Basic Health Plan
Working Group
Katharine London
Robert W. Seifert
September 24, 2012
Overview
Data and information to support decision-making
regarding Working Group questions.
Topics:
C. Provider Access
F. Benefit Structure
H. BHP-Eligible Individuals
D. Provider Payments
Activity in other states
2
C. Provider Access
3
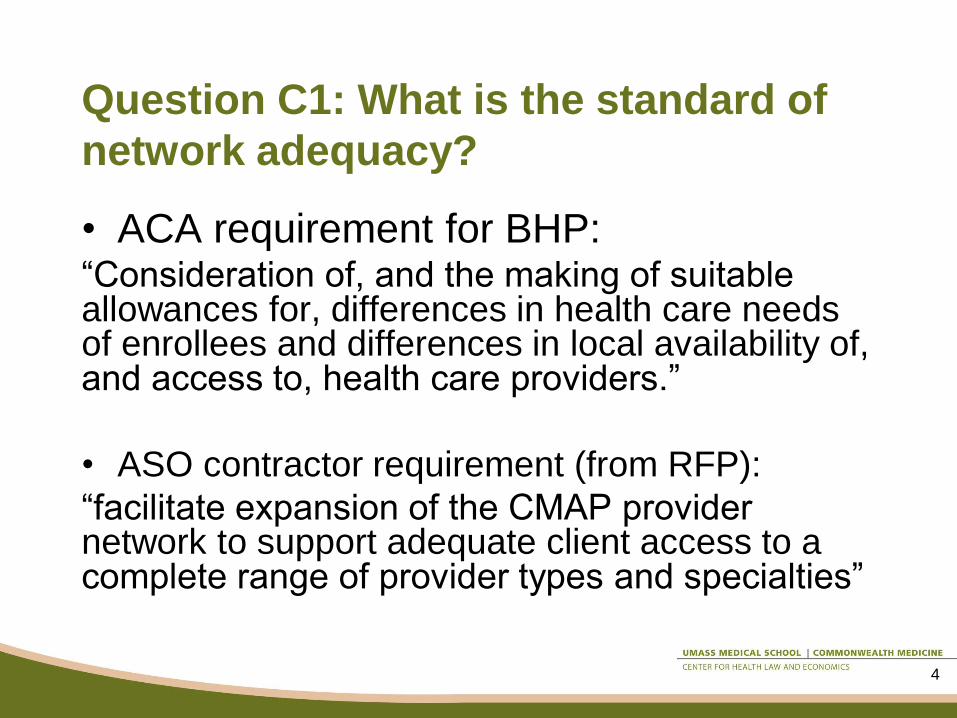
Question C1: What is the standard of
network adequacy?
• ACA requirement for BHP: ―Consideration of, and the making of suitable allowances for, differences in health care needs of enrollees and differences in local availability of, and access to, health care providers.‖
• ASO contractor requirement (from RFP):
―facilitate expansion of the CMAP provider network to support adequate client access to a complete range of provider types and specialties‖
4
Question C1: What is the standard of
network adequacy?
• We are investigating Medicaid contract
requirements regarding network
adequacy for ASO, BH, Dental carve-
out.
5
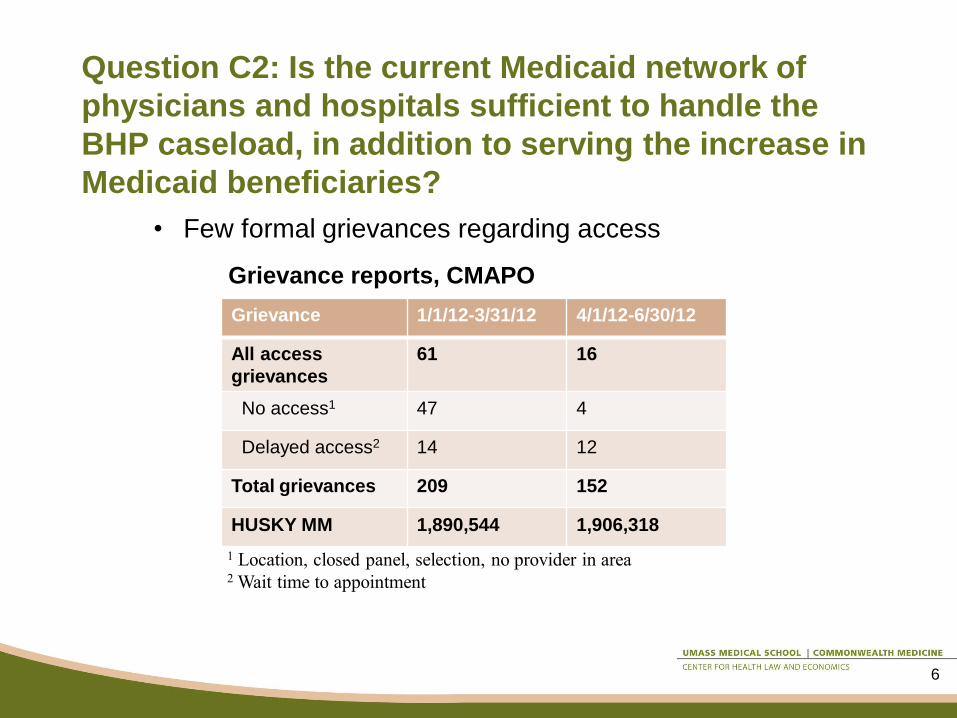
Question C2: Is the current Medicaid network of
physicians and hospitals sufficient to handle the
BHP caseload, in addition to serving the increase in
Medicaid beneficiaries?
Grievance 1/1/12-3/31/12 4/1/12-6/30/12
All access
grievances
61 16
No access1 47 4
Delayed access2 14 12
Total grievances 209 152
HUSKY MM 1,890,544 1,906,318
1 Location, closed panel, selection, no provider in area 2 Wait time to appointment
Grievance reports, CMAPO
• Few formal grievances regarding access
6

Some evidence of office-based
physicians’ reluctance to accept new
Medicaid patients
Source: Decker S L Health Aff 2012;31:1673-1679
7

Primary care capacity
• Study* published December 2008 o Urban/suburban counties (Fairfield, Hartford, New Haven) have highest
uninsured rates, but relatively high numbers of PCP/100,000 pop.; may be
better positioned to absorb increases in coverage. CHCs and hospital
clinics also important sources of care here.
o Rural counties (Windham, Tolland, Litchfield) have lower uninsured rate
(and lower absolute numbers of uninsured), but fewer PCPS, so may be
less able to absorb increases in coverage.
o ―Connecticut … has a sufficient supply of health care resources and an
adequate overall supply of licenses primary care providers… However, the
geographic distribution of primary care providers currently poses some
challenges in rural and inner-city areas, which are likely to be exacerbated
by expanded insurance coverage… Even if Connecticut is able to absorb
near term increase in primary care services demand, this may not be the
case in ten to fifteen years.‖
*Center for Health Policy, University of Connecticut. Assessment of Primary Care Capacity in Connecticut. December
2008, revised February 2009
8

CT US
Primary care HPSAs
Total designations 38 5,796
Est. underserved population 292,485 35,057,608
% of population underserved 8.2% 11.4%
Practitioners needed to achieve
target practitioner to population ratio
(2000:1)
136 16,030
Dental HPSAs
Total designations 40 4,438
Est. underserved population 339,677 31,707,007
% of population underserved 9.5% 10.3%
Practitioners needed to achieve
target practitioner to population ratio
(3000:1)
102 9,427
Health Professional Shortage Areas (HPSA):
Slightly lower need in CT than national average
Source: Kaiser statehealthfacts.org. 2012 data
9
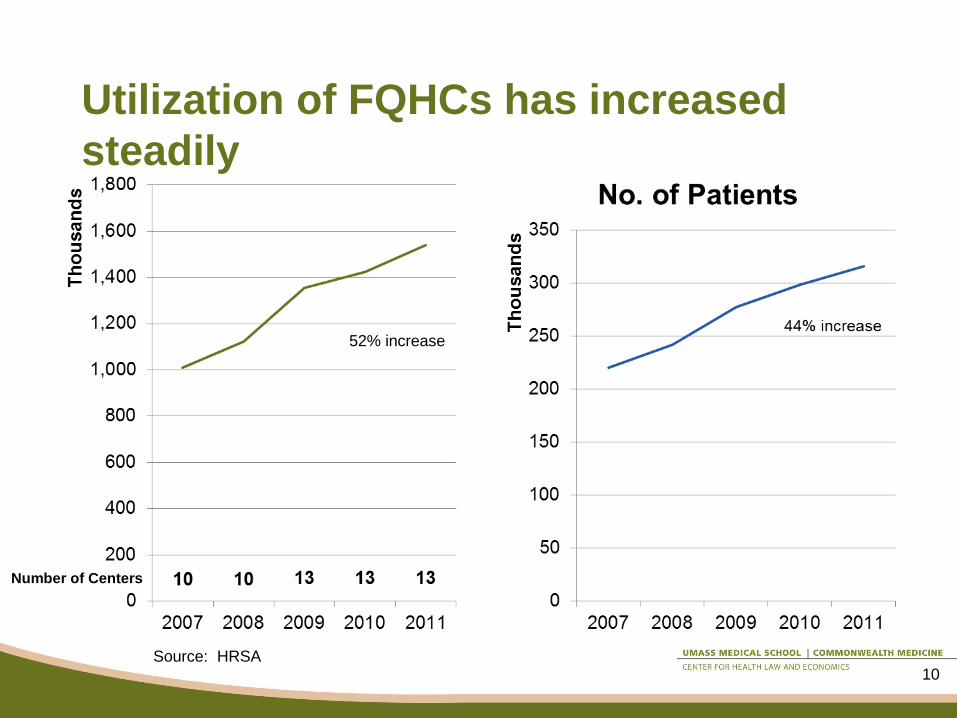
Utilization of FQHCs has increased
steadily
52% increase
Source: HRSA
Number of Centers
10

F. Benefit Structure
11
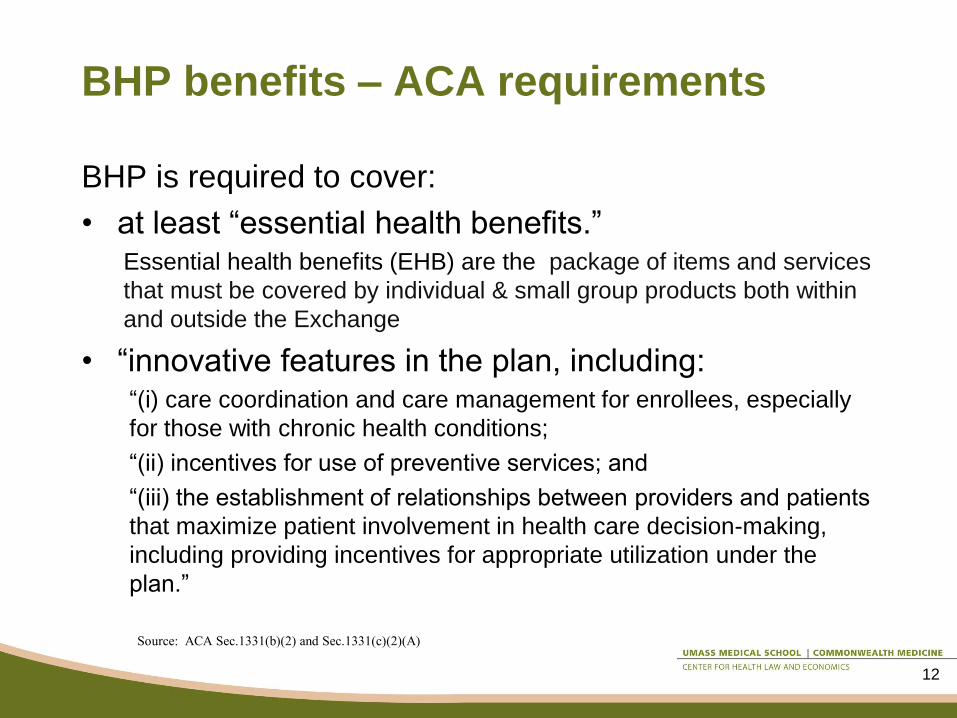
BHP benefits – ACA requirements
BHP is required to cover:
• at least ―essential health benefits.‖ Essential health benefits (EHB) are the package of items and services
that must be covered by individual & small group products both within
and outside the Exchange
• ―innovative features in the plan, including: ―(i) care coordination and care management for enrollees, especially
for those with chronic health conditions;
―(ii) incentives for use of preventive services; and
―(iii) the establishment of relationships between providers and patients
that maximize patient involvement in health care decision-making,
including providing incentives for appropriate utilization under the
plan.‖
12
Source: ACA Sec.1331(b)(2) and Sec.1331(c)(2)(A)

BHP benefits – additional options
HUSKY A offers benefits beyond EHB that could be
included in a BHP, such as:
• Intensive care management
• Coordination between primary care and mental
health and substance abuse services through the
Behavioral Health Partnership
• Dental care and coordination through the Dental
Health Partnership
• Vision testing and eyeglasses
• Hearing testing and hearing aids
• Non-emergency medical transportation
13
Source: ACA Sec.1331(b)(2) and Sec.1331(c)(2)(A)
H. BHP-Eligible Individuals
14

Question H1: What is the financial risk
to individuals in the BHP vs. Exchange? • Risk in BHP would be no higher, and most likely
lower, than in Exchange
• BHP premiums may not exceed Exchange premiums
• Subsidized cost sharing in Exchange: 6% of income (up to
150% FPL), 13% of income (150-200%)
• Mercer estimate: BHP premiums and cost sharing equal to
1% of income (at 138% FPL) and 2% of income (at 200%)
would produce a margin for the state of 22% of costs
• Therefore, BHP premiums and cost sharing significantly
lower than Exchange is likely to be economically viable
• Individuals purchasing coverage through Exchange may be
at additional financial risk if income increases during the
year because of year-end reconciliation of tax credits
15
Source: ACA Sec.1331(b)(2) and Sec.1331(c)(2)(A)
Question H2:
What is the experience of care likely to
be in the BHP vs. the Exchange?
16
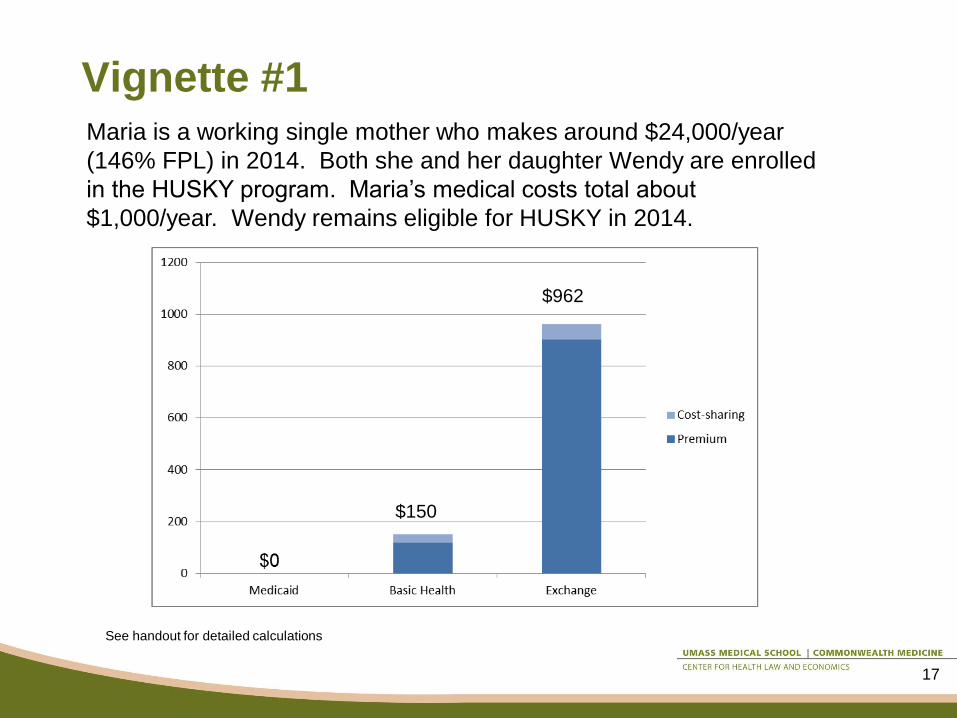
Vignette #1
17
Maria is a working single mother who makes around $24,000/year
(146% FPL) in 2014. Both she and her daughter Wendy are enrolled
in the HUSKY program. Maria’s medical costs total about
$1,000/year. Wendy remains eligible for HUSKY in 2014.
See handout for detailed calculations
$150
$962
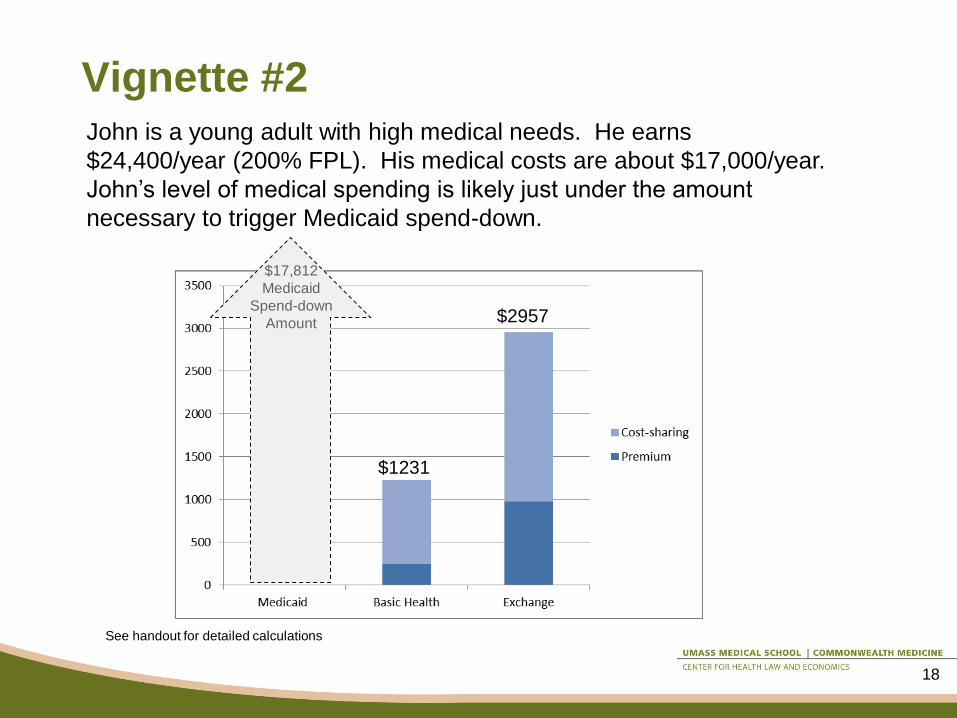
Vignette #2
18
John is a young adult with high medical needs. He earns
$24,400/year (200% FPL). His medical costs are about $17,000/year.
John’s level of medical spending is likely just under the amount
necessary to trigger Medicaid spend-down.
See handout for detailed calculations
$2957
$1231
$17,812
Medicaid
Spend-down
Amount
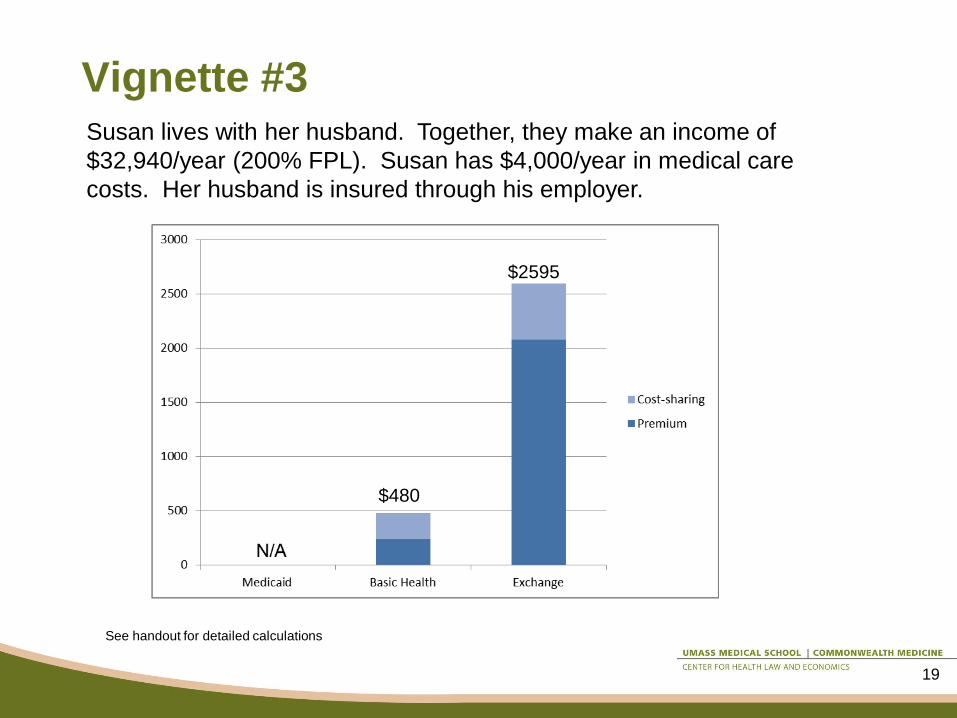
Vignette #3
19
Susan lives with her husband. Together, they make an income of
$32,940/year (200% FPL). Susan has $4,000/year in medical care
costs. Her husband is insured through his employer.
See handout for detailed calculations
$2595
$480
D. Provider Payments
20
Question D1: Payment levels
Working group question: How do Medicaid
provider payments compare to commercial
insurers’ provider payments?
21
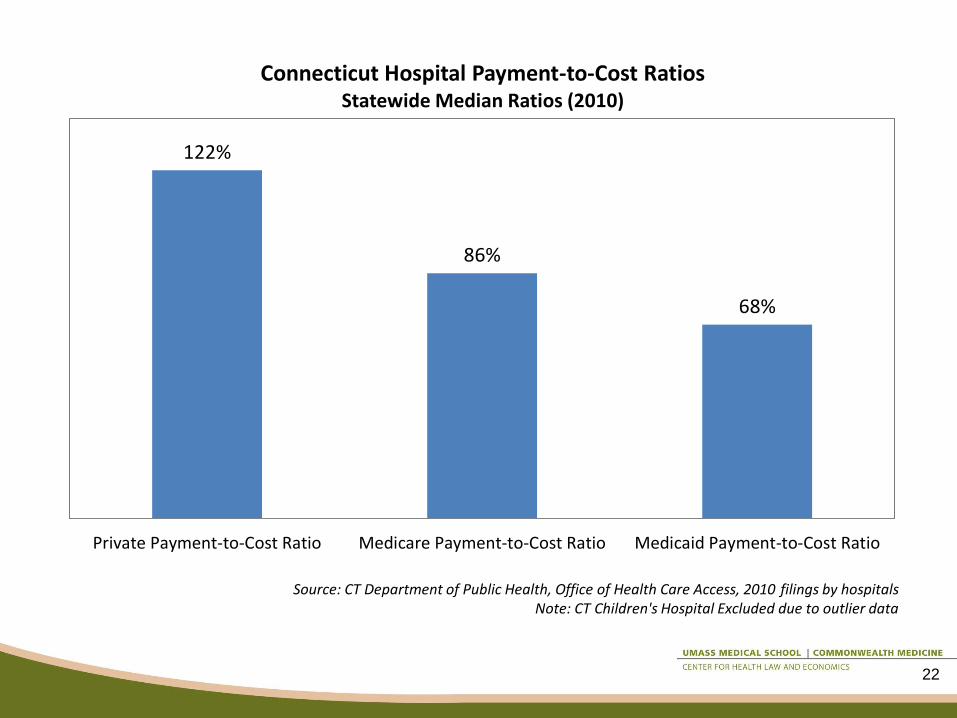
122%
86%
68%
Private Payment-to-Cost Ratio Medicare Payment-to-Cost Ratio Medicaid Payment-to-Cost Ratio
Connecticut Hospital Payment-to-Cost Ratios Statewide Median Ratios (2010)
Source: CT Department of Public Health, Office of Health Care Access, 2010 filings by hospitals Note: CT Children's Hospital Excluded due to outlier data
22
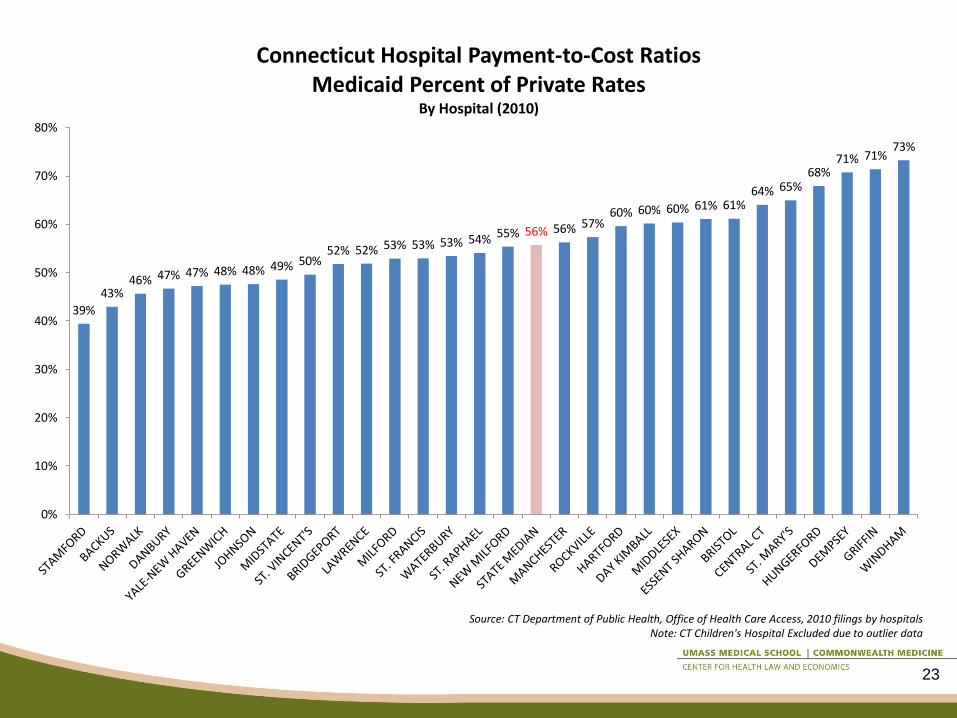
39%
43% 46% 47% 47% 48% 48% 49% 50%
52% 52% 53% 53% 53% 54% 55% 56% 56% 57% 60% 60% 60% 61% 61%
64% 65% 68%
71% 71% 73%
0%
10%
20%
30%
40%
50%
60%
70%
80%
Connecticut Hospital Payment-to-Cost Ratios Medicaid Percent of Private Rates
By Hospital (2010)
Source: CT Department of Public Health, Office of Health Care Access, 2010 filings by hospitals Note: CT Children's Hospital Excluded due to outlier data
23

24
Source: www.statehealthfacts.org; taken from Stephen Zuckerman, Aimee Williams, and Karen Stockley, "Medicaid Physician Fees Grew By More Than
15 Percent From 2003 to 2008, Narrowing Gap With Medicare Physician Payment Rates," Health Affairs, April 2009.
Question D2: Payment methods
Working group question: What payment
methods and rates would best promote value
and access?
25
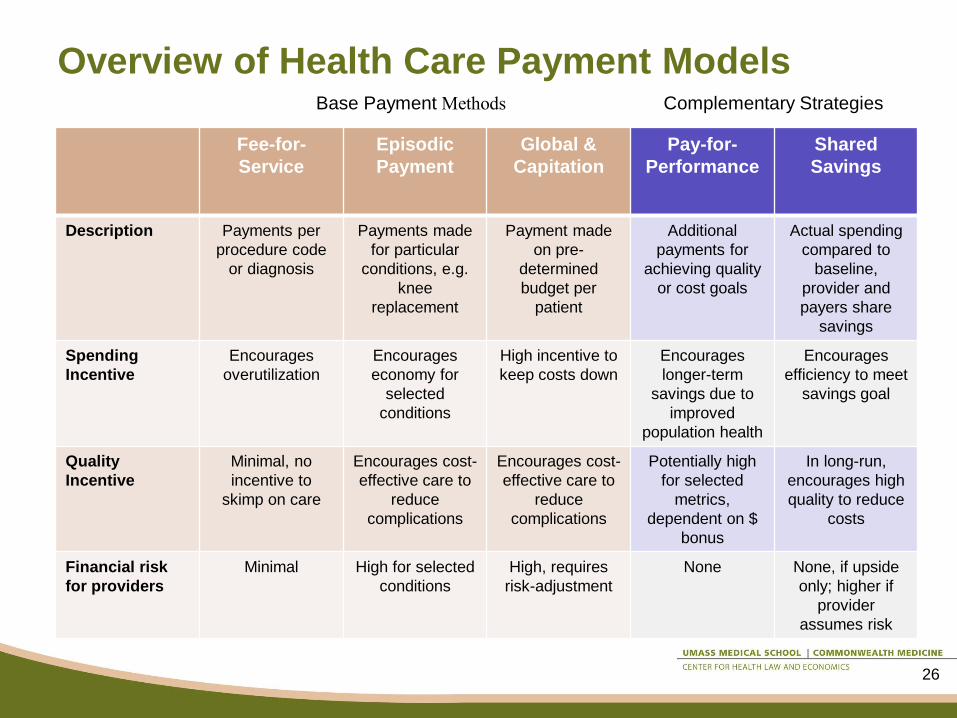
Overview of Health Care Payment Models
Fee-for-
Service
Episodic
Payment
Global &
Capitation
Pay-for-
Performance
Shared
Savings
Description Payments per
procedure code
or diagnosis
Payments made
for particular
conditions, e.g.
knee
replacement
Payment made
on pre-
determined
budget per
patient
Additional
payments for
achieving quality
or cost goals
Actual spending
compared to
baseline,
provider and
payers share
savings
Spending
Incentive
Encourages
overutilization
Encourages
economy for
selected
conditions
High incentive to
keep costs down
Encourages
longer-term
savings due to
improved
population health
Encourages
efficiency to meet
savings goal
Quality
Incentive
Minimal, no
incentive to
skimp on care
Encourages cost-
effective care to
reduce
complications
Encourages cost-
effective care to
reduce
complications
Potentially high
for selected
metrics,
dependent on $
bonus
In long-run,
encourages high
quality to reduce
costs
Financial risk
for providers
Minimal High for selected
conditions
High, requires
risk-adjustment
None None, if upside
only; higher if
provider
assumes risk
Complementary Strategies Base Payment Methods
26
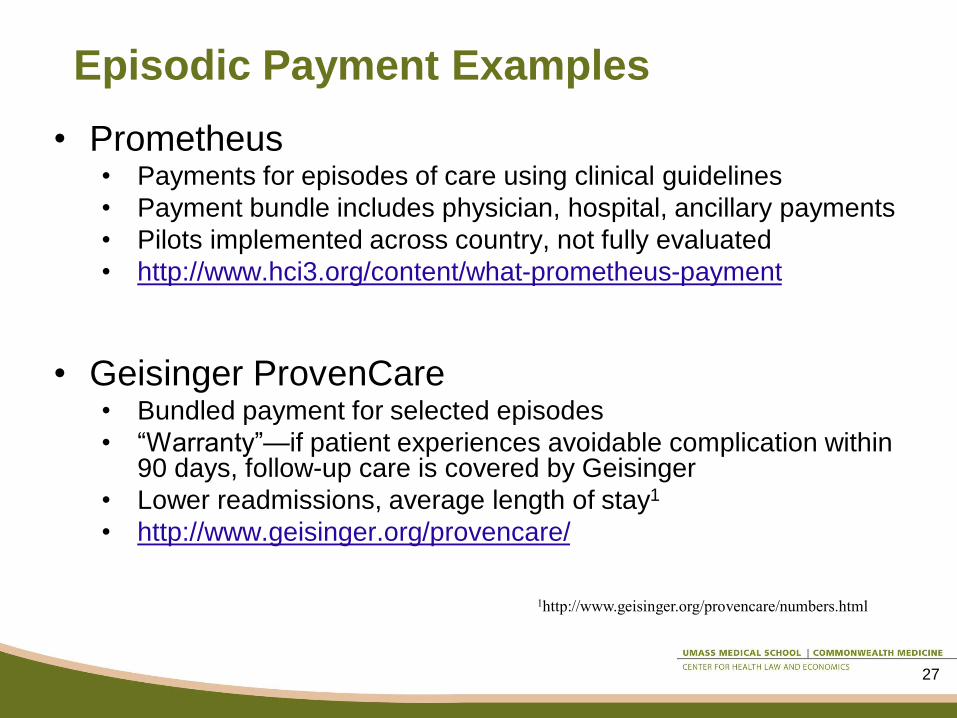
Episodic Payment Examples
• Prometheus • Payments for episodes of care using clinical guidelines
• Payment bundle includes physician, hospital, ancillary payments
• Pilots implemented across country, not fully evaluated
• http://www.hci3.org/content/what-prometheus-payment
• Geisinger ProvenCare • Bundled payment for selected episodes
• ―Warranty‖—if patient experiences avoidable complication within 90 days, follow-up care is covered by Geisinger
• Lower readmissions, average length of stay1
• http://www.geisinger.org/provencare/
1http://www.geisinger.org/provencare/numbers.html
27

Alternative Payment Examples: Global
Budget
• Blue Cross of MA Alternative Quality Contract
• Global budget
• May be either full-risk model or shared risk model
• Quality bonuses for both ambulatory and hospital
measures
• Includes risk adjustment
• Initial results indicated 2.8% savings over two-years,
with improvements in quality metrics1
• http://www.bluecrossma.com/visitor/pdf/alternative-
quality-contract.pdf
1 Z. Song et al, ‘The Alternative Quality Contract,’ Based on a Global Budget, Lowered Medical Spending and Improved Quality, Health Affairs, August 2012.
28
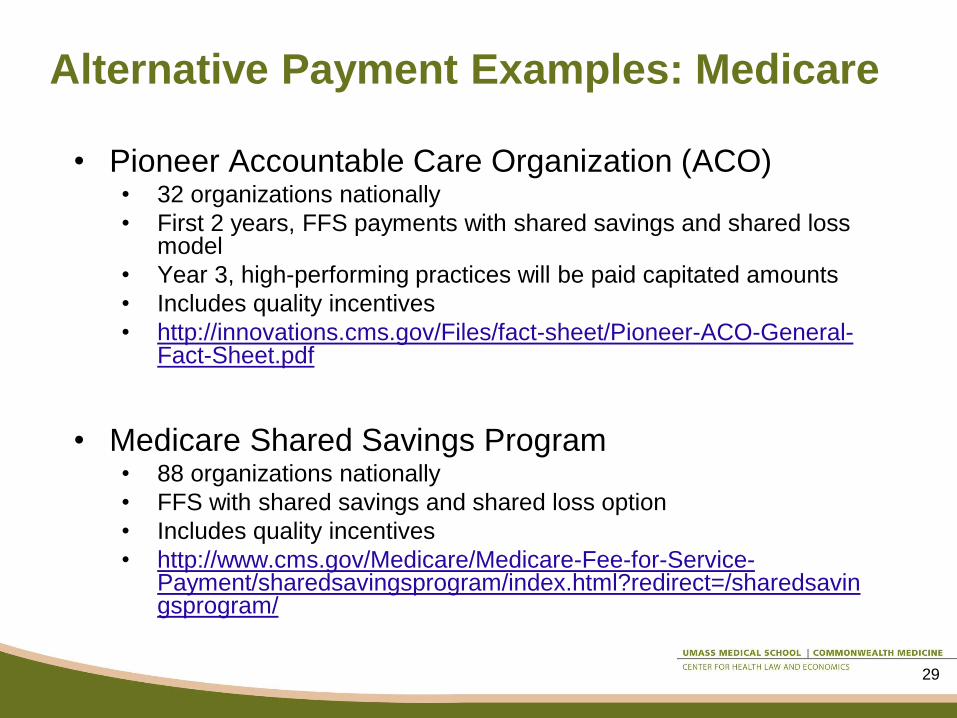
Alternative Payment Examples: Medicare
• Pioneer Accountable Care Organization (ACO) • 32 organizations nationally
• First 2 years, FFS payments with shared savings and shared loss model
• Year 3, high-performing practices will be paid capitated amounts
• Includes quality incentives
• http://innovations.cms.gov/Files/fact-sheet/Pioneer-ACO-General-Fact-Sheet.pdf
• Medicare Shared Savings Program • 88 organizations nationally
• FFS with shared savings and shared loss option
• Includes quality incentives
• http://www.cms.gov/Medicare/Medicare-Fee-for-Service-Payment/sharedsavingsprogram/index.html?redirect=/sharedsavingsprogram/
29
Question D3: Effect on commercial
insurance payment rates
Working group question: What effect will the
expansion of enrollment in Medicaid and the BHP
have on commercial insurance rates?
30

Question D3: Effect on commercial
insurance payment rates
Study 1: Frakt, ―How much do hospitals cost shift? A review of the evidence,‖ The
Milbank Quarterly, 89:1, 2011, pp. 90-130.
Review of existing evidence to determine ―if one payer (Medicare, say)
pays less relative to costs, another (a private insurer, say) will
necessarily pay more.‖
Findings: ―Although some cost shifting may result from changes in public
payment policy, it is just one of many possible effects.‖
―Changes in the balance of market power between hospitals and health
care plans also significantly affect private prices.‖
―To the extent that hospitals still have some unexploited market power,
perhaps some cost shifting is possible, but … it is likely to be a rate
closer to twenty cents on the dollar than [a] dollar-for-dollar rate.‖
31
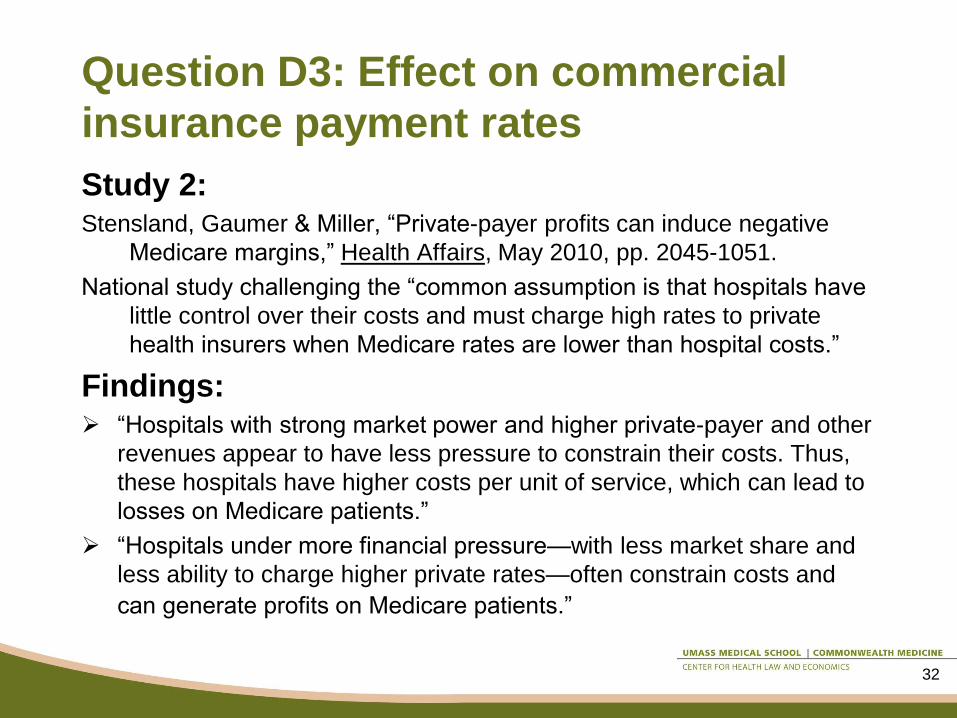
Question D3: Effect on commercial
insurance payment rates
Study 2: Stensland, Gaumer & Miller, ―Private-payer profits can induce negative
Medicare margins,‖ Health Affairs, May 2010, pp. 2045-1051.
National study challenging the ―common assumption is that hospitals have
little control over their costs and must charge high rates to private
health insurers when Medicare rates are lower than hospital costs.‖
Findings: ―Hospitals with strong market power and higher private-payer and other
revenues appear to have less pressure to constrain their costs. Thus,
these hospitals have higher costs per unit of service, which can lead to
losses on Medicare patients.‖
―Hospitals under more financial pressure—with less market share and
less ability to charge higher private rates—often constrain costs and
can generate profits on Medicare patients.‖
32
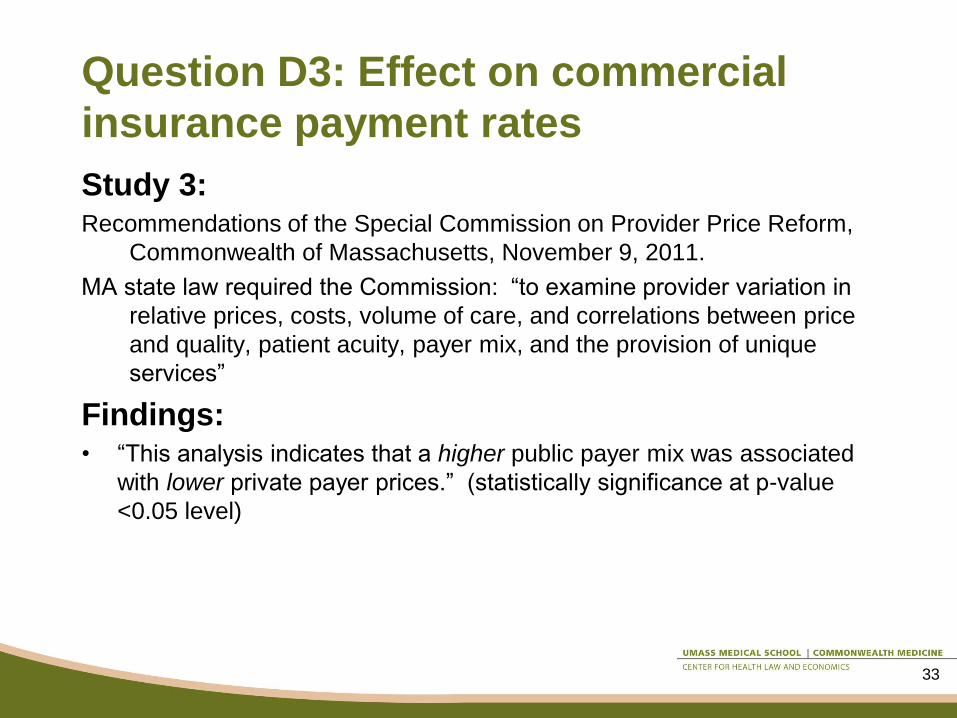
Question D3: Effect on commercial
insurance payment rates
Study 3: Recommendations of the Special Commission on Provider Price Reform,
Commonwealth of Massachusetts, November 9, 2011.
MA state law required the Commission: ―to examine provider variation in
relative prices, costs, volume of care, and correlations between price
and quality, patient acuity, payer mix, and the provision of unique
services‖
Findings: • ―This analysis indicates that a higher public payer mix was associated
with lower private payer prices.‖ (statistically significance at p-value
<0.05 level)
33
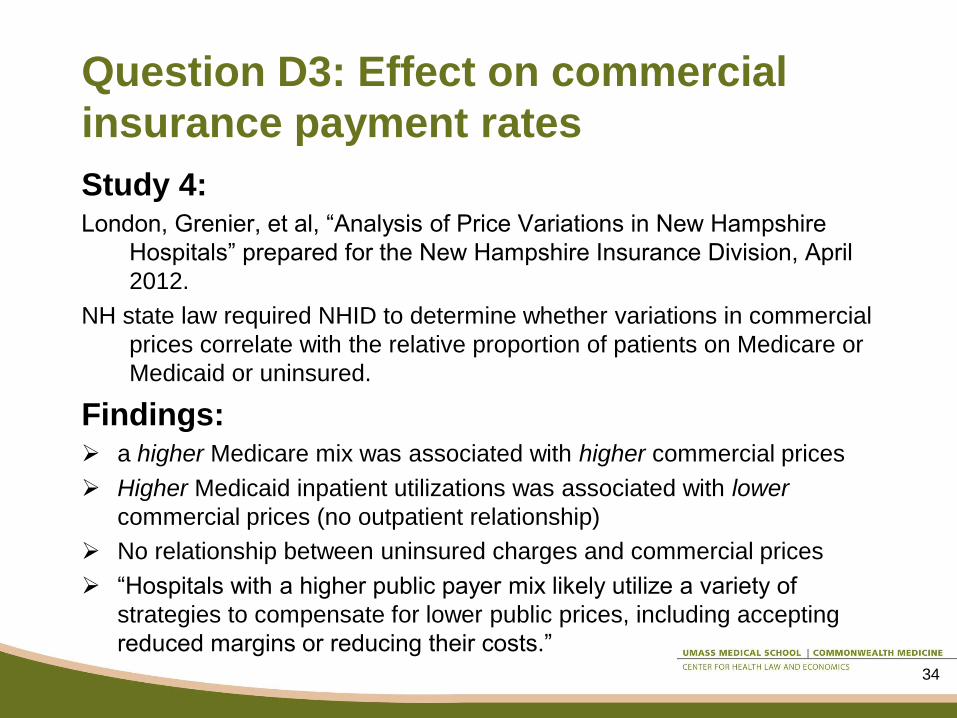
Question D3: Effect on commercial
insurance payment rates
Study 4: London, Grenier, et al, ―Analysis of Price Variations in New Hampshire
Hospitals‖ prepared for the New Hampshire Insurance Division, April
2012.
NH state law required NHID to determine whether variations in commercial
prices correlate with the relative proportion of patients on Medicare or
Medicaid or uninsured.
Findings: a higher Medicare mix was associated with higher commercial prices
Higher Medicaid inpatient utilizations was associated with lower
commercial prices (no outpatient relationship)
No relationship between uninsured charges and commercial prices
―Hospitals with a higher public payer mix likely utilize a variety of
strategies to compensate for lower public prices, including accepting
reduced margins or reducing their costs.‖
34

Activity in other states
35

36
• NY Health Benefit Exchange is seeking input from its Regional Advisory
Committees on the Basic Health Plan option during meetings Sept 13-25,
2012. This is the summary that the NY HBX provided for their RACs:
• Urban Institute Findings:
– Estimated enrollment: 468,000
– Exchange size declines from 1.1 million to 820,000
– Advantages: potential for $600 million annual State savings, increased
affordability for consumers, and improved continuity of coverage
– Disadvantages: concerns about access to care because provider payment
rates may be below commercial rates, potential impact on the Exchange
due to adverse selection impact on premiums, reduced negotiating
leverage with plans
– Uncertainties: calculation of the federal payment is uncertain pending
federal guidance
New York
Source: New York State Health Benefit Exchange presentation available at
http://www.healthcarereform.ny.gov/health_insurance_exchange/docs/2012-09_rac_meeting_presentation.pdf

Other New England states
• Massachusetts: Developing BHP
pursuant to authorization in FY13
budget; to be administered by
MassHealth (Office of Medicaid)
• Vermont: Decided not to pursue BHP;
does not fit state’s large vision for single
payer
37
Other states
• California: SB 703 introduced but not
passed in last session • Concerns about provider rates and viability of
Exchange
• Gov. Brown plans to call special session in Dec.
or Jan. to deal with ACA issues
“… many important issues and questions cannot be addressed
or answered without further guidance from the federal
government and additional analysis to understand the
interrelationship of the decisions we must make.”
38


