
PHILIPPINESBasic Education
Public Expenditure Review
THE WORLD BANK
THE WORLD BANK
1818 H Street, NWWashington, DC 20043 USAInternet: www.worldbank.org
World Bank Office Manila23rd Floor, The Taipan PlaceF. Ortigas Jr. Road, Ortigas CenterPasig City, PhilippinesTelephone: (63-2) 637-5855Internet: www.worldbank.org.ph
Head OfficeStreet Address:255 London CircuitCanberra ACT 2601 Australia
Postal address:GPO Box 887 Canberra ACT 2601 Australia
Telephone: +61 2 6178 4000Fax: +61 2 6178 4880ABN: 629 215 588 38
Manila OfficeLevel 23 Tower 2 RCBC Plaza6819 Ayala AvenueMakati City Philippines 1200
PH
ILIP
PIN
ES
: BA
SIC
ED
UC
AT
ION
PU
BL
IC E
XP
EN
DIT
UR
E R
EV
IEW
THE W
OR
LD B
AN
KA
ustralian AID
Pub
lic D
iscl
osur
e A
utho
rized
Pub
lic D
iscl
osur
e A
utho
rized
Pub
lic D
iscl
osur
e A
utho
rized
Pub
lic D
iscl
osur
e A
utho
rized
Pub
lic D
iscl
osur
e A
utho
rized
Pub
lic D
iscl
osur
e A
utho
rized
Pub
lic D
iscl
osur
e A
utho
rized
Pub
lic D
iscl
osur
e A
utho
rized

2012
This work is a product of the staff of The World Bank and AusAID. Note that The World Bank and AusAID do not
necessarily own each component of the content included in the work. The World Bank and AusAID therefore do
not warrant that the use of the content contained in the work will not infringe on the rights of third parties. The risk
of claims resulting from such infringement rests solely with you.
The findings, interpretations, and conclusions expressed in this work do not necessarily reflect the views of The
World Bank, its Board of Directors, AusAID or the governments they represent. The World Bank and AusAID do
not guarantee the accuracy of the data included in this work. The boundaries, colors, denominations, and other
information shown on any map in this work do not imply any judgment on the part of The World Bank or AusAID
concerning the legal status of any territory or the endorsement or acceptance of such boundaries.
Nothing herein shall constitute or be considered to be a limitation upon or waiver of the privileges and immunities of
The World Bank and AusAID, all of which are specifically reserved.
Rights and Permissions
This work is available under the Creative Commons Attribution 3.0 Unported license (CC BY 3.0)
http://creativecommons.org/licenses/by/3.0. Under the Creative Commons Attribution license, you are free to copy,
distribute, transmit, and adapt this work, including for commercial purposes under the following conditions:
License: Creative Commons Attribution CC BY 3.0
Translations – If you create a translation of this work, please add the following disclaimer along with the attribution:
This translation was not created by The World Bank or AusAID and should not be considered an official World
Bank or AusAID translation. The World Bank and AusAID shall not be liable for any content or error in this
translation.
All queries on rights and licenses should be addressed to the The World Bank in the Philippines, Ortigas Center,
Pasig City; telephone: 63-2-6375855; Internet: www.worldbank.org.ph
Supported by funding from the Australian Agency for International Development (AusAID), the Australian
Government’s overseas aid agency.
Cover photos: Top photo – By World Bank, bottom photo – By AusAID
The World Bank in the Philippines
Ortigas Center, Pasig City
Telephone: +63-2-6375855
Internet: www.worldbank.org.ph
Australian AID
Manila Office
Level 23 Tower 2 RCBC Plaza
6819 Ayala Avenue, Makati City
Philippines

Report Number 71272-PH
Philippines: Basic Education Public
Expenditure Review
THE WORLD BANK

CURRENCY EQUIVALENTS
(Exchange Rate Effective March 15, 2010)
Currency Unit = Peso
US$1 = PhP 45.65
FISCAL YEAR
January 1 – December 31
ABBREVIATIONS AND ACRONYMS ABM Agency Budget Matrix
ADM Alternate Delivery Mode
APIS Annual Poverty Indicators Survey
BEC Basic Education Curriculum
BEIS Basic Education Information
System
BESRA Basic Education Sector Reform
Agenda
BLGF
BTr
Bureau of Local Government
Finance
Bureau of Treasury
CCT Conditional Cash Transfer
CHED
COA
Commission on Higher Education
Commission on Audit
CO Capital Outlay
CSR Cohort Survival Rate
DBCC Development and Budget
Coordinating Committee
DBM Department of Budget Management
DECS Department of Education, Culture,
and Sports
DepED Department of Education
DPWH Department of Public Works and
Highways
DSWD Department of Social Welfare and
Development
EDCOM Congressional Commission on
Education
EFA Education For All
ESC Education Service Contracting
FIES Family Income and Expenditure
Survey
FFCCCII Federation of Filipino Chinese
Chambers of Commerce and
Industry Inc
GAA General Appropriations Act
GDP Gross Domestic Product
GER Gross Enrollment Rate
IPIN Implicit Price Index
IRA Internal Revenue Allotment
KRT Key Reform Thrust
LGC Local Government Code
LGU Local Government Unit
MDG Millennium Development Goal
MOOE Maintenance and Other Operating
Expenses
MTPDP Medium-Term Philippine
Development Plan
NAT National Achievement Test
NCA Notice of Cash Allocation
NER Net Enrollment Rate
NG
NSCB
National Government
National Statistical Coordination
Board
NSO National Statistics Office
PER
PFSED
Public Expenditure Review
Physical Facilities and School
Engineering Division
PETS Public Expenditure Tracking Survey
PHP Philippine Pesos
PPP Public-Private Partnerships
PS Personal Services
PTR Pupil-Teacher Ratio
RA Republic Act
SAOB Statement of Allotments
Obligations and Balances
SARO Special Allotment Release Order
SBP School Building Program
SEF Special Education Fund
STR
TESDA
Student-Teacher Ratio
Technical Education and Skills
Development Authority
TIMSS Trends in International Math and
Science Study
SEF Special Education Fund

PHILIPPINES
Basic Education Public Expenditure Review
CONTENTS
Acknowledgements ........................................................................................................................ i
Executive Summary ...................................................................................................................... ii
Introduction: Motivation and Structure .................................................................................... xi
Chapter 1- Performance of the Philippine Basic Education Sector, 20022008: Access,
Efficiency, and Quality ................................................................................................................. 1
Access to Schooling: Trends in Enrollment Rates ...................................................................... 1
Trends in Internal Efficiency Indicators ..................................................................................... 3
Trends in Completion Rates........................................................................................................ 5
International Comparisons of Participation and Completion Rates ............................................ 7
Trends in Learning Achievement................................................................................................ 8
Conclusion ................................................................................................................................ 11
Chapter 2 - Equity Issues in Basic Education Outcomes ........................................................ 12
Geographic Distribution of Outcomes ...................................................................................... 12
Gender Equity ........................................................................................................................... 17
Conclusion ................................................................................................................................ 19
Chapter 3 - Recent Trends in Government Spending on Basic Education ........................... 21
Overall Trends in Government Spending on Basic Education ................................................. 21
Government Spending Compared to Overall Financial Requirements for Basic Education .... 26
Possible Reasons for National Government Spending Trends ................................................. 27
The Role of Local Government Spending on Basic Education ................................................ 30
Private Spending on Basic Education ....................................................................................... 31
Education Service Contracting – Partnership with the Private Sector ...................................... 33
Future Projections of Resource Requirements for Basic Education ......................................... 34
Conclusion ................................................................................................................................ 36

Chapter 4 - Quality of Government Spending on Basic Education ....................................... 37
Economic Composition of Government Spending and its Relation to the Adequacy of Input
Provision and Basic Education Outcomes ................................................................................ 37
Geographic Distribution of Government Spending and Input Provision.................................. 47
Geographic Disparities in Input Provision ................................................................................ 50
Relation Between Inputs, Outcomes, and Government Spending ............................................ 52
Conclusion ................................................................................................................................ 52
Chapter 5 - Budget Execution and Operational Efficiency .................................................... 54
Budget Execution Process......................................................................................................... 55
Case Studies of Program/Activity/Project (PAP) Budget Execution ....................................... 57
Conclusion ................................................................................................................................ 72
Chapter 6 - Policy Recommendations: Making Expenditures Count .................................... 74
More and Better Managed Resources ....................................................................................... 74
Evidence-based Decision Making............................................................................................. 77
Annex 1: Data and Methods....................................................................................................... 80
Annex 2: Reference Table for Chapter 1 and 4 ...................................................................... 96
Annex 3: Reference Tables for Chapter 3 ............................................................................. 107
Annex 4: Measuring Congestion in Public Schools .............................................................. 129
Annex 5: Structure of the Philippine Basic Education Sector ............................................. 142
References .................................................................................................................................. 148

FIGURES
Figure 1: Gross Enrollment Rate and Net Enrollment Rate, SY 20022003 to SY 20082009 .... 2
Figure 2: Completion Rate, SY 20032004 to SY 20072008 ...................................................... 6 Figure 3: International Comparison of Elementary Outcome Indicators ....................................... 8
Figure 4: National Achievement Test – Mean Percentage Score (MPS), Grade Six, .................. 10 Figure 5: National Achievement Test – Mean Percentage Score (MPS), Secondary Level, SY
20042005 to SY 20072008 ....................................................................................................... 10 Figure 6: Regional Differences in Elementary Gross Enrollment Rate ........................................ 12 Figure 7: Regional Differences in Secondary Gross Enrollment Rate ......................................... 13
Figure 8: Elementary Completion Rate, by Region, SY 20032004 and SY 20072008 ........... 14
Figure 9: Secondary Completion Rate, by Region, SY 20032004 and SY 20072008 ............ 14 Figure 10: Net Enrollment Rate, by Income Quintile, 2004 ........................................................ 16
Figure 11: Net Enrollment Rate, by Gender, SY 20022003 to SY 20082009 ........................ 18
Figure 12: Completion Rate, by Gender, SY 20032004 to SY 20072008 ............................... 18
Figure 13: Government Expenditure on Education as a Percentage of GDP, 20022008 ........... 21
Figure 14: Share of GDP Spent on Education in Selected Countries ........................................... 22 Figure 15: Actual National Government Spending Compared to 2005 Education Spending Plan
....................................................................................................................................................... 27
Figure 16: National Government Spending per Pupil, 20022008 ............................................. 30
Figure 17: Pupil-Teacher Ratio in Public Elementary Schools, SY 20022003 to SY 20072008
....................................................................................................................................................... 41
Figure 18: Student-Teacher Ratio in Public Secondary Schools, SY 20022003 to SY
20072008 .................................................................................................................................... 42
Figure 19: Pupil/Student-Class Ratio, SY 2002-2003 to SY 2007-2008 ..................................... 45
Figure 20: Changes in LGU Compared to NG Spending on Basic Education, 20032006 ......... 49 Figure 21: Budget Execution Process ........................................................................................... 55
Figure 22: Budget Utilization of the School Furniture Program, 20042008 .............................. 61 Figure 23: Budget Utilization of the School Building Program, 2005—2008 ............................. 62
Figure 24: Budget Utilization of the Textbook Procurement Program, 2004-2008 ..................... 64
Figure 25: Sample Elementary Reconstructed Cohort Survival Flow Diagram, SY 20032004 85 Figure 26: Structure of the Philippine Education System ........................................................... 143
TABLES
Table 1: Cohort Survival and Grade 1 Dropout Rates for Elementary Public Schools, SY
20032004 to SY 20072008 ......................................................................................................... 4
Table 2: Cohort Survival Rate in Secondary Public Schools, SY 20032004 to SY 20072008 .. 5 Table 3: National Achievement Test – Mean Percentage Score (MPS), by Region .................... 15
Table 4: Total Government Spending on Basic Education, 20022008 ...................................... 23
Table 5: Total Government Spending per Pupil on Basic Education, 20022008 ....................... 24 Table 6: National Government Spending – Shares (%) of Selected Sectors Net of Debt Servicing,
20022008 .................................................................................................................................... 28 Table 7: Average of Household Expenditures on Education per School-Age Household Member
Conditional on Households Reporting Education Expenditures .................................................. 32

Table 8: Projected Government Spending on Basic Education: 2015 .......................................... 35
Table 9: National Government Spending on Basic Education, by Expense Class, 20022008 ... 39 Table 10: Regional Disparities in Government Spending per Pupil on Basic Education, 2008(in
2002 constant prices, PhP) ............................................................................................................ 48 Table 11: Pupil/Student to Teacher Ratio and Pupil/Student to Class Ratio, by Region, ............ 51 Table 12: Utilization Rate Using Statement of Allotments, Obligations, and Balances (SAOB)
Figures: Total Allotment Releases Compared to Total Obligations (in PhP millions) ................. 56 Table 13: Utilization Rate Using SAOB Figures: Total Allotment Releases Compared to Total
Obligations, by Object of Expenditure (in PhP millions) ............................................................. 57 Table 14: Utilization Rates of Selected DepED Programs: ......................................................... 59
Table 15: Implementation Timeline of the School Furniture Program, 20042005 ................... 59
Table 16: Key Changes in the School Building Program Implementation Modalities, 20052007
....................................................................................................................................................... 63
Table 17: Textbook Evaluation and Procurement Process for Title and Content ........................ 65 Table 18: Procurement Process for Textbook Printing and Delivery (242 days) ........................ 65 Table 19: Actual Chronology of Events: Supply and Delivery of Sibika 1-3, HEKASI 4-6 and
Araling Panlipunan 1-4 (Under SEMP 2005) ............................................................................... 66 Table 20: Allotment Releases/Transfer, FY2006 ......................................................................... 67
Table 21: Implementation Timeline of New Teacher Deployment for Selected SDOs in Region
VII, 2007 ....................................................................................................................................... 69 Table 22: Number of Appointment Papers Received and Disapproved ...................................... 70
Table 23: Sample of Teacher Deployment Analysis of SDO Lapu-Lapu City, SY 20072008 . 71 Table 24: Definitions of Public Expenditure Terms in the Philippines ........................................ 81
Table 25: Elementary Flow Rates by Grade, SY 20032004 to SY 20072008* ....................... 96
Table 26: Secondary Flow Rates by Year Level, SY 20032004 to SY 20072008* ................ 96
Table 27: Elementary Gross Enrollment Rate and Net Enrollment Rate, by Gender
SY 20032004 to SY 20082009 ................................................................................................. 97
Table 28: Secondary Gross Enrollment Rate and Net Enrollment Rate, by Gender, SY
20032004 to SY 20082009 ....................................................................................................... 97
Table 29: Elementary Repetition Rate, by Gender, SY 20032004 to SY 20072008 .............. 97
Table 30: Secondary Repetition Rate, by Gender, SY 20032004 to SY 20072008 ................ 98
Table 31: National Achievement Test Mean Percentage Scores (MPS) and Test Takers, by
Region, 20052007 ....................................................................................................................... 98 Table 32: Achievement Score Analysis Results ......................................................................... 100
Table 33: Results of Efficiency Grouping (Full Sample) .......................................................... 101 Table 34: Characteristics of Schools with Below-Average Efficiency Compared to Average
Efficiency .................................................................................................................................... 102
Table 35: Characteristics of Schools with Above-Average Efficiency Compared to Below-
Average Efficiency ..................................................................................................................... 103 Table 36: Characteristics of Schools with Above-Average Efficiency ...................................... 104 Table 37: Characteristics of Schools with Below-Average Efficiency ...................................... 105 Table 38: Characteristics of Schools with Above-Average Efficiency ...................................... 106
Table 39: Government Spending on Education, 20022008 ...................................................... 107 Table 40: Government Spending on Education, 20022008 in Constant Prices ........................ 107
Table 41: Government Spending on Education, % GDP, 20022008 ....................................... 108 Table 42: Government Spending on Education, % of NG Spending Net of Debt Service ......... 108

Table 43: Sectoral Distribution of National Government Spending ........................................... 109
Table 44: Government Spending on Basic Education per Pupil................................................. 109 Table 45: National Government Spending on Education by Expense Class .............................. 110 Table 46: LGU Spending on Basic Education ............................................................................ 111
Table 47: National Government Basic Education Appropriations, Allotments & Obligations,
20022008 .................................................................................................................................. 112 Table 48: Real Per-Pupil Spending by Region ........................................................................... 114 Table 49: Department of Education Regional Basic Education Spending (Obligations) by
Expense Class, 20022008 ......................................................................................................... 118 Table 50: Department of Education Regional Basic Education Spending (Obligations) by Levels
by Expense Class, 20022008 .................................................................................................... 122 Table 51: Basic Statistics –for the Philippines ........................................................................... 143
BOXES
Box 1: BEIS SY 20042005 Compared to APIS 2004 on Net Enrollment Rates .......................... 7 Box 2: Using Conditional Cash Transfers to Reduce Gender and Income Class Inequities in
Education: Lessons from Mexico ................................................................................................. 19 Box 3: Total Government Spending per Pupil on Basic Education: 2002 to 2008 ...................... 25 Box 4: The Concession Schools Program of Colombia................................................................ 34
Box 5: School-Related Determinants of Learning Achievement ................................................. 38 Box 6: An Alternative Method to Estimate Shortages .................................................................. 43
Box 7: Other Critical Expenditures............................................................................................... 46
Box 8: Budget Execution Process in the Philippines .................................................................... 54
i
Acknowledgements
This report was prepared by a World Bank and AusAID team, under the leadership and
guidance of Bert Hofman, WB Country Director, Philippines; Emmanuel Jimenez, WB EASHD
Sector Director; Titon Mitra, Minister-Counsellor, AusAID Manila; and Eduardo Velez Bustillo,
WB EAP Education Sector Manager. The WB team was co-led by Lynnette Perez, Senior
Education Specialist and Yasuhiko Matsuda, Senior Public Sector Specialist, and included
Rozanno Rufino, Education Specialist. The AusAID team was co-led by Ken Vine, Senior
Education Adviser; and Mark Todd, Education Adviser. The team included Adora Perez,
Portfolio Manager, Education; Hazel Aniceto, Senior Program Officer; and Andrew Cumpston,
Senior Economic Adviser. The WB-AusAID team was ably supported by a team of Consultants
led by Vandana Sipahimalani-Rao and included Michael Alba, Jason Alinsunurin, Jo Ann Cruz,
Rouselle Lavado, Shimz Manaois, Honesto Nuqui, Emmanuel San Andres, Anne Sevilla, and
Justine Diokno-Sicat. Research assistance was provided by Remrick Patagan. Kristine May San
Juan-Ante and Lilian San Gabriel provided excellent administrative and logistical support to the
PER team.
The team benefitted from excellent support of the Manila Offices of the World Bank and
the AusAID. WB Peer Reviewers were Elizabeth King, Sector Director, Education; Ulrich
Lachler, Lead Economist, EAP; Eric Bloom, Senior Economist, LCSHE; Vicente Paqueo,
Consultant, WB. AusAID Peer Reviewers were Stephen Passingham, Principal Education
Adviser, AusAID Canberra; Warren Turner, Portfolio Manager for Economics and Public
Finance Management, AusAID Manila; and Timothy Cadogan-Cowper, Policy/Program
Manager for Economics and Public Finance, AusAID Canberra. Contributing Peer Reviewers
were Kathleen Burke, Program Manager for Partnerships, AusAID Canberra and Lea Neri,
Senior Program Officer, AusAID Manila.
The preparation of this report greatly benefitted from the excellent support provided by
the Philippine Government authorities led by the Department of Education and the Department
of Budget and Management. The PER team held consultation workshops in December 2008 and
June 2009. Key stakeholders and partners from government, nongovernment organizations,
academe, business, and the private sector participated. The team is grateful to these key groups,
who shared their valuable insights and feedback and provided useful comments with the PER
team. However, they are not responsible for the recommendations that the team offers. The team
is grateful to key partners who took the time to meet with them and who provided information in
a competent and timely manner.
This report was funded through a grant by the AusAID World Bank Philippines
Development Trust Fund, which is financed by the Australian Government through AusAID.
ii
Executive Summary
1. The 2010 Philippines Basic Education Public Expenditure Review (BEPER) provides an
overview of public expenditures and outcomes in the basic education sector since 2000. The PER
team intends this analysis to assist the Department of Education (DepED) in setting policy
priorities and in making decisions on resource allocation, utilization, and management. In this
review, we analyze trends in education performance as they relate to the Philippines’ Education
for All (EFA) goals and the objectives of the Basic Education Sector Reform Agenda (BESRA).
Our analysis traces trends in government spending and their impact on basic education inputs
and outcomes. We also examine the equity dimensions of the education outcomes and spending
across geographic areas, households of different income levels, and gender. We examine in detail
the processes for executing DepED’s priority programs such as the provision of new teaching
posts, school buildings, furniture, and textbooks, and we identify potential bottlenecks that slow
implementation.
Philippine Basic Education Sector: Performance and Challenges
2. Although the Government of the Philippines has committed to the Millennium
Development Goals (MDGs) and EFA goals by 2015, its level of investment in basic education
is not sufficient for realizing these commitments. Although we have seen some positive signs
with slight improvements in access and quality indicators and increases in government spending
on classrooms and textbooks, the overall conclusion of this review is that the MDG and EFA
targets will likely not be reached by 2015, given the current slow pace of progress. Indeed, the
indicators for SY 2008-2009 are so far short of those targets that these would be difficult to
achieve even if the present levels of spending were to be substantially increased and rapid gains
were made in the efficiency of program implementation.
Declining Performance
3. The performance of the basic education sector has declined steadily since the late 1990s.
Before 1990, the Philippines was considered one of the most highly educated developing
countries. Its enrollment rates at all levels of education were higher than those of other countries
with comparable, or even higher, income levels. However, since the late 1990s, the Philippines
has lost ground to its neighboring countries. Enrollment rates significantly increased for these
countries, but enrollment in the Philippines has declined. Both elementary and secondary school
net enrollment rates have dropped from the peaks of over 90 percent and 70 percent in the 1990s
to 84 percent and 60 percent, respectively, in 2008. Since 2000, the school-age population has
grown at an average annual rate of 2.1 percent, far outpacing the average annual growth rate of 1
percent in school enrollment. The decline in school enrollments coincides with the increase in
poverty over the 20032006 period. Although there is no household data to support our thinking,
we suspect that the poor who could not afford the cost of schooling pulled their children out of
schools. Thus, it is impossible to probe this important question directly in this review.
4. Repetition and dropout rates in basic education remain persistently high at around 5
percent and 15 percent, respectively. Out of 100 school-age children, only 42 enter grade 1 at age
6, and only 30 of them complete elementary school. Of the 30 age 6 entrants who do graduate
from elementary school, only 26 make the transition to secondary school and of these, only 19

iii
complete secondary school. Moreover, only 15 of the age 6 entrants complete secondary school
in the stipulated ten years. These figures have remained almost unchanged since the 1980s. More
in-depth analyses are required to understand the exact causes of repetitions and dropouts. Some
of the reasons may be driven by factors outside the control of the school system. One likely
cause that we note is the tendency among some parents to enroll their children later than the
DepED-recommended age of six. Other reasons may be related to ways in which the education
system is run, such as the quality of instruction at the secondary-school level and its relevance
for the job market. Studies in the Philippines and other countries find that enrolling in school at
older ages occurs because children are not ready for school.
5. Another equally important issue is that students learn only two-thirds of what they are
supposed to learn at the primary level, and less than half at the secondary level. Although there
has been improvement in the last two years in Grade 6 National Achievement Test (NAT) scores
from 55 percent in SY 20052006 to 65 percent in SY 20072008, Science, Mathematics and
English scores are still less than 60 percent. At the secondary level, mean Mathematics and
Science scores remain below 50 percent. These findings highlight the urgent need to improve the
quality of teaching and learning in public schools.
Persistent Inequalities
6. Education inequality in the Philippines shows up in income, gender, and geography. The
major concern is the fact that it is the children and youth from poor families who either do not go
to school at all, do not complete school, or drop out of school the earliest. Almost one-fifth of the
poorest 20 percent are not in school, compared with only 2 percent of the richest 20 percent: a
15- to17-year-old teenager in the richest quintile is 4.4 times more likely to have graduated from
high school than a peer in the poorest quintile.
7. In gender inequality, boys consistently lag significantly behind. The differences are
particularly striking at the secondary school l level, where boys’ net enrollment rate is almost ten
percentage points below that of girls. Once enrolled, about 75% of the girls complete the entire
secondary education but less than two-thirds among boys. A 2007 UNICEF study found that half
of the boys who dropped out at older ages did so to work (Abuso et al. 2007). The same study
found that one of the main reasons for dropping out was poverty.
8. Finally, divergent educational outcomes have persisted across regions. There are few
signs that the previously lagging regions are catching up with the better performing ones. The
Philippines' official statistics do not provide us with sufficiently detailed data on education
outcomes to analyze the probable causes of the observed inequality, but it is highly likely that
there are also substantial intraregional variations in all outcome indicators as well.
Why Have Basic Education Outcomes Declined?
9. Aside from the demand-side factors including poverty, the deterioration in performance
in basic education can be attributed primarily to the decline in the government’s effort to fund
the public education system adequately, the bureaucracy’s inability to quickly spend what is
appropriated, and the government’s inability to spend on the right activities. Clearly, the issues
have much to do with the quantity, quality and efficiency of public spending.
iv
Quantity of Public Spending
10. Government spending on education declined from over 4.2 percent of GDP in 1998 to 2.6
percent of GDP in 2008. Government spending on basic education also declined from 2.9 percent
in 2002 to about 2.3 percent of GDP in 2005. This decrease translated into a steady decline in
real spending per student, which dropped between 2000 and 2005. According to the DepED’s
own 2005 Multi-Year Education Spending Plan estimates, modest increases in 2007 and 2008
recorded in national and local government spending have been sufficient to fund only 80 percent
of what was needed to meet EFA access and quality commitments.
11. The decline in public spending is due in part to a reduced public sector budget and partly
to the decreasing priority given to education, particularly basic education. The deterioration in
the government’s fiscal position followed the Asian financial crisis in the late 1990s. Although
the fiscal circumstances improved over the 20062008 period, the effects of the new revenue
measures introduced in 2004 were offset by subsequent policy actions and the subpar
performance of tax administration. This PER analysis reinforces the importance of enhancing the
government’s revenue efforts, as is repeated in other World Bank reports, to make available
more fiscal resources for critical public expenditures in basic education.
12. Further, the government's annual budget decision-making gives decreasing priority to the
education sector. The actual pattern of budget allocation suggests that among the main sector
categories, although the education sector still receives the largest share of the government
budget, in recent years basic education has been losing ground compared to some other sectors.
In obligation terms, the share of national government spending on basic education dropped from
19 percent in 2002 to just below 15 percent in 2008, but during the same period the share of
economic services, including infrastructure, increased from 27.3 percent to 31.6 percent. Basic
education's share continued to fall even after 2005, when the fiscal situation began to improve. In
addition, government spending on basic education has not kept pace with the rapidly growing
school-age population thus putting increasing pressure on the public budget.
Quality of Government Spending
13. One likely channel of causation between levels of public spending and outcomes is the
provision of inputs for education services. Providing adequate numbers and assessing the quality
of key inputs, such as teachers, classrooms, textbooks, and classroom furniture, is essential for
improving outcomes. To better understand which inputs are critical to improving basic education
outcomes in the Philippines, available data make it possible to analyze the relationships between
certain school characteristics and average learning outcomes, and to do so at different levels of
aggregation.
14. The PER review analyzed the economic composition of government spending and related
its findings to an analysis of input shortages. The PER finds that at the current level of
enrollment, the total number of teachers in the system is sufficient to keep the elementary pupil-
teacher ratio at a reasonable level. However, there are still many teachers in nonteaching
positions. Further, the pupil-teacher ratio varies significantly across regions. These findings
suggest that at the current level of enrollment, greater efficiency in resource use is possible by
redeploying teachers already employed in the elementary-school system, and by better

v
coordination between DepED and Local Government Units (LGUs), many of which often hire
what are called "locally funded" teachers to make up for teacher shortages at schools within their
jurisdictions. However, at the secondary-school level, many more teachers would need to be
hired even at the current level of enrollment. Finally, because double shifts in classrooms have a
negative effect on students' test scores, the classroom shortage remains a serious obstacle to
increasing enrollments and improving students’ learning outcomes. Here again, regional
variations appear to be a serious issue. The PER finds the recent positive trend in increasing per
pupil expenditure on Maintenance and Operating Expenses (MOOE) encouraging, particularly
MOOE grants to schools.
15. This PER analysis clearly shows that public spending matters. The insufficient public
spending on basic education and the inefficient allocation of funds has resulted in persistent
under-provision of key inputs, such as classrooms. Despite the construction of 41,546 classrooms
in 2007, the pupil-class ratio at the elementary level has improved only marginally, because
many of the new classrooms simply replaced dilapidated existing facilities. The PER analysis
indicates that an estimated additional 32,000 classrooms are needed to meet projected increased
enrollments. At the secondary-school level the situation is considerably worse, with a student-
class ratio of 52.88.
16. The PER analysis also shows in turn that adequate provisions of these school inputs
matter. Better pupil/student1-teacher and class ratios and higher per-pupil government spending
are positively correlated with better participation and completion rates at the regional level. At
the municipal level, adequate school inputs, such as the presence of better qualified teachers and
single shifts, correlate with better learning outcomes. Although these results cannot be
interpreted in a causal manner the findings indicate that higher government spending and better
input ratios are associated with better outcomes in public schools.
17. The available regional-level data clearly show positive correlations between government
spending and education outcomes. These findings suggest that increasing spending in lagging
areas is likely to narrow the geographic inequalities. An outcome of the poor coordination
between the national government and LGUs is the inequitable distribution of public resources
across geographic areas. National government spending on basic education is not related to
regional per capita GDP (i.e., it is neither regressive nor progressive) but real per pupil spending
on basic education by LGUs is positively correlated with regional real per capita GDP, i.e., it is
regressive.2 Since the national government does not have a policy for providing compensatory
funding for poorer regions, total government spending on Capital Outlay(CO) and MOOE is
biased towards richer regions. We note that since 2002, although the national government has
reduced the regional variation in real per-pupil spending, the corresponding regional variation in
LGU spending on basic education has increased.
1 In the Philippines, pupils refer to the learners at the elementary level, while students are the learners at the
secondary level* 2The relation between real per pupil spending and poverty ratios is also non-significant at the regional level. The
PER team obtained data on regional real per capita GDP and regional poverty ratios from the National Statistical
Coordination Board (NSCB) website. We did not include National Cash Allocation NCR in the analysis, since it has
a real per capita GDP that is much higher than in any other region. Thus, we treat it as an outlier.

vi
Efficiency of Government Spending: Budget Execution
18. Case studies conducted for this PER analysis show that because of operational
inefficiencies and instability in the sector's policy environment, DepED’s ability to spend the
allocated budget quickly and efficiently is weak. Thus, merely increasing allocations to the
sector, possibly by combining strengthened overall fiscal efforts and regaining the education
sector’s share in the total budget, is unlikely to produce direct results.
19. Comparing actual obligations3 to total allotments released by DepED in each fiscal year
shows that nominal increases in total allotments have outpaced increases in total obligations, thus
reducing budget execution ratios steadily from 97 percent in 2004 to 92 percent in 2008.
Furthermore, except in 2007 total available appropriations increased even more rapidly than total
allotments. However, these statistics mask much lower budget execution ratios for MOOE, and
especially for CO, which range from 56.7 percent to 71.8 percent. These facts are particularly
distressing, since MOOE and CO spending provides critical inputs for access to and quality of
education.
20. The case studies quantify the extent of inefficiency in terms of both delay and lapsed
appropriations. In some cases, program execution only began more than a year after the original
appropriation was approved because of DepED's failure to issue implementing rules and
guidelines or to release sub-allotments to the regions and to the school division offices for final
execution. Lapsed appropriations reached PhP 9 billion (7.7 percent of the total available
appropriations) and PhP 5.4 billion (4.2 percent of the total available appropriations) in 2005 and
2006, respectively. These amounts exceeded the combined total appropriations for school
building, textbook procurement, and school furniture purchases for those years.
21. The case studies suggest two important systemic causes of poor execution: uncertainty or
instability in the policy environment; and excessive complexity in certain administrative
procedures. Policy uncertainty and instability is sometimes caused by DepED’s need to interact
with external actors, such as legislators whose consent is almost a prerequisite for the selection
of classroom construction sites, or the Civil Service Commission, which must sign off on new
teacher certification. However, in other cases DepED itself has been a source of policy instability
and uncertainty.
22. The PER analysis suggests that although the basic education sector needs additional
resources for rapidly expanding the supply of key inputs for quality education services, unless
efforts are intensified to improve budget execution and even if resources were available, merely
increasing allocation would be unlikely to result in actual increases in the larger number of
critical inputs and their efficient deployment.
3"Actual obligations" are defined as those liabilities that are legally incurred and to which the government is
committed to pay, either immediately or in the future. These obligations represent the closest the PER team could
get to actual spending in the budget documents.

vii
Slow Signs of Recovery
23. Since 2006, signs of improvements in government spending, input availability, and minor
improvements in outcomes are encouraging. However, the pace has been, and is, too slow for the
Philippines to meet its Education for All (EFA) and Millennium Development Goal (MDG)
commitments.
24. Since around 2005, some of the outcome indicators have stopped declining. For example,
completion rates increased from 66.5 percent to 71.4 percent for elementary in SY2005-2006,and
56.9 percent and 70.8 percent for secondary in in SY20072008. The increase in enrollment
rates has been more modest. These encouraging trends coincide with some increases in
government spending on basic education that began in 2006. However, real per-pupil spending is
still below its 2000 level and is still far short of the international education commitments of the
government. According to DepED’s own 2005 Spending Plan projections, even combined
National Government (NG) and LGU spending would have funded only 80 percent of the monies
needed to meet EFA access and quality commitments in 2007 and 2008.
25. There are improvements in the quality of spending. MOOE spending has increased
school-based management grants and MOOE grants are being released directly to schools.
Because of greater resource availability created by expanded fiscal space, DepED has been able
to hire thousands of teachers, to replace many dilapidated classrooms, and to build new ones.
However, this report finds that there has been no improvement in the efficiency of public
spending.
Moving Forward
26. This PER has produced compelling evidence of serious underfunding of basic education,
which threatens the government’s goal of achieving the MDG and EFA commitments. However,
achieving a higher level of spending may demand much stronger fiscal efforts by the
government, given the similarly pressing needs in other important sectors such as health and
social protection, as well as economic infrastructure. In 2005 the government introduced the
Basic Education Sector Reform Agenda (BESRA), which is a coherent, sound basic education
reform agenda and policy framework. But BESRA's effectiveness is hampered by limited public
resources available for the sector, inefficiency in the utilization of available resources, and a
rapidly growing school-age population. If judged from the relative success of the reforms
instituted since 2005, then the answers to improving education are already in place, but they need
to be accelerated and reinforced. To reverse the decline and to meet the MDG and EFA goals,
the government must increase and sustain its reform efforts.
27. However, to take full advantage of initial gains and to translate its expected benefits more
quickly into desired outcomes, the government's current efforts can be complemented. First, by
ensuring that more resources reach students in need. And second, by improving DepED’s
decision-making. Thus, the department's response to problems can use specific policy
interventions that are based on objective data and sound analysis. Following these
recommendations would address the issues of quantity, quality, and efficiency.

viii
More and Better Managed Resources
28. For the Philippines to meet its MDG and EFA goals, the government must make more
resources available on a per-pupil basis and implement a series of measures that will make
expenditures count. Such measures range from reallocating the budget to make it responsive to
local needs and to better coordinating national and local governments to improve their budget
execution. In addition, it is essential to initiate a set of complementary actions, such as more
effective partnerships with funders and providers in the private sector, and in other sectors of the
government that can address causes of low enrollments outside the education sector. This
objective can be accomplished by a combination of the following strategies:
29. Increasing funding. Gradually increase the national budget allocation to the basic
education sector over the medium term. The estimates show that national and local government
spending should increase substantially to a minimum of 3.2 percent of GDP by 2015. This
increase should go into effect even if other quality improvement measures are not accounted for.
Further, the increase should be more than 6 percent of GDP if there are improvements in the
teacher-pupil ratios, prioritization of quality improvement measures such as teacher training, and
elimination of shifts in classroom use.
30. Improving budget execution. To ensure allocated resources are effectively utilized in a
timely manner, there should be a review of all relevant administrative actions. This review would
identify where efficiency gains could be made by simplifying and streamlining procedures. A
longer-term agenda would include major investments in strengthening the department’s key
management capacities, such as planning, procurement, and introducing internal management
systems and practices that improve coordination across units and clarify the accountability of
those responsible for specific aspects of program and project implementation.
31. Allocating resources. This report highlights the need to invest more in classroom
construction and to ensure an adequate number of qualified teachers and of teaching and learning
resources. This report finds that although there are already enough teachers in elementary
schools overall, there is a problem of deployment, which is primarily because of teachers'
geographic distribution. It is important to strengthen DepED’s ability to project and plan for both
future enrollments for provision of the required level of inputs, including new teacher hires.
Increased and sufficient funds should be made available at the school level where they can do the
most good.
32. Introducing explicit mechanisms to ensure more effective coordination of
expenditure assignments between DepED and LGUs. National and local government NG and
LGU spending on basic education should be tightly coordinated with DepED to provide for
increased resources, especially in poorer regions. Doing so will require a stronger compact
between national and local governments. This agreement should be designed to strengthen
school-based management and to yield a more equitable allocation of resources in areas such as
teacher deployment, targeting of capital expenditures, and provision of teaching and learning
materials.
33. Enhancing cross-sectoral collaboration, ensuring the link between demand- and
supply-side interventions. Studies in the Philippines have identified poverty and the high

ix
opportunity cost of schooling, particularly for older boys, as a key deterrent to completing
school. Pantawid Pamilyang Pilipino Program (4Ps), which is the government’s Conditional
Cash Transfer program (CCT), is expected to boost parents’ incentives to keep their children in
schools by granting cash grants to household with school-age children in exchange for constant
school attendance. Using the recently launched CCT in a well-targeted effective manner is
essential to addressing this issue and to ensuring the link between demand- and supply-side
interventions.
34. Increasing use of alternative delivery modes (ADMs) of education. ADMs can help
address the lack of inputs in critical areas and can also respond to learners in disadvantaged,
difficult, or special contexts. In addition to responding to the problem of input shortages,
appropriate ADMs can be used as a viable channel of learning for students whose access to
learning is limited by poverty the out-of-school youths, and children in disaster and conflict-
prone areas. With proper planning and implementation, quality education services could be
provided through ADMs with fewer inputs and thus could also generate possible savings for
DepED.
35. Enhancing public-private partnerships (PPP) within a coherent policy and
regulatory framework. The government's Education Service Contracting (ESC) Program is an
example of a successful public-private partnership in education in the Philippines. The program
has been proven to be cost-effective in increasing access to schooling. It has done so by
providing grants to households to enroll children who would otherwise have gone to public
schools into certified private schools where space is available. Expanding the ESC program
would significantly alleviate the pressure on the public school system to build thousands of
additional classrooms to accommodate both current and future pupils.
Evidence-based Decision-making
36. The effectiveness of government interventions in basic education depends on the quality
of data available for policy analysis and DepED’s ability to institutionalize evidence-based
decision-making. The quality of available data is poor and it is difficult to systematically
coordinate different data sources needed to analyze trends in outcomes and spending in the
subsector. To address this concern, DepED might pursue the following key strategies:
37. Strengthening capacities for evidence-based decision-making. DepED should
gradually invest in building capacities for making its policy decisions based on objective analysis
and evidence from policy research. Doing so should enable DepED to apply more rigorously its
criteria of relative efficiency and cost-effectiveness in its budgetary decision-making.
38. Improving availability of accurate and consistent data. To consolidate and
institutionalize evidenced-based decision-making, the government should invest in improving the
coverage and quality of policy-relevant data. Doing so should be an urgent priority for basic
education. Improvements should include the timeliness, quality, and better sampling of current
household surveys, such as the Family Income and Expenditure Survey (FIES). The DepED’s
Basic Education Information System (BEIS) is a useful tool, but there is room for improving its
data quality and ability to link with other sources of information in the sector can be improved.

x
39. Tracking and monitoring allocation and spending. Institutionalizing annual reviews of
public expenditures and key programs and conducting periodic public expenditure tracking
surveys (PETS) and school-level surveys would be worthwhile initiatives.. Appropriately
measured and disseminated, PETS should enhance transparency and contribute to ensuring that
education expenditures reach the intended beneficiaries. Expenditure tracking could focus first
on the school MOOE by providing accurate and transparent information on actual inflows to
schools and by identifying the extent and location of leakages.
40. Institutionalizing the updating of the Multi-Year Spending Plan. In the short run, the
DepED should regularly update (e.g., every other year) the Multi-Year Spending Plan, which
was initiated in 2005 as a basis for annual budget formulation. Regularly updating the spending
plan would enable DepED to seek guaranteed allocation in the medium term, thus improving the
predictability of resource flows and spending for priorities.

xi
Introduction: Motivation and Structure
Motivation
41. The goal of the Basic Education Public Expenditure Review (BEPER) is to provide a
detailed examination of the trends and patterns in public spending in the basic education sector
and their relation to access, participation, equity, and learning achievement outcomes from 2002
to 2008. By documenting basic information and identifying the issues and challenges confronting
the basic education sector in these areas, this PER clarifies the real issues confronting Philippine
basic education and encourages serious discussions of the issues among a broad set of
stakeholders in the sector. The PER findings are also intended to inform the government’s
budget decision making, as well as its medium-term reform priorities in the basic education
sector.
42. Since one of the Review's goals is also to build local capacities in public expenditure
analysis, the PER team was carried out in close partnership with several local researchers and
selected government agencies.
Structure of Report
43. This Review covers the following set of topics in six chapters:
Chapter 1 analyzes trends in education performance. Its focus is on gross and net
enrollment, repetition, drop-out rates, cohort survival, completion, and learning
achievement. The Review examines these factors in the context of Millennium
Development Goals and Education for All goals and sector objectives.
Chapter 2 examines regional, economic, and gender dimensions of equity in the basic
education sector.
Chapter 3 studies trends in government spending on basic education in relation to
sector priorities and against the projections in the DepED’s Multi-Year Education
Spending Plan. It also makes preliminary estimates of future resource requirements
for the basic education sector.
Chapter 4 discusses the quality of government spending on basic education in terms
of its composition and impact on inputs and outcomes, and its geographic allocation.
Chapter 5 diagnoses bottlenecks in executing DepED’s priority programs.
Chapter 6 summarizes the policy implications of the main findings of the study and
offers several recommendations.

1
Chapter 1 - Performance of the Philippine Basic Education Sector,
20022008: Access, Efficiency, and Quality
1. This chapter analyzes trends in access, retention, survival, completion, transition, and
learning achievement over the period 2002 to 2008. Both this and earlier studies of the
performance of the basic education system have been hampered by DepED databases that are
neither comprehensive, accurate, nor timely. However, in 2002, DepED introduced a new, more
accurate Basic Education Information System (BEIS). BEIS has been used extensively in the
analyses presented in this Chapter. In addition, the analyses draw selectively on data from the
2004 Annual Poverty Indicators Survey (APIS) and DepED’s annual National Achievement Test
(NAT).
Access to Schooling: Trends in Enrollment Rates
2. The 1990s was a period of sizeable growth in access to schooling, which was reflected in
improving participation rates at elementary and secondary levels. The net enrollment rate (NER)
at the elementary level rose from 84.6 percent in 1990 to 92.7 percent in 2000. At the secondary
level, it rose from 54.7 percent in 1990 to 62.3 percent in 2000. Total enrollment in the
Philippine basic education system at both the public and private schools grew at an average
annual rate of 2.7 percent from 19811999. This rate was faster than the population growth rate
of 2.3 percent. In fact, enrollment in secondary schools grew very rapidly at an average annual
rate of 4.5 percent between 1985 and 1992, particularly after 1987 when the government began
to provide free secondary education.
3. By contrast, following the Asian financial crisis in the late 1990s, there has been a
marked decline in enrollment rates, both in the gross enrollment rate (GER) and the net
enrollment rate (NER). Total enrollment in public and private schools grew at an average annual
rate of just under 1 percent from 20022008, which was much lower than the 2.7 percent annual
average growth rate from 19811999. During the 19982008 period, the population of the
country grew at an average annual rate of 2.04 percent, twice the pace of the increase in
enrollments. More importantly, the six- to 11-year-old population and the 12- to15-year-old
population grew at even higher average annual rates of 2.11 percent and 2.1 percent,
respectively. These statistics imply that fewer and fewer children of school age enrolled in
school during this period. Figure 1 illustrates the declining GER and NER at elementary and
secondary levels. Indonesia, Malaysia, and Thailand, which were substantially behind the
Philippines years ago, have now surpassed the Philippines with NERs of 95 percent, 97 percent,
and 94 percent, respectively.
4. The elementary NER fell by about 7 percent from 2002 to 2008, bringing it to a level
below what it was in 1990. The MDG of 100 percent elementary NER by 2015 will now be
extremely difficult to achieve, even though the rate of decline decreased and the NER increased
marginally in SY 20082009.4 After improving through the 1990s, the secondary-level NER was
relatively stable from 2002 to 2008. A comparison of elementary and secondary NERs shows
4This increase is negligible and could be within the statistical margin of error. However, the NER estimates were
performed by estimating population figures at the provincial level. See Annex 1 on Data and Methods for further
details.
2
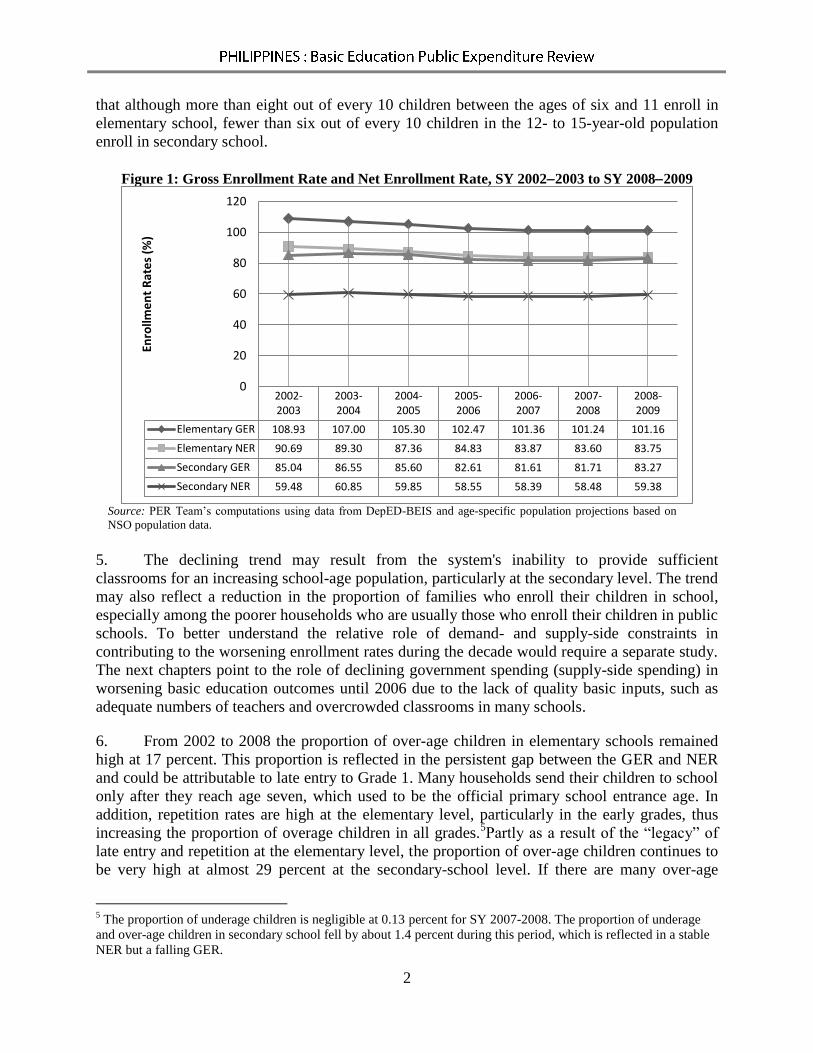
that although more than eight out of every 10 children between the ages of six and 11 enroll in
elementary school, fewer than six out of every 10 children in the 12- to 15-year-old population
enroll in secondary school.
Figure 1: Gross Enrollment Rate and Net Enrollment Rate, SY 20022003 to SY 20082009
Source: PER Team’s computations using data from DepED-BEIS and age-specific population projections based on
NSO population data.
5. The declining trend may result from the system's inability to provide sufficient
classrooms for an increasing school-age population, particularly at the secondary level. The trend
may also reflect a reduction in the proportion of families who enroll their children in school,
especially among the poorer households who are usually those who enroll their children in public
schools. To better understand the relative role of demand- and supply-side constraints in
contributing to the worsening enrollment rates during the decade would require a separate study.
The next chapters point to the role of declining government spending (supply-side spending) in
worsening basic education outcomes until 2006 due to the lack of quality basic inputs, such as
adequate numbers of teachers and overcrowded classrooms in many schools.
6. From 2002 to 2008 the proportion of over-age children in elementary schools remained
high at 17 percent. This proportion is reflected in the persistent gap between the GER and NER
and could be attributable to late entry to Grade 1. Many households send their children to school
only after they reach age seven, which used to be the official primary school entrance age. In
addition, repetition rates are high at the elementary level, particularly in the early grades, thus
increasing the proportion of overage children in all grades.5Partly as a result of the “legacy” of
late entry and repetition at the elementary level, the proportion of over-age children continues to
be very high at almost 29 percent at the secondary-school level. If there are many over-age
5 The proportion of underage children is negligible at 0.13 percent for SY 2007-2008. The proportion of underage
and over-age children in secondary school fell by about 1.4 percent during this period, which is reflected in a stable
NER but a falling GER.
2002-2003
2003-2004
2004-2005
2005-2006
2006-2007
2007-2008
2008-2009
Elementary GER 108.93 107.00 105.30 102.47 101.36 101.24 101.16
Elementary NER 90.69 89.30 87.36 84.83 83.87 83.60 83.75
Secondary GER 85.04 86.55 85.60 82.61 81.61 81.71 83.27
Secondary NER 59.48 60.85 59.85 58.55 58.39 58.48 59.38
0
20
40
60
80
100
120
Enro
llme
nt
Rat
es
(%)

3
children in basic education, it increases the burden on the system, increases inefficiency, and
reduces cost effectiveness. Further, high repetition rates often lead to increased dropout rates in
later grades.
7. This analysis covers both private and public school enrollment. Although most of the
student population is served by public schools, the share of enrollment in private schools at the
elementary level has increased marginally over the last few years to a little over 8 percent in
2008. In contrast, the share of private enrollment at the secondary level declined by about 1
percent between 2002 and 2008 to 20 percent in SY 20082009. However, we note that private
school enrollment reported by DepED are estimates extrapolated from data submitted by a
sample of private schools. These variations in enrollment may not reflect the true situation.
Further, because more private schools now submit data to DepED, the accuracy of the estimates
may have improved in recent years.
8. The data show that over the period 2002 to 2008, the school-age population grew at over
2 percent but enrollment grew by less than 1 percent annually. These divergent trends
demonstrate that unless there is an immediate and large increase in funding enrollment, MDG
and EFA targets will not be met by 2015.
Trends in Internal Efficiency Indicators
9. Enrolling in school is essential, but staying in the system and obtaining a basic education
is critical if the child and the community are to reap the benefits of schooling. Therefore, this
Review analyzes trends in internal efficiency indicators, which include repetition, dropout,
cohort survival, and completion rates at the elementary and secondary levels. These indicators
are often used as indicators of the quality of schooling.
10. Many children who enter school do not reach the last grade of the cycle. Today, out of
100 school-age children, only 42 six-year-olds enter Grade 1 and 30 complete the elementary
level. Of the 30 who do graduate from elementary school, about 26 move on to secondary
school. Of these, only 19 complete high school, and only 15 of the 19 complete school in the
stipulated 10 years.
11. A full diagnosis of the reasons for high dropout and repetition rates is beyond the scope
of this PER report. However, a recent UNICEF study on why Philippine children drop out of
school identified poverty as the prime reason (Abuso et al. 2007). Older boys drop out of school
to help parents with livelihood activities or to find work as means of augmenting family income.
Older girls dropout to take care of younger siblings and to enable their parents to go to work. The
study emphasized that poverty interacted with school-related factors that motivate children to
drop out, such as distance from school, overcrowded classrooms, quality and numbers of
teachers, and academic requirements. The UNICEF study points to the need to address both
demand- and supply-side constraints to retaining children in school and to enabling them to
complete schooling. A policy tool that addresses demand-side constraints is the Conditional
Cash Transfer (CCT).
12. Elementary: The Cohort Survival Rate (CSR) measures the proportion of children in the
first grade who reach the last grade of elementary or secondary school. This indicator assesses
4
the efficiency of the system. A low CSR is caused by high dropout rates. It is generally argued in
the literature that high dropout rates reflect school characteristics such as high pupil-teacher and
pupil-classroom ratios, a crowded curriculum, and didactic teaching practices. Hence, dropout
rates are useful proxies for school quality. Earlier studies (ADB and World Bank 1999; Manasan
2002, 2008) reported that elementary CSR in public schools remained at about 68 percent from
1990 to 2000, with minor fluctuations over the years. Thus, almost one-third of those enrolled in
Grade 1 failed to reach Grade 6.
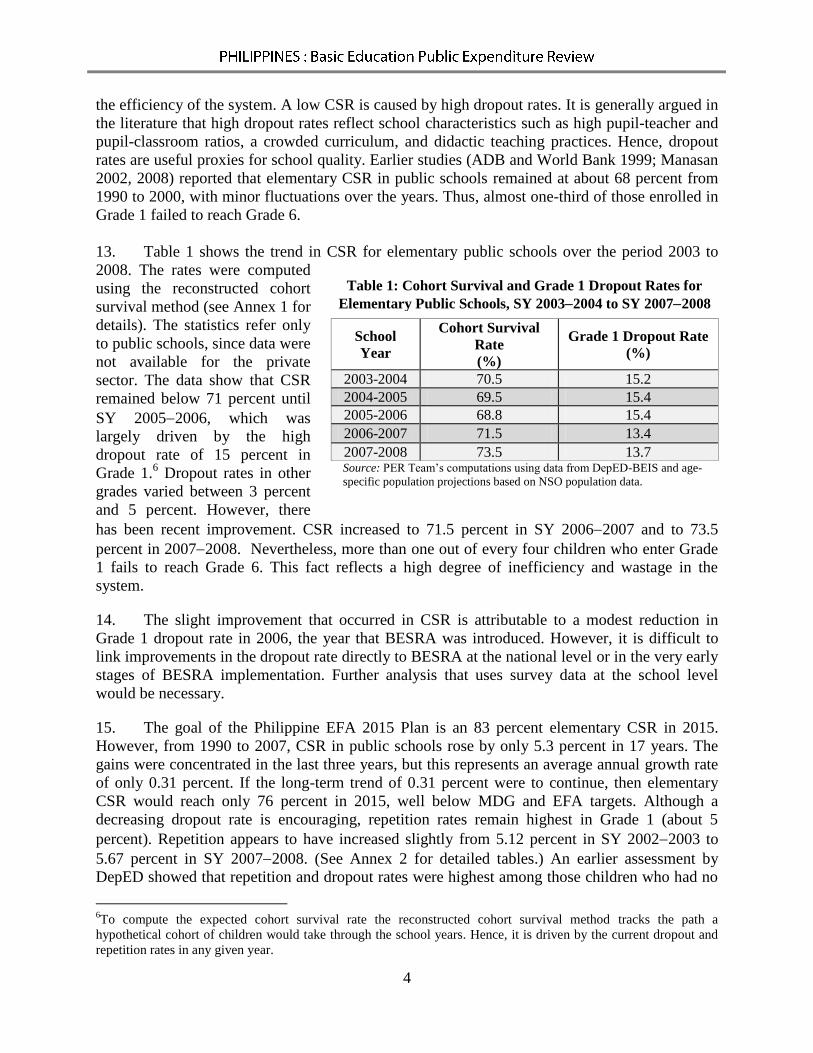
13. Table 1 shows the trend in CSR for elementary public schools over the period 2003 to
2008. The rates were computed
using the reconstructed cohort
survival method (see Annex 1 for
details). The statistics refer only
to public schools, since data were
not available for the private
sector. The data show that CSR
remained below 71 percent until
SY 20052006, which was
largely driven by the high
dropout rate of 15 percent in
Grade 1.6 Dropout rates in other
grades varied between 3 percent
and 5 percent. However, there
has been recent improvement. CSR increased to 71.5 percent in SY 20062007 and to 73.5
percent in 20072008. Nevertheless, more than one out of every four children who enter Grade
1 fails to reach Grade 6. This fact reflects a high degree of inefficiency and wastage in the
system.
14. The slight improvement that occurred in CSR is attributable to a modest reduction in
Grade 1 dropout rate in 2006, the year that BESRA was introduced. However, it is difficult to
link improvements in the dropout rate directly to BESRA at the national level or in the very early
stages of BESRA implementation. Further analysis that uses survey data at the school level
would be necessary.
15. The goal of the Philippine EFA 2015 Plan is an 83 percent elementary CSR in 2015.
However, from 1990 to 2007, CSR in public schools rose by only 5.3 percent in 17 years. The
gains were concentrated in the last three years, but this represents an average annual growth rate
of only 0.31 percent. If the long-term trend of 0.31 percent were to continue, then elementary
CSR would reach only 76 percent in 2015, well below MDG and EFA targets. Although a
decreasing dropout rate is encouraging, repetition rates remain highest in Grade 1 (about 5
percent). Repetition appears to have increased slightly from 5.12 percent in SY 20022003 to
5.67 percent in SY 20072008. (See Annex 2 for detailed tables.) An earlier assessment by
DepED showed that repetition and dropout rates were highest among those children who had no
6To compute the expected cohort survival rate the reconstructed cohort survival method tracks the path a
hypothetical cohort of children would take through the school years. Hence, it is driven by the current dropout and
repetition rates in any given year.
Table 1: Cohort Survival and Grade 1 Dropout Rates for
Elementary Public Schools, SY 20032004 to SY 20072008
School
Year
Cohort Survival
Rate (%)
Grade 1 Dropout Rate (%)
2003-2004 70.5 15.2 2004-2005 69.5 15.4 2005-2006 68.8 15.4
2006-2007 71.5 13.4
2007-2008 73.5 13.7
Source: PER Team’s computations using data from DepED-BEIS and age-
specific population projections based on NSO population data.

5
preschool experience. Further in-depth analysis is needed to understand why repetition rates
continue to be high while dropout rates have started to decline.
Table 2: Cohort Survival Rate in Secondary Public Schools, SY 20032004 to SY 20072008
School Year Cohort Survival Rate
(%) Average Dropout Rate
(%) 2003-2004 75.6 7.9 2004-2005 74.1 8.5
2005-2006 61.5 12.5
2006-2007 77.0 7.5
2007-2008 75.7 8.0 Note: Average dropout rate has been computed by averaging the dropout rates for all grades.
These rates were individually computed using the reconstructed cohort survival method.
Source: PER Team’s computations using data from DepED-BEIS and age-specific population
projections based on NSO population data.
16. Secondary: Although the CSR in public elementary schools was stable during the 1990s,
public secondary-level CSR worsened from 75 percent in SY 19901991 to 68.7 percent in SY
1999-2000 (Manasan 2002). BEIS data show that this trend was reversed during the past decade.
By SY 20072008 secondary CSR returned to 75 percent. Table 2 shows that after 2002,
secondary CSR dropped again to a low of 61.5 percent in SY 2005-2006 before recovering the
following year. The dropout rates are the highest in the first year of secondary school, although
they average 7 percent to 9 percent in all years. Data for SY 20052006 show that although the
dropout rate increased, CSR dropped markedly. However, these patterns are difficult to interpret
since the Bridge Program was introduced in SY 20032004 to assist children in their transition
from elementary to secondary school. The Bridge Program in English, science, and math helped
incoming first-year students who were unprepared for the academic demands of secondary
education. The students who were beneficiaries were identified based on a High School
Readiness Test conducted in May 2004. However, the Bridge Program was implemented for
only a year. Participants in the program are thus included for only one year in the data. Including
them in the data distorts dropout rates for SY 20052006.
17. Secondary repetition rates increased slightly during the period of this analysis. The
repetition rate for the first year of secondary school, for example, increased from 3.22 percent in
SY 2002-2003 to 4.39 percent in SY 2007-2008 (See Annex 2 for detailed tables). This increase
in repetition rates is a major concern, and further analysis is needed to understand the reasons for
this poor performance.
Trends in Completion Rates
18. We define completion rates as the proportion of children enrolled in Grade 1 or Year 1
who complete elementary or secondary school.7 Using the reconstructed cohort survival method,
7According to DepED’s definition, the difference between the cohort survival rate and the completion rate is that the
cohort survival rate only measures students who reach the last grade, not those who graduate. The World Bank and
UNESCO Institute of Statistics use a different calculation method to compute for Primary Completion Rate (PCR).
The World Bank defines PCR as the ratio of the total number of students who successfully complete the last year of
primary school in a given year to the total number of children of official graduation age in the population. In

6
the PER team computed completion rates to estimate what proportion of the cohort that entered
Grade 1 completed secondary school.
19. Figure 2 shows that school completion rates fell in SY 20052006 before rising again in
SY 2007-2008. The completion rate also showed a slight “dip” at the elementary level, in 2005
before recovering to a higher level in SY 20072008. We note that fewer than half the cohort
that enrolls in Grade 1 in public schools completes secondary school. This statistic reflects the
high dropout rate of about 15 percent in Grade 1, low transition rates of about 85 percent from
elementary to secondary school, and high dropout rates of 9 percent to 10 percent in each year of
secondary school.8
Figure 2: Completion Rate, SY 20032004 to SY 20072008
: Source:PER team’s computations using data from DepED-BEIS and age-specific population projections based on NSO
population data.
UNESCO's method, the PCR in the Philippines for both the World Bank and UNESCO has similar values; PCR has
already reached the 90s mark. 8Completion rate can also be defined as the proportion of children who complete elementary or secondary school
without repeating any grades. This definition would lead to lower completion rates due to repetition rates of the
order of 4 percent to 5 percent in Grade 1 and Year 1 and 2 percent to 3 percent in other grades and years. For
example, the completion rate for secondary school if we trace a cohort starting Grade 1 in SY 20072008 would fall
to 34.9 percent if we were to apply the strict definition of completing elementary and secondary school in ten years,
i.e., without any repetition).
2003-2004 2004-2005 2005-2006 2006-2007 2007-2008
Elementary 68.19 66.88 66.54 69.17 71.40
Secondary 71.40 69.71 56.85 72.25 70.77
Elementary to Secondary Cycle 42.73 38.56 37.20 42.31 45.33
0
10
20
30
40
50
60
70
80
Co
mp
leti
on
Rat
e (
%)

7
Box 1: BEIS SY 20042005 Compared to APIS 2004 on Net Enrollment Rates
There are often discrepancies between school attendance figures obtained from the BEIS and
those from surveys of the National Statistics Office (NSO), such as the Annual Poverty
Indicators Survey (APIS).9 For example, in SY 20042005, BEIS net enrollment rates are
reported to be 87.36 percent and 59.85 percent, respectively, for the elementary and secondary
levels. The corresponding estimates from APIS 2004 are 93.67 percent and 84.91 percent.
There are two main reasons for these discrepancies:
First, the data sources collect information differently. BEIS is an administrative reporting
system for schools, the intent of which is to conduct a virtual census every school year. APIS is
a household survey based on a stratified, clustered, random sample. It is intended to be
representative only at the national and regional levels. Thus, the accuracy of BEIS figures
depends on factors such as the extent to which schools submit completed BEIS forms and the
accuracy of the data reported by schools, transmitted to the DepED national office, and
recorded in the BEIS database,10
while the precision of APIS estimates depends on the size of
sampling errors and the accuracy of household responses. Second, the data sources have different reference periods for, and definitions and treatments of,
the term “enrollment.” In the BEIS, the reference period is an entire school year, and enrollment
is a technical term that refers to a student being properly registered as of August 31 (see
Definition of Terms under Facts and Figures in the DepED website:
http://www.deped.gov.ph/factsandfigures/default.asp).In APIS, the reference period is the first
six months of the survey year. APIS gives no significance to enrollment other than its everyday
meaning, whatever the respondent may consider that to be. Moreover, survey respondents may
have different interpretations and responses to the questions “Is (name of child) currently
attending school? (If yes) What grade/year is (child) currently attending?” As noted in Keane
(1970), an affirmative answer to the first question may include children who went to school for
the whole year, those who dropped out at some point during the school year, and those who
never attended school. One reason we still consider education outcome indicators from
household data is that it is possible to compare these across income quintiles. Doing so is not
possible if we use the BEIS data.
International Comparisons of Participation and Completion Rates
20. Comparisons of the Philippines with countries that have an income level (in per capita
PPP terms) similar to that of the Philippines and to some neighboring countries with higher
income levels, indicate that the Philippines’ participation and completion rates are lower than
average (See Figure 3). The average NER for this group of countries was 89 percent and the
average completion rate was 86 percent. In addition, most of the countries shown in Figure 3
have increased their participation rates in recent years, but these rates have been declining in the
Philippines. The pressure of a high population growth rate of 2.04 percent (2.1 percent of the
school-age population) as a contributing factor to declining participation rates contrasts sharply
9 This issue is not new. Keane (1970) discusses differences in enrollment figures obtained from Bureaus of Public
and Private Schools and from the Census of Population and Housing. 10
Two continuing problems with the BEIS data set are the non-reporting of ARMM (for example, in SY 20042005
and SY 20052006) and non-reporting of private schools, which is random. Private schools submit their BEIS forms
in certain years, but not in others. However, DepED does extrapolate numbers for the country.

8
with the population growth in comparable countries such as Vietnam, which has a growth rate of
1.2 percent; Thailand, which has 0.6 percent; and Indonesia, at 1.6 percent. Earlier studies
reported that the NER for the Philippines was higher than those of most of its Asian neighbors in
the 1990s. Yet the deterioration of most outcome indicators for the Philippines since has resulted
in elementary participation and completion rates being lower than those for most neighboring
countries, including Indonesia, Malaysia, Thailand, and Cambodia.11
Figure 3: International Comparison of Elementary Outcome Indicators
a. Data are for 2008 except where indicated with (i): 2006 and (ii): 2007.
b.NER (SY20082009) and completion rate (SY20072008) figures for the Philippines are based on the PER Team’s
computations using data from DepED-BEIS and age-specific population projections based on NSO population data.
c. NER data for Thailand is from the statistical tables of the 2010 UNESCO EFA Global Monitoring Report/UIS 2009.
Source: UNESCO Institute for Statistics (UIS) in World Bank-EdStats, May 2010
Trends in Learning Achievement
21. Many observers argue that the most important, direct indicator of school quality is the
learning achievement level of students. Manasan (2002) reported that mean scores in national
elementary and secondary assessment tests remained below the passing rate of 70 percent despite
improvements during the late 1990s.12
The mean elementary achievement score improved from
11
We urge caution when comparing completion rates across countries, because different countries use different
methods for computing this indicator. Moreover, many countries lack the time series data needed for computing
completion data and rely on undocumented estimation procedures. For example, the Philippines completion rate
(2007) reported in the World Bank 2009 World Development Indicators is 94 percent, which is as much as 20
percentage points higher than what we have computed for this report. 12
The National Elementary Achievement Test (NEAT) was given to all Grade 6 students from SY 19931994 to SY
200102. The National Secondary Achievement Test (NSAT) has been administered to all fourth-year high school
students since SY 1994.
0
20
40
60
80
100
120
Geo
rgia
Tajik
ista
n
Ho
nd
ura
s
Mal
aysi
a (i
)
Ind
on
esi
a (i
i)
Gu
ate
mal
a
Thai
lan
d (
c)
Bo
livia
(ii)
Nic
arag
ua
Ind
ia (
ii)
Mo
ngo
lia
Mo
rocc
o
Cam
bo
dia
Kyr
gyz
Rep
ub
lic
Mo
ldo
va
Lao
PD
R
Tim
or-
Lest
e
Pak
ista
n
Ph
ilip
pin
es (
b)
NER Completion Rate

9
40.1 percent in 1990 to 51.4 percent in 2000. At the secondary level, the mean achievement score
rose from 35.6 percent in 1990 to 51.9 percent in 2000. Despite these improvements, the
Philippines ranked very low in both mathematics and science in the Trends in International
Mathematics and Science Study (TIMSS) in 1999.
22. DepED’s National Education Testing and Research Center (NETRC) has administered a
National Achievement Test (NAT) to Grade 6 pupils every year since 2005 (In 2003 and 2004,
the NAT was administered to Grades 4 and 5 pupils, respectively.). At the secondary level, a
NAT was administered in 2003 to students in Years 1 and 4, in 2004 to students in Years 2 and
4, in 2005 to students in Years 3 and 4, and beginning in 2006, administered every year to Year 2
students. These changes to the testing at the secondary level make comparisons over time
difficult. In addition, there are methodological concerns with NETRC's design and analysis of
the NAT tests that limit the usefulness of NAT scores as outcome measures.
23. Figure 4 shows that NAT scores fell for all subjects from SY 20042005 to SY
20052006 at the elementary level. However, the test scores have improved from a mean of 55
percent in SY 20052006 to 65 percent in SY 20072008. With mean achievement test scores
lower than 60 percent, science remains a significant area of concern at the elementary level. The
mean achievement level remains mediocre for mathematics, science, and English, but in Hekasi
and Filipino recent improvements have brought means close to 70 percent. These results are
consistent with the Philippines’ performance in the 2003 TIMSS when it ranked 41st of 46
countries.
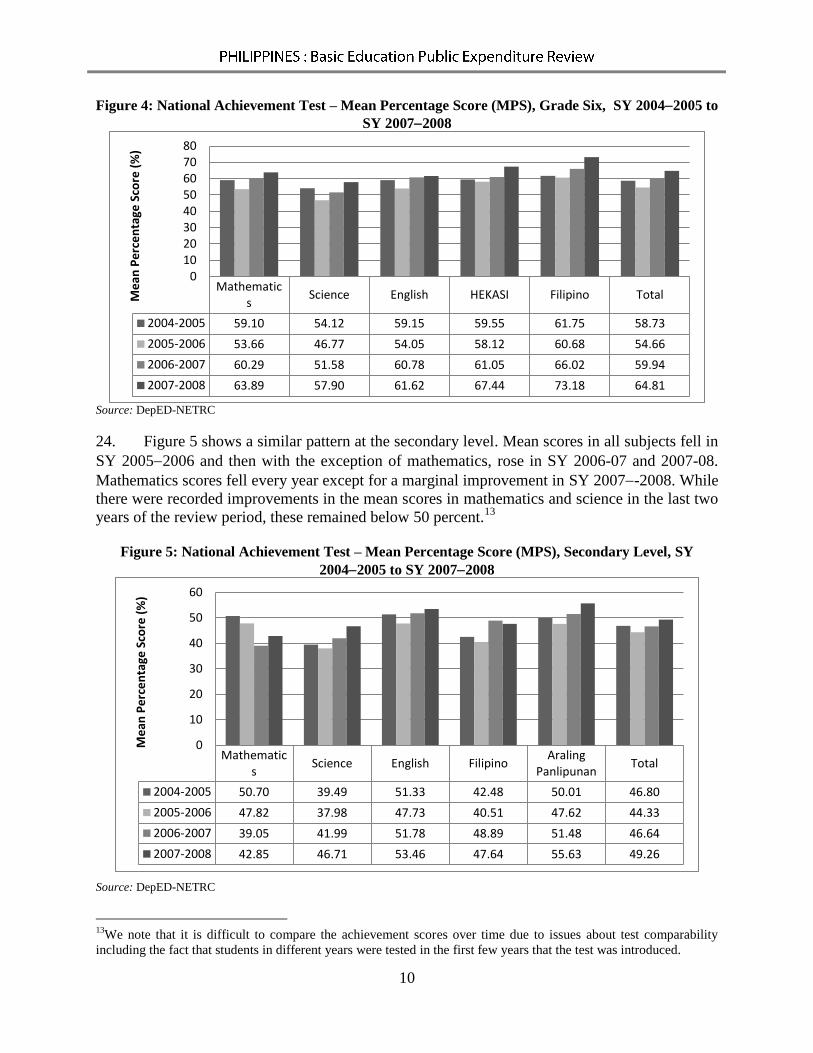
10
Figure 4: National Achievement Test – Mean Percentage Score (MPS), Grade Six, SY 20042005 to
SY 20072008
Source: DepED-NETRC
24. Figure 5 shows a similar pattern at the secondary level. Mean scores in all subjects fell in
SY 20052006 and then with the exception of mathematics, rose in SY 2006-07 and 2007-08.
Mathematics scores fell every year except for a marginal improvement in SY 2007-2008. While
there were recorded improvements in the mean scores in mathematics and science in the last two
years of the review period, these remained below 50 percent.13
Figure 5: National Achievement Test – Mean Percentage Score (MPS), Secondary Level, SY
20042005 to SY 20072008
Source: DepED-NETRC
13
We note that it is difficult to compare the achievement scores over time due to issues about test comparability
including the fact that students in different years were tested in the first few years that the test was introduced.
Mathematics
Science English HEKASI Filipino Total
2004-2005 59.10 54.12 59.15 59.55 61.75 58.73
2005-2006 53.66 46.77 54.05 58.12 60.68 54.66
2006-2007 60.29 51.58 60.78 61.05 66.02 59.94
2007-2008 63.89 57.90 61.62 67.44 73.18 64.81
01020304050607080
Me
an P
erc
en
tage
Sco
re (
%)
Mathematics
Science English FilipinoAraling
PanlipunanTotal
2004-2005 50.70 39.49 51.33 42.48 50.01 46.80
2005-2006 47.82 37.98 47.73 40.51 47.62 44.33
2006-2007 39.05 41.99 51.78 48.89 51.48 46.64
2007-2008 42.85 46.71 53.46 47.64 55.63 49.26
0
10
20
30
40
50
60
Me
an P
erc
en
tage
Sco
re (
%)

11
Conclusion
25. The analysis in this chapter establishes that the recent performance of the basic education
sector in the Philippines has been poor. Measures of access to schooling, and key indicators such
as enrollment rates, which had improved during the 1990s, have fallen since 2000. Although
measures of the public education system’s internal efficiency, cohort survival, and completion
rates have improved marginally at the elementary level since 2006, they remain low. These
measures initially fell initially at the secondary level, but have recovered to 1990 levels since
2006. As measures of the quality of the education system, learning achievement levels have
fluctuated but overall improved marginally since NAT was introduced in 2004 (except in
Mathematics at the secondary level). However, mean learning achievement scores remain
mediocre and making comparisons over years is difficult.
26. In short, the overall performance of the Philippines’ basic education sector has
deteriorated compared to its past position relative to other countries in the region. There are some
signs that the declining trends of some key indicators have been reversed since the middle of the
2000s. However, the pace of the turnaround is not sufficient for the Philippines to meet either the
EFA or the MDG targets of universal enrollment, let alone more ambitious goals of improving
the quality of education to a level comparable to that of more successful economies in the region.
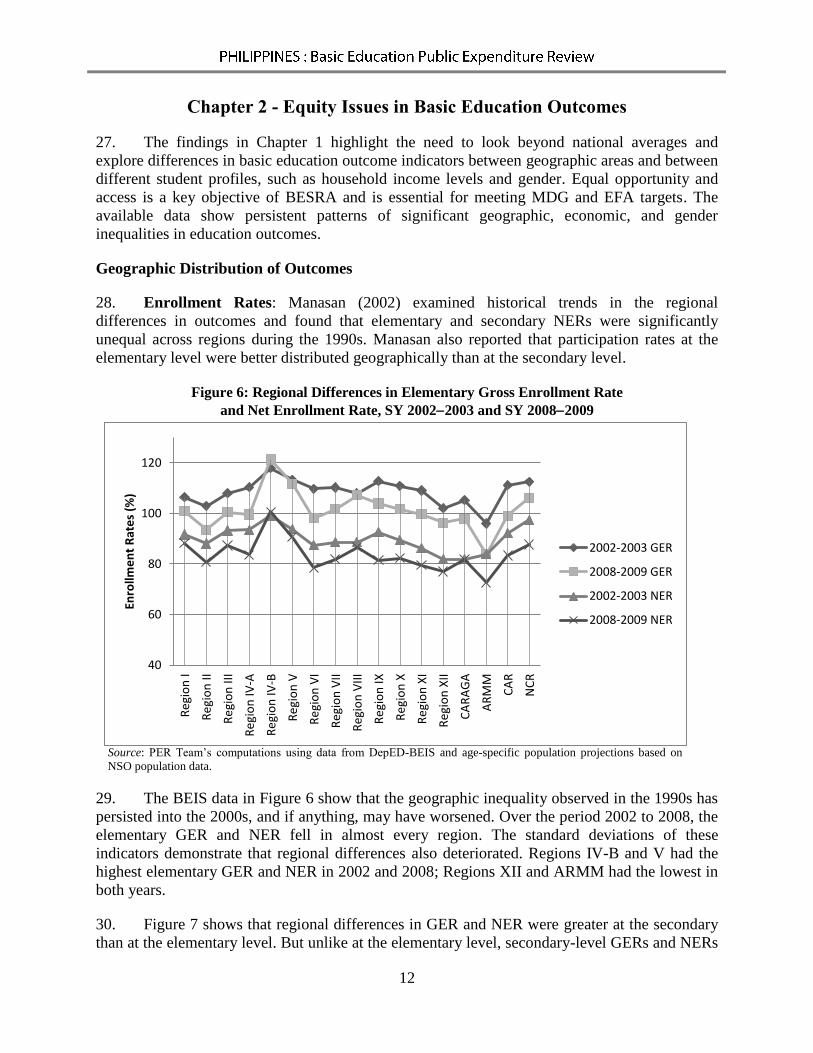
12
Chapter 2 - Equity Issues in Basic Education Outcomes
27. The findings in Chapter 1 highlight the need to look beyond national averages and
explore differences in basic education outcome indicators between geographic areas and between
different student profiles, such as household income levels and gender. Equal opportunity and
access is a key objective of BESRA and is essential for meeting MDG and EFA targets. The
available data show persistent patterns of significant geographic, economic, and gender
inequalities in education outcomes.
Geographic Distribution of Outcomes
28. Enrollment Rates: Manasan (2002) examined historical trends in the regional
differences in outcomes and found that elementary and secondary NERs were significantly
unequal across regions during the 1990s. Manasan also reported that participation rates at the
elementary level were better distributed geographically than at the secondary level.
Figure 6: Regional Differences in Elementary Gross Enrollment Rate
and Net Enrollment Rate, SY 20022003 and SY 20082009
Source: PER Team’s computations using data from DepED-BEIS and age-specific population projections based on
NSO population data.
29. The BEIS data in Figure 6 show that the geographic inequality observed in the 1990s has
persisted into the 2000s, and if anything, may have worsened. Over the period 2002 to 2008, the
elementary GER and NER fell in almost every region. The standard deviations of these
indicators demonstrate that regional differences also deteriorated. Regions IV-B and V had the
highest elementary GER and NER in 2002 and 2008; Regions XII and ARMM had the lowest in
both years.
30. Figure 7 shows that regional differences in GER and NER were greater at the secondary
than at the elementary level. But unlike at the elementary level, secondary-level GERs and NERs
40
60
80
100
120
Re
gio
n I
Re
gio
n II
Re
gio
n II
I
Re
gio
n IV
-A
Re
gio
n IV
-B
Re
gio
n V
Re
gio
n V
I
Re
gio
n V
II
Re
gio
n V
III
Re
gio
n IX
Re
gio
n X
Re
gio
n X
I
Re
gio
n X
II
CA
RA
GA
AR
MM
CA
R
NC
R
Enro
llme
nt
Rat
es
(%)
2002-2003 GER
2008-2009 GER
2002-2003 NER
2008-2009 NER

13
were marginally more equal across regions in 2008 than in 2002. Compared to their elementary
counterparts during the 20022008 period, secondary GERs and NERs showed a more varied
picture. GER and NER fell in some regions (as did the national mean), but rose in others. NCR
and Region I had the highest GER and NER in both 2002 and 2008.
Figure 7: Regional Differences in Secondary Gross Enrollment Rate
and Net Enrollment Rate, SY 20022003 and SY 20082009
Source: PER Team’s computations using data from DepED-BEIS and age-specific population projections based on NSO
population data.
31. In general, regions that have high elementary-level participation rates also have high
secondary-level participation rates. Regions with high GERs also had high NERs, and vice versa.
However, GERs tended to be less equal across regions than were NERs. This observation
indicates that the proportion of over-age (and possibly under-age) children is unequal across
regions.
32. Cohort Survival and Completion Rates: During the 1990s, elementary-level CSR
improved for all regions except NCR and Caraga (Manasan 2002).This trend continued until
regional disparities in the elementary CSR and completion rates narrowed between 2002 and
2008. The national average also improved during this period.
0
20
40
60
80
100
120
Re
gio
n I
Re
gio
n II
Re
gio
n II
I
Re
gio
n IV
-A
Re
gio
n IV
-B
Re
gio
n V
Re
gio
n V
I
Re
gio
n V
II
Re
gio
n V
III
Re
gio
n IX
Re
gio
n X
Re
gio
n X
I
Re
gio
n X
II
CA
RA
GA
AR
MM
CA
R
NC
R
Enro
llme
nt
Rat
es
(%)
2002-2003 GER
2008-2009 GER
2002-2003 NER
2008-2009 NER

14
Figure 8: Elementary Completion Rate, by Region, SY 20032004 and SY 20072008
Source: PER Team’s computations using data from DepED-BEIS and age-specific population projections based on
NSO population data
33. The secondary-level CSR deteriorated in all regions during the 1990s except for those in
Mindanao, which registered slight improvements (Manasan 2002).14
The picture has been mixed
since 2000. Some regions have shown slight improvement, but others have shown slight
deterioration. The inequality in the completion rate at the secondary level widened across
regions while the national average stagnated.15
Figure 9: Secondary Completion Rate, by Region, SY 20032004 and SY 20072008
Note: ARMM data for SY 20032004 had some inconsistencies. Hence, ARMM’s completion rate for the said school year is
treated as missing data.
Source: PER Team’s computations using data from DepED-BEIS and age-specific population projections based on NSO
population data.
14
The reason for the difference in the Mindanao regions is unclear. 15
The standard deviations of regional completion rates came from DepED’s computations, which were based on the
BEIS. For unknown reasons these appear to be slightly different from the completion rates computed by the PER
team.
0102030405060708090
Re
gio
n I
Re
gio
n II
Re
gio
n II
I
Re
gio
n IV
-A
Re
gio
n IV
-B
Re
gio
n V
Re
gio
n V
I
Re
gio
n V
II
Re
gio
n V
III
Re
gio
n IX
Re
gio
n X
Re
gio
n X
I
Re
gio
n X
II
CA
RA
GA
AR
MM
CA
R
NC
R
Ph
ilip
pin
es
Co
mp
leti
on
Rat
e (
%)
2003-2004
2007-2008
0
10
20
30
40
50
60
70
80
90
Re
gio
n I
Re
gio
n II
Re
gio
n II
I
Re
gio
n IV
-A
Re
gio
n IV
-B
Re
gio
n V
Re
gio
n V
I
Re
gio
n V
II
Re
gio
n V
III
Re
gio
n IX
Re
gio
n X
Re
gio
n X
I
Re
gio
n X
II
CA
RA
GA
AR
MM
CA
R
NC
R
Ph
ilip
pin
es
Co
mp
leti
on
Rat
e (
%)
2003-2004
2007-2008

15
34. Learning Achievement: Regional differences in learning achievement determined by the
National Elementary Achievement Test (NEAT) show that in the late 1990s, most regions
registered a decline and a few showed marginal improvements. At the secondary level, in the late
1990s the National Secondary Achievement Test (NSAT) scores showed more marked
improvements for all regions except ARMM (Manasan 2002).
35. The NEAT and NSAT were replaced by the National Achievement Test (NAT) in 2002.
Table 3 shows that mean elementary-level NAT scores improved in all regions and that
secondary-level NAT scores improved in most regions. National mean NAT scores improved
from SY 200506 to SY 200708, but regional inequalities worsened marginally.Although the
standard deviations are lower than for other outcome indicators, when the team computed
“effect” sizes, we found that there were substantial regional variations in NAT scores. Since the
population of test-takers is very large, even small standard deviations may be significant. Effect
sizes compare each region with the national mean and standard deviation. Medium to large effect
sizes indicate that a region has a substantially different NAT score from the national mean. Table
3 illustrates these differences.16
Table 3: National Achievement Test – Mean Percentage Score (MPS), by Region
REGION
20052006 20072008 20052008 20052006 20072008 20072008
Elementary Secondary
MPS MPS Effect Size MPS MPS Effect Size
Region I – Ilocos 56.75 68.83 Medium 52.27 56.76 Large
Region II – Cagayan
Valley 53.16 58.72 Large 47.99 44.37 Medium
Region III – Central
Luzon 53.28 67.75 Medium 47.61 52.18 Medium
Region IVA –
Calabarzon 56.99 68.40 Medium 45.06 47.74 Medium
Region IVB –
Mimaropa 62.37 70.24 Medium 49.84 50.37 Small
Region V – Bicol 50.44 57.24 Large 41.32 40.21 Large
Region VI – Western
Visayas 49.33 60.35 Medium 44.78 45.21 Medium
Region VII – Central
Visayas 55.54 65.66 Small 50.84 52.62 Medium
Region VIII – Eastern
Visayas 67.66 74.69 Large 65.33 65.53 Large
Region IX –
Zamboanga Peninsula 57.08 67.56 Medium 49.51 55.64 Large
Region X – Northern
Mindanao 54.02 62.95 Medium 45.50 47.50 Medium
Region XI – Davao 52.66 61.27 Medium 42.75 44.30 Medium
Region XII – 49.72 63.94 Small 42.03 46.73 Medium
16
We compute national mean and SD, excluding data for Region I, and label them A and B. We compute the mean
for Region Iand label it C. Effect Size = (A – C)/B. If the absolute effect size lies between zero and 0.2 then we
categorize it as a small effect, between 0.2 and 0.8 as a moderate effect, and greater than 0.8 a large effect.

16
REGION
20052006 20072008 20052008 20052006 20072008 20072008
Elementary Secondary
MPS MPS Effect Size MPS MPS Effect Size
Soccsksargen/ Central
Mindanao
National Capital Region
(NCR) 47.02 62.30 Medium 40.48 43.92 Medium
Cordillera
Administrative Region
(CAR)
56.09 60.93 Medium 44.86 49.15 Small
Autonomous Region in
Muslim Mindanao
(ARMM)
45.27 47.04 Large 44.67 46.48 Medium
Caraga Region 70.83 75.55 Large 61.00 62.87 Large
Standard Deviation 6.751658 6.8578549 6.6709749 6.8512624
36. The available basic education outcome indicators suggest substantial differences between
regions and hence, geographic disparity in performance. Further, although the available data are
disaggregated only to the regional level, there may be substantial intraregional variations in all
outcome indicators. Further analysis with data at the level of municipalities or school divisions is
needed to explore these intraregional disparities.
37. Differences in Basic Education Outcomes Across Income Quintiles. The term "education
equity” traditionally defines the inequality of benefits experienced by the various income groups.
Here, we explore the differences in education outcome indicators across income groups. To do
so, we analyzed the latest available APIS 2004 household data. The definitions of the terms and
methods appear in Annex 1 on Data and Methods.
Figure 10: Net Enrollment Rate, by Income Quintile, 2004
Source: Basic data from APIS 2004
38. The data show that not only does the first quintile have the worst outcomes, but also that
it has the largest gap between it and the next quintile. This observation holds for both indicators,
but it is most easily seen in the secondary NER (Figure 10). The implication is that if low
0
20
40
60
80
100
120
Quintile 1(Poorest)
Quintile 2 Quintile 3 Quintile 4 Quintile 5(Richest)
Enro
llme
nt
rate
s (%
)
Elementary NER Secondary NER
17
income is a reason for low enrollment, then a demand-side intervention such as the CCT program
can be an effective intervention to raise poor families' children’s enrollment rates.
Gender Equity
39. Another key dimension of inequality that often concerns both policy-makers and society
at large is gender. In many societies, there are uneven educational opportunities between
genders. Girls often suffer from more limited learning opportunities, thus limiting both their
future earning potential and their ability to participate fully in social and economic activities.
40. In the Philippines, gender disparity in elementary participation rates is marginal at the
elementary level, but significant at the secondary level. (See Figure11) However, unlike most
developing countries, in the Philippines it is boys, not girls, who are disadvantaged in basic
education. This pattern is consistent with past studies, although their implication have been
ignored by policy-makers. For example, Estudillo et al. (2001) offer a possible reason for this
gender difference in educational investments. These researchers found that parents in rural areas
transfer land holdings to sons but invest in the education of daughters. They do so because they
perceive a comparative advantage to having sons in farm activities and daughters in nonfarm
activities. Their intention is to effect intergenerational transfers such that the overall lifetime
wealth of the children will be equal. However, Alba (2001) suggests that women invest in
education to compensate for the predominance of women in low-wage professions and
industries, and to address the wage differential between men and women. A 2007 UNICEF study
found that half of the boys who dropped out of school at older ages did so to work. Most of the
remaining male dropouts left due to other financial reasons, such as the inability to pay for
various school requirements and contributions (Abuso et al. 2007). Abuso's study investigated
the reasons for high dropout rates in basic education in the Philippines and found that one of the
main reasons for dropping out was poverty.
41. Gender Disparity in Enrollment Rates: At the elementary level, net enrollment rates
continue to be slightly higher for girls compared to that of boys. This finding confirms the results
in past studies. The gender gap widens at the secondary level. Girls’ NERs are about 10
percentage points higher than those of boys.17
17
We obtained the same results from APIS (2004) data. Girls tend to have better school participation rates than boys,
and the gender differences are statistically significant.

18
Figure 11: Net Enrollment Rate, by Gender, SY 20022003 to SY 20082009
Source:PER Team’s computations using data from DepED-BEIS and age-specific population projections based on NSO
population data.
42. Completion Rates by Gender: At both the elementary and secondary levels girls have
higher completion rates than do boys. These rates reflect higher dropout and repetition rates
among boys. Figure 12 demonstrates that over the period 2002 to 2008, on average, girls’
elementary and secondary completion rates are at least 10 percentage points higher than boys’.
Figure 12: Completion Rate, by Gender, SY 20032004 to SY 20072008
Source: PER Team’s computations using data from DepED-BEIS and age-specific population projections based on
NSO population data.
2003-2004 2004-2005 2005-2006 2006-2007 2007-2008
Elementary CR Male 63.05 61.09 61.37 63.91 66.60
Elementary CR Female 73.98 73.44 72.32 75.11 76.78
Secondary CR Male 65.36 64.14 51.53 63.24 65.33
Secondary CR Female 77.33 75.17 66.06 74.16 76.02
0
10
20
30
40
50
60
70
80
90
Co
mp
leti
on
Rat
e (
%)
2002-2003
2003-2004
2004-2005
2005-2006
2006-2007
2007-2008
2008-2009
Elementary NER Male 89.90 88.39 86.42 83.88 83.02 82.76 83.19
Elementary NER Female 91.51 90.25 88.34 85.81 84.75 84.47 84.32
Secondary NER Male 54.88 56.04 54.94 53.74 53.68 54.02 55.11
Secondary NER Female 64.20 65.76 64.87 63.46 63.20 63.03 63.76
0
20
40
60
80
100N
et
en
rollm
en
t ra
te (
%)

19
Conclusion
43. The government has sought to reduce education inequality and has developed a variety of
policies and programs to achieve this objective. Despite these efforts, inequality in basic
education continues to be a key issue. As indicated by our analysis, inequality in basic education
in its various dimensions remains substantial. We measure geographic inequality in education
outcomes at the regional level and must work with the absence of more disaggregated, and hence
more meaningful, data. The analysis shows that inequalities have persisted since the 1990s and
worsened for some of the indicators.
44. Education inequality among households by income groups remains substantial, as shown
by the differences in outcome indicators, such as enrollment rates. The above finding on the
relationship between income and educational outcomes points to the importance of cross-sectoral
collaboration. For example, the CCT program of the government can have considerable effects
on enrollment, dropout, and completion rates provided that households’ increased interest in
enrolling their children in school is met with an adequate number of classrooms and qualified
teachers. This is a highly promising program that deserves strong support by DepED and other
stakeholders. There are several ways that the government could enhance the effectiveness of the
CCT program. For example, in line with the government’s policy of convergence, DepED should
give top priority to these poor areas and households in terms of teacher allocation,
Box 2: Using Conditional Cash Transfers to Reduce Gender and Income Class Inequities
in Education: Lessons from Mexico
Conditional cash transfers (CCTs) are increasingly used by developing countries to reduce
income inequalities in health and education opportunities (in addition to being a tool to alleviate
poverty). For the education sector, these have been a successful tool used by several countries
to increase enrolment and attendance among children from the poorest households. A recent
World Bank report summarizing several dozen impact evaluations of CCT programs in various
countries concluded that “every program that has had a credible evaluation has found a positive
effect on school enrolment, although those effects are sometimes found among some age
groups and not others”(Fizbein et al. 2009: 129). The paper also reports how some countries
including Bangladesh and India have successfully used stipend/scholarships in a manner similar
to CCTs to target improving particular groups’ education outcomes.
One of the best-known examples is the successful CCT program in Mexico. This program,
initially entitled PROGRESA, and then more recently called “Oportunidades,” has alleviated
poverty and improved health and education outcomes of the poorest households in Mexico. In
particular, it has been successful in substantially reducing the dropout of older girls from fifth
to sixth grades. Evaluations of the PROGRESA found that the program was successful in
significantly increasing school enrolment amongst the poorest targeted households for boys and
girls at the primary and secondary level (Schultz 2000). It significantly reduced economic and
gender inequalities in school enrolments for the PROGRESA localities, leading to more boys
from working class background, as well as poor older girls, attending schools.

20
school/classroom construction, and provision of learning materials to meet increased demand for
basic education arising from the program.
45. Contrary to the common pattern of gender inequality in other countries, in the
Philippines, it is boys who are actually lagging behind girls in a range of education indicators. In
some of the other countries in which girls’ education lags behind that of boys, those countries'
CCT programs give an extra grant for girls in addition to standard cash grant to families to
encourage parents to send their girl children to school. The CCT program in the Philippines
could adopt a reverse policy. By improving the quality of schooling, CCT could also increase
returns to secondary education by inducing households to enable boys to complete high school.

21
Chapter 3 - Recent Trends in Government Spending on Basic Education
46. In this chapter the Review examines total government spending on basic education after
2001. It builds on earlier analyses to explore whether the declining trend in public financing of
the sector continued since the Asian financial crisis of 1997 and, if so, how this is related to
required inputs and the declining outcome trends discussed in Chapter 1. It also investigates the
extent to which policy and reform measures have impacted public spending on basic education in
recent years.
47. One of BESRA’s main policy actions is to “. . .increase annual budget outlays to meet
enrollment and cost increases, eliminate resource gaps and attain target goals” (DepED 2006).
DepED adopted a Multi-Year Spending Plan in 2005 to provide a basis for making national
government spending decisions for the sector (DepED, World Bank, and PIDS 2005). The plan
provided financial projections, using alternative scenarios to project cost enrollment increases
due to population growth and to cover costs to meet input deficiencies in the EFA targets.
Overall Trends in Government Spending on Basic Education
Figure 13: Government Expenditure on Education as a Percentage of GDP, 20022008
48. There are many causes for the deteriorating performance of the Philippine basic
education system, including some demand-side factors that are not yet fully understood.
However, there is compelling evidence that the deterioration in outcome indicators has coincided
with the weakening of government support at the level of public spending on the education
sector. Government spending on this sector increased from the late 1980s and stood at 4.2
percent of GDP in 1998. However, the decrease in the government’s fiscal efforts in the wake of
the 1997 Asian financial crisis translated into a corresponding shrinkage in public spending on
education. Spending declined to 2.6 percent of GDP in 2008, despite the recovery in economic
3.39 3.24
2.86 2.68 2.65 2.7 2.63
2.91 2.76
2.42 2.29 2.26 2.32 2.27
1.00
1.50
2.00
2.50
3.00
3.50
4.00
2002 2003 2004 2005 2006 2007 2008
Pe
rce
nta
ge
Total Education Basic Education

22
growth, which recorded an annual average rate of 5.3 percent in constant 2002 prices. Figure 13
illustrates this growth.18
49. Figure 14 shows that total government spending on education is lower in the Philippines
than in countries with similar income levels, including several poorer countries.19
Further, a
regression analysis using panel data for 19982005 for these countries revealed that government
spending on education as a share of GDP in the Philippines is less than half the predicted value
of 5.7 percent for its level of per capita income. This result is consistent with an earlier study by
Manasan (2002), who found that even as early as 1999, when the government was spending
relatively more on both education as a share of GDP and also on a per-pupil basis, spending on
education as a share of GDP was lower in the Philippines compared with most neighboring
Asian countries, including Malaysia and Thailand.
Figure 14: Share of GDP Spent on Education in Selected Countries
Note: Latest year figure for Mongolia is 2007 and 2005 for the Philippines.
Source: World Bank, World Development Indicators; and PER Team’s estimates for Philippines predicted GDP share
50. The decreasing proportion of GDP spent on the sector is an important indicator of lower
government commitment to funding the sector. However, it is more revealing to examine the
trend in the actual amount of public spending on basic education in total and per pupil. Table 4
18Although the national government accounts for over 90 percent of government spending on the sector, LGUs also
spend on education. Thus, total government spending is the sum of national and local government spending. DepED
spending dominates the NG spending on basic education, but a share of the spending on school building
construction is financed by the School Building Program. This program is administered by the Department of Public
Works and Highways (DPWH). 19
The PER team chose 32 countries for this comparison. The team based its choices on countries' per-capita income
being similar in purchasing power parity (PPP) to that of the Philippines. Unfortunately, comparative figures for
basic education were not available, so the team used total education expenditures (including tertiary level).
0123456789
Bo
livia
Ge
org
ia
Gu
atem
ala
Ind
ia
Ind
on
esia
Kyr
gyz
Rep
ub
lic
Lao
PD
R
Mal
aysi
a
Mo
ldo
va
Mo
ngo
lia
Mo
rocc
o
Nic
arag
ua
Pak
ista
n
Par
agu
ay
Tajik
ista
n
Thai
lan
d
Ph
ilip
pin
es
Ph
ilip
pin
es
pre
dic
ted
GD
Psh
are
(bas
ed
on
pe
r ca
pit
ain
com
e)
1998 2002 2006

23
shows that between 2002 and 2008, total government spending, both national and local,
increased at an annual average rate of 7.1 percent in nominal terms, but only 1.8 percent in real
terms.20
When the team compared this with the 5.3 percent growth in real GDP during this
period, it was evident that the growth dividend did not benefit the basic education sector. Real
total government spending actually decreased between 2002 and 2005. An upward trend began
only in 2006.21
Table 4: Total Government Spending on Basic Education, 20022008
2002 2003 2004 2005 2006 2007 2008
In current prices (PhP millions)
A.
National
Government
Spending on Basic
Education
106,051 108,363 107,352 112,744 123,066 141,017 157,168
B. LGU Spending on
Basic Education* 9,196 10,708 10,623 11,744 13,225 14,508 15,915
C. Total Government
Spending on Basic
Education 115,247 119,071 117,975 124,488 136,291 155,525 173,083
In 2002 prices (PhP millions)
A.
National
Government
Spending on Basic
Education
106,051 105,622 98,720 97,403 101,021 111,882 115,597
B. LGU Spending on
Basic Education* 9,196 10,437 9,769 10,146 10,856 11,510 11,705
C. Total Government
Spending on Basic
Education 115,247 116,059 108,489 107,549 111,877 123,393 127,302
* Local government figures for 2007 and 2008 are projected based on 2002-2006 trends.
51. An approximate measure of the adequacy of government spending for providing
necessary inputs for each enrolled student is public spending per pupil, adjusted for inflation.
Table 5 reports a sharp decline from real spending per pupil of PhP 7,112 in 2002 to PhP 6,619
in 2005. This decline reflects the pattern of total government spending on basic education. Real
perpupil spending began an upward trend, similar to total real spending in 2006.This increase
continued from 2006 until 2008, when real per pupil government spending reached PhP 7,435.
20
It is important to control for inflation by using constant prices to make figures comparable across years. (See
Annex 1 on Data and Methods for details.) 21
See Box 3 for a discussion on the use of alternative deflators to represent spending data in constant prices.

24
This level also coincided with marginal improvements — or at least an arresting of the
deterioration — in some key outcome indicators
52. Nevertheless, despite the increases since 2006, real per-pupil spending was still
substantially lower in 2008 than the PhP8,082 recorded in 1998, prior to the fiscal crisis.22
Not
only has the spending on the sector not kept pace with the rapid growth in the school-age
population, per-pupil spending has fallen despite declining enrollment rates.
Table 5: Total Government Spending per Pupil on Basic Education, 20022008
2002 2003 2004 2005 2006 2007 2008
In current prices (PhP)
A. National Government
Spending on Basic
Education 6,544 6,598 6,618 6,938 7,499 8,461 9,180
B. LGU Spending on
Basic Education* 568 652 655 723 806 870 930
C. Total Government
Spending on Basic
Education 7,112 7,251 7,273 7,661 8,305 9,331 10,109
In 2002 prices (PhP)
A. National Government
Spending on Basic
Education 6,544 6,432 6,086 5,994 6,156 6,713 6,752
B. LGU Spending on
Basic Education* 568 636 602 624 662 691 684
C. Total Government
Spending on Basic
Education 7,112 7,067 6,688 6,619 6,818 7,403 7,435
* Local government figures for 2007-2008 are projected
22
The team computed this per-pupil spending by using enrollment data from NSO, since the BEIS dataset was not
yet in place in 1998. This figure is in 2002 constant prices for comparability.

25
Box 3: Total Government Spending per Pupil on Basic Education: 2002 to 2008
The graph below compares the trends in per pupil spending by national and local governments on
basic education over the period 2002 to 2008 in nominal terms (current prices) with the trends in
real terms (constant 2002 prices). The standard deflator used by the Philippine Government (the
Implicit Price Index or IPIN), which is the same as the most often internationally used GDP
deflator, was used to compute spending in real terms in the report.
Nominal vs. Real per Pupil Total Basic Education Expenditure, 2002 to 2008
A simple alternative deflator was also constructed, and is reported here, in an attempt to better
reflect price changes in the education sector. Since about 85% of the spending in the basic
education sector is on salaries, the “education deflator” was constructed taking 85% of a
“compensation index” (available from the NSCB website) and 15% of the IPIN. Unfortunately, a
wages index which would reflect changes in salaries in the basic education sector is not available.
The compensation index reflects wage changes for other sectors such as construction and private
services, but it is the only available wage index in the Philippines. As the graph illustrates, trends
in real per pupil spending are very similar regardless of which deflator is used. In fact, with the
“wage deflator,” per pupil spending is somewhat lower every year. The only difference in the
spending trend is that the upturn in per pupil spending begins a year earlier in 2005 when the
education deflator is used compared with when the IPIN is used.
(The NSCB website (http://www.nscb.gov.ph/econindex/) reports the quarterly indices on
compensation which may be used as "deflators to express a current value in real terms, as bases
for wage formulation, and for forecasting or projections.)

26
Government Spending Compared to Overall Financial Requirements for Basic Education
53. Although these trends in government spending indicate the inadequacy of the
government’s effort in the sector, the spending trend alone does not show the impact of public
spending on the basic education sector. The government’s declining financial spending in the
circumstances of these falling outcomes is particularly problematic.
54. Spending enough to fund growing enrollments, address input requirements, and finance
key programs is a necessary, though not sufficient, condition to improve education outcomes.
How much should the government have spent in the last few years to put the Philippines on track
to reach the MDG and EFA goals? How much would have been “enough”? To answer these
questions, we compare actual government spending on basic education with the financial
projections outlined in the 2005 DepED Multi-Year Spending Plan.
55. The Multi-year Spending Plan modeled alternative financial projections for a 10-year
period, using different assumptions for each set of projections. All figures were reported in 2005
prices. Figure 15 reports the actual increases in NG spending on the sector (DepED plus the
School Building Program23
) and compares these with the projected increases in the 2005
Spending Plan. Recent increases in NG spending on basic education in 2007 and 2008 were large
enough to finance growing enrollments based on Scenario 1; that is, enrollment growth driven
purely by population and income growth. While still falling short of the projections in Scenario 2
for providing minimum service standards by meeting input requirements, the shortfall is a
moderate 7 percent. However, these scenarios assume constant enrollment rates. Hence,
spending trends consistent with these projections would only allow the Philippines to meet the
current enrollment rate rather than achieve universal enrollment. More relevant scenarios would
meet the EFA targets. However, even these goals are underfunded because the recent NG
spending increases have been 37 percent lower than would be required to put the country on
track to reach the EFA targets. These facts are reflected in Scenario 3. In addition, since the
government did not spend at the level of the EFA Scenario 3 in 2006-2008, even if the
government were to catch up with this scenario now, the resource gap would now be even larger.
23
The School Building Program is appropriated outside DepED’s budget and executed by the DPWH.
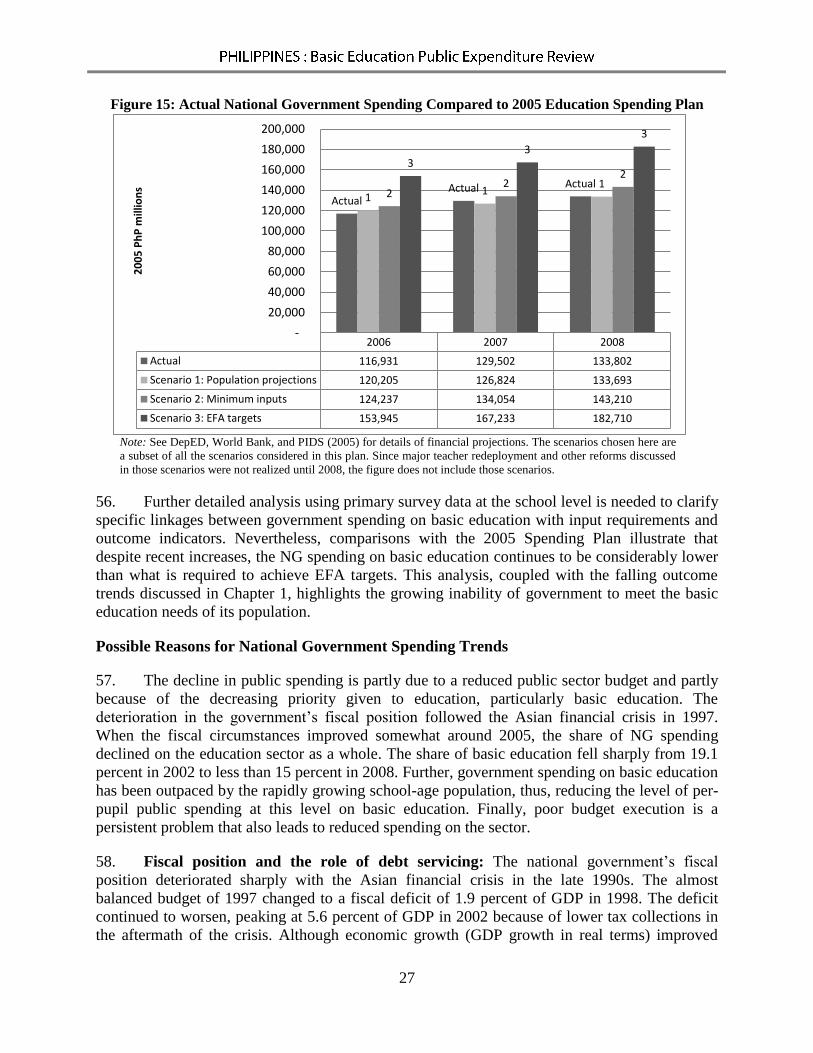
27
Figure 15: Actual National Government Spending Compared to 2005 Education Spending Plan
Note: See DepED, World Bank, and PIDS (2005) for details of financial projections. The scenarios chosen here are
a subset of all the scenarios considered in this plan. Since major teacher redeployment and other reforms discussed
in those scenarios were not realized until 2008, the figure does not include those scenarios.
56. Further detailed analysis using primary survey data at the school level is needed to clarify
specific linkages between government spending on basic education with input requirements and
outcome indicators. Nevertheless, comparisons with the 2005 Spending Plan illustrate that
despite recent increases, the NG spending on basic education continues to be considerably lower
than what is required to achieve EFA targets. This analysis, coupled with the falling outcome
trends discussed in Chapter 1, highlights the growing inability of government to meet the basic
education needs of its population.
Possible Reasons for National Government Spending Trends
57. The decline in public spending is partly due to a reduced public sector budget and partly
because of the decreasing priority given to education, particularly basic education. The
deterioration in the government’s fiscal position followed the Asian financial crisis in 1997.
When the fiscal circumstances improved somewhat around 2005, the share of NG spending
declined on the education sector as a whole. The share of basic education fell sharply from 19.1
percent in 2002 to less than 15 percent in 2008. Further, government spending on basic education
has been outpaced by the rapidly growing school-age population, thus, reducing the level of per-
pupil public spending at this level on basic education. Finally, poor budget execution is a
persistent problem that also leads to reduced spending on the sector.
58. Fiscal position and the role of debt servicing: The national government’s fiscal
position deteriorated sharply with the Asian financial crisis in the late 1990s. The almost
balanced budget of 1997 changed to a fiscal deficit of 1.9 percent of GDP in 1998. The deficit
continued to worsen, peaking at 5.6 percent of GDP in 2002 because of lower tax collections in
the aftermath of the crisis. Although economic growth (GDP growth in real terms) improved
2006 2007 2008
Actual 116,931 129,502 133,802
Scenario 1: Population projections 120,205 126,824 133,693
Scenario 2: Minimum inputs 124,237 134,054 143,210
Scenario 3: EFA targets 153,945 167,233 182,710
Actual Actual Actual
1 1
1 2
2 2
3 3
3
-
20,000
40,000
60,000
80,000
100,000
120,000
140,000
160,000
180,000
200,0002
00
5 P
hP
mill
ion
s

28
after 2002, tax collections continued to fall from 17 percent of GDP in 1997 to 12.3 percent in
2004. The fiscal balance improved slightly after 2002, but only because the national government
reduced expenditures on all sectors, including education.
59. Another consequence of the financial crisis was the increase in debt servicing, which
accounted for an increasing share of NG spending from 18.6 percent in 2001 to 31.6 percent in
2005. Debt servicing requirements created a shrinking overall fiscal envelope available for all
sectors, net of debt servicing until around 2005.24
Decreasing priority given to the basic
education sector: After 2004, revenue improved due to a set of one-off tax reforms and the
corresponding growth in tax collection to 14.3 percent of GDP.25
At the same time, the share of
debt servicing was reduced to 21.3 percent of the total NG spending in 2008. Nevertheless, the
increased fiscal position did not translate into a larger allocation to the basic education sector.
Here, the share in the total primary spending actually decreased from the annual average of 18.1
percent in 20022005 to the annual average of 15.9 percent in 20062008. It is evident that the
government’s relative priorities shifted during the latter part of the 2000s in favor of
infrastructure, such as communications, roads, and other transportation, whose share in the total
primary spending increased from an average of 10.3 percent in 20022005 to 13.3 percent in
2006-2008 (Table 6).26
60. Furthermore, even when social services received a higher share of the national budget in
2008, the government gave greater priority to other subsectors, such as health, social security,
and welfare, rather than to basic education. However, the basic education sector continues to
receive the bulk of national government education expenditure. An average of 84 percent of all
education expenditure goes to basic education, although its share dropped to 71 percent in 2008.
Given the constitutional requirement to prioritize education in budget allocation, DepED still
receives the single largest appropriations of all the departments in the NG budget. Still, its status
as the highest budgetary priority has clearly eroded in recent years relative to other sectors.
Table 6: National Government Spending – Shares (%) of Selected Sectors Net of Debt Servicing,
20022008
SECTOR 2002 2003 2004 2005 2006 2007 2008
ECONOMIC SERVICES 27.33 28.64 28.02 26.91 30.20 33.39 31.64
Agriculture, Agrarian Reform, and
Natural Resources 6.29 6.69 5.78 7.28 6.49 7.87 5.63
Trade and Industry 0.73 0.46 0.58 0.52 0.55 0.68 0.51
Tourism 0.21 0.20 0.24 0.21 0.23 0.25 0.21
Power and Energy 0.27 0.19 0.30 0.27 0.36 0.66 0.52 Water Resource Development and
Flood Control 1.12 1.18 1.26 1.02 1.51 1.61 1.45
Communications, Roads, and Other 9.73 11.32 11.12 8.87 12.78 14.38 12.77
24
The only sector that showed a mild increase was General Administrative Services in 2004-2005. 25
The key measures included the introduction of an excise tax in 2005 and an increase in the VAT rate from 10
percent to 12 percent in 2006. The tax/GDP ratio again declined and stagnated at 14 percent in 2007 and 2008,
raising the fiscal deficit to 0.9 percent of GDP in 2008. 26
All figures are in terms of obligations. It is possible that sectoral shares based on appropriations or allotments are
different. Thus, the shares here are not only a reflection of priority accorded by the NG, but also of the differential
execution efficiency of the various sectors.
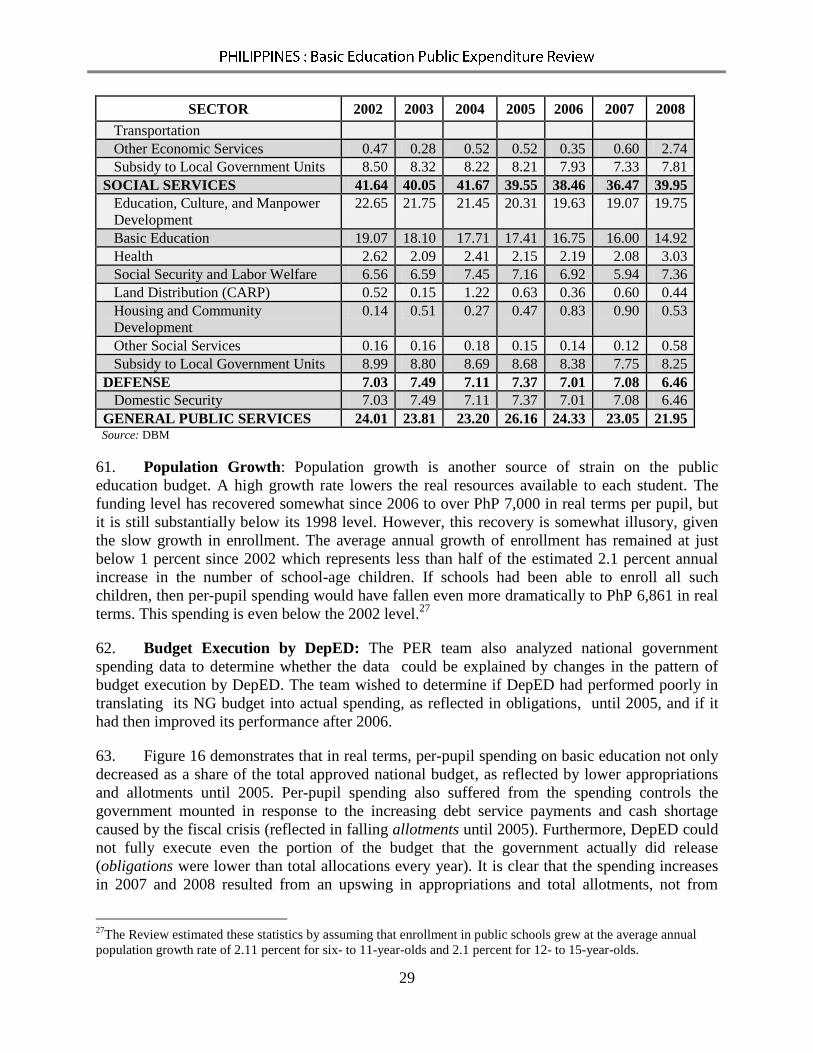
29
SECTOR 2002 2003 2004 2005 2006 2007 2008
Transportation
Other Economic Services 0.47 0.28 0.52 0.52 0.35 0.60 2.74 Subsidy to Local Government Units 8.50 8.32 8.22 8.21 7.93 7.33 7.81
SOCIAL SERVICES 41.64 40.05 41.67 39.55 38.46 36.47 39.95
Education, Culture, and Manpower
Development 22.65 21.75 21.45 20.31 19.63 19.07 19.75
Basic Education 19.07 18.10 17.71 17.41 16.75 16.00 14.92
Health 2.62 2.09 2.41 2.15 2.19 2.08 3.03 Social Security and Labor Welfare 6.56 6.59 7.45 7.16 6.92 5.94 7.36
Land Distribution (CARP) 0.52 0.15 1.22 0.63 0.36 0.60 0.44
Housing and Community
Development 0.14 0.51 0.27 0.47 0.83 0.90 0.53
Other Social Services 0.16 0.16 0.18 0.15 0.14 0.12 0.58
Subsidy to Local Government Units 8.99 8.80 8.69 8.68 8.38 7.75 8.25
DEFENSE 7.03 7.49 7.11 7.37 7.01 7.08 6.46 Domestic Security 7.03 7.49 7.11 7.37 7.01 7.08 6.46
GENERAL PUBLIC SERVICES 24.01 23.81 23.20 26.16 24.33 23.05 21.95 Source: DBM
61. Population Growth: Population growth is another source of strain on the public
education budget. A high growth rate lowers the real resources available to each student. The
funding level has recovered somewhat since 2006 to over PhP 7,000 in real terms per pupil, but
it is still substantially below its 1998 level. However, this recovery is somewhat illusory, given
the slow growth in enrollment. The average annual growth of enrollment has remained at just
below 1 percent since 2002 which represents less than half of the estimated 2.1 percent annual
increase in the number of school-age children. If schools had been able to enroll all such
children, then per-pupil spending would have fallen even more dramatically to PhP 6,861 in real
terms. This spending is even below the 2002 level.27
62. Budget Execution by DepED: The PER team also analyzed national government
spending data to determine whether the data could be explained by changes in the pattern of
budget execution by DepED. The team wished to determine if DepED had performed poorly in
translating its NG budget into actual spending, as reflected in obligations, until 2005, and if it
had then improved its performance after 2006.
63. Figure 16 demonstrates that in real terms, per-pupil spending on basic education not only
decreased as a share of the total approved national budget, as reflected by lower appropriations
and allotments until 2005. Per-pupil spending also suffered from the spending controls the
government mounted in response to the increasing debt service payments and cash shortage
caused by the fiscal crisis (reflected in falling allotments until 2005). Furthermore, DepED could
not fully execute even the portion of the budget that the government actually did release
(obligations were lower than total allocations every year). It is clear that the spending increases
in 2007 and 2008 resulted from an upswing in appropriations and total allotments, not from
27
The Review estimated these statistics by assuming that enrollment in public schools grew at the average annual
population growth rate of 2.11 percent for six- to 11-year-olds and 2.1 percent for 12- to 15-year-olds.
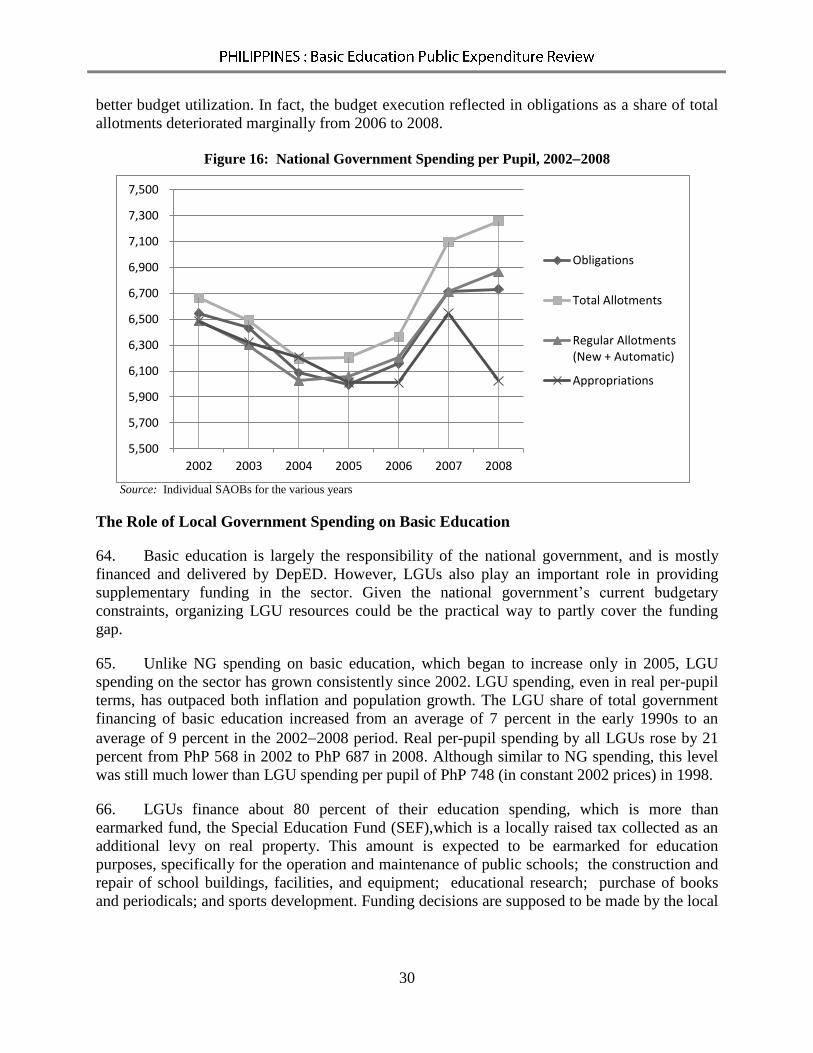
30
better budget utilization. In fact, the budget execution reflected in obligations as a share of total
allotments deteriorated marginally from 2006 to 2008.
Figure 16: National Government Spending per Pupil, 20022008
Source: Individual SAOBs for the various years
The Role of Local Government Spending on Basic Education
64. Basic education is largely the responsibility of the national government, and is mostly
financed and delivered by DepED. However, LGUs also play an important role in providing
supplementary funding in the sector. Given the national government’s current budgetary
constraints, organizing LGU resources could be the practical way to partly cover the funding
gap.
65. Unlike NG spending on basic education, which began to increase only in 2005, LGU
spending on the sector has grown consistently since 2002. LGU spending, even in real per-pupil
terms, has outpaced both inflation and population growth. The LGU share of total government
financing of basic education increased from an average of 7 percent in the early 1990s to an
average of 9 percent in the 20022008 period. Real per-pupil spending by all LGUs rose by 21
percent from PhP 568 in 2002 to PhP 687 in 2008. Although similar to NG spending, this level
was still much lower than LGU spending per pupil of PhP 748 (in constant 2002 prices) in 1998.
66. LGUs finance about 80 percent of their education spending, which is more than
earmarked fund, the Special Education Fund (SEF),which is a locally raised tax collected as an
additional levy on real property. This amount is expected to be earmarked for education
purposes, specifically for the operation and maintenance of public schools; the construction and
repair of school buildings, facilities, and equipment; educational research; purchase of books
and periodicals; and sports development. Funding decisions are supposed to be made by the local
5,500
5,700
5,900
6,100
6,300
6,500
6,700
6,900
7,100
7,300
7,500
2002 2003 2004 2005 2006 2007 2008
Obligations
Total Allotments
Regular Allotments(New + Automatic)
Appropriations
31
school board. In addition, many LGUs supplement the SEF with an allocation from their general
fund.28
67. In a well-functioning intergovernmental system, spending by national and local
governments complement each other in an efficient manner. LGUs can finance those inputs that
the national government does not supply in sufficient quantities. However, in the Philippines,
there is no evidence of such a pattern of vertical coordination. Instead, there is some evidence
that LGUs have often hired teachers to compensate for teacher shortages, even though the
national government should have primary responsibility for supplying teachers. Unfortunately, in
the absence of a detailed breakdown of LGU spending data, it is not possible for the PER team to
comment further on the issue of whether LGUs finance specific inputs to complement NG
financing. Other studies, such as Manasan and Castel (2009), suggest that the sharing of
responsibility between DepED and the LGUs for financing basic education is not clearly defined.
Manasan and Castel find that school-level data show a mismatch between needs of the school
and SEF spending by LGUs.29
Private Spending on Basic Education
68. Household Spending: In many developing countries, households spend their own money
to supplement their children’s education, either by sending them to public schools or to good
private schools. The PER team analyzed household education expenditures for 2003 and 2006,
years for which Family Income and Expenditure Survey (FIES) household data for the
Philippines are available. These expenditures include spending on tuition and other fees,
allowances, books, and supplies.
69. However, this analysis is limited, since the FIES household data do not distinguish
between students who attend public or private schools. Thus, we cannot separate household
spending on education by the type of school. In addition, these data are not segregated by grade
attended, so it is not possible to estimate household spending on basic education. Table 7 reports
household spending on all levels of education.
28
The LGUs’ general fund comes from the intergovernmental fiscal transfer from the NG to LGUs called the
Internal Revenue Allotment (IRA), and from other locally raised revenues. 29
A separate study on “Basic Education Financing through Local Government Units” is in process, with AusAID
support, to further study these issues.

32
Table 7: Average of Household Expenditures on Education per School-Age Household Member
Conditional on Households Reporting Education Expenditures
(in 2003 NCR adjusted prices)
Education Expenditures and Components 2003 2006 Percent Change
Total Expenditures 3,579.74 2,843.73 –20.56 ***
71.912 69.406
Tuition and Other Fees 2,488.59 2,071.73 –16.75 ***
51.926 54.602
Allowances 633.56 457.95 –27.72 ***
29.501 25.617
Books 168.31 137.44 –18.34 ***
4.904 4.959
Supplies 289.28 176.62 –38.95 ***
3.633 3.538
Number of Households 16,480,393 17,403,482 5.60
Percent with positive education expenditures 63.60 64.43
Number of strata 1,574 1,566
Number of primary sampling units 2,838 3,132
Notes: Excludes households with positive education expenditures but no school-age members.
The numbers below the estimates are survey-design-consistent standard errors
*** - the difference between the 2003 and 2006 estimates is significant at 0.01 (two-tailed) level of significance.
** - the difference between the 2003 and 2006 estimates is significant at 0.05 (two-tailed) level of significance.
* - the difference between the 2003 and 2006 estimates is significant at 0.1 (two-tailed) level of significance.
70. Table 7 reports the mean of household expenditures on education per school-age
household member for 2003 and 2006. The estimates are in 2003 NCR prices and are conditional
on both the (sub) sample of households that reported spending on education, and the presence of
school-age members.30
Between 2003 and 2006, total expenditures on education per school-age
member and its components declined significantly. The statistics that show relatively lower
decreases are tuition and other fees and books; those that show relatively larger contractions are
allowances and supplies.
71. Between 2003 and 2006, the average household education expenditures per school-age
household in each quintile showed statistically significant declines. The exception was quintile 4,
which registered a statistically significant increase. Moreover, the poorer the quintile, the larger
30
For the variable "household spending on education per school-age member", school-age is defined as seven to 24
years old. There are two reasons for this. First, unlike the APIS, the FIES does not provide a roster of household
members, but only gives the number of household members by various age groups such as less than one year old,
one to six years old, seven to 14 years, 15 to 24 years old, and so forth. Second, education expenditures are not
disaggregated by level of education, but lumped together. The assumption is that households that are reporting
education expenditures, but not reporting any students who are between seven and 24 years old, are spending on pre-
school education (for members younger than seven) or graduate school (for members older than 24 years) and are
dropped from the sample.

33
the absolute values of the percent changes. Thus, it appears that households could not
compensate for decreasing real government spending on education.
72. Private Corporate Spending: DepED has forged more than 400 partnerships with
private sector corporations, nongovernment, and civic organizations through the Adopt-a-School
program (DepED 2010). Through the program, DepED raised PhP 1 billion in 2000.
Contributions increased to PhP 6 billion in 2008, which was equivalent to 3.5 percent of total
government spending in the sector that year. In 2009, the contributions increased to PhP 7.2
billion. Nevertheless, these amounts were still not large enough to provide sufficient resources to
put the country on track to achieve EFA targets established in the MYSP. DepED has spent a
major portion (more than 90 percent) of the resources from this program on information, and
technology acquisitions and programs. Five percent has been spent on health and nutrition
programs and the remaining on other items and activities.
Education Service Contracting – Partnership with the Private Sector
73. According to a recent World Bank study on Education Service Contracting (ESC), the
Philippines has one of the largest public-private partnership (PPP) in the world. The program
covers more than 567,500 student beneficiaries, representing 8.8 percent of a total 6.46 million
high school enrollments in SY 2008-2009 (Patrinos et al. 2010). The report concludes that this is
a cost-effective program under which DepED contracts with certified private schools to accept
students who would otherwise have been in overcrowded public schools. The program
encourages households to invest in education. Thus, on average, the families of ESC grantees
pay PhP 4,298 to cover the difference between the grant amount and the actual cost of tuition at
the private school attended. The report recommends expanding the ESC program to ease the
pressure to build tens of thousands of more classrooms in the public sector. It also explains that
the first step would be for DepED to assess the capacity and demand for the program and to
improve regulation.

34
Box 4: The Concession Schools Program of Colombia
Along with the recommended expansion of the ESC program, another PPP scheme that could
be implemented is the system of contracting private school operators to manage public schools.
This plan is similar to the Concession Schools Program introduced in Bogota, Colombia in
1999 (Barrera-Osorio 2007; Patrinos et al. 2009). Under this program, as a way to improve
access to and quality of education for low-income students, the government engages private
entities to manage public schools. The government provides the infrastructure, selects the
students, and gives an annual pre-agreed per-pupil payment. Private operators have autonomy
in terms of school management and relative flexibility to contract administrative and teaching
staff. Private schools can also freely decide on and implement their pedagogic model. Twenty-
five public schools are run under this scheme on 15-year contracts. These schools are located in
the poorest areas in Bogota, which are experiencing a severe lack of primary and secondary
schools. The program addresses the limitations of some demand-side interventions, such as the
lack of requirement to demonstrate improved outcomes for continued public funding, by
requiring concession schools to maintain an above-average score on the national academic test
and to meet other performance standards set by the government. Empirical analysis provides strong evidence of a direct effect of concessions schools in
reducing dropout rates (Barrera-Osorio 2007). There is also some evidence that concession
schools have an indirect impact on the dropout rates of nearby regular public schools, which
have lower dropout rates compared with public schools outside the influence of concessions
schools. This indirect impact is linked to positive externalities generated by extension
community work done by concession schools.
Future Projections of Resource Requirements for Basic Education
74. DepED is currently working with the World Bank to update the 2005 Multi-Year
Education Spending Plan. The updated plan will consider the latest enrollment projections and
cost parameters. However, we can estimate how much the government would need to spend on
basic education to achieve its objectives by 2015. Although there are many other factors,
including demand-side and governance constraints, that cannot be tackled by merely increasing
government spending, this report shows that decreased government spending before 2006
contributed to deteriorating basic education outcomes. Even recent spending increases in 2007
and 2008 fell considerably short of the funding needed to achieve EFA and MDG targets.
International studies and a few papers that examine education in the Philippines, such as Orbeta
(2005), conclude that increasing government spending on key inputs and quality improvement
measures is a necessary, although not sufficient, condition to improving education enrollment
and completion rates. Although measures such as the CCTs discussed earlier can alleviate
demand-side constraints, providing sufficient numbers of good-quality schools and teachers is
essential.
75. How much should the government spend in the next five years to put the country back on
track to achieve its objectives for basic education? Table 8 considers and summarizes some
alternative scenarios. The cost estimate for government spending on basic education, expressed
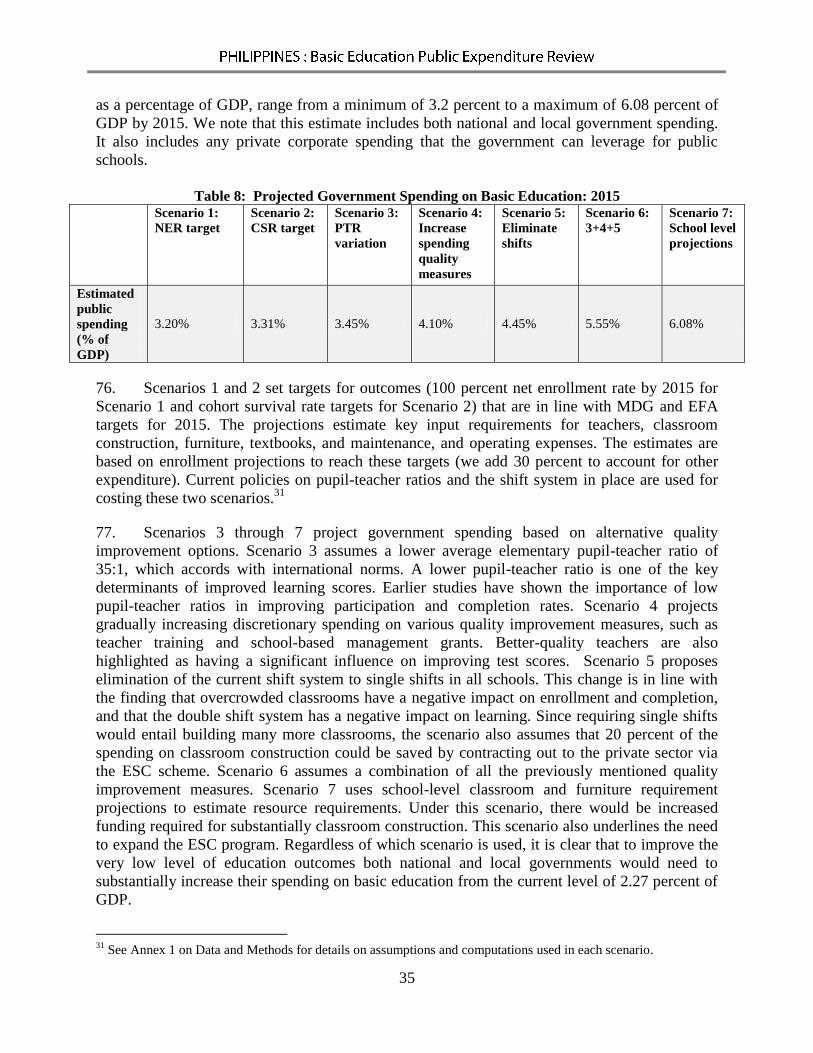
35
as a percentage of GDP, range from a minimum of 3.2 percent to a maximum of 6.08 percent of
GDP by 2015. We note that this estimate includes both national and local government spending.
It also includes any private corporate spending that the government can leverage for public
schools.
Table 8: Projected Government Spending on Basic Education: 2015
Scenario 1:
NER target
Scenario 2:
CSR target
Scenario 3:
PTR
variation
Scenario 4:
Increase
spending
quality
measures
Scenario 5:
Eliminate
shifts
Scenario 6:
3+4+5
Scenario 7:
School level
projections
Estimated
public
spending
(% of
GDP)
3.20% 3.31% 3.45% 4.10% 4.45% 5.55% 6.08%
76. Scenarios 1 and 2 set targets for outcomes (100 percent net enrollment rate by 2015 for
Scenario 1 and cohort survival rate targets for Scenario 2) that are in line with MDG and EFA
targets for 2015. The projections estimate key input requirements for teachers, classroom
construction, furniture, textbooks, and maintenance, and operating expenses. The estimates are
based on enrollment projections to reach these targets (we add 30 percent to account for other
expenditure). Current policies on pupil-teacher ratios and the shift system in place are used for
costing these two scenarios.31
77. Scenarios 3 through 7 project government spending based on alternative quality
improvement options. Scenario 3 assumes a lower average elementary pupil-teacher ratio of
35:1, which accords with international norms. A lower pupil-teacher ratio is one of the key
determinants of improved learning scores. Earlier studies have shown the importance of low
pupil-teacher ratios in improving participation and completion rates. Scenario 4 projects
gradually increasing discretionary spending on various quality improvement measures, such as
teacher training and school-based management grants. Better-quality teachers are also
highlighted as having a significant influence on improving test scores. Scenario 5 proposes
elimination of the current shift system to single shifts in all schools. This change is in line with
the finding that overcrowded classrooms have a negative impact on enrollment and completion,
and that the double shift system has a negative impact on learning. Since requiring single shifts
would entail building many more classrooms, the scenario also assumes that 20 percent of the
spending on classroom construction could be saved by contracting out to the private sector via
the ESC scheme. Scenario 6 assumes a combination of all the previously mentioned quality
improvement measures. Scenario 7 uses school-level classroom and furniture requirement
projections to estimate resource requirements. Under this scenario, there would be increased
funding required for substantially classroom construction. This scenario also underlines the need
to expand the ESC program. Regardless of which scenario is used, it is clear that to improve the
very low level of education outcomes both national and local governments would need to
substantially increase their spending on basic education from the current level of 2.27 percent of
GDP.
31
See Annex 1 on Data and Methods for details on assumptions and computations used in each scenario.

36
Conclusion
78. Real government spending on education has declined from over 4.2 percent of GDP in
1998 to 2.6 percent of GDP in 2008. Real government spending on basic education also declined
from 2.9 percent in 2002 to about 2.3 percent of GDP in 2005. These statistics indicate a steady
decrease in real spending per student from 2000 to 2005. This reduction was partly due to the
effect on the government’s fiscal balance brought about by the Asian financial crisis in the late
1990s. It was also partly because of the decreasing priority given to education, particularly to
basic education, whose share in the total national government budget declined from 19.1 percent
in 2002 to less than 15 percent in 2008. Further, government spending on basic education has not
kept pace with the rapidly growing school-age population, thus putting increasing pressure on the
public budget.
79. The decline in real resources available to the education sector contributed to declines in
basic education outcomes prior to 2006, when BESRA was introduced. One of the main policy
actions of BESRA is directed at increasing real resources devoted to basic education. Although a
better fiscal situation and lower debt payments contribute to recent spending increases and
indicate that higher NG resources are available for all sectors, the relative share of basic
education in NG spending continued to decline. The 2007 spike in spending may also represent
catch-up spending. Local government units, and both households and private corporate donors in
the private sector, play important roles in supplementing the availability of resources in the basic
education sector. However, despite recent increases in NG spending, the combined resources
from all public and private sources still fall very short of the resources required to achieve EFA
goals. Government spending will need to be increased if the Philippines is to achieve its goals for
the sector. Alternative projections estimate that both national and local government spending on
basic education will need to increase at least 3.2 percent of GDP or as much as to 6 percent of
GDP by 2015 to reach MDG and EFA targets.

37
Chapter 4 - Quality of Government Spending on Basic Education
80. In this chapter, we extend the expenditure analysis. We examine the quality of
government spending on the basic education sector by the extent to which the allocation of
public spending is in line with the marginal needs in the sector. Our analysis focuses on the
composition of the public spending and its relation to input shortages and to the geographic
distribution of public spending.
Economic Composition of Government Spending and its Relation to the Adequacy of Input
Provision and Basic Education Outcomes
81. We ask if the government focused its spending on financing the key inputs that have the
largest marginal impact on enrollment, completion, and learning outcomes. Although
government spending data is not suitable for a detailed analysis at the school level, we can
analyze the economic composition of national government spending and relate it to inputs and
input shortages, if not directly to outcomes.32
Our analysis of the determinants of learning
outcomes suggests that adequately funding teachers and classrooms is particularly relevant in the
Philippines.
82. The Impact of School-Related Inputs on Learning Achievement: Students’ learning
outcomes are determined by a variety of factors, ranging from individual aptitude to household
characteristics and school environment. Philippine data are not available to estimate effects of
variables other than certain school characteristics. Hence, we performed a regression analysis,
using as the dependent variable the NAT scores at the municipality level for SYs 20052006 and
2007-2008 for second-year secondary school students. We included municipality and division
dummies.
83. The analysis shows that the school-related characteristics that have a significant positive
impact on learning achievement are better pupil/student-teacher ratios, smaller school size, and
having a school principal and better qualified teachers. This finding underlines the importance of
having an adequate number of good-quality teachers in enhancing student learning in the
Philippines. This result is also consistent with findings in other countries in the school-
effectiveness/education production function estimation literature.
84. One of the key factors that has a significant negative impact on test scores is the shift
system. Municipalities that had higher shares of schools using the double shift system had
lower average test scores than did municipalities with higher share of schools that used the single
shift system. This finding highlights the need for adequate numbers of classrooms and teachers,
which would enable all students to get enough contact hours with their teachers. These facts
imply that eliminating the shift system and having enough classrooms, teachers, and learning
materials is essential if the public school system is to be able to give a quality education. Box 5
provides some details of the results of this analysis.33
32
Unfortunately, the Bureau of Local Government Finance (BLGF) does not provide the economic composition of
LGU spending data. Thus, we had to limit this analysis to national government spending data. In any event, more
than 90 percent of the spending on the sector is by the national government. 33
Taking the analysis one step further, regression residuals of these regressions can be interpreted in terms of
efficiency. Thus, those schools with residuals above zero are more efficient than average and those with residuals

38
Box 5: School-Related Determinants of Learning Achievement
School Inputs: A higher teacher-student ratio affects test scores positively. All else constant, a 1
percent increase in teacher-student ratio will lead to 1.6 percent increase in test scores while a
one-point increase in its increment will lead to 0.46-point increase in mean percentage scores.
Classroom-to-student ratio and its increment do not have a statistically significant effect on
achievement scores.
Enrollment: All variables related to the number of students enrolled have a negative effect on
mean scores. The higher the ratio of first and second years enrolled in the school, the lower the
score. This finding supports the idea that a higher concentration of students leads to dilution of
limited school resources, including contact time with teachers.
Congestion: To control for school size and to avoid multicollinearity (a condition in which the
regressors are highly correlated) problems, the team divided total school enrollment into
quartiles and entered them into the regression as dummy variables. Compared to schools with
lower enrollment, those with 500 or more students had significantly lower test scores. Also,
students who came from schools operating with two shifts had lower mean percentage scores. A
plausible explanation is that most schools with two shifts operate on resources meant for only
one shift, while schools that have three or more shifts received additional inputs and funding.
School Quality: Most schools headed by a teacher-in-charge, Special Education (SPED), or
vocational teachers have lower achievement scores compared to schools headed by a principal.
However, when we added in municipality dummies, the negative effect remained only for
schools headed by vocational teachers. This result probably captures other aspects of the school
more than just the effect of school heads. Teacher quality, as reflected in having a higher
proportion of better qualified teachers who are higher ranked, leads to significantly better scores.
Sources of Funding: Before we added division and municipality dummies, all variables
pertaining to LGU funding sources for teachers had a negative impact on achievement scores.
When we controlled for municipality and divisions, our models showed that most of the LGU
effect disappeared and only the negative effect of parent-teacher-community association
(PTCA)-funded teachers remained. This result may be because the proportion of LGU-funded
teachers is closely correlated with other municipality characteristics.
below zero are more inefficient than average (Farell 1958, cited in Jacobs et al. 2006). Comparing the characteristics
of more and less efficient schools might lead to some policy implications if efficiency were defined as applying to
those schools that were better able to translate inputs into higher test scores. However, because of limitations of the
data, this report's efficiency analysis does not reveal much about the factors that make some schools more efficient
than others. In fact, the schools that are classified as efficient have almost the same characteristics as those that are
classified as inefficient. One characteristic that does stand out is that the more efficient schools appear to be more
flexible to changing circumstances. When these schools lose a principal, they tend to hire a replacement faster than
do other schools. When enrollment increases so that these schools are forced to resort to two shifts, they are able to
revert to one shift again the following year. These results imply that the factors that have the greatest impact on
efficiency in translating inputs into better outcomes, such as higher achievement scores, might not be fully captured
by the BEIS. In addition, the difficulty of this analysis was compounded because the BEIS and NETRC (test score)
databases are not linked. Moreover, as mentioned earlier, there are problems with NETRC's design and analysis of
the NAT tests that limit the usefulness of NAT scores as outcome measures. Further analysis using primary survey
data is needed to thoroughly explore these issues.

39
Other School Characteristics: Although being an annex school does not have a significant
effect on learning achievement, schools that are funded purely by local governments tended to
have higher achievement scores. However, we note that there are very few of these schools).
85. Economic Composition: The share of NG spending on basic education devoted to
Personal Services (PS) decreased steadily from 90 percent in 2002 to 82 percent in 2008. This
trend reversed the continuously increasing share of NG spending on PS from 74 percent in 1990
to 90 percent in 2001. The share of Capital Outlay (CO) in total NG spending also fell from 5
percent of NG spending in 2002 to 3 percent in 2005 and then returned to 5 percent in 2008. The
decline in the PS share has benefited Maintenance and Other Operating Expenses (MOOE),
which has more than doubled from 5 percent in 2002 to 12 percent in 2008, thus reversing the
declining trend in the 1990s. In the absence of data to establish the marginal returns to additional
spending in different expense classes, it is difficult for us to comment on the relative shares of
PS, CO, and MOOE in NG spending. However, our analysis of the trends in real spending on the
various categories suggests that the rebalancing of allocation that we see among the expense
classes is consistent with the sector’s relative needs.
86. On a per-pupil basis, both PS and CO spending have followed a similar pattern,
decreasing from 2000 to around 2005 and recovering thereafter, although per-pupil PS spending
in 2008 did not reach the 2003 level. However, real per-pupil spending for MOOE has increased
every year since 2002. It has more than doubled from PhP 338 in 2002 to PhP 828 in 2008,
surpassing its earlier peak level of PhP 726 in 1990. Although the increasing trend started early
in the decade, the more substantial increases occurred after 2006 when BESRA was introduced.
From a policy perspective, the critical question is whether the current composition of spending is
optimal, given the relative shortages of various inputs such as teachers and classrooms.
Table 9: National Government Spending on Basic Education, by Expense Class, 20022008
Particulars 2002 2003 2004 2005 2006 2007 2008
Shares (percent of total)
Personal Services 89.8 90.3 89.4 89.4 87.4 82.6 82.4 MOOE 5.2 5.7 6.6 7.5 8.2 12.1 12.3 Capital Outlay 5.0 4.0 4.0 3.1 4.4 5.3 5.3
Total spending (2002 prices in PhP millions)
Total spending 106,051 105,622 98,717 97,403 101,013 111,882 115,596 Personal Services 95,282 95,387 88,248 87,046 88,258 92,404 95,222 MOOE 5,477 6,026 6,505 7,352 8,322 13,533 14,218 Capital Outlay 5,291 4,208 3,964 3,004 4,433 5,945 6,155
Per pupil spending (2002 prices in PhP millions)
Total spending 6,546 6,440 6,086 5,994 6,103 6,656 6,752 Personal Services 5,882 5,816 5,441 5,357 5,333 5,497 5,562 MOOE 338 367 401 452 503 805 831 Capital Outlay 327 257 244 185 268 354 360
Source: Individual SAOBs for the various years

40
87. Impact on Teachers: Apart from students, teachers are the most important of all inputs
to an education system. International research confirms the key role played by teachers in
improving learning achievement as well as in reducing dropout and repetition rates. Orbeta
(2005) found that in the Philippines, better teacher-student ratios improved enrollment rates by
attracting more children to school, retaining them in school, and hence, increasing cohort
survival rates.34
The analysis of the impact of school-related inputs on achievement scores earlier
in this chapter also highlights the significant role played by having sufficient teachers as
reflected in teacher-pupil ratios and schools having principals to lead them. Thus, it is important
to investigate whether DepED has provided sufficient teachers for public elementary and
secondary schools despite decreasing real spending on the sector since 2000.
88. Trends in PS spending are determined by both teacher pay level and the number of
teachers. The pay level is important for recruiting and retaining qualified teachers. The number
of teachers has direct bearing on the pupil-teacher ratio, an important contributor to learning
outcomes.
89. The increases in PS spending in the 1990s were mostly attributable to increases in public
school teacher salaries, which increased three-fold in real terms between 1985 and 1997.
International comparisons suggest that public-school teacher salaries in the Philippines in the
1990s were higher than would be expected in other countries. For example, primary-school
teachers’ remuneration as a ratio of GNP per capita in the Philippines was three in 1997
compared to the mean in Asia of around 2.5 (Manasan 2002). More recent data from UNESCO
for 2000 also confirm that in general, teachers in the Philippines are better paid than are their
counterparts in developing countries.
90. During the 2000s, teacher salaries were revised upward in 2000, 2001, 2007, and 2008.
However, in 2002 prices, average salaries for all teacher classes decreased from 2002 to 2005,
and then increased because of the substantial raises awarded from 2006 to 2008. The average
salary of Class 1 teachers was 11 percent lower in real terms in 2008 than in 2002, that of Class
2 teachers was 9 percent lower, and that of Class 3 teachers 3 percent lower. In contrast, the
average annual salaries of Master teachers 1 and 2 were 3 percent and 8 percent higher,
respectively, for the same period.
91. In the absence of recent internationally comparable evidence, we cannot determine
whether the Philippines under- or overpays its teachers. Moreover, such judgments rest on more
than international comparisons of salary and allowance levels. Many education systems have
found it necessary to increase salary levels to attract and retain specialist secondary teachers,
especially in mathematics and science. We need more recent evidence, including comparable
international data, to assess the relation between teacher salaries in the Philippines and learning
achievement.
92. When we consider the number of teachers, we find that DepED estimated that it had a
deficit of 37,986 teachers in SY 20032004 in public elementary and secondary schools. Recent
34
It is not surprising that international research has demonstrated that better trained teachers have a statistically
significant impact on student achievement levels. It is regrettable, therefore, that there are no available data on the
proportion of teachers who are trained and who continue to receive good quality in-service training. This area would
need to be investigated as part of the teacher management study mentioned earlier.

41
evidence indicates that DepED reduced this teacher deficit to 9,333 teachers by the end of SY
20072008 by creating 28,653 new teacher positions (Manasan 2008).35
However, an analysis of
the most recent BEIS data indicates that the number of DepED-funded teachers actually working
in the public school system increased only 2.6 percent, from 411,582 teachers in 2002 to 422,099
teachers in 2007. This finding confirms anecdotal evidence that, while it is relatively easy for
DepED to hire new teachers (that is, create new teacher positions), it has not been able to
actually deploy these new teachers to schools with critical teacher shortages. Neither has DepED
increased the number of teachers actually working in schools and not on leave.
93. When we include only nationally funded teachers who are actually working in school, our
analysis of pupil/student to teacher ratios at the elementary and secondary levels shows that
despite the worsening in enrollment rates, the ratio at both levels decreased only slightly between
2000 and 2005. By 2008, the ratios recovered to the level in 2002.
Figure 17: Pupil-Teacher Ratio in Public Elementary Schools, SY 20022003 to SY 20072008
Source: DepED-BEIS
35
These estimates of teacher deficits were made by DepED using a color coding system of classifying schools based
on input shortages. See Box 6 on Congestion Analysis for an illustration of how a more comprehensive analysis of
input shortages could be performed.
2002-2003 2003-2004 2004-2005 2005-2006 2006-2007 2007-2008
Nationally-funded teachers 36.25 36.55 37.88 35.89 35.93 36.16
Nationally + locally-fundedteachers
34.73 34.01 35.08 33.23 33.53 33.18
30
32
34
36
38
40
42
44
46
48
50
Pu
pil-
Teac
he
r R
atio

42
Figure 18: Student-Teacher Ratio in Public Secondary Schools, SY 20022003 to SY 20072008
Source: DepED-BEIS
94. Although national-level elementary school pupil-teacher ratios are reasonable by
international standards, there are substantial regional differences. For secondary schools, if we
consider only nationally funded teachers, then the national-level student-teacher ratio is high by
international standards. Moreover, secondary-school ratios usually do not exceed those of
elementary schools, as is the case in the Philippines. Normally, the need to provide subject
specialist teachers at the secondary level leads to lower student-teacher ratios. Box 6 illustrates
this point.
95. Locally hired teachers: Our evidence indicates that LGUs have begun to fund teachers,
particularly in areas where there are severe teacher shortages. At the elementary level, from 2002
to 2007 the share of locally funded teachers doubled from 4 percent to 8 percent. At the
secondary level, the share increased from 15 percent in 2002 to 22 percent in 2007. Figure 18
shows that the limited data available on locally funded teachers from the BEIS indicate that
additional hiring of locally funded teachers, particularly at the secondary level, accounts for why
there have been recent improvements in the pupil/student to teacher ratio. If we considered only
nationally funded teachers working in school, then the improvements would have been marginal
at the national level.
96. This finding is somewhat surprising, since the Local Government Code states that LGUs
are meant to use their SEF primarily for building construction and maintenance. LGUs' funding
of teachers may appear positive in that it improves student-teacher ratios. However, it also raises
some concerns about its impact on teaching quality. Because LGUs frequently pay much lower
salaries and sometimes hire teachers with lower qualifications. There is mixed international
evidence on how lower-paid contract teachers with lower qualifications compared to regular
government teachers impact the quality of schooling. Additional analysis of primary survey data
would be required to further explore this issue. Nevertheless, even from a teacher management
standpoint, it is complicated to have two sets of teachers with different compensation packages
2002-2003 2003-2004 2004-2005 2005-2006 2006-2007 2007-2008
Nationally-funded teachers 44.56 45.85 46.36 44.35 43.66 43.33
Nationally + locally-fundedteachers
38.09 36.34 36.19 34.65 34.11 33.99
30
32
34
36
38
40
42
44
46
48
50St
ud
en
t-Te
ach
er
Rat
io

43
and sets of incentives. The study on local government funding of education now in progress will
throw more light on these issues.
Box 6: An Alternative Method to Estimate Shortages
For a public school, too many students and too few teachers are two sides of the same coin.
But how many students are too many and how few teachers are too few? To answer these
questions, we need to solve dual computational problems. These problems are related, but not
identical:
1. Given the number of teachers, classrooms, and chairs available in a public school, we
estimate the full capacity of the school. Then for each school we deduce the number of
excess students (or unutilized enrollment slots). 2. Given the current number of students in the various grade and year levels of a school, we
determine the minimum number of teachers, classrooms, and chairs needed to serve these
students. In doing so we keep in mind current DepED policies. Then for each school we
infer the shortage (or surplus) of teachers, classrooms, and chairs.
DepED currently uses color coding schemes for teachers, classrooms, and seats. These codes
classify schools based on indicator ratios, but do not solve either of the two computational
problems.
To solve both computational problems, we tried a school-by-school simulation, using SY
20072008 BEIS data on 37,807 elementary schools and 6,523 secondary schools. For
simulation purposes, we assumed that one teacher at the elementary level could teach all the
subjects to one section of 45 pupils in any grade level. At the secondary level, we assumed
that seven specialized teachers would be needed to deliver the complete curriculum to the
typical stream of four sections in a high school, each with 45 students. In keeping with DepED
policy in estimating shortages, we included only nationally funded teachers in our
computations.
The estimations show that given the number of available classrooms, teachers, and seats, the
aggregate national capacity is about 11 million students at the elementary level. The actual SY
20072008 enrollment was 12.3 million students. Thus, at the aggregate national level, the
public elementary school sector appears to be operating at about 12 percent above full
capacity. Nevertheless, although some elementary schools are congested, others are
undersubscribed. The statistics below summarize the results at the elementary level:
11,773 elementary schools (31 percent of 37,807) were classified as congested;
37,807
11,773
20,305
5,728
-
5,000
10,000
15,000
20,000
25,000
30,000
35,000
40,000
TOTAL ELEMENTARYSCHOOLS
SY 2007-2008
"CONGESTED SCHOOLS" "JUST RIGHT" UNDER-SUBSCRIBEDSCHOOLS
How many public elementary schools are congested?

44
5,728 (15 percent of 37,807) had surplus inputs (i.e., were undersubscribed);
20,305 (54 percent of 37,807, a majority) had an adequate number of teachers,
classrooms, and seats;
the 11,773 congested schools have 2.13 million aisle students, representing an average of
about 180 aisle students per congested school;
5,728 undersubscribed schools have 854,000 unfilled slots, representing an average of
149 per school, equivalent to 8 percent below estimated capacity.
The simulation also shows that the major drawback for 1,214 of the congested elementary
schools (10 percent of 11,773) is the lack of teachers. For these schools, the first priority is to
acquire at least one additional teacher, not an additional classroom or chair. The key constraint
for 1,672 of them (14 percent of 11,773) is the lack of classrooms. Finally, for the remainder
8,971 (76 percent of 11,773) congested schools the key limitation is the lack of chairs.
When we estimated teacher shortages, the simulation yielded a surprising finding:
For the public elementary sector as a whole, a total of 344,818 teachers are needed but
348,220 national teacher positions are already available. Based on aggregate figures,
there seems to be no teacher shortage.
However, a school-by-school analysis shows that a total of 14,107 schools have a
combined shortage of 32,216 teachers. In contrast, a total of 12,001 schools have a
combined surplus of 35,618 teachers.
Thus, at the elementary level, teacher shortages might be solved for all public schools by
redeploying teachers from schools with a surplus to schools with a shortage, as determined by
current levels of enrollment. There are several practical and political constraints to
redeploying teachers that must be considered. Further, since 2000 enrollment has not grown
at the pace required to meet EFA goals. In fact, enrollment growth has not even kept pace
with the growing school-age population, resulting in falling NERs. A full-scale teacher
management study is needed to determine possible policy alternatives to meet future teacher
needs in public elementary schools.
Please see Annex 4 for the corresponding situation in public secondary schools and for details
of the methods used in the simulation.
97. Impact on Classrooms and Classroom Furniture: The second set of key inputs
provided by NG and LGU funding is classrooms and classroom furniture. Providing enough
classrooms to accommodate growing enrollment is essential to preventing overcrowding and to
improving access. Consistent with the findings of several international studies, Orbeta (2005)
found that student-classroom ratios have a significant impact on enrollment and learning
achievement in the Philippines. To reduce overcrowding, the government policy has allowed
schools with student-classroom ratios greater than 50 to hold classes in shifts. This policy is
controversial, since many educators believe that students receive a poorer-quality education in
double-shift schools because they have fewer contact hours with teachers. This belief is validated
by the regression analysis reported earlier in this chapter. In fact, even with shifts, the number of
students per class continues to be high at 52.88 for secondary public schools, as illustrated in
Figure 19 below.

45
Figure 19: Pupil/Student-Class Ratio, SY 2002-2003 to SY 2007-2008
Source: DepED-BEIS
98. DepED estimated that it had a deficit of almost 32,000 classrooms in 2003. This deficit
excluded the classrooms required to accommodate estimated enrollment increases. The pupil-
class ratio deteriorated until 2004, but since 2007, DepED, aided by the School Building
Program that is administered by the Department of Public Works and Highways (DPWH), has
built 41,546 new classrooms. Nevertheless, the ratio improved only to 38.72 at the elementary
level because many new classrooms merely replaced old, dilapidated ones they did not represent
additional facilities.
99. Given the persistently high pupil/student-class ratios, especially at the secondary level,
one of the priorities for DepED continues to be that of funding the construction of additional
classrooms to reduce over-crowding and accommodate growing enrollment. DepED is also
considering expanding the Education Service Contracting (ESC) scheme to subsidize enrollment
of students in private schools with spare capacity that are located near crowded secondary public
schools. Doing so would reduce DepED's burden of building additional classrooms and
providing additional teachers in public secondary schools. As noted in the previous chapter, the
Philippine experience shows that the ESC scheme is cost effective compared to building new
schools and classrooms and hiring new teachers.
100. Cost of Classroom Construction: Because of its increasing use of the principal-led
construction mode in the last three years, DepED-built classrooms tend to be cheaper, more
complete, higher in quality, and more ready for immediate use than are the DPWH classrooms.36
36
Under the principal-led construction scheme, the school principal/head takes the lead role in the planning,
implementation, supervision, completion, and reporting of school building and classroom construction projects.
Operating within the wider framework of School-Based Management (SBM), the scheme empowers school heads
and gives them greater transparency and accountability in school building projects. This innovation was introduced
in the World Bank-supported Third Elementary Education Project (TEEP), which was eventually mainstreamed by
2002-2003
2003-2004
2004-2005
2005-2006
2006-2007
2007-2008
Pupil-Class ratio (Elementary) 40.14 39.64 40.90 38.80 38.72 38.72
Student-Class ratio (Secondary) 55.44 56.37 55.68 53.84 52.88 52.88
303234363840424446485052545658
Pu
pil/
Stu
de
nt-
Cla
ss R
atio

46
DepED could also rationalize costs by using more precise BEIS data and a new algorithm to
prioritize and coordinate the allocation of funds for major repairs and new construction. At
present, DepED uses a color coding system to locate schools for new classroom construction, but
uses a different procedure to identify classroom repairs. Despite the cost-saving measures now
being implemented, NG capital outlays on classrooms and school furniture will have to increase
given the growth of the school-age cohort and increasing enrollment and completion rates.
Further, because LGUs also fund classrooms, to ensure that DepED makes additional provision
in areas poorly funded by LGUs, there must be better coordination between national and local
decision making.
Box 7: Other Critical Expenditures
MOOE: Earlier studies, such as those by Manasan (2002) and the 2005 Multi-Year Education
Spending Plan (DepED, World Bank, and PIDS 2005), criticized the low, declining levels of
MOOE spending in the 1990s. Since MOOE spending is on vital inputs in basic education, such
as teacher training and instructional materials, the nominal level of NG spending of PhP 422 on
MOOE per pupil in 2000 is too low. In fact, MOOE spending per pupil had halved during the
1990s.
Two of the components of the noticeable increases in MOOE spending between 2002 and 2008
are the School-Based Management grants introduced under BESRA and the School MOOE
grants. These grants are given directly to schools to enable them to meet their own expenses.
Given the persistently high dropout and repetition rates discussed in Chapter 1 and the
importance of textbooks, instructional materials, and other interventions funded by MOOE, the
increase in real spending and real per-pupil spending on MOOE is clearly a welcome trend. It
will need to be sustained to finance key supply and demand-side initiatives. If we assume that
teachers in the Philippines are being paid relatively better than their counterparts in other,
comparable countries, the PS component of NG spending should increase only in proportion to
growing enrollment. Doing so would allow for an increased share of MOOE in NG spending on
basic education, which would be a positive development.
Textbooks: Through MOOE, DepED also funds textbooks, which are a key input needed to
enhance the teaching-learning experience. (However, there were no available data to empirically
include this in the regression analysis.) Examining the quality of textbooks is beyond the scope
of this report, but we note that DepED has improved the availability of textbooks during the last
few years by undertaking several reforms. According to DepED data, the student textbook ratio
was 1:2.5 on average at both the elementary and secondary level in 2003. This ratio has
improved to 1:1.2 at the elementary level and 1:1.7 at the secondary level.
Demand-side Initiatives: Other key initiatives funded by DepED are the demand-side
initiatives designed to enhance enrollment and reduce dropout rates, particularly for the poorest
households. The Third Joint World Bank-AusAID BESRA Review Mission reported that several
demand-side interventions, such as school meals, education vouchers, and scholarships, have
been initiated and have received increased budget allocations (World Bank and AusAID 2008).
These interventions are funded by the MOOE component of NG spending. Real increases noted
in MOOE spending are a welcome trend. The Government’s Conditional Cash Transfer Program
DepED into its regular civil works program. Assessments of various school building projects indicate that the
principal-led scheme is the most efficient mode of implementation. (See, for example, Governance Watch-Ateneo
School of Government 2003, 2010.)

47
(i.e., the PantawidPamilyang Pilipino Program or 4Ps) is also an important demand-side
initiative started in 2008. The 4Ps is not funded by DepED, but by the Department of Social
Welfare and Development (DSWD). It is likely to have a considerable impact on reducing
income inequality in education outcomes.
Geographic Distribution of Government Spending and Input Provision
101. The disparity in outcomes across regions that we noted in Chapter 2 suggests that there
are similar disparities in the government's efforts to provide quality education services. Although
a region is too aggregated a unit of analysis to establish causal relations government
interventions with educational outcomes, we can assume that the inequality of outcomes is
related, at least partially, to inequality of spending and input provision, even at the regional level.
Available regional-level data do in fact show positive correlations between government spending
and education outcomes, suggesting that increasing spending in lagging regions could lead to
narrowing of the regional inequalities.
102. Past studies rarely examined the question of regional differences in government spending
on basic education. Manasan (2002) is the exception. In his study, he noted unequal distribution
of LGU SEF income and hence, LGU spending on education. The pattern he observed persists.
On a real per-student basis, the highest spending region (Region XIV) spent around 50 percent
more than the lowest spending region (Region VII) and 33 percent more than the national
average in 2008. Furthermore, between 2002 and 2008, the top spenders (e.g., NCR and Region
XIV) were among the regions with the highest government spending on a real per-pupil basis in
every year and the lowest spenders (e.g., Region VII and XII) were consistently among the
regions with the lowest spending level.

48
Table 10: Regional Disparities in Government Spending per Pupil on Basic Education, 2008(in
2002 constant prices, PhP)
Region LGU
spending NG spending
Total
Spending Region VII – Central Visayas 330 5,594 5,924 Region XII – Soccsksargen/Central
Mindanao 265 5,820 6,086
Region IX – Zamboanga Peninsula 68 6,249 6,317 Region XI – Davao 347 6,035 6,382 Region IVA – Calabarzon 1,177 5,229 6,406 Region IVB – Mimaropa 189 6,273 6,462 Region X – Northern Mindanao 299 6,273 6,572 Region V – Bicol 146 6,429 6,575 Philippines 642 6,012 6,654 Region III – Central Luzon 649 6,022 6,671 Region VIII – Eastern Visayas 113 6,749 6,862 Caraga Region 146 6,797 6,944 Region VI – Western Visayas 322 6,845 7,167 Region II – Cagayan Valley 186 7,633 7,819 Region I – Ilocos 437 7,827 8,265 National Capital Region 2,624 5,691 8,315 Cordillera Administrative Region 274 8,620 8,894
Note:This table excludes National Government spending for central operations that cannot be disaggregated by region.
Source: SAOB data from DepED for NG spending; LGU spending data from BLGF statements.
103. A major contributor to the persistent inequality in spending levels across regions is the
nature of the funding source, the Special Education Fund (SEF), which is financed from property
taxes. Thus, richer LGUs are better able to collect more SEF and so can allocate more resources
to education. This finding implies that unless the national government consciously adopts a
policy of geographic equalization or compensation, distribution of public spending across
regions will always be regressive.
104. The bivariate correlation between NG and LGU spending in 2008 is negative and
moderate (-0.25). This finding suggests that there might be a degree of compensation between
NG and LGU spending, i.e., either that the NG spends more in poorer regions or vice versa to
make up for funding shortfall. The negative correlation disappears when we remove the outlier
regions, Regions III, IVA, and NCR, from the computation. In these regions the LGUs have far
higher fiscal capacities than in the other regions. Hence, the NG tended to spend less on a per
student basis. The NG's relatively low per-pupil spending may be because of the larger number
of students in these relatively more urbanized regions. A more appropriate measure of whether
spending is compensatory would be a correlation between changes in NG and LGU spending on
basic education by region. If the national government were deliberately allocating more of its
budget to fiscally disadvantaged regions, then the two variables should be negatively correlated.
However, the data do not show such a pattern, at least not for the 2003-2006 period (Figure 20).

49
Figure 20: Changes in LGU Compared to NG Spending on Basic Education, 20032006
Source: SAOB data for NG spending; BLGF data for LGU spending
105. In fact, real per-pupil spending on basic education by the national government at the
regional level does not have any significant relation to regional, real per capita GDP; that is, the
national government does not spend significantly more in poorer regions.37
Since the national
government does not have an explicit policy that targets the poorer regions where LGUs spend a
considerable sum, total government spending on CO and MOOE, in particular where LGUs
spend a considerable sum, is clearly skewed towards richer regions. This bias could have
negative consequences for future inputs and outcomes and that would further skew regional
differences. The recent benefit incidence analysis done by Manasan et al. (2007) also found that
LGU spending at elementary level was less progressive in 2007 relative to 1999.Manasan et al.
also found that LGU spending at the secondary level became more regressive in 2007 relative to
1999 due to the widening disparity in the distribution of SEF income per student across regions.
106. Rather than an explicit geographic compensatory policy, DepED has a color-coding
system of resource allocation that targets areas where more inputs, such as teachers and
classrooms, can be provided to regions, divisions, or schools with shortages. In addition, when
BESRA was introduced in 2006, Key Result Thrust 5 in the policy document explicitly discussed
“...goal-based funding levels with equitable allocations to localities linked to LGU contributions”
(DepED 2006: 20). This statement gave DepED the responsibility and authority to reduce local
differences in education spending by more directly linking its funding with LGU contributions.
But the effects of these policies are not visible, at least not at the regional level. Further analysis
using updated LGU spending data after 2006, and local-level analysis at the LGU level using
primary data, could assess whether there have been recent changes, particularly changes made
37
The relation between real per-pupil spending and poverty ratios is also nonsignificant at the regional level. We
obtained the data on regional real per capita GDP and regional poverty ratios from the NSCB website. We omitted
NCR was from the analysis since it has a real per-capita GDP that is much higher than any other region. Thus, we
treat it as an outlier.
50
after the introduction of the new equity-based allocation formula to DepED MOOE allotments
across schools.
Geographic Disparities in Input Provision
107. The disparity in the levels of government spending across region should reflect similar
disparities in the level of input provisions. Earlier studies did not discuss regional disparities in
input availability, but the BEIS data supports this assumption.
108. Teachers and Classrooms: Despite DepED’s color-coding policy, which is meant to
direct inputs to areas with poor input ratios, there are still wide regional variances in
pupil/student to teacher and pupil/student to classroom ratios. (See Table 11) Although the
national mean of the elementary pupil-teacher ratio improved slightly, regional inequality
worsened in 2007 compared to 2002. This deterioration was indicated by a higher standard
deviation in 2007. At the secondary level, the average student-teacher ratio improved. Unlike
the elementary pupil-teacher ratio, regional dispersion of the secondary indicators remained
about the same over time (it was marginally better in 2007 compared to 2002).
109. The national average of the elementary pupil-classroom ratio improved between 2002
and 2007. However, regional differences increased, indicating that the construction of new
classrooms needs to be better targeted in the future. The regional differences in the secondary
student-classroom ratio narrowed over that time, along with improvements in the national
average.

51
Table 11: Pupil/Student to Teacher Ratio and Pupil/Student to Class Ratio, by Region,
SY 20022003 and SY 20072008
Region Pupil/Student to Teacher Ratio Pupil/Student to Class Ratio
Elementary Secondary Elementary Secondary
200203 200708 200203 200708 200203 200708 200203 200708
Region I–Ilocos 27.91 25.72 30.27 32.34 34.24 31.53 50.87 48.45 Region II –
Cagayan Valley 29.60 26.88 33.07 29.93 33.14 30.01 50.91 45.41
Region III –
Central Luzon 35.61 33.74 39.23 37.96 40.81 39.28 56.34 56.27
Region IVA -
Calabarzon 39.94 39.43 42.76 40.64 45.55 44.65 64.30 60.08
Region IVB –
MImaropa 34.96 32.30 35.59 32.31 38.34 37.16 49.60 50.37
Region V – Bicol 33.32 33.64 35.78 32.65 37.25 37.37 53.57 49.55 Region VI –
Western Visayas 31.21 28.64 35.00 31.28 36.57 33.85 52.29 49.44
Region VII –
Central Visayas 37.54 34.36 44.38 34.57 41.97 40.02 57.92 52.07
Region VIII –
Eastern Visayas 30.83 29.91 38.28 36.63 35.18 34.52 52.72 52.92
Region IX –
Zamboanga
Peninsula 32.97 32.14 37.10 31.57 37.14 36.71 50.48 55.23
Region X –
Northern
Mindanao 35.76 34.22 40.59 36.44 39.83 37.63 58.28 55.68
Region XI –
Davao Region 36.77 33.76 38.96 32.64 41.96 40.04 51.03 53.50
Region XII –
Soccskargen/Centr
al Mindanao 37.43 34.53 40.44 32.87 43.34 41.28 61.12 53.36
Caraga 32.85 30.54 36.84 31.40 37.10 34.91 54.66 49.33 Autonomous
Region in Muslim
Mindanao
(ARMM)
40.90 40.48 38.97 37.44 50.24 49.87 55.41 53.59
Cordillera
Administrative
Region(CAR) 27.79 25.26 29.75 26.67 30.94 27.80 51.65 45.01
National Capital
Region (NCR) 38.76 38.83 37.47 31.98 50.27 50.13 58.67 56.86
Philippines 34.73 33.18 38.09 33.99 40.14 38.72 55.44 52.88 Standard
Deviation 4.01 4.53 3.39 3.40 5.49 6.15 4.20 3.89
52
Relation Between Inputs, Outcomes, and Government Spending
110. The “region” is the lowest level of disaggregation for which comprehensive, national
government spending data on basic education are available. To analyze the complex relation
between government spending, inputs, and basic education outcomes, we need to work with
lower levels, such as divisions, municipalities, or school levels.
111. Nevertheless, to explore the relation between government spending, inputs, and outcomes
we performed a correlation analysis at the regional level.38
In this analysis we demonstrate that
higher regional NERs at the elementary and secondary levels are positively correlated with
higher regional government spending per pupil. In addition, regions with better pupil/student to
teacher and pupil/student to classroom ratios also had higher NERs in elementary and high
schools. Higher regional completion rates at the elementary and secondary levels are even more
strongly correlated with higher regional government spending per pupil and better pupil/student
to teacher and pupil/student to classroom ratios. Although these results cannot be interpreted in a
causal manner, they are consistent with the assumption that higher government spending and
better input ratios are associated with better outcomes in public schools at the regional level.39
Conclusion
112. This chapter assessed the quality of public spending on basic education in terms of its
composition and its relation to funding of critical sector inputs and geographic distribution. The
regression analysis of the determinants of student learning outcomes suggested that keeping the
pupil/student to teacher ratio and the pupil/student to classroom ratio low is important for
facilitating better learning. The change in the composition of the basic education budget over
2002-2008, when the relative share of PS was reduced in favor of MOOE, is mostly positive,
since the Philippine teachers tend to have been well remunerated in the past. Hence, the overall
teacher shortage is not so severe. However, the reasonable student-teacher ratio, especially at the
secondary level, has been achieved largely because the LGUs have stepped in to hire locally
funded teachers. This situation creates a concern for the quality and the qualifications of these
locally hired teachers, since they are not under DepED's direct management and are often paid
lower salaries than are nationally funded teachers.
113. In contrast, despite the thousands of new classrooms that have been built in the last
several years the classroom shortage has not been fully resolved because many of the new
classrooms simply replaced old, dilapidated structures. DepED must continue to invest in
building new classrooms. However, it is also advisable to expand the relatively effective
Education Service Contracting scheme to utilize existing idle capacities of private schools.
38
We note that an analysis of this kind is sensitive to which regions are included or excluded, since there are only 17
regions in the country. In addition, all variables pertain only to government schools because data on all inputs,
spending and outcomes were available only for these schools. The exception is that for NER, data were available for
both public and private schools. However, to ensure consistency, in this report we use only public school enrollment. 39
However, achievement test scores display unexpected results at the regional level. Regions with better input ratios
and higher government spending per pupil often had worse average achievement scores at the elementary and
secondary levels. The reason is unclear, but it may be that the “region” is too high a level of aggregation for such an
analysis. Or it may indicate that the allocations of public resources favor regions with a low quality of education.
The achievement score analysis discussed in Chapter 1 explores this relation at the municipality level and finds that
better teacher related inputs do have a significant positive impact on achievement levels.

53
114. A key issue that emerges from the analysis is the persistent geographic inequality in
public spending. A regression analysis of the relation between government spending, inputs, and
outcomes by region supports the view that more spending and more inputs lead to better
outcomes. Despite its stated position of providing “equitable funding to localities,” there appears
to be no correlation between NG spending and regional income. Clearly, DepED does not favor
poorer regions in its allocations, since there appears to be no correlation between NG spending
and regional income. However, there is a positive correlation between regional income and local
government allocation of resources for basic education. Thus, the current distribution of total
government spending favors wealthier regions. Although the color-coding scheme is supposed to
direct resources to those schools in greater need, its effects are not visible, at least not at the
regional level.
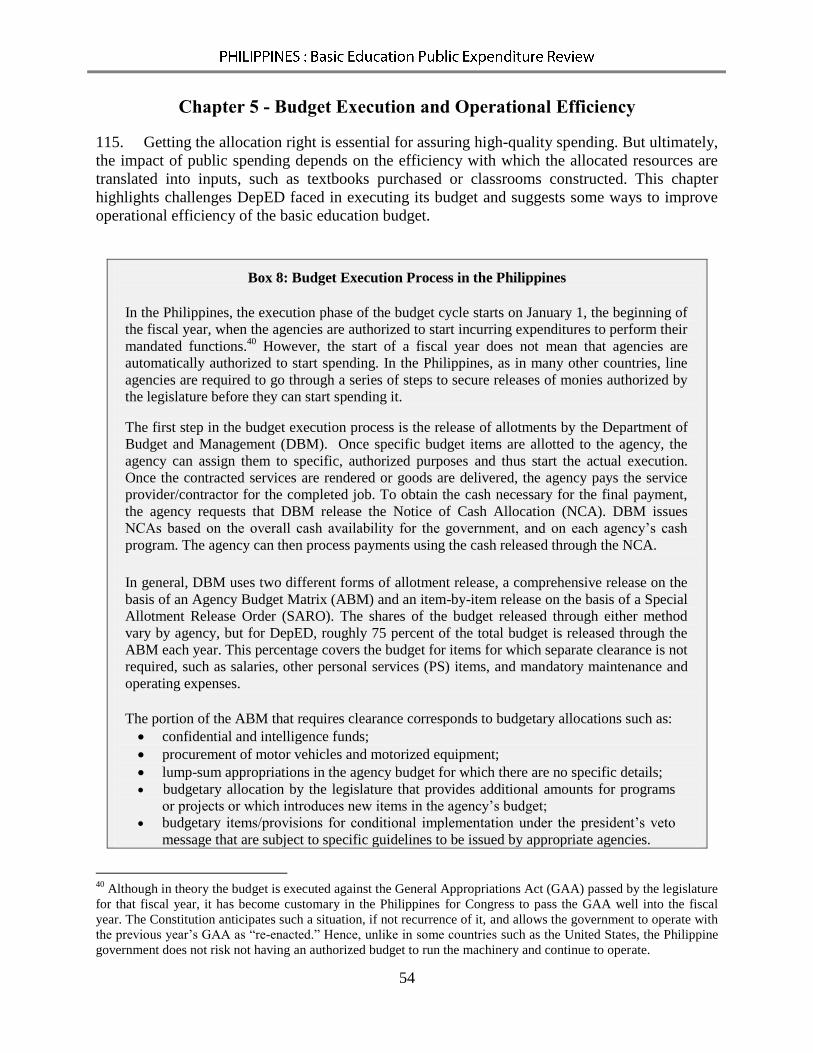
54
Chapter 5 - Budget Execution and Operational Efficiency
115. Getting the allocation right is essential for assuring high-quality spending. But ultimately,
the impact of public spending depends on the efficiency with which the allocated resources are
translated into inputs, such as textbooks purchased or classrooms constructed. This chapter
highlights challenges DepED faced in executing its budget and suggests some ways to improve
operational efficiency of the basic education budget.
Box 8: Budget Execution Process in the Philippines
In the Philippines, the execution phase of the budget cycle starts on January 1, the beginning of
the fiscal year, when the agencies are authorized to start incurring expenditures to perform their
mandated functions.40
However, the start of a fiscal year does not mean that agencies are
automatically authorized to start spending. In the Philippines, as in many other countries, line
agencies are required to go through a series of steps to secure releases of monies authorized by
the legislature before they can start spending it.
The first step in the budget execution process is the release of allotments by the Department of
Budget and Management (DBM). Once specific budget items are allotted to the agency, the
agency can assign them to specific, authorized purposes and thus start the actual execution.
Once the contracted services are rendered or goods are delivered, the agency pays the service
provider/contractor for the completed job. To obtain the cash necessary for the final payment,
the agency requests that DBM release the Notice of Cash Allocation (NCA). DBM issues
NCAs based on the overall cash availability for the government, and on each agency’s cash
program. The agency can then process payments using the cash released through the NCA.
In general, DBM uses two different forms of allotment release, a comprehensive release on the
basis of an Agency Budget Matrix (ABM) and an item-by-item release on the basis of a Special
Allotment Release Order (SARO). The shares of the budget released through either method
vary by agency, but for DepED, roughly 75 percent of the total budget is released through the
ABM each year. This percentage covers the budget for items for which separate clearance is not
required, such as salaries, other personal services (PS) items, and mandatory maintenance and
operating expenses. The portion of the ABM that requires clearance corresponds to budgetary allocations such as: confidential and intelligence funds;
procurement of motor vehicles and motorized equipment;
lump-sum appropriations in the agency budget for which there are no specific details;
budgetary allocation by the legislature that provides additional amounts for programs
or projects or which introduces new items in the agency’s budget;
budgetary items/provisions for conditional implementation under the president’s veto
message that are subject to specific guidelines to be issued by appropriate agencies.
40
Although in theory the budget is executed against the General Appropriations Act (GAA) passed by the legislature
for that fiscal year, it has become customary in the Philippines for Congress to pass the GAA well into the fiscal
year. The Constitution anticipates such a situation, if not recurrence of it, and allows the government to operate with
the previous year’s GAA as “re-enacted.” Hence, unlike in some countries such as the United States, the Philippine
government does not risk not having an authorized budget to run the machinery and continue to operate.

55
Budget Execution Process
116. Some of DepED’s priority programs and projects, such as purchases of textbooks and
school furniture, and classroom construction, are appropriated by nationwide, lump-sum items.
The details of the final allocations are not specified in the General Appropriations Act (GAA).
To execute these programs and projects, DepED must obtain clearance from DBM for allotment
releases. Once DBM releases allotments for these items, the DepED Central Office then
distributes specific amounts to the regional offices or other implementing units through sub-
allotments. When they receive sub-allotments, the implementing units obligate the budget and
enter into expenditure commitments to begin the funded activities. When DepED is ready to
make payments (for example, to service providers or contractors), it requests a cash release from
DBM with an Notice of Cash Allocation (NCA). Although some items may be combined in
batches, SAROs are prepared and released on an item-by-item basis. NCAs are released without
reference to specific spending purposes (that is, particular obligations incurred). Thus, for a
relatively small but important portion of the budget, the question of allocative efficiency is not
fully resolved at the budget formulation or approval stages. After the appropriations are
authorized by Congress the Department Secretary has the discretion to allocate these lump-sum
appropriations to specific geographic locations. Figure 21 depicts the budget execution process
schematically. Figure 21: Budget Execution Process
117. To further complicate management and analysis of budget execution, the Philippines’
appropriation structure has many sources of budget authorizations as follows:
(i) approved appropriation in the GAA plus additional releases through the Special
Allotment Release Orders (SAROs) charged from the national special purpose or
lump-sum funds (i.e., Miscellaneous Personnel Benefits Fund, Pension Gratuity
Fund, Priority Development Assistance Fund, and Calamity Fund);
(ii) automatic appropriations of items based on legislative authorization other than the
annual GAA (e.g., for the payment of the retirement and life insurance premium
of personnel);
(iii) continuing appropriations (i.e., carryover from the previous years for capital
outlays and maintenance and other operating expenses); and
(iv) supplemental budgets.
Appropriations
(As approved by Congress)
Allotment release
Sub-allotment release
From DepED CO to DepED ROs, SDOs, schools
Commitments/ obligations
Procurement and implementation procedures, contract award, order, supplier, delivery
Verification of delivery
Internal control and audit
Actual payment Issuance of check or requests of cash allocation to DepED CO and/or DBM CO and ROs LDDAP
From DBM CO or ROs in the form of ABM & SAROs
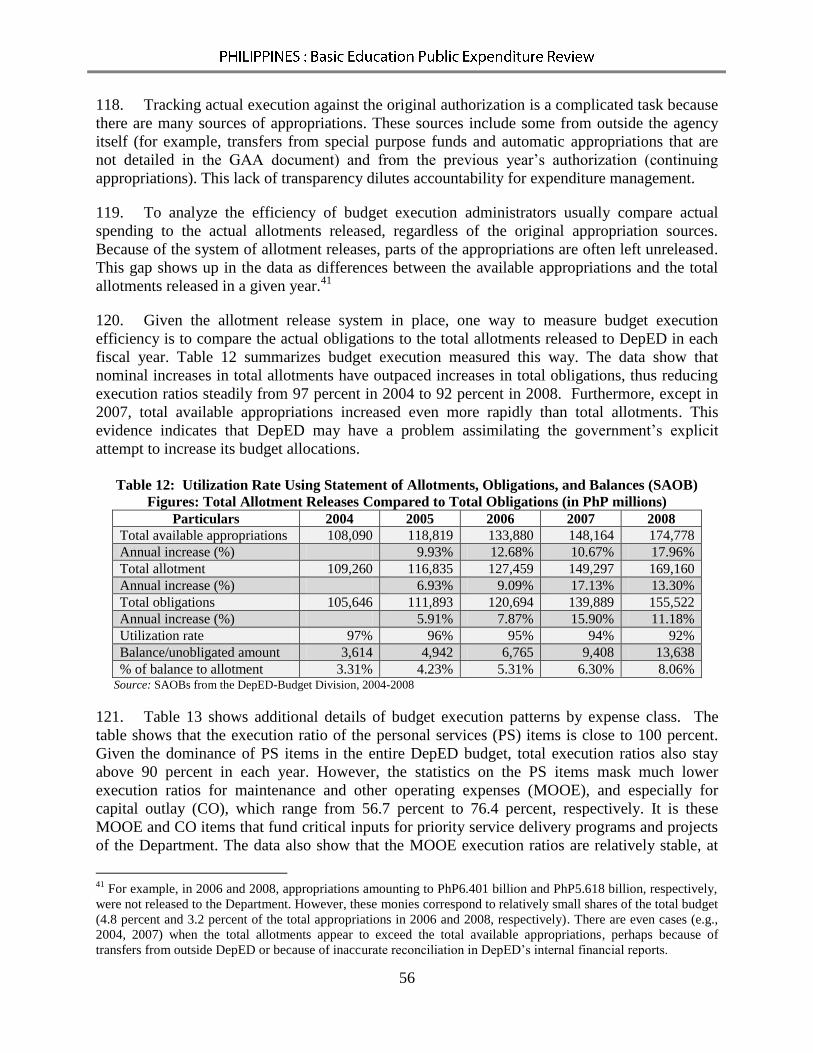
56
118. Tracking actual execution against the original authorization is a complicated task because
there are many sources of appropriations. These sources include some from outside the agency
itself (for example, transfers from special purpose funds and automatic appropriations that are
not detailed in the GAA document) and from the previous year’s authorization (continuing
appropriations). This lack of transparency dilutes accountability for expenditure management.
119. To analyze the efficiency of budget execution administrators usually compare actual
spending to the actual allotments released, regardless of the original appropriation sources.
Because of the system of allotment releases, parts of the appropriations are often left unreleased.
This gap shows up in the data as differences between the available appropriations and the total
allotments released in a given year.41
120. Given the allotment release system in place, one way to measure budget execution
efficiency is to compare the actual obligations to the total allotments released to DepED in each
fiscal year. Table 12 summarizes budget execution measured this way. The data show that
nominal increases in total allotments have outpaced increases in total obligations, thus reducing
execution ratios steadily from 97 percent in 2004 to 92 percent in 2008. Furthermore, except in
2007, total available appropriations increased even more rapidly than total allotments. This
evidence indicates that DepED may have a problem assimilating the government’s explicit
attempt to increase its budget allocations.
Table 12: Utilization Rate Using Statement of Allotments, Obligations, and Balances (SAOB)
Figures: Total Allotment Releases Compared to Total Obligations (in PhP millions)
Particulars 2004 2005 2006 2007 2008
Total available appropriations 108,090 118,819 133,880 148,164 174,778
Annual increase (%) 9.93% 12.68% 10.67% 17.96%
Total allotment 109,260 116,835 127,459 149,297 169,160
Annual increase (%) 6.93% 9.09% 17.13% 13.30%
Total obligations 105,646 111,893 120,694 139,889 155,522
Annual increase (%) 5.91% 7.87% 15.90% 11.18%
Utilization rate 97% 96% 95% 94% 92%
Balance/unobligated amount 3,614 4,942 6,765 9,408 13,638
% of balance to allotment 3.31% 4.23% 5.31% 6.30% 8.06% Source: SAOBs from the DepED-Budget Division, 2004-2008
121. Table 13 shows additional details of budget execution patterns by expense class. The
table shows that the execution ratio of the personal services (PS) items is close to 100 percent.
Given the dominance of PS items in the entire DepED budget, total execution ratios also stay
above 90 percent in each year. However, the statistics on the PS items mask much lower
execution ratios for maintenance and other operating expenses (MOOE), and especially for
capital outlay (CO), which range from 56.7 percent to 76.4 percent, respectively. It is these
MOOE and CO items that fund critical inputs for priority service delivery programs and projects
of the Department. The data also show that the MOOE execution ratios are relatively stable, at
41
For example, in 2006 and 2008, appropriations amounting to PhP6.401 billion and PhP5.618 billion, respectively,
were not released to the Department. However, these monies correspond to relatively small shares of the total budget
(4.8 percent and 3.2 percent of the total appropriations in 2006 and 2008, respectively). There are even cases (e.g.,
2004, 2007) when the total allotments appear to exceed the total available appropriations, perhaps because of
transfers from outside DepED or because of inaccurate reconciliation in DepED’s internal financial reports.

57
least in the three years examined here, but those of CO fluctuate. This difference is not
surprising, given the lumpy nature of capital expenditures. However, CO items managed by
DepED tend not to be so lumpy, since most of them are school or classroom construction
projects. These are relatively small-scale works, unlike, for example, major roads projects, and
can be completed within a fiscal year. This fact implies that there may be some additional
constraints to efficient execution of CO items beyond the usual lumpiness of capital investment
projects.
Table 13: Utilization Rate Using SAOB Figures: Total Allotment Releases Compared to Total
Obligations, by Object of Expenditure (in PhP millions)
2006 2007 2008
PS* Allotment 99,405 107,884 118,352
Obligations 99,231 99.8% 107,494 99.6% 119,305 100.8%
Current 99,227 100.0% 107,438 99.9% 119,191 99.9%
Continuing 4 0.0% 56 0.1% 114 0.1%
MOOE Allotment 14,126 22,654 25,771
Obligations 10,148 71.8% 16,286 71.9% 19,044 73.9%
Current 9,094 89.6% 10,851 66.6% 12,313 64.7%
Continuing 1,054 10.4% 5,435 33.4% 6,731 35.3%
CO Allotment 5,346 7,560 9,051
Obligations 3,028 56.7% 5,782 76.4% 5,856 64.7%
Current 1,344 44.4% 3,342 57.8% 3,584 61.2%
Continuing 1,684 55.6% 2,440 42.2% 2,272 38.8%
Total Allotment 118,877 138,098 153,174
Obligations 112,407 94.6% 129,562 93.8% 144,205 94.1%
Current 109,665 97.6% 121,631 93.9% 135,088 93.7%
Continuing 2,742 2.4% 7,931 6.1% 9,117 6.3% * Net of automatic appropriations for Retirement and Life Insurance Premiums (RLIP)
Source: SAOBs from the DepED-Budget Division, 2006-2008
122. Further disaggregation shows that sizable shares of the obligations against the previous
year’s authorizations (continuing appropriations) were made for both MOOE and CO. In other
words, DepED is constantly executing its backlog budget, which serves as additional evidence
that it is facing absorptive capacity constraints.
Case Studies of Program/Activity/Project (PAP) Budget Execution
123. To better understand the specific nature of the budget execution problems and the
constraints that DepED may be facing in expediting utilization of the appropriated funds, we
examined in detail the execution performance of four DepED programs/projects: (i) School
Furniture Program; (ii) School Building Program;42
(iii) Procurement of Textbooks; and (iv)
Hiring of New Teachers covering the period 2004-07.43
The school furniture and school building
42
The official name of the program is Construction of Elementary and Secondary School Buildings in Areas
Experiencing Acute Classroom Shortage. 43
A close examination of the budget execution system of these centrally managed programs was done at the DepED
Central Office level. We obtained examples through field visits to DepED Regional Office (RO) – Region VII
(Central Visayas) and the School Division Offices (SDOs) of Cebu City, Cebu Province, Mandaue City, and Lapu-
Lapu City. In the National Capital Region (NCR), we held interviews at various offices of DepED-Central Office,

58
items comprise 56 percent to 74 percent, respectively, of the capital outlays for the period. The
lumpsums for textbooks represent 9 percent to 12 percent, of total MOOE.
124. The four items chosen for the case studies illustrate different areas of budget execution.
Three of these are lump-sum programs. The School Furniture Program and the School Building
Program are subject to the sub-allotment procedures within DepED. DepED acquires textbooks
at the Central Office level and distributes them at the lower level units. Hiring of new teachers
involves an entirely different set of procedures since it has to do with management of personnel.
125. For the case studies we first established the extent of under-utilization of the appropriated
budget. We did so by collecting data on budget releases and obligations. To identify the
bottlenecks we determined the chronology of budget execution for each program, the points
during the budget execution process where there were delays. To find out why budget execution
was delayed we interviewed DepED officials involved in the specific aspect of program
implementation. And we formulated an interpretation of probable systematic causes of the
underperformance for the selected Program/Activity/Projects (PAPs).
126. Execution by Selected Program/Activity/Project (PAP): Table 14 shows the budget
execution ratios of the four programs selected for this analysis. The data show that the
Government increased appropriations to all the programs except the School Furniture Program,
which remained at the same level from 2005 to 2007. Allotments follow a similar pattern of
increases, again except for the School Furniture Program. Obligations for the three programs also
increased, especially in 2008.
127. The stagnant execution ratios of the Textbook and the School Furniture Programs make it
clear that when the cumulative execution ratios fall below 100 percent in two consecutive years,
some amounts of the original appropriation always lapse at the end of the second year. However,
the execution performance of the School Building Program appears to be more positive,
especially in 2007-2008. Although 2008 saw a sizable increase in the amount of obligations in
the hiring of new teachers, this increase was still less than the increase in the appropriation. In
2008 alone, about PhP 2 billion would have lapsed at the end of the year.
128. For all programs, 2005 and 2006 appear to have been bottleneck years. Except for the
hiring of new teachers in 2005, all four programs showed low execution ratios. The case studies
explore some of the probable causes of the poor execution performance observed in those years.
Although some of the causes may have been temporary, others are likely to be recurring, or even
systemic, problems.
and at DepED RO-NCR and DepED-SDO of Quezon City. We also gathered data from DBM-Central Office Budget
Management Bureau (BMB) B and DBM Regional Office – NCR.
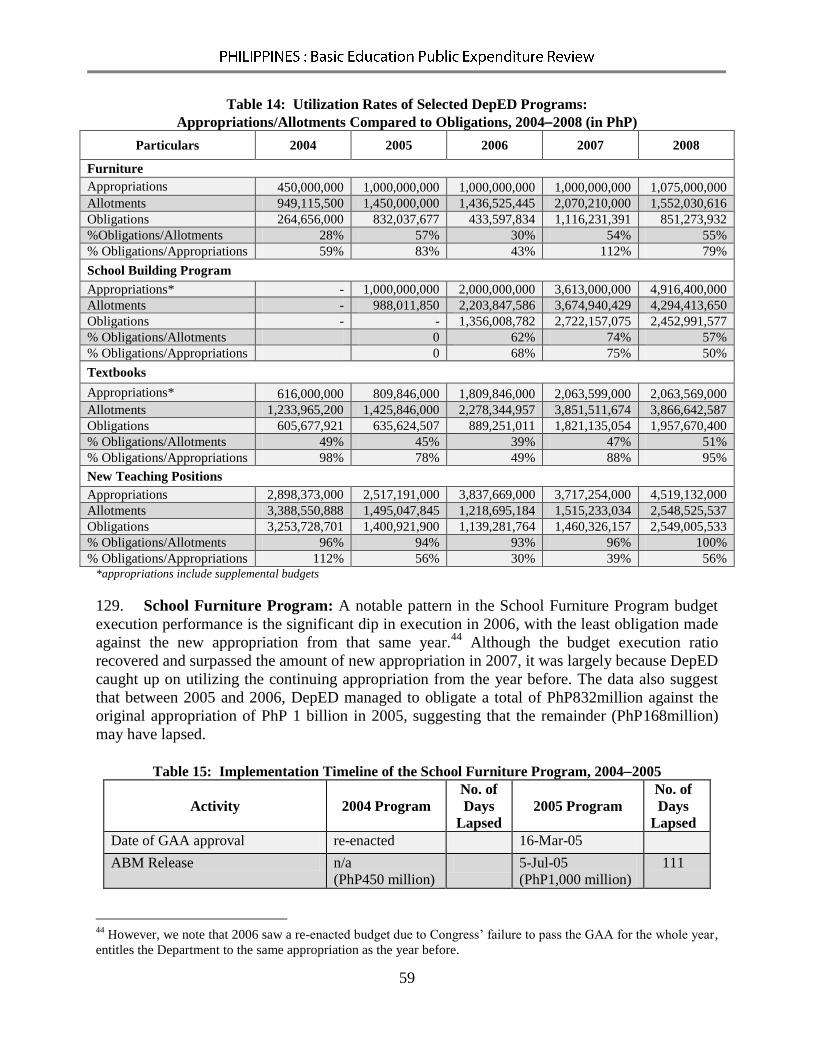
59
Table 14: Utilization Rates of Selected DepED Programs:
Appropriations/Allotments Compared to Obligations, 20042008 (in PhP)
Particulars 2004 2005 2006 2007 2008
Furniture
Appropriations 450,000,000 1,000,000,000 1,000,000,000 1,000,000,000 1,075,000,000
Allotments 949,115,500 1,450,000,000 1,436,525,445 2,070,210,000 1,552,030,616
Obligations 264,656,000 832,037,677 433,597,834 1,116,231,391 851,273,932
%Obligations/Allotments 28% 57% 30% 54% 55%
% Obligations/Appropriations 59% 83% 43% 112% 79%
School Building Program
Appropriations* - 1,000,000,000 2,000,000,000 3,613,000,000 4,916,400,000
Allotments - 988,011,850 2,203,847,586 3,674,940,429 4,294,413,650
Obligations - - 1,356,008,782 2,722,157,075 2,452,991,577
% Obligations/Allotments 0 62% 74% 57%
% Obligations/Appropriations 0 68% 75% 50%
Textbooks
Appropriations* 616,000,000 809,846,000 1,809,846,000 2,063,599,000 2,063,569,000
Allotments 1,233,965,200 1,425,846,000 2,278,344,957 3,851,511,674 3,866,642,587
Obligations 605,677,921 635,624,507 889,251,011 1,821,135,054 1,957,670,400
% Obligations/Allotments 49% 45% 39% 47% 51%
% Obligations/Appropriations 98% 78% 49% 88% 95%
New Teaching Positions
Appropriations 2,898,373,000 2,517,191,000 3,837,669,000 3,717,254,000 4,519,132,000
Allotments 3,388,550,888 1,495,047,845 1,218,695,184 1,515,233,034 2,548,525,537
Obligations 3,253,728,701 1,400,921,900 1,139,281,764 1,460,326,157 2,549,005,533
% Obligations/Allotments 96% 94% 93% 96% 100%
% Obligations/Appropriations 112% 56% 30% 39% 56% *appropriations include supplemental budgets
129. School Furniture Program: A notable pattern in the School Furniture Program budget
execution performance is the significant dip in execution in 2006, with the least obligation made
against the new appropriation from that same year.44
Although the budget execution ratio
recovered and surpassed the amount of new appropriation in 2007, it was largely because DepED
caught up on utilizing the continuing appropriation from the year before. The data also suggest
that between 2005 and 2006, DepED managed to obligate a total of PhP832million against the
original appropriation of PhP 1 billion in 2005, suggesting that the remainder (PhP168million)
may have lapsed.
Table 15: Implementation Timeline of the School Furniture Program, 20042005
Activity 2004 Program No. of
Days
Lapsed 2005 Program
No. of
Days
Lapsed Date of GAA approval re-enacted 16-Mar-05
ABM Release n/a (PhP450 million)
5-Jul-05 (PhP1,000 million)
111
44
However, we note that 2006 saw a re-enacted budget due to Congress’ failure to pass the GAA for the whole year,
entitles the Department to the same appropriation as the year before.
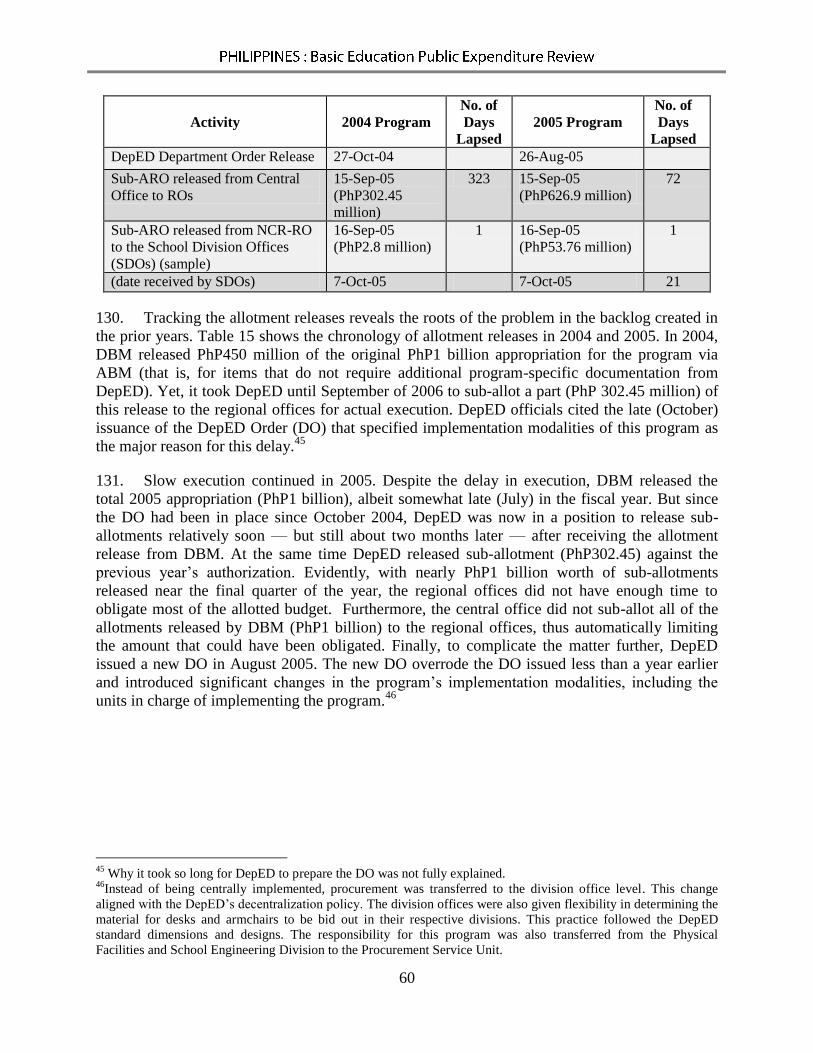
60
Activity 2004 Program No. of
Days
Lapsed 2005 Program
No. of
Days
Lapsed DepED Department Order Release 27-Oct-04 26-Aug-05
Sub-ARO released from Central
Office to ROs 15-Sep-05 (PhP302.45
million)
323 15-Sep-05 (PhP626.9 million)
72
Sub-ARO released from NCR-RO
to the School Division Offices
(SDOs) (sample)
16-Sep-05 (PhP2.8 million)
1 16-Sep-05 (PhP53.76 million)
1
(date received by SDOs) 7-Oct-05 7-Oct-05 21
130. Tracking the allotment releases reveals the roots of the problem in the backlog created in
the prior years. Table 15 shows the chronology of allotment releases in 2004 and 2005. In 2004,
DBM released PhP450 million of the original PhP1 billion appropriation for the program via
ABM (that is, for items that do not require additional program-specific documentation from
DepED). Yet, it took DepED until September of 2006 to sub-allot a part (PhP 302.45 million) of
this release to the regional offices for actual execution. DepED officials cited the late (October)
issuance of the DepED Order (DO) that specified implementation modalities of this program as
the major reason for this delay.45
131. Slow execution continued in 2005. Despite the delay in execution, DBM released the
total 2005 appropriation (PhP1 billion), albeit somewhat late (July) in the fiscal year. But since
the DO had been in place since October 2004, DepED was now in a position to release sub-
allotments relatively soon — but still about two months later — after receiving the allotment
release from DBM. At the same time DepED released sub-allotment (PhP302.45) against the
previous year’s authorization. Evidently, with nearly PhP1 billion worth of sub-allotments
released near the final quarter of the year, the regional offices did not have enough time to
obligate most of the allotted budget. Furthermore, the central office did not sub-allot all of the
allotments released by DBM (PhP1 billion) to the regional offices, thus automatically limiting
the amount that could have been obligated. Finally, to complicate the matter further, DepED
issued a new DO in August 2005. The new DO overrode the DO issued less than a year earlier
and introduced significant changes in the program’s implementation modalities, including the
units in charge of implementing the program.46
45
Why it took so long for DepED to prepare the DO was not fully explained. 46
Instead of being centrally implemented, procurement was transferred to the division office level. This change
aligned with the DepED’s decentralization policy. The division offices were also given flexibility in determining the
material for desks and armchairs to be bid out in their respective divisions. This practice followed the DepED
standard dimensions and designs. The responsibility for this program was also transferred from the Physical
Facilities and School Engineering Division to the Procurement Service Unit.

61
Figure 22: Budget Utilization of the School Furniture Program, 20042008
Source: DepED-Budget Division
132. In 2006, the Government operated under a re-enacted 2005 budget. DepED obtained the
same PhP 1 billion appropriations for the School Furniture Program as in 2005. However,
because of the implementation setbacks experienced in 2003 and 2004 and having the guidelines
for the 2005 program issued only in the latter part of 2005, and because sub-allotments to
division offices for the 2006 program were issued only on February 14, 2007,DepED was unable
to implement any of the 2006 appropriation during the year, On February 20, 2007, DepED
issued the guidelines for the 2006 School Furniture Program (DepED Order No. 12, s.2007). As
Figure 22 shows, the backlog continued to reduce execution efficiency in 2007, when DepED
failed to obligate most of the 2007 appropriation for the program.
133. Contrary to assertions that delays in budget execution result from DBM’s tight control of
allotment releases, our detailed review of the execution of the School Furniture Program, at least
for 20042007, locates the main source of the weakness inside DepED. One of the main reasons
for the repeated delays in releasing sub-allotments and execution of the program appears to be
the frequent changes in DepED's policies and guidelines for implementing the program. This
problem may be because the years 2004-2006 were a turbulent period for DepED with the
sudden departure of the secretary, the introduction of BESRA, and the implementation of a
number of changes in the ways programs were managed. For example, issuing two DOs in less
than a year was a direct result of the change of leadership and the corresponding change in the
Department’s approach to the program. Although it is legitimate for new leadership to introduce
new approaches, even if there were only a temporary instability in the Department’s policies it
clearly affected execution efficiency of the program and had negative effects lasting more than a
year or two.
134. School Building Program: DepED’s experience with the School Building Program in
2004-2008 reveals other causes of execution problems. Figure 23 shows that this program also
suffered considerable execution delays in this period, with no activity whatsoever recorded in
0.45
1.00
0.45
1.00 1.00
0.11
1.08
0.13 0.25
0.38
0.43
1.00
0.73
0
0.2
0.4
0.6
0.8
1
1.2
Budget Obligations Budget Obligations Budget Obligations Budget Obligations Budget Obligations
2004 2005 2006 2007 2008
Ph
P b
illio
ns
Current Continuing

62
2005 and less than half of the appropriation obligated in 2006. Although the amount executed
increased in 2007, the ratio remained low despite the increase in appropriation that year.
Figure 23: Budget Utilization of the School Building Program, 2005—2008
Source: DepED-Budget Division
135. This case is partly a story of a new policy causing start-up delays similar to the case of
the School Furniture Program. Until 2005, the School Building Program had been the main
responsibility of the Department of Public Works and Highways (DPWH), although DepED had
also been managing 10 percent of the Program’s budget from year 2000. But since 2005, DepED
has received appropriations for building schools directly in areas experiencing acute classroom
shortage. DPWH has also continued to implement a School Building Program funded from a
Special Purpose Fund. For DepED, the newness of this program resulted in some initial changes
in the way programs were implemented.
136. Two other problems are DepED’s need to follow legal mandates and to negotiate with
outside actors, such as members of Congress, local chief executives, and certain civil society
organizations (CSOs) in selecting specific sites for school building construction. The first step in
the execution of the project is to prepare a priority list of recipient schools at which DepED
hopes to build new classrooms. DepED uses the BEIS and the color-coding scheme to identify
these schools. In addition, DepED is obliged by Republic Act 7884 (the Roxas Law) to consult
with and receive consent from representatives of each legislative district concerned. Anecdotes
suggest that this process can become lengthy if the legislators are not readily available for
consultations or do not agree with DepED’s priority list.
137. Initial uncertainty and delayed determination of basic policy on the program
implementation also contributed to DepED’s failure to obligate the allotment in 2005. In
interviews, DepED officials cited several reasons for this delay. First, the unit in charge, the
Central Office’s Physical Facilities and Schools Engineering Division (PFSED), became
1.00
2.00
0.47
3.60
2.40
4.90
1.90 0.89
0.34
0.51
0.00
1.00
2.00
3.00
4.00
5.00
6.00
Budget Obligations Budget Obligations Budget Obligations Budget Obligations
2005 2006 2007 2008
Ph
P b
illio
ns
Current Continuing

63
operational only in January 2005. However, it was not yet fully prepared to formulate and issue a
new policy immediately, since the School Building Program was new for DepED. Furthermore, a
particular provision in the GAA required DepED to prioritize implementation by LGUs and
NGOs, such as the Federation of Filipino-Chinese Chambers of Commerce and Industry, Inc.
(FFCCCII), even though this provision appeared to contravene the Implementing Rules and
Regulation of the Procurement Law (Republic Act 9184) issued in 2004. Confusion over which
legal requirement prevailed temporarily paralyzed DepED. Once DepED chose to effect part of
the program through LGUs and the FFCCCII, it was further slowed by having to wait for LGUs
to voluntarily submit letters of intent, and for the FFCCCII to choose project sites first. DepED
was to cover areas not chosen by the FFCCCII, but the latter’s delay in identifying their project
sites hampered DepED from implementing its portion of the program.
138. Hence, in contrast to the School Furniture Program, what stands out in the case of the
School Building Program is the effect of externally imposed requirements, such as the legal
requirements inserted by the legislators that required program administrators to follow certain
procedures for program implementation. There were also internal causes of delay, much like the
case of the School Furniture Program. The School Building Program started in 2005, which
precisely coincided with the period of turbulence in DepED. The changes in leadership led to
repeated issuing of DepED orders on the program’s implementation guidelines as well as
specific changes in the way the program was to be implemented (Table 16).
Table 16: Key Changes in the School Building Program Implementation Modalities, 20052007
2005 Program 2006 Program 2007 Program
Guidelines
(Date,
Secretary/OIC)
DepEDOrder No.4, s. 2005
(5/4/2005, Abad)
DepEDOrder No.32, s. 2005
(6/14/05, Bacani)
DepEDOrder No.65, s. 2005
(12/29/05, Hidalgo)
DepEDOrder No.3, s. 2006
(1/24/06, Hidalgo)
DepEDOrder No.10, s.
2007
(2/9/2007, Lapus)
Mode of
Implementation
1st priority – construction by
NGOs such as FFCCCII;
2nd
priority – construction by
LGU and PTCA;
3rd
priority – construction by
DepED through contracting
To be undertaken by
DepED through contracting
or under Memorandum of
Agreement (MOA) between
LGU and DepED SDO
To be undertaken by
DepED through
contracting using
Principal-led Scheme
or by LGU through
MOA
139. Textbook Procurement: Among the reforms that followed the implementation of the
2001 Governance of Basic Education Act was a new Textbook Policy (2004).47
To ensure
47
DepED Memorandum No. 289, s.2004. “Textbook Policy”.

64
uniform and quality learning nationwide, the new policy adopted standardized titles and
synchronized purchases.48
140. The execution ratios of the textbook program were generally better than for the previous
two programs, except in 2004 when DepED failed to obligate any part of the PhP616 million
appropriations for the program. Nevertheless, the patterns in budget execution were similar in
terms of the dominance of the backlog from the previous year’s appropriations. Further, the
levels of obligations could not keep pace with the rates of increases of the appropriations at least
in 2005-2007 (Figure 24).
Figure 24: Budget Utilization of the Textbook Procurement Program, 2004-2008
Source: DepED-Budget Division
141. A particular feature of the textbook program was that procurement-related delays were a
major source of execution problems. The development of the textbook content had once been the
responsibility of the Instructional Materials Corporation of the DepED. However, since the
passing of the Book Publishing Industry Development Act (Republic Act 8047) in 1995, this
responsibility was shifted to private publishers.
142. In creating its List of Approved Textbooks, DepED oversees an evaluation process that
includes the expert judgment of academicians, administrators, and curriculum specialists.49
Textbooks must pass or be approved by three of the four evaluators to get on the approved list.
The evaluation of textbooks is based on both content and form. Prior to the introduction of the
48
Before 2004, the textbook program had many titles for each subject, different texts for the same grade or year
level, and errors in content. 49
The evaluation process involves two levels: private-sector review of materials by two reviewers, and DepED’s
own evaluation, in which two reviewers come from either the Bureau of Elementary Education or the Bureau of
Secondary Education).
0.61
0.01
0.81
0.005
1.80
0.25
2.10
0.11
2.10
0.30
0.60 0.63
0.64
1.70
1.7
0.00
0.50
1.00
1.50
2.00
2.50
Budget Obligations Budget Obligations Budget Obligations Budget Obligations Budget Obligations
2004 2005 2006 2007 2008
Ph
P b
illio
ns
Current Continuing

65
current process and in response to a scandal about the quality of textbooks, evaluation could take
from two weeks to a month per book on average. The length of time needed depended on
whether it was an elementary or high school book. The new four-step process doubles the time
for evaluation, including revisions, if any, from 45 days to three months. Assuming no delay, the
entirety of the four-step evaluation process shown below can add up to 245 calendar days.50
Table 17: Textbook Evaluation and Procurement Process for Title and Content
Step 1. DepED issues a Textbook Call. Step 2. Publishers submit textbooks and teacher’s manual (TXs/TMs). Step3. DepED-IMCS processes TXs/TMs and identifies/contracts evaluators/reviewers. Step 4. DepED-IMCS conduct and manage content evaluation focusing on three main
elements – the evaluation is divided into four groups: - Coverage of Learning Competencies (LCs) - Subject Matter Content - Presentation and Language
Step 5. An independent committee computes the aggregate of weighted ratings by the four
separate groups to determine the ranking of the TXs/TMs. Step 6. DepED- IMCS releases copies of Team Evaluation Rating Sheets and TXs/TMs with
marginal notes to concerned publishers. Step 7. Publishers whose TXs/TMs have aggregate weighted ratings greater than or equal to
the cut-off score submit to the DepED-BAC sealed offers for the copyright
authorization fee. Step 8. DepED determines the TXs/TMs to be printed and delivered based on weighted ranks
for quality and price. Step 9. Publishers make the necessary revisions on the TXs/TMs in preparation for DepED
bidding for printing and delivery. Source: DepED-IMCS 2007 TX Call Guidelines for Elementary Math, Science & Health, and English.
143. The next stage of procurement is the supply and delivery of books.51
Based on the
allocation list prepared under the GAA of 1999 and refined under the World Bank-funded Social
Expenditure Management Project and Third Elementary Education Project, regions are allocated
their budgets for their particular purchases. The procurement process for the supply and delivery
of textbooks can take up to 242 days from bid opening to delivery. Previously, preparation for
the procurement took only 47 days.
Table 18: Procurement Process for Textbook Printing and Delivery (242 days)
Steps No. of days required Step 1. Bid Call and Tendering 45* Step 2. Pre-Bid conference 1 Step 3. Bid Opening 1 Step 4. Technical and Financial Evaluation 15
50
“The Textbook Procurement Process,” PowerPoint presentation by Instructional Materials Council Secretariat
(IMCS) for the National Textbook Delivery Workshop, September 27, 2007. 51
Locally funded purchases are done on a regional basis, following national competitive rules. Foreign-assisted
purchases (for example, covered by the World Bank or donor-funded projects) procurement is done by zone (four
zones covering 16 regions), and uses international competitive bidding rules. The four zones are: Zone 1 (Northern
and Central Luzon Regions), Zone 2 (Metro Manila and Southern Luzon Regions), Zone 3 (Visayas Region), and
Zone 4 (Mindanao Regions).

66
Step 5. Deliberation and Awarding 15 Step 6. Contracting Period 15 Step 7. Printing Period 60 Step 8. Delivery Period 90 Total 242
*30-45 days standard per RA 9184/World Bank guidelines
Source:DepED-IMCS 2007 TX Call Guidelines for Elementary Math, Science & Health and English.
144. In total, the whole process, from title to delivery, can take more than 500 days for a new
book to reach the end-user’s hand. But again, this is only the average duration of the process.
The process can take even longer if it encounters some problems along the way. Even with the
two-year validity of MOOE appropriations, this length of time means that unless DepED is able
to start the process within the first semester of the first year of the appropriation’s validity, it runs
the risk of losing the appropriation before the procurement process is completed. Fortunately,
revision of the content happens only once every five years and subsequent supply will only
depend on reprinting and delivery.
145. In practice, procurement does not always go smoothly. DepED’s experience in 2005
illustrates the kinds of difficulty that can be faced by a government agency involved in a
complex procurement process. In 2005, the new Textbook Policy, which had been issued in July
2004, was still being operationalized. Coincidentally, DepED was in the process of updating
instructional materials and curriculum. Doing so required the review and re-evaluation of the old
textbooks, and the purchase, if needed, of a new batch of textbooks and teachers’ manuals
(TXs/TMs). Finally, the reform of the DepED procurement process was too recent for the system
to be ready. DepED itself was going through several simultaneous changes in policy and
operations. Thus, the education bureaucracy had to respond to the high degree of uncertainty that
characterized the internal environment.
146. During the latter part of 2005, IMCS and the DepED Procurement Service began
preparation for the purchase of 15 million new elementary textbooks (PhP810 million worth of
books). Between October and December 2005, DepED issued a request for bids, to which 18
bidders responded. The process took its course and actual textbook deliveries occurred between
January and February 2007. From tender to actual delivery of textbooks to end-users, the
procurement took nearly 17 months. If the pre-procurement stage which took six months, is
added, then the entire process took 23 months.
Table 19: Actual Chronology of Events: Supply and Delivery of Sibika 1-3, HEKASI 4-6 and
Araling Panlipunan 1-4 (Under SEMP 2005)
Procurement Stage Date Completed Start of Tendering Process October 2005 Submission of Bids December 9, 2005 Completion of Technical and Financial Assessments February 2006 Request to Award May 30, 2006 Notice to World Bank on Awards June 13, 2006 Notice of Award to Suppliers June 15, 2006 Notice to Proceed/Letter of Credit September 2006 Start of Printing September 15, 2006 Start of Delivery November 20, 2006

67
147. Yet again, budget execution in 2006 experienced a backlog effect. Since the 2005
textbook budget of PhP 810 million was unspent, it was carried over in its entirety for
implementation in 2006. The Department also received an additional PhP 810 million from the
2006 budget, re-enacted on the basis of the 2005 budget. Finally, a supplemental budget was
passed in October to add PhP1 billion, increasing the 2006 appropriation to PhP 1.81 billion.
Altogether, these three sources of appropriations meant that the Department had PhP2.62 billion
in appropriations available for its textbook purchase in 2006.
148. During the entire year of 2006 DepED managed to obligate only PhP 889 million against
these relatively large appropriations. The SAROs issued by DBM on February 9 and July 11
divided this amount in two obligations. To facilitate implementation, the new secretary of
DepED decided to sub-allot the textbook funds to the regions. The releases were for the purchase
of textbooks and teacher’s manuals by Regional Offices (PhP 310 million), and to defray the
distribution and monitoring costs by the Division Offices (PhP 332 million). DepED also faced
the prospect of having PhP 549 million lapse from the continuing appropriation from 2005. Thus,
the department resorted to transferring the unexpended amount to the DBM-Procurement
Service.52
Table 20: Allotment Releases/Transfer, FY 2006
DBM Releases Purpose DepED Releases Amount SARO#B-06-00198 (February
9, 2006) Distribution and monitoring of TXs/
TMs by Division Offices
Sub-ARO to
Regional
Office/Division
Office(November
20, 2006)
PhP332 million
SARO#BMB-B-06-0000216
(July 11, 2006) Purchase of TXs /TMs
by Regional Offices Sub-ARO to
Regional
Office/Division
Office (July 13,
2006)
PhP310 million
Transfer to DBM-PS Request (December 20, 2006)
Programmed for the
procurement of
TXs/TMs
PhP549 million
Source: DepED Budget Accounts, SARO and Sub-ARO Releases for FY 2006
149. New Teacher Deployment: Because of constantly increasing enrollment and a
corresponding shortage of teachers in certain areas, the GAA provides a lump-sum allocation for
new staff positions. These monies comprise funding requirements for the creation of new
teaching and non-teaching positions for the current year; and funding requirement for the
teaching and non-teaching positions newly created in prior fiscal years, subject to actual
deployment to schools, SDOs, and newly legislated/established secondary schools. Unlike the
52
This was the second time DepED attempted to transfer the textbook procurement budget to DBM-Procurement
Service just before the appropriation was to lapse. COA has noted this as inconsistent with the government’s own
financial management rules.
Actual Delivery January-February 2007 Source: Second Social Expenditure Management Project (SEMP2) Project Completion Report, prepared by DepED-
Project Development and Evaluation Division (August 13, 2007).

68
three programs discussed earlier, the deployment of new teaching positions entails an additional
layer of complexity, because there are several agencies involved besides DepED itself. For
instance, DBM’s role is not limited to issuing SAROs and NCAs to DepED. Approvals of the
creation of new teacher items must be sent through the DBM Central Office and a Notice of
Salary Compensation Action (NOSCA) must be issued by DBM regional offices. Once the
teachers have been selected, their appointment papers have to be attested by the Civil Service
Commission (CSC), which validates the required documents submitted by the new teachers, after
verification by the Professional Regulatory Commission (PRC). The example illustrates how the
complexity of the administrative process involved in new teacher deployment contributes to slow
budget execution.
150. Table 21 summarizes the key steps taken in deployment of new teachers to selected
School Division Offices in Visayas (Region VII). After the GAA is passed with a line item for
new teacher hiring, the process starts with the DepED secretary requesting the DBM secretary to
create a certain number of new teaching positions. Unlike the School Furniture Program and the
School Building Program in which there were clear bottlenecks such as DepED Central Office’s
delay in issuing sub-allotments to the Regional Offices, the implementation of new teacher
deployment progresses through relatively stable intervals. Each critical milestone, such as DBM
approval of DepED’s original request, DBM issuance of NOSCA, etc., is cleared within about
one or two months. One step in the whole process that takes longer is the final clearance by the
CSC of the proposed recruitments. The CSC’s job is to attest to the proper professional
qualifications of the job applicants. The chronology in Table 21 shows that this final step of the
process can take four (as was the case for Mandaue City) to six months (as in Cebu Province).
According to the CSC regional office in Region VII we visited, the long delay is almost
inevitable, given their limited staffing vis-à-vis the work load. In this particular office, two CSC
employees handled as many as 2,000 applications of personnel actions each month.
151. The complexity of the entire process appears to be the main reason it takes so long to hire
and deploy new teachers. Nevertheless, a more detailed examination of the process in 2007
indicated that more careful, efficient management of the process by DepED could expedite some
of the steps. The following observations describe some instances in which DepED could have
handled some of the steps in the process more efficiently in 2007 (see Table 21):
(i) It took from April 2 to June 12 for the DBM Central Office to approve DepED’s request
for the creation of new teaching positions. This delay happened because in mid-May, DepED
submitted a revised allocation list that included new teaching positions allotted for special
groups such as madrasah, technical-vocational, and mobile teachers. Usually, it would only
take a month for DBM to issue the approval. Had DepED been able to submit a final list in
April, the DBM approval might have been obtained within the same month.
(ii)The issuance of NOSCA by the DBM RO across the SDOs took between one and six
weeks. According to a DBM Regional Director we interviewed, the DBM RO can usually
prepare the NOSCA within a week if there are no problems in the documents forwarded by
the DepED RO. However, problems can arise from delays in the submission of revised
deployment reports. Problems also emerge from the fact that it is only the Regional Director
(DBM) who can sign the NOSCA. Thus, when the director is absent/unavailable, the
NOSCA has to wait for his or her return. The variations in the NOSCA turnaround time

69
across SDOs suggest varying levels of accuracy in the submission of deployment reports by
these SDOs. Better handling of documents by some of the SDOs could have cut the
processing time.
Table 21: Implementation Timeline of New Teacher Deployment for Selected SDOs in Region VII,
2007
Document/Activity Responsibility
Center Division
of Cebu
City
Division of
Mandaue
City
Province of
Cebu Division of
Lapu-Lapu
City Request for creation of new
teaching positions From DepED
Central Office to
DBM Central
Office
2-Apr-07 2-Apr-07 2-Apr-07 2-Apr-07
Approval by DBM Central
Office and request for
deployment report
From DBM Central
Office to
DepEDCentral
Office
12-Jun-07 12-Jun-07 12-Jun-07 12-Jun-07
Allocation to ROs From
DepEDCentral
Officeto DepED
RO
18-Jun-07 18-Jun-07 18-Jun-07 18-Jun-07
Memo to SDOs From DepED RO to
DepED SDO 26-Jun-07 26-Jun-07 26-Jun-07 26-Jun-07
Submission of deployment
report to DepED RO DepED SDO 3-Aug-07
DepED RO endorsement of
deployment report to DBM RO DepED RO 13-Jul-07 9-Aug-07 14-Jul-07 5-Jul-07
Issuance of NOSCA DepED RO 27-Jul-07 16-Aug-07 21-Aug-07 27-Jul-07 Publication/Advertisement of
Vacancies DepED SDO 9-Aug-07 13-Jul-07 31-Aug-07 31-Jul-07
Signing of Appointment Paper
by SDOs DepED SDO 27-Aug-07 1-Sep-07 28-Sep-07 21-Aug-07
Transmittal to CSC of List of
Teachers to be Hired and their
required docs
DepED SDO Accredited
by CSC 25-Sep-07 13-Sep-07
Date stamp received by CSC 25-Sep-07 19-Oct-07
Attested by CSC 8-Jan-08 29-Jan-08 6-Nov-07
Released by CSC 24-Jan-08 04-Apr-08 05-Feb-08
152. Because the process of preparing the NOSCA and the CSC attestation is long and
circuitous, new teachers typically assume office several months after the school year starts. The
entire process, including CSC attestation, of deploying new teachers can take up to 10 months.
By the time all the required steps have been taken, it is typically January of the following year
before the new teacher can finally begin teaching. To have the teachers start earlier, some school
division superintendents risk having the new teachers report for work without the CSC
attestation. But even then, teachers are reporting in September, about two months after the start
of the school year.

70
153. Even though the SDOs we visited for this case study had relatively high capacity, were
well organized, and located in a highly urbanized area, it still took them a long time to have the
new teachers assume office. The situation is likely to be worse for SDOs with lower
administrative capacities. Such SDOs are often located in rural or remote areas. For SDOs in
Region VII, while schools wait for new teachers to assume office, other teachers must fill in. In
some cases, until the new teachers arrived the number of students per class reportedly rose from
45 to around 80 to 100 students.
154. Some of the delays were also due to inefficient handling of the steps by the SDOs. In
2007, the CSC disapproved a number of Region VII's applications. The CSC sent them back to
the SDOs because of one procedural deficiency or another, such as a missing document. Some
of the reasons cited were:
the candidate did not meet the rating requirement prior to promotion;
the item was not vacant;
the SDO failed to publish the vacancy announcement;
the announced position (item) was not found in the template;
the incumbent who “owned” the item as indicated in the appointment was different
from the one appearing in the template;
the agency template showed that the item belonged to someone other than the
applicant;
the position was filled before 10 calendar days from the publication of the vacancy
announcement.
155. The data show that virtually all of the disapprovals emanated from the one SDO that
covered the entire province of Cebu outside of the cities in the metro Cebu area. This finding
suggests a possible mismatch between the work load and the SDO’s administrative capacity.
Table 22: Number of Appointment Papers Received and Disapproved
DepED-Cebu Province
Jan Feb Mar Apr May June Jul Aug Sep Oct Nov Dec Total
Appointments
Received 362 234 411 635 2 24 242 153 122 502 118 197 3,002
Disapproved 31 41 45 154 9 25 20 19 33 14 75 466
DepED-Lapu-Lapu
Jan Feb Mar Apr May June Jul Aug Sep Oct Nov Dec Total
Appointments
Received 2 33 34 3 31 82 88 48 8 36 365
Disapproved 1 3 1 5
DepED-Mandaue
Jan Feb Mar Apr May June Jul Aug Sep Oct Nov Dec Total
Appointments
Received 78 19 20 18 30 38 68 15 9 9 304
Disapproved 0 0 0 0 0 0 0 0 0 0 0 0 0 Source: CSC
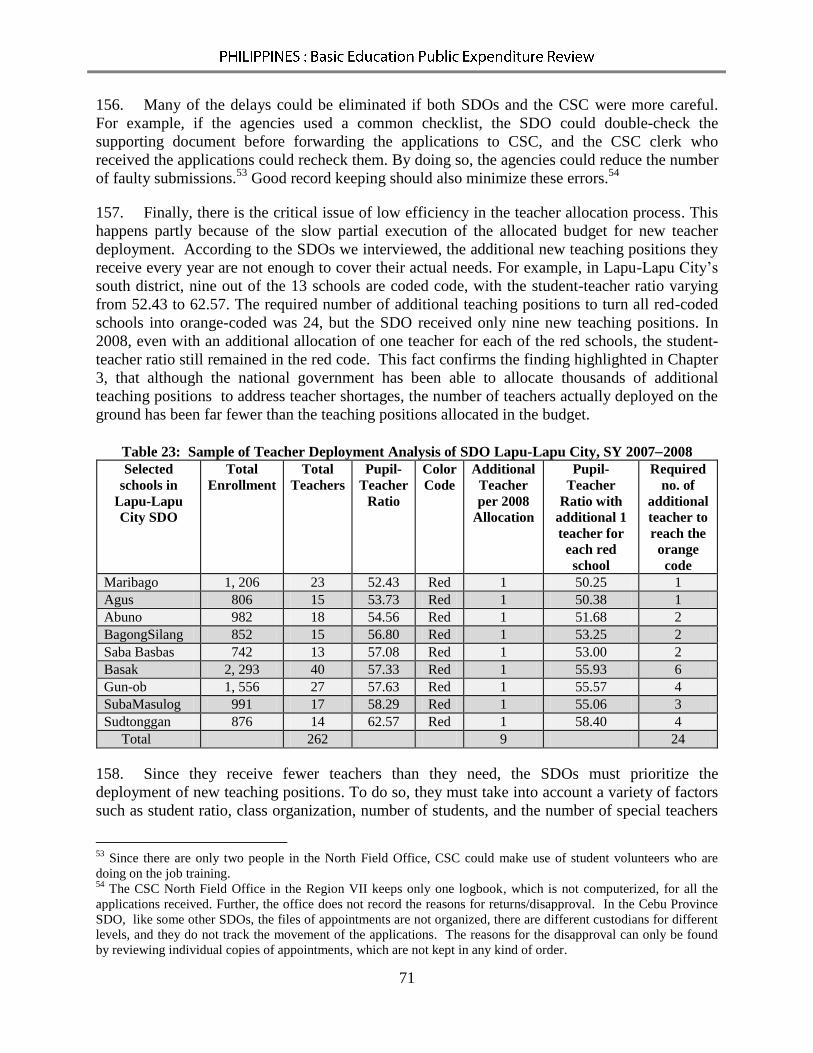
71
156. Many of the delays could be eliminated if both SDOs and the CSC were more careful.
For example, if the agencies used a common checklist, the SDO could double-check the
supporting document before forwarding the applications to CSC, and the CSC clerk who
received the applications could recheck them. By doing so, the agencies could reduce the number
of faulty submissions.53
Good record keeping should also minimize these errors.54
157. Finally, there is the critical issue of low efficiency in the teacher allocation process. This
happens partly because of the slow partial execution of the allocated budget for new teacher
deployment. According to the SDOs we interviewed, the additional new teaching positions they
receive every year are not enough to cover their actual needs. For example, in Lapu-Lapu City’s
south district, nine out of the 13 schools are coded code, with the student-teacher ratio varying
from 52.43 to 62.57. The required number of additional teaching positions to turn all red-coded
schools into orange-coded was 24, but the SDO received only nine new teaching positions. In
2008, even with an additional allocation of one teacher for each of the red schools, the student-
teacher ratio still remained in the red code. This fact confirms the finding highlighted in Chapter
3, that although the national government has been able to allocate thousands of additional
teaching positions to address teacher shortages, the number of teachers actually deployed on the
ground has been far fewer than the teaching positions allocated in the budget.
Table 23: Sample of Teacher Deployment Analysis of SDO Lapu-Lapu City, SY 20072008
Selected
schools in
Lapu-Lapu
City SDO
Total
Enrollment
Total
Teachers
Pupil-
Teacher
Ratio
Color
Code
Additional
Teacher
per 2008
Allocation
Pupil-
Teacher
Ratio with
additional 1
teacher for
each red
school
Required
no. of
additional
teacher to
reach the
orange
code
Maribago 1, 206 23 52.43 Red 1 50.25 1
Agus 806 15 53.73 Red 1 50.38 1
Abuno 982 18 54.56 Red 1 51.68 2
BagongSilang 852 15 56.80 Red 1 53.25 2
Saba Basbas 742 13 57.08 Red 1 53.00 2
Basak 2, 293 40 57.33 Red 1 55.93 6
Gun-ob 1, 556 27 57.63 Red 1 55.57 4
SubaMasulog 991 17 58.29 Red 1 55.06 3
Sudtonggan 876 14 62.57 Red 1 58.40 4
Total 262 9 24
158. Since they receive fewer teachers than they need, the SDOs must prioritize the
deployment of new teaching positions. To do so, they must take into account a variety of factors
such as student ratio, class organization, number of students, and the number of special teachers
53
Since there are only two people in the North Field Office, CSC could make use of student volunteers who are
doing on the job training. 54
The CSC North Field Office in the Region VII keeps only one logbook, which is not computerized, for all the
applications received. Further, the office does not record the reasons for returns/disapproval. In the Cebu Province
SDO, like some other SDOs, the files of appointments are not organized, there are different custodians for different
levels, and they do not track the movement of the applications. The reasons for the disapproval can only be found
by reviewing individual copies of appointments, which are not kept in any kind of order.

72
who are underloaded. To address the shortfall in the number of teachers, some SDOs set up night
classes to accommodate the growing number of enrollees. However, night school could not be
sustained because of the lack of teachers for the second shift.
Conclusion
159. By using an in-depth case study approach, our analysis of the operational efficiency of
the DepED budget has revealed many deficiencies that have important implications for
participation, retention, completion, and learning achievement. The four budget items we chose
for the case studies are not fully representative of the DepED budget execution as a whole, but
they are critical components of the Department’s CO and MOOE budgets. Efficient execution of
each of these components is essential if DepED is to narrow input shortages in textbooks,
classrooms, and teachers.55
160. The case studies show slow, incomplete budget execution by DepED, quantified the
extent of inefficiency in terms of delay and the lapsing of appropriations, and suggested several
possible causes of these weaknesses. First, much of the delay has been caused by DepED’s
inability to expedite the process. Contrary to frequent allegations that slow budget execution is
due to DBM’s slowness or refusal to release the budget, more often DepED was unable to sub-
allot the released allotments to continue the budget execution process smoothly.56
161. In our initial interviews, weak financial management capacities within DepED were
mentioned as an important source of operational inefficiency. Capacity limitations may be a
valid constraint, but the case studies suggest that more important systemic causes are uncertainty
or instability in the policy environment and excessive complexity in certain administrative
procedures. Policy uncertainty/instability is sometimes caused by DepED’s need to interact with
external actors, be they legislators whose consent is virtually required for the selection of
55
A possible limitation of this particular set of case studies is that the period chosen for the analysis, 20042007,
may be an anomalous period, given the extent of policy and operational changes DepED introduced during those
years. If this period is atypical, then recurrence of severe budget execution problems that we observed in some of the
years may be less likely to repeat themselves in the future. However, there is some evidence to suggest that weak
budget execution has been a recurring problem beyond this study's specific time period. For example, the World
Bank-ADB (2003: 70) joint public expenditure review referred to budget execution problems in “the purchase of
textbooks and desks, the hiring of new teachers and non-formal education programs.” The reported obligation-to-
allotment ratio for textbooks in 1997 and 1998 were 42 percent and zero, respectively. However, the report also
cited low allotment-to-appropriation ratios of 30 percent and 36 percent in 1996 and 1997, respectively. It is possible
that the low obligation-to-allotment ratios were due, at least partly, to the late releases of allotments, which would
limit both the allotment-to-appropriation ratios and the obligation-to-allotment ratios. Either way, the possibility that
our findings may be limited to a specific time period does not invalidate one of our main findings: that policy
changes slow down budget execution by creating uncertainty over the directions and the ways in which programs are
implemented. 56
The case studies did not examine the effect of the timing of NCA releases on budget execution, which is another
frequently alleged reason by line agencies for poor performance. The current transaction recording system of the
government does not permit the direct association of individual NCA requests and releases with specific allotments
and obligations. Therefore, it is possible that final execution of the budget (i.e., disbursement for payments against
services rendered/goods delivered) is even slower because of slow or partial releases of NCAs by DBM. However,
this possibility is immaterial to this study because we measure budget execution at the level of obligations rather
than by payments.

73
classroom construction sites, or with the CSC, which needs to sign off on new teacher attestation.
However, in other cases, DepED itself has been a source of policy instability and uncertainty.
162. The introduction of new policies created uncertainty. These new policies and
improvements were intended to improve DepED’s ability to provide quality education services in
a timely manner and were urgently needed, but the dilemma was, and is, that they have clearly
contributed to slow budget execution and hence, at least initially, to slow program delivery. Two
critical questions are, can DepED quickly learn new ways of operating, and can future changes
be introduced more gradually based on DepED’s realistic absorptive capacity.
163. These major findings lead to the following policy implications. First, as desirable as they
may be, policies, operational changes, or rule changes create a risk of implementation failure.
Therefore, ideally, DepED should carefully consider the operational impacts of new policies and
procedures before fully introducing them, or perhaps consider phased implementation.
164. Second, although it is more difficult to reduce external sources of operational uncertainty,
especially if these are legislative mandates, DepED could at least identify such sources
systematically and develop an advocacy plan to eliminate or reduce them, where possible. For
example, doing so could include a proposal to amend the Roxas Law or other legislation that
affects DepED operations.
165. Third, procedural complexity leads to operational inefficiency. The complexity in an
administrative procedure is usually due to the Government’s (or legislators’) desire to regulate
the bureaucracy, thus minimizing undesirable behavior such as corruption in procurement or
hiring of unqualified persons as teachers. However, these concerns should be balanced with
considerations of efficiency in service delivery. The case studies, especially of textbook
procurement and new teacher hiring, suggest that the balance may favor control at the cost of
efficiency. Selective reviews of administrative procedures that hinge on budget execution and
program delivery may be useful to identify those procedures that are truly excessive. It may be
possible to eliminate some steps or to institute alternative, more expeditious ways to achieve a
comparable level of control. Computerizing certain transactions would also expedite processing
of some procedures by speeding up the handling of paperwork and also reducing the scope for
human error.

74
Chapter 6 - Policy Recommendations: Making Expenditures Count
166. In 2005 the government introduced the Basic Education Sector Reform Agenda
(BESRA), a coherent reform agenda/policy framework. If judged by the initial, albeit modest,
gains achieved in outcomes and enhanced mobilization of resources, then the answers to
improving access to quality education are already in place. To be able to catch up with the level
of performance required to meet the MDG and EFA targets, the government need only ensure
that it steps up and sustains these reform efforts. However, the effectiveness of the reforms is
hampered by limited public resources available for the sector and by inefficiencies in the
utilization of available resources. In terms of allocation, the quality of spending for critical inputs
has improved, with more resources being directed towards critical inputs such as textbooks and
classrooms. However, the impact of spending is reduced by the insufficient volume of resources,
which cannot keep pace with the rapid population growth and the operational inefficiency in its
execution. Nevertheless, in terms of its geographic distribution, the quality of public spending is
still suboptimal, since it does not channel more resources to poorer regions in the country.
167. To take full advantage of initial gains and to translate its expected benefits more quickly
into desired outcomes, the government should complement the ongoing efforts by effecting the
following sets of additional measures. First, more resources need to reach students in need.
Accomplishing this goal means allocating more to basic education and improving operational
efficiency of budget execution. Second, DepED’s decision making must improve so that the
Department can devise specific policy interventions to adequately and promptly respond to
particular problems. Interventions should be based on objective data and sound analysis. Doing
so would address the issues of quantity, quality, equality, and efficiency that we discuss in this
report.
More and Better Managed Resources
168. The level of public resources currently devoted to basic education is not sufficient for the
Philippines to meet its MDG and EFA goals. The government needs to make more resources
available on a per-pupil basis and to implement a series of measures to make expenditures count.
Such measures range from reallocating the budget to be responsive to local needs and to
improving coordination between national and local governments to expediting budget execution.
A set of complementary actions would also be beneficial. These actions might include more
effective partnerships with the private sector, both as funders and providers, and with other
sectors of government that are in a position to help address causes of low enrollments and to
respond to basic learning needs outside the education sector. This objective can be accomplished
by a combination of the following strategies:
169. Increasing funding. The target should be to gradually increase per-pupil spending to a
level sufficient for providing quality education. Doing so would mean increasing the national
budget allocation to basic education over the medium term. However, sustainable increases may
only be possible with stronger efforts to collect revenues. To achieve MDG/EFA enrollment or
completion rate targets by 2015, DepED can estimate the total spending requirements based on
enrollment projections. The estimates may indicate that national and local government spending
would have to increase very substantially to a minimum of 3.2 percent of GDP by 2015 even if
other quality improvement measures are not accounted for. This minimum would increase to
75
more than 6 percent of GDP if pupil-teacher ratios are improved, more is spent on quality
improvement measures such as teacher training, and shifts in classroom use are eliminated.
However, we stress that an increase in the budget should be reinforced by a well-defined
expenditure plan indicating the short- and medium-term budget requirements needed to achieve
targets and fund its reform commitments. Such a plan would be a basis for seeking guaranteed
allotments in the medium term that would improve the predictability of resource flows and
spending for priorities.
170. Improving budget execution to ensure that allocated resources are effectively
utilized in a timely manner. Unless DepED’s capacity to execute its budget and implement
programs/projects is simultaneously enhanced, significant funding increases may not result in
corresponding improvements in outcomes. Improving budget execution could start with a review
of all relevant administrative actions. Doing so would identify where efficiency gains can be
made through simplifying and streamlining procedures while also ensuring transparency and
accountability. A longer-term agenda would include considerable investments in strengthening
the department’s key management capacities, including planning and procurement. The agenda
could also introduce internal management systems and practices that improve coordination
across units, and which clarify accountability of those responsible for specific aspects of program
and project implementation. Developing a good management information system (MIS) would
also be a worthwhile investment. Improving the way the BEIS data are updated and linked to
other MISs such as financial, procurement and asset management information systems would be
essential. Development of a financial MIS should be done in coordination with the oversight
agencies in charge of building a government-wide system (i.e., COA, DBM, and BTr).
171. Allocating resources in a manner that is more responsive to school-level needs and
that corresponds to minimum standards and goals. The report illustrates the importance of
avoiding school congestion, hence, the need to address classroom construction shortages. The
report also shows that it is important to provide adequate teaching and learning resources and a
sufficient number of qualified teachers. Until the government fully addresses the classroom
shortage, there must be an increase in the allocation for classroom construction. More should be
done through the more cost-effective principal-led scheme implemented by DepED than through
the DPWH modality. It is neither necessary, nor is it probably feasible in the short run, given the
fiscal constraint, for the public sector to provide all the required classrooms to increase
enrollment. DepED can and should rely more extensively on the Education Service Contracting
(ESC) scheme to leverage idle capacities in private schools.
172. Although there is sufficient number of teachers in elementary schools, the problem is
primarily in their geographic distribution and their quality and performance. In future rounds of
deployment, DepED should continue to target new teacher positions to the shortage divisions.
The proportion of new teaching positions allocated to the secondary schools should be increased
and, in consultation with the Department of Budget Management, DepED should undertake a
review of the administrative procedures for the transfer of vacant secondary teacher positions to
address serious shortages of teachers at the secondary level. It will be important to strengthen
DepED’s capacity to project future enrollments and plan for provision of the required level of
inputs. To develop a more concrete set of policy options for improving teacher quality and
performance, we recommend a detailed study of teacher management.

76
173. Both more and enough funds should be made available at the school level, where they
can do the most good. The application of the new equality-based school MOOE formula in the
DepED’s subsequent budgets would enable each school to address its own varying needs and
requirements. To minimize the risk of bottlenecks and delays in the decentralization and use of
resources, DepED must provide intensive training to develop the skills of the implementing units
in the procedures, reporting requirements, and accountabilities involved in the process of
downloading of funds. Simplification of, and greater transparency in, the downloading
procedures is an important requisite to facilitate the provision and utilization of resources.
174. Introducing explicit mechanisms to ensure more effective coordination of
expenditure assignments between DepED and LGUs. To provide for increased resources,
especially in poorer regions, national and local government spending on basic education should
be tightly coordinated. Doing so will require a stronger compact between national and local
governments, one which is designed to strengthen school-based management and to yield a more
equitable allocation of resources in areas such as teacher deployment, targeting of capital
expenditures, and provision of teaching and learning materials. This compact could include, for
example, DepED entering into an explicit agreement (e.g., via a memorandum of agreement) to
fund a specific number of additional teachers if the corresponding LGU built additional
classrooms according to the DepED specifications. The national government could also either
require matching grants from LGUs for NG assistance to minimize substitution, which usually
happens when LGUs reduce their education spending after receiving more national government
assistance for education, or to provide matching grants to relatively resource-poor localities.
Since DepED lacks legal authority to impose cooperation from LGUs, such schemes would work
only on a voluntary basis. It may be worthwhile to try several different schemes with willing
LGUs. Pilot projects would not only identify which approaches might work best, but also reveal
what practical obstacles might crop up in implementation. Hence, proper adjustments can be
introduced if the government were to decide to pursue such schemes more broadly.
175. Enhancing cross-sectoral collaboration, ensuring the link between demand- and
supply-side interventions. The government has recently launched a conditional cash transfer
(CCT) program called Pantawid Pamilyang Pilipino Program (4Ps). This program is expected to
boost parents’ incentives to keep their children in school by giving cash grants to households
with school-age children in exchange for continuous school attendance. Recent evaluations of
CCT programs in the Philippines and elsewhere demonstrate that such programs can target the
intervention to increase school enrollment and attendance. Studies in the Philippines have
identified poverty and the high opportunity cost of schooling, particularly for older boys, as a
key deterrent to completing school. Using the recently launched CCT in a well-targeted and
effective manner would be essential to addressing this issue. At the same time, DepED should
ensure that the increasing school participation resulting from demand-side interventions is
matched by sufficient planning and provision of classrooms, teachers, teaching and learning
materials, and other critical inputs. The active participation of the DepED in the interagency
coordination committee and in the monitoring and evaluation of the 4Ps program should be able
to identify supply-side and coordination problems early on and make any necessary adjustments.
176. Increasing use of alternative delivery modes (ADMs) of education to help address
the lack of inputs in critical areas and to respond to learners in disadvantaged, difficult, or
special contexts. The report supports the immediate adoption of alternative modes of delivering
77
formal education, especially in congested schools and other areas that are seriously lacking in the
necessary inputs to effectively provide services through conventional schooling. In addition to
responding to the problem of input shortages, appropriate ADMs can also be used as a viable
channel of learning for students whose access is limited by poverty, for out-of-school youths, and
for those students who live in disaster and conflict-prone areas. There are several ADMs that
have been successfully tested and later implemented by DepED, such as the Instructional
Management by Parents, Communities and Teachers (IMPACT) and the Modified In-School and
Off-School Approach (MISOSA). With proper planning and implementation, good-quality
education services could be provided through ADMs with fewer inputs (in relation to
conventional delivery) and thus, could also generate possible savings for DepED. However, to
realize the implementation of ADMs on a wider scale, the DepED, in close coordination with its
regional and division offices, must effectively integrate ADMs into its internal planning and
budgeting processes. An evaluation of these ADMs will need to be carried out in the immediate
term to ensure that these ADMs remain cost-effective strategies to improve access of the poor
and disadvantaged learners to basic education.
177. Enhancing public-private partnerships (PPP) within a coherent policy and
regulatory framework. The Philippines has one of the largest public-private partnerships
program in education in the world. Aside from the extensive resources mobilized through
corporate and other private sector initiatives for public schools, the growth of nongovernment
alternatives to financing and provision of education has been dramatic over the years. These
alternatives include the Education Service Contracting (ESC) program of Government, which
subsidizes students’ access to private schools. The initial findings of a recent World Bank study
on the efficacy of the ESC schemes are that it has been successful and cost effective in
increasing access to schooling. ESC has achieved its success by providing grants to households
to enroll children in certified private schools where space is available. These children would
otherwise have gone to public schools. The study recommends expanding the use of the ESC
program to alleviate the pressure on the public school system, and to build thousands of
additional classrooms to accommodate students in already overcrowded classrooms as well as
future enrollees. To enhance its scope, DepED would need to estimate the capacity and demand
for ESC in a systematic manner. The parallel Education Voucher Scheme, which meets the same
goals as the ESC, can be integrated in the program funding of the ESC. Another possible area for
PPP expansion is the system of contracting private school operators to manage public schools, in
a manner similar to the Concessions Schools program introduced in Colombia.
Evidence-based Decision Making
178. The effectiveness of government interventions in basic education depends on the quality
of data available for policy analysis and DepED’s capacity to institutionalize evidence-based
decision making. The current quality of available data is poor. It is difficult to systematically
assemble different data sources to analyze trends in outcomes and spending in the subsector. To
address this concern, DepED might pursue the following key strategies:
179. Strengthening capacities for evidence-based decision making. Over time, DepED
needs to invest in building its ability to make policy decisions. These decisions should be based
on objective analysis and evidence from policy research, which should enable DepED to apply
more rigorously its criteria of relative efficiency and cost-effectiveness in its budgetary decision

78
making. Better data would allow DepED and other stakeholders to address many of the questions
raised in this review. Detailed research in various areas will need to be undertaken to guide
effective resource allocation, for example, the reasons for system problems such as falling
participation rates and changes in other outcome indicators. Research could also explain the
problems' relation to government spending; causes of poorer performance of male students;
reasons for late enrollments of a number of school-age children; in-depth review of teacher
deployment procedures and the relative efficiency of national and LGU appointments; what
combination of classrooms, teachers, and learning materials would provide the greatest
improvement in learning outcomes, and the funds needed to resource that combination. Although
the lack of data makes the answers to these questions elusive for now, once such data are
routinely collected, most of the analyses needed to inform these sorts of issues can and should
become a routine for DepED.
180. In line with the government’s objectives of improving equity of access to quality
education, DepED, in collaboration with DBM and the National Economic and Development
Authority (NEDA), could start using data from national household surveys (e.g., Family Income
and Expenditure Survey or the Annual Poverty Indicator Survey) to regularly analyze and assess
education indicators and to relate these analyses to household socioeconomic and demographic
characteristics.
181. Another set of recommended measures would be to increase the allocative efficiency and
geographic equity of the DepED budget by deliberately allocating the marginal increases in the
budget to those items or programs that have proven to be cost-effective or that have shown
potential in producing good outcomes, and to discontinue, or at least reduce, allocations to those
programs deemed ineffective. To identify the relative effectiveness of existing programs, the
DepED could perform an evaluation of all its programs. DepED may not currently have the
capacity to evaluate all its existing programs in a single year. If so, then the proposed program
evaluations can be evaluated over a specific time period, e.g., three years.
182. Improving availability of accurate and consistent data. To codify and institutionalize
evidenced-based decision making, the government will need to invest in improving the coverage
and quality of policy-relevant data as an urgent priority for basic education. Prioritization
includes improving the timeliness, quality, and coverage (i.e., better sampling) of existing
household surveys, such as the Family Income and Expenditure Survey (FIES). The DepED’s
Basic Education Information System (BEIS) has proven to be a useful tool, but its data quality
and ability to link with other sources of information in the sector could be improved. An in-depth
assessment of BEIS's data content, validation, and a review of its process of collecting,
computing, and managing administrative data would be highly relevant to efforts to rationalize
resource allocation and enhance program planning. It would also improve the quality of key data
required to inform policy and decision making. As a first step, DepED could revisit BEIS's
content by reviewing the data elements that comprise the current system. Doing so would not
only assist the school heads who will collect and record the raw data, but also help the planning
officers who will be analyzing, aggregating, and using the data.
183. In future national and sub-national PERs, a greater portion of accurate data would bring
increased thoroughness to the exercise. To improve the quality of PER analysis, we recommend

79
that DepED identify where there is relevant, but currently unused, data. DepED should also
identify areas for which data is not being collected and to put in place mechanisms to do so.
184. Tracking and monitoring allocation and spending. Institutionalizing annual reviews of
public expenditures and key programs and conducting periodic public expenditure tracking
surveys (PETS) and school-level surveys would be worthwhile initiatives. Appropriately
measured and disseminated, PETS can enhance transparency and help ensure that education
expenditures reach the intended beneficiaries. As an immediate focus, expenditure tracking could
highlight the school MOOE by providing accurate and transparent information on actual inflows
to schools and by identifying the extent of leakages and their locations. International experience
with similar PETS (such as the first PETS done in Uganda in 1996) has shown that public
disclosure of such information has a tremendous positive impact on reducing leakages and
ensuring that resources due to schools are rightfully channeled to them.
185. Institutionalizing the updating of the Multi-Year Spending Plan. In the short run, the
DepED would be well advised to regularly update (e.g., every other year) its Multi-Year
Spending Plan, which was initiated in 2005 as a basis for annual budget formulation. This review
shows that DepED's actual spending has fallen short of its estimates to achieve EFA targets, even
with the spending increases in 2007 and 2008. Regularly updating the spending plan would
enable DepED to seek guaranteed allocations in the medium term to improve the predictability of
resource flows and spending for priorities. As a related activity, analytical inputs from the
proposed evaluation of DepED programs mentioned above should inform the spending plan
updating.

80
Annex 1: Data and Methods
1. In this annex we discuss the data sources and methods used in the report. We also provide
definitions of all key technical terms used in the report. Finally, we note some of the limitations
of the available data that we have drawn on in the report.
Government Spending Data Analysis
2. Data Sources: The Philippine government is mandated by law to provide free public
education in the elementary and high school levels (Art XIV Sec. 2(2), 1987 Constitution). The
Department of Education (DepED) is the main agency by which this provision is implemented.
However, there are other public sector agencies that contribute to the provision of basic
education. The Department of Public Works and Highways (DPWH) implements a Special
Purpose Fund (SPF) called the School Building Program (SBP). SBP is identified by the
legislature and monitored by DepED as a main source of infrastructure spending for basic
education. In addition, local government units (LGUs) also spend on basic education services.
3. We obtained data on national government spending on basic education from the annual
Statements of Allotments, Obligations and Balances (SAOB) of DepED and the Obligation and
Implementation Status Report of the DPWH. We acquired obligations data for other national
government education spending from the Department of Budget and Management (DBM) Fiscal
Statistics Handbook (FSH), and Budget of Expenditures and Source of Financing (BESF) for
certain fiscal years. Appropriations data came from the General Appropriations Act (GAA)
documents. We obtained data on automatic and continuing appropriations from the National
Expenditure Program (NEP) documents. Local government units also spend on basic education.
LGU spending data on basic education came from the Bureau of Local Government Finance
(BLGF) from 2002 to 2006. Data for more recent years were not available.
4. Other data sourced from the DBM are the implicit price index (IPIN), which DBM used
as the deflator with the base year of 2002; gross domestic product (GDP); and total national
government (NG) expenditures for all sectors. We obtained international data from the World
Bank’s Education Statistics (EdStats) database.
5. Definitions and Methods: Appropriations reflect what the government is allowed to
spend through the GAA or national budget, but do not represent actual spending (see Table 24).
Furthermore, there are two additional kinds of appropriations that are not reported in the GAA
but are allowed to be spent. These are continuing and automatic appropriations. Continuing
appropriations are appropriations from the preceding fiscal year that have not already been
allotted. Since all appropriations are typically available for departments to spend over two
succeeding fiscal years, these monies can be used by the department in the current fiscal year.
Automatic appropriations are appropriations authorized by standing legislation. This type of
appropriation does not require additional action by government. An allotment is defined as an
authorization to obligate that is issued based on appropriations. Any obligation issued is defined
as a legally incurred liability that government is committed to pay now or in the future.
Disbursements are defined as the actual release of funds for obligations. In budget data analysis,
it is ideal to use actual payments or disbursements made by the government. However, the
accounting method used in the Philippines makes it impossible to match disbursements to the

81
actual service rendered. It is also difficult to get details of disbursement by allotment class and
by program/project. Thus, the data that best approximates actual government spending is
reflected in obligations, which show the amount the government has promised to pay. In this
report we analyze government spending data from 2002 to 2008. We define basic education
national government spending as obligations of DepED plus the SBP, unless otherwise specified.
Table 24: Definitions of Public Expenditure Terms in the Philippines
Public Expenditure Terms Definition Source
Expenditure Program The ceiling on obligations that could be
incurred by the government in a given budget
year. This ceiling is supported by estimated
financial resources.
This includes proposed new, continuing, and
automatic appropriations (i.e., New +
Automatic + Continuing Appropriations).
National Expenditure
Program (NEP) or
Proposed National
Budget
Appropriations
New An authorization made by law or other
legislative enactment, directing payment out of
government funds under specified conditions or
for specific purposes.
General
Appropriations Act
(GAA) or National
Budget
Continuing An authorization to support obligations for a
specified purpose or project, even when these
obligations are incurred after the budget year.
Appropriations for capital outlay (CO) and
maintenance and other operating expenses
(MOOE) are valid for a total of two
succeeding fiscal years.
National Expenditure
Program (NEP) or
Proposed National
Budget
Automatic An authorization made annually or for some
other period prescribed by law, by virtue of
standing legislation that does not require
periodic action by Congress (e.g., Retirement
and Life Insurance Premium).
National Expenditure
Program (NEP) or
Proposed National
Budget
Allotments
Authorization issued by the DBM to an agency,
which allows the latter to incur obligation for
specified amounts contained in a legislative
appropriation
Statement of
Allotments,
Obligations and
Balances (SAOB)
Obligations
Liabilities legally incurred and committed to be
paid for by the government either immediately
or in the future.
Statement of
Allotments,
Obligations and
Balances (SAOB)
Disbursements
Settlement of government obligations and/or
accounts payable by cash; movement of cash
from the BTr or from an authorized disbursing
officer to the final recipient. Disbursement is
synonymous with
liquidation/settlement/payment of an obligation.
Bureau of Treasury
(BTr)
Source: DBM, Glossary of terms, BESF.
6. Using these definitions, we computed various indicators to assess the trend of basic
public education spending. They include:
Nominal national government (NG) basic education spending, which is the amount of
spending (obligations) by the national government (DepED plus SBP) on basic education in
current prices;
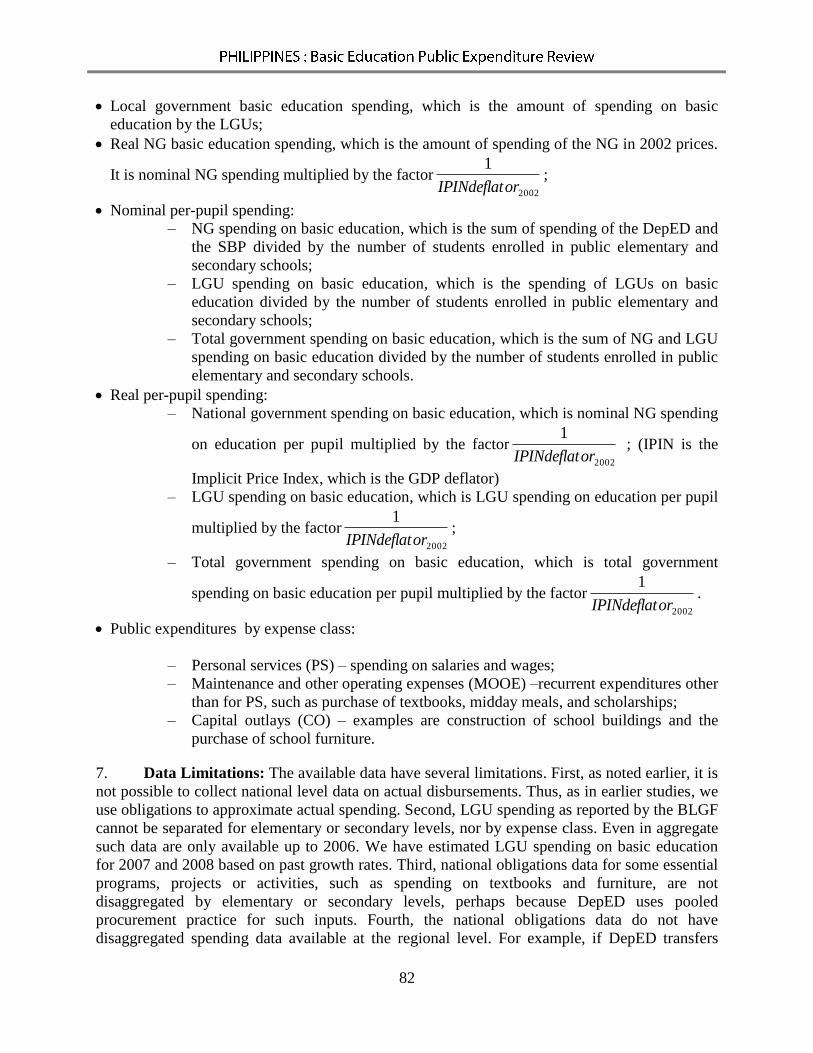
82
Local government basic education spending, which is the amount of spending on basic
education by the LGUs;
Real NG basic education spending, which is the amount of spending of the NG in 2002 prices.
It is nominal NG spending multiplied by the factor2002
1
orIPINdeflat;
Nominal per-pupil spending:
– NG spending on basic education, which is the sum of spending of the DepED and
the SBP divided by the number of students enrolled in public elementary and
secondary schools;
– LGU spending on basic education, which is the spending of LGUs on basic
education divided by the number of students enrolled in public elementary and
secondary schools;
– Total government spending on basic education, which is the sum of NG and LGU
spending on basic education divided by the number of students enrolled in public
elementary and secondary schools.
Real per-pupil spending:
– National government spending on basic education, which is nominal NG spending
on education per pupil multiplied by the factor2002
1
orIPINdeflat ; (IPIN is the
Implicit Price Index, which is the GDP deflator)
– LGU spending on basic education, which is LGU spending on education per pupil
multiplied by the factor2002
1
orIPINdeflat;
– Total government spending on basic education, which is total government
spending on basic education per pupil multiplied by the factor2002
1
orIPINdeflat.
Public expenditures by expense class:
– Personal services (PS) – spending on salaries and wages;
– Maintenance and other operating expenses (MOOE) –recurrent expenditures other
than for PS, such as purchase of textbooks, midday meals, and scholarships;
– Capital outlays (CO) – examples are construction of school buildings and the
purchase of school furniture.
7. Data Limitations: The available data have several limitations. First, as noted earlier, it is
not possible to collect national level data on actual disbursements. Thus, as in earlier studies, we
use obligations to approximate actual spending. Second, LGU spending as reported by the BLGF
cannot be separated for elementary or secondary levels, nor by expense class. Even in aggregate
such data are only available up to 2006. We have estimated LGU spending on basic education
for 2007 and 2008 based on past growth rates. Third, national obligations data for some essential
programs, projects or activities, such as spending on textbooks and furniture, are not
disaggregated by elementary or secondary levels, perhaps because DepED uses pooled
procurement practice for such inputs. Fourth, the national obligations data do not have
disaggregated spending data available at the regional level. For example, if DepED transfers

83
money to regional offices for furniture, it is recorded as “obligated” under the category of
regional operations in the SAOB. However, there is no way to determine what proportion of the
transferred amount was actually spent at the regional or sub-regional levels. Finally, there is no
government spending data available for the region of ARMM.
Basic Education Inputs and Outcomes Data Analysis
8. Data Sources: We used data from the Basic Education Indicators System (BEIS), which
was instituted by DepED in 2002, to analyze the trends in education inputs and outcomes for
period 20022008. Learning achievement data were based on National Achievement Test
(NAT) scores that we obtained from the planning division of DepED. To compute indicators
such as enrollment ratios we projected age-specific population data based on population data
obtained from the census from the National Statistics Office (NSO) for the year 2000.
9. Definitions and Methods
Participation Rates
Gross Enrollment Ratio (GER):
– Elementary GER = Total enrollment in Grades 1-6 divided by 6- to 11-year-old
population;
– Secondary GER = Total Enrollment in first to fourth year of high school divided
by 12- to 15-year-old population.
Net Enrollment Ratio (NER):
– Elementary NER = 6- to 11-year-olds enrolled in Grades 1-6 divided by 6- to 11-
year-old population;
– Secondary GER = 12- to 15-year-olds enrolled in first to fourth year of high
school divided by 12- to 15-year-old population.
10. We obtained enrollment data for the GER and NER from public and private school
enrollment from the BEIS. Since the census shows that 2000 is the latest year for which
population data are available, we estimated age-specific population projections by using the
following methods. We used provincial population growth rates to calculate total provincial
population from 2001 to 2008. We then applied the proportion of children of each age (6- to 15-
year-olds) in 2000 to the provincial population estimates to project age-specific provincial
population numbers. This method assumed that the age distribution of provincial population was
stable from 2000 to 2008. These population projections may have yielded more accurate GERs
and NERs than those available in BEIS that were computed by DepED, for which DepED used a
fixed population growth rate for all years at the national level.
Internal Efficiency Indicators
11. The team used the reconstructed cohort method (RCM) used by UNESCO to compute
these indicators. To construct a flow chart and compute all the internal efficiency indicators, this
method used enrollment data for two consecutive years, also the number of repeaters by grade

84
and the number of graduates for the current year. All data were obtained from the BEIS. The
formulae for these flow rates are as follows:
Promotion Rate is the percentage of school children enrolled in a given grade/year who are
promoted to the next grade/year at the end of a given school year.
Promotion Rate =
(Number of children enrolled in Grade X+1 in Year Y+1 – Repeaters in Grade X+1)*100
Number of children enrolled in Grade X in Year Y
Repetition Rate is the percentage of pupils/students enrolled in a given grade/year in a given
school year who study in (or repeat) the same grade/year the following school year.
Repetition Rate =
(Number of repeaters in Grade X)*100
Number of children enrolled in Grade X in Year Y
Dropout Rate is the number of pupils/students who leave school during the year, and also those
who complete the grade/year level but fail to enroll in the next grade/year level the following
school year divided by the total number of pupils/students enrolled during the previous school
year.
Drop-out Rate =
(Number of children enrolled in Grade X in Year Y – Repeaters in Grade X – [Number of
children enrolled in Grade X+1 in Year Y+1 – Repeaters in Grade X+1])*100
Number of children enrolled in Grade X in Year Y
Grade X = Grade 1 or first year of high school
Grade X + n = succeeding grades/year levels
Year Y = current school year
Year Y + 1 = next school year
12. The flow chart is also used to compute the following indicators:
Cohort Survival Ratio (CSR) is the proportion of enrollees at the beginning grade or year
who reach the final grade or year (this can be calculated with and without repetition).
Completion Rate is the percentage of first year entrants (grade one pupils or first-year high
school students) who complete/finish their full term (this can be calculated with and without
repetition)

85
Figure 25: Sample Elementary Reconstructed Cohort Survival Flow Diagram, SY 20032004
Source: Calculations were based on UNESCO’s reconstructed cohort formula; Education for All: The Year 2000 Assessment
Technical Guidelines (International Consultative Forum on Education for All 1998).
Input indicators
Pupil-Teacher Ratio is the number of pupils enrolled in a level (i.e., elementary/secondary
divided by the total number of elementary/secondary teachers in a given school year).
Pupil-Classroom Ratio is the number of pupils enrolled in a level (i.e., elementary/secondary
divided by the total number of classrooms in elementary/secondary in a given school year).
For the purposes of this study, we considered only academic classrooms in our PCR
computation. We excluded other instructional classrooms such as home economics rooms,
laboratories, and computer rooms. We also computed the pupil-class ratio. Here, we included
classrooms being used for multiple shifts.
Pupil-Seating Ratio is the number of pupils enrolled in a level (i.e., elementary/secondary
divided by total seating capacity). Seating furniture in public elementary and secondary
schools in the Philippines include desks (one each for two students), sets of tables and chairs
(each set for two students) and armchairs (one armchair for one student); hence, total seating
capacity = (Desks x 2) + (Table-chair sets x 2) + Armchairs.
13. We obtained all data for input indicators from the BEIS database.
14. Data Limitations: The data on inputs and outcomes have several limitations. Except for
enrollment data, all other input and outcome data are available only for public schools. There are
no available data for private schools. Even the enrollment data that include private school
enrollment are based on DepED extrapolations, since only some private schools submit their data
to DepED. According to DepED, the number of private schools that submit data has been getting

86
closer to 100 percent in recent years. In addition, we note that BEIS data and population
projections may have some margin of error. Therefore, minor movements in indicators such as
enrollment rates should not be given undue importance, since they are likely to be within the
margin of error of the population and enrollment estimates. There are also many inconsistencies
in data for the region of ARMM. Finally, experts comment that the learning achievement data in
the form of NAT scores are not comparable over time, because the tests were not standardized in
this manner.
Household Data Analysis
15. Data Sources for Family Income and Expenditure Survey: The Family Income and
Expenditure Survey (FIES) is a triennial national survey conducted by the National Statistics
Office (NSO). For this report, we used the two most recent available data from FIES, conducted
in 2003 and 2006. FIES covered a total of 42,094 households in 2003. FIES 2006 surveyed
38,483 households.
16. Although the FIES questionnaire lists individual-level data in the household member
(HHM) roster, such data are not available in the publicly released data set. For this study we used
only data on household expenditure on education. We analyzed this data by income quintile and
region. We derived per-capita spending on education to obtain an indicator of education
spending per HHM who is of school age. To approximate this amount, the denominator for per-
capita spending on education is the number of HHMs who are between seven and 25 years old
(i.e., HHMs deemed to be of school age rather than the total number of HHMs. We note that the
way HHM counts and age categories are presented in the FIES datasets prevented further
refinements in the count of HHMs by age range.
17. All income and expenditure data for FIES 2006 are expressed in 2003 prices to adjust for
overall price inflation. We used regional Consumer Price Index (CPI) data obtained from NSCB.
To adjust for spatial price differences, we further adjusted 2003 and 2006 FIES data to NCR
levels by using official regional poverty thresholds for 2003 also from NSCB. We weighted all
summary statistics by using the appropriate raising factor provided in the FIES dataset.
18. Annual Poverty Indicators Survey: We used survey-based education indicators from
the results of the 2004 Annual Poverty Indicators Survey (APIS)57
, which covered 42,789
households and contains information on 203,222 individuals. The APIS questionnaire asked four
questions on education: current enrolment status, current grade or year level, reason for not
attending school, and highest educational attainment. The first three questions were asked of
HHMs between six and 24 years old (total of 84,019 individuals).The last question was asked of
all HHMs above six years old.
19. Definitions and Methods: We performed the analysis for this study by using the HHM-
level data set, in which each individual from the same household had identical household-level
data. We adjusted household per-capita expenditures to NCR levels using poverty threshold data,
and used this adjusted per capita expenditure to generate expenditure quintiles.
57
Although the more recent APIS survey was conducted in 2007, these data were not publicly available as of this
writing.

87
20. We assumed that in line with official policy, children enter Grade 1 when they are six
years old and we expect them to graduate from high school at the age of 15. We weighted all
statistics by using the appropriate raising factor provided in the APIS data set
21. FIES Data: Using FIES data, we disaggregated household expenditures on education as
follows:
Tuition: spending on matriculation and tuition fees in cash and kind
Books: spending on books in cash and kind
Supplies: spending on school and other supplies (notebooks, pencils/pens, bond paper/pad
paper, newspaper/magazines, comics/pocketbooks, others) in cash and kind
Allowance: spending on allowance for family member studying away from home in cash and
kind
Total: Tuition + Books + Supplies + Allowance
22. As noted above, to reflect the effect of inflation, we adjusted prices to 2003 levels by
using regional CPI, which we applied to 2006 data. We obtained estimates of household
consumption expenditures in NCR 2003 prices as follows: yit is the nominal household
consumption expenditures of the ith household in the sample of the tth survey year (t = 2003,
2004, 2006). Since prior examination of the data showed that there were no zero or missing
observations for yit, we specified the following log-linear regression equation:
where git is a set of mutually exclusive dummy variables grit, where grit equals one if the ith
household in the tth survey year resides in region r, and zero otherwise; xit and it are,
respectively, a (column) vector of exogenous characteristics of, and a scalar unobserved error
term associated with, household i in survey year t, and t and t are coefficient vectors.
23. The reason we used the logarithmic transformation of yit rather than its level as the
dependent variable in Equation (1) is that the distribution of yit for each year t is positively
skewed, so that the error term of a cross-section regression with yit as the dependent variable is
likely to be heteroskedastic, with larger error variances being more likely for larger values of yit.
In contrast, the natural logarithm of yit has a cross-sectional distribution that is more like that of a
normally distributed random variable.
24. We assumed that Equation (1) was estimated by survey regression techniques. The
predicted value for NCR of the natural logarithm of household i’s consumption expenditures in
year t is given by
(1) ln ,it t it t it ity α g β x
(2) * * ˆˆln ,it t t ity β x

88
where *ˆt is the estimated coefficient for year t of the NCR dummy variable
58 and ˆ
tβ is the
vector of coefficient estimates of household characteristics Xt,. The predicted residual is given by
i.e., the predicted residual is the difference between the actual and predicted values of the natural
logarithm of consumption expenditures of the ith household in year t.59
(We note that ln ity is the
predicted value at the regional location of residence of household i.) We defined
We obtained the consumption expenditures in NCR 2003 prices of the ith household in the tth
survey year as
where *tp is the CPI for NCR in year t. Dividing *
ity by household size yielded real household
consumption expenditures per household member, which is our proxy for permanent income that
we used in the text as the basis of categorizing households and children into income quintiles.
25. To approximate per-student spending on education using FIES data, which does not
provide the number of HHMs currently enrolled, we divided HH spending on education by the
number of HHMs that were most likely school age (between seven and 25 years old). This result
gave us the per-capita spending on education, which we calculated as
total HH spending on education
no. of HHMs aged 7-25yo.
26. APIS Data: We derived the following education outcome indicators by using APIS data:
Enrolment: an individual is enrolled if she/he is attending school at any grade or year level
during the survey period;
Enrolment Rate: proportion of individuals of a certain category (or base) who are enrolled;
we calculated this proportion for HHMs of basic education age (six- to 15-year-olds);
Primary enrolment: if individual is enrolled in primary school (Grades 1 through 6);
Primary enrolment rate: proportion of individuals of official primary school age (six- to
11-year-olds) who are enrolled in primary school;
58
In the regressions, NCR is actually designated as the left-out category. 59
By assumption, this residual is independent of geographic influences that are reflected by g. If it is not, then the
vector g consists of endogenous regressors and the OLS estimates presented here would be biased.
(3) ˆ ln ln ,it it ity y
(4) * * ˆln ln .it it ity y
(5)
** * 2003
*exp ln ,it it
t
py y
p

89
Secondary enrolment: if individual is enrolled in secondary school (first through fourth year
of high school);
Secondary enrolment rate: proportion of individuals of official secondary school age (12-
to 15-year-olds) who are enrolled in secondary school;
Education deficit 1: number of years an individual of any age who is currently enrolled in
primary or secondary school is behind in her/his schooling; for example, if a student is seven
years old, she/he should be in Grade 2 but is enrolled in Grade 1, then she/he has an
educational deficit of 1 year;
Education deficit 2: number of years an individual who is of basic education age (between
six and 15years old) and is behind in her/his schooling regardless of enrolment status (this
number includes deficit of individuals who dropped out or never attended school).
27. Concentration Curves and Indexes60
: One measure for inequality in education
indicators is the concentration curve. This curve is similar to a Lorenz curve, but modified to
accommodate categorical data. To derive this curve, we assigned individuals according to a
ranking variable (here, adjusted per-capita expenditure) and plotted the cumulative distribution
of an education indicator on a graph. If an indicator is concentrated towards the rich (for
example, education attainment), this curve would appear below the 45-degree line. A more
bowed-in curve indicates a greater bias for the rich. But if an indicator is concentrated towards
the poor (for example, dropping out), this curve would appear above the 45-degree line, and a
more bowed out curve indicates greater bias for the poor.
28. The concentration index (CI) is an inequality measure based on the concentration curve.
It is a ratio of the area between the 45-degree line and the concentration curve and the area below
the 45-degree line (area of full inequality). It results in a numerical measure of inequality that in
absolute values goes from zero, or perfect equality, to one, or perfect inequality. For indicators
that are biased towards the rich (i.e., bowed in a concentration curve) this index would be
positive, while for indicators that are biased towards the poor (a bowed out curve) this index
would be negative.
29. Each CI presented in this study has an associated standard error (Std.Err.) statistic, which
we used to gauge the significance of the index. We used the standard error to calculate the t-
statistic for the CI, which we derived as CI
Std Errt . We then used it to test hypotheses.
30. Since they are estimates from survey data, concentration curves are subject to sampling
error. Hence, visual inspection is not a reliable basis for determining stochastic dominance. The
correct inference can only come from testing hypotheses. Two such tests that we used are the
multiple comparison approach (MCA) and the intersection-union principle (IUP).
31. When comparing two curves A and B, regardless of whether both are concentration
curves or one is either a Lorenz curve or the line of equality, MCA rejects the null hypothesis
that there is no dominance in favor of the alternative hypothesis of dominance for A if going in
one direction (e.g., cumulatively from the lowest to the highest ranked observations), we find
60
For a more detailed introduction to concentration curves and indices, see the World Bank’s technical note
at:http://siteresources.worldbank.org/EXTEDSTATS/Resources/3232763-1171296378756/concentration.pdf.

90
that A is significantly higher than B at least one point; and, going in the opposite direction, we
never find that B is significantly higher than A. Further, we took into account the fact that we
conducted multiple testing in the derivation of the critical value of the decision rule. A problem
with the MCA is that it may have a large (i.e., the probability of committing a Type I error (of
rejecting non-dominance, even if it is true)), since its decision rule requires only one testing point
to be statistically different.
32. The alternative, the IUP, rejects the null hypothesis in favor of the alternative hypothesis
if we found that the ordinates of the two curves were statistically different at all points in the
cumulative distribution being tested. Accordingly, a problem with the MCA is that reducing
correspondingly reduces the power of the test (1 – ), so that it has a low ability to detect
dominance when it is true.
33. Given the features of the tests, our best strategy was to use both in the analyses of equity
in the text.
34. Data Limitations: The FIES and APIS data for schooling were not segregated by
whether a child is attending private or public school. Thus, it was impossible to do a benefit
incidence analysis. In addition, it was difficult to interpret household expenditure on education
data, since households that send their children to private schools would be likely to spend much
more than would those that send their children to public schools. Finally, while APIS has
information about education outcomes, FIES has information about household expenditure on
education. However, because the two surveys use different sampling methods, it is difficult to
link the two data sets.
Determinants of Learning Achievement/Efficiency Analysis
35. Data Sources: We obtained National Achievement Test (NAT) scores administered to
Year 2 students at the secondary level during school years 20052006, 20062007, and
20072008 from the National Education Testing and Research Center (NETRC). NETRC
conducted achievement tests for Year 2 students starting in February 2006 to determine the
eligibility of the students to advance to third year.61
The examination measured competencies in
English, science, mathematics, Filipino, and social studies.
36. We obtained school characteristics from the BEIS School Statistics Module. The BEIS
was started in 2002 by the Research and Statistics Division of DepED. It was intended for
monitoring and performance evaluation. Among the variables that we used in this study were
enrolment, number of shifts, classroom utilization, school furniture, position of teaching
personnel, and LGU-funded teachers.
37. We merged BEIS and NAT datasets for the three school years by using unique school
IDs assigned by DepED for each school. We merged 4,151 schools for SY 20052006, 4,143
schools for SY 20062007, and 4814 schools for SY 20072008.
61
DepEDOrder No. 27, s.2005. “Remedial Instruction Programs in High School.”

91
38. Definitions and Methods: In their study, Behrman and Oliver (2000) noted that most
researchers used an education production function to examine how student, household, school,
and community inputs are combined to yield education outcomes. According to Orbeta (2008),
there are three methods commonly used for estimating the function: contemporaneous, value-
added, and cumulative.
39. The contemporaneous method is so called because it looks at the relation between
achievement scores and inputs at year t. A criticism of this method is that it fails to account for
the fact that learning is a cumulative process, that what the child knows at year t is an
aggregation of inputs from the past to year t. Failure to account for the influence of the past
limits the value of the analysis (Glewwe 2000).
40. The value-added method accounts for this problem by examining the relation between the
difference in test scores at year (t) and year (t-n) and the inputs at year t.
41. The cumulative method, considered to be the most comprehensive (Orbeta 2008; Todd
and Wolpin 2003), uses a history of inputs as regressors of achievement scores.
42. Hanushek (1997) conducted a literature review in which he cites the following as
commonly used measures of resources available to schools:
Real resources of the classroom (teacher education, teacher experience, and teacher-pupil
ratios);
Financial aggregates of resources (expenditure per student and teacher salary);
Measures of other resources in schools (specific teacher characteristics, administrative
inputs, and facilities).
43. When these resources are available we use them as regressors. The BEIS School
Statistics Module collects information on enrollment, number of shifts, classroom utilization,
school furniture, position of teaching personnel, and LGU-funded teachers. Financial measures
were not available at the school level.
44. School Inputs: The inputs we used in our regression analysis were the resources
available to the secondary school, second-year cohort that took the test. Since it was possible to
track the inputs given to the second-year cohort during their first year, we also included inputs
for the first year (year (t-1)) as regressors. For example, for the test given in SY 20052006 to
the second-year cohort, we included inputs for SY 20042005 in the regression. To account for
the inputs that were allocated to the relevant cohort during the test year, we also included the
changes between second year inputs at year (t) and first year inputs at year (t-1).
45. Enrolment: To allow easier interpretation of school input ratios, we used enrollment data
for first and second years in the regression.62
Ratios of first-year enrollment (year (t-1)) and
second-year enrollment (year t) during the NAT year are indicators of competition for limited
school resources.
62
If enrollment were not included as a regressor, it would be difficult to interpret student-teacher ratios and student-
classroom ratios, because the effects are confounded.
92
46. Congestion: As discussed in Chapter 4, when resources are limited, schools use multiple
shifts to accommodate all enrollees. We used dummy variables for schools with two, three, and
four shifts to examine whether the shift system has an effect on achievement scores.
47. School Quality: As proxy measures for school quality, we used data on school heads and
positions of teaching personnel. We assumed that a school headed by a principal would be better
managed because principals receive training on school management. We used dummies for
schools that are headed by personnel other than principal in the regression. As our proxy for the
quality of teaching personnel we used BEIS data on the template position of teachers (a teacher
ranking system that depends on qualifications and years of experience). Those who occupy
Teacher 3 and Master Teacher positions have higher educational attainment and more years of
teaching experience.63
48. Sources of Teacher Funding: As discussed in Chapter 3, because LGUs have been
hiring teachers to compensate for shortages in nationally-funded teacher positions, LGU
spending on basic education has grown consistently over the years. These funds could either be
from the SEF or LGUs’ main budgets. Unfortunately, detailed data on how much each LGU
spends on teachers was not available. However, BEIS provides data on the number of teachers
disaggregated by source of funding, i.e., the number of teachers funded from the LGU’s main
budget, SEF municipality, or SEF province/city. Some schools also tap the Parents-Teachers-
Community Association (PTCA) as a source of teacher funding, so we also included these data
in the regression.
49. Chapter 3 also mentions that data on the amount of national government expenditure that
was actually spent per school were not available. In the absence of any NG or school-level
expenditure data, we added division level dummies to the regressions.
50. Other Characteristics: There are schools in the dataset that are classified as annex
schools. Such schools are managed by main schools. There are also some schools that are fully
funded by local governments. We included these two variables in the regression as dummy
variables. Doing so enabled us to examine if being an annex school that may or may not be fully
funded by LGUs leads to different achievement scores compared to a main school or schools
funded by the national government.
51. Another constraint is that data for students, household, and community characteristics,
presumably major contributors to learning outcomes, were not available. Thus, we added dummy
variables for municipalities to control for the effect of these missing variables. However, we note
that they are imperfect proxies.
52. We used four models to examine the determinants of test scores among schools. The
regressors are:
a) Core (Model 1): teacher to student ratio in year t-1, classroom to student ratio in year
t-1, first year enrollment in t-1, teacher to student ratio increment, classroom to student
ratio increment, enrollment increment, ratio of first years enrolled in year t-1, ratio of
63
A teacher is promoted to Teacher 3 level after 24 years of teaching experience.

93
second years enrolled, dummies for size, dummies for shifts, proxies for school head
and teacher quality, proxies for sources of teacher funding, indicator variable if school
is an annex, indicator variable if school is mostly locally funded, and year dummies.
b) Division (Model 2): core plus division dummies. Since data on national government
spending was not available at the school level, we added division dummies as proxies
for the support that each school receives from the national government.
c) Municipalities (Model 3): core plus municipality dummies. Estimation of an
education production function should include controls for household characteristics.
Since there were no available data, we controlled for demographic characteristics by
adding municipality dummies.
d) Division and Municipality (Model 4): core plus division plus municipality dummies.
Annex 2 provides detailed tables of the results using these different models.
53. Model Fit: Models 1 to 4 show significant differences in goodness of fit: the adjusted R2
is 0.062 for Model 1 and 0.492 for Model 4. We found that Models 1 and 2 were heteroskedastic.
("Heteroskedasticity" is defined as a condition that arises when regressors (variables) monitored
over a specific period of time, are not constant. The resulting variances can cause the standard
errors of the coefficients to be underestimated and hence, lead to a false judgment of statistical
significance.) Despite the inclusion of division and municipality dummies in models 2 to 4, all
four models failed the test for omitted variables. This failure implies that substantial components
of education production, primarily those related to student and household characteristics, were
not captured in these models. Thus, the results should be viewed with caution.
54. We conducted a pooled analysis on efficiency. First, we added the residuals per school
and took the means of regressors across years. For regressors that were in their binary form, such
as school heads and shifts, we examined the percent of schools that experienced change from
year (t) to year (t+1). The table below describes the two binary variables. For instance, the
variable “principal to no-principal SY 2005 to SY2006” pertains to schools that moved from
having a principal in 2005 to having no principal in 2006. Schools that moved from having no
principal in 2005 to having a principal in 2006 are represented by the variable “no-principal to
principal SY2005 to SY2006.” We applied the same methods to movements in shifts.
Variable Description
principal to no-principal SY 2005 to SY2006 % of schools with principals in 2005 who had no
principals in 2006
principal to no-principal SY 2006 to SY2007 % of schools with principals in 2006 who had no
principals in 2007
no-principal to principal SY 2005 to SY2006 % of schools with no principals in 2005 who had
principals in 2006
no-principal to principal SY2006 to SY2007 % of schools with no principals in 2006 who had
principals in 2007
1 shift to 2 shifts SY2005 to SY2006 % of schools with 1 shift in 2005 who had 2 shifts
in 2006
1 shift to 2 shifts SY2006 to SY2007 % of schools with 1 shift in 2006 who had 2 shifts
in 2007
2 shifts to 1 shift SY2005to SY2006 % of schools with 2 shift in 2005 who had 1 shift in
2006

94
2 shifts to 1 shift SY2006 to SY2007 % of schools with 2 shifts in 2006 who had 1 shift
in 2007
55. We grouped the residuals into four quartiles. We classified those in the first quartile as
schools (with above average efficiency), those in second and third quartiles as averagely efficient
schools, and those in the fourth quartile as having below average efficiency.
Residual/Efficiency
Quartile 1 Less than -0.1709535
Quartile 2 Greater than or equal to -0.1709535 & less than -4.09e-
14 Quartile 3 Greater than or equal to -4.09e-14 & less than 0.1644905 Quartile 4 Greater than or equal to 0.1644905
56. We conducted a sensitivity analysis to examine whether the results would hold when
analysis was restricted to a data subset. We truncated the data at the lowest 5 percent and highest
95 percent of the residual. We regrouped the schools with the following cut-off points:
Residual/Efficiency
Quartile 1 Less than -0.1472497 Quartile 2 Greater than or equal to -0.1472497 & less than -4.09e-14 Quartile 3 Greater than or equal to -4.09e-14 & less than 0.1364865 Quartile 4 Greater than or equal to 0.1364865
57. Annex 2 provides detailed tables for the results of the efficiency analysis.
58. Data Limitations: As noted, a major constraint we faced in doing this analysis was that
data needed for the value-added and cumulative methods were not available. No achievement
tests were conducted at least twice for the same cohort in recent years.64
Although most analyses
on education production function explore relationships at the level of an individual student,
another limitation of the analysis is that data on achievement scores is available only at the
school level.
Resource Projections for Government Spending on Basic Education
59. Data Sources: We obtained enrollment projections data by region from DepED. These
enrollment projections are based on the Philippines achieving the target cohort survival ratio of
85 percent (EFA goal) by 2015. We used these projections as the basis for the financial resource
projections for all the alternative scenarios. The only exception is Scenario 1, which we have
based on our own enrollment projections. In our projections we assumed that the Philippines
would achieve a 100 percent Net Enrollment Rate (NER) by 2015 (MDG goal). The difference in
enrollment projections is minor, since improving the Cohort Survival Rate (CSR) also results in
close to 100 percent NER.
64
In his paper, Orbeta (2008) was able to use the value-added approach because in SY 2002-2003, the National
Diagnostic Test (NDT) was given at the beginning of the school year and the National Achievement Test (NAT)
towards the end of the school year. The National Education Testing and Research Center (NETRC) stopped
administering NDT starting SY 200304.

95
60. We obtained current numbers of teachers, classrooms, and furniture from BEIS and cost
parameters for all inputs from DepED. We assumed that teacher salaries were or are revised
upwards as planned by DepED from 20092012.
61. Definitions and Methods: Our estimations use alternative assumptions for seven
alternative scenarios. Except for Scenario 3, all scenarios assume a PTR of 45:1 as projected by
DepED. All scenarios use classroom and shortage computations based on DepED’s estimations.
We derive our estimates for teacher, classroom, and furniture requirements at the regional level
in all scenarios except Scenario 7, which uses classroom projections at the school level.
62. All scenarios assume a 1:1 textbook ratio and a per student MOOE provided to every
student. Finally, we assume 30 percent additional government spending for administrative and
quality improvement expenditure over and above what was spent on these key inputs.
63. Scenario 1 assumes that the elementary and secondary NER will be 100 percent in 2015.
Scenarios 2 to 7 assume that the elementary and secondary CSR will be 85 percent, which is in
line with DepED’s targets. Scenario 3 varies the PTR to be lower at 35:1 for the elementary
level, thus raising the number of total teachers that need to be hired. Scenario 4 assumes that
DepED spends increasing additional amounts on quality improvement measures, such as teacher
training and school-based management grants reaching 60 percent in additional spending over
and above what DepED will spend on key inputs. Scenario 5 assumes that all shifts are
eliminated, thus substantially increasing the number of classrooms required. We also assume that
by increasing use of the ESC scheme there will be a 20 percent reduction in the number of
classrooms required. Scenario 6 incorporates all the quality improvement measures in the
previous scenarios (3, 4, and 5) using Scenario 2 as the base case. Finally, Scenario 7 uses
Scenario 2 as the base case but projects classroom requirements at the school level. Scenario 2
also assumes that all shifts are eliminated, thus substantially increasing the number of classrooms
needed.
64. Data Limitations: Although we used the latest available data for these resource
projections, DepED is currently working with the World Bank to update the 2005 Multi-Year
Spending Plan (DepED, World Bank, and PIDS 2005). Thus, our projections should be treated as
preliminary. The updated spending plan will use latest available data on enrollment projections
and cost parameters to estimate in extensive detail future resources required for the sector.
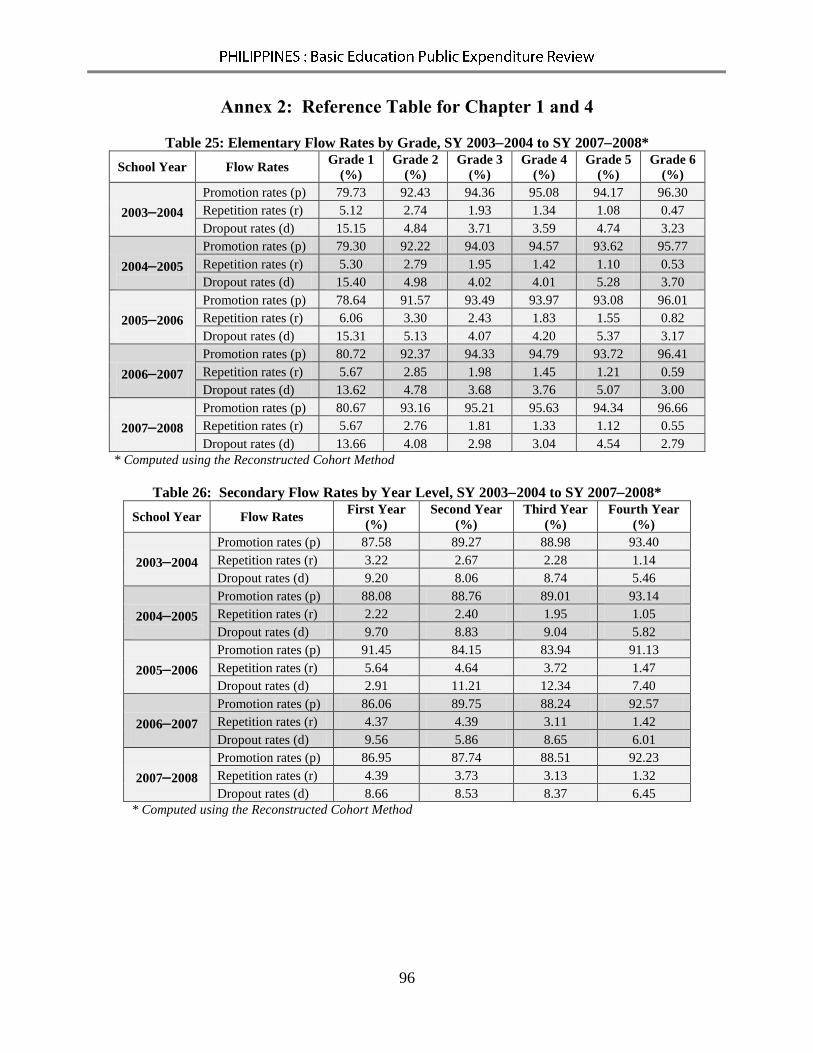
96
Annex 2: Reference Table for Chapter 1 and 4
Table 25: Elementary Flow Rates by Grade, SY 20032004 to SY 20072008*
School Year Flow Rates Grade 1
(%)
Grade 2
(%)
Grade 3
(%)
Grade 4
(%)
Grade 5
(%)
Grade 6
(%)
20032004
Promotion rates (p) 79.73 92.43 94.36 95.08 94.17 96.30
Repetition rates (r) 5.12 2.74 1.93 1.34 1.08 0.47
Dropout rates (d) 15.15 4.84 3.71 3.59 4.74 3.23
20042005
Promotion rates (p) 79.30 92.22 94.03 94.57 93.62 95.77
Repetition rates (r) 5.30 2.79 1.95 1.42 1.10 0.53
Dropout rates (d) 15.40 4.98 4.02 4.01 5.28 3.70
20052006
Promotion rates (p) 78.64 91.57 93.49 93.97 93.08 96.01
Repetition rates (r) 6.06 3.30 2.43 1.83 1.55 0.82
Dropout rates (d) 15.31 5.13 4.07 4.20 5.37 3.17
20062007
Promotion rates (p) 80.72 92.37 94.33 94.79 93.72 96.41
Repetition rates (r) 5.67 2.85 1.98 1.45 1.21 0.59
Dropout rates (d) 13.62 4.78 3.68 3.76 5.07 3.00
20072008
Promotion rates (p) 80.67 93.16 95.21 95.63 94.34 96.66
Repetition rates (r) 5.67 2.76 1.81 1.33 1.12 0.55
Dropout rates (d) 13.66 4.08 2.98 3.04 4.54 2.79
* Computed using the Reconstructed Cohort Method
Table 26: Secondary Flow Rates by Year Level, SY 20032004 to SY 20072008*
School Year Flow Rates First Year
(%)
Second Year
(%)
Third Year
(%)
Fourth Year
(%)
20032004
Promotion rates (p) 87.58 89.27 88.98 93.40
Repetition rates (r) 3.22 2.67 2.28 1.14
Dropout rates (d) 9.20 8.06 8.74 5.46
20042005
Promotion rates (p) 88.08 88.76 89.01 93.14
Repetition rates (r) 2.22 2.40 1.95 1.05
Dropout rates (d) 9.70 8.83 9.04 5.82
20052006
Promotion rates (p) 91.45 84.15 83.94 91.13
Repetition rates (r) 5.64 4.64 3.72 1.47
Dropout rates (d) 2.91 11.21 12.34 7.40
20062007
Promotion rates (p) 86.06 89.75 88.24 92.57
Repetition rates (r) 4.37 4.39 3.11 1.42
Dropout rates (d) 9.56 5.86 8.65 6.01
20072008
Promotion rates (p) 86.95 87.74 88.51 92.23
Repetition rates (r) 4.39 3.73 3.13 1.32
Dropout rates (d) 8.66 8.53 8.37 6.45
* Computed using the Reconstructed Cohort Method

97
Table 27: Elementary Gross Enrollment Rate and Net Enrollment Rate, by Gender, SY 20032004
to SY 20082009
School
Year
Elementary GER
(Public and Private)
(%)
Elementary NER
(Public and Private)
(%)
Male Female Male Female
20022003 109.68 108.15 89.90 91.51
20032004 107.81 106.16 88.39 90.25
20042005 105.96 104.62 86.42 88.34
20052006 103.26 101.63 83.88 85.81
20062007 102.21 100.48 83.02 84.75
20072008 102.15 100.30 82.76 84.47
20082009 102.39 99.87 83.19 84.32
Table 28: Secondary Gross Enrollment Rate and Net Enrollment Rate, by Gender, SY 20032004
to SY 20082009
School
Year
Secondary GER
(Public and Private)
(%)
Secondary NER
(Public and Private)
(%)
Male Female Male Female
20022003 81.66 88.50 54.88 64.20
20032004 82.97 90.21 56.04 65.76
20042005 81.83 89.44 54.94 64.87
20052006 79.06 86.24 53.74 63.46
20062007 78.52 84.77 53.68 63.20
20072008 79.57 85.09 54.02 63.03
20082009 80.97 85.62 55.11 63.76
Table 29: Elementary Repetition Rate, by Gender, SY 20032004 to SY 20072008
Male (%)
School Year Grade 1 Grade 2 Grade 3 Grade 4 Grade 5 Grade 6
20032004 6.01 3.54 2.62 1.87 1.55 0.67
20042005 6.22 3.61 2.62 1.95 1.55 0.76
20052006 7.09 4.27 3.25 2.52 2.22 1.21
20062007 6.64 3.73 2.66 1.98 1.70 0.84
20072008 6.72 3.58 2.46 1.84 1.59 0.78
Female (%)
School Year Grade 1 Grade 2 Grade 3 Grade 4 Grade 5 Grade 6
20032004 4.09 1.85 1.19 0.79 0.62 0.27
20042005 4.25 1.89 1.22 0.87 0.65 0.32
20052006 4.87 2.23 1.55 1.11 0.88 0.44
20062007 4.57 1.90 1.26 0.90 0.72 0.34
20072008 4.47 1.85 1.13 0.81 0.65 0.33

98
Table 30: Secondary Repetition Rate, by Gender, SY 20032004 to SY 20072008
Male (%)
School Year First Year Second Year Third Year Fourth Year
20032004 4.98 4.15 3.49 1.78
20042005 3.37 3.72 3.04 1.60
20052006 6.89 7.11 5.78 2.37
20062007 6.46 6.67 4.74 2.19
20072008 6.57 5.68 4.73 2.04
Female (%)
School Year First Year Second Year Third Year Fourth Year
20032004 1.41 1.29 1.19 0.59
20042005 1.06 1.15 0.99 0.57
20052006 2.50 2.29 1.86 0.72
20062007 2.13 2.17 1.60 0.75
20072008 2.12 1.88 1.71 0.71
Table 31: National Achievement Test Mean Percentage Scores (MPS) and Test Takers, by Region,
20052007
REGION 2005 2006 2007
No. of
Test-
takers
Total
Score
(MPS)
No. of Test-
takers
Total Score
(MPS)
No. of Test-
takers
Total Score
(MPS)
Autonomous
Region in Muslim
Mindanao
(ARMM)
mean 156 47
sd 98 16
obs 131
Region V – Bicol mean 146 43 186 42 169 41
sd 206 10 209 8 193 8
obs 392 406 448
Region II –
Cagayan Valley mean 150 49 175 44 152 45
sd 150 11 169 10 153 9
obs 217 243 272
Region IVA -
Calabarzon mean 265 49 299 49 279 50
sd 317 13 338 13 308 13
obs 393 413 469
Cordillera
Autonomous
Region (CAR)
mean 89 45 109 46 102 50
sd 140 8 150 8 151 10
obs 163 167 162
Caraga mean 150 64 185 64 170 66
sd 201 12 211 12 182 12
obs 147 146
150

99
Region III –
Central Luzon mean 271 50 305 50 287 55
sd 288 13 308 11 297 12
obs 365 377 389
Region VII –
Central Visayas mean 146 52 206 48 182 53
sd 140 13 169 9 152 13
obs 334 327 337
Region XI –
Davao mean 195 44 258 45 243 47
sd 261 11 320 11 284 10
obs 183 193 192
Region VIII –
Eastern Visayas mean 139 67 174 66 167 67
sd 144 13 168 13 150 14
obs 294 298 315
Region I – Ilocos mean 148 57 183 55 163 61
sd 191 15 227 14 203 15
obs 388 397 427
Region IVB –
MIMAROPA mean 127 53 186 50 139 52
sd 159 12 206 12 143 12
obs 147 152 247
National Capital
Region (NCR) mean 668 42 819 44 712 45
sd 464 7 490 8 459 8
obs 162 167 175
Region X –
Northern
Mindanao
mean 172 47 223 46 205 51
sd 190 12 231 13 234 14
obs 187 191 202
Region XII -
Soccsksargen mean 174 43 212 50
sd 190 11 223 14
obs 167 198
Region VI –
Western Visayas mean 180 46 210 45 188 47
sd 200 12 211 10 194 12
obs 432 477 513
Region IX –
Zamboanga
Peninsula
mean 156 52 194 50 189 59
sd 201 13 223 12 223 13
obs 180 189 187
NATIONAL mean 194 50 238 49 213 52
sd 251 14 283 13 252 14
obs 4,151 4,143 4,814
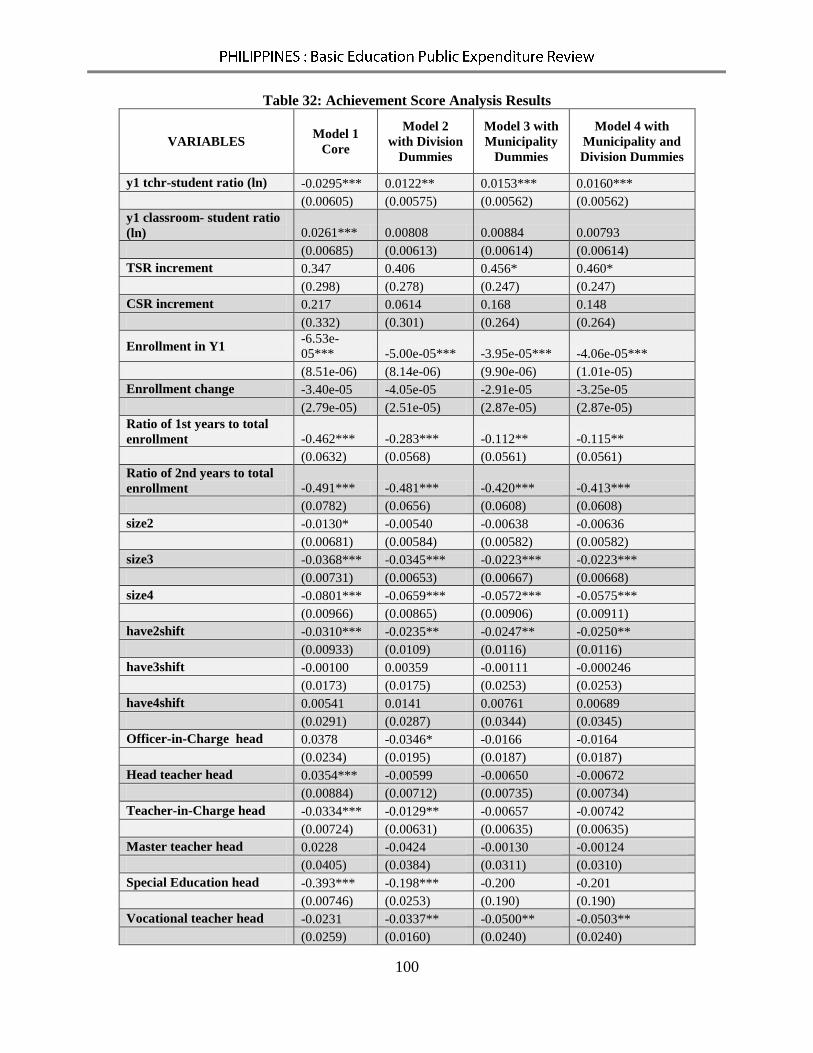
100
Table 32: Achievement Score Analysis Results
VARIABLES Model 1
Core
Model 2
with Division
Dummies
Model 3 with
Municipality
Dummies
Model 4 with
Municipality and
Division Dummies
y1 tchr-student ratio (ln) -0.0295*** 0.0122** 0.0153*** 0.0160***
(0.00605) (0.00575) (0.00562) (0.00562)
y1 classroom- student ratio
(ln) 0.0261*** 0.00808 0.00884 0.00793
(0.00685) (0.00613) (0.00614) (0.00614)
TSR increment 0.347 0.406 0.456* 0.460*
(0.298) (0.278) (0.247) (0.247)
CSR increment 0.217 0.0614 0.168 0.148
(0.332) (0.301) (0.264) (0.264)
Enrollment in Y1 -6.53e-
05*** -5.00e-05*** -3.95e-05*** -4.06e-05***
(8.51e-06) (8.14e-06) (9.90e-06) (1.01e-05)
Enrollment change -3.40e-05 -4.05e-05 -2.91e-05 -3.25e-05
(2.79e-05) (2.51e-05) (2.87e-05) (2.87e-05)
Ratio of 1st years to total
enrollment -0.462*** -0.283*** -0.112** -0.115**
(0.0632) (0.0568) (0.0561) (0.0561)
Ratio of 2nd years to total
enrollment -0.491*** -0.481*** -0.420*** -0.413***
(0.0782) (0.0656) (0.0608) (0.0608)
size2 -0.0130* -0.00540 -0.00638 -0.00636
(0.00681) (0.00584) (0.00582) (0.00582)
size3 -0.0368*** -0.0345*** -0.0223*** -0.0223***
(0.00731) (0.00653) (0.00667) (0.00668)
size4 -0.0801*** -0.0659*** -0.0572*** -0.0575***
(0.00966) (0.00865) (0.00906) (0.00911)
have2shift -0.0310*** -0.0235** -0.0247** -0.0250**
(0.00933) (0.0109) (0.0116) (0.0116)
have3shift -0.00100 0.00359 -0.00111 -0.000246
(0.0173) (0.0175) (0.0253) (0.0253)
have4shift 0.00541 0.0141 0.00761 0.00689
(0.0291) (0.0287) (0.0344) (0.0345)
Officer-in-Charge head 0.0378 -0.0346* -0.0166 -0.0164
(0.0234) (0.0195) (0.0187) (0.0187)
Head teacher head 0.0354*** -0.00599 -0.00650 -0.00672
(0.00884) (0.00712) (0.00735) (0.00734)
Teacher-in-Charge head -0.0334*** -0.0129** -0.00657 -0.00742
(0.00724) (0.00631) (0.00635) (0.00635)
Master teacher head 0.0228 -0.0424 -0.00130 -0.00124
(0.0405) (0.0384) (0.0311) (0.0310)
Special Education head -0.393*** -0.198*** -0.200 -0.201
(0.00746) (0.0253) (0.190) (0.190)
Vocational teacher head -0.0231 -0.0337** -0.0500** -0.0503**
(0.0259) (0.0160) (0.0240) (0.0240)

101
Proportion of teacher 3 and
above 0.0712*** 0.0252* 0.0262* 0.0268*
(0.0148) (0.0143) (0.0153) (0.0153)
PTCA-funded teachers (%) -0.171*** -0.0863** -0.102*** -0.101***
(0.0415) (0.0392) (0.0378) (0.0378)
LGU-funded teachers (%) -0.0834*** -0.0190 0.000303 0.00390
(0.0274) (0.0229) (0.0237) (0.0237)
SEF municipality-funded
teachers (%) -0.0623** -0.0573** -0.0220 -0.0199
(0.0296) (0.0286) (0.0270) (0.0270)
SEF province/city-funded
teachers (%) -0.112*** 0.0238 0.00761 0.00403
(0.0246) (0.0234) (0.0232) (0.0232)
Dummy for annex school -0.0520*** -0.00842 -0.0160 -0.0158
(0.0107) (0.0106) (0.0107) (0.0107)
Dummy for locally funded
school 0.0961* 0.0806 0.0634* 0.0663*
(0.0536) (0.0492) (0.0384) (0.0384)
Year=2006 0.0120* 0.00556 0.00468 0.00454
(0.00709) (0.00587) (0.00519) (0.00518)
Year=2007 0.0436*** 0.0490*** 0.0491*** 0.0492***
(0.00649) (0.00537) (0.00470) (0.00470)
Constant 4.186*** 4.136*** 4.423*** 3.825***
(0.0376) (0.0407) (0.112) (0.270)
Observations 13108 13108 13108 13108
Adjusted R-squared 0.062 0.378 0.491 0.492 *** p<0.01, ** p<0.05, * p<0.1; Standard errors in parentheses. Models 1 and 2 report robust standard errors to correct for
heteroscedasticity.
Table 33: Results of Efficiency Grouping (Full Sample)
Characteristics of Schools with Above-Average Efficiency Compared to Average Efficiency
VARIABLES Mean one-tailed t-test two-tailed t-
test
above average above<average above>average above=average
teacher-student ratio 0.0229 0.0232 0.1744 0.8256 0.3488
classroom-student ratio 0.0174 0.0171 0.8316 0.1684 0.3368
teacher-student ratio
increment
0.0015 0.0011 0.9456 0.0544** 0.1087
classroom-student ratio
increment
0.0015 0.0011 0.9727 0.0273** 0.0545*
first year enrollment 268.8985 286.9412 0.051* 0.949 0.1021*
enrollment change -40.7698 -44.9744 0.9875 0.0125** 0.0249**
ratio of first year to
total enrollment
0.3112 0.3117 0.3573 0.6427 0.7145
ratio of second year to
total enrollment
0.2591 0.2602 0.0614* 0.9386 0.1228
proportion of teacher 3
and above
0.1556 0.1467 0.9385 0.0615** 0.123
total enrollment 884.1301 938.7567 0.0736* 0.9264 0.1472
proportion of teachers 0.0145 0.0164 0.1892 0.8108 0.3783

102
funded by PTCA
proportion of teachers
funded by LGUs
0.0257 0.0320 0.0307** 0.9693 0.0614*
proportion of teachers
funded by muni. SEF
0.0287 0.0263 0.7783 0.2217 0.4435
proportion of teachers
funded by prov. SEF
0.0474 0.0440 0.8173 0.1827 0.3653
principal to no-
principal SY2005 to
SY2006
0.0633 0.0638 0.4787 0.5213 0.9574
principal to no-
principal SY2006 to
SY2007
0.0657 0.0597 0.7592 0.2408 0.4816
no-principal to
principal SY2005 to
SY2006
0.0761 0.0497 0.9988 0.0012*** 0.0024***
no-principal to
principal SY2006 to
SY2007
0.0593 0.0493 0.8946 0.1054 0.2108
1 shift to 2 shifts
SY2005 to SY2006
0.0088 0.0068 0.7391 0.2609 0.5218
1 shift to 2 shifts
SY2006 to SY2007
0.0176 0.0096 0.9714 0.0286** 0.0573*
2 shifts to 1 shift
SY2005 to SY2006
0.0120 0.0108 0.6259 0.3741 0.7482
2 shifts to 1 shift
SY2006 to SY2007
0.0096 0.0104 0.4067 0.5933 0.8135
*** statistically significant at 0.01 level of significance, ** statistically significant at 0.05 level of significance, *statistically
significant at 0.1 level of significance
Table 34: Characteristics of Schools with Below-Average Efficiency Compared to Average
Efficiency
Mean one-tailed t-test two-tailed t-test
VARIABLES below average below<average below>average below=average
teacher- student ratio 0.0236 0.0232 0.8025 0.1975 0.3949
classroom-student ratio 0.0180 0.0171 0.9996 0.0004*** 0.0009***
teacher-student ratio
increment 0.0015 0.0011 0.9412 0.0588* 0.1175
classroom-student ratio
increment 0.0014 0.0011 0.9427 0.0573* 0.1146
first year enrollment 276.7521 286.9412 0.2063 0.7937 0.4126
enrollment change -42.8432 -44.9744 0.8326 0.1674 0.3348
ratio of first year to total
enrollment 0.3085 0.3117 0.0093*** 0.9907 0.0186**
ratio of second year to
total enrollment 0.2586 0.2602 0.0141** 0.9859 0.0282**
proportion of teacher 3
and above 0.1557 0.1467 0.9415 0.0585* 0.117
total enrollment 908.5450 938.7567 0.236 0.764 0.4719
proportion of teachers
funded by PTCA 0.0154 0.0164 0.3357 0.6643 0.6713
proportion of teachers 0.0250 0.0320 0.0127** 0.9873 0.0254
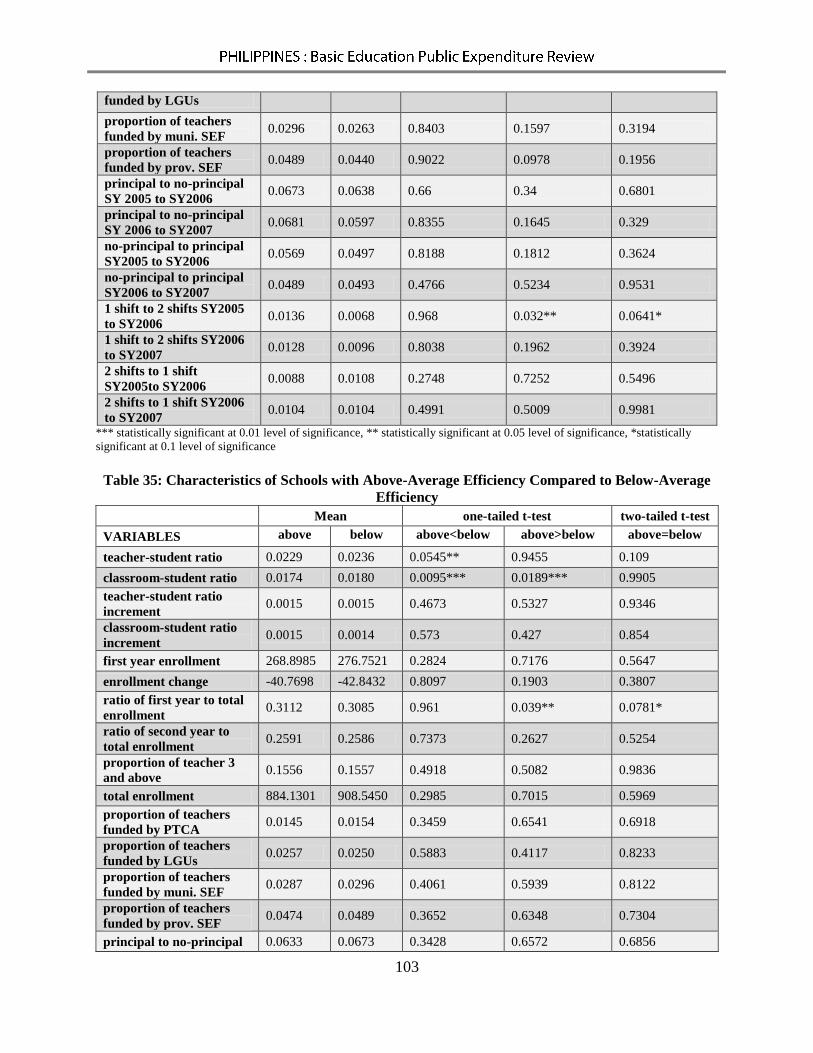
103
funded by LGUs
proportion of teachers
funded by muni. SEF 0.0296 0.0263 0.8403 0.1597 0.3194
proportion of teachers
funded by prov. SEF 0.0489 0.0440 0.9022 0.0978 0.1956
principal to no-principal
SY 2005 to SY2006 0.0673 0.0638 0.66 0.34 0.6801
principal to no-principal
SY 2006 to SY2007 0.0681 0.0597 0.8355 0.1645 0.329
no-principal to principal
SY2005 to SY2006 0.0569 0.0497 0.8188 0.1812 0.3624
no-principal to principal
SY2006 to SY2007 0.0489 0.0493 0.4766 0.5234 0.9531
1 shift to 2 shifts SY2005
to SY2006 0.0136 0.0068 0.968 0.032** 0.0641*
1 shift to 2 shifts SY2006
to SY2007 0.0128 0.0096 0.8038 0.1962 0.3924
2 shifts to 1 shift
SY2005to SY2006 0.0088 0.0108 0.2748 0.7252 0.5496
2 shifts to 1 shift SY2006
to SY2007 0.0104 0.0104 0.4991 0.5009 0.9981
*** statistically significant at 0.01 level of significance, ** statistically significant at 0.05 level of significance, *statistically
significant at 0.1 level of significance
Table 35: Characteristics of Schools with Above-Average Efficiency Compared to Below-Average
Efficiency
Mean one-tailed t-test two-tailed t-test
VARIABLES above below above<below above>below above=below
teacher-student ratio 0.0229 0.0236 0.0545** 0.9455 0.109
classroom-student ratio 0.0174 0.0180 0.0095*** 0.0189*** 0.9905
teacher-student ratio
increment 0.0015 0.0015 0.4673 0.5327 0.9346
classroom-student ratio
increment 0.0015 0.0014 0.573 0.427 0.854
first year enrollment 268.8985 276.7521 0.2824 0.7176 0.5647
enrollment change -40.7698 -42.8432 0.8097 0.1903 0.3807
ratio of first year to total
enrollment 0.3112 0.3085 0.961 0.039** 0.0781*
ratio of second year to
total enrollment 0.2591 0.2586 0.7373 0.2627 0.5254
proportion of teacher 3
and above 0.1556 0.1557 0.4918 0.5082 0.9836
total enrollment 884.1301 908.5450 0.2985 0.7015 0.5969
proportion of teachers
funded by PTCA 0.0145 0.0154 0.3459 0.6541 0.6918
proportion of teachers
funded by LGUs 0.0257 0.0250 0.5883 0.4117 0.8233
proportion of teachers
funded by muni. SEF 0.0287 0.0296 0.4061 0.5939 0.8122
proportion of teachers
funded by prov. SEF 0.0474 0.0489 0.3652 0.6348 0.7304
principal to no-principal 0.0633 0.0673 0.3428 0.6572 0.6856

104
SY2005 to SY2006
principal to no-principal
SY 2006 to SY2007 0.0657 0.0681 0.4051 0.5949 0.8102
no-principal to principal
SY 2005 to SY2006 0.0761 0.0569 0.9731 0.0269** 0.0539*
no-principal to principal
SY2006 to SY2007 0.0593 0.0489 0.8749 0.1251 0.2502
1 shift to 2 shifts SY2005
to SY2006 0.0088 0.0136 0.1272 0.8728 0.2543
1 shift to 2 shifts SY2006
to SY2007 0.0176 0.0128 0.8366 0.1634 0.3269
2 shifts to 1 shift
SY2005to SY2006 0.0120 0.0088 0.7847 0.2153 0.4306
2 shifts to 1 shift SY2006
to SY2007 0.0096 0.0104 0.4204 0.5796 0.8408
*** statistically significant at 0.01 level of significance, ** statistically significant at 0.05 level of significance, *statistically significant
at 0.1 level of significance
Table 36: Characteristics of Schools with Above-Average Efficiency
Compared to Average Efficiency (Truncated Sample)
Mean one-tailed t-test two-tailed t-test
VARIABLES above average above<average above>average above=average
teacher- student ratio 0.0229 0.0233 0.1715 0.8285 0.343
classroom-student ratio 0.0173 0.0171 0.7049 0.2951 0.5902
teacher-student ratio
increment 0.0011 0.0013 0.2084 0.7916 0.4167
classroom-student ratio
increment 0.0012 0.0012 0.4699 0.5301 0.9398
first year enrollment 266.7989 287.3278 0.0337** 0.9663 0.0674*
enrollment change -41.2648 -44.8645 0.964 0.036** 0.072*
ratio of first year to total
enrollment 0.3114 0.3116 0.4444 0.5556 0.8887
ratio of second year to total
enrollment 0.2596 0.2600 0.3078 0.6922 0.6156
proportion of teacher 3 and
above 0.1540 0.1474 0.8596 0.1404 0.2808
total enrollment 874.6549 940.5885 0.0423** 0.9577 0.0847*
proportion of teachers
funded by PTCA 0.0148 0.0163 0.282 0.718 0.564
proportion of teachers
funded by LGUs 0.0272 0.0308 0.1598 0.8402 0.3197
proportion of teachers
funded by muni. SEF 0.0277 0.0266 0.6327 0.3673 0.7346
proportion of teachers
funded by prov. SEF 0.0548 0.0421 0.9983 0.0017*** 0.0034***
principal to no-principal SY
2005 to SY2006 0.0686 0.0619 0.7685 0.2315 0.463
principal to no-principal SY
2006 to SY2007 0.0614 0.0583 0.6397 0.3603 0.7205
no-principal to principal SY
2005 to SY2006 0.0677 0.0490 0.9834 0.0166** 0.0332**
no-principal to principal
SY2006 to SY2007 0.0561 0.0499 0.7746 0.2254 0.4508
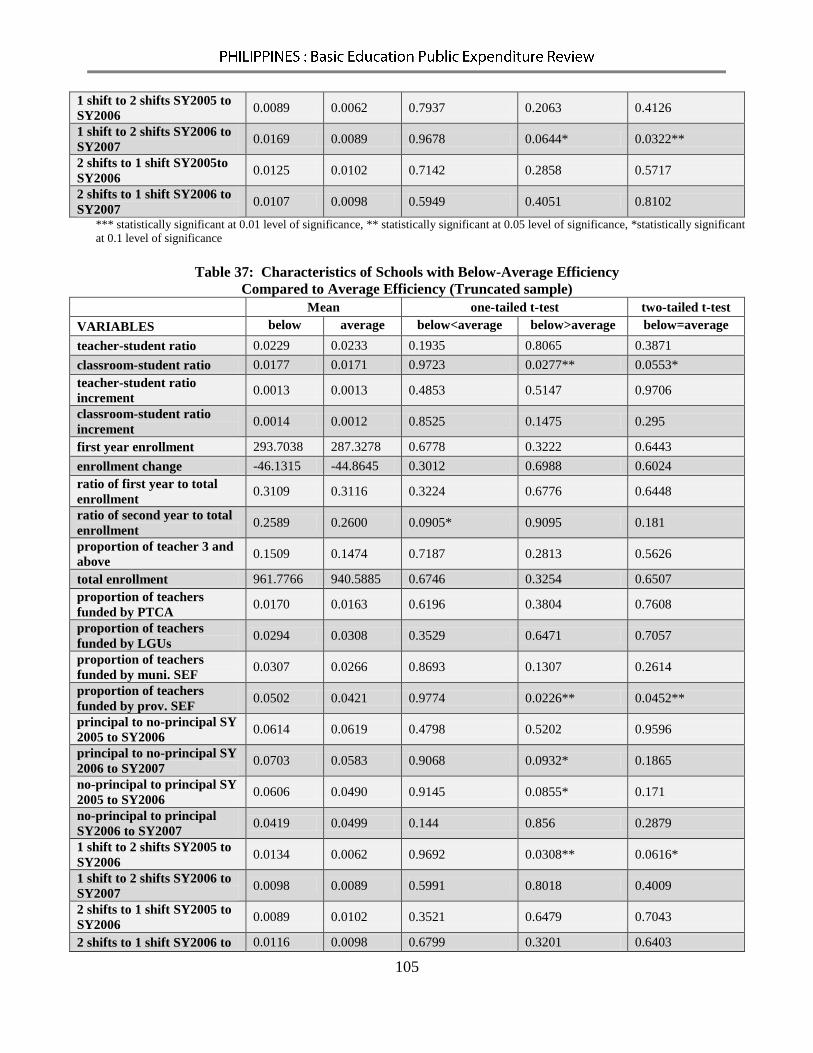
105
1 shift to 2 shifts SY2005 to
SY2006 0.0089 0.0062 0.7937 0.2063 0.4126
1 shift to 2 shifts SY2006 to
SY2007 0.0169 0.0089 0.9678 0.0644* 0.0322**
2 shifts to 1 shift SY2005to
SY2006 0.0125 0.0102 0.7142 0.2858 0.5717
2 shifts to 1 shift SY2006 to
SY2007 0.0107 0.0098 0.5949 0.4051 0.8102
*** statistically significant at 0.01 level of significance, ** statistically significant at 0.05 level of significance, *statistically significant
at 0.1 level of significance
Table 37: Characteristics of Schools with Below-Average Efficiency
Compared to Average Efficiency (Truncated sample)
Mean one-tailed t-test two-tailed t-test
VARIABLES below average below<average below>average below=average
teacher-student ratio 0.0229 0.0233 0.1935 0.8065 0.3871
classroom-student ratio 0.0177 0.0171 0.9723 0.0277** 0.0553*
teacher-student ratio
increment 0.0013 0.0013 0.4853 0.5147 0.9706
classroom-student ratio
increment 0.0014 0.0012 0.8525 0.1475 0.295
first year enrollment 293.7038 287.3278 0.6778 0.3222 0.6443
enrollment change -46.1315 -44.8645 0.3012 0.6988 0.6024
ratio of first year to total
enrollment 0.3109 0.3116 0.3224 0.6776 0.6448
ratio of second year to total
enrollment 0.2589 0.2600 0.0905* 0.9095 0.181
proportion of teacher 3 and
above 0.1509 0.1474 0.7187 0.2813 0.5626
total enrollment 961.7766 940.5885 0.6746 0.3254 0.6507
proportion of teachers
funded by PTCA 0.0170 0.0163 0.6196 0.3804 0.7608
proportion of teachers
funded by LGUs 0.0294 0.0308 0.3529 0.6471 0.7057
proportion of teachers
funded by muni. SEF 0.0307 0.0266 0.8693 0.1307 0.2614
proportion of teachers
funded by prov. SEF 0.0502 0.0421 0.9774 0.0226** 0.0452**
principal to no-principal SY
2005 to SY2006 0.0614 0.0619 0.4798 0.5202 0.9596
principal to no-principal SY
2006 to SY2007 0.0703 0.0583 0.9068 0.0932* 0.1865
no-principal to principal SY
2005 to SY2006 0.0606 0.0490 0.9145 0.0855* 0.171
no-principal to principal
SY2006 to SY2007 0.0419 0.0499 0.144 0.856 0.2879
1 shift to 2 shifts SY2005 to
SY2006 0.0134 0.0062 0.9692 0.0308** 0.0616*
1 shift to 2 shifts SY2006 to
SY2007 0.0098 0.0089 0.5991 0.8018 0.4009
2 shifts to 1 shift SY2005 to
SY2006 0.0089 0.0102 0.3521 0.6479 0.7043
2 shifts to 1 shift SY2006 to 0.0116 0.0098 0.6799 0.3201 0.6403

106
SY2007
*** statistically significant at 0.01 level of significance, ** statistically significant at 0.05 level of significance, *statistically significant
at 0.1 level of significance
Table 38: Characteristics of Schools with Above-Average Efficiency
Compared to Below-Average Efficiency
VARIABLES Mean one-tailed t-test two-tailed t-test
above below above<below above>below above=below
teacher-student ratio 0.0229 0.0229 0.5014 0.4986 0.9972
classroom-student ratio 0.0173 0.0177 0.0896* 0.9104 0.1792
teacher-student ratio
increment 0.0011 0.0013 0.2537 0.7463 0.5074
classroom-student ratio
increment 0.0012 0.0014 0.1594 0.8406 0.3188
first year enrollment 266.7989 293.7038 0.0337** 0.9663 0.0674*
enrollment change -41.2648 -46.1315 0.9686 0.0314** 0.0628*
ratio of first year to total
enrollment 0.3114 0.3109 0.6138 0.3862 0.7724
ratio of second year to total
enrollment 0.2596 0.2589 0.7783 0.2217 0.4435
proportion of teacher 3 and
above 0.1540 0.1509 0.6668 0.3332 0.6665
total enrollment 874.6549 961.7766 0.0403** 0.9597 0.0806*
proportion of teachers
funded by PTCA 0.0148 0.0170 0.2188 0.7812 0.4377
proportion of teachers
funded by LGUs 0.0272 0.0294 0.3054 0.6946 0.6108
proportion of teachers
funded by muni. SEF 0.0277 0.0307 0.2368 0.7632 0.4737
proportion of teachers
funded by prov. SEF 0.0548 0.0502 0.8186 0.1814 0.3629
principal to no-principal SY
2005 to SY2006 0.0686 0.0614 0.7531 0.2469 0.4937
principal to no-principal SY
2006 to SY2007 0.0614 0.0703 0.1976 0.8024 0.3953
no-principal to principal SY
2005 to SY2006 0.0677 0.0606 0.7545 0.2455 0.491
no-principal to principal
SY2006 to SY2007 0.0561 0.0419 0.9411 0.0589* 0.1178
1 shift to 2 shifts SY2005 to
SY2006 0.0089 0.0134 0.1574 0.8426 0.3148
1 shift to 2 shifts SY2006 to
SY2007 0.0169 0.0098 0.9292 0.1416 0.0708*
2 shifts to 1 shift SY2005 to
SY2006 0.0125 0.0089 0.794 0.206 0.4119
2 shifts to 1 shift SY2006 to
SY2007 0.0107 0.0116 0.4203 0.5797 0.8407
*** statistically significant at 0.01 level of significance, ** statistically significant at 0.05 level of significance, *statistically significant
at 0.1 level of significance

107
Annex 3: Reference Tables for Chapter 3
Table 39: Government Spending on Education, 20022008
In current prices 2002 2003 2004 2005 2006 2007 2008
National (with SBP) 125,311 129,311 128,673 134,129 146,516 166,482 184,148
National 123,311 127,311 126,967 133,278 144,145 165,354 182,502
1.0 Basic Education (DepEd + SBP) 106,051 108,363 107,352 112,744 123,066 141,017 157,168
1.2 DepEd
104,051
106,363
105,646
111,893
120,694
139,889
155,522
a School Building Program
(obligations)
2,000 2,000 1,706 851 2,372 1,128 1,646
c SUC
15,686 17,074 17,538 17,508 18,617 19,159 20,809
d. CHED
755 662 1,053 830 1,826 1,733 1,587
e. TESDA
2,161 2,609 2,085 2,403 2,359 3,724 3,246
f. DOST
658 603 645 644 648 849 1,338
Local Government Units' Spending 9,196 10,708 10,623 11,744 13,225 14,508 15,915
Basic Education Spending (with SBP) 115,247 119,071 117,975 124,488 136,291 155,525 173,083
Total Education Spending (w/ SBP) 134,507 140,018 139,296 145,873 159,741 180,990 200,063
Total Education Spending 132,507 138,018 137,590 145,022 157,370 179,862 198,417
Table 40: Government Spending on Education, 20022008 in Constant Prices
In 2002 prices 2002 2003 2004 2005 2006 2007 2008
National (with SBP) 125,311 126,040 118,326 115,878 120,271 132,086 135,440
National 123,311 124,091 116,758 115,143 118,324 131,192 134,229
1.0 Basic Education (DepEd + SBP) 106,051 105,622 98,720 97,403 101,021 111,882 115,597
1.0 DepEd 104,051 103,673 97,151 96,668 99,074 110,987 114,386
2 SUC 15,686 16,642 16,128 15,126 15,282 15,201 15,305
3 CHED 755 645 968 717 1,499 1,375 1,167
4 TESDA 2,161 2,543 1,918 2,076 1,936 2,955 2,387
5 DOST 658 587 593 556 532 673 984
Local 9,196 10,437 9,769 10,146 10,856 11,510 11,705
Basic Education Spending (with SBP) 115,247 116,059 108,489 107,549 111,877 123,393 127,302
Basic Education Spending (SAOB) 113,247 114,110 106,920 106,814 109,931 122,498 126,092
Total Education Spending (w/ SBP) 134,507 136,477 128,095 126,024 131,127 143,597 147,145
Total Education Spending 132,507 134,528 126,526 125,289 129,180 142,702 145,935

108
Table 41: Government Spending on Education, % GDP, 20022008
As % of GDP 2002 2003 2004 2005 2006 2007 2008
A. National (with SBP) 3.161% 2.996% 2.641% 2.467% 2.429% 2.504% 2.456%
A. National 3.111% 2.949% 2.606% 2.451% 2.651% 3.041% 3.356%
1.0 Basic Education (DepEd with SBP) 2.675% 2.510% 2.204% 2.073% 2.040% 2.121% 2.096%
1.0 DepEd OSEC 2.625% 2.464% 2.169% 2.058% 2.219% 2.572% 2.860%
2 SUC 0.396% 0.396% 0.360% 0.322% 0.309% 0.288% 0.278%
3 CHED 0.019% 0.015% 0.022% 0.015% 0.030% 0.026% 0.021%
4 TESDA 0.055% 0.060% 0.043% 0.044% 0.039% 0.056% 0.043%
5 DOST 0.017% 0.014% 0.013% 0.012% 0.011% 0.013% 0.018%
B. Local 0.232% 0.248% 0.218% 0.216% 0.219% 0.218% 0.212%
C. Total Education Spending (with SBP) 3.393% 3.244% 2.859% 2.683% 2.648% 2.722% 2.668%
C. Total Education Spending (SAOB data used) 3.343% 3.198% 2.824% 2.667% 2.609% 2.705% 2.646%
Table 42: Government Spending on Education, % of NG Spending Net of Debt Service,
20022008
2002 2003 2004 2005 2006 2007 2008
A. National (with SBP) 22.53% 21.60% 21.23% 20.71% 19.94% 18.89% 18.44%
A. National 22.17% 21.26% 20.95% 20.58% 19.62% 18.76% 18.27%
1.0 Basic Education (DepEd with SBP) 19.07 18.10 17.71 17.41 16.75 16.00 17.84
1.0 DepEd OSEC 18.71% 17.77% 17.43% 17.27% 16.43% 15.87% 15.57%
2 SUC 2.82% 2.85% 2.89% 2.70% 2.53% 2.17% 2.08%
3 CHED 0.14% 0.11% 0.17% 0.13% 0.25% 0.20% 0.16%
4 TESDA 0.39% 0.44% 0.34% 0.37% 0.32% 0.42% 0.32%
5 DOST 0.12% 0.10% 0.11% 0.10% 0.09% 0.10% 0.13%
B. Local 1.65% 1.79% 1.75% 1.81% 1.80% 1.65% 1.59%
C. Total Education Spending (with SBP) 24.18% 23.39% 22.98% 22.52% 21.74% 20.54% 20.03%
C. Total Education Spending (SAOB data used) 23.83% 23.05% 22.70% 22.39% 21.42% 20.41% 19.87%

109
Table 43: Sectoral Distribution of National Government Spending:
Obligation Basis; Net of Debt Servicing
P A R T I C U L A R S 2002 2003 2004 2005 2006 2007 2008
ECONOMIC SERVICES 27.33 28.64 28.02 26.91 30.20 33.39 31.64
Agriculture, Agrarian Reform, and
Natural Resources
6.29 6.69 5.78 7.28 6.49 7.87 5.63
Trade and Industry 0.73 0.46 0.58 0.52 0.55 0.68 0.51
Tourism 0.21 0.20 0.24 0.21 0.23 0.25 0.21
Power and Energy 0.27 0.19 0.30 0.27 0.36 0.66 0.52
Water Resource Development and
Flood Control
1.12 1.18 1.26 1.02 1.51 1.61 1.45
Communications, Roads, and Other
Transportation
9.73 11.32 11.12 8.87 12.78 14.38 12.77
Other Economic Services 0.47 0.28 0.52 0.52 0.35 0.60 2.74
Subsidy to Local Government Units 8.50 8.32 8.22 8.21 7.93 7.33 7.81
SOCIAL SERVICES 41.64 40.05 41.67 39.55 38.46 36.47 39.95
Education, Culture, and Manpower
Development
22.65 21.75 21.45 20.31 19.63 19.07 19.75
Basic Education 19.07 18.10 17.71 17.41 16.75 16.00 14.92
Health 2.62 2.09 2.41 2.15 2.19 2.08 3.03
Social Security and Labor Welfare 6.56 6.59 7.45 7.16 6.92 5.94 7.36
Land Distribution (CARP) 0.52 0.15 1.22 0.63 0.36 0.60 0.44
Housing and Community Development 0.14 0.51 0.27 0.47 0.83 0.90 0.53
Other Social Services 0.16 0.16 0.18 0.15 0.14 0.12 0.58
Subsidy to Local Government Units 8.99 8.80 8.69 8.68 8.38 7.75 8.25
DEFENSE 7.03 7.49 7.11 7.37 7.01 7.08 6.46
Domestic Security 7.03 7.49 7.11 7.37 7.01 7.08 6.46
GENERAL PUBLIC SERVICES 24.01 23.81 23.20 26.16 24.33 23.05 21.95
Table 44: Government Spending on Basic Education per Pupil
Nominal per pupil spending 2002 2003 2004 2005 2006 2007 2008
Basic Education (DepEd + SBP) 6,544.41 6,598.49 6,617.86 6,938.40 7,499.37 8,460.50 9,179.54
Local 567.51 652.01 654.88 722.72 805.90 870.42 929.53
Basic Education (DepEd +
SBP+Local))
7,111.92 7,250.51 7,272.74 7,661.12 8,305.27 9,330.92 10,109.08
Real per pupil spending
Basic Education (DepEd + SBP) 6,544.41 6,431.61 6,085.72 5,994.31 6,156.03 6,712.53 6,751.52
Local 567.51 635.52 602.22 624.38 661.54 690.59 683.67
Basic Education (DepEd + SBP+Local) 7,111.92 7,067.13 6,687.93 6,618.69 6,817.58 7,403.11 7,435.19
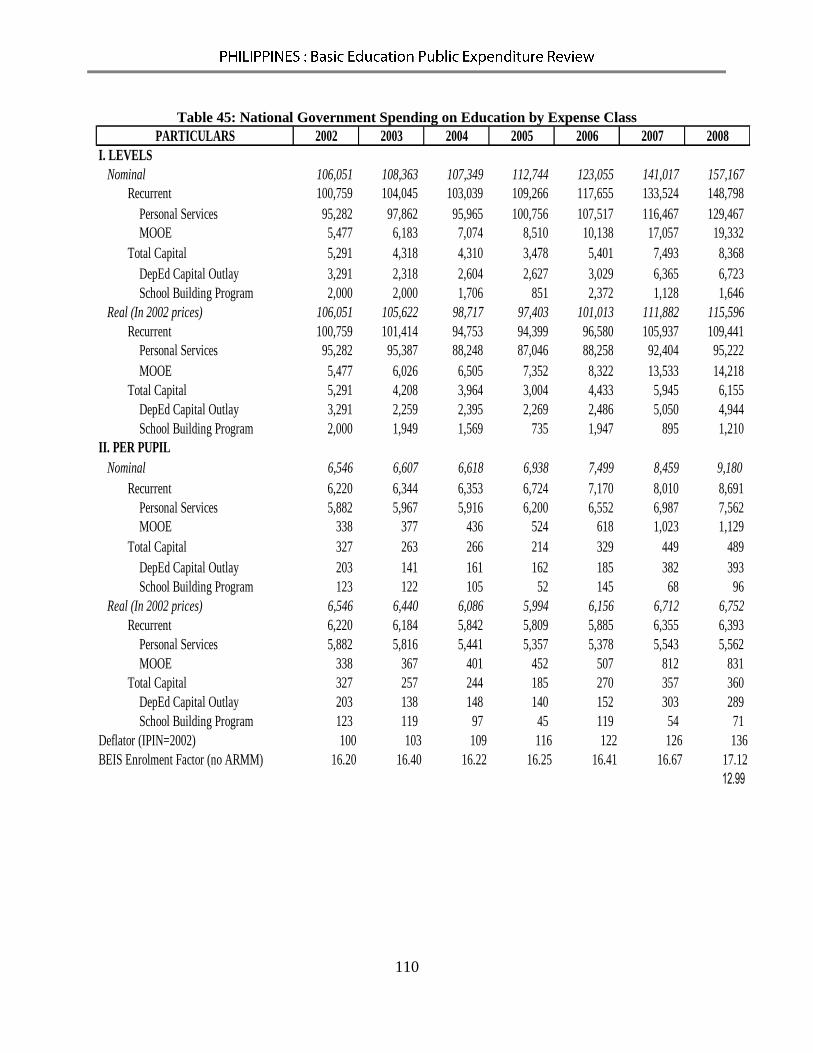
110
Table 45: National Government Spending on Education by Expense Class
PARTICULARS 2002 2003 2004 2005 2006 2007 2008
I. LEVELS
Nominal 106,051 108,363 107,349 112,744 123,055 141,017 157,167
Recurrent 100,759 104,045 103,039 109,266 117,655 133,524 148,798
Personal Services 95,282 97,862 95,965 100,756 107,517 116,467 129,467
MOOE 5,477 6,183 7,074 8,510 10,138 17,057 19,332
Total Capital 5,291 4,318 4,310 3,478 5,401 7,493 8,368
DepEd Capital Outlay 3,291 2,318 2,604 2,627 3,029 6,365 6,723
School Building Program 2,000 2,000 1,706 851 2,372 1,128 1,646
Real (In 2002 prices) 106,051 105,622 98,717 97,403 101,013 111,882 115,596
Recurrent 100,759 101,414 94,753 94,399 96,580 105,937 109,441
Personal Services 95,282 95,387 88,248 87,046 88,258 92,404 95,222
MOOE 5,477 6,026 6,505 7,352 8,322 13,533 14,218
Total Capital 5,291 4,208 3,964 3,004 4,433 5,945 6,155
DepEd Capital Outlay 3,291 2,259 2,395 2,269 2,486 5,050 4,944
School Building Program 2,000 1,949 1,569 735 1,947 895 1,210
II. PER PUPIL
Nominal 6,546 6,607 6,618 6,938 7,499 8,459 9,180
Recurrent 6,220 6,344 6,353 6,724 7,170 8,010 8,691
Personal Services 5,882 5,967 5,916 6,200 6,552 6,987 7,562
MOOE 338 377 436 524 618 1,023 1,129
Total Capital 327 263 266 214 329 449 489
DepEd Capital Outlay 203 141 161 162 185 382 393
School Building Program 123 122 105 52 145 68 96
Real (In 2002 prices) 6,546 6,440 6,086 5,994 6,156 6,712 6,752
Recurrent 6,220 6,184 5,842 5,809 5,885 6,355 6,393
Personal Services 5,882 5,816 5,441 5,357 5,378 5,543 5,562
MOOE 338 367 401 452 507 812 831
Total Capital 327 257 244 185 270 357 360
DepEd Capital Outlay 289
School Building Program 71
Deflator (IPIN=2002) 100 103 109 116 122 126 136
BEIS Enrolment Factor (no ARMM) 16.20 16.40 16.22 16.25 16.41 16.67 17.12
12.99
140148138203 303152
123 54119 97 45 119

111
Table 46: LGU Spending on Basic Education
2001 2002 2003 2004 2005 2006
I. Levels (In current prices, in PhP)
Total LGU Education Spending 9,705,422,039 9,196,343,958 10,707,605,461 10,623,102,817 11,743,676,176 13,224,541,768
General Fund 1,931,555,199 1,798,643,978 1,881,136,166 1,629,447,777 1,616,235,372 1,773,381,423
Special Education Fund 7,773,866,839 7,397,699,980 8,826,469,294 8,993,655,040 10,127,440,804 11,451,160,345
II. Shares of Total LGU Education
Spending
General Fund 19.9% 19.6% 17.6% 15.3% 13.8% 13.4%
Special Education Fund 80.1% 80.4% 82.4% 84.7% 86.2% 86.6%
III. Share of Total LGU Spending
Total LGU Education Spending 7.1% 6.5% 6.9% 6.6% 7.0% 6.9%
General Fund 1.4% 1.3% 1.2% 1.0% 1.0% 0.9%
Special Education Fund 5.7% 5.3% 5.7% 5.6% 6.0% 5.9%

112
Table 47: National Government Basic Education Appropriations, Allotments & Obligations, 20022008
2002 2003 2004 2005 2006 2007 2008
A. National 125,311 129,311 128,673 134,129 146,516 166,482 184,148
1 Basic Education 106,051 108,363 107,352 112,744 123,066 141,017 157,168
B. Local 9,196 10,708 10,623 11,744 13,225 13,225 13,225
C. Total Education Spending 134,507 140,018 139,296 145,873 159,741 179,707 197,373
II. Appropriations
A. National 124,343 127,429 130,821 134,427 143,538 163,034 176,227
1 Basic Education 105,083 106,481 109,500 113,042 120,087 137,569 149,247
B. Local 9,196 10,708 10,623 11,744 13,225 13,225 13,225
C. Total Education Spending 134,507 140,018 139,296 145,873 159,741 179,707 197,373
III. Allotments
A. National 127,250 130,336 130,566 138,064 150,690 174,595 196,406
1 Basic Education (Total Allotment) 107,990 109,388 109,245 116,679 127,240 149,130 169,426
1 Basic Education (Current + Automatic Appropriations) 105,145 106,140 106,331 113,978 123,993 141,036 160,256
B. Local 9,196 10,708 10,623 11,744 13,225 13,225 13,225
C. Total Education Spending 136,447 141,043 141,189 149,808 163,915 187,820 209,631
A. National 125,311 126,040 118,326 115,878 120,271 132,086 135,440
1 Basic Education 106,051 105,622 98,720 97,403 101,021 111,882 115,597
B. Local 9,196 10,437 9,769 10,146 10,856 10,493 9,727
C. Total Education Spending 134,507 136,477 128,095 126,024 131,127 142,579 145,167
II. Appropriations
A. National 124,343 124,206 120,302 116,136 117,826 129,351 121,424
1 Basic Education 105,083 103,788 100,695 97,661 98,576 109,147 103,149
B. Local 9,196 10,437 9,769 10,146 10,856 10,493 9,727
C. Total Education Spending 136,447 137,476 129,836 129,424 134,554 149,016 129,680
III. Allotments
A. National 127,250 127,039 120,067 119,278 123,698 138,523 144,456
1 Basic Education (Total Allotment) 107,990 106,621 100,460 100,803 104,448 118,319 124,612
1 Basic Education (Current + Automatic Appropriations) 105,145 103,456 97,781 98,469 101,783 111,897 117,868
B. Local 9,196 10,437 9,769 10,146 10,856 10,493 9,727
C. Total Education Spending 136,447 137,476 129,836 129,424 134,554 149,016 154,183
I. Obligations
In current prices, in Million PhP
I. Obligations
In 2002 prices, in Million PhP

113
2002 2003 2004 2005 2006 2007 2008
A. National
1 Basic Education 6,544 6,432 6,086 5,994 6,156 6,712 6,732
B. Local 568 636 602 624 662 629 567
II. Appropriations
A. National
1 Basic Education 6,485 6,320 6,207 6,010 6,007 6,547 6,024
B. Local 546 611 570 598 634 602 542
III. Allotments
A. National
1 Basic Education (Total Allotment) 6,664 6,492 6,193 6,204 6,365 7,098 7,258
1 Basic Education (Current + Automatic Appropriations) 6,489 6,300 6,028 6,060 6,202 6,713 6,865
B. Local 546 611 578 600 634 602 602
MEMO ITEMS:
IPIN (2002=100) 100.00 102.59 108.74 115.75 121.82 126.04 135.96
BEIS Enrollment no ARMM(in Millions) 16.20 16.42 16.22 16.25 16.41 16.67 17.17
Real Per Pupil, In PhP
I. Obligations

114
Table 48: Real Per-Pupil Spending by Region
Real Per-Pupil Spending (IPIN 2002=100)
2003
Regions Municipalities Cities Provinces Total-LGU NG Total Spending Region 1-Ilocos 87.18 94.76 121.91 303.85 7,371.62 7,675.47 Region 2-Cagayan 59.01 40.98 65.37 165.36 6,935.07 7,100.44 Region 3-Central Luzon 193.45 145.69 172.26 511.40 5,761.13 6,272.53 Region 4A-Calabarzon 399.68 384.09 335.26 1,119.03 5,722.64 6,841.67 Region 4B-Mimaropa 51.10 89.75 64.00 204.86 4,087.99 4,292.85 Region 5-Bicol 40.30 46.10 55.27 141.67 6,361.38 6,503.05 Region 6-Western Visayas 66.20 193.37 90.78 350.35 6,660.00 7,010.35
Real Per-Pupil Spending (IPIN 2002=100)
2002
Regions Municipalities Cities Provinces Total-LGU NG Total Spending Region 1-Ilocos 81.72 112.50 144.82 339.03 7,574.01 7,913.05 Region 2-Cagayan 61.61 38.38 57.68 157.67 6,975.06 7,132.73 Region 3-Central Luzon 215.03 116.57 212.97 544.57 5,427.31 5,971.88 Region 4A-Calabarzon 292.40 421.26 300.79 1,014.44 7,042.60 8,057.04 Region 4B-Mimaropa 101.89 53.46 91.50 246.84 - 246.84 Region 5-Bicol 37.21 28.25 49.56 115.02 6,560.56 6,675.58 Region 6-Western Visayas 65.40 213.86 85.52 364.77 6,778.77 7,143.55 Region 7-Central Visayas 53.32 203.72 54.31 311.36 5,286.21 5,597.56 Region 8-Eastern Visayas 45.24 40.22 48.68 134.14 6,761.73 6,895.87 Region 9-Zamboanga Peninsula 22.42 54.05 19.96 96.44 6,623.72 6,720.16 Region 10-Northern Mindanao 67.18 203.02 52.51 322.72 5,337.05 5,659.77 Region 11-Davao Region 56.05 271.23 54.72 382.00 6,737.99 7,119.99 Region 12-
SOCCSKSARGEN/Central Mindanao 65.26 137.72 53.23 256.21 5,160.50 5,416.71
Region 14-Cordillera Administrative
Region 54.86 216.62 69.85 341.33 7,886.54 8,227.87
Region 15-National Capital Region 134.55 1,984.44 - 2,118.99 5,763.74 7,882.73 Region 16-Caraga 38.11 59.54 32.34 129.99 6,316.39 6,446.38
Total 105.02 344.39 96.70 546.11 5,852.72 6,398.83

115
Region 7-Central Visayas 60.77 218.30 45.72 324.79 5,174.21 5,499.00 Region 8-Eastern Visayas 41.97 40.84 52.07 134.88 6,533.75 6,668.63 Region 9-Zamboanga Peninsula 23.95 45.36 19.74 89.05 6,459.66 6,548.71 Region 10-Northern Mindanao 78.27 181.18 57.26 316.71 5,885.40 6,202.12 Region 11-Davao Region 59.62 242.11 45.38 347.11 5,570.34 5,917.45 Region 12-
SOCCSKSARGEN/Central Mindanao 73.47 133.13 63.52 270.13 5,642.35 5,912.47
Region 14-Cordillera Administrative
Region 66.12 186.11 46.73 298.96 7,905.20 8,204.16
Region 15-National Capital Region 195.98 2,491.34 - 2,687.32 5,573.09 8,260.41 Region 16-Caraga 42.54 65.32 37.35 145.21 6,263.94 6,409.15
Total 122.12 393.35 95.11 610.57 5,774.76 6,385.33
Real Per-Pupil Spending (IPIN 2002=100)
2004
Regions Municipalities Cities Provinces Total-LGU NG Total Spending Region 1-Ilocos 73.31 96.90 127.27 297.48 7,080.89 7,378.37 Region 2-Cagayan 67.12 38.49 68.07 173.67 6,763.95 6,937.62 Region 3-Central Luzon 186.53 114.94 128.00 429.46 5,489.92 5,919.38 Region 4A-Calabarzon 343.29 302.90 472.99 1,119.18 4,725.65 5,844.83 Region 4B-Mimaropa 47.27 49.86 59.97 157.10 3,546.84 3,703.94 Region 5-Bicol 41.00 48.31 61.16 150.47 6,078.47 6,228.94 Region 6-Western Visayas 67.57 203.73 78.63 349.93 6,438.59 6,788.52 Region 7-Central Visayas 58.73 223.55 43.46 325.74 5,119.78 5,445.52 Region 8-Eastern Visayas 31.64 50.61 28.28 110.52 6,254.26 6,364.78 Region 9-Zamboanga Peninsula 24.28 34.39 26.43 85.10 6,040.64 6,125.74 Region 10-Northern Mindanao 67.80 188.37 58.00 314.17 5,774.54 6,088.71 Region 11-Davao Region 53.47 179.85 44.72 278.05 5,364.22 5,642.26 Region 12-
SOCCSKSARGEN/Central Mindanao 69.61 113.91 70.19 253.71 5,185.18 5,438.89
Region 14-Cordillera Administrative
Region 61.76 162.07 49.45 273.27 7,709.95 7,983.22
Region 15-National Capital Region 128.61 2,368.17 - 2,496.77 5,476.91 7,973.68 Region 16-Caraga 44.68 43.99 43.57 132.24 6,028.29 6,160.53 Total 106.83 365.36 106.24 578.43 5,457.63 6,036.06
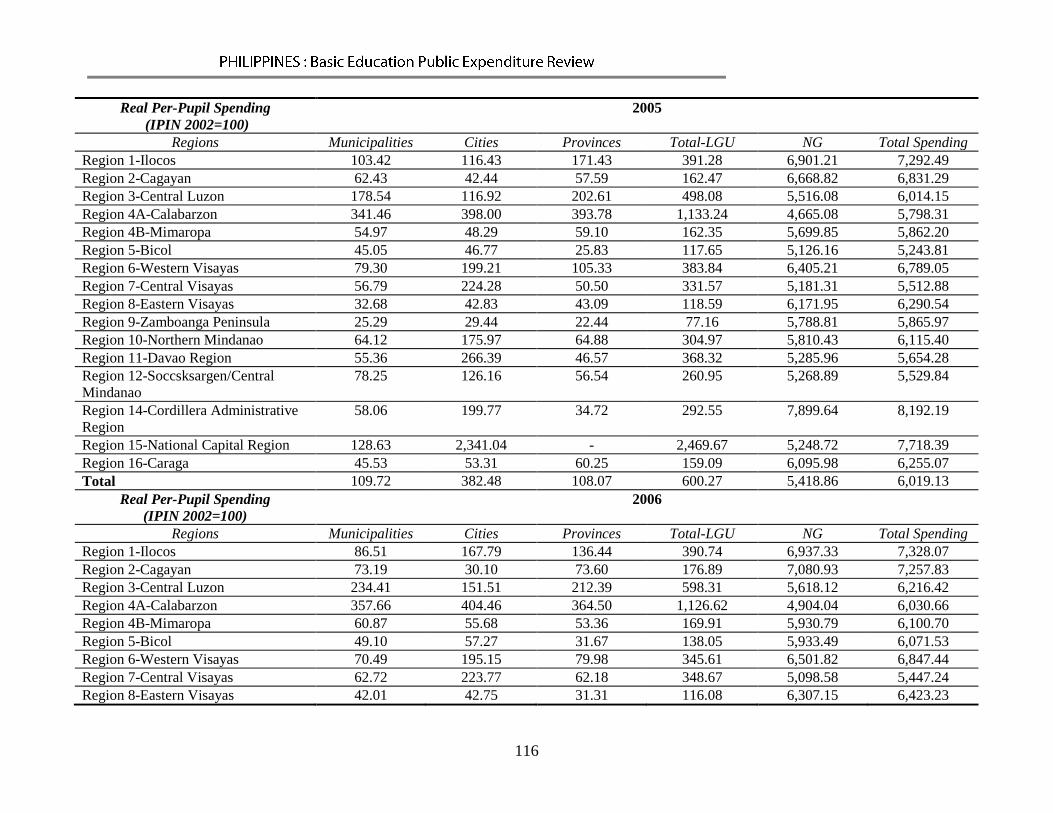
116
Real Per-Pupil Spending (IPIN 2002=100)
2005
Regions Municipalities Cities Provinces Total-LGU NG Total Spending Region 1-Ilocos 103.42 116.43 171.43 391.28 6,901.21 7,292.49 Region 2-Cagayan 62.43 42.44 57.59 162.47 6,668.82 6,831.29 Region 3-Central Luzon 178.54 116.92 202.61 498.08 5,516.08 6,014.15 Region 4A-Calabarzon 341.46 398.00 393.78 1,133.24 4,665.08 5,798.31 Region 4B-Mimaropa 54.97 48.29 59.10 162.35 5,699.85 5,862.20 Region 5-Bicol 45.05 46.77 25.83 117.65 5,126.16 5,243.81 Region 6-Western Visayas 79.30 199.21 105.33 383.84 6,405.21 6,789.05 Region 7-Central Visayas 56.79 224.28 50.50 331.57 5,181.31 5,512.88 Region 8-Eastern Visayas 32.68 42.83 43.09 118.59 6,171.95 6,290.54 Region 9-Zamboanga Peninsula 25.29 29.44 22.44 77.16 5,788.81 5,865.97 Region 10-Northern Mindanao 64.12 175.97 64.88 304.97 5,810.43 6,115.40 Region 11-Davao Region 55.36 266.39 46.57 368.32 5,285.96 5,654.28 Region 12-Soccsksargen/Central
Mindanao 78.25 126.16 56.54 260.95 5,268.89 5,529.84
Region 14-Cordillera Administrative
Region 58.06 199.77 34.72 292.55 7,899.64 8,192.19
Region 15-National Capital Region 128.63 2,341.04 - 2,469.67 5,248.72 7,718.39 Region 16-Caraga 45.53 53.31 60.25 159.09 6,095.98 6,255.07
Total 109.72 382.48 108.07 600.27 5,418.86 6,019.13
Real Per-Pupil Spending (IPIN 2002=100)
2006
Regions Municipalities Cities Provinces Total-LGU NG Total Spending Region 1-Ilocos 86.51 167.79 136.44 390.74 6,937.33 7,328.07 Region 2-Cagayan 73.19 30.10 73.60 176.89 7,080.93 7,257.83 Region 3-Central Luzon 234.41 151.51 212.39 598.31 5,618.12 6,216.42 Region 4A-Calabarzon 357.66 404.46 364.50 1,126.62 4,904.04 6,030.66 Region 4B-Mimaropa 60.87 55.68 53.36 169.91 5,930.79 6,100.70 Region 5-Bicol 49.10 57.27 31.67 138.05 5,933.49 6,071.53 Region 6-Western Visayas 70.49 195.15 79.98 345.61 6,501.82 6,847.44 Region 7-Central Visayas 62.72 223.77 62.18 348.67 5,098.58 5,447.24 Region 8-Eastern Visayas 42.01 42.75 31.31 116.08 6,307.15 6,423.23

117
Region 9-Zamboanga Peninsula 27.32 24.57 28.81 80.70 6,044.77 6,125.47 Region 10-Northern Mindanao 71.19 179.13 69.51 319.84 5,828.93 6,148.76 Region 11-Davao Region 58.36 262.18 51.24 371.79 5,553.40 5,925.19 Region 12-Soccsksargen/Central
Mindanao 84.19 117.28 73.64 275.10 5,503.04 5,778.14
Region 14-Cordillera Administrative
Region 63.65 156.62 65.76 286.04 7,834.17 8,120.20
Region 15-National Capital Region 60.26 2,599.02 - 2,659.28 4,944.25 7,603.53 Region 16-Caraga 42.76 52.28 55.64 150.68 6,141.90 6,292.57
Total 111.44 418.45 104.60 634.49 5,535.36 6,169.84

118
Table 49: Department of Education Regional Basic Education Spending (Obligations) by Expense Class, 20022008
Obligations by Expense
Class
2002 2003 2004 2005 2006 2007 2008
Total Amount of Current and Continuing Appropriation
Region 1-Ilocos 6,930,319,599.00 6,949,911,403.48 6,970,643,167.48 7,234,251,312.32 7,642,732,317.58 8,601,296,800.78 9,871,724,426.94
Personal Services 6,703,447,599.00 6,760,980,949.86 6,715,373,030.77 6,980,745,188.60 7,327,469,028.73 7,948,739,044.83 8,659,263,033.31
MOOE 224,372,000.00 104,683,429.62 238,678,722.11 206,632,074.77 239,328,641.47 561,529,544.00 754,232,428.88
Capital Outlays 2,500,000.00 84,247,024.00 16,591,414.60 46,874,048.95 75,934,647.38 91,028,211.95 458,228,964.75
Financial Expenses 0.00 0.00 0.00 0.00 0.00 0.00 0.00
Region 2-Cagayan 4,378,884,545.00 4,543,380,175.26 4,607,467,138.65 4,801,445,915.49 5,325,606,689.77 5,735,057,249.04 6,491,669,385.20
Personal Services 4,183,518,073.00 4,391,883,275.21 4,400,313,310.82 4,506,871,897.54 5,011,078,493.54 5,175,865,724.52 5,746,554,746.86
MOOE 183,306,961.00 150,096,900.05 189,853,436.28 241,852,747.95 241,488,126.61 443,032,803.72 531,796,203.90
Capital Outlays 12,059,511.00 1,400,000.00 17,300,391.55 52,721,270.00 73,040,069.62 116,158,720.80 213,299,182.44
Financial Expenses 0.00 0.00 0.00 0.00 0.00 0.00 19,252.00
Region 3-Central Luzon 9,039,619,085.57 10,009,258,178.77 10,125,610,910.18 10,926,115,175.11 11,884,944,417.62 12,953,663,804.20 14,862,463,561.36
Personal Services 8,695,933,873.94 9,630,133,727.54 9,676,918,905.15 10,324,396,952.70 10,961,342,254.92 11,518,308,319.88 13,000,003,350.49
MOOE 342,835,211.63 360,547,076.17 358,804,362.04 392,526,857.33 585,963,985.52 1,030,750,805.43 1,312,629,975.42
Capital Outlays 850,000.00 18,577,375.06 89,876,073.55 209,062,637.83 337,613,389.68 404,604,228.89 549,827,867.95
Financial Expenses 0.00 0.00 11,569.44 128,727.25 24,787.50 450.00 2,367.50
Region 4A-Calabarzon 13,334,275,650.63 11,394,152,766.52 10,031,736,629.20 10,691,213,636.71 12,087,221,162.07 13,482,145,102.27 15,133,508,477.59
Personal Services 12,819,949,557.00 10,954,197,451.15 9,591,269,353.20 10,148,371,486.64 11,145,065,370.31 11,993,322,548.14 13,323,292,115.06
MOOE 492,201,571.63 410,735,281.25 362,929,316.50 399,821,316.79 495,592,678.49 805,499,775.51 1,294,611,532.71
Capital Outlays 22,124,522.00 29,220,034.12 77,523,359.50 143,020,833.28 446,557,033.27 683,322,778.62 515,604,829.82
Financial Expenses 0.00 0.00 14,600.00 0.00 6,080.00 0.00 0.00
Region 4B-Mimaropa 0.00 2,516,615,088.02 2,275,308,716.58 3,926,303,665.16 4,348,754,410.53 4,896,117,089.23 5,412,069,532.00
Personal Services 0.00 2,342,721,609.34 2,120,526,396.93 3,692,983,322.60 4,012,086,380.30 4,256,736,193.25 4,762,764,290.12
MOOE 0.00 155,904,240.60 125,110,118.84 173,415,554.73 227,626,555.24 438,805,617.82 446,457,918.39
Capital Outlays 0.00 17,989,238.08 29,667,600.81 59,904,787.83 109,040,356.60 200,575,278.16 202,847,323.49
Financial Expenses 0.00 0.00 4,600.00 0.00 1,118.39 0.00 0.00
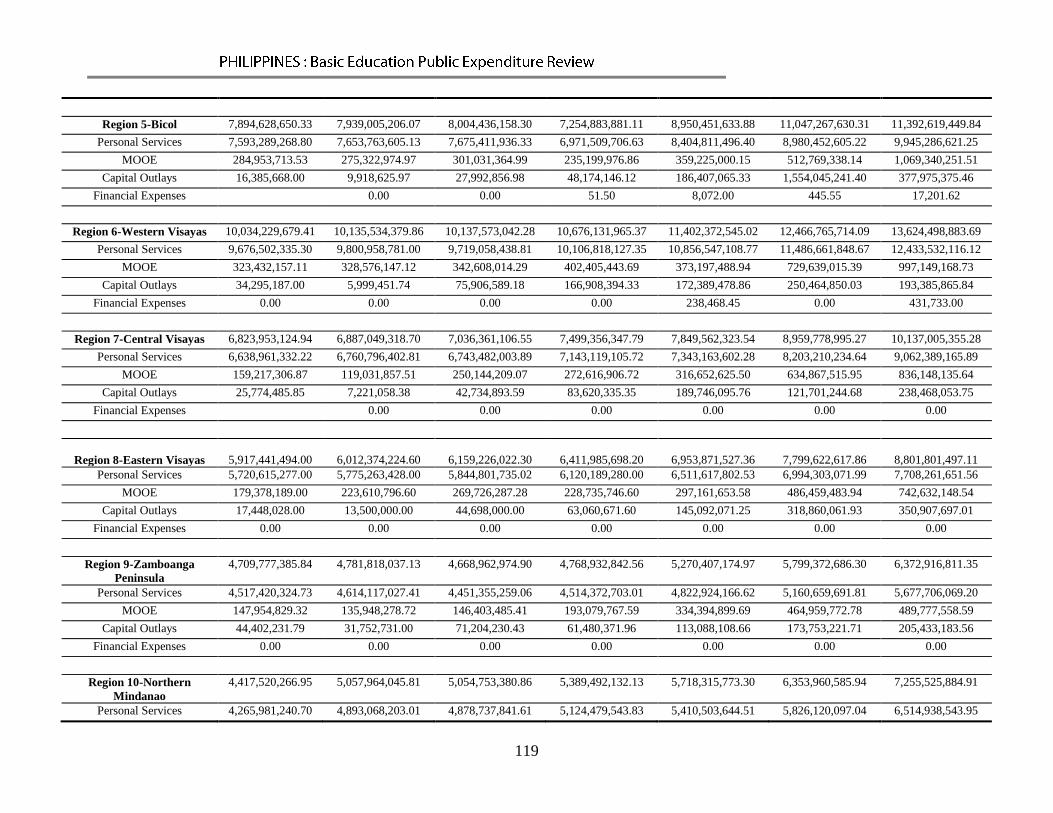
119
Region 5-Bicol 7,894,628,650.33 7,939,005,206.07 8,004,436,158.30 7,254,883,881.11 8,950,451,633.88 11,047,267,630.31 11,392,619,449.84
Personal Services 7,593,289,268.80 7,653,763,605.13 7,675,411,936.33 6,971,509,706.63 8,404,811,496.40 8,980,452,605.22 9,945,286,621.25
MOOE 284,953,713.53 275,322,974.97 301,031,364.99 235,199,976.86 359,225,000.15 512,769,338.14 1,069,340,251.51
Capital Outlays 16,385,668.00 9,918,625.97 27,992,856.98 48,174,146.12 186,407,065.33 1,554,045,241.40 377,975,375.46
Financial Expenses 0.00 0.00 51.50 8,072.00 445.55 17,201.62
Region 6-Western Visayas 10,034,229,679.41 10,135,534,379.86 10,137,573,042.28 10,676,131,965.37 11,402,372,545.02 12,466,765,714.09 13,624,498,883.69
Personal Services 9,676,502,335.30 9,800,958,781.00 9,719,058,438.81 10,106,818,127.35 10,856,547,108.77 11,486,661,848.67 12,433,532,116.12
MOOE 323,432,157.11 328,576,147.12 342,608,014.29 402,405,443.69 373,197,488.94 729,639,015.39 997,149,168.73
Capital Outlays 34,295,187.00 5,999,451.74 75,906,589.18 166,908,394.33 172,389,478.86 250,464,850.03 193,385,865.84
Financial Expenses 0.00 0.00 0.00 0.00 238,468.45 0.00 431,733.00
Region 7-Central Visayas 6,823,953,124.94 6,887,049,318.70 7,036,361,106.55 7,499,356,347.79 7,849,562,323.54 8,959,778,995.27 10,137,005,355.28
Personal Services 6,638,961,332.22 6,760,796,402.81 6,743,482,003.89 7,143,119,105.72 7,343,163,602.28 8,203,210,234.64 9,062,389,165.89
MOOE 159,217,306.87 119,031,857.51 250,144,209.07 272,616,906.72 316,652,625.50 634,867,515.95 836,148,135.64
Capital Outlays 25,774,485.85 7,221,058.38 42,734,893.59 83,620,335.35 189,746,095.76 121,701,244.68 238,468,053.75
Financial Expenses 0.00 0.00 0.00 0.00 0.00 0.00
Region 8-Eastern Visayas
5,917,441,494.00
6,012,374,224.60
6,159,226,022.30
6,411,985,698.20
6,953,871,527.36
7,799,622,617.86
8,801,801,497.11
Personal Services 5,720,615,277.00 5,775,263,428.00 5,844,801,735.02 6,120,189,280.00 6,511,617,802.53 6,994,303,071.99 7,708,261,651.56
MOOE 179,378,189.00 223,610,796.60 269,726,287.28 228,735,746.60 297,161,653.58 486,459,483.94 742,632,148.54
Capital Outlays 17,448,028.00 13,500,000.00 44,698,000.00 63,060,671.60 145,092,071.25 318,860,061.93 350,907,697.01
Financial Expenses 0.00 0.00 0.00 0.00 0.00 0.00 0.00
Region 9-Zamboanga
Peninsula
4,709,777,385.84 4,781,818,037.13 4,668,962,974.90 4,768,932,842.56 5,270,407,174.97 5,799,372,686.30 6,372,916,811.35
Personal Services 4,517,420,324.73 4,614,117,027.41 4,451,355,259.06 4,514,372,703.01 4,822,924,166.62 5,160,659,691.81 5,677,706,069.20
MOOE 147,954,829.32 135,948,278.72 146,403,485.41 193,079,767.59 334,394,899.69 464,959,772.78 489,777,558.59
Capital Outlays 44,402,231.79 31,752,731.00 71,204,230.43 61,480,371.96 113,088,108.66 173,753,221.71 205,433,183.56
Financial Expenses 0.00 0.00 0.00 0.00 0.00 0.00 0.00
Region 10-Northern
Mindanao
4,417,520,266.95 5,057,964,045.81 5,054,753,380.86 5,389,492,132.13 5,718,315,773.30 6,353,960,585.94 7,255,525,884.91
Personal Services 4,265,981,240.70 4,893,068,203.01 4,878,737,841.61 5,124,479,543.83 5,410,503,644.51 5,826,120,097.04 6,514,938,543.95

120
MOOE 136,119,026.25 161,895,842.80 159,221,270.17 230,132,493.00 238,166,352.24 418,578,930.56 500,437,457.84
Capital Outlays 15,420,000.00 3,000,000.00 16,794,269.08 34,867,052.82 69,622,534.08 109,261,147.38 239,385,471.12
Financial Expenses 0.00 0.00 0.00 13,042.48 23,242.47 410.96 764,412.00
Region 11-Davao Region 5,707,334,915.99 4,860,446,487.54 4,860,444,591.31 4,992,167,775.31 5,466,559,781.54 6,109,230,653.69 6,959,829,408.52
Personal Services 5,509,907,392.02 4,638,602,150.92 4,562,483,444.74 4,746,314,696.59 5,023,548,836.32 5,560,493,491.12 6,138,764,673.44
MOOE 175,060,753.97 181,393,844.62 226,493,024.57 192,318,417.72 289,340,701.30 429,734,939.42 648,258,939.16
Capital Outlays 22,366,770.00 40,450,492.00 71,468,122.00 53,534,661.00 153,670,243.92 119,002,223.15 172,805,795.92
Financial Expenses 0.00 0.00 0.00 0.00 0.00 0.00 0.00
Region 12-
Soccsksargen/Central
Mindanao
3,925,606,913.71 4,428,392,044.69 4,223,082,790.46 4,570,441,736.04 5,088,315,635.58 5,639,706,021.45 6,445,084,847.32
Personal Services 3,771,350,703.48 4,273,486,008.00 4,023,000,814.50 4,332,451,990.00 4,654,616,430.47 5,010,772,975.28 5,588,452,323.82
MOOE 152,256,210.23 153,929,784.17 183,077,475.96 189,243,617.85 264,886,637.92 559,816,318.73 581,674,048.42
Capital Outlays 2,000,000.00 976,252.52 17,004,500.00 48,746,128.19 168,812,567.19 69,116,727.44 274,958,475.08
Financial Expenses 0.00 0.00 0.00 0.00 0.00 0.00
Region 14-Cordillera
Administrative Region
2,417,286,349.54 2,509,965,846.41 2,532,600,454.75 2,713,647,348.20 2,839,993,999.87 3,191,121,685.82 3,581,223,444.92
Personal Services 2,294,556,913.51 2,361,027,771.00 2,387,778,228.50 2,513,922,715.21 2,615,140,234.67 2,854,394,794.93 3,151,267,922.18
MOOE 101,206,436.03 101,287,385.41 114,893,838.25 122,371,649.99 132,772,010.00 240,117,435.95 269,425,551.63
Capital Outlays 21,523,000.00 47,650,690.00 29,928,388.00 77,352,983.00 92,081,755.20 96,609,454.94 160,529,971.11
Financial Expenses 0.00 0.00 0.00 0.00 0.00 0.00 0.00
Region 15-National Capital
Region
9,765,642,284.00 9,909,763,497.06 10,258,202,963.86 10,622,538,275.37 10,812,437,249.09 12,431,719,312.89 14,562,056,552.33
Personal Services 9,066,688,118.00 9,362,707,112.11 9,506,959,484.15 9,850,492,428.20 10,038,942,616.04 11,107,969,363.14 12,847,742,232.53
MOOE 640,079,166.00 453,230,584.95 619,469,068.71 547,780,925.57 599,681,765.18 829,096,855.06 1,192,360,933.30
Capital Outlays 58,875,000.00 93,825,800.00 131,756,061.00 224,264,921.60 173,812,867.87 494,653,094.69 521,953,386.50
Financial Expenses 0.00 0.00 18,350.00 0.00 0.00 0.00 0.00
Region 16-Caraga 3,262,257,372.00 3,336,039,204.00 3,284,475,862.00 3,535,345,514.59 3,735,822,254.28 4,265,015,522.15 4,910,948,630.58
Personal Services 3,102,358,550.00 3,186,183,493.00 3,118,346,045.00 3,328,032,975.05 3,529,111,741.21 3,826,006,925.81 4,221,677,862.62
MOOE 134,750,029.00 123,986,052.00 134,622,446.00 175,230,674.54 177,046,573.37 342,324,848.75 398,519,086.67
Capital Outlays 25,148,793.00 25,869,659.00 31,493,859.00 32,081,865.00 29,663,939.70 96,673,575.08 290,751,681.29

121
Financial Expenses 0.00 0.00 13,512.00 0.00 0.00 10,172.51 0.00
Total Regional 98,558,777,316.91 101,271,669,903.92 100,230,885,909.66 106,014,253,221.46 115,377,368,896.00 129,731,841,471.29 145,814,946,148.94
Personal Services 94,560,480,558.70 97,399,890,995.49 95,415,816,228.48 100,405,072,119.67 107,667,969,207.62 115,904,016,930.27 128,781,896,718.40
MOOE 3,677,123,561.57 3,440,180,476.56 4,023,066,440.47 4,203,364,171.70 5,172,525,695.20 8,927,983,001.15 12,065,451,339.33
Capital Outlays 321,173,196.64 431,598,431.87 791,940,609.27 1,405,675,108.86 2,536,572,224.37 4,899,830,060.85 4,966,363,125.09
Financial Expenses 0.00 0.00 62,631.44 141,821.23 301,768.81 11,479.02 1,234,966.12

122
Table 50: Department of Education Regional Basic Education Spending (Obligations) by Levels by Expense Class, 20022008
II. By Levels 2002 2003 2004 2005 2006 2007 2008
Region 1-Ilocos
Division Offices-
Elementary Education
4,405,157,000 4,584,000,850 4,596,409,813 4,730,167,798 4,674,458,306 5,154,912,536 5,187,012,541
Personal Services 3,995,373,000 4,560,387,079 4,559,984,813 4,683,274,103 4,631,037,332 5,030,433,098 5,036,456,905
MOOE 37,294,000 23,613,771 36,425,000 46,893,695 43,420,974 124,479,438 150,555,636
Capital Outlays 0 0 0 0 0 0 0
Financial Expenses
Division Offices-
Secondary Education
1,849,513,000 1,930,862,005 1,961,305,000 2,036,875,264 2,082,686,800 2,364,756,561 2,399,084,086
Personal Services 1,623,809,000 1,881,411,204 1,883,347,000 1,966,807,391 2,001,580,757 2,197,663,165 2,219,098,825
MOOE 75,617,000 49,450,801 77,958,000 70,067,873 81,106,044 167,093,395 179,985,262
Capital Outlays 0 0 0 0 0 0 0
Financial Expenses 0 0 0 0 0
Region 2-Cagayan
Division Offices-
Elementary Education
2,886,664,605 3,032,085,664 3,053,801,000 3,302,380,379 3,282,215,165 3,535,199,620 3,702,584,996
Personal Services 2,826,641,144 2,982,694,947 2,992,040,000 3,231,364,769 3,199,582,404 3,433,928,642 3,493,266,583
MOOE 60,023,461 49,390,717 61,761,000 71,015,610 82,632,761 97,804,454 201,341,156
Capital Outlays 0 0 0 0 0 3,466,524 7,977,258
Financial Expenses
Division Offices-
Secondary Education
1,049,673,339 1,148,572,952 1,160,138,533 1,327,526,939 1,326,465,491 1,477,886,215 1,598,606,823
Personal Services 987,918,633 1,087,444,143 1,094,822,000 1,241,178,403 1,245,921,270 1,356,205,390 1,442,598,962
MOOE 61,754,706 61,128,809 65,316,533 86,348,536 80,544,220 121,680,825 134,242,357
Capital Outlays 0 0 0 0 0 0 21,746,252
Financial Expenses 0 0 0 0 19,252
Region 3-Central Luzon
Division Offices-
Elementary Education
6,588,225,972 6,804,107,007 6,803,555,708 7,182,681,874 7,117,861,424 7,970,588,496 8,150,304,635
Personal Services 6,473,039,612 6,684,373,811 6,676,310,179 7,059,568,004 6,993,566,196 7,576,736,745 7,760,268,000
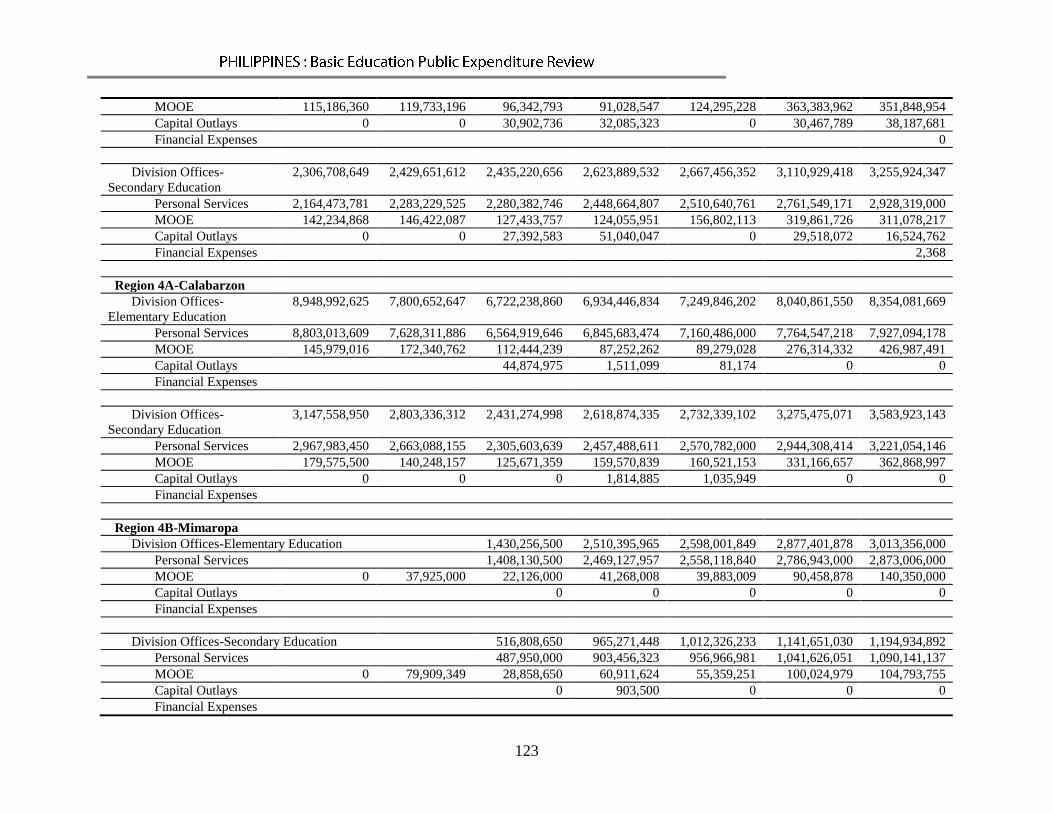
123
MOOE 115,186,360 119,733,196 96,342,793 91,028,547 124,295,228 363,383,962 351,848,954
Capital Outlays 0 0 30,902,736 32,085,323 0 30,467,789 38,187,681
Financial Expenses 0
Division Offices-
Secondary Education
2,306,708,649 2,429,651,612 2,435,220,656 2,623,889,532 2,667,456,352 3,110,929,418 3,255,924,347
Personal Services 2,164,473,781 2,283,229,525 2,280,382,746 2,448,664,807 2,510,640,761 2,761,549,171 2,928,319,000
MOOE 142,234,868 146,422,087 127,433,757 124,055,951 156,802,113 319,861,726 311,078,217
Capital Outlays 0 0 27,392,583 51,040,047 0 29,518,072 16,524,762
Financial Expenses 2,368
Region 4A-Calabarzon
Division Offices-
Elementary Education
8,948,992,625 7,800,652,647 6,722,238,860 6,934,446,834 7,249,846,202 8,040,861,550 8,354,081,669
Personal Services 8,803,013,609 7,628,311,886 6,564,919,646 6,845,683,474 7,160,486,000 7,764,547,218 7,927,094,178
MOOE 145,979,016 172,340,762 112,444,239 87,252,262 89,279,028 276,314,332 426,987,491
Capital Outlays 44,874,975 1,511,099 81,174 0 0
Financial Expenses
Division Offices-
Secondary Education
3,147,558,950 2,803,336,312 2,431,274,998 2,618,874,335 2,732,339,102 3,275,475,071 3,583,923,143
Personal Services 2,967,983,450 2,663,088,155 2,305,603,639 2,457,488,611 2,570,782,000 2,944,308,414 3,221,054,146
MOOE 179,575,500 140,248,157 125,671,359 159,570,839 160,521,153 331,166,657 362,868,997
Capital Outlays 0 0 0 1,814,885 1,035,949 0 0
Financial Expenses
Region 4B-Mimaropa
Division Offices-Elementary Education 1,430,256,500 2,510,395,965 2,598,001,849 2,877,401,878 3,013,356,000
Personal Services 1,408,130,500 2,469,127,957 2,558,118,840 2,786,943,000 2,873,006,000
MOOE 0 37,925,000 22,126,000 41,268,008 39,883,009 90,458,878 140,350,000
Capital Outlays 0 0 0 0 0
Financial Expenses
Division Offices-Secondary Education 516,808,650 965,271,448 1,012,326,233 1,141,651,030 1,194,934,892
Personal Services 487,950,000 903,456,323 956,966,981 1,041,626,051 1,090,141,137
MOOE 0 79,909,349 28,858,650 60,911,624 55,359,251 100,024,979 104,793,755
Capital Outlays 0 903,500 0 0 0
Financial Expenses
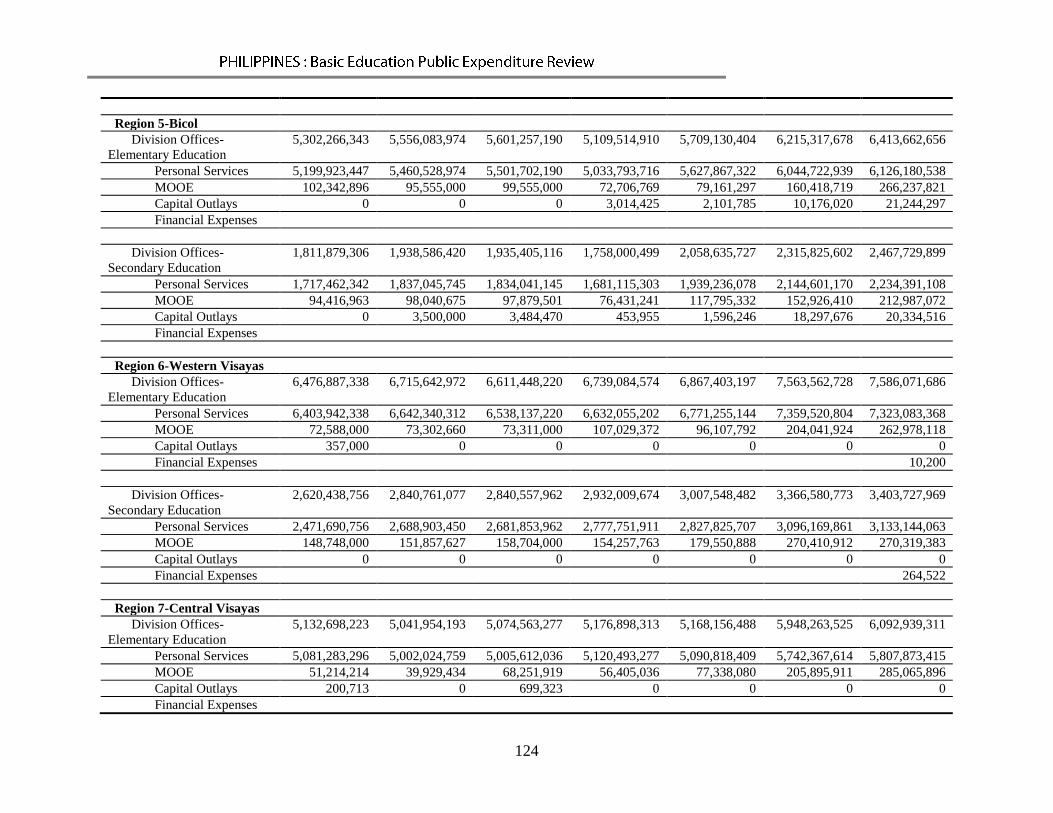
124
Region 5-Bicol
Division Offices-
Elementary Education
5,302,266,343 5,556,083,974 5,601,257,190 5,109,514,910 5,709,130,404 6,215,317,678 6,413,662,656
Personal Services 5,199,923,447 5,460,528,974 5,501,702,190 5,033,793,716 5,627,867,322 6,044,722,939 6,126,180,538
MOOE 102,342,896 95,555,000 99,555,000 72,706,769 79,161,297 160,418,719 266,237,821
Capital Outlays 0 0 0 3,014,425 2,101,785 10,176,020 21,244,297
Financial Expenses
Division Offices-
Secondary Education
1,811,879,306 1,938,586,420 1,935,405,116 1,758,000,499 2,058,635,727 2,315,825,602 2,467,729,899
Personal Services 1,717,462,342 1,837,045,745 1,834,041,145 1,681,115,303 1,939,236,078 2,144,601,170 2,234,391,108
MOOE 94,416,963 98,040,675 97,879,501 76,431,241 117,795,332 152,926,410 212,987,072
Capital Outlays 0 3,500,000 3,484,470 453,955 1,596,246 18,297,676 20,334,516
Financial Expenses
Region 6-Western Visayas
Division Offices-
Elementary Education
6,476,887,338 6,715,642,972 6,611,448,220 6,739,084,574 6,867,403,197 7,563,562,728 7,586,071,686
Personal Services 6,403,942,338 6,642,340,312 6,538,137,220 6,632,055,202 6,771,255,144 7,359,520,804 7,323,083,368
MOOE 72,588,000 73,302,660 73,311,000 107,029,372 96,107,792 204,041,924 262,978,118
Capital Outlays 357,000 0 0 0 0 0 0
Financial Expenses 10,200
Division Offices-
Secondary Education
2,620,438,756 2,840,761,077 2,840,557,962 2,932,009,674 3,007,548,482 3,366,580,773 3,403,727,969
Personal Services 2,471,690,756 2,688,903,450 2,681,853,962 2,777,751,911 2,827,825,707 3,096,169,861 3,133,144,063
MOOE 148,748,000 151,857,627 158,704,000 154,257,763 179,550,888 270,410,912 270,319,383
Capital Outlays 0 0 0 0 0 0 0
Financial Expenses 264,522
Region 7-Central Visayas
Division Offices-
Elementary Education
5,132,698,223 5,041,954,193 5,074,563,277 5,176,898,313 5,168,156,488 5,948,263,525 6,092,939,311
Personal Services 5,081,283,296 5,002,024,759 5,005,612,036 5,120,493,277 5,090,818,409 5,742,367,614 5,807,873,415
MOOE 51,214,214 39,929,434 68,251,919 56,405,036 77,338,080 205,895,911 285,065,896
Capital Outlays 200,713 0 699,323 0 0 0 0
Financial Expenses
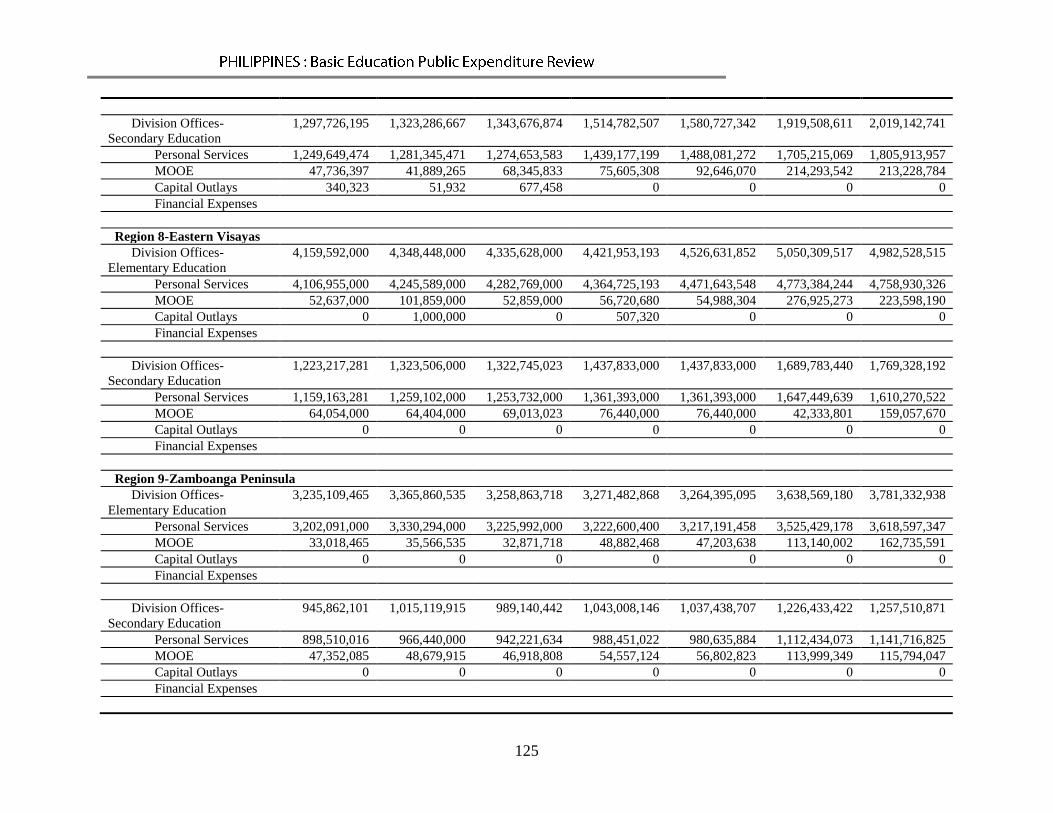
125
Division Offices-
Secondary Education
1,297,726,195 1,323,286,667 1,343,676,874 1,514,782,507 1,580,727,342 1,919,508,611 2,019,142,741
Personal Services 1,249,649,474 1,281,345,471 1,274,653,583 1,439,177,199 1,488,081,272 1,705,215,069 1,805,913,957
MOOE 47,736,397 41,889,265 68,345,833 75,605,308 92,646,070 214,293,542 213,228,784
Capital Outlays 340,323 51,932 677,458 0 0 0 0
Financial Expenses
Region 8-Eastern Visayas
Division Offices-
Elementary Education
4,159,592,000 4,348,448,000 4,335,628,000 4,421,953,193 4,526,631,852 5,050,309,517 4,982,528,515
Personal Services 4,106,955,000 4,245,589,000 4,282,769,000 4,364,725,193 4,471,643,548 4,773,384,244 4,758,930,326
MOOE 52,637,000 101,859,000 52,859,000 56,720,680 54,988,304 276,925,273 223,598,190
Capital Outlays 0 1,000,000 0 507,320 0 0 0
Financial Expenses
Division Offices-
Secondary Education
1,223,217,281 1,323,506,000 1,322,745,023 1,437,833,000 1,437,833,000 1,689,783,440 1,769,328,192
Personal Services 1,159,163,281 1,259,102,000 1,253,732,000 1,361,393,000 1,361,393,000 1,647,449,639 1,610,270,522
MOOE 64,054,000 64,404,000 69,013,023 76,440,000 76,440,000 42,333,801 159,057,670
Capital Outlays 0 0 0 0 0 0 0
Financial Expenses
Region 9-Zamboanga Peninsula
Division Offices-
Elementary Education
3,235,109,465 3,365,860,535 3,258,863,718 3,271,482,868 3,264,395,095 3,638,569,180 3,781,332,938
Personal Services 3,202,091,000 3,330,294,000 3,225,992,000 3,222,600,400 3,217,191,458 3,525,429,178 3,618,597,347
MOOE 33,018,465 35,566,535 32,871,718 48,882,468 47,203,638 113,140,002 162,735,591
Capital Outlays 0 0 0 0 0 0 0
Financial Expenses
Division Offices-
Secondary Education
945,862,101 1,015,119,915 989,140,442 1,043,008,146 1,037,438,707 1,226,433,422 1,257,510,871
Personal Services 898,510,016 966,440,000 942,221,634 988,451,022 980,635,884 1,112,434,073 1,141,716,825
MOOE 47,352,085 48,679,915 46,918,808 54,557,124 56,802,823 113,999,349 115,794,047
Capital Outlays 0 0 0 0 0 0 0
Financial Expenses

126
Region 10-Northern Mindanao
Division Offices-
Elementary Education
3,025,351,580 3,593,699,546 3,595,497,204 3,698,711,867 3,743,058,445 4,116,932,801 4,245,865,150
Personal Services 2,987,496,076 3,545,876,000 3,544,732,622 3,612,415,928 3,686,769,531 3,998,487,314 4,087,526,891
MOOE 37,855,504 47,823,546 50,764,581 86,294,738 56,288,914 118,445,423 157,626,610
Capital Outlays 0 0 0 0 0
Financial Expenses
Division Offices-
Secondary Education
929,423,294 1,124,509,324 1,110,798,138 1,174,565,373 1,209,056,783 1,368,529,526 1,433,573,417
Personal Services 877,721,619 1,061,390,000 1,057,335,507 1,102,260,456 1,139,050,318 1,248,857,220 1,317,867,035
MOOE 51,701,675 63,119,324 53,462,630 72,293,075 70,003,123 119,672,021 115,676,382
Capital Outlays 0 0 0 0 0
Financial Expenses
Region 11-Davao Region
Division Offices-
Elementary Education
3,811,617,672 3,271,689,896 3,208,739,588 3,276,087,911 3,832,460,896 3,828,679,930 3,928,009,609
Personal Services 3,757,874,585 3,205,411,000 3,132,620,529 3,235,853,961 3,763,850,924 3,705,709,160 3,745,389,824
MOOE 53,743,087 49,248,104 63,211,837 40,233,950 68,609,972 122,970,770 182,619,785
Capital Outlays 0 17,030,792 12,907,222 0 0 0 0
Financial Expenses 0 0 0 0
Division Offices-
Secondary Education
1,414,998,335 1,230,571,735 1,237,727,927 1,298,322,618 875,344,296 1,517,381,903 1,541,904,264
Personal Services 1,331,555,859 1,168,150,000 1,164,681,215 1,228,215,414 819,375,677 1,382,322,440 1,389,831,109
MOOE 83,442,476 62,421,735 67,118,712 70,107,204 55,968,619 135,059,463 151,503,301
Capital Outlays 0 0 5,928,000 0 0 0 569,854
Financial Expenses
Region 12-Soccsksargen/Central Mindanao
Division Offices-
Elementary Education
2,612,996,744 3,017,903,591 2,812,954,000 2,938,521,000 2,992,624,239 3,344,025,000 3,483,645,000
Personal Services 2,569,479,263 2,969,973,274 2,765,973,000 2,891,589,000 2,949,929,033 3,228,014,000 3,287,047,000
MOOE 43,517,481 47,930,317 46,981,000 46,932,000 42,695,206 116,011,000 196,598,000
Capital Outlays 0 0 0 0 0
Financial Expenses 0 0 0 0
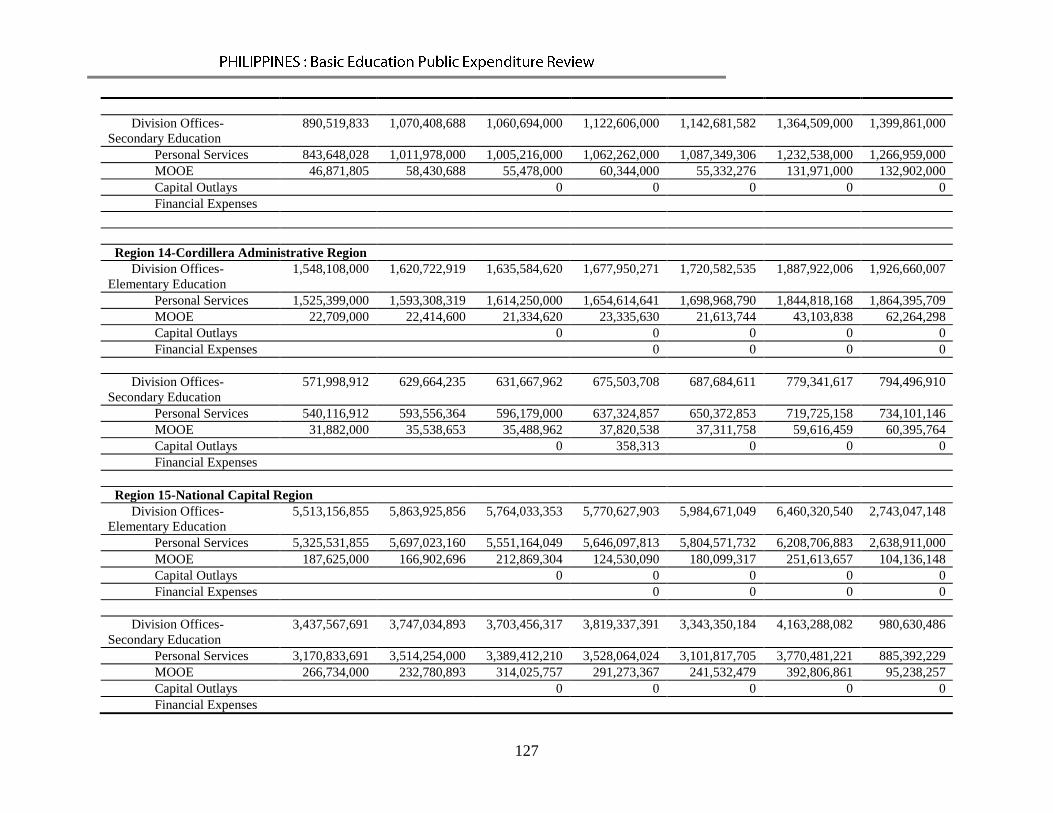
127
Division Offices-
Secondary Education
890,519,833 1,070,408,688 1,060,694,000 1,122,606,000 1,142,681,582 1,364,509,000 1,399,861,000
Personal Services 843,648,028 1,011,978,000 1,005,216,000 1,062,262,000 1,087,349,306 1,232,538,000 1,266,959,000
MOOE 46,871,805 58,430,688 55,478,000 60,344,000 55,332,276 131,971,000 132,902,000
Capital Outlays 0 0 0 0 0
Financial Expenses
Region 14-Cordillera Administrative Region
Division Offices-
Elementary Education
1,548,108,000 1,620,722,919 1,635,584,620 1,677,950,271 1,720,582,535 1,887,922,006 1,926,660,007
Personal Services 1,525,399,000 1,593,308,319 1,614,250,000 1,654,614,641 1,698,968,790 1,844,818,168 1,864,395,709
MOOE 22,709,000 22,414,600 21,334,620 23,335,630 21,613,744 43,103,838 62,264,298
Capital Outlays 0 0 0 0 0
Financial Expenses 0 0 0 0
Division Offices-
Secondary Education
571,998,912 629,664,235 631,667,962 675,503,708 687,684,611 779,341,617 794,496,910
Personal Services 540,116,912 593,556,364 596,179,000 637,324,857 650,372,853 719,725,158 734,101,146
MOOE 31,882,000 35,538,653 35,488,962 37,820,538 37,311,758 59,616,459 60,395,764
Capital Outlays 0 358,313 0 0 0
Financial Expenses
Region 15-National Capital Region
Division Offices-
Elementary Education
5,513,156,855 5,863,925,856 5,764,033,353 5,770,627,903 5,984,671,049 6,460,320,540 2,743,047,148
Personal Services 5,325,531,855 5,697,023,160 5,551,164,049 5,646,097,813 5,804,571,732 6,208,706,883 2,638,911,000
MOOE 187,625,000 166,902,696 212,869,304 124,530,090 180,099,317 251,613,657 104,136,148
Capital Outlays 0 0 0 0 0
Financial Expenses 0 0 0 0
Division Offices-
Secondary Education
3,437,567,691 3,747,034,893 3,703,456,317 3,819,337,391 3,343,350,184 4,163,288,082 980,630,486
Personal Services 3,170,833,691 3,514,254,000 3,389,412,210 3,528,064,024 3,101,817,705 3,770,481,221 885,392,229
MOOE 266,734,000 232,780,893 314,025,757 291,273,367 241,532,479 392,806,861 95,238,257
Capital Outlays 0 0 0 0 0
Financial Expenses
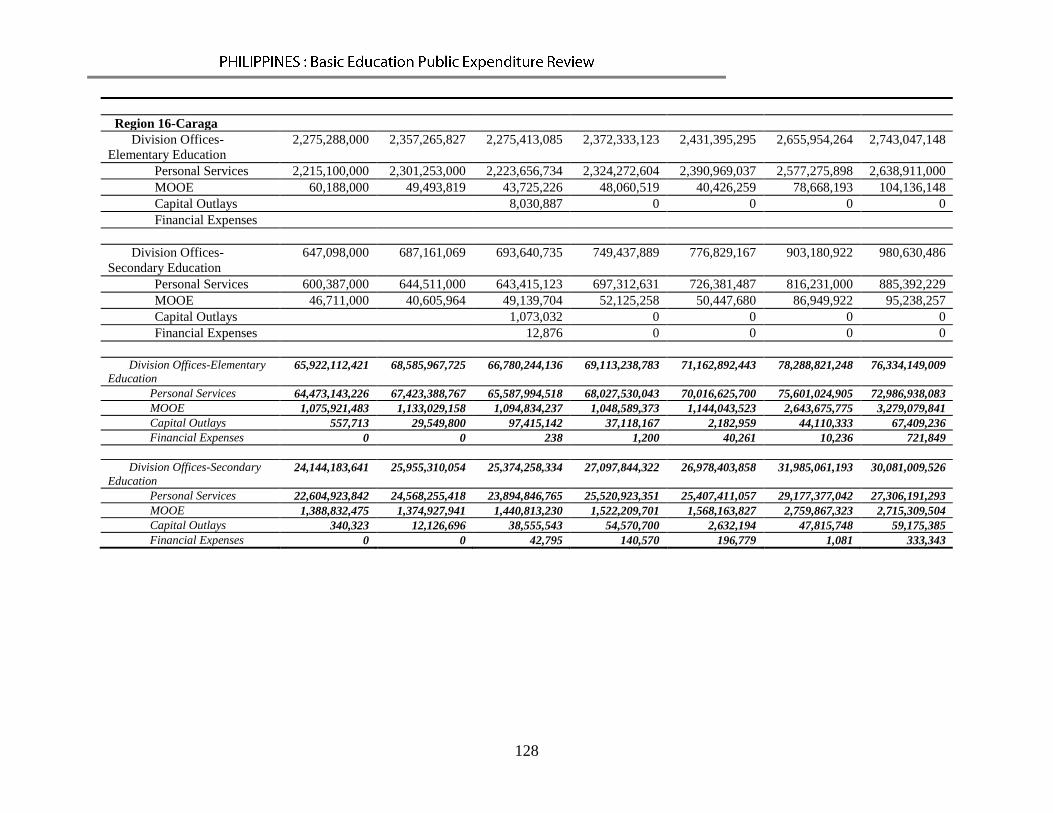
128
Region 16-Caraga
Division Offices-
Elementary Education
2,275,288,000 2,357,265,827 2,275,413,085 2,372,333,123 2,431,395,295 2,655,954,264 2,743,047,148
Personal Services 2,215,100,000 2,301,253,000 2,223,656,734 2,324,272,604 2,390,969,037 2,577,275,898 2,638,911,000
MOOE 60,188,000 49,493,819 43,725,226 48,060,519 40,426,259 78,668,193 104,136,148
Capital Outlays 8,030,887 0 0 0 0
Financial Expenses
Division Offices-
Secondary Education
647,098,000 687,161,069 693,640,735 749,437,889 776,829,167 903,180,922 980,630,486
Personal Services 600,387,000 644,511,000 643,415,123 697,312,631 726,381,487 816,231,000 885,392,229
MOOE 46,711,000 40,605,964 49,139,704 52,125,258 50,447,680 86,949,922 95,238,257
Capital Outlays 1,073,032 0 0 0 0
Financial Expenses 12,876 0 0 0 0
Division Offices-Elementary
Education 65,922,112,421 68,585,967,725 66,780,244,136 69,113,238,783 71,162,892,443 78,288,821,248 76,334,149,009
Personal Services 64,473,143,226 67,423,388,767 65,587,994,518 68,027,530,043 70,016,625,700 75,601,024,905 72,986,938,083
MOOE 1,075,921,483 1,133,029,158 1,094,834,237 1,048,589,373 1,144,043,523 2,643,675,775 3,279,079,841
Capital Outlays 557,713 29,549,800 97,415,142 37,118,167 2,182,959 44,110,333 67,409,236
Financial Expenses 0 0 238 1,200 40,261 10,236 721,849
Division Offices-Secondary
Education 24,144,183,641 25,955,310,054 25,374,258,334 27,097,844,322 26,978,403,858 31,985,061,193 30,081,009,526
Personal Services 22,604,923,842 24,568,255,418 23,894,846,765 25,520,923,351 25,407,411,057 29,177,377,042 27,306,191,293
MOOE 1,388,832,475 1,374,927,941 1,440,813,230 1,522,209,701 1,568,163,827 2,759,867,323 2,715,309,504
Capital Outlays 340,323 12,126,696 38,555,543 54,570,700 2,632,194 47,815,748 59,175,385
Financial Expenses 0 0 42,795 140,570 196,779 1,081 333,343

129
Annex 4: Measuring Congestion in Public Schools
1. The public's general perception is that public schools, especially elementary schools, are
overcrowded with students and underprovided with teachers, classrooms, and in some schools,
chairs and textbooks. This impression is reinforced by news video footage of severely
overcrowded classrooms in some NCR schools. But we ask how many public schools can be
classified as “congested,” “just right,” or “undersubscribed”. Further, for each school deemed to
be congested, we ask what constraint is that most immediately blocks or limits its capacity. Is it
the lack of teachers, lack of classrooms, lack of chairs, two or all three of the foregoing? We
also ask how great the shortage (or surplus) is of teachers, classrooms, and chairs in each public
school.
2. With scarce resources and high enrollments, DepED faces two computational problems,
related but different:
a) Given the current number of students in the various grade/year levels, DepED must find
the minimum number of teachers, classrooms and chairs needed to serve these students
“within DepED standards.” For instance, if there are 110 pupils in Grade 1, 95 in Grade
2, 85 in Grade 3, 70 in Grade 4, 60 in Grade 5, and 55 pupils in Grade 6, how many
teachers, classrooms and chairs are needed in all? From these calculations DepED can
infer the shortage (or in some cases, surplus) of teachers, classrooms and chairs65.
b) Given the number of teachers, classrooms and chairs available in a public school,
DepED must estimate the “full capacity” of the school. Given the current level of
resources in a school, how many students can the school handle “within DepED norms"?
For instance, if a public elementary school has 15 teachers, 10 classrooms, and 520
chairs, how many pupils can it effectively teach within DepED norms? And if such a
school has an actual enrollment of, say 550, would that be too many, just right or could
we say the school is undersubscribed? From these calculations, DepED can estimate the
number of excess students (or unutilized enrollment slots, as the case may be).
3. The solution of one problem does not lead directly to the solution of the other. DepEd
has long since recognized and tried to solve the first problem. The DepED color-coding scheme
illustrates the results. There are actually three separate color-coding schemes, each based on a
BEIS-based indicator ratio: pupil-teacher ratio (PTR), pupil-classroom ratio (PCR), and pupil-
seat ratio (PSR). These three ratios could be used to generate three sequentially arranged lists of
schools, each list arranged from highest priority (i.e., the so-called red schools) to the lowest
priority (i.e., the so-called sky blue and blue schools).
4. Because there are three queues, each public school must position itself in each of three
separate lines: one queue waiting for additional teachers, another queue for additional
classrooms, and a third queue for additional chairs. The color-coding schemes cannot produce a
single consolidated queue. Further, because the color schemes are defined by ratios instead of
absolute quantities, the ratios cannot be used as bases for the usual pro rata allocations of
government resources.
65
The lack of textbooks is not addressed in this note.

130
5. Until recently DepED has not recognized the second computational problem. Yet it is
very important, because it provides a more direct way of measuring school congestion. The
need for estimating full capacity arose because of the need to estimate the demand for Education
Service Contracting (ESC) slots66
in private secondary schools. Under the 20-year-old DepED-
managed Government Assistance to Students in Private Education (GASTPE) program,
students who cannot be accommodated in public secondary schools are offered partial financial
assistance to seek schooling in nearby private secondary schools. Doing so at least partially
decongests public schools, This showed the need to estimate the full capacity of public
secondary schools and subsequently to estimate the number of “aisle students”67
in them. These
aisle students are precisely the target clientele of the ESC program. The specific topic of this
note is how to estimate the full capacity of public elementary and secondary schools, determine
the number of aisle students, and thus measure congestion in public schools.
Parameters for Determining the Full Capacity of a Public School
6. Given the number of teachers, classrooms, and chairs in a public school, we ask how
DepED can determine the full capacity (or effective capacity) of the school. We suggest using
the following parameters or assumptions to estimate full capacity:
a) The norm class size. What is the maximum number of elementary pupils that a teacher
can teach effectively in a classroom? For the initial simulation, for an elementary
monograde class, we set the target class size at 45. For an elementary multigrade class
involving two grades, we set the target class size at 45 as well. At the secondary level,
we set the norm class size at 45.
b) The classroom capacity. For consistency, we set the classroom seating capacity equal to
the target class size.
c) The number of shifts allowed. Although some public schools actually offer two or even
three shifts in NCR, for pedagogic and safety reasons we compute the full capacity of a
school on the basis of two shifts at most. Even then, we allow a second shift only if there
are enough teachers, appropriate facilities, and a safe environment for students and
pupils to report early in the morning or end classes with enough light. First, we assume
that except for those schools that are already offering two shifts, public elementary
schools will offer only one shift. For secondary schools we assume that schools in urban
area or cities, if there are enough teachers available, will be allowed to offer a second
shift. We assume that all other secondary schools will offer only single shifts.
66
Annually, there are about 580,000 ESC grantees and voucher holders at the secondary school level but the
potential demand, i.e., the number of aisle students, is more than double that number. 67
If the full capacity of a public school is 700 but its actual enrolment is 800, we say it has 100 “aisle students”.
These students remain enrolled in the public school, have not been turned away, are overstraining the resources of
the school, and have to sit or stand in the aisles. They could also be referred to as excess, overflow, spillover or
standing-room-only students. The counting of aisle students presupposes the prior determination of “full capacity”
of a public school.

131
d) The teacher subject specialization ratio. We assume that at the elementary school level,
one teacher is enough to teach all the elementary school curriculum subjects. We assume
that at the secondary level, schools need seven specialized teachers to deliver the
complete secondary curriculum to a stream of four sections: one section each in the first,
second, third, and fourth years.
e) The criterion for defining “congested” and “undersubscribed.” Initially, we set this
criterion at 45 (the target class size) and use it for categorization. We refer to any school
with more than 45 aisle students as “congested.” In contrast, we label a school with
more than 45 unfilled enrolment slots as a “roomy” or undersubscribed school. We refer
to all other schools as “just right”.
Formula for Estimating the Full Capacity of a Public Elementary School
7. For our numeric simulation we define the “full capacity” of a public elementary school
as the minimum of three quantities based on the number of teachers, classrooms, and seats. If
the elementary school has T teachers (national68
teacher positions), C classrooms,69
and S
chairs,70
then full capacity is the minimum of:
QUANTITY (assuming
target class size is 45) REMARKS
T*45 CAPACITY BASED ON TEACHERS ONLY: This is the
number of students which the available T elementary level
teachers can teach effectively. C*SHIFTS*45 CAPACITY BASED ON CLASSROOMS ONLY: This is
the number of students which can fit into the available C
classrooms, taking the no. of shifts into consideration. S*SHIFTS CAPACITY BASED ON CHAIRS ONLY: This is the
effective seating capacity based on available S chairs, taking
into consideration the number of shifts.
EXAMPLE 1: Suppose a public elementary school offering only one shift has10 teachers,
six classrooms and 280 chairs. For this school, FULL CAPACITY = MINIMUM { 10*45,
6*1*45, 280*1 } = MINIMUM { 450, 270, 280 } = 270. Although the 10 teachers could
teach as many as 450 students but there are enough chairs for 280, the classroom capacity is
only 270 students. School capacity equals 270 pupils. In this example it is the lack of
classrooms (not teachers, not chairs) that most immediately blocks school capacity. If actual
enrollment is 300 students, then the implied number of aisle students is 30 (i.e., 300-270).
But if actual enrolment is 250, then the implied number of unfilled enrollment slots is 20
68
For the initial simulations, we define “national teachers” as all national teacher positions assigned to the
elementary school, including the SPED teacher positions but excluding preschool teachers, who are mostly
contracted by private service providers. “Enrollment” includes SPED but not preschool teachers, who are usually
subcontracted to private service providers. 69
These are “academic classrooms” and exclude science labs, computer rooms, Industrial Arts shops, etc.
70 As used in this note, the generic term “chair” means a one-seater. Thus, a two-seater desk or a two-seater table-
and-chair set is counted as two chairs. A typical single-seat chair is counted as one chair.

132
(i.e., 270-250). In this example the shortage of teachers and classrooms cannot be estimated
unless we know the details of enrollment by grade level.
EXAMPLE 2: Suppose the public elementary school above has facilities that enable it to
offer two shifts. For this school, FULL CAPACITY = MINIMUM {10*45, 6*2*45, 280*2}
= MINIMUM { 450, 540, 560 } = 450. Although the supply of classrooms and shifts has
effectively doubled to 540 and 560 respectively, there are still only 10 teachers who can
effectively teach only 450 pupils (in 10 sections). Thus, full capacity is 450 and this level is
immediately blocked by the lack of teachers (not classrooms, not chairs).
8. The data used to run the numerical simulations is from the SY 20072008 BEIS data.
We performed school-by-school computations on the 37,800 elementary schools and 6,532
public secondary schools in the BEIS.
Preliminary Results on Congestion in Public Elementary Schools
9. The graph below summarizes the results of the simulation:
11,773 elementary schools (31 percent of 37,807) can be classified as “congested”71
5,728 (15 percent of 37,807) are considered to be undersubscribed.
20,305 (54 percent of 37,807, a majority) are judged as “just right.”
10. The aggregate national capacity is about 11,028 million students, compared to the actual
20072008 enrollment of about 12,304 million students. Based on the national totals, the public
elementary school sector appears to be operating at about 12 percent (i.e., 12.304/11.028 – 1)
71
A school where 45 is the standard class size is deemed congested if it has more than 45 aisle students.
Conversely a school is considered to be undersubscribed if it has more than 45 unfilled enrolment slots. All other
schools are classified as “just right”.


