Download - Banerjee Ceic Seminar 6-16-03

Comparison of Distributed Generation Options for India
Rangan Banerjee∗Visiting Faculty
EPP
CEIC Seminar 16th June 2003 (∗ on leave from IIT Bombay)

Outline of Talkn India- Energy Balance n Power Sector Balance and Trendsn Distributed generation optionsn Non-Renewable Comparisonn Renewable Optionsn Issues

Energy Contentn Average Calorific Value of Indian Coal
4500kcal/kg (18.8 MJ/kg)n Average Calorific Value of Oil
10000kcal/kg (41.8 MJ/kg) n Natural Gas 9300 kcal/m3 (38.9 MJ/m3)n Nuclear, Hydro – Work backwards from
generation based on plant efficienciesn Hydro 85%, Nuclear 25%

Power Generation
n Coal 205.5 Million Tonnesn Oil 2.63 Million Tonnesn Gas 8.11 Billion m3
n Hydro 311 PJn Nuclear 151 PJn Coal 3865 PJ, Oil 110 PJ, N Gas 315 PJn Total Primary 4753 PJ

1997-98

1997-98
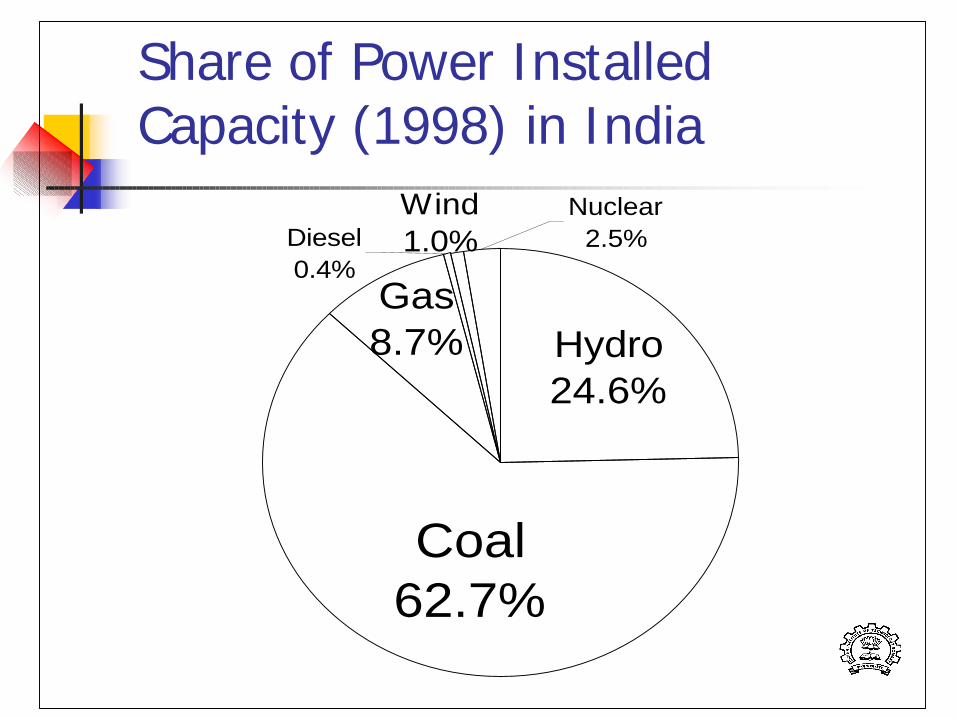
Share of Power Installed Capacity (1998) in India
Diesel0.4%
Wind1.0%
Nuclear2.5%
Gas8.7%
Coal62.7%
Hydro24.6%

India - Fossil Fuel reservesFuel Reserves Prodn R/P
ratioCoal(Million Tonnes)
60000 296 ~200+
Oil(Million Tonnes)
660 33.86 19 (9)
N.GasBillion m3
692 26.4 26
Nuclear Nat U ~50
Data Source TEDDY

Electricity Sector in India
n Low per capita electricity consumption(~400 kWh/capita/year)
n Energy and Peak power scarcityn Large number of villages un- electrifiedn Significant proportion of households
without access to electricityn Electricity use linked with quality of life
Electricityn 104 GW Installed Capacity 2002( less than 4%
of World Capacity)Average 0.1 kW of installed capacity/capita
n World installed capacity 0.53 kW/capitan Low electricity consumption – India-
about 340 kWh/capita/yearNepal, Bangladesh & Bhutan –
lower than 100 kWh/capita/yearn World average electricity consumption-
2100 kWh/capita/year

Electricity Sectorn SEB annual loss 2000-1 Rs 20,500
crores (US 4400 million $)n Gap of 92 p/kWh - between cost of
supply and revenue (2c/kWh)n Peak shortage 13%, energy shortage
7%n Estimated requirement of 100,000 MW
additional capacity by 2012

Load curve of a typical day –MSEB(8/11/2000 source: WREB annual report-2001)
10260 MW9892 MW
6000
7000
8000
9000
10000
11000
1 2 3 4 5 6 7 8 9 10 11 12 13 14 15 16 17 18 19 20 21 22 23 24
Time hours
Dem
and,
MW
morning peak
Evening peak
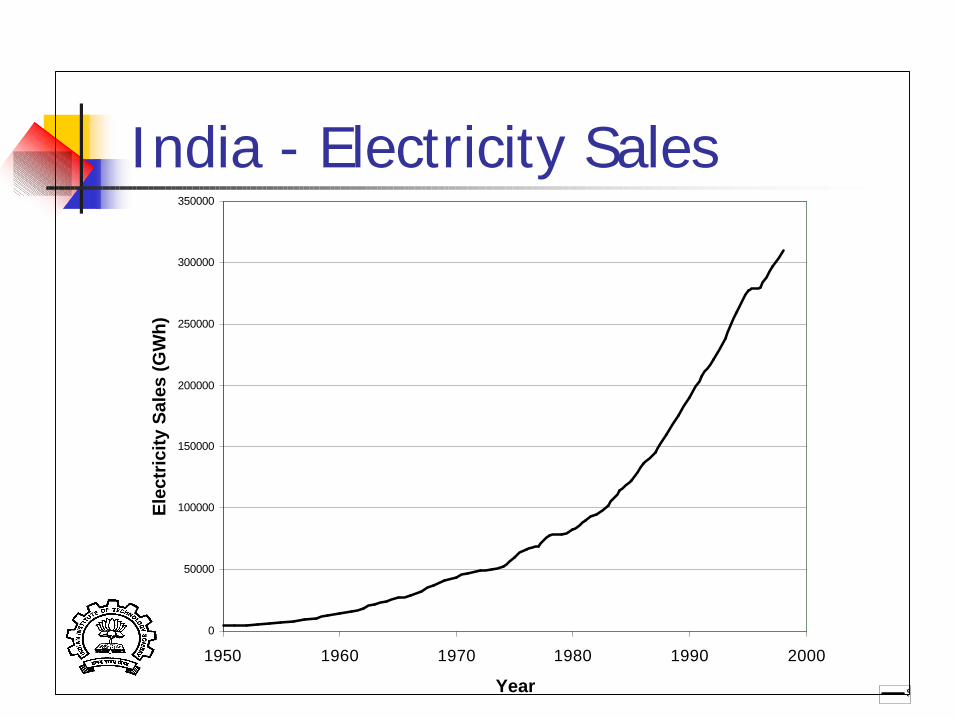
India - Electricity Sales
0
50000
100000
150000
200000
250000
300000
350000
1950 1960 1970 1980 1990 2000
Year
Ele
ctri
city
Sal
es (
GW
h)
Se
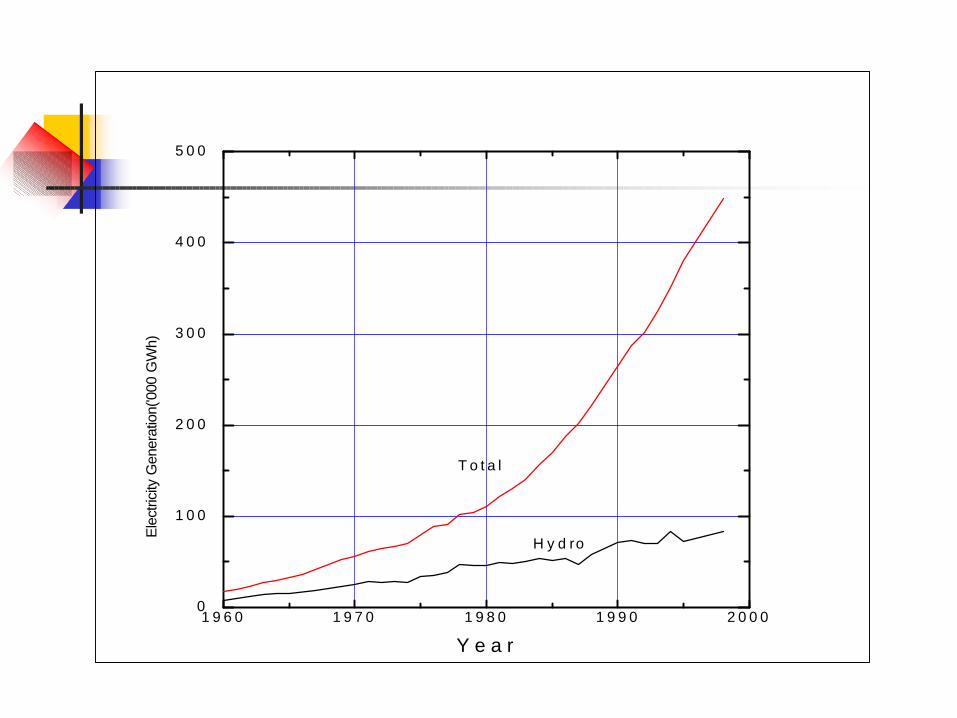
1 9 6 0 1 9 7 0 1 9 8 0 1 9 9 0 2 0 0 00
1 0 0
2 0 0
3 0 0
4 0 0
5 0 0
H y d ro
T o t a l
Ele
ctric
ity G
ener
atio
n('0
00 G
Wh)
Y e a r

Annual Capacity Additions
0
1000
2000
3000
4000
5000
6000
1960 1965 1970 1975 1980 1985 1990 1995 2000
Year
Cap
acity
Add
ition
(M
W)
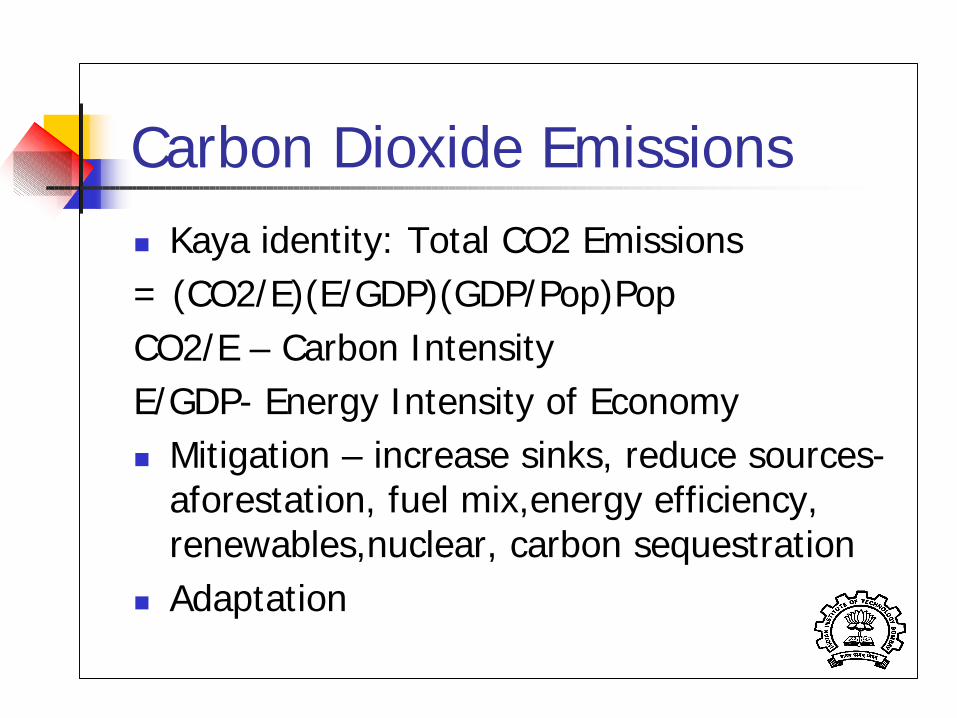
Carbon Dioxide Emissionsn Kaya identity: Total CO2 Emissions= (CO2/E)(E/GDP)(GDP/Pop)PopCO2/E – Carbon IntensityE/GDP- Energy Intensity of Economyn Mitigation – increase sinks, reduce sources-
aforestation, fuel mix,energy efficiency, renewables,nuclear, carbon sequestration
n Adaptation
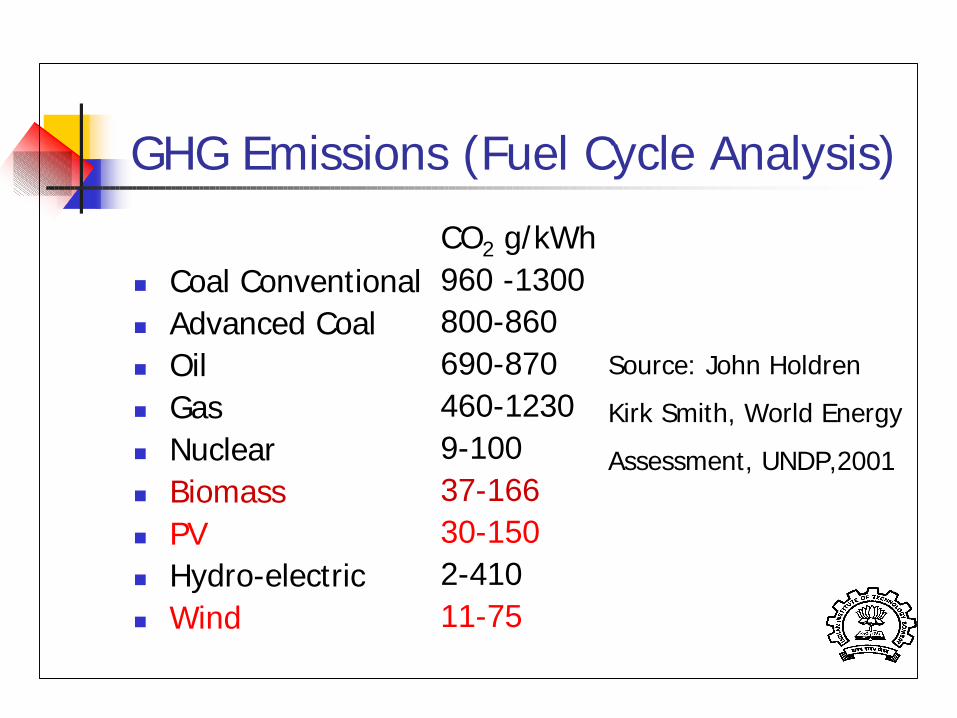
GHG Emissions (Fuel Cycle Analysis)
n Coal Conventionaln Advanced Coaln Oiln Gasn Nuclearn Biomassn PVn Hydro-electricn Wind
CO2 g/kWh960 -1300800-860690-870460-12309-10037-16630-1502-41011-75
Source: John Holdren
Kirk Smith, World Energy
Assessment, UNDP,2001

Distributed Generation Options
n Non-Renewablen IC Engine- dieseln IC Engine- Natural
gasn Micro-turbine-
Natural gasn PEM fuel cell-
reformer - Natural gas
n Renewablen Wind Turbinen Solar Photovoltaic
(PV)n Biomass Gasifier-
Gas Enginen Bagasse -
Cogeneration

Comparison
n Annualised Life Cycle Costs (ALCC) -annual cost of owning and operating equipment
n ALCC = C0 CRF(d,n) + AC f + AC O&M
n CRF (d,n) =[ d(1+d)n]/[(1+d)n-1]n discount rate d, Life n years, C0 Capital
Cost,AC f , AC O&M , annual cost - fuel and O&M
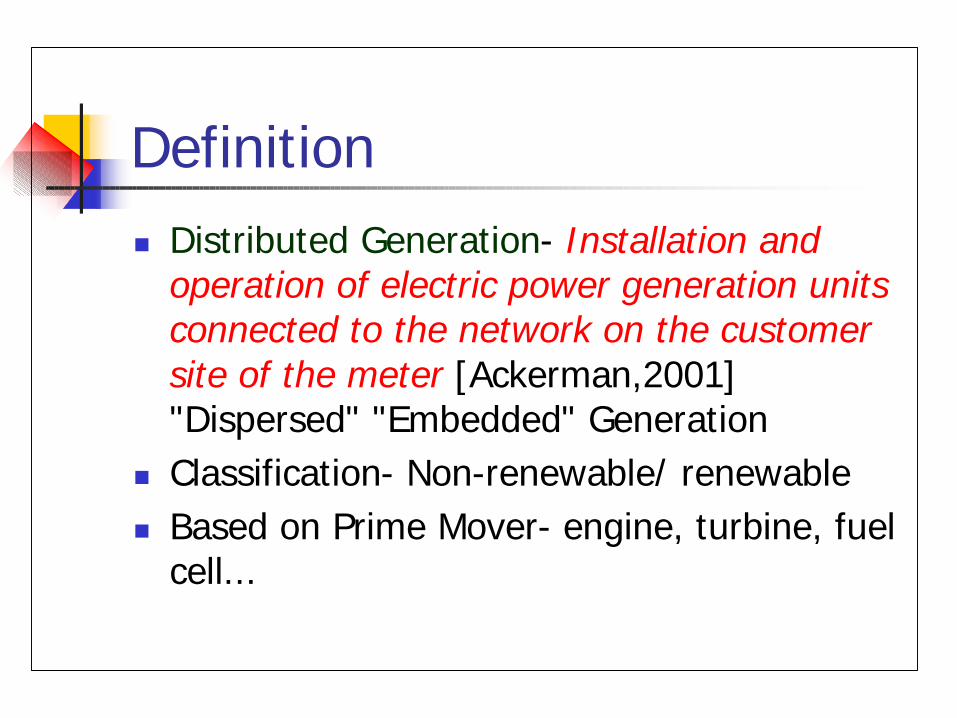
Definitionn Distributed Generation- Installation and
operation of electric power generation units connected to the network on the customer site of the meter [Ackerman,2001]"Dispersed" "Embedded" Generation
n Classification- Non-renewable/ renewablen Based on Prime Mover- engine, turbine, fuel
cell...

Option Capital Cost(Rs/kW)
Life η O&McostRs/kWh
Diesel 25000 20 40% 0.25
Gas Engine 33000 20 35% 0.25MicroTurbine
45000 20 28% 0.25
Fuel Cell 14100010 45% 0.25Discount rate d =0.1,Natural gas price = Rs5200/1000sm3
Diesel price = Rs16/litre, density = 850 kg/m3,LHV = 9700 kcal/kg
($530/kW)
($700/kW)
($960/kW)
($3000/kW)
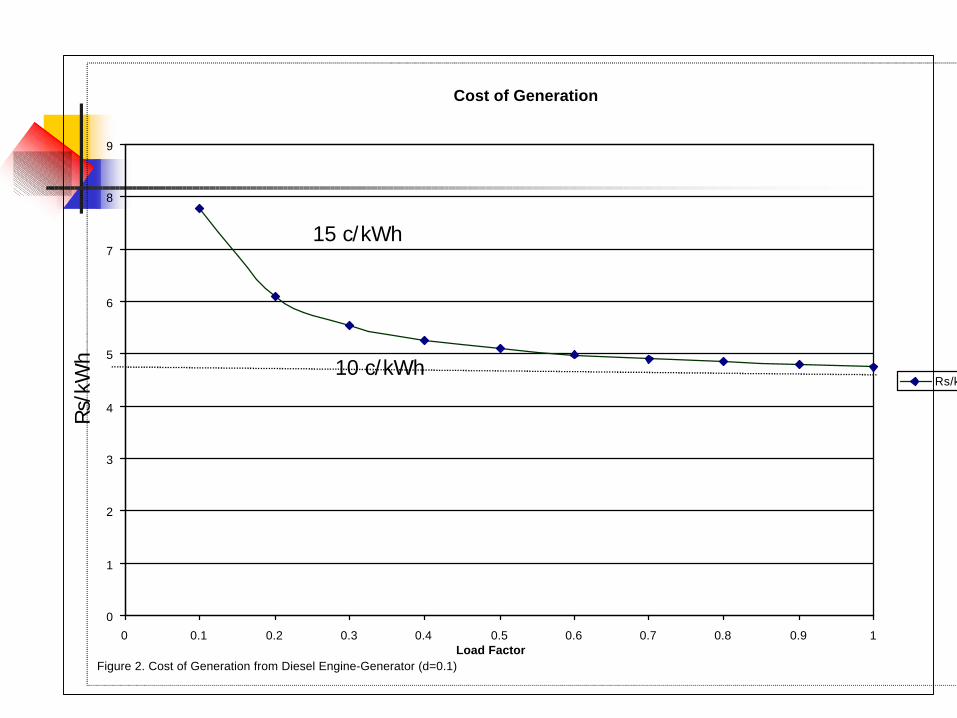
Cost of Generation
0
1
2
3
4
5
6
7
8
9
0 0.1 0.2 0.3 0.4 0.5 0.6 0.7 0.8 0.9 1Load Factor
Rs/kWh
Figure 2. Cost of Generation from Diesel Engine-Generator (d=0.1)
10 c/kWh
15 c/kWh
Rs/
kWh

Schematic of a PEM Fuel Cell -Reformer

0
5000
10000
15000
20000
25000
30000
35000
40000
45000
50000
0 0.1 0.2 0.3 0.4 0.5 0.6 0.7 0.8 0.9 1
Load Factor
Diesel
Gas Engine
MicroTurbine
Fuel Cell
Figure 1. Comparison of Annualised Life Cycle Costs for Non Renewables (Discount rate =10%)
$960/kW/year
$110/kW/year

Annualised Life Cycle Costs
0
5000
10000
15000
20000
25000
30000
35000
40000
45000
0 0.1 0.2 0.3 0.4 0.5 0.6 0.7 0.8 0.9 1Load Factor
Diesel
Gas Engine
MicroTurbine
Figure 3 Comparison of non-renewable options (High discount rate 30%)
$960/kW/year
$110/kW/year

Renewable Power Generation
Wind
Solar SmallHydro
Biomass /Biogas
TidalEnergy
WaveEnergy
Ocean ThermalEnergy
Solar ThermalSolarPhotovoltaic
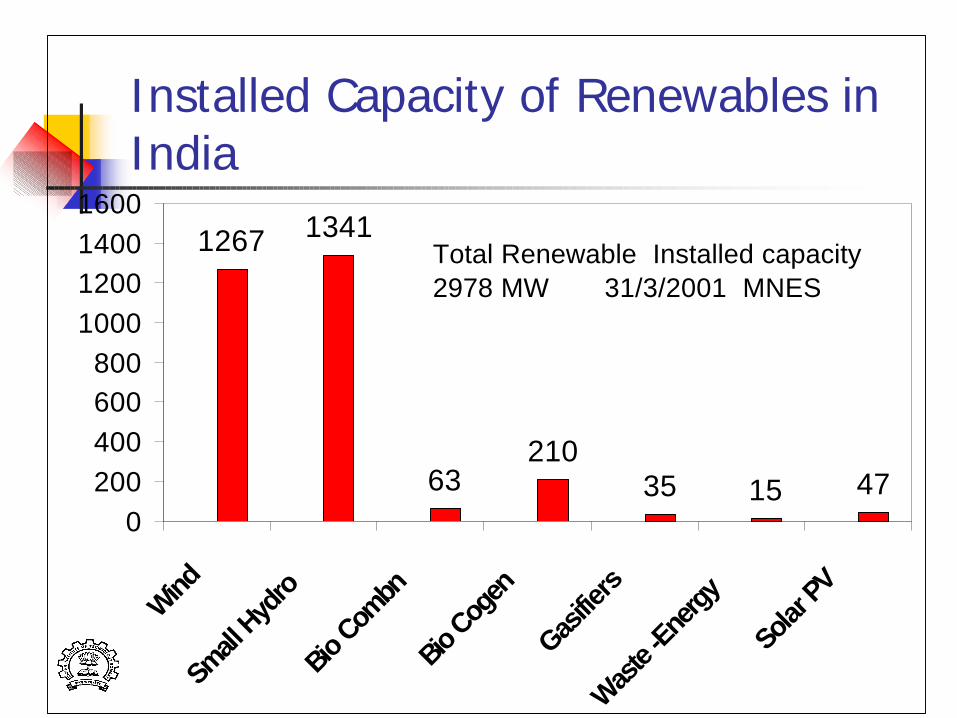
Installed Capacity of Renewables in India
1267 1341
63 35 15 47210
0200400600800
1000120014001600
Wind
Small
Hyd
ro
Bio C
ombn
Bio C
ogen
Gasifie
rs
Was
te -En
ergy
Solar
PV
Total Renewable Installed capacity 2978 MW 31/3/2001 MNES

Daily Wind Variation
0123456789
0 4 8 12 16 20 24
Time of day (hours)
Avg
win
d s
pee
d m
/s
Daily variation Sanodar (West Coast)
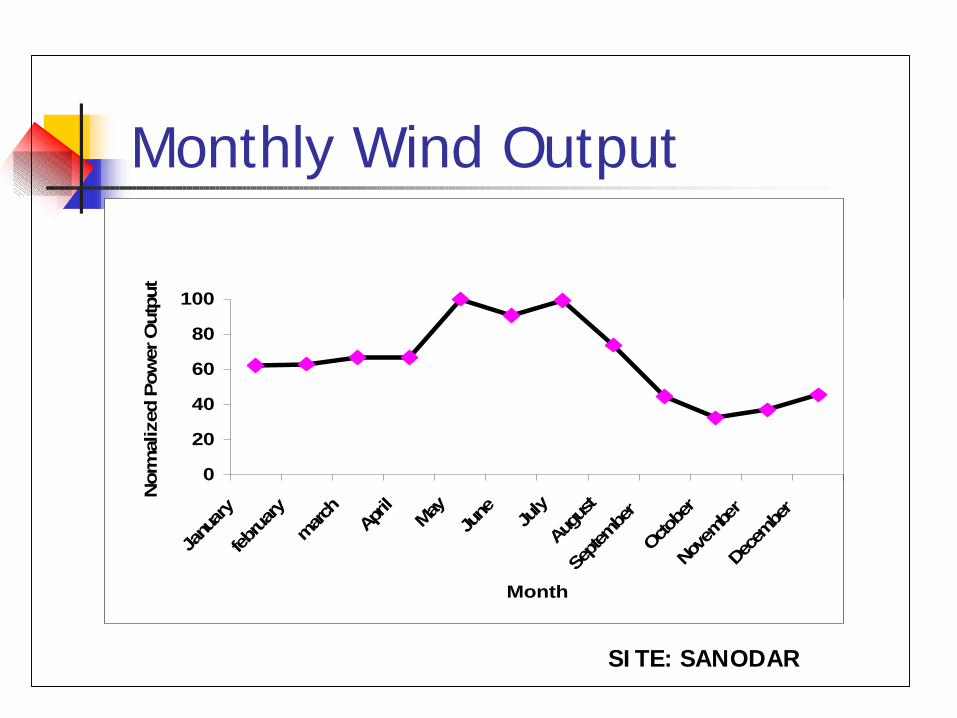
Monthly Wind Output
SITE: SANODAR
0
20
40
60
80
100
Janu
ary
febru
ary
marc
hAp
rilMay
June Ju
ly
Augus
t
Septe
mbe
r
Octobe
r
Nove
mber
Decem
ber
Month
Norm
aliz
ed P
ow
er O
utp
ut

Wind -Cost of Generation
0.1 0.2 0.3 0.45960 6048 6136 6223d=0.1 ALCC Rs
Rs/kWh 6.80 3.45 2.33 1.7815167 15255 15342 15430d=0.3 ALCC Rs
Rs/kWh 17.31 8.71 5.84 4.40Capital cost Rs 50,000/kW, O&M cost Rs 0.1/kWh, Life 20 years
14c 7c 5c 4c
$1060/kW
$130
Load Factor
$320
37c 18c 12c 9c
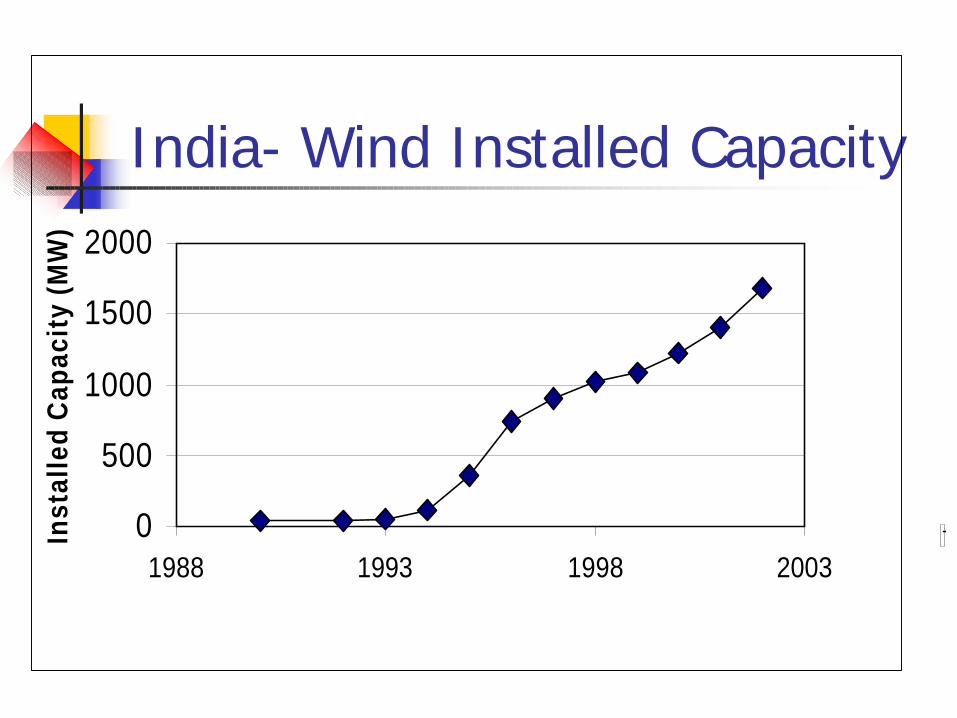
India- Wind Installed Capacity
0
500
1000
1500
2000
1988 1993 1998 2003
Inst
alle
d C
apac
ity
(MW
)

India- Wind Generation
0
500
1000
1500
2000
2500
1991 1993 1995 1997 1999 2001 2003
Ann
ual G
ener
atio
n (M
Us)
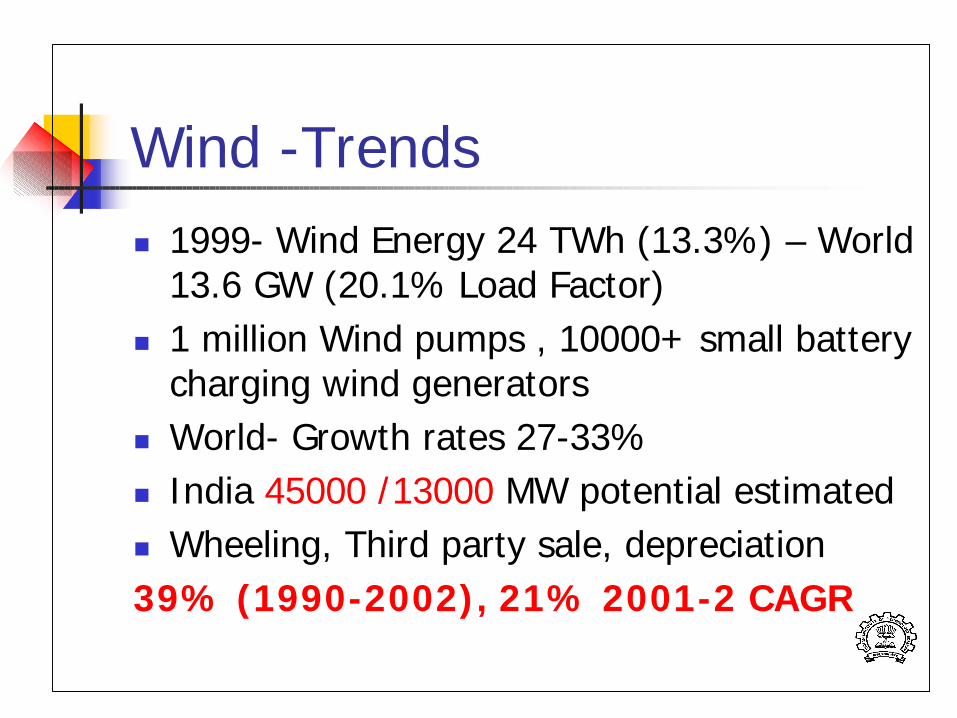
Wind -Trendsn 1999- Wind Energy 24 TWh (13.3%) – World
13.6 GW (20.1% Load Factor)n 1 million Wind pumps , 10000+ small battery
charging wind generatorsn World- Growth rates 27-33%n India 45000 /13000 MW potential estimatedn Wheeling, Third party sale, depreciation 39% (1990-2002), 21% 2001-2 CAGR

Daily Solar Radiation
00.20.40.60.8
11.2
0 2 4 6 8 10 12 14 16 18 20 22 24
Time in hrs.
Sol
ar ra
diat
ion
kW/m
2
Site :Mumbai, May

Monthly Solar Radiation
012345678
1 2 3 4 5 6 7 8 9 10 11 12Month
Avg
Dai
ly S
olar
R
adia
tion(
kWh/
m2/
day)
Site: Mumbai

PV- Cost of Generation
Capital cost/kW 20000025000030000023,93029,803 35,676LF =0.2 ALCC Rs
Rs/kWh 13.66 17.01 20.3624,03929,91235,785LF=0.25 ALCC Rs
Rs/kWh 10.98 13.66 16.34O&M Rs 0.25/kWh, Life 20 years, discount rate =10%
$4300 $5300 $6400
$760
29c 36c 43c
23c 29c 35c

Solar PVn Total Installed Capacity 65 MWn 1999-2000 Prodn 9.6 MW cells, 11 MW modulesn Grid Connected 2.5 MW (2002) - 31 systems -
average 80 kW, largest 240 kW peakn Daily insolation 4- 7 kWh/m2 , 300 sunny daysn Capital subsidies on grid connected systems - 2/3rd
of initial capital cost n Manufacturers - Tata BP, Shell, BHEL, CEL

Gasifier
Ash
Air
Biomass
Gas
Air
Gas &Air
Gas
Cooling & Cleaning
System
Diesel
Power output
Engine Generator
Fig. Schematic Diagram of Gasifier –Engine System
Schematic of Gasifier Engine
Source: Parikh
Biomassn Fuelwood, agricultural residues (rice husk,sugarcane
trash, coconut shells..), animal wastes.n 40% India's primary energy use.n Estimates - residue 16000-18000 MW (6000
hrs/year).n Dedicated plantations - waste land - 500 million
tonnes - 60000 MW (6000 hrs/year).n Atmospheric gasification (incomplete combustion)n Diesel costly - prefer dedicated engine based on
producer gas

Input Data - Biomass GasifierGasifier Engine-generator
Capital Cost (Rs/kW) 20000 33000Life 10 years 20 yearsEfficiency 70% 35%Biomass NCV = 3400 kcal/kg, Price Rs 1/kgDiscount rate = 10%, O&M cost = Rs 0.5/kWh

0
2
4
6
8
10
12
0 0.1 0.2 0.3 0.4 0.5 0.6 0.7 0.8 0.9 1
Load Factor
Gas Engine
Bioengine
Diesel
Gas Engine
Bioengine
Diesel
Biomass Gasifier Engine Cost
13c/kWh
8.5 c/kWh
4.3c/kWh
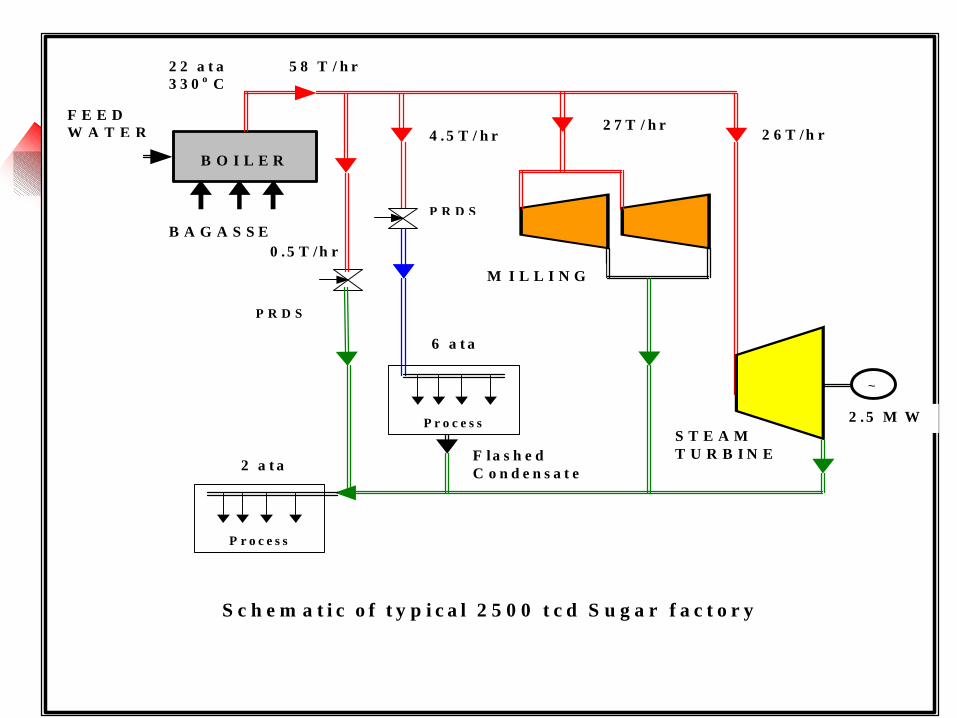
0 . 5 T / h r
F e e d w a t e r
P r o c e s s
P r o c e s s
2 a t a
~
S T E A M T U R B I N E
2 . 5 M W
6 a t a
B A G A S S E
5 8 T / h r 2 2 a t a 3 3 0 o C
4 . 5 T / h r 2 7 T / h r
2 6 T /h r
S c h e m a t i c o f t y p i c a l 2 5 0 0 t c d S u g a r f a c t o r y
F la s h e d C o n d e n s a t e
P R D S
P R D S
M I L L I N G
0 . 5 T /h r
F E E D W A T E R
B O I L E R

F e e d w a t e r
Con
dens
er
2 a t a
P R O C E S S
7 5 T P H , 6 5 a t a , 4 8 0 O C
4 . 5 T P H
~
6 a t a
B A G A S S E ( A l t e r n a t e f u e l )
2 a t a
B F P
1 3 M W
B O I L E R
1 .0 M W M i l l d r iv e s
9 . 5 M W P o w e r e x p o r t
2 . 5 M W C a p t i v e l o a d
P R O C E S S
P R O P O S E D P L A N T C O N F I G U R A T I O N : O P T I O N 2
S T E A M T U R B I N E
C O N D E N S E RE S S

Bagasse CogenerationIncremental Capital Cost(Rs/kW)
30000
Life 20 yearsBoiler Efficiency 70%Bagasse NCV = 3400 kcal/kg, Price Rs 1.50/kgDiscount rate = 10%, O&M cost = Rs 0.5/kWh2500 tcd plant 9.5 MW export, 0.93 kg extra/ kWhLoad factor 0.4 0.5 0.6
Rs/kWh 1.20 1.00 0.87
$680/kW
2.6c 2.1c1.9c

0
10
20
30
40
50
60
70
0 1 2 3 4 5 6 7 8 9 10 11 12 13 14 15 16 17 18 19 20 21 22 23 24
Hour of the day.
Lo
ad (
kW)
Residential Electricity Demand Agriculture DemandIndustry demand Total Load
Typical Load Curve (Rural India)

What is a Hybrid Energy System?
n Hybrid –n n. Something heterogeneous in origin or
compositionn n. an offspring of different breeds,varieties
n Hybrid Energy Systems combine two or more different energy conversion devices to provide a common energy service(s).

Why Hybrid ?n Daily and Monthly variation in
Renewable Resource Availabilityn Daily and Monthly Variation in Demand
Profilen Hybrid of two renewables may help
overcome limitations of bothn Retrofitting/ provision of fossil backup
may provide easier acceptability of renewable technology
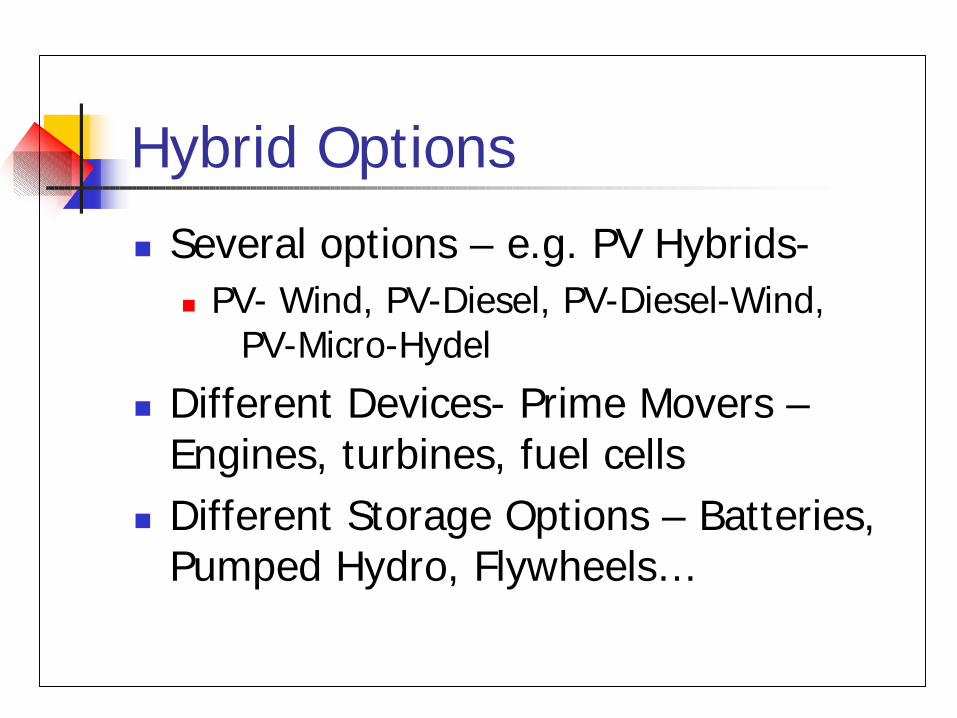
Hybrid Options
n Several options – e.g. PV Hybrids-n PV- Wind, PV-Diesel, PV-Diesel-Wind,
PV-Micro-Hydel
n Different Devices- Prime Movers –Engines, turbines, fuel cells
n Different Storage Options – Batteries, Pumped Hydro, Flywheels…

MPPTOperating voltage315-378 V
MPPTOperating voltage315-378 V
Bi-directional inverter30kW
Bi-directional inverter30kW
Battery Bank240 batteries2V, 600Ah @C10
Battery Bank240 batteries2V, 600Ah @C10 DG Set
50 kW
DG Set50 kW
RETREATBUILDINGConnected load 90kW
RETREATBUILDINGConnected load 90kW
PV arrays15kW @1000 w/m2
PV arrays15kW @1000 w/m2
TERI’S HYBRID SYSTEM

Criteria
n Autonomy A = 1- HLOL/(HTOT)HLOL no of hours of loss of loadHTOT total no of hours of load
n Emissionsn Costn Trade-off between criteria

Indian Experience -Hybrid
n Wind-Solar PV – 9 systems- 42 kW totale.g 5 kW Chunnambar Island – 3.3
kW Wind, 1.8 kW PV, 800 Ah Batteryn PV-Diesel - Kiltan, Minicoy (100kW)n 500 kW Wind-Diesel – Sagar Island –
West Bengal(10-50 kW wind m/cs with 2 -360 KVA generators)
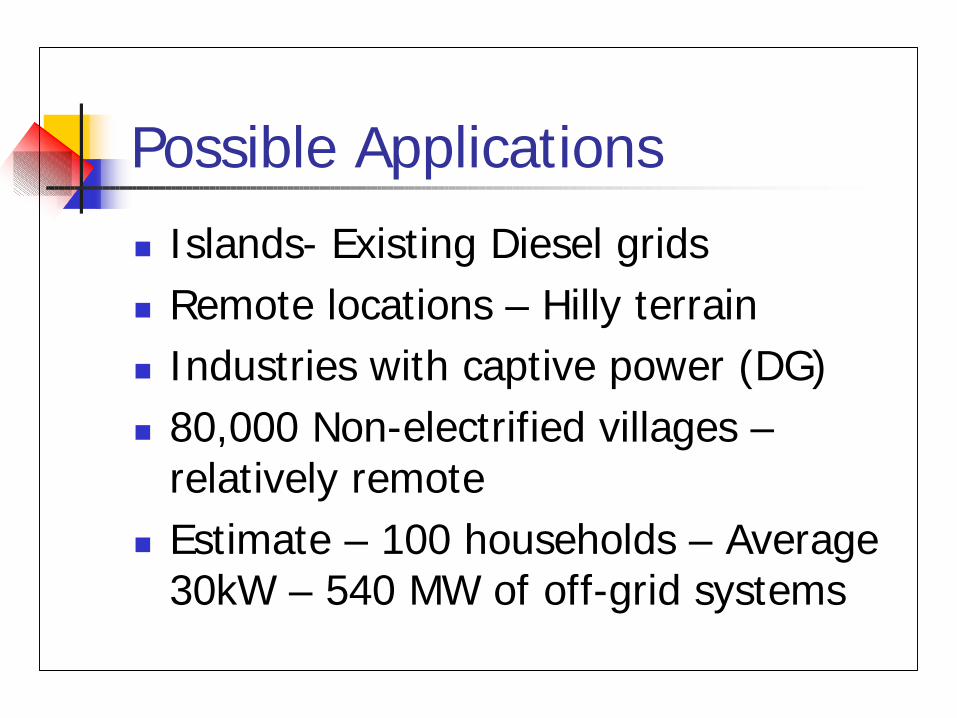
Possible Applications
n Islands- Existing Diesel gridsn Remote locations – Hilly terrainn Industries with captive power (DG)n 80,000 Non-electrified villages –
relatively remoten Estimate – 100 households – Average
30kW – 540 MW of off-grid systems

Hybrid Cost Comparison
25
27
29
31
33
35
37
39
41
43
0 1 2 3 4 5 6 7 8 9 10
LOLP (%)
Cost
(Rs/
kWh)
Single Photovoltaic System Single Wind Energy System Hybrid Sytem (fpv =0.2)

Renewables- Policiesn Subsidies/Incentives - offered by Govt of
India on Renewablesn Target Oriented - Installation not actual
generationn Only country with separate Ministry for
renewablesn 10% of power generation target by 2010n Preferential tariff for renewablesn Centralised vs Decentralised

Renewable Issuesn Resource Variability Site Specificn Load Uncertaintyn System Selection/Sizing – Incomplete
assessment of options, “Satisficing”n Most Renewables – promoted by individual
technology /component suppliersn Systems Analysis/Load Forecasting –
Software/modelling support required

Renewable Issuesn Load management- cost effective method of
matching supply-demand (DSM)n Experience with Control strategies/R&D
needed –Pilot systemsn Need for indigenous controller & inverter
developmentn Need to have well documented pilot systems
that provide “unbiased” data on actual performance of hybrid systems. Independent assessment and dissemination of results
Hybrid Issuesn Affordability to end-user? How much of costs
to be recovered? Remote areas lower ability to pay- Need to try different models
n Externalities need to be quantified – to level playing field
n Govt- Manufacturers –R& D institutions-partnerships
n Clearly specified criterian Tracking of Hybrid Programme & mid-course
corrections

End-Note
You can never plan the future by the past
Edmund Burke

ReferencesT.Ackerman, G. Andersson, L.Sodder, Distributed Generation: A definition, Electric Power
Systems Research 57 (2001) 195–204.Distributed Generation, The Power Paradigm for the New Millenium, Edited by A.M.
Borbely and J.F.Kreider, CRC Press, Boca Raton, USA, 2001.Assessment of Distributed Generation Technology Applications, Prepared for Maine Public
Utilities Commission by Resource Dynamics Corporation, Vienna, VA, USA, February 2001, available on the web at //www.distributed-generation.com.
Fuel Cell Handbook, Fourth Edition, November 1998, US Department of Energy, Office of Fossil Energy, Federal Energy Technology Centre, Pittsburgh,USA available on the web at //www.fetc.doe.gov/publications.
Ministry of Non-Conventional Energy Sources, Annual Reports, New Delhi, 1993, 2000,2001,2002.
Wind power development in India: Towards global leadership, Ministry of Non-Conventional Energy Sources, New Delhi, October 2002.
Tata Energy Data Directory 1999, Tata Energy Research Institute, New Delhi, 2000PP.Parikh, State of the Art Report on Gasification of Biomass, Report submitted to DNES,
Govt of India, 1984.Status of Biomass Gasification Technology at ASCENT, India, October 1998,
http://www.bgtechnologies.net/ankur.htm.
Thank You


