
Axiata Group Berhad
1Q 2017 Results
25 May 2017
Tan Sri Jamaludin Ibrahim, President & Group CEO
Vivek Sood, Group CFO

1Q 2017 2
Executive summary: FinancialsYoY within guidance, QoQ encouraging signs.
1Q17 double digit YoY revenue and EBITDA growth due to Ncell acquisition and weaker Ringgit Malaysia; however PATAMI
impacted by higher D&A charges, higher finance cost and negative contribution from Idea.
• QoQ growth : Revenue 1.6% ; EBITDA 8.8% ; PATAMI >100% ; Normalised PATAMI >100%
• YoY growth : Revenue 17.4% ; EBITDA 14.9% ; PATAMI -35.1% ; Normalised PATAMI -37.4%
At constant currency, 1Q17 financial performance reflect positive impact from a weaker ringgit vs all currencies.
• QoQ growth : Revenue 0.0% ; EBITDA 7.0% ; PATAMI >100% ; Normalised PATAMI >100%
• YoY growth : Revenue 12.4% ; EBITDA 9.5% ; PATAMI -38.9% ; Normalised PATAMI -40.3%
Celcom showing signs of stabilisation; execution of XL’s Transformation Agenda is on track and showing positive traction.
Cost and capex optimization programme is on target, prioritising Celcom and XL.
On 28 April 2017, edotco completed a second round of equity private placement deal of USD100m to KWAP. Axiata will
remain as the majority shareholder holding 62.4% of the issued shares of edotco with INCJ, Khazanah and KWAP
collectively holding 37.6%.
On 19 May 2017, Axiata entered into a strategic partnership with Mitsui, which will contribute its expertise in digital services
and IoT to enable Smart to further strengthen its digital leadership. Mitsui will emerge as a 10% shareholder in Smart, and
Axiata will retain a controlling 82.5% stake.
Cash balance, gross debt/EBITDA and net debt/EBITDA improved from RM5.3bn to RM6.7bn, 2.6x to 2.4x and 2.0x to 1.6x
respectively.

1Q 2017 3
Note: Growth number based on results in local currency in respective operating markets
• Continued postpaid revenue growth of 1.2% QoQ driven by good take up on postpaidofferings i.e. First Gold 80 and First Platinum, to deliver higher ARPU (+1.9% QoQ).
• However, prepaid revenue decreased 6.2% QoQ due to seasonality, challenges in marketand distribution channels.
• Celcom’s 4G and 4G+ population coverage now spans 77% and 38% respectively.
• On YoY basis, Celcom’s 1Q17 revenue, normalised EBITDA and normalised PATAMI growthwas -3.3%, -13.4%, and -23.3%, respectively.
• 1Q17 mobile data revenue grew by 29.8% YoY, accounting for 41.1% of total revenue.
• Overall turnaround programme is on track.
Key Group highlights (1/6):Celcom: Amidst stiff competitive environment and a depressed mobile industry in1Q17, Celcom
postpaid continues to grow but prepaid still faces some challenges in distribution channels.

1Q 2017 4
Note: Growth number based on results in local currency in respective operating markets
• On QoQ basis, XL is ahead of industry in 1Q17, in both total revenue and EBITDA growth.
• XL’s Transformation Agenda to position the company as a data-centric business is ontrack, and data revenue now accounts for >50% of total revenue.
• XL and Axis established distinct brand position in the market. Both continue to grow intheir respective market segments.
• The 3G U900 roll-out has contributed to improving revenue trends with positive traction inthe ex-Java region, whilst Java remains stable QoQ.
• On YoY basis, XL’s 1Q17 revenue, EBITDA and normalised PAT growth was -6.4%, -15.7%and +>100%, respectively.
• Third consecutive quarter of service revenue growth of +0.3% QoQ driven by an increase indata revenue (+8.9%). EBITDA margin improved 0.5pp driven by the improvement inrevenue and focus on cost efficiencies.
Key Group highlights (2/6):XL: Sequential revenue and EBITDA growth in a seasonally weaker quarter.

1Q 2017 5
Note: Growth number based on results in local currency in respective operating markets
• Overall strong growth performance and improved margins for merged entity.
• Post merger, network integration is progressing well and on target for completion in 3Q17, whilstedotco Bangladesh was carved out on 19th January 2017.
• On QoQ basis, Robi increases subscriber market share to 28.6% (+1.0% pp).
• On YoY basis, Robi’s 1Q17 revenue, EBITDA and PAT growth was 30.7%, -31.6% and ->100%respectively. For proforma Robi (includes Airtel, excludes edotco Bangladesh), revenue, EBITDAand PAT growth was 4.2%, 6.4% and 37.7% respectively.
• 1Q17 data revenue grew by 83.0% YoY, as data accounted for 17.4% of Robi’s total revenue.
• In spite of the implementation of VAT impacting all business segments, Dialog mobile subscribermarket share has increased 0.5pp QoQ.
• Dialog benefits from cost rescaling initiatives and keeps EBITDA margins stable.
• On YoY basis, Dialog’s 1Q17 revenue, EBITDA and PAT growth was 4.8%, 2.9% and -42.1%respectively. Normalised for forex and tax impact, PAT growth was -13.0%.
• On YoY basis, revenue growth for mobile, fixed and pay-TV operations at 2.2%, 39.0% and -5.0%,respectively. Dialog Broadband Networks’ 1Q17 PAT turned positive, whilst Dialog Televisionexperienced an EBITDA growth of +>100%.
• Mobile data revenue grew 41.6% YoY in 1Q17, accounting for 27.1% of Dialog’s mobile revenue.
Key Group highlights (3/6):Dialog: Market share improved despite VAT impact.
Robi: Overall strong growth performance.

1Q 2017 6
Key Group highlights (4/6):Smart: Continued strong performance.
Ncell: Soft 1Q17 due to ILD revenue decline and more aggressive data pricing.
Note: Growth number based on results in local currency in respective operating markets
Nepal
• Despite a challenging 1Q17, mainly due to continued ILD revenue decline and moreaggressive data pricing, Ncell maintained strong cash flow.
• On YoY basis, Ncell’s 1Q17 revenue, EBITDA and PAT growth was -2.7%, -5.9% and -1.8%,respectively.
• 1Q17 PAT margin rose 0.3pp to 34.8% YoY due to continued efforts from cost controlsinitiatives.
• 1Q17 data revenue grew by 22.1% YoY, as data accounted for 17.0% of Ncell’s total revenue.
• Smart continues to deliver strong performance in 1Q17 fueled by excellent data monetisationand effective cost management, amidst aggressive price competition by other players.
• On YoY basis, Smart’s 1Q17 revenue, EBITDA and PAT growth was 17.0%, 18.2% and 23.2%respectively.
• Data subscribers grew 10.3% YoY to 3.6m; 1Q17 data revenue grew by 57.1%, as data accountedfor 48.5% of Smart’s total revenue.
1Q 2017 7
Key Group highlights (5/6):Edotco: Strong growth from expanding portfolio and higher tenancy ratio.
ADS: Continues to look for asset monetisation opportunities.
Note: Growth number based on results in local currency in respective operating markets
• As at 1Q17, edotco owns 17.4k towers (+4.7% YoY), and manages 8.4k sites (+22.2% YoY).
• Tenancy ratio rose to 1.58x (vs 1.52x in 1Q16).
• On YoY basis, proforma revenue growth of 7.7%.
• Digital financial services: Building ecosystem and rising contribution to core business.
• Continues to look for asset monetisation opportunities.

1Q 2017 8
Note: Growth number based on results in local currency in respective operating markets
• 1Q17 M1 reported revenue, EBITDA and PAT growth of 1.2%, -5.1% and -14.6%respectively. For Axiata’s 1Q17, M1 contributed RM31m (vs RM36m in 1Q16) to Axiata,accounting for 10.6% of normalised Group PATAMI.
Key Group highlights (6/6):Associates and joint ventures: Negative contribution of RM31m in 1Q17, largely due to Idea.
• For FY17, Idea reported revenue, EBITDA and consolidated PAT growth of -1.0%, -14.1%and ->100% respectively. For Axiata’s 1Q17, Idea contributed a loss of RM25m (vs a profitof RM65m in 1Q16) to Axiata.
1Q 2017 9
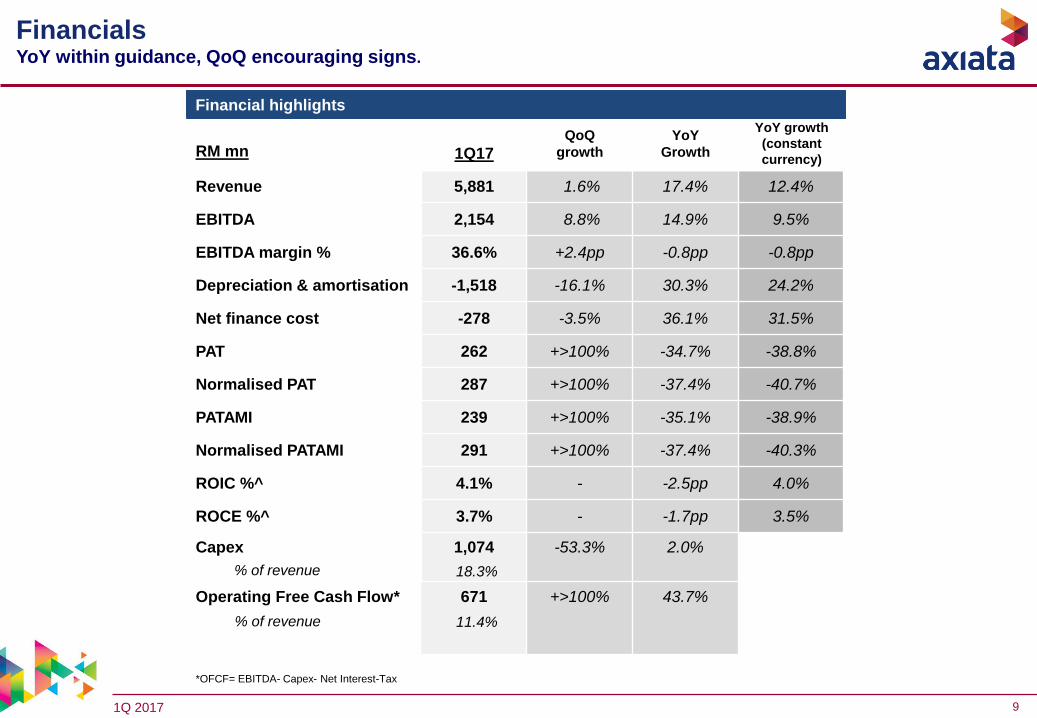
Financial highlights
RM mn 1Q17QoQ
growth
YoY
Growth
Revenue 5,881 1.6% 17.4% 12.4%
EBITDA 2,154 8.8% 14.9% 9.5%
EBITDA margin % 36.6% +2.4pp -0.8pp -0.8pp
Depreciation & amortisation -1,518 -16.1% 30.3% 24.2%
Net finance cost -278 -3.5% 36.1% 31.5%
PAT 262 +>100% -34.7% -38.8%
Normalised PAT 287 +>100% -37.4% -40.7%
PATAMI 239 +>100% -35.1% -38.9%
Normalised PATAMI 291 +>100% -37.4% -40.3%
ROIC %^ 4.1% - -2.5pp 4.0%
ROCE %^ 3.7% - -1.7pp 3.5%
Capex 1,074 -53.3% 2.0%
Operating Free Cash Flow* 671 +>100% 43.7%
Financial highlights
% of revenue 18.3%
% of revenue 11.4%
YoY growth
(constant
currency)
*OFCF= EBITDA- Capex- Net Interest-Tax
FinancialsYoY within guidance, QoQ encouraging signs.
1Q 2017 10
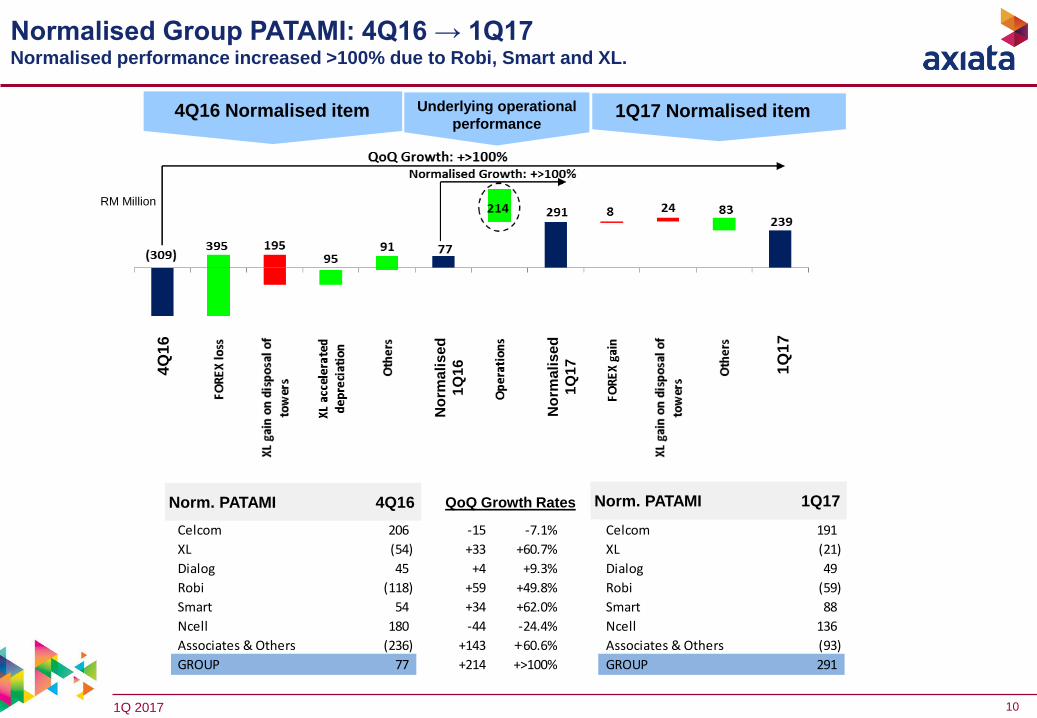
Norm PATAMI Q416 Norm PATAMI Q117
Celcom 206 -15 -7.1% Celcom 191
XL (54) +33 +60.7% XL (21)
Dialog 45 +4 +9.3% Dialog 49
Robi (118) +59 +49.8% Robi (59)
Smart 54 +34 +62.0% Smart 88
Ncell 180 -44 -24.4% Ncell 136
Associates & Others (236) +143 -60.6% Associates & Others (93)
GROUP 77 +214 +>100% GROUP 291
QoQ Growth Rates
RM Million
Normalised Group PATAMI: 4Q16 → 1Q17Normalised performance increased >100% due to Robi, Smart and XL.
1Q17 Normalised item4Q16 Normalised item Underlying operational
performance
Norm. PATAMI 4Q16 Norm. PATAMI 1Q17QoQ Growth Rates
1Q
17
4Q
16
No
rmali
sed
1Q
16
No
rma
lis
ed
1Q
17
+
1Q 2017 11
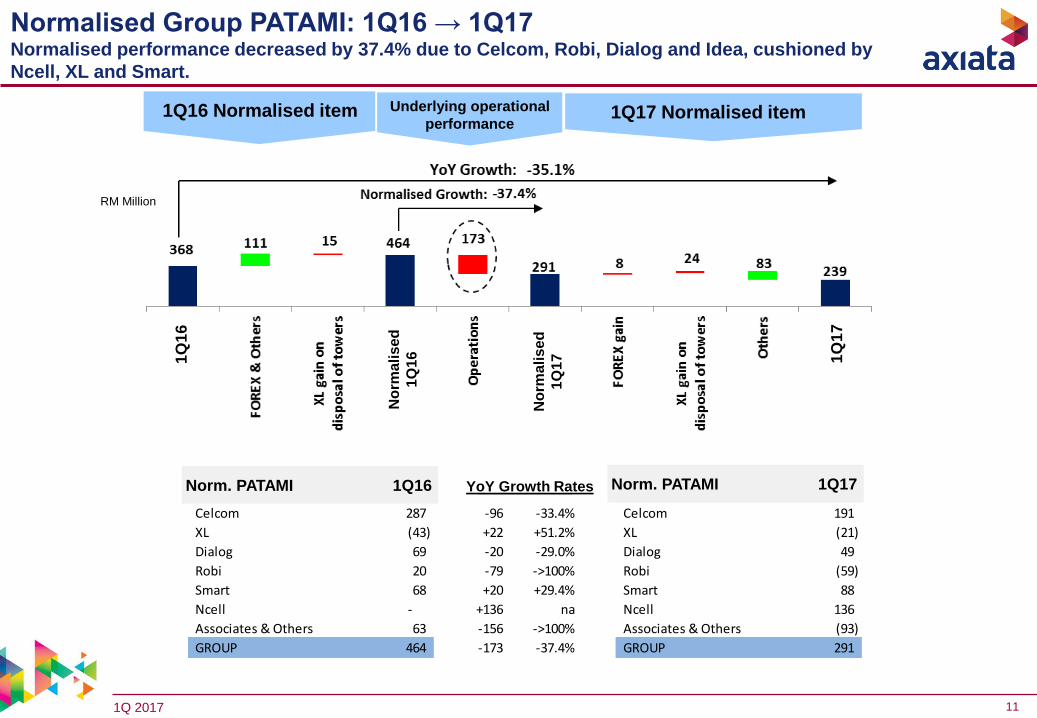
Norm PATAMI Q116 Norm PATAMI Q117
Celcom 287 -96 -33.4% Celcom 191
XL (43) +22 +51.2% XL (21)
Dialog 69 -20 -29.0% Dialog 49
Robi 20 -79 ->100% Robi (59)
Smart 68 +20 +29.4% Smart 88
Ncell - +136 na Ncell 136
Associates & Others 63 -156 ->100% Associates & Others (93)
GROUP 464 -173 -37.4% GROUP 291
FY Growth Rates
(
RM Million
Normalised Group PATAMI: 1Q16 → 1Q17Normalised performance decreased by 37.4% due to Celcom, Robi, Dialog and Idea, cushioned by
Ncell, XL and Smart.
1Q17 Normalised item1Q16 Normalised item Underlying operational
performance
Norm. PATAMI 1Q16 Norm. PATAMI 1Q17YoY Growth Rates
1Q
17
1Q
16
No
rma
lis
ed
1Q
16
No
rma
lis
ed
1Q
17

1Q 2017 12
467 371 141
(1,424)
671
1Q16 2Q16 3Q16 4Q16 1Q17
822 830
541
(1,138)
1,080
1Q16 2Q16 3Q16 4Q16 1Q17
Capital expenditureHigher FCF and OFCF due to lower capex intensity of 18.3% and higher EBITDA.
FCF
RM million
OFCF
RM million+31.3%
+>100%
* *
4Q16 4Q16
FY16
Capex (RM mn) 1Q16 1Q17
Celcom 174 167
XL 349 349
Dialog 103 151
Robi 330 193
Smart 67 75
Ncell n/a 55
Others 31 84
Total 1,053 1,074Note:
Numbers may not add up due to rounding
FCF=EBITDA-Capex
OFCF= EBITDA- Capex- Net Interest-Tax
n/a = not available
* Includes Celcom spectrum payment in 4Q16 amounting to RM816.8m
+>100%
+43.7%
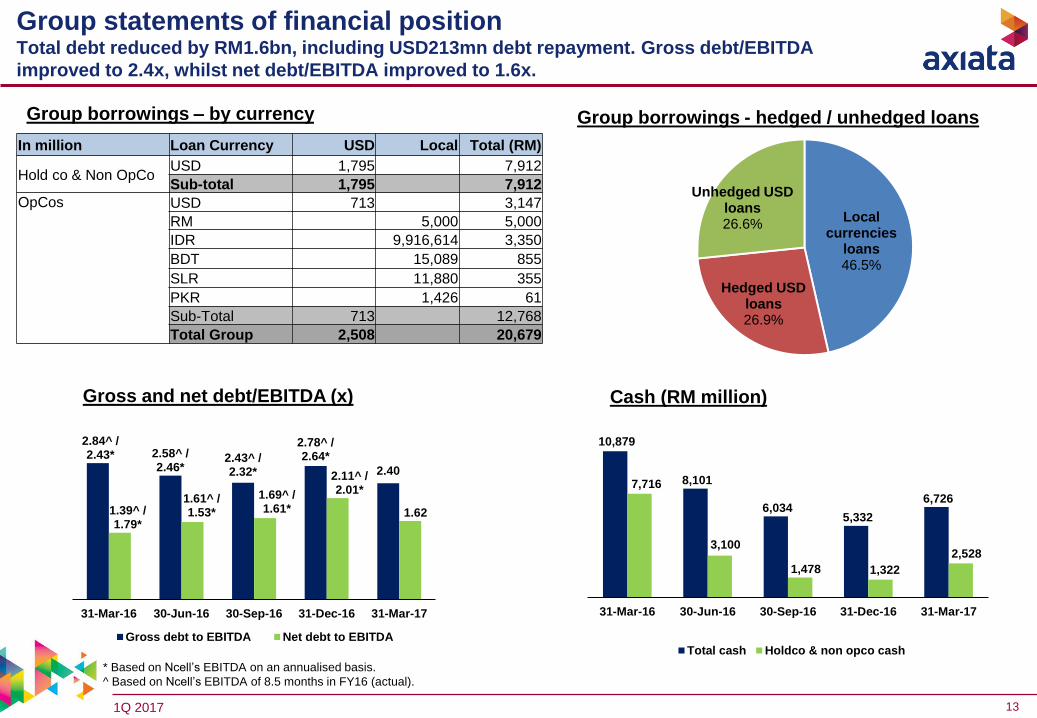
1Q 2017 13
Group borrowings – by currency Group borrowings - hedged / unhedged loans
* Based on Ncell’s EBITDA on an annualised basis.
^ Based on Ncell’s EBITDA of 8.5 months in FY16 (actual).
Group statements of financial position Total debt reduced by RM1.6bn, including USD213mn debt repayment. Gross debt/EBITDA
improved to 2.4x, whilst net debt/EBITDA improved to 1.6x.
Cash (RM million)Gross and net debt/EBITDA (x)
2.84^ /2.43* 2.58^ /
2.46*2.43^ /2.32*
2.78^ /2.64*
2.40
1.39^ / 1.79*
1.61^ /1.53*
1.69^ /1.61*
2.11^ /2.01*
1.62
31-Mar-16 30-Jun-16 30-Sep-16 31-Dec-16 31-Mar-17
Gross debt to EBITDA Net debt to EBITDA
10,879
8,101
6,034 5,332
6,726
7,716
3,100
1,478 1,322
2,528
31-Mar-16 30-Jun-16 30-Sep-16 31-Dec-16 31-Mar-17
Total cash Holdco & non opco cash
Local currencies
loans46.5%
Hedged USD loans26.9%
Unhedged USD loans26.6%
In million Loan Currency USD Local Total (RM)
Hold co & Non OpCoUSD 1,795 7,912
Sub-total 1,795 7,912
OpCos USD 713 3,147
RM 5,000 5,000
IDR 9,916,614 3,350
BDT 15,089 855
SLR 11,880 355
PKR 1,426 61
Sub-Total 713 12,768
Total Group 2,508 20,679

1Q 2017 14
FY17 headline KPIs: In line
*1 USD = RM4.55
** Capex is not a headline KPI
Headline KPIs(based on Bloomberg*
estimate for 2017 forex)Guidance
Headline KPIs(based on constant
currency)Guidance
Revenue growth 9% - 11% In line 8% - 10% In line
EBITDA growth 7% - 9% In line 6% - 8% In line
ROIC 4.5% - 5.0% In line 4.5% - 5.0% In line
ROCE 4.0% - 4.5% In line 4.0% - 4.5% In line
Capex ** RM6.6bn RM6.4bn
Note:
• D&A run rate ~ 1Q17
• Net finance cost run rate ~ 1Q17
1Q 2017 15
Key opportunities and challenges
Opportunities
Celcom ‘Refresh’ and XL ‘Transformation Agenda’.
e.Co‘s organic and inorganic growth.
Portfolio rebalancing and optimum capital allocation.
Challenges
Currency volatility and increasingly stringent foreign exchange control requirements inMalaysia.
Tax and regulatory uncertainties in Malaysia (spectrum allocation), Nepal (capital gainstax, ILD interconnection, 4G license), Sri Lanka (new taxes in 2017 Budget) andBangladesh (4G license / technology neutrality).
Heightened competition in all markets especially Malaysia, Singapore and India.

1Q 2017 16
Appendix
1Q 2017 17
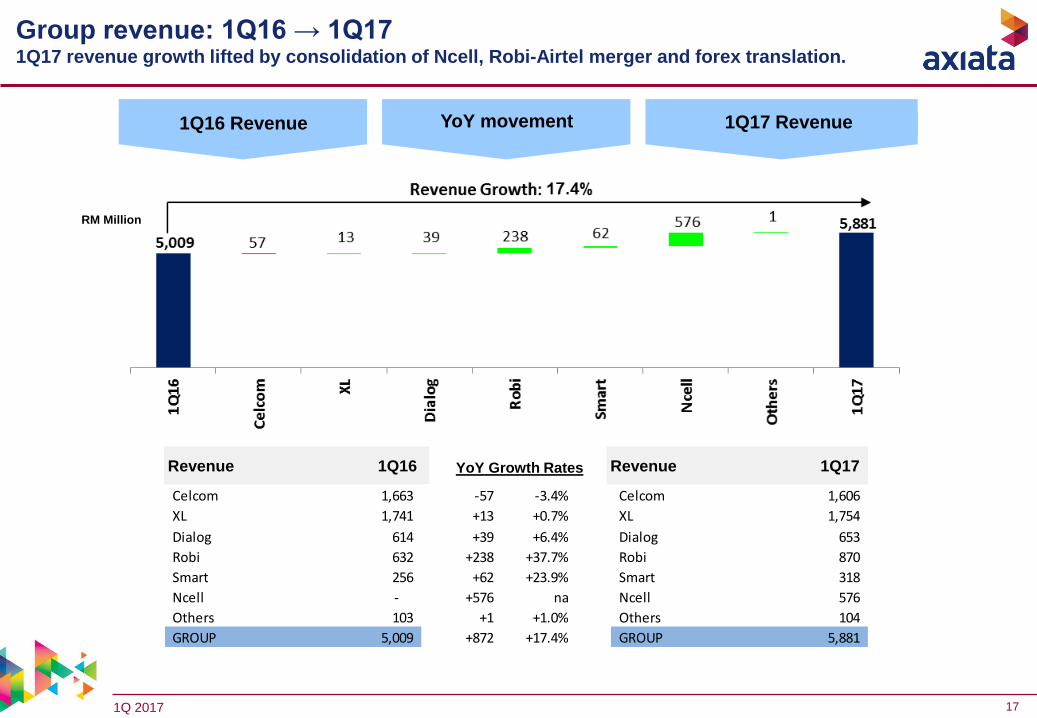
Revenue Q116 Revenue Q117
Celcom 1,663 -57 -3.4% Celcom 1,606
XL 1,741 +13 +0.7% XL 1,754
Dialog 614 +39 +6.4% Dialog 653
Robi 632 +238 +37.7% Robi 870
Smart 256 +62 +23.9% Smart 318
Ncell - +576 na Ncell 576
Others 103 +1 +1.0% Others 104
GROUP 5,009 +872 +17.4% GROUP 5,881
YoY Growth Rates
1Q16 Revenue 1Q17 RevenueYoY movement
Revenue 1Q16 Revenue 1Q17
RM Million
Group revenue: 1Q16 → 1Q17 1Q17 revenue growth lifted by consolidation of Ncell, Robi-Airtel merger and forex translation.
YoY Growth Rates
1Q 2017 18
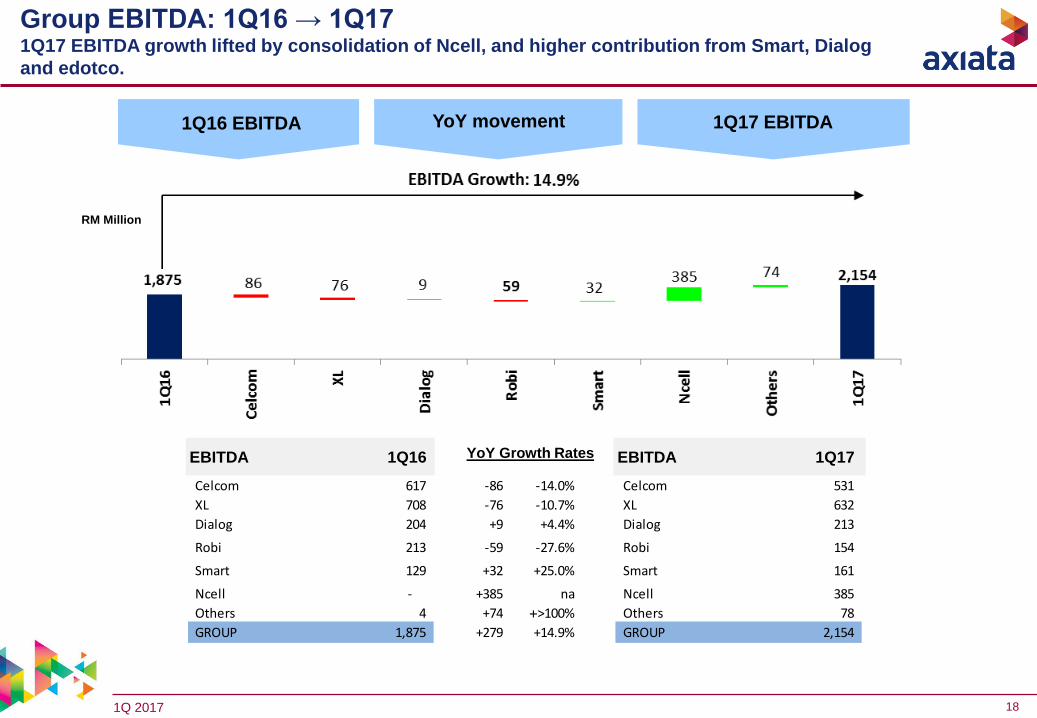
EBITDA Q116 EBITDA Q117
Celcom 617 -86 -14.0% Celcom 531
XL 708 -76 -10.7% XL 632
Dialog 204 +9 +4.4% Dialog 213
Robi 213 -59 -27.6% Robi 154
Smart 129 +32 +25.0% Smart 161
Ncell - +385 na Ncell 385
Others 4 +74 ->100% Others 78
GROUP 1,875 +279 +14.9% GROUP 2,154
YoY Growth Rates
1Q16 EBITDA 1Q17 EBITDAYoY movement
RM Million
Group EBITDA: 1Q16 → 1Q171Q17 EBITDA growth lifted by consolidation of Ncell, and higher contribution from Smart, Dialog
and edotco.
YoY Growth RatesEBITDA 1Q16 EBITDA 1Q17
+
1Q 2017 19
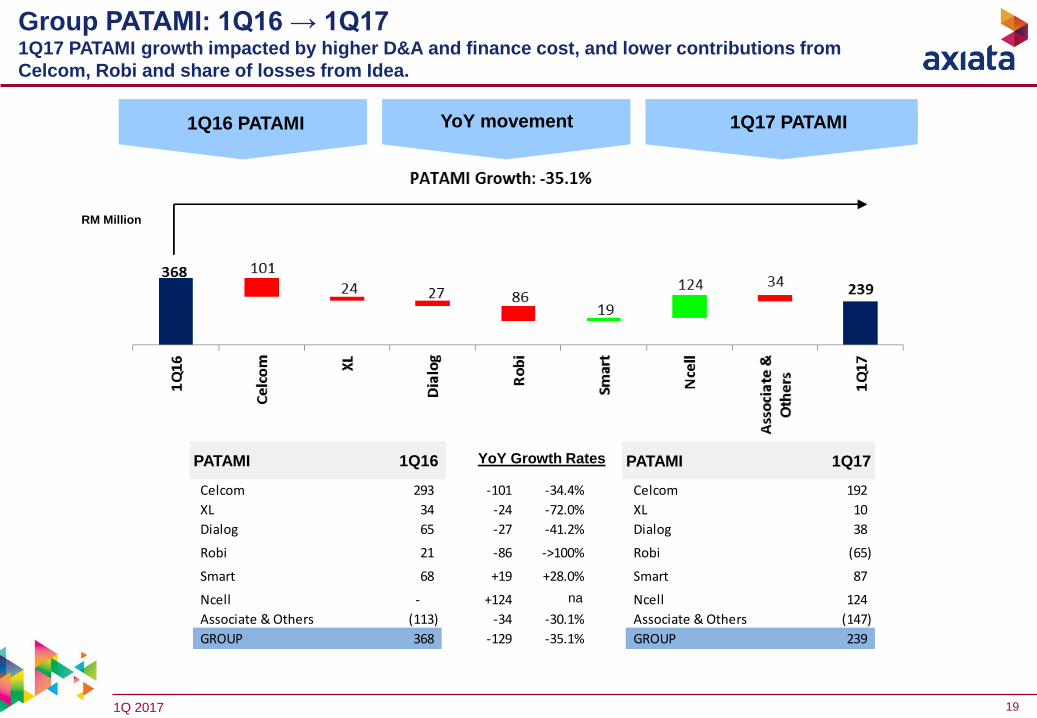
PATAMI Q116 PATAMI Q117
Celcom 293 -101 -34.4% Celcom 192
XL 34 -24 -72.0% XL 10
Dialog 65 -27 -41.2% Dialog 38
Robi 21 -86 ->100% Robi (65)
Smart 68 +19 +28.0% Smart 87
Ncell - +124 -57.7% Ncell 124
Associate & Others (113) -34 -30.1% Associate & Others (147)
GROUP 368 -129 -35.1% GROUP 239
YoY Growth Rates
1Q16 PATAMI 1Q17 PATAMIYoY movement
RM Million
Group PATAMI: 1Q16 → 1Q171Q17 PATAMI growth impacted by higher D&A and finance cost, and lower contributions from
Celcom, Robi and share of losses from Idea.
YoY Growth RatesPATAMI 1Q16 PATAMI 1Q17
na

1Q 2017 20
1,665 1,682 1,630 1,646 1,609
1Q16 2Q16 3Q16 4Q16 1Q17
* Normalisation excludes holding company charge, impact of edotco disposal, Celcom Planet, Sukuk interest
Revenue (RM mn) Data revenue as a % of total revenue
EBITDA* (RM mn) & margins (%)
Normalised
EBITDA
Margin
40.7% 38.2% 35.1% 38.6% 36.5%
PATAMI* (RM mn) & margins (%)
Normalised
PATAMI
Margin
21.1% 19.1% 16.9% 17.1% 16.7%
Service
revenue 91.2% 88.2% 92.1% 92.5% 91.6%
Celcom: financial performance Signs of stabilisation amidst stiff competitive environment.
31%33%
36% 37%41%
1Q16 2Q16 3Q16 4Q16 1Q17
625 596 523
585 538 678 642
572 635 587
1Q16 2Q16 3Q16 4Q16 1Q17
EBITDA Normalised EBITDA
288 261
216 200 192
351 320
276 281 269
1Q16 2Q16 3Q16 4Q16 1Q17
PATAMI Normalised PATAMI

1Q 2017 21
* OPEX and EBITDA Margin excludes holding company charge, impact of edotco disposal and Employee Wish Plan
Operating Expenses*
31 Mar 16 30 June 16 30 Sept 16 31 Dec 16 31 Mar 17
Capex 174 446 892 1,330 167
Cash and Cash Equivalents 1,695 841 1,279 1,022 1,205
Gross Debt 4,488 4,535 4,495 5,035 5,000
Net Assets -591 -1,330 -1,111 -908 -717
Gross Debt / Equity (x) n/m n/m n/m n/m n/m
Gross Debt / EBITDA (x) 1.7 1.7 1.8 2.0 2.1
% of Revenue 1Q16 2Q16 3Q16 4Q16 1Q17
Direct Expenses 23.3% 23.6% 22.8% 21.9% 22.4%
Sales and Marketing 8.3% 7.9% 7.4% 7.5% 7.7%
Network Cost 13.6% 15.8% 18.2% 18.7% 17.0%
Staff Cost 8.2% 6.3% 8.9% 5.1% 8.5%
Bad Debts 0.5% -0.2% 0.1% 0.4% 0.9%
Others 5.3% 8.4% 7.4% 7.9% 6.9%
Total Expenses 59.3% 61.8% 64.9% 61.4% 63.5%
Normalised EBITDA Margin 40.7% 38.2% 35.1% 38.6% 36.5%
Depreciation & Amortisation 12.9% 13.0% 12.5% 16.6% 15.1%
Financial Position (RM mn)
Celcom: financial performance1Q17 normalised EBITDA margin decreased due to the one-off staff cost reversal in 4Q16.

1Q 2017 22
Celcom: operational performanceEncouraging take up on First Gold 80 and First Platinum delivers higher postpaid ARPU.
Subscribers (‘000)
Data traffic (‘mil GB) and data usage (GB) Smartphone penetration and 4G pop coverage (%)
ARPU (RM)
Data
subscribers54.4% 58.2% 60.2% 61.9% 63.1%
2,840 2,897 2,869 2,960 2,946
9,235 8,338 8,285 7,596 7,300
12,075 11,234 11,154
10,556 10,246
1Q16 2Q16 3Q16 4Q16 1Q17
Postpaid Prepaid
76 76 76 80 81
29 29 30 31 30
39 39 41
43 43
1Q16 2Q16 3Q16 4Q16 1Q17
Postpaid Prepaid Blended
62%
66% 66% 64% 66%
61%
72% 72%76% 77%
1Q16 2Q16 3Q16 4Q16 1Q17Smartphone penetration 4G pop coverage
45.2 55.8
65.4
76.9
96.7 2.3 2.8 3.2
3.9
5.0
1Q16 2Q16 3Q16 4Q16 1Q17
Data traffic ('mil GB) Data usage/data subcriber/month (GB)
1Q 2017 23
169
55 (65)
216
47(159) 18 56 (124) 20
1Q16 2Q16 3Q16 4Q16 1Q17
PAT Normalisation
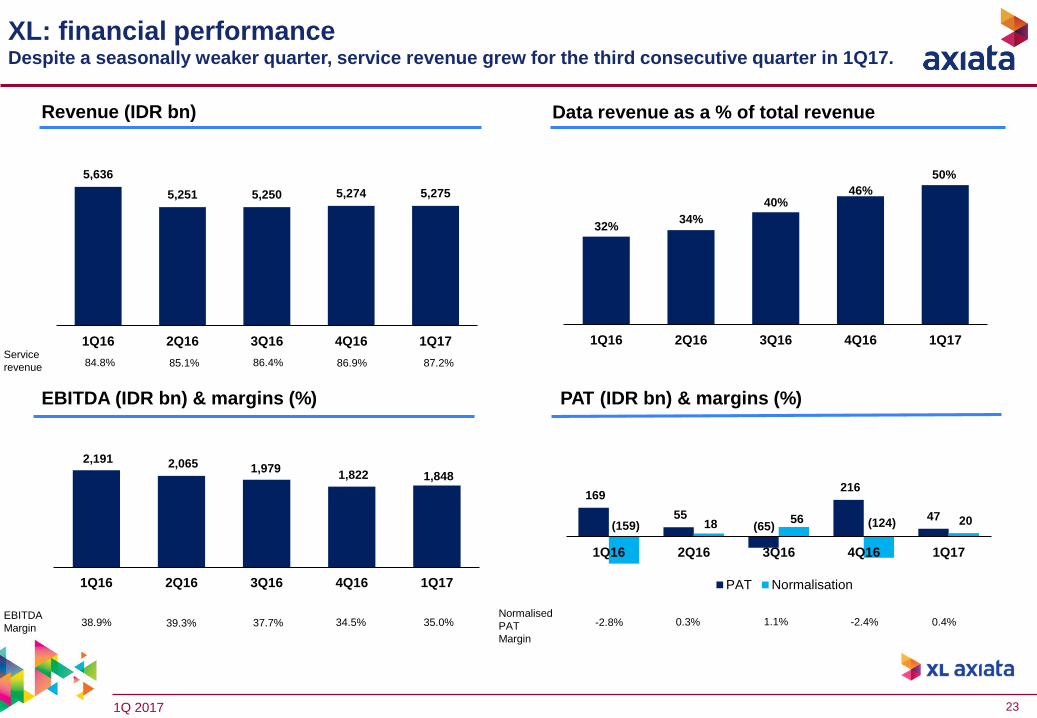
XL: financial performanceDespite a seasonally weaker quarter, service revenue grew for the third consecutive quarter in 1Q17.
Revenue (IDR bn) Data revenue as a % of total revenue
EBITDA (IDR bn) & margins (%)
EBITDA
Margin 38.9% 39.3% 37.7% 34.5% 35.0%
PAT (IDR bn) & margins (%)
Normalised
PAT
Margin
-2.8% 0.3% 1.1% -2.4% 0.4%
Service
revenue 84.8% 85.1% 86.4% 86.9% 87.2%
5,636
5,251 5,250 5,274 5,275
1Q16 2Q16 3Q16 4Q16 1Q17
32%34%
40%46%
50%
1Q16 2Q16 3Q16 4Q16 1Q17
2,191 2,065 1,979 1,822 1,848
1Q16 2Q16 3Q16 4Q16 1Q17

1Q 2017 24
XL: financial performance1Q17 EBITDA margin improved by 0.5pp QoQ to 35.0%, driven by revenue improvement and focus on
cost efficiencies.
Operating Expenses
31 Mar 16 30 Jun 16 30 Sept 16 31 Dec 16 31 Mar 17
Capitalised Capex 1,048 2,263 3,450 6,474 971
Cash and Cash Equivalents 2,222 6,217 3,343 1,400 1,730
Gross Debt 25,229 17,888 15,157 14,671 14,560
Net Assets 14,270 21,018 20,945 21,209 21,256
Gross Debt / Equity (x) 1.8 0.9 0.7 0.7 0.7
Gross Debt / EBITDA (x) 2.9 2.0 1.8 1.8 1.9
% of Revenue 1Q16 2Q16 3Q16 4Q16 1Q17
Direct Expenses 7.2% 8.0% 10.0% 11.0% 12.5%
Sales and Marketing 5.8% 5.2% 7.3% 8.5% 5.2%
Network Cost 39.3% 40.0% 37.4% 37.7% 39.9%
Staff Cost 5.8% 5.3% 5.0% 5.5% 4.9%
Others incl. discount 3.0% 2.2% 2.6% 2.8% 2.5%
Total Expenses 61.1% 60.7% 62.3% 65.5% 65.0%
EBITDA Margin 38.9% 39.3% 37.7% 34.5% 35.0%
Depreciation & Amortisation 33.2% 39.8% 34.3% 43.3% 31.8%
Financial Position (IDR bn)

1Q 2017 25
XL: operational performance1Q17 total traffic growth of 178% YoY, driven by higher smartphone penetration of 65% and data users
at 68% of subscriber base.
Total traffic (‘000 TB) Smartphone penetration (%) and 4G BTS
ARPU (IDR ‘000)Subscribers (‘000)
Data
subscribers54% 54% 65% 65% 68%
438 490 511 533 540
42,034 43,482 44,461 45,941 47,437
42,472 43,972 44,972 46,474 47,977
1Q16 2Q16 3Q16 4Q16 1Q17
Postpaid Prepaid
127 113 109
118 124
38 34 34 33 32
39 35 34 34 33
(14)
(4)
6
16
26
36
-
20
40
60
80
100
120
140
160
180
1Q16 2Q16 3Q16 4Q16 1Q17
Postpaid Prepaid Blended
85.2
112.1
137.6
180.4
236.7
1Q16 2Q16 3Q16 4Q16 1Q17
Total traffic ('000 TB)
48%53%
60%63% 65%
3,286
5,250 7,204
8,204 10,330
(10,000)
(5,000)
-
5,000
10,000
15,000
30%
40%
50%
60%
70%
80%
90%
1Q16 2Q16 3Q16 4Q16 1Q17
Smartphone penetration Total 4G BTS
1Q 2017 26
Revenue (SLR mn) Data revenue as a % of total mobile revenue*
EBITDA (SLR mn) & margins (%)
EBITDA
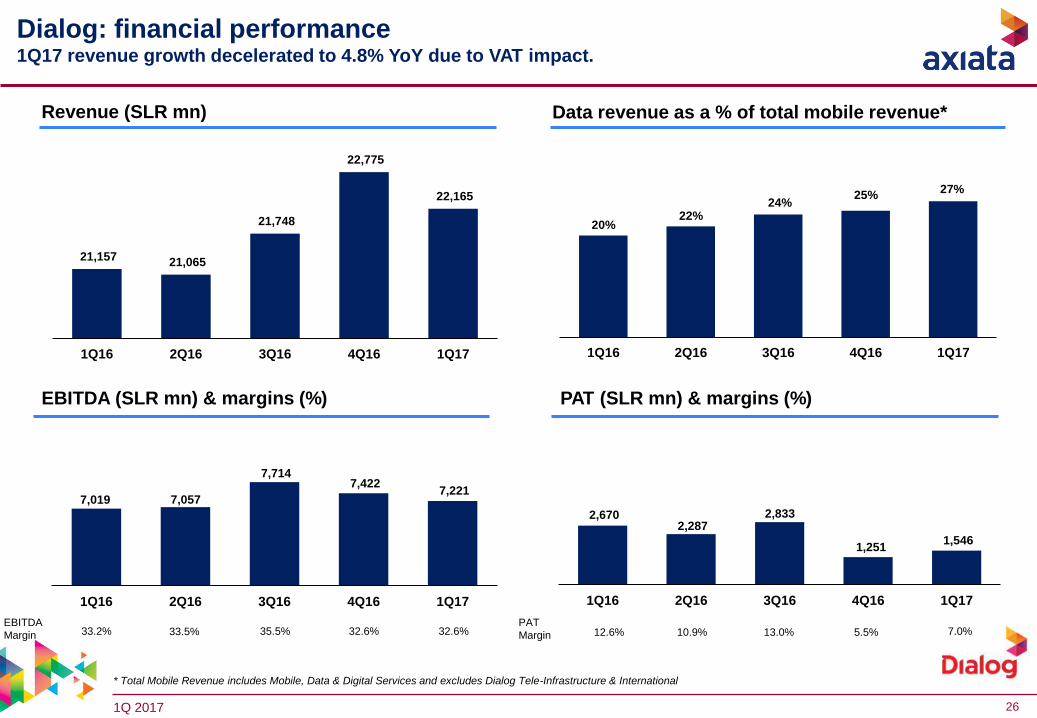
Margin 33.2% 33.5% 35.5% 32.6%
PAT (SLR mn) & margins (%)
PAT
Margin 12.6% 10.9% 13.0% 5.5%32.6% 7.0%
* Total Mobile Revenue includes Mobile, Data & Digital Services and excludes Dialog Tele-Infrastructure & International
Dialog: financial performance1Q17 revenue growth decelerated to 4.8% YoY due to VAT impact.
21,157 21,065
21,748
22,775
22,165
1Q16 2Q16 3Q16 4Q16 1Q17
20%22%
24%25%
27%
1Q16 2Q16 3Q16 4Q16 1Q17
7,019 7,057
7,714 7,422
7,221
1Q16 2Q16 3Q16 4Q16 1Q17
2,670 2,287
2,833
1,251 1,546
1Q16 2Q16 3Q16 4Q16 1Q17

1Q 2017 27
¹ Restated. Spectrum fees now included under ‘network cost’ instead of ‘others’.
² Capex excludes Customer Premises Equipment investments and spectrum acquisition & license renewal
³ Excludes cash from overdraft facilities
Dialog: financial performanceDialog benefits from cost rescaling initiatives and keep EBITDA margin stable QoQ.
Operating Expenses¹
31 Mar 16 30 Jun 16 30 Sept 16 31 Dec 16 31 Mar 17
Capex² 2,942 7,091 12,742 23,173 3,994
Cash and Cash Equivalents³ 9,741 3,653 5,072 6,410 4,123
Gross Debt 31,540 31,850 31,916 32,562 33,041
Net Assets 49,935 49,609 52,510 54,021 55,606
Gross Debt / Equity (x) 0.6 0.6 0.6 0.6 0.6
Gross Debt / EBITDA (x) 1.1 1.1 1.1 1.1 1.1
% of Revenue 1Q16 2Q16 3Q16 4Q16 1Q17
Direct Expenses 29.9% 27.7% 26.1% 27.8% 26.6%
Sales and Marketing 13.7% 13.8% 14.8% 15.0% 15.3%
Network Cost 12.2% 11.9% 12.8% 12.9% 13.5%
Staff Cost 7.8% 7.5% 8.1% 8.1% 8.3%
Bad debts 1.0% 2.5% 0.2% 1.4% 0.7%
Others 2.0% 3.1% 2.5% 2.2% 3.0%
Total Expenses 66.8% 66.5% 64.5% 67.4% 67.4%
EBITDA Margin 33.2% 33.5% 35.5% 32.6% 32.6%
Depreciation & Amortisation 17.4% 18.1% 18.9% 20.9% 19.6%
Financial Position (SLR mn)

1Q 2017 28
Dialog: operational performanceMobile subscribers grew 15.8% YoY; ARPU impacted by weaker consumer spending due to VAT.
Smartphone penetration (%) and 4G BTS
ARPU* (SLR)Subscribers* (‘000)
* Restated for 2Q16 subscribers and ARPU.
Data
subscribers25.9% 26.1% 27.9% 28.8% 29.4%
Data traffic (‘mil GB) and data usage (GB)
1,166 1,187 1,209 1,253 1,260
9,424 9,770 10,103 10,572 11,008
10,590 10,957 11,313 11,825 12,268
1Q16 2Q16 3Q16 4Q16 1Q17
Postpaid Prepaid
1,115 1,180 1,160 1,171
1,088
307 296 316 301 292
393 392 406
393 375
-
50
100
150
200
250
300
350
400
450
-
200
400
600
800
1,000
1,200
1,400
1,600
1,800
1Q16 2Q16 3Q16 4Q16 1Q17
Postpaid Prepaid Blended
14.6 17.8
21.2 24.3
25.8
1.8 2.1
2.2 2.4 2.4
(2.0)
(1.0)
-
1.0
2.0
3.0
-
5.0
10.0
15.0
20.0
25.0
30.0
35.0
40.0
45.0
50.0
1Q16 2Q16 3Q16 4Q16 1Q17
Data traffic ('mil GB) Data usage/data subcriber/month (GB)
36% 38%41%
44%46%
1,778 1,917 2,049
2,384 2,439
(1,000)
(500)
-
500
1,000
1,500
2,000
2,500
3,000
0%
10%
20%
30%
40%
50%
60%
70%
1Q16 2Q16 3Q16 4Q16 1Q17
Smartphone penetration Total 4G BTS
1Q 2017 29
Revenue (BDT mn) Data revenue as a % of total revenue
EBITDA* (BDT mn) & margins (%) PAT* (BDT mn) & margins (%)
Proforma
EBITDA
Margin
Proforma
PAT
Margin
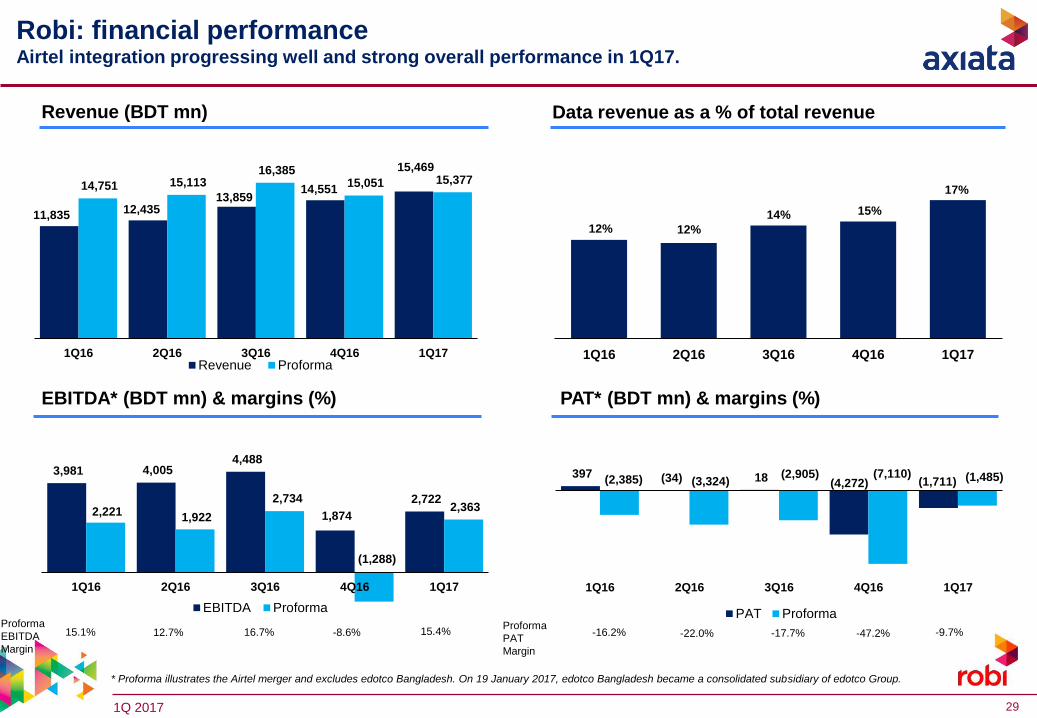
* Proforma illustrates the Airtel merger and excludes edotco Bangladesh. On 19 January 2017, edotco Bangladesh became a consolidated subsidiary of edotco Group.
-8.6%12.7% 16.7% 15.4% -47.2%-22.0% -17.7% -9.7%15.1% -16.2%
Robi: financial performanceAirtel integration progressing well and strong overall performance in 1Q17.
12% 12%
14% 15%
17%
1Q16 2Q16 3Q16 4Q16 1Q17
11,835 12,435
13,859 14,551
15,469
14,751 15,113 16,385
15,051 15,377
1Q16 2Q16 3Q16 4Q16 1Q17Revenue Proforma
3,981 4,005 4,488
1,874
2,722 2,221
1,922
2,734
(1,288)
2,363
1Q16 2Q16 3Q16 4Q16 1Q17
EBITDA Proforma
397 (34) 18 (4,272) (1,711)(2,385) (3,324)(2,905) (7,110) (1,485)
1Q16 2Q16 3Q16 4Q16 1Q17
PAT Proforma

1Q 2017 30
Operating Expenses
31 Mar 16 30 Jun 16 30 Sept 16 31 Dec 16 31 Mar 17
Capex 4,435 9,991 12,917 20,335 4,055
Cash and Cash Equivalents 3,395 4,968 4,229 4,228 1,808
Gross Debt 22,029 21,720 19,480 32,562 25,029
Net Assets 55,287 55,253 55,270 69,441 59,719
Gross Debt / Equity (x) 0.4 0.4 0.4 0.5 0.4
Gross Debt / EBITDA (x) 1.4 1.4 1.2 2.3 2.3
% of Revenue 1Q16 2Q16 3Q16 4Q16 1Q17
Direct Expenses 21.8% 25.5% 29.7% 30.9% 27.6%
Sales and Marketing 13.1% 13.7% 12.6% 15.0% 15.7%
Network Cost 16.9% 16.1% 13.1% 18.9% 27.4%
Staff Cost 5.8% 5.6% 5.2% 8.6% 4.6%
Bad debts 0.4% -0.9% 0.4% 1.4% 0.2%
Others 6.8% 6.5% 5.7% 11.3% 6.9%
Total Expenses 64.9% 66.6% 66.6% 86.1% 82.4%
EBITDA Margin * 35.1% 33.4% 33.4% 13.9% 17.6%
Depreciation & Amortisation 27.8% 29.7% 28.6% 50.0% 27.9%
Financial Position (BDT mn)
Robi: financial performance1Q17 EBITDA margin impacted by edotco carve out and Airtel dilution.
* Normalised EBITDA margin for 1Q16 to 4Q16

1Q 2017 31
Smartphone penetration (%) and 3G BTS
ARPU (BDT)Subscribers (‘000)
Data
subscribers47.5% 48.5% 56.8% 55.8% 55.3%
Data traffic (‘mil GB) and data usage (MB)
Robi: operational performanceIncreases subscriber base by 7.1% QoQ.
176 187 182 342 343
27,274 27,255 23,652
33,489 35,857
27,450 27,442 23,834
33,830 36,200
1Q16 2Q16 3Q16 4Q16 1Q17
Postpaid Prepaid
280 286 278 281 261
133 133 154 149
131
135 135
155 151
133
1Q16 2Q16 3Q16 4Q16 1Q17
Postpaid Prepaid Blended
8.2 10.4
14.8
21.9
27.1 208 264
367 451 465
1Q16 2Q16 3Q16 4Q16 1Q17
Total traffic ('mil GB) Data usage/data subcriber/month (MB)
18%
24%27% 29% 30%
4,195 4,624
5,225
7,711 7,989
1Q16 2Q16 3Q16 4Q16 1Q17
Smartphone penetration Total 3G BTS

1Q 2017 32
9,230
9,962
8,935
9,533
8,686
1Q16 2Q16 3Q16 4Q16 1Q17
Revenue (NPR mn) Data revenue as a % of total revenue
EBITDA (NPR mn) & margins (%)
EBITDA
Margin 65.7% 64.7% 60.1% 66.5% 63.5%
PAT (NPR mn) & margins (%)
PAT
Margin 34.5% 38.6% 27.7% 37.6% 34.8%
Nepal
Ncell: financial performanceSoft 1Q17 due to ILD revenue decline and more aggressive data pricing.
14,054
15,392
14,862
14,343
13,679
1Q16 2Q16 3Q16 4Q16 1Q17
14%15%
17%18%
17%
1Q16 2Q16 3Q16 4Q16 1Q17
4,852
5,944
4,111
5,390 4,766
1Q16 2Q16 3Q16 4Q16 1Q17
1Q 2017 33
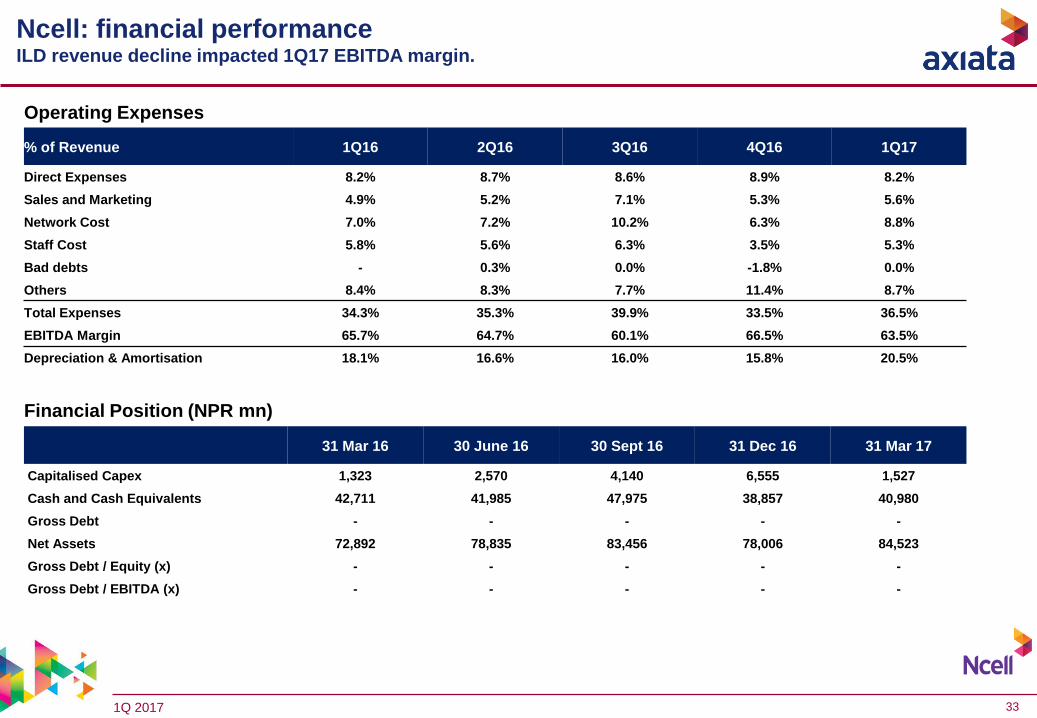
Operating Expenses
31 Mar 16 30 June 16 30 Sept 16 31 Dec 16 31 Mar 17
Capitalised Capex 1,323 2,570 4,140 6,555 1,527
Cash and Cash Equivalents 42,711 41,985 47,975 38,857 40,980
Gross Debt - - - - -
Net Assets 72,892 78,835 83,456 78,006 84,523
Gross Debt / Equity (x) - - - - -
Gross Debt / EBITDA (x) - - - - -
% of Revenue 1Q16 2Q16 3Q16 4Q16 1Q17
Direct Expenses 8.2% 8.7% 8.6% 8.9% 8.2%
Sales and Marketing 4.9% 5.2% 7.1% 5.3% 5.6%
Network Cost 7.0% 7.2% 10.2% 6.3% 8.8%
Staff Cost 5.8% 5.6% 6.3% 3.5% 5.3%
Bad debts - 0.3% 0.0% -1.8% 0.0%
Others 8.4% 8.3% 7.7% 11.4% 8.7%
Total Expenses 34.3% 35.3% 39.9% 33.5% 36.5%
EBITDA Margin 65.7% 64.7% 60.1% 66.5% 63.5%
Depreciation & Amortisation 18.1% 16.6% 16.0% 15.8% 20.5%
Financial Position (NPR mn)
Nepal
Ncell: financial performanceILD revenue decline impacted 1Q17 EBITDA margin.

1Q 2017 34
Nepal
ARPU (NPR)Subscribers (‘000)
Data
subscribers39.3% 41.7% 41.9% 40.3% 42.9%
Data traffic (‘mil GB) and data usage (MB) Smartphone penetration (%) and 3G BTS
Ncell: operational performanceHigher subscriber base and declining ILD revenue impacted 1Q17 ARPU.
N/A
429 472 497 490 476
13,005 13,535 13,892 14,427 14,740
1Q16 2Q16 3Q16 4Q16 1Q17
Postpaid Prepaid
13,43414,006 14,388 14,917 15,216
417 425 381
342 328 349 365 343
319 297
351 367
345 320
298
-
50
100
150
200
250
300
350
400
450
-
100
200
300
400
500
600
700
1Q16 2Q16 3Q16 4Q16 1Q17
Postpaid Prepaid Blended
2.12.7
3.43.8
4.8
142 160
193 212
263
(50)
-
50
100
150
200
250
0
1000
2000
3000
4000
5000
6000
7000
8000
9000
10000
1Q16 2Q16 3Q16 4Q16 1Q17
Data traffic ('mil GB) Data usage/data subcriber/month (MB)
36%39% 42%
49%
1,661 1,735 1,800 1,915 2,092
(2,000) (1,500) (1,000) (500) - 500 1,000 1,500 2,000 2,500
0%
10%
20%
30%
40%
50%
60%
70%
1Q16 2Q16 3Q16 4Q16 1Q17
Smartphone penetration (%) Total 3G BTS

1Q 2017 35
Towers (‘000)Tenancies (‘000)
Managed sites (‘000) Tenancy ratio (x)
edotco Group: operational performance (proforma)Tower portfolio rises to 17,436 and tenancy ratio at 1.58x.
25,302
25,798 25,995
26,643
27,474
1Q16 2Q16 3Q16 4Q16 1Q17
16,656 16,774
17,054
17,286
17,436
1Q16 2Q16 3Q16 4Q16 1Q17
6,858 7,003
8,130 8,525 8,382
1Q16 2Q16 3Q16 4Q16 1Q17
1.52
1.54
1.52
1.54
1.58
1Q16 2Q16 3Q16 4Q16 1Q17

1Q 2017 36
Foreign exchange
Source: Bloomberg
Average Rate
1Q16
Average Rate
4Q16
Average Rate
1Q17
QoQ
Appreciation/
(Depreciation)
against MYR
YoY
Appreciation/
(Depreciation)
against MYR
QoQ
Appreciation/
(Depreciation)
against USD
YoY
Appreciation/
(Depreciation)
against USD
(%) (%) (%) (%)
INDONESIAN RUPIAH, IDR 0.000310 0.000311 0.000333 7.07 7.42 3.10 1.39
SRI LANKA RUPEE, LKR 0.029005 0.030124 0.029432 (2.30) 1.47 (5.92) (4.22)
BANGLADESHI TAKA, BDT 0.053408 0.054606 0.056264 3.04 5.35 (0.79) (0.56)
US DOLLAR, USD 4.197858 4.282427 4.447465 3.85 5.95 0.00 0.00
SINGAPORE DOLLAR, SGD 2.990633 3.042696 3.137025 3.10 4.89 (0.73) (0.99)
PAKISTAN RUPEE, PKR 0.040070 0.040825 0.042439 3.95 5.91 0.10 (0.03)
INDIAN RUPEE, INR 0.062189 0.064976 0.066336 2.09 6.67 (1.70) 0.68
NEPALESE RUPEE, NPR 0.037534 0.040066 0.041441 3.43 10.41 (0.41) 4.21
Local Currency
Local
Currency
Closing Rate
Mar'16
Closing Rate
Dec'16
Closing Rate
Mar'17QoQ % YoY %
IDR 0.000297 0.000333 0.000332 -0.3% 11.8%
LKR 0.026700 0.030000 0.029100 -3.0% 9.0%
BDT 0.049531 0.057021 0.055524 -2.6% 12.1%
USD 3.942000 4.486000 4.420000 -1.5% 12.1%
SGD 2.918600 3.100600 3.168300 2.2% 8.6%
PKR 0.037638 0.042885 0.042176 -1.7% 12.1%
INR 0.059417 0.066063 0.068079 3.1% 14.6%
NPR NA 0.041289 0.042549 3.1% NA


