
AutomationofSurfaceIrrigationSystems
Khaled Bali, Tom Gill (USBR), Dale Lentz (USBR), Daniele Zaccaria (UCD), Dan Putnam (UCD), Rachael Long (Yolo), Daniel Munk (Fresno), Blake Sanden
(Kern)
[email protected] Cooperative Extension‐Imperial CountyUC Desert Research and Extension Center
Holtville, CA
Phase 1: Cooperating Partners‐ Imperial Valley (2011‐Date)
• UCCE/UC Desert Research and Extension Center (DREC)
• US Bureau of Reclamation Yuma Area Office Water Conservation Field Services Program
• US Bureau of Reclamation Science & Technology Program
• US Bureau of Reclamation Hydraulic Investigations and Laboratory Services Group
• Control Design Inc. (DREC), Rubicon Water (DREC & commercial field)
• Alfalfa Grower
Phase 2: Cooperating Partners (2014‐2017)• UCCE (Imperial, Kern, Fresno, and Yolo) and UCD (Daniele and Dan
Putnam)‐ four locations
• California Department of Water Resources
• US Bureau of Reclamation Science & Technology Program
• US Bureau of Reclamation Hydraulic Investigations and Laboratory Services Group
• Control Design Inc., Rubicon Water, Observant, (tule ET sensors?)
• Alfalfa Growers

California
• Alfalfa is California’s largest agricultural water user
- About 1 million acre of alfalfa
- About 4.0 - 5.5 million ac-ft of water per year
• Surface (flood) irrigation is the primary method of irrigation for alfalfa and other field crops in California
• Imperial Valley (2015):– 128,623 acres (140,134 acres same month last year)– Water use 6.5-7 ac-ft/ac

Irrigation Methods in California:
1- Surface irrigation (flood):- Border strip (flat) irrigation (slope 0.1-0.2%)
- Furrow irrigation (slope)
- Basin irrigation (zero slope)
2- Sprinkler Irrigation (various types)
3- Drip Irrigation (various types)
- Surface drip
- Subsurface drip

Surface irrigation:
- Water application methods where water is applied over the soil surface by gravity (no energy is needed).
- Most common irrigation system throughout the world
- Has been used for thousands of years
- Land leveling practices over the past century made it more efficient
- High efficiency possible on medium and heavy soils
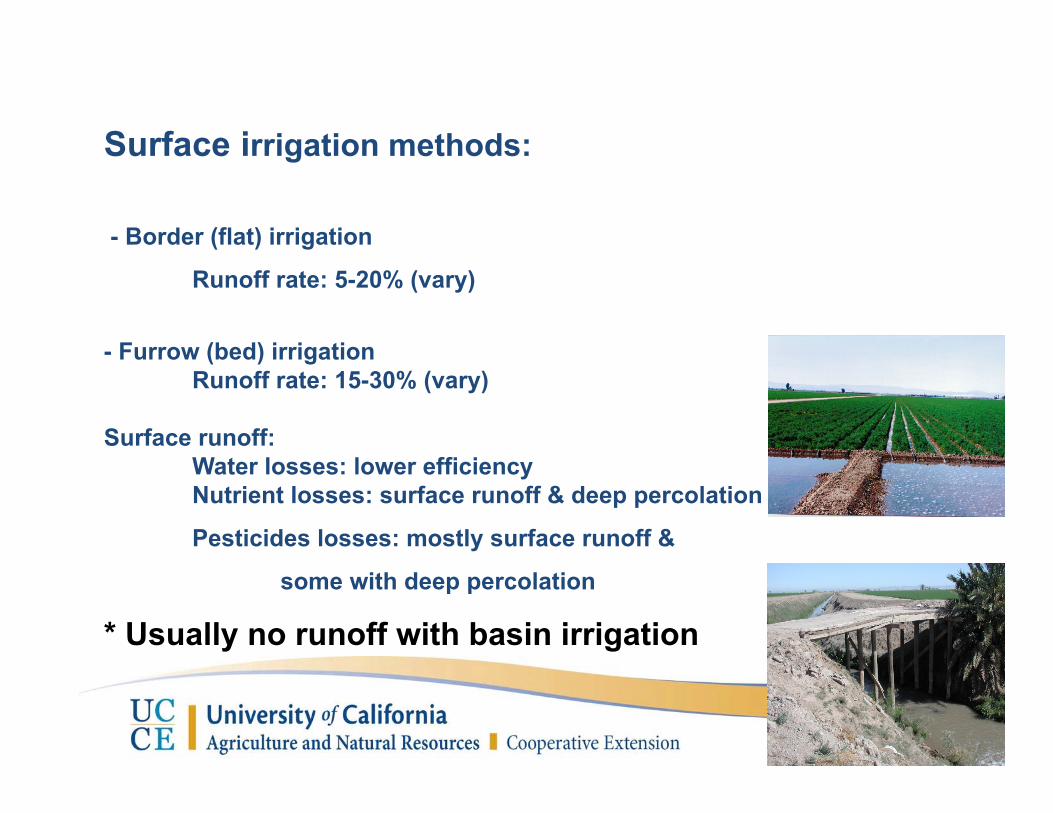
Surface irrigation methods:
- Border (flat) irrigation
Runoff rate: 5-20% (vary)
- Furrow (bed) irrigationRunoff rate: 15-30% (vary)
Surface runoff: Water losses: lower efficiencyNutrient losses: surface runoff & deep percolation
Pesticides losses: mostly surface runoff &
some with deep percolation
* Usually no runoff with basin irrigation
d
zSubsurface
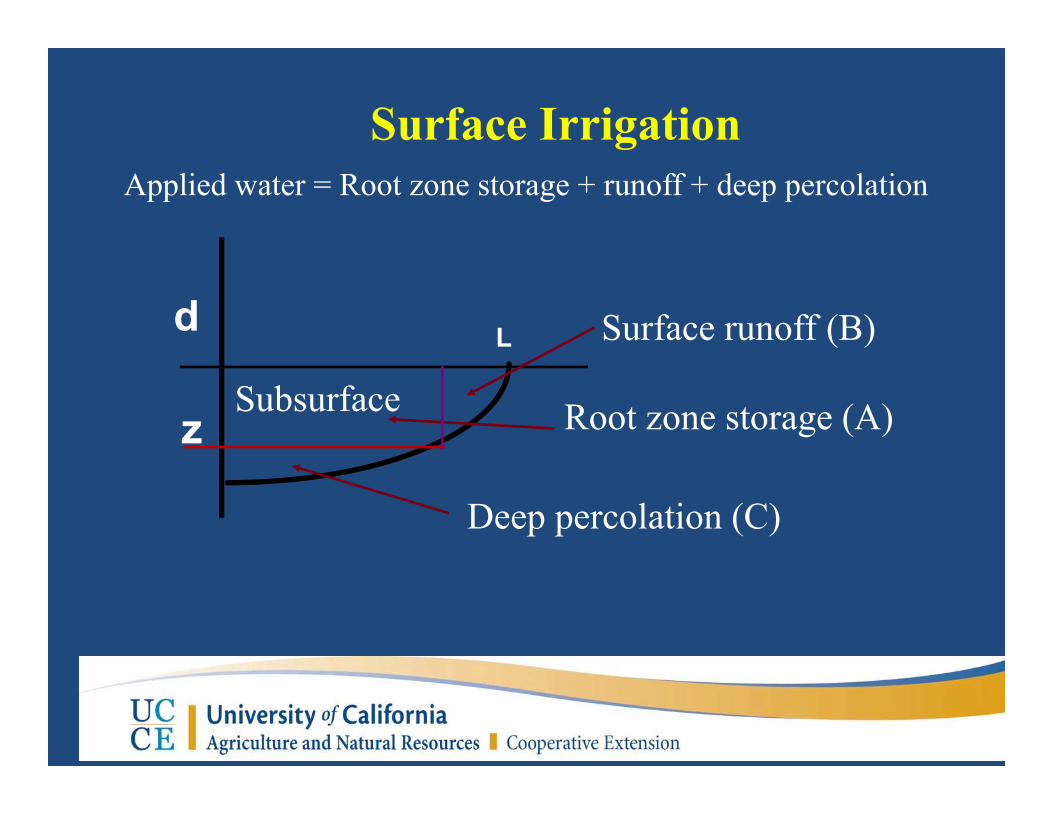
Surface Irrigation
L Surface runoff (B)
Root zone storage (A)
Deep percolation (C)
Applied water = Root zone storage + runoff + deep percolation
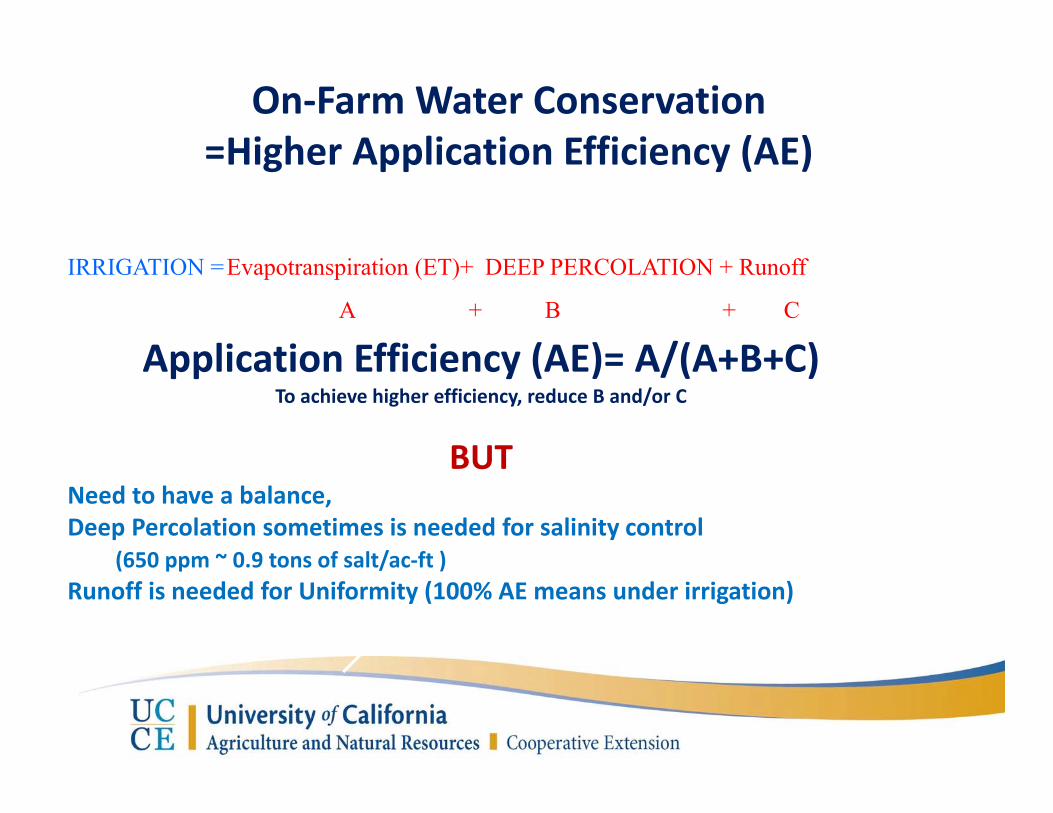
On‐Farm Water Conservation=Higher Application Efficiency (AE)
Application Efficiency (AE)= A/(A+B+C)To achieve higher efficiency, reduce B and/or C
BUTNeed to have a balance, Deep Percolation sometimes is needed for salinity control
(650 ppm ~ 0.9 tons of salt/ac‐ft )Runoff is needed for Uniformity (100% AE means under irrigation)
DEEP PERCOLATION + Runoff
B + C
Evapotranspiration (ET)+
A +
IRRIGATION =
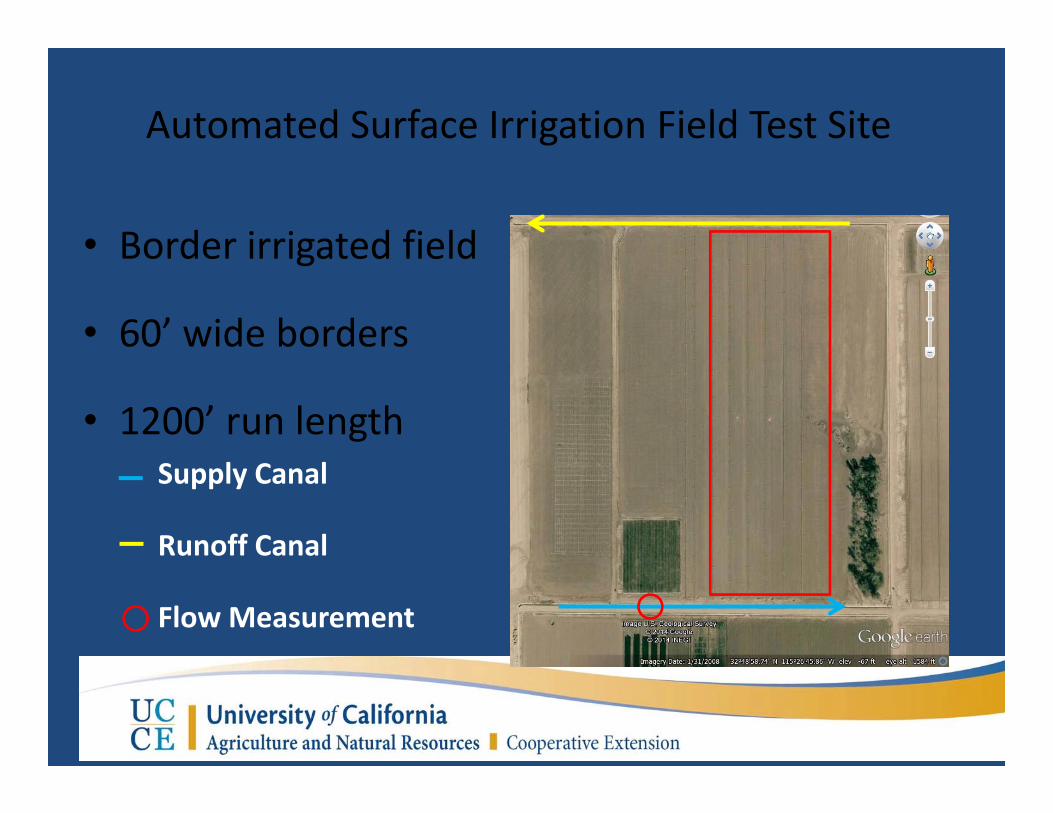
Automated Surface Irrigation Field Test Site
• Border irrigated field
• 60’ wide borders
• 1200’ run lengthSupply Canal
Runoff Canal
Flow Measurement
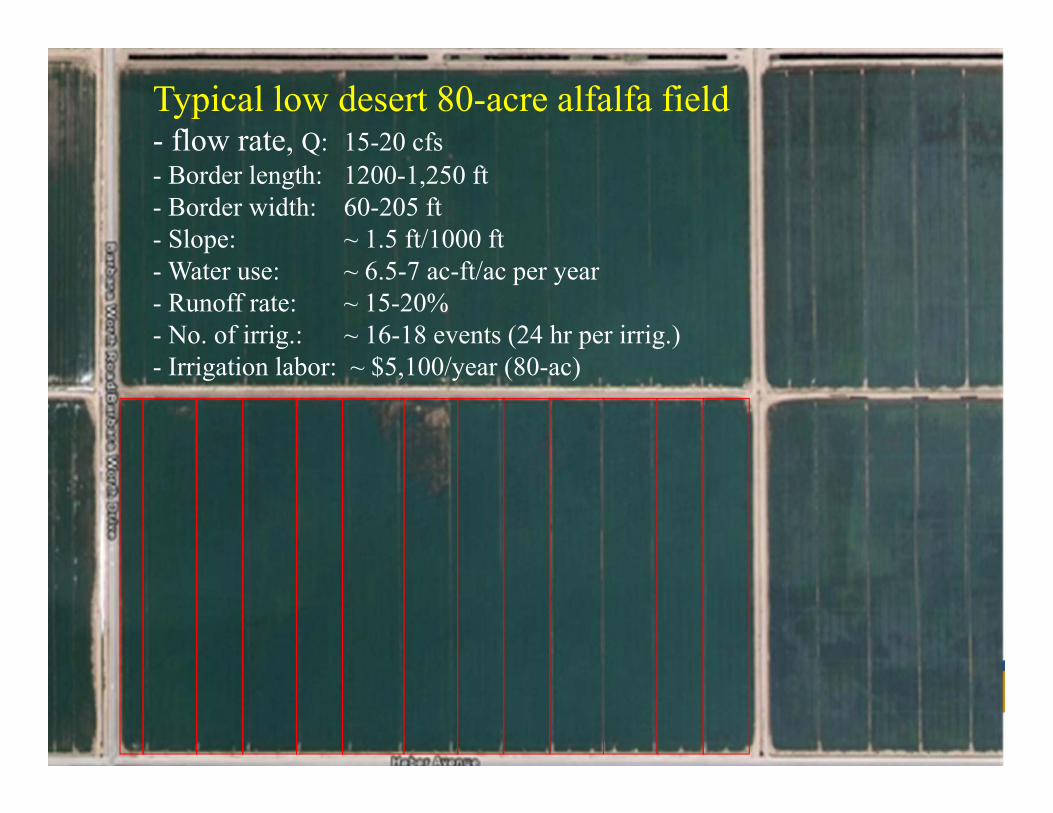
Typical low desert 80-acre alfalfa field- flow rate, Q: 15-20 cfs- Border length: 1200-1,250 ft- Border width: 60-205 ft- Slope: ~ 1.5 ft/1000 ft - Water use: ~ 6.5-7 ac-ft/ac per year- Runoff rate: ~ 15-20%- No. of irrig.: ~ 16-18 events (24 hr per irrig.)- Irrigation labor: ~ $5,100/year (80-ac)

d
z
Surface
Subsurface
Surface
Subsurface
L
L
Volume applied= Surface storage +Subsurface storageflow rate*time= d*L + z*L
Automation of Surface Irrigation Systems
• Irrigators typically work in 24‐hr shifts
• Make decisions on when to turn the water off based on a number of variables (flow rate, advance rate, crop height, etc)
• Automation: smart decisions based on accurate and real‐time data (flow rate, advance rate, automated gates, ETc , and other variables)
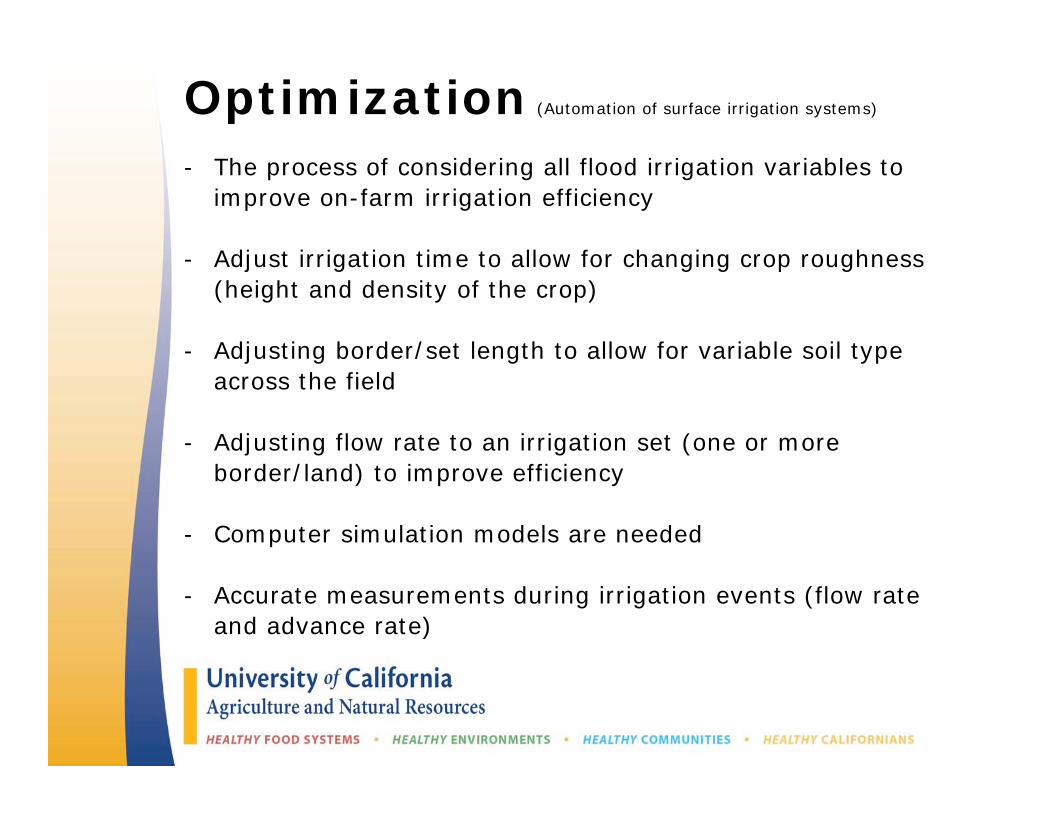
Optimization (Automation of surface irrigation systems)
- The process of considering all flood irrigation variables to improve on-farm irrigation efficiency
- Adjust irrigation time to allow for changing crop roughness (height and density of the crop)
- Adjusting border/set length to allow for variable soil type across the field
- Adjusting flow rate to an irrigation set (one or more border/land) to improve efficiency
- Computer simulation models are needed
- Accurate measurements during irrigation events (flow rate and advance rate)

Optimization‐ Soil type 114 & 115 (heavy soils)‐ lower flow rate or high flow rate will work depending on the time of the year (considerations: erosion rate & scalding)‐ Soil type 106 or 110 (lighter soil)‐ higher flow rate to increase efficiency‐ Soil type 115 & 106 (change flow rate during the irrigation event)
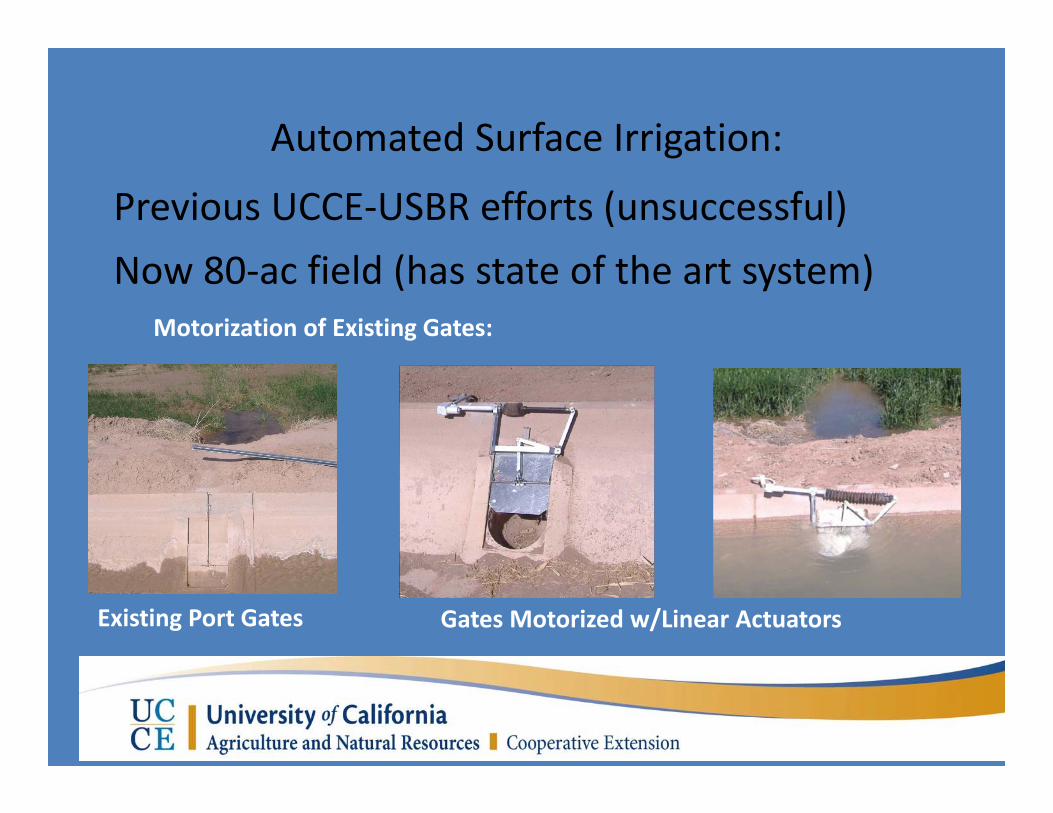
Automated Surface Irrigation:
Previous UCCE‐USBR efforts (unsuccessful) Now 80‐ac field (has state of the art system)
Motorization of Existing Gates:
Existing Port Gates Gates Motorized w/Linear Actuators
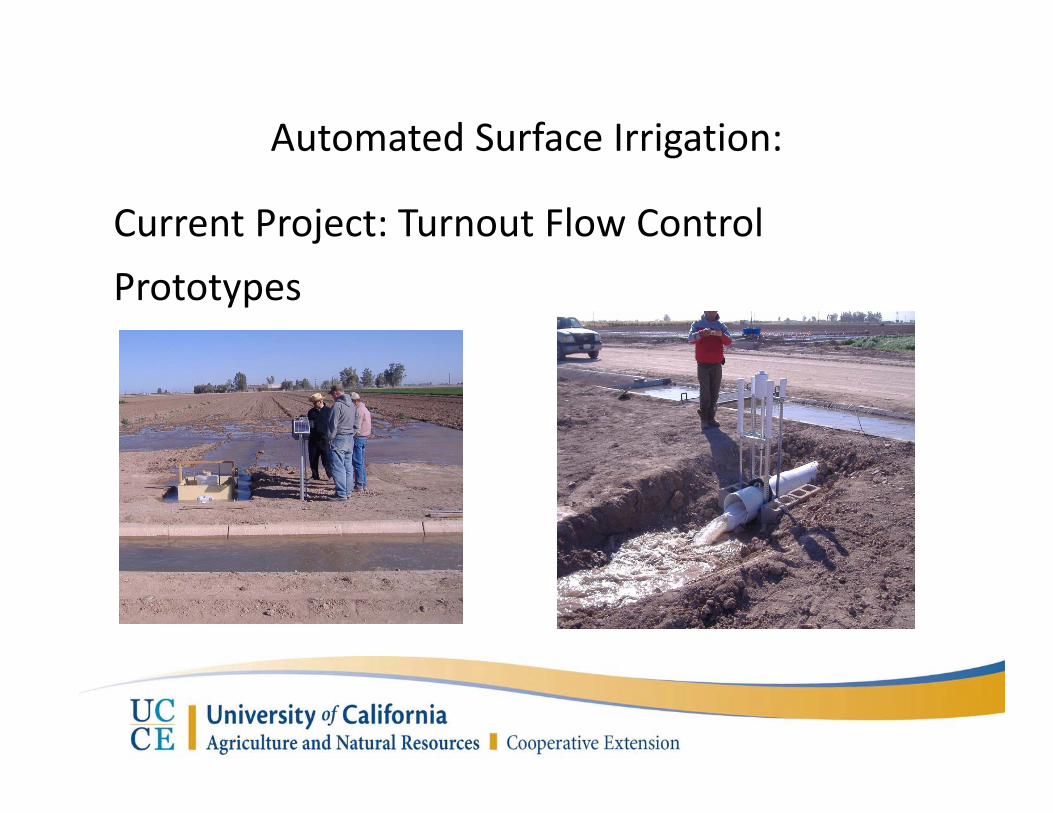
Automated Surface Irrigation:
Current Project: Turnout Flow Control Prototypes
Hydraulic‐Operated Turnout “Pinch Valve” Turnout

Automated Surface Irrigation:
Current Project: Turnout Flow Control Prototypes
“Tip‐Up” Turnout “Tarp Gate” Turnout

Automation of Surface Irrigation Systems
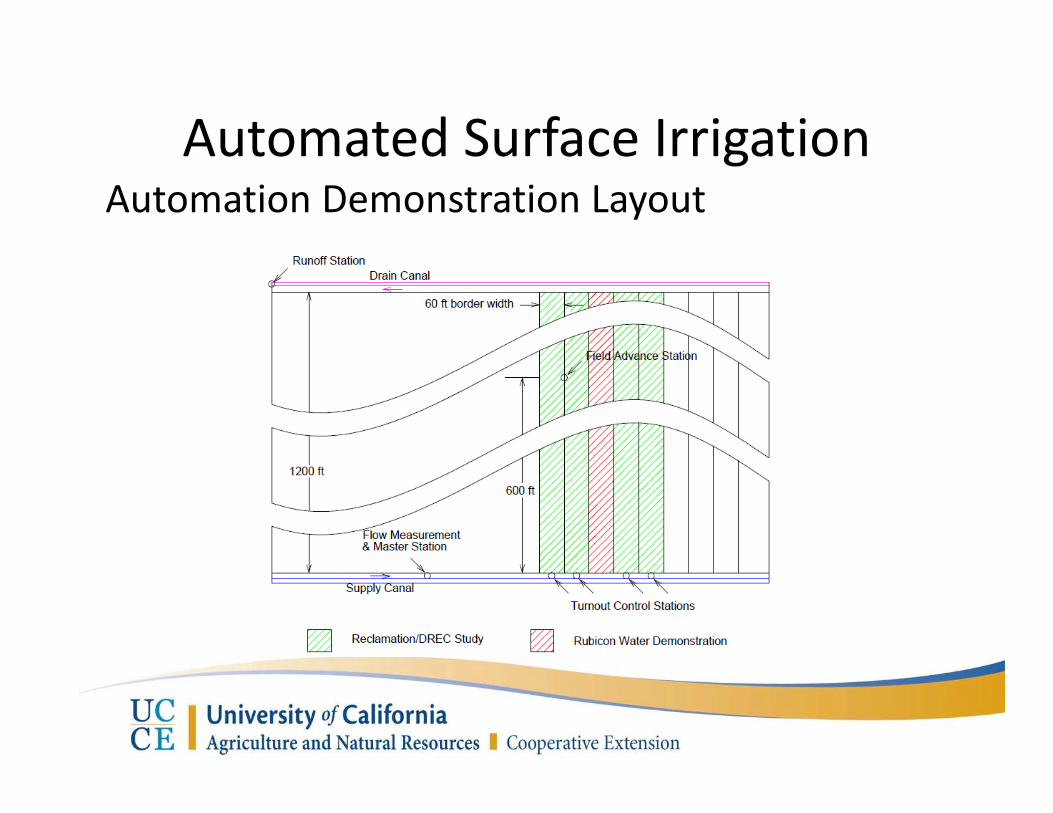
Automated Surface IrrigationAutomation Demonstration Layout
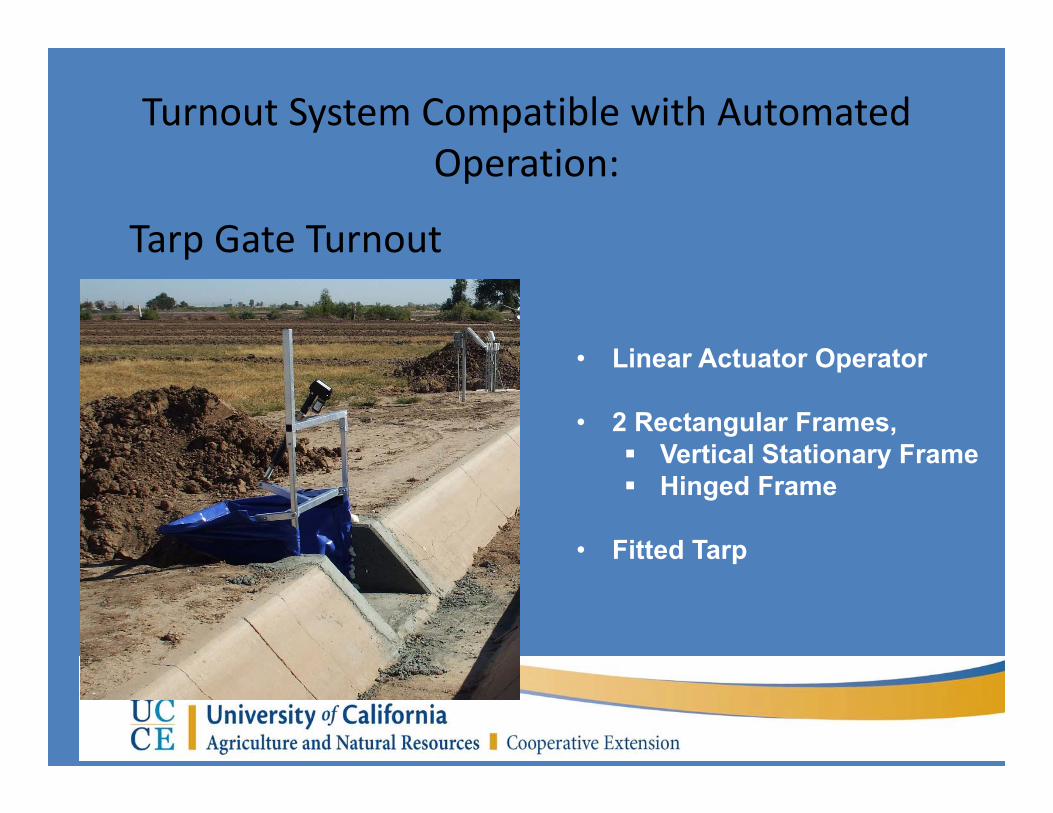
Turnout System Compatible with Automated Operation:
Tarp Gate Turnout
• Linear Actuator Operator
• 2 Rectangular Frames, Vertical Stationary Frame Hinged Frame
• Fitted Tarp
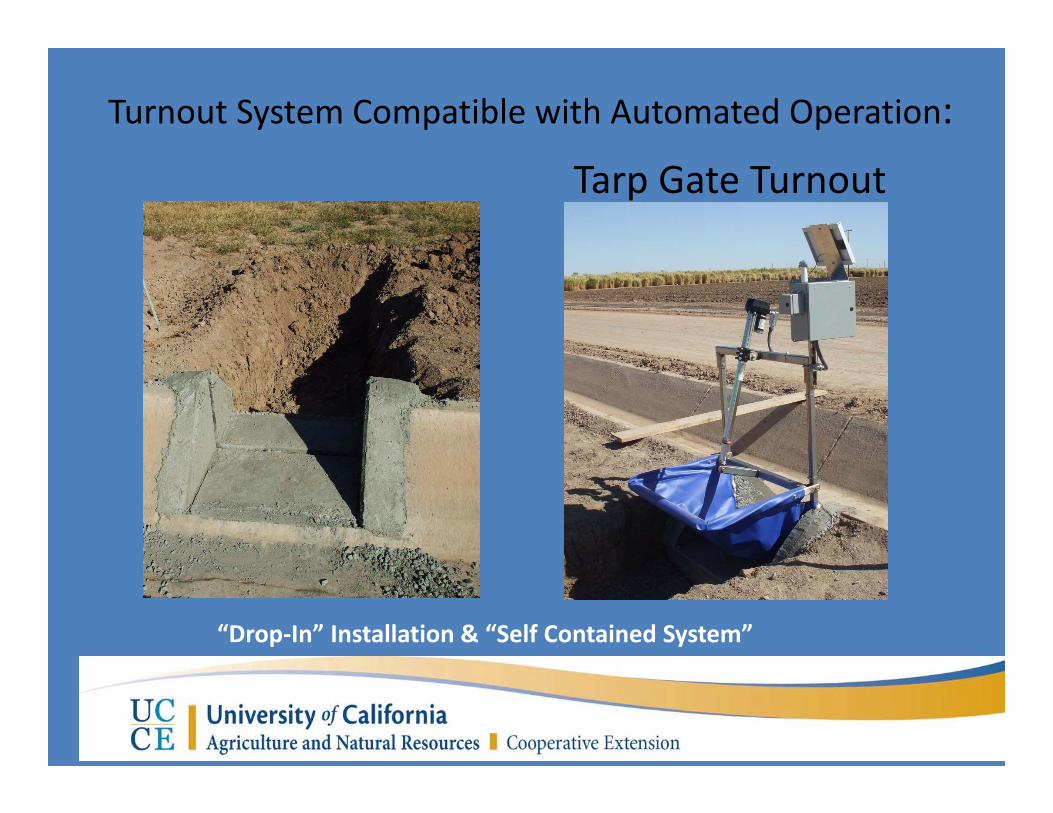
Turnout System Compatible with Automated Operation:
Tarp Gate Turnout
“Drop‐In” Installation & “Self Contained System”
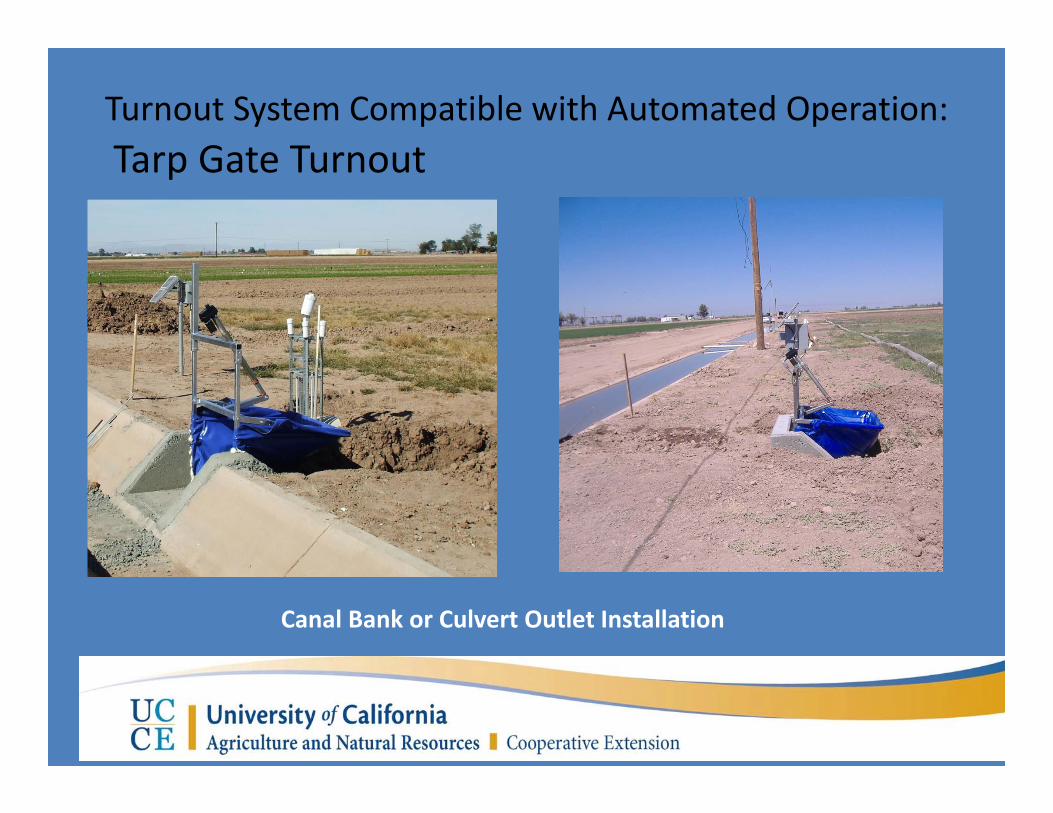
Turnout System Compatible with Automated Operation:Tarp Gate Turnout
Canal Bank or Culvert Outlet Installation
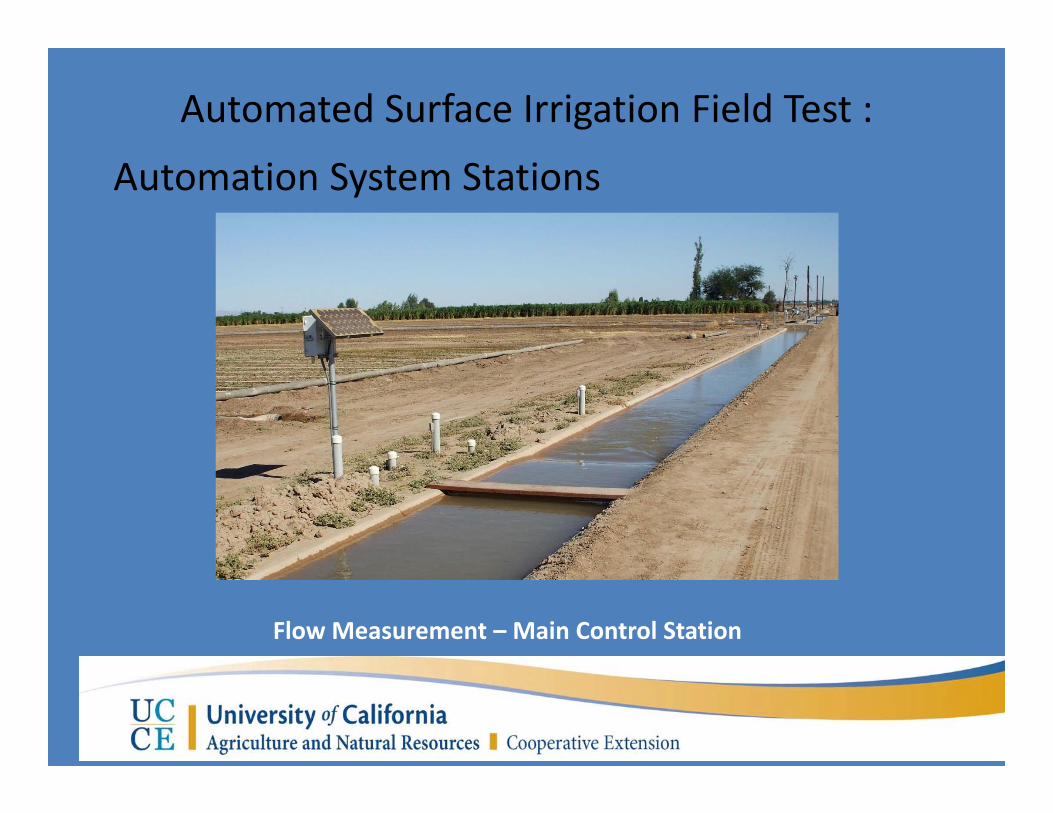
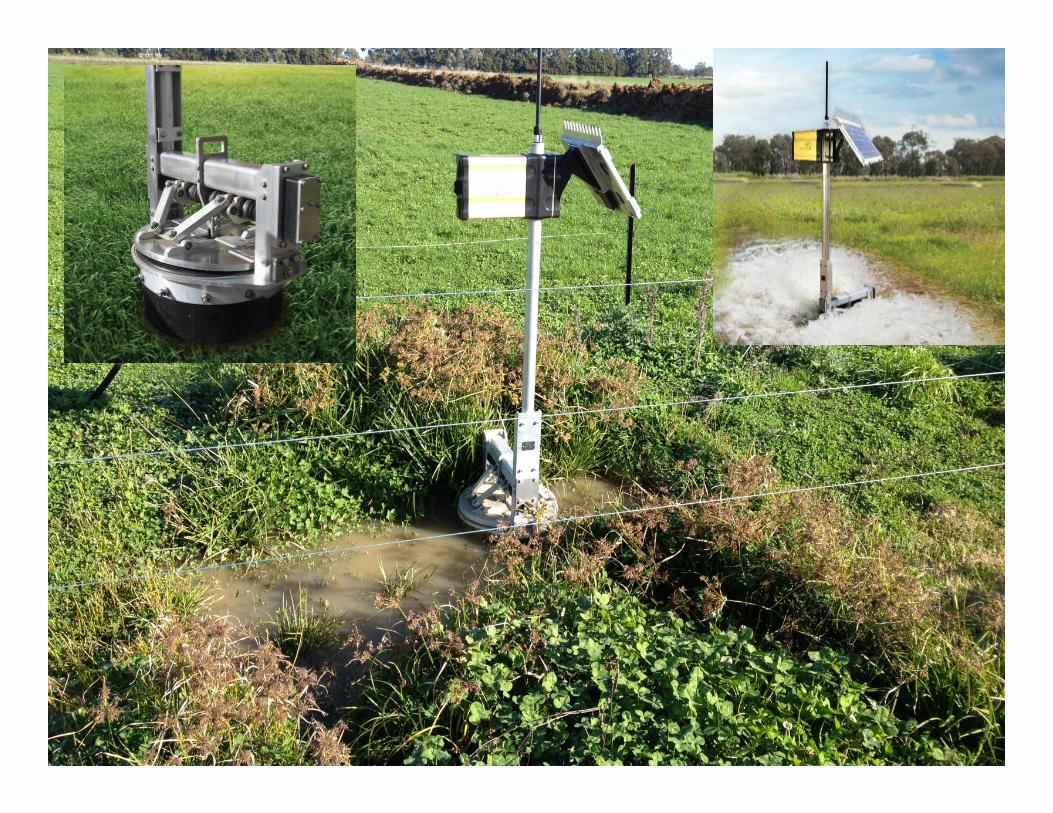
Automated Surface Irrigation Field Test :
Automation System Stations
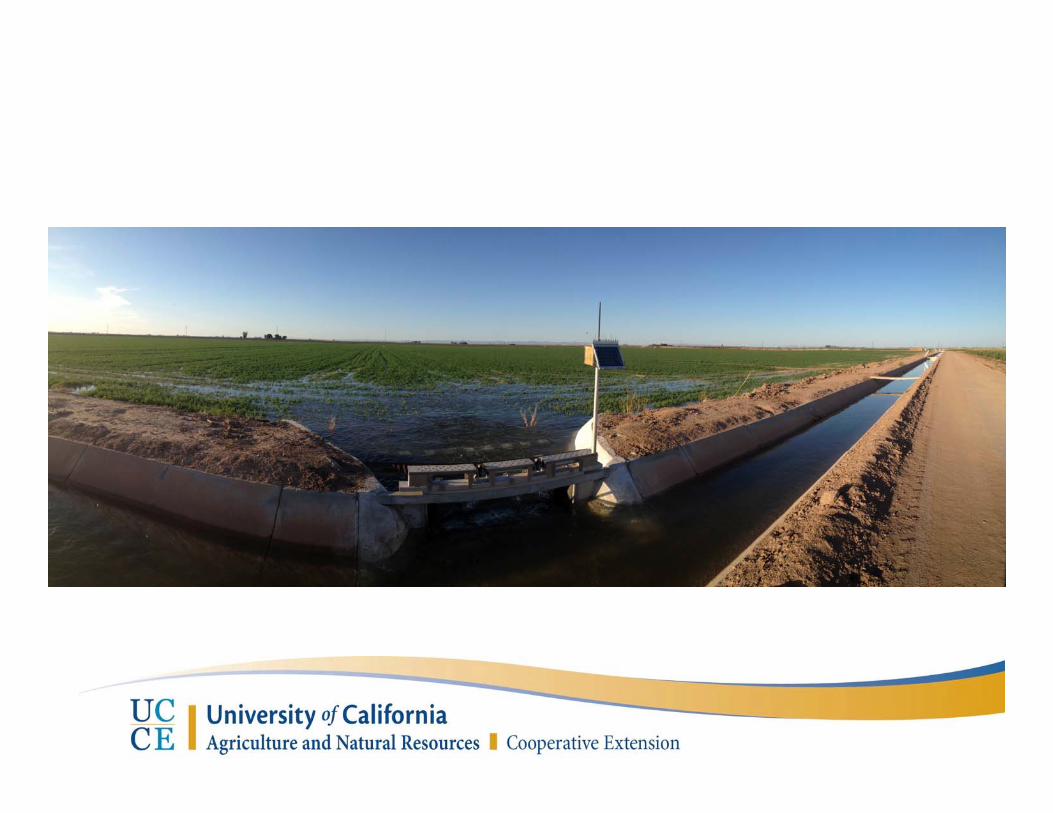
Flow Measurement – Main Control Station
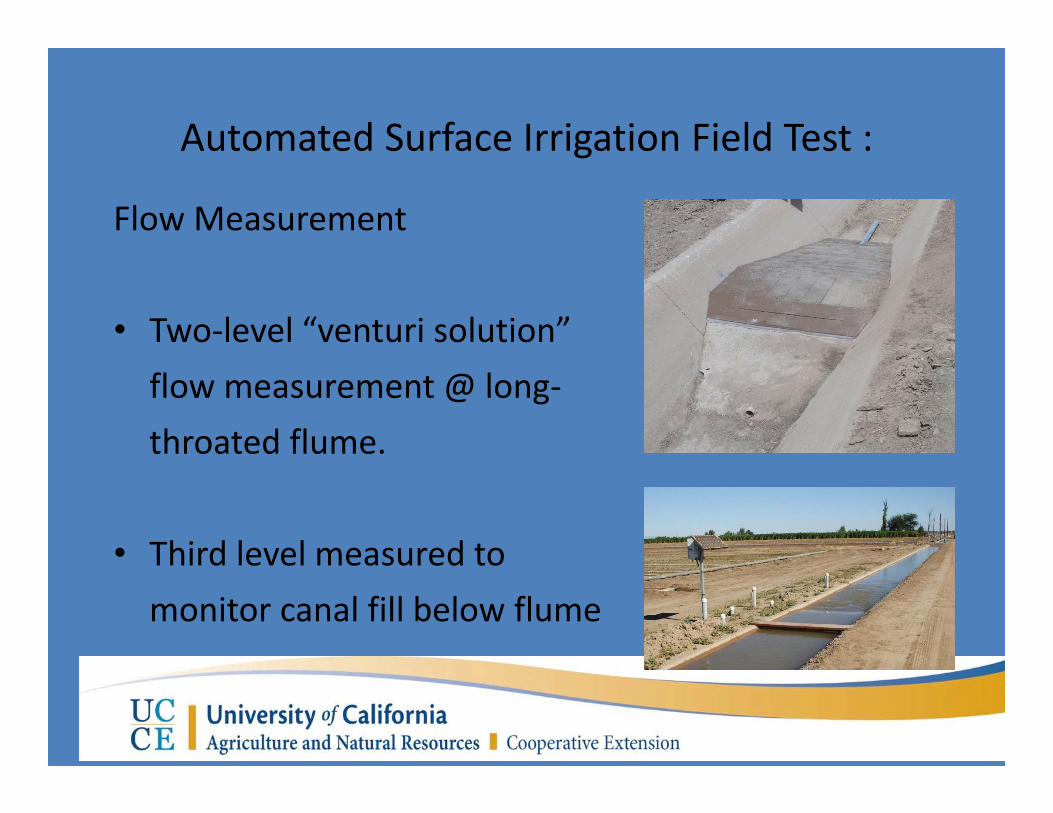
Automated Surface Irrigation Field Test :
Flow Measurement
• Two‐level “venturi solution” flow measurement @ long‐throated flume.
• Third level measured to monitor canal fill below flume
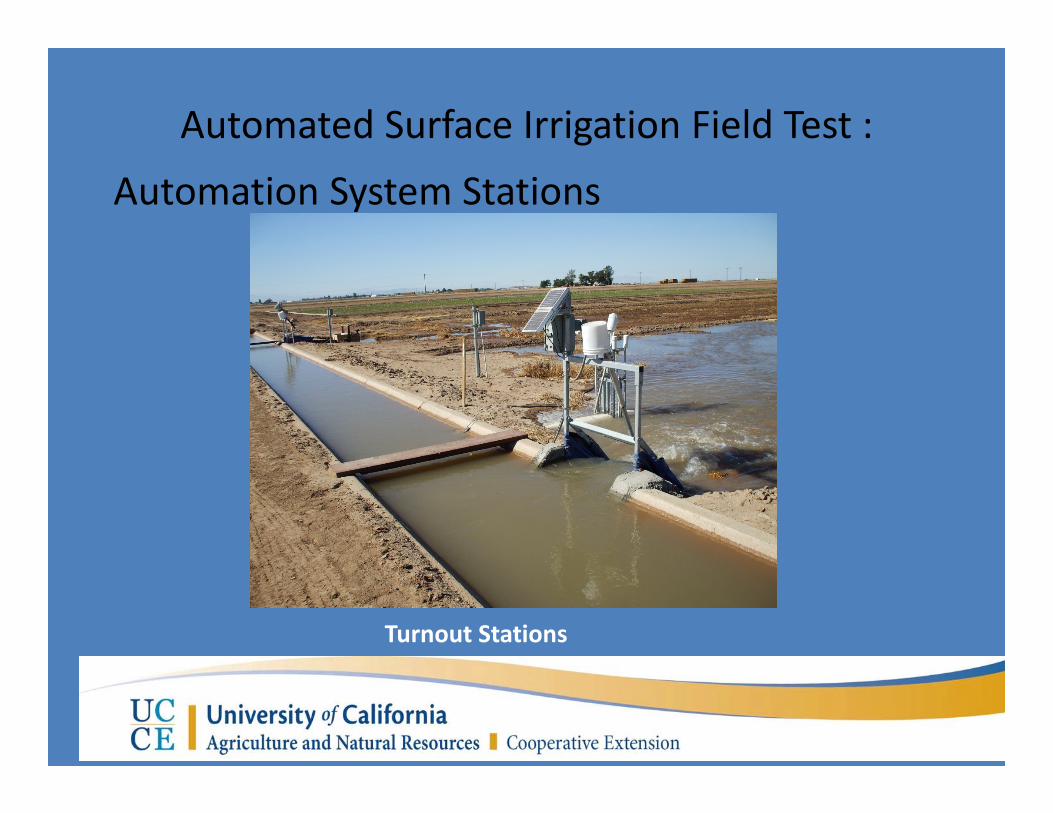
Automated Surface Irrigation Field Test :
Automation System Stations
Turnout Stations
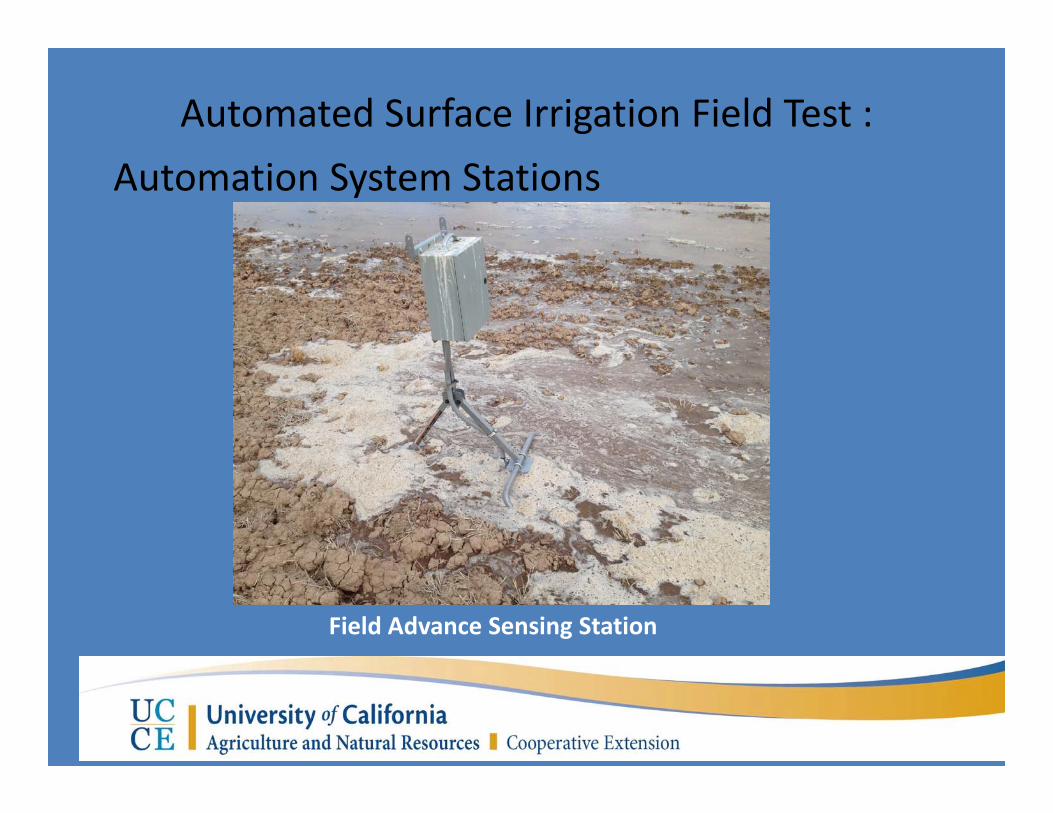
Automated Surface Irrigation Field Test :Automation System Stations
Field Advance Sensing Station
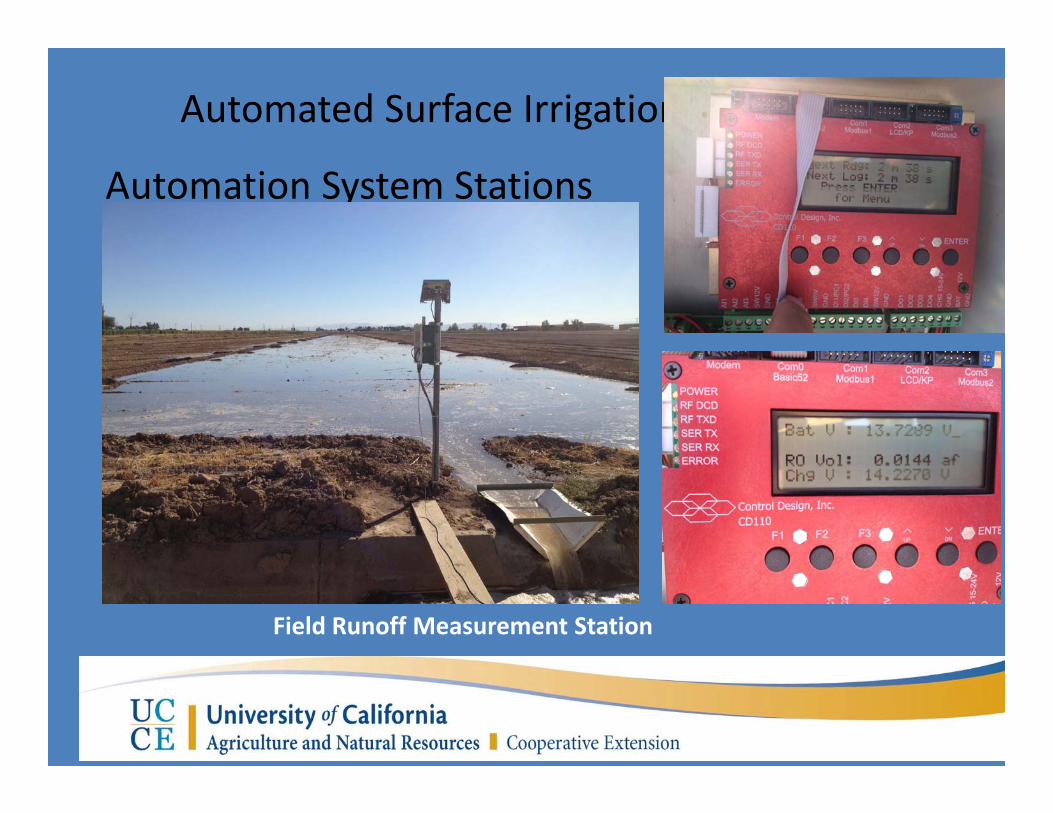
Automated Surface Irrigation Field Test :
Automation System Stations
Field Runoff Measurement Station

Automation Operating Cycle: Startup
Main Control (MC)
• MC placed in “Auto” Mode
• MC monitors canal fill• MC keeps “running
average” flow rate
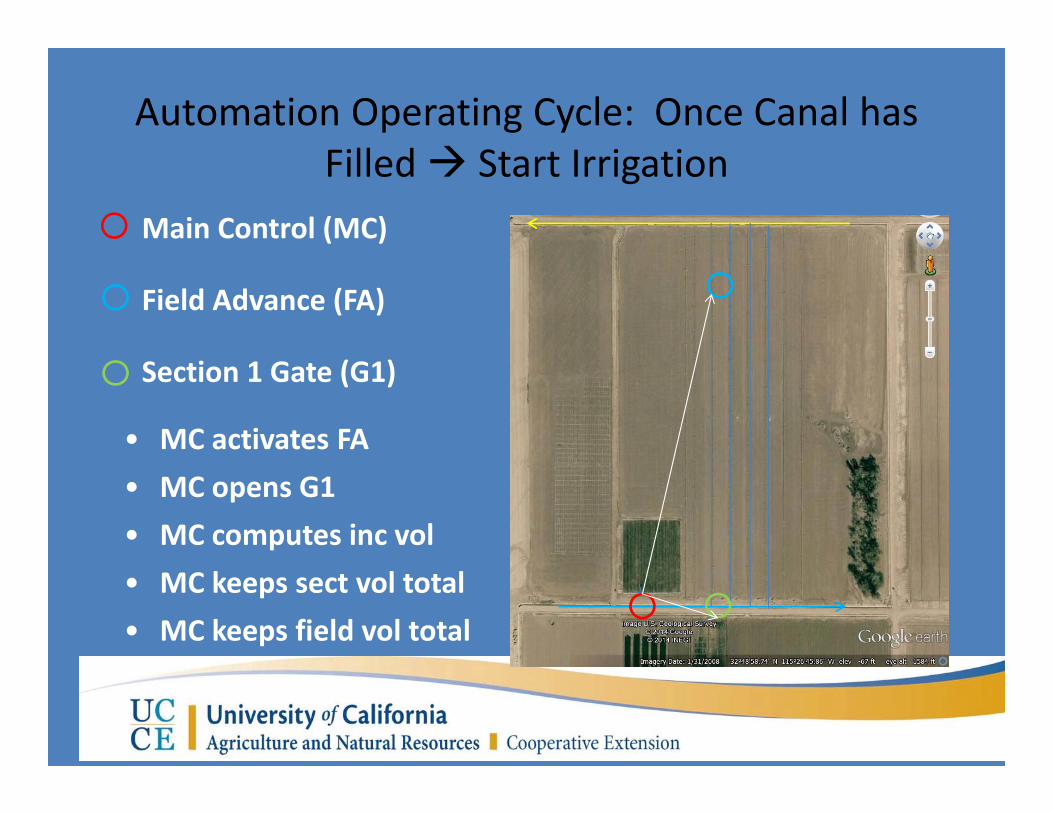
Automation Operating Cycle: Once Canal has Filled Start Irrigation
Main Control (MC)
Field Advance (FA)
Section 1 Gate (G1)
• MC activates FA• MC opens G1• MC computes inc vol• MC keeps sect vol total• MC keeps field vol total
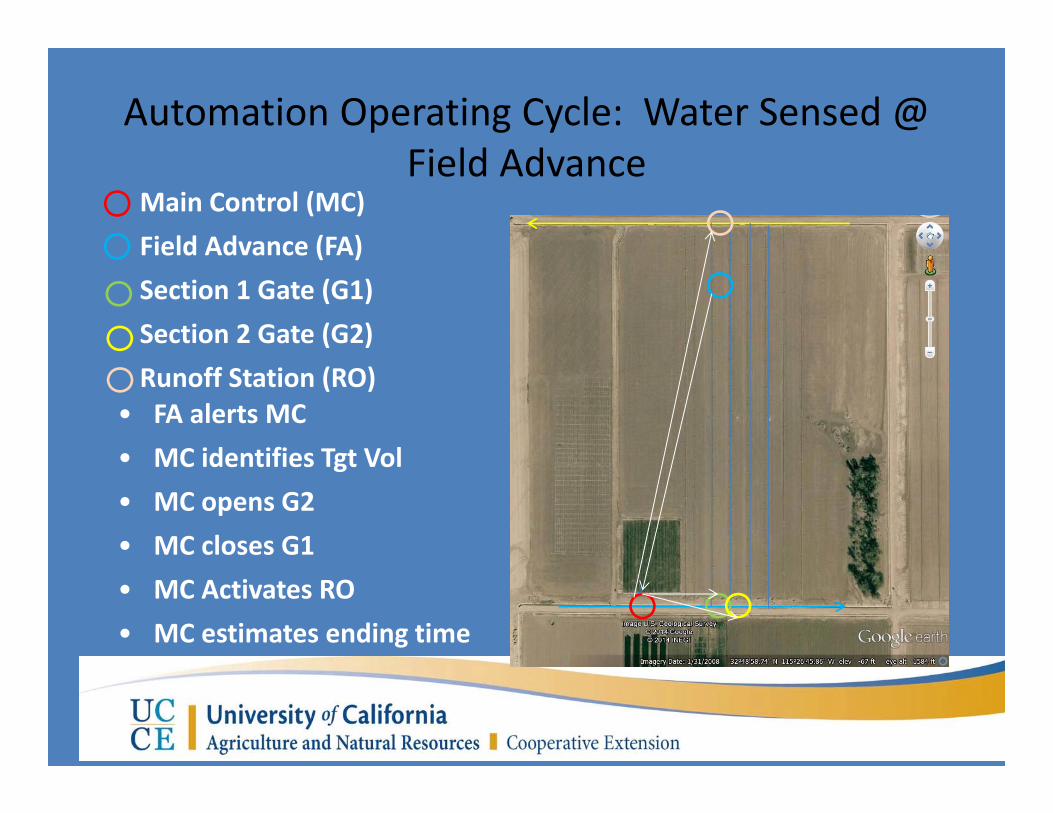
Automation Operating Cycle: Water Sensed @ Field Advance
Main Control (MC)Field Advance (FA)Section 1 Gate (G1)Section 2 Gate (G2)Runoff Station (RO)
• FA alerts MC• MC identifies Tgt Vol• MC opens G2• MC closes G1 • MC Activates RO• MC estimates ending time

Automation Operating Cycle: Section 1 Runoff Measurement Complete
Main Control (MC)Section 2 Gate (G2)Runoff Station (RO)
• RO reports RO Vol to MC• MC compares RO Vol & Tgt Vol• MC adjusts Tgt Vol if needed• MC estimates ending time
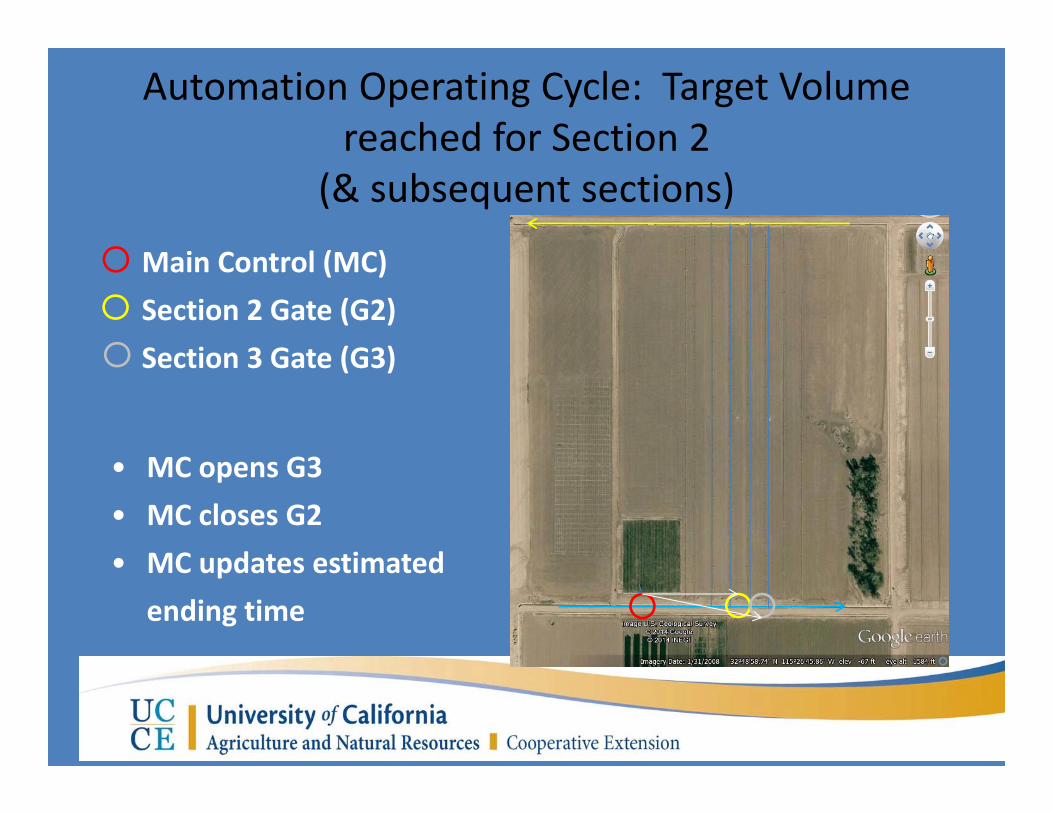
Automation Operating Cycle: Target Volume reached for Section 2
(& subsequent sections)
Main Control (MC)Section 2 Gate (G2)Section 3 Gate (G3)
• MC opens G3• MC closes G2• MC updates estimated
ending time

Automation Operating Cycle: End of Irrigation
Main Control (MC)Section n Gate (Gn)
• MC in alert mode• Activities for end of
irrigation expected to be “site specific”
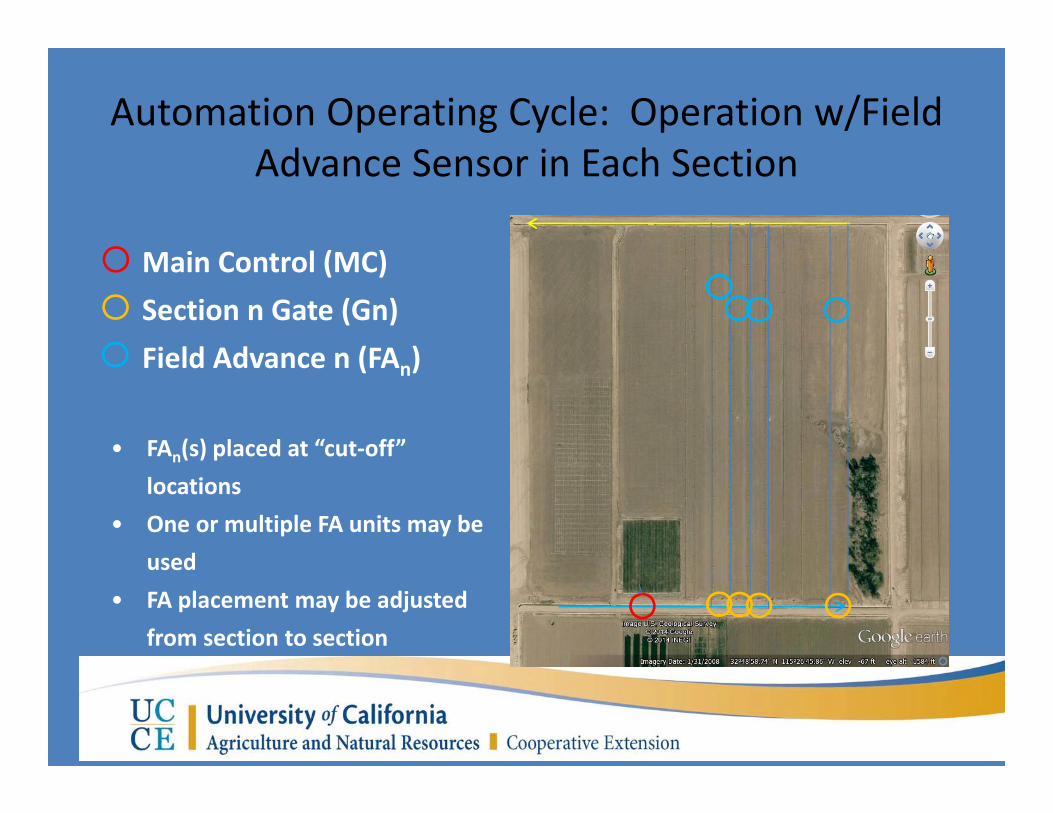
Automation Operating Cycle: Operation w/Field Advance Sensor in Each Section
Main Control (MC)Section n Gate (Gn)Field Advance n (FAn)
• FAn(s) placed at “cut‐off” locations
• One or multiple FA units may be used
• FA placement may be adjusted from section to section
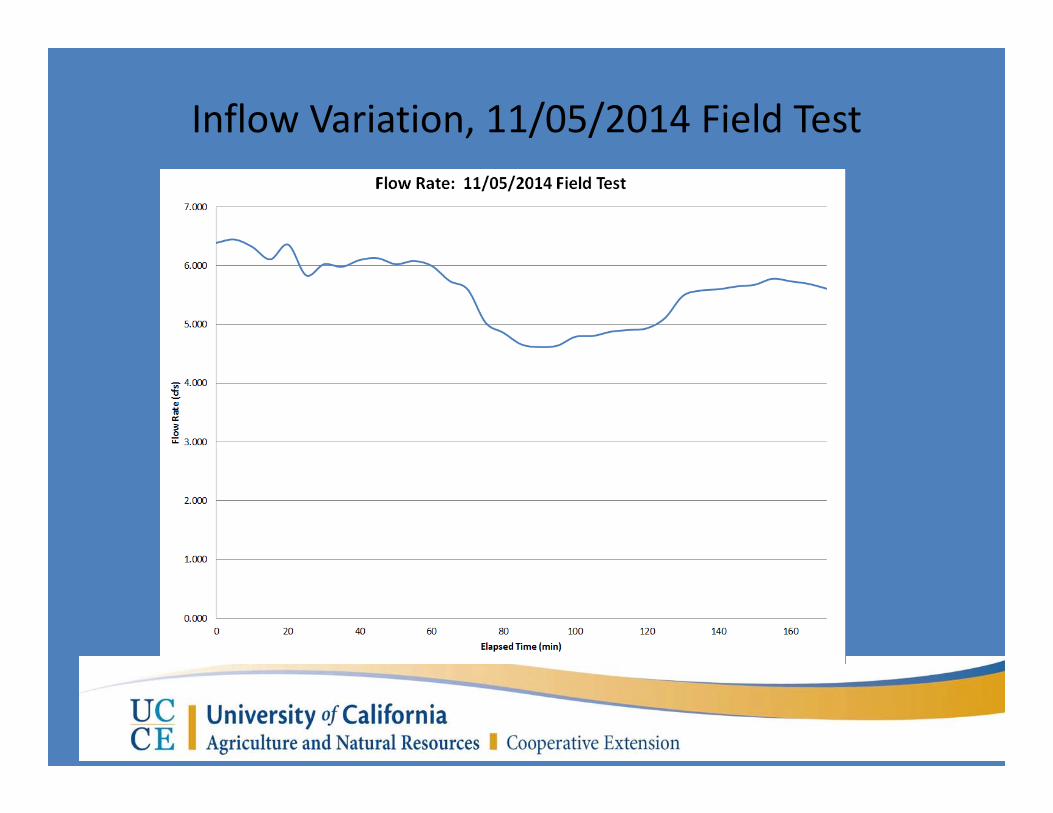
Inflow Variation, 11/05/2014 Field Test

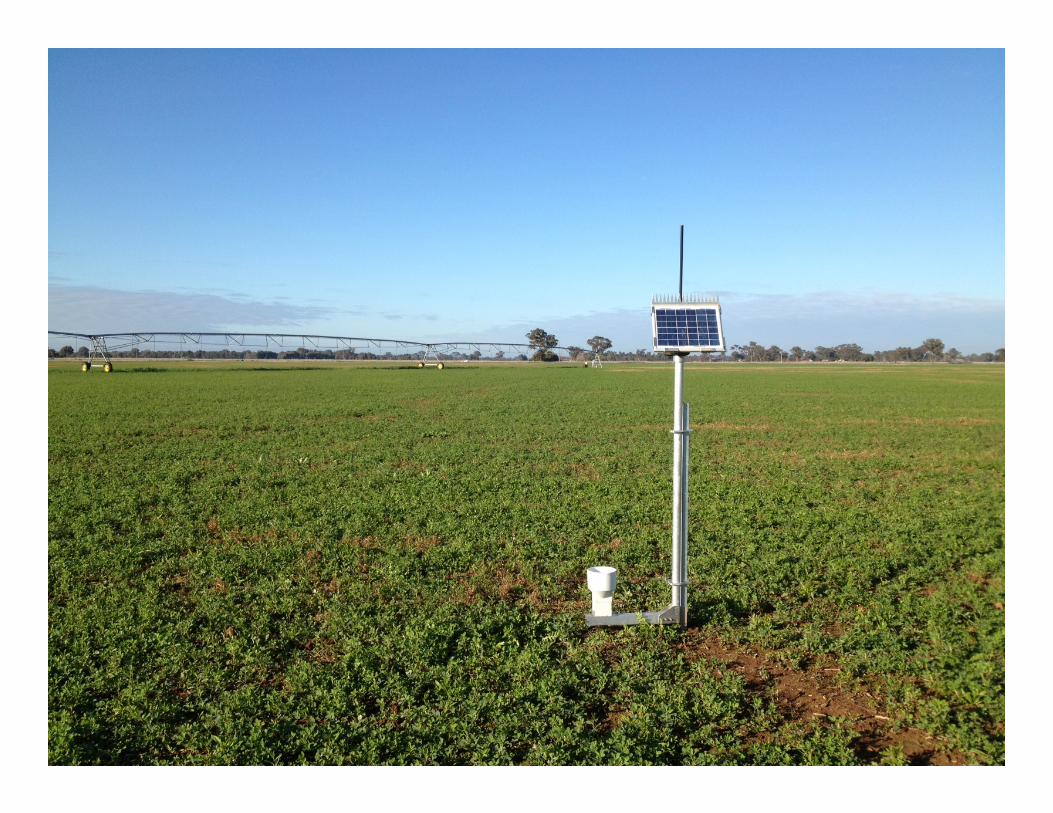
Automated Surface Irrigation Field TestAdditional system components:
Office Base Station

Automated Surface Irrigation Field TestAdditional system components:
Portable Station
Automated Surface Irrigation Field Test :
Current Project Status:
• Programming for basic functions has been developed and tested for each station type
• User menu functions of Main Control program are currently being refined
• Main Control programming for multiple field sensor option is being developed.

Summary and Desired Outcomes
• Water conservation (reducing runoff to less than 5% of applied water)
• Labor savings (one irrigator per 4 fields vs 1 irrigator per field)
• Value of conserved water (currently $285 per ac‐ft in IID service area)
• Drought and limited water supplies (deficit irrigate the lower end of the field)
Thank you


