
University of East London Institutional Repository: http://roar.uel.ac.uk This paper is made available online in accordance with publisher policies. Please scroll down to view the document itself. Please refer to the repository record for this item and our policy information available from the repository home page for further information. To see the final version of this paper please visit the publisher’s website. Access to the published version may require a subscription. Author(s): Edmonds, Caroline J ; Isaacs, Elizabeth B; Visscher, Peter M; Rogers, Mary; Lanigan, Julie; Singhal, Atul; Lucas, Alan; Gringras, Paul; Denton, Jane; Deary, Ian J. Article title: Inspection Time and cognitive abilities in twins aged 7 to 17 years: development, heritability and genetic covariance Year of publication: 2008 Citation: Edmonds, C.J. et al (2008) ‘Inspection Time and cognitive abilities in twins aged 7 to 17 years: development, heritability and genetic covariance’. Intelligence, 36 (3) 210-225. Link to published version: http://dx.doi.org/10.1016/j.intell.2007.05.004 DOI: 10.1016/j.intell.2007.05.004

Inspection time and cognitive abilities
1
Inspection Time and cognitive abilities in twins aged 7 to 17 years: age-related changes,
heritability and genetic covariance
Caroline J. Edmonds, *Elizabeth B. Isaacs, Mary Rogers, Julie Lanigan, Atul Singhal, Alan
Lucas
MRC Childhood Nutrition Research Centre, Institute of Child Health, UCL, 30 Guilford
Street, London, WC1N 1EH, UK
Paul Gringras, Jane Denton
The Multiple Births Foundation, Queen Charlotte's & Chelsea, Du Cane Road, London, W12
0HS, UK
Peter M. Visscher
Institute of Evolutionary Biology, School of Biological Sciences, Ashworth Laboratories,
University of Edinburgh, EH9 3JF, Edinburgh, UK
Ian J. Deary
Department of Psychology, University of Edinburgh, 7 George Square, Edinburgh, EH8 9JZ,
UK
* Corresponding author Tel.: + 44 20 7905 2246; Fax: + 44 20 7831 9903; E-mail address:
Running Head - Inspection time and cognitive abilities
Inspection time and cognitive abilities
2
Abstract
We studied the age-related differences in inspection time and multiple cognitive domains in a
group of monozygotic (MZ) and dizygotic (DZ) twins aged 7 to 17 years. Data from 111 twin
pairs and 19 singleton siblings were included. We found clear age-related trends towards more
efficient visual information processing in older participants. There were substantial
correlations between inspection time and cognitive abilities. The heritability of inspection time
was 45%, and ranged from 73% to 85% for cognitive abilities. There were significant non-
shared environmental effects on inspection time and Wechsler IQ scores, but no shared
environmental effects. The genetic correlation between inspection time and Performance IQ
was .55 and with Verbal IQ it was .28. There was a significant non-shared environmental
correlation of .24 between inspection time and Verbal IQ.
Inspection time and cognitive abilities
3
Inspection Time and cognitive abilities in twins aged 7 to 17 years: age-related changes,
heritability and genetic covariance
There has been a great deal of interest in inspection time as a psychological construct
that correlates with general cognitive ability and might provide a partial foundation for
individual differences in psychometric intelligence (Deary, 2000, chapter 7). This paper
reports a cross-sectional study conducted on twins that assessed inspection time and
psychometric tests of several cognitive abilities in children between the ages of 7 to 17 years.
The twin design was used to examine the heritability of inspection time and cognitive abilities
in childhood and adolescence. We examine the extent to which the association between
inspection time and cognitive ability is associated with genetic or environmental factors by
employing genetic covariance techniques.
Inspection Time as an Index of Processing Speed
The modelling and measurement of inspection time were developed in the 1970s
(Vickers, 1970, 1979; Vickers, Nettelbeck & Wilson, 1972), from a theory of visual perception
that assumes that information is acquired in small quanta from the environment. Each quantum
is defined as an ‘inspection’, the characteristic stimulus duration needed by an individual in
order to make a decision to a criterion level of accuracy (Vickers, 1970). An individual’s
inspection time is the stimulus exposure time necessary for accurate perception, and is
considered by many to be an index of the central nervous system’s speed of intake of
information or speed of processing (Burns & Nettelbeck, 2003; Deary & Stough, 1996;
Kranzler & Jensen, 1989; Nettelbeck, 1987; Nettelbeck & Wilson, 2004), although the precise
nature of what inspection time measures is not fully understood (Deary, 2000, chapter 7).
Inspection time and cognitive abilities
4
Inspection times are significantly correlated with psychometric intelligence as measured by
IQ-type tests; people with higher psychometric intelligence can make accurate perceptual
judgements on the basis of shorter stimulus durations (Brand, 1981, 1984; Brand & Deary,
1982; Deary, 1993; Deary, Caryl, Egan & Wight, 1989; Grudnik & Kranzler, 2001; Kranzler
& Jensen, 1989; Nettelbeck & Lally, 1976). Inspection times shorten over childhood,
indicating more efficient information processing (Nettelbeck & Lally, 1979; Nettelbeck &
Wilson, 1985, 2004). Furthermore, inspection times are substantially heritable (Luciano,
Smith, Wright, Geffen, Geffen, & Martin, 2001; Posthuma, de Geus & Boomsma, 2001).
Visual inspection time measurement is usually undertaken as a two-alternative forced
choice perceptual decision making task conducted under tachistoscopic presentation conditions
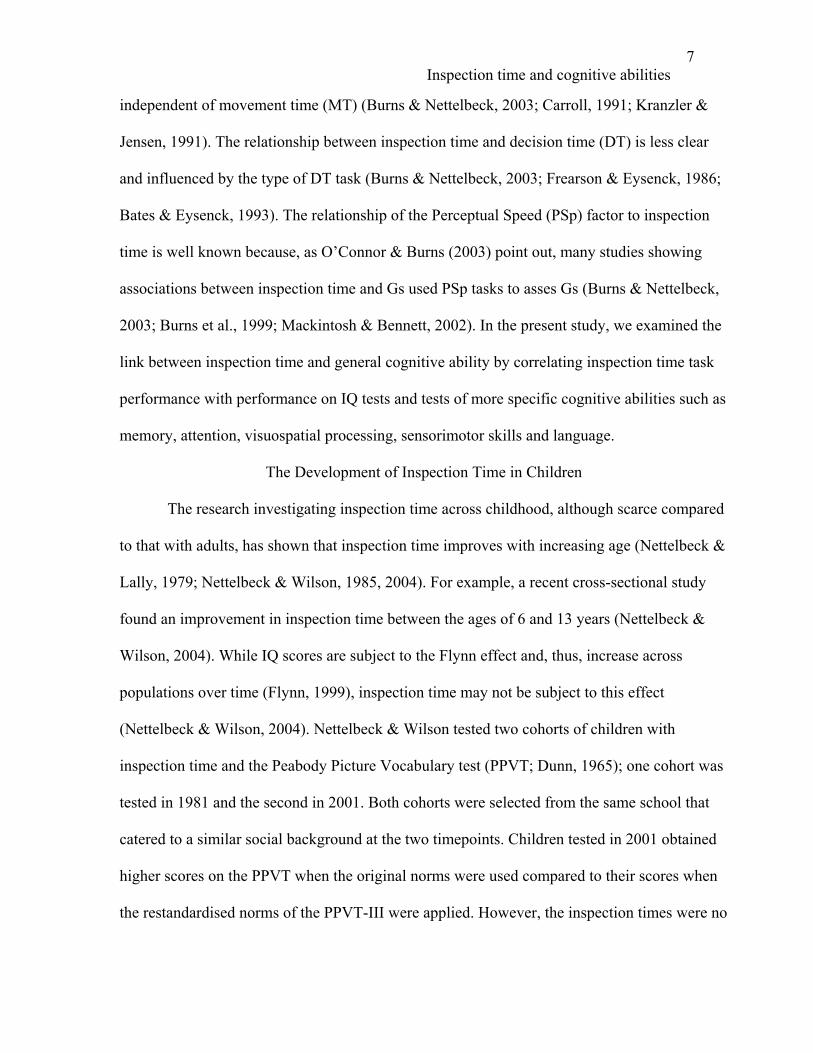
with backward masking; Figure 1 shows an example of an inspection time stimulus. Typically,
the task requires participants to make decisions on multiple trials about which one of two legs
of an inverted u-shaped figure is longer. These stimuli are presented for a range of durations,
from hundreds of milliseconds to very short durations in the range of several milliseconds. The
inspection time describes the minimum stimulus exposure necessary for an accurate decision
to be made about the stimulus’s leg length. Each stimulus is followed by a backward pattern
mask in order to control the effective processing duration of the stimuli. Participants need not
make rapid responses to the stimulus since only the correctness of the response is noted; thus,
inspection time tasks do not assess speed of reactions.
Insert Figure 1 about here
Inspection Time and Cognitive Abilities
The correlation in adults between inspection time and psychometric tests of cognitive
abilities is well established. A meta-analysis that combined the results of 50 studies,
Inspection time and cognitive abilities
5
comprising 2356 participants, found a corrected correlation coefficient between IQ and visual
inspection time of -.49 (corrected correlation coefficients are adjusted for sampling error,
measurement error and/or sample differences in variance; uncorrected r = -.32; Grudnik &
Kranzler, 2001).
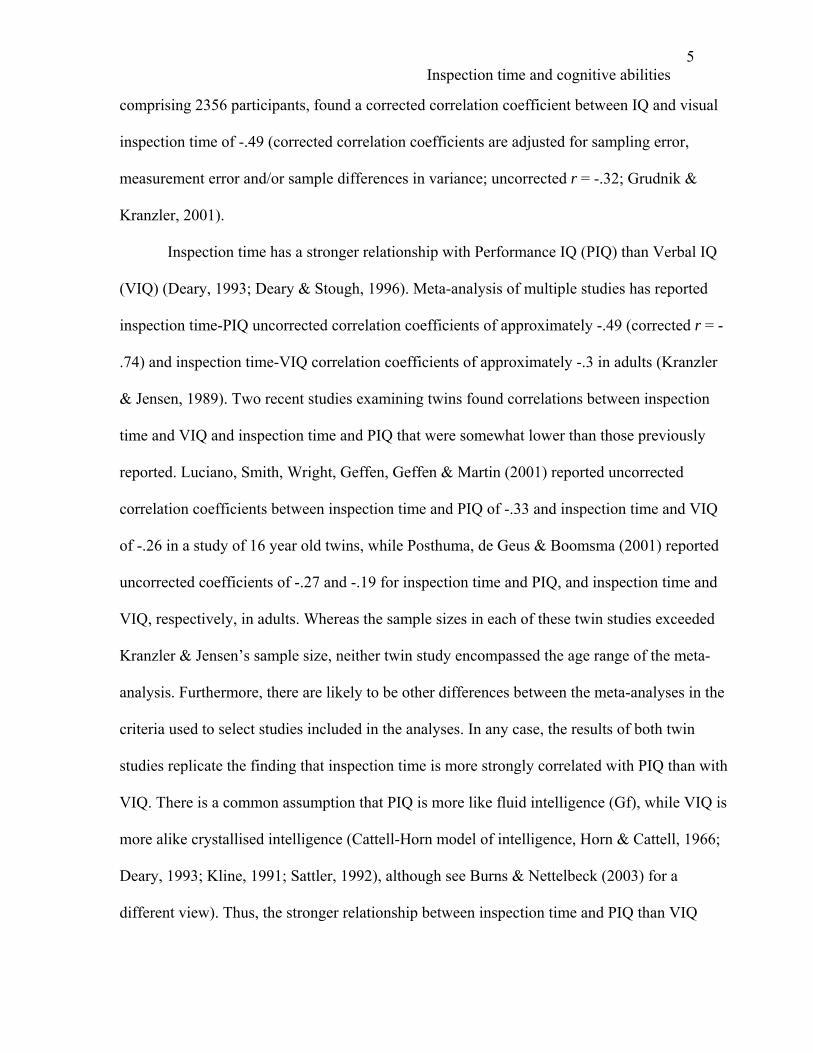
Inspection time has a stronger relationship with Performance IQ (PIQ) than Verbal IQ
(VIQ) (Deary, 1993; Deary & Stough, 1996). Meta-analysis of multiple studies has reported
inspection time-PIQ uncorrected correlation coefficients of approximately -.49 (corrected r = -
.74) and inspection time-VIQ correlation coefficients of approximately -.3 in adults (Kranzler
& Jensen, 1989). Two recent studies examining twins found correlations between inspection
time and VIQ and inspection time and PIQ that were somewhat lower than those previously
reported. Luciano, Smith, Wright, Geffen, Geffen & Martin (2001) reported uncorrected
correlation coefficients between inspection time and PIQ of -.33 and inspection time and VIQ
of -.26 in a study of 16 year old twins, while Posthuma, de Geus & Boomsma (2001) reported
uncorrected coefficients of -.27 and -.19 for inspection time and PIQ, and inspection time and
VIQ, respectively, in adults. Whereas the sample sizes in each of these twin studies exceeded
Kranzler & Jensen’s sample size, neither twin study encompassed the age range of the meta-
analysis. Furthermore, there are likely to be other differences between the meta-analyses in the
criteria used to select studies included in the analyses. In any case, the results of both twin
studies replicate the finding that inspection time is more strongly correlated with PIQ than with
VIQ. There is a common assumption that PIQ is more like fluid intelligence (Gf), while VIQ is
more alike crystallised intelligence (Cattell-Horn model of intelligence, Horn & Cattell, 1966;
Deary, 1993; Kline, 1991; Sattler, 1992), although see Burns & Nettelbeck (2003) for a
different view). Thus, the stronger relationship between inspection time and PIQ than VIQ

Inspection time and cognitive abilities
6
may reflect an association with fluid intelligence, rather than crystallised intelligence, although
this has recently been questioned (e.g. Burns & Nettelbeck, 2003; Nettelbeck, 2001).
Many have argued that the relationship between inspection time and IQ is causal, with
individual differences in inspection time causing individual differences in IQ (Anderson, 1992;
Brand, 1981, 1984; Brand & Deary, 1982; Neubauer, 1997). Speed of processing has been
argued to be the mechanism underlying this causal relationship (Anderson, 1992; Neubauer,
1997). However, others have suggested that a short inspection time is a consequence of being
clever. The mechanisms proposed to underlie the suggested IQinspection time relationship
include better macrolevel processing in more intelligent individuals (Ceci, 1990) and higher
motivation (Mackintosh, 1986) or less anxiety (Irwin, 1984) in cleverer participants during
inspection time task performance. A longitudinal study with a cross-lagged design, and
subjected to structural equation modelling, used an auditory analogue of the inspection time
procedure and IQ scores collected when children were aged 11- and then 13-years of age. It
found that inspection time at age 11 predicted later IQ, but not the reverse, thus lending
support to the argument that individual differences in inspection time cause individual
differences in IQ (Deary, 1995).
Recent research has suggested that inspection time correlates more specifically with
general speed of processing (Gs), rather than fluid ability (Gf) or general visualisation ability
(Gv) (e.g. Burns, Nettelbeck and Cooper, 1999; Burns & Nettelbeck, 2003). An analysis of
processes involved in Gs has suggested four factors: test-taking speed or visualization speed,
perceptual speed, decision time and movement time (O’Connor & Burns, 2003; Stankov &
Roberts, 1997; Roberts & Stankov, 1999). So where does inspection time fit with this more
detailed analysis of processing speed? Inspection time has consistently been found to be
Inspection time and cognitive abilities
7
independent of movement time (MT) (Burns & Nettelbeck, 2003; Carroll, 1991; Kranzler &
Jensen, 1991). The relationship between inspection time and decision time (DT) is less clear
and influenced by the type of DT task (Burns & Nettelbeck, 2003; Frearson & Eysenck, 1986;
Bates & Eysenck, 1993). The relationship of the Perceptual Speed (PSp) factor to inspection
time is well known because, as O’Connor & Burns (2003) point out, many studies showing
associations between inspection time and Gs used PSp tasks to asses Gs (Burns & Nettelbeck,
2003; Burns et al., 1999; Mackintosh & Bennett, 2002). In the present study, we examined the
link between inspection time and general cognitive ability by correlating inspection time task
performance with performance on IQ tests and tests of more specific cognitive abilities such as
memory, attention, visuospatial processing, sensorimotor skills and language.
The Development of Inspection Time in Children
The research investigating inspection time across childhood, although scarce compared
to that with adults, has shown that inspection time improves with increasing age (Nettelbeck &
Lally, 1979; Nettelbeck & Wilson, 1985, 2004). For example, a recent cross-sectional study
found an improvement in inspection time between the ages of 6 and 13 years (Nettelbeck &
Wilson, 2004). While IQ scores are subject to the Flynn effect and, thus, increase across
populations over time (Flynn, 1999), inspection time may not be subject to this effect
(Nettelbeck & Wilson, 2004). Nettelbeck & Wilson tested two cohorts of children with
inspection time and the Peabody Picture Vocabulary test (PPVT; Dunn, 1965); one cohort was
tested in 1981 and the second in 2001. Both cohorts were selected from the same school that
catered to a similar social background at the two timepoints. Children tested in 2001 obtained
higher scores on the PPVT when the original norms were used compared to their scores when
the restandardised norms of the PPVT-III were applied. However, the inspection times were no
Inspection time and cognitive abilities
8
different in the two cohorts. This suggests that inspection time may be stable across
generations and may not be subject to the same cohort effects as IQ. Thus, age related
improvements in inspection time in a cross-sectional study design are unlikely to be
contaminated by the Flynn effect.
While measured inspection time has been shown to improve over childhood, not
everyone agrees that this results from developmental increases in speed of processing.
Anderson (1986, 1992, 2001) has argued that speed of processing remains constant from
childhood to adulthood. He initially suggested that younger children performed poorly relative
to their older peers because they were more affected by task demands, and that reducing the
load on attention and/or motivation may improve the performance of younger children
(Anderson, 1986, 1992). However, counter to this argument, allowing extensive practice has
been shown to reduce, but not remove, developmental trends in inspection time (Nettelbeck &
Vita, 1992), suggesting a resilient age-related improvement in inspection time. On the other
hand, a longitudinal study found that just one exposure to an inspection time task resulted in an
improvement in inspection time scores one year later that was greater than the effect of one
year’s ageing (Anderson, Reid & Nelson, 2001), leading Anderson to conclude that strategic
advances, rather than ageing, underlie the observed developmental trend. More recently,
Anderson proposed that it is changes in “response selection processes that contribute to
speeded performance on many reaction time tasks” (Anderson, 2001, p.293) that underlie
developmental decreases in inspection time. These processes include executive functions, in
which there are well documented developmental improvements (Korkman, Kirk & Kemp,
1998). Here, we examine age-related changes in inspection time from the age of 7 to 17 years.

Inspection time and cognitive abilities
9
Speed of Processing: Development and Heritability
There are biological reasons why speed of processing might be expected to improve
with age. Certain developmental changes that occur in the brain across the period of childhood
and adolescence might be expected to lead to an increase in speed of processing (e.g.
Courchesne et al., 2000; Giedd et al., 1999; Miller, 1994). Myelination starts in the prenatal
period and continues up until about the age of 20 (for a discussion see Pujol et al., 2004) and
one effect of this is to increase the speed with which information can pass along myelinated
processes (Miller, 1994). Kail (2000) argues that age-related changes in the proposed domain-
general processing system underlying reaction time improvements with age are, in part, due to
underlying biological factors, such as myelination and changes in the number of synaptic
connections, both of which change over childhood and adolescence. These mechanisms may
operate across the life span; for instance, cognitive ageing involves slowing of processing
speed (Salthouse, 1996), which is associated with decreases in myelination at the upper end of
the age continuum (Bartzokis, 2004).
The question of whether there is a biological contribution to inspection time can be
further addressed by using a twin design and examining the genetic contribution to inspection
time. To date, there have been only two studies examining inspection time and IQ using a twin
design: one considering the performance of 16-year-old children (Luciano et al., 2001), and a
second that assessed both younger (mean age 26 years) and older (mean age 50 years) adult
cohorts (Posthuma et al., 2001). There have been no studies so far examining the genetic
contribution to inspection time in children under the age of 16. Estimates of heritability of
inspection time can be obtained from the data reported in these papers by doubling the
difference between the MZ and DZ intraclass correlations and expressing this as a percentage

Inspection time and cognitive abilities
10
(by multiplying the outcome by 100). Using this approach, estimates of heritability of
inspection time are obtained of between 26% (Luciano et al., 2001) and 56% (Posthuma et al.,
2001).
Genetic covariance can take the study of the biological contributions to the inspection
time-cognitive ability association even further than examining heritability. It can address the
extent to which the correlation between inspection time and cognitive abilities is caused by
genetic and environmental (shared and non-shared) factors. The shared environmental factor
describes non-genetic, environmental factors that are responsible for differences between
rearing families, whereas the non-shared environmental factor describes environmental
influences that are not shared by members of the same rearing family. Both Luciano et al.
(2001) and Posthuma et al. (2001) found that the model that best suited the data included an
additive genetic factor and a non-shared environmental factor and excluded a factor that
explained variance due to shared environmental influences. A further common finding was that
a greater proportion of the variance in inspection time was explained by the unique
environment factor (54% Posthuma et al.; 64% Luciano et al.), than the genetic factor (46%
Posthuma et al.; 36% Luciano et al.). When considering the genetic correlations between
inspection time and IQ, both papers found stronger genetic correlations between inspection
time and PIQ than between inspection time and VIQ. In the case of Posthuma et al., the genetic
correlation between inspection time and PIQ was .47, while it was .31 between inspection time
and VIQ. Thus, 22% of the genetic variance in PIQ was explained by factors shared with
inspection time, while 10% of the genetic variance was shared between inspection time and
VIQ. In the case of Luciano et al., the genetic correlations between inspection time and PIQ
and inspection time and VIQ were -.65 and -.47 respectively (the sign of the correlation

Inspection time and cognitive abilities
11
coefficients in these two studies differs because of the methods used to calculate inspection
time; in the case of Luciano et al, faster inspection times resulted in lower scores, while faster
inspection times were associated with higher scores in the case of Posthuma et al). These
correspond to 42% of genetic variance shared between inspection time and PIQ, and 22%
shared between inspection time and VIQ.
Present Study
In the present study, we tested twin pairs and singletons aged from 7 to 17 years and
obtained measures of inspection time, cognitive abilities using standardised IQ-type tests, and
measures of neuropsychological functioning. Data were available from 240 children in total.
Thus, the present sample of children provided data to allow us to assess inspection time
changes across childhood and to consider the question of whether the inspection time-IQ
relationships observed in adulthood are present in childhood. The present study also provides
the first twin study examining the heritability of inspection time in children and the first child
study of the genetic and environmental correlations between inspection time and IQ.
Method
Participants
Same sex twin pairs were recruited from a database of children who have been
followed by the Multiple Births Foundation (MBF). The MBF is a charity that supports
families with multiple births and also provides information to professionals. The majority of
children registered with the MBF were either born at Queen Charlotte’s and Chelsea hospital
or attended a clinic there. Families with children of the appropriate age were contacted and
invited to take part. Singleton siblings of twins in the sample were also recruited in order to
increase the sample size in the behavioural analyses. Two hundred and forty one children took

Inspection time and cognitive abilities
12
part in the cognitive testing that included inspection time; not all children completed all other
tests.
There were 111 twin pairs and 19 singleton siblings (9 male; 10 female). Of the twins,
67 pairs were monozygotic (40 male; 27 female) and 44 pairs were dizygotic (27 male; 17
female). Zygosity was initially determined by ABO and Rh blood groups and, in twins with
identical blood groups, by twelve independent polymorphic DNA markers. One child was
excluded from the analyses because she was diagnosed with Attention Deficit Hyperactivity
Disorder, thus compromising testing (MZ twin aged 8 years 7 months); removing this child
reduced the sample to 240 children. In analyses that involved cross-twin comparisons, both
members of this twin pair were excluded. Otherwise, data from the non-affected twin were
included.
Twins were aged between 7 years 11 months and 17 years 3 months at the time of
assessment (mean age at test 11 years 5 months; SD: 26 months). Singleton siblings were aged
between 7 years 7 months and 16 years 7 months (mean: 12 years 6 months; SD: 33 months).
Written informed consent was obtained from parents or guardians and assent from children,
prior to testing. The study was approved by the local ethics committee.
A group of 10 twin pairs (8 MZ; 2 DZ) and 4 siblings were assessed during a week of
intensive testing (intensive week protocol). Due to time constraints, these children were not
administered the NEPSY standardised neuropsychological battery.
In addition, occasional subtests were omitted from the testing protocol for individual
participants, for example, as a result of time limitations; the group size is stated in the
appropriate tables.

Inspection time and cognitive abilities
13
Materials
The following series of psychometric assessments was administered.
Inspection time.
Inspection time was presented on a Compaq 300 Pentium III computer with an Iiyama
VisionMaster Pro 410 screen running at a vertical refresh rate of 160 Hz. The task is the same
as that described in Deary et al., (2004), but with a longer practice session. The cue, stimuli
and mask are presented in Figure 1. The “+” shaped cue measured 4 mm by 4 mm. The
stimulus was an inverted u-shape that was 25 mm across the top, 50 mm on the long leg and 25
mm on the short leg. The mask was a similar shape, but larger than the stimulus, and included
an irregular array of vertical lines in order to cover the long and short stimulus lines
completely. The mask was 25 mm across the top, both legs were 55 mm long and each leg was
14 mm wide at the widest point.
Each test trial began with the cue, presented for 500 ms. After an interval of 800
ms the inspection time figure appeared; 15 durations were used: 6, 12, 19, 25, 31, 37, 44,
50, 62, 75, 87, 100, 125, 150 and 200 ms. There were 10 trials at each duration and these
were randomised over all trial presentations. Immediately after the stimulus offset, the
mask was presented for 500 ms. After the mask, a “respond” command appeared at the
bottom of the screen and participants pressed one of two keys to indicate the location of
the longer leg; the right and left response keys indicated that the longer line was on the
right and the left, respectively. Accuracy of responding, rather than speed, was
emphasised. The “respond” command remained on screen until the child responded, or
for 10 s, and no child failed to respond within this period. The screen presentations were

Inspection time and cognitive abilities
14
tested and verified with a light detector applied to the screen and attached to an
oscilloscope to check the timings.
There were three practice blocks to ensure familiarity with the requirements of the task.
In practice block 1, the cue, stimuli and mask were introduced. The sequence of images of cue
stimulus mask was demonstrated slowly, three times. Children were asked to say aloud
which of the stimulus figure legs was longer and feedback was given. Practice block 2
comprised 15 trials with feedback; in trials 1-5 the stimulus was presented for 400 ms, for 150
ms in trials 6-10, and for 75 ms in trials 11-15. The longer leg alternated regularly between
right and left. Practice block 3 comprised 10 trials with feedback. Five stimulus durations were
used; 25, 50, 75, 100 and 125 ms. Each duration was presented with either a longer left or right
leg and trials were randomised. All three practice blocks could be repeated if participants made
substantial errors. The actual test trials were presented in five blocks, each comprising 30
randomised trials, with a brief break between blocks. No feedback was given in the test trials.
The inspection time score reported here is the sum of correct judgements over 150
trials; thus higher inspection time scores reflect better performance, and a score of 75 would be
expected by chance.
Wechsler Intelligence Scales for Children Third edition (WISC-III).
A short form of the WISC-III (Wechsler 1992) was administered. VIQ was calculated
using the Information, Similarities, Vocabulary and Digit Span subtests, while Picture
Completion, Coding, Picture Arrangement and Block Design subtests were used to calculate
PIQ (Sattler, 1992). Full Scale IQ (FSIQ) scores were based on all of the above subtests. In
addition, Symbol Search was administered and, along with Coding, scores from these two
subtests were used to calculate the Processing Speed index score. However, scores on Symbol
Inspection time and cognitive abilities
15
Search were not used to calculate IQ scores (Sattler, 1992). IQ and Index scores have a mean
of 100 and a standard deviation of 15. Subtest scores have a mean of 10 and SD of 3.
NEPSY.
The NEPSY (Korkman et al., 1998) is a standardised neuropsychological assessment
that measures ability in five distinct domains: Attention/Executive, Language, Sensorimotor,
Visuospatial and Memory. While the initials NEPSY do not stand for individual words, the
letters NE refer to neuro and PSY to psychology. All core subtests were administered and used
to calculate the five domain scores, which have a mean of 100 and a standard deviation of 15.
The population mean subtest score is 10 and the SD is 3. Since NEPSY norms cover the age
range 3 years to 12 years, 11 months, no NEPSY data from children over the age of 13 years
were included.
The results presented below, therefore, are based on a maximum of 240 children,
except in the case of the NEPSY scores when a maximum of 155 children were included.
Table 1 presents descriptive statistics for children given different protocols.
Insert Table 1 about here
Procedure
All children were tested individually at the MRC Childhood Nutrition Research Centre
in London. The cognitive testing began in the late morning and continued to the late afternoon.
There was a break for lunch and short breaks during the afternoon.
Statistical analyses
Children were grouped according to age quintiles and inspection time score was
analysed across these groups in order to examine whether inspection time improves with age in
a steady progression. In addition, the whole sample, with age as a continuous variable, was
Inspection time and cognitive abilities
16
used in order to examine the age-related changes in inspection time. The second set of analyses
examined the relationship between inspection time and IQ and NEPSY domain scores. We
considered whether inspection time improves with age when mental age is controlled. In the
first two sets of analyses the twin structure of the data was ignored. This has no effect on the
estimates of the phenotypic correlation coefficients, but the estimated standard errors of the
correlations are slightly too low. The third set considered genetic models of the data; we
examined variance components and intra-class correlations from univariate and bivariate
models. Components of variance between and within pairs of MZ and DZ twins were modelled
in terms of a random effects model reflecting the contributions of additive genetic effects (A),
shared environmental effects (C) and unique environmental effects, which also includes error
(E). This is the so-called ACE model and follows the formulation of Jinks and Fulker (1970).
The logic behind this model is that the resemblance of twins is caused by shared environmental
effects and by additive genetic effects and that these effects can be separated when using MZ
pairs and DZ pairs reared together (e.g., Plomin, De Fries, McClearn & McGuffin, 2001). MZ
twins share all of their genes whereas DZ pairs have on average only 50% of their genes
identical by descent. Therefore, if we assume that resemblance due to shared environmental
effects is the same for MZ and DZ pairs, then a larger resemblance of MZ pairs when
compared to DZ pairs is due to genetic factors. An alpha level of .05 was used for all statistical
tests. Standard errors of the intra-class correlation are a function of their true values and the
sample size. If the true MZ and DZ intra-class correlations are 0.6 and 0.3, then SE for 67 MZ
and 44 DZ pairs are approximately 0.08 and 0.14, respectively (Visscher, 2004). Variance
components were estimated by maximum likelihood, and the effects of sex and age (age at test
in months) were fitted in the models as a factor and linear covariate, respectively. The ACE
Inspection time and cognitive abilities
17
model assumes no dominance or non-additive genetic effects, no assortative mating and no
GXE interaction.
Results
In order to describe the relationship between inspection time and age at test, children
were grouped into quintiles based on age at assessment. Quintiles were used because these
resulted in more even group n than stratifying by age. The first quintile described the youngest
20% of the sample, the second quintile the next 20% and so on. The mean age at test of
children in quintile 1 was 8 years 10 months (range 7,7 to 9,6); quintile 2 mean was 10 years 3
months (range 9,7 to 10,8); quintile 3 mean was 11 years 2 months (10,9 to 11,7); quintile 4
was mean 12 years 8 months (11,8 to 13,10); quintile 5 was mean 15 years 2 months (range
13,11 to 17,3). Data on mean birthweight and gestational age were considered for both twins
and singletons in each quintile and for the whole sample (data available from the authors).
These birth data were examined because they are associated with cognitive test scores later in
childhood and it is important to establish that any age differences in cognitive abilities and
inspection time are not confounded with birth characteristics (Shenkin, Starr, & Deary, 2004).
Over the whole sample, age at assessment was not associated with perinatal variables such as
gestation length and birthweight; a regression of age at test on gestation and birthweight was
not significant, F(1,215) = .63, p = .53. When considering the quintile groups, the birthweights
and gestational ages of the twins were, as expected, lower than the values for singletons, but
similar across quintiles.
Inspection Time and Age at Test
The overall mean inspection time score, defined as the number of correct judgements
out of 150, was 121.1 (SD = 14.1). Mean inspection time scores are shown by age quintiles in

Inspection time and cognitive abilities
18
Table 2; the data show that mean inspection time score increases in each age quintile. A
oneway ANOVA showed a significant effect of age quintile on inspection time score,
F,(1,235) = 23.39, p < .01. Post hoc Sheffe tests revealed that the inspection time of the
youngest age quintile was significantly lower than that of all other age quintiles; quintile 2
differed significantly from quintiles 1, 4 and 5 and quintile 3 differed from quintiles 1 and 5.
Figure 2 shows psychometric curves showing stimulus duration by number correct, separately
for each age quintile. Each quintile shows a similar s-shaped curve with those for older
quintiles shifted to the left, indicating better performance. Similar s-shaped curves were
observed in children of each gender (Figure available from the authors).
Insert Table 2 about here
Insert Figure 2 about here
In the whole sample, there was a positive relationship between inspection time score
and age at test, r = .51, p < .01, as demonstrated in the scatterplot of inspection time scores
presented in Figure 3. Using regression, there was a linear relationship between inspection
time score and age at test; for every additional year in age, inspection time score increased by
an average of 3.2 points (inspection time score = .27 age + 84.40; F(1,238) = 85.1, p < .01).
Insert Figure 3 about here
It is important to rule out the possibility that apparent age differences in inspection time
might be confounded with differences in the children’s family backgrounds. Therefore, we
examined whether children in the different age-based quintiles came from similar families in
terms of demographic variables such as parental qualifications and social code (based on
standard occupational classification; Office of Population Census and Surveys, 1995). In each
quintile, over 60% of fathers and 47% of mothers were educated to degree level or equivalent

Inspection time and cognitive abilities
19
(fathers range from 61.2 to 75.6%; mothers range from 47.1 to 70.7%). Over 78% of
households in each quintile were categorised as professional or managerial (range from 78.5 to
90.3%).
Age at test did not correlate significantly with parental qualifications (r = .08 for
mother’s, and .00 for father’s) or social code (r = .09); therefore, there was no confounding of
age and social position or parental education. Inspection time scores correlated significantly
with mother’s (r = .13, p < .05) and father’s (r = .19, p < .01) qualifications. In the case of both
fathers and mothers, the higher the level of qualifications obtained, the lower the social code;
since low values for social code represent more professional job status, this relationship is in
the expected direction. Social code itself did not correlate significantly with child’s inspection
time score (r = .03).
Inspection time, IQ, Processing Speed and NEPSY
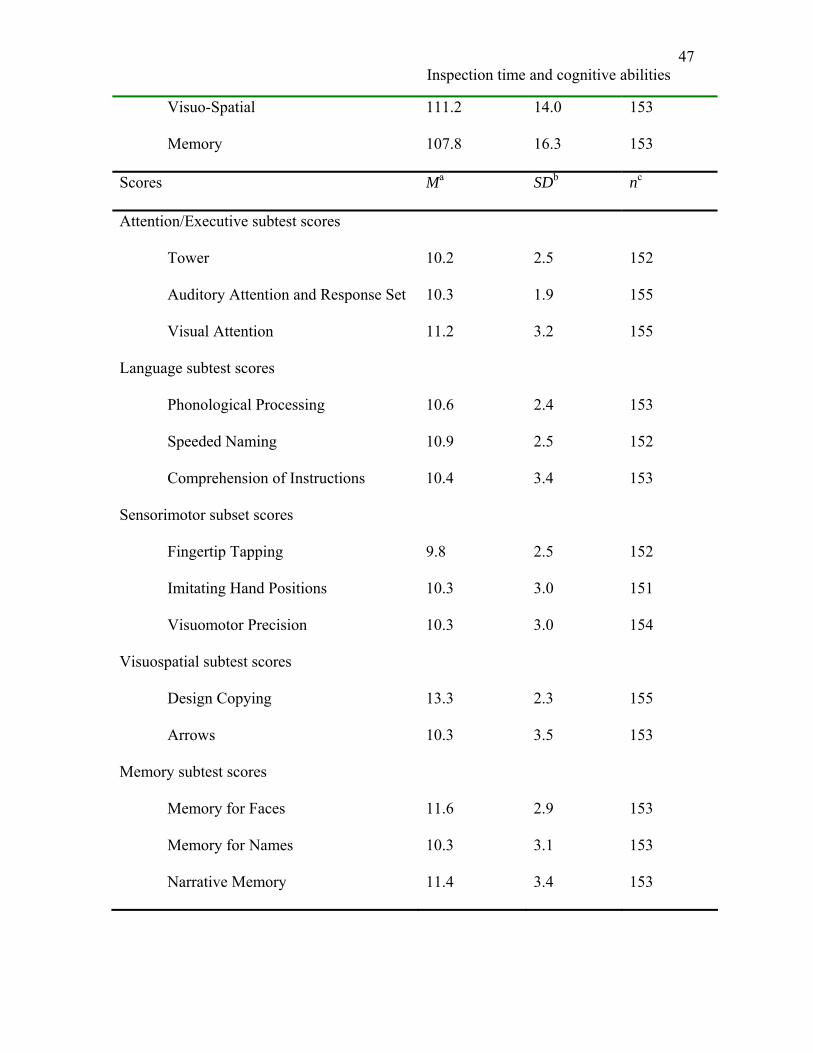
Mean IQ scores, Processing Speed Index score, NEPSY domain scores and all subtest
mean scores are shown in Table 3. All mean IQ, Index and Domain scores were above the
population mean of 100 and within 1 SD of this mean; all standard deviations were similar to
those expected in the population. In the case of subtest scores, almost all were within one SD
of the expected mean of 10.
Insert Table 3 about here
Table 4 presents correlations between inspection time score, FSIQ, VIQ and PIQ
scores, and the five NEPSY domain scores. These were calculated using both raw scores (not
age-scaled; raw scores are shown above diagonal) and age-scaled (below diagonal) scores for
the mental ability tests. The coefficients from the raw score analyses were larger than those
obtained in the analyses using age-scaled scores; this occurred because both inspection time

Inspection time and cognitive abilities
20
score and raw WISC-III scores improved with age. The correlations between inspection time
and all three WISC-III derived IQ scores were highly significant, ranging from .50 to .58 in the
case of raw scores, and between .19 to .27 in the case of age scaled scores. Almost all NEPSY
domain scores correlated with inspection time scores significantly and in the expected
direction. For raw Sensorimotor domain scores the correlation coefficients were negative. This
occurred because a bigger value in the raw score indicates poorer performance; this sign is
reversed when scores are age scaled. Coefficients between inspection time scores and age-
scaled Visuospatial domain scores did not reach significance.
Insert Table 4 about here
Inspection Time and IQ, Mental Age and Chronological Age
Does inspection time score increase with age when IQ is held constant?
Older children had a higher inspection time score and inspection time score also
correlated positively with FSIQ score (age scaled r = .26, p < .01; raw score r = .58, p < .01).
The relationship between inspection time score and age remained significant when partial
correlations were conducted that took FSIQ into account (age scaled r = .53, p < .01; raw score
r = .14, p = .03). Therefore, there is an improvement in inspection time with age, over and
above the general level of measured intelligence. There was a significant relationship between
inspection time and WISC-III FSIQ raw score when age at assessment was held constant (raw
score r = .35, p < .01). This association suggests that inspection time score is related to
differences in measured general intelligence (mental age) over and above the effect of
chronological age.
Insert Table 5 about here

Inspection time and cognitive abilities
21
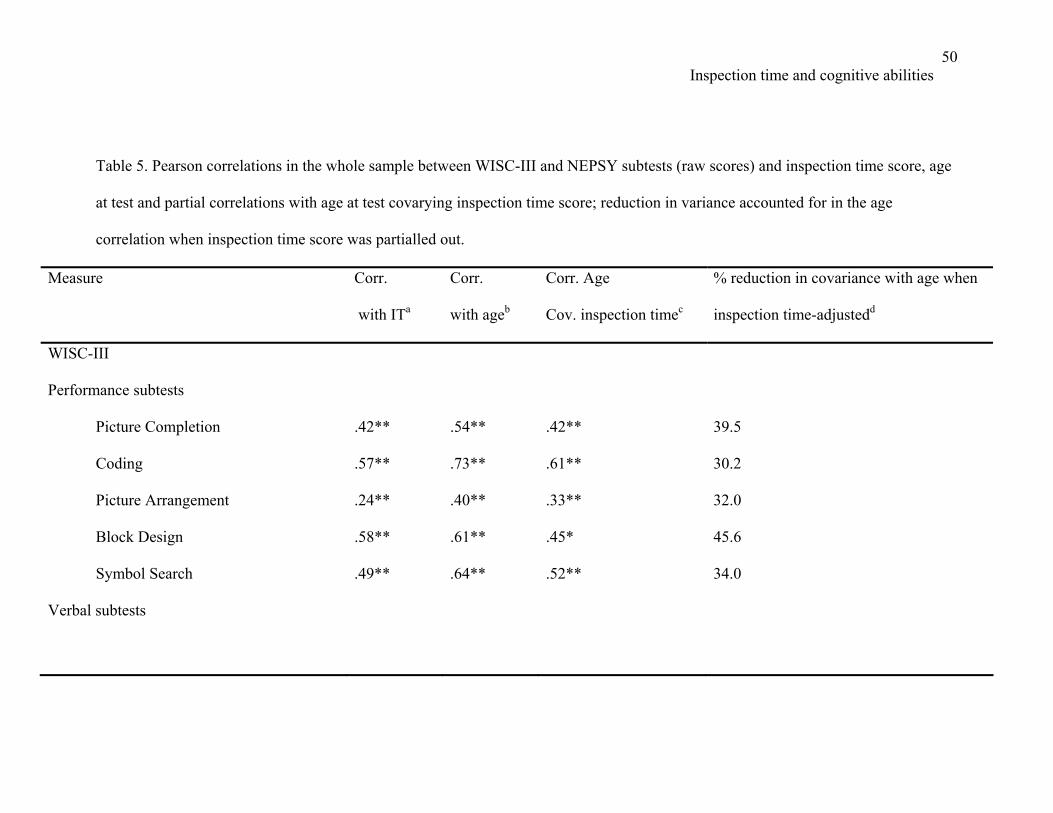
Table 5 shows the correlation coefficients obtained when all raw NEPSY and WISC-III
subtest scores were correlated with inspection time score, and age at test; we also show the
correlation with age at assessment when inspection time score was covaried. The final column
shows the percentage of variance in the relationship between subtest scores and age at test that
is accounted for by inspection time score. Inspection time score makes a substantial
contribution to the variance between age at assessment and many WISC-III subtests (overall
range 27.0% to 45.9%). The contribution to the relationships between NEPSY subtests and age
at test were more variable (overall range 10.3% to 100%).
Genetic Models
Variance components and intra-class correlations
Variance components and intra-class correlations for birthweight, IT and IQ measures
were estimated for MZ and DZ twins separately, using maximum likelihood and a linear model
in which age and sex were fitted. The estimates are similar to ANOVA-based estimates of the
intra-class correlations. These data are shown in Table 6. For all measures, the between pairs
variance was greater than the within pairs variance in the case of MZ twins, while the reverse
was true for DZ twins. This is reflected in higher intra-class correlations for MZ twins
compared to DZ twins.
On the inspection time measure, the zero estimate of between pair variance in the case of
DZ twins was a result of a partial confounding between the effect of age and the effect of a
twin pair. When age was removed, this between pair variance rose above zero, and the
estimates are shown in the footnote of Table 6. This occurred because of the nature of the
cross-sectional design. The displayed results from all twin analyses (Tables 8-10) are from
fitting age and sex in the model of analysis
Inspection time and cognitive abilities
22
Insert Table 6 about here
Univariate ACE models.
Using Mx (Neale et al., 2002), univariate ACE models were fitted to WISC-III raw
scores and inspection time scores (Table 7). Age at test (linear covariate) and sex were fitted in
all analyses and the estimates of their effects are shown as the female minus male mean for sex
and the increase per month of test for age. In all cases the contribution from the shared
environment did not differ significantly from zero. The genetic contribution to WISC-III
scores was approximately 80% of the variance, with the remainder accounted for by the unique
environment/error term. The genetic contribution to inspection time scores was 45% of the
variance, with 55% accounted for by the unique environment/error term. Because the shared
environment did not contribute significantly to the WISC-III and inspection time scores, the
models were re-run with only the A and E terms. The main difference as a result of this was a
reduction in the 95% confidence intervals for the estimates of the heritability (h2), but not for
the proportion of total variance due to unique environmental effects (e2). Since the MZ
intraclass correlations were more than twice the DZ correlations for all traits except
birthweight (Table 6), a model with dominance effects might be more appropriate. We fitted
an ADE model to the data (results not shown in tables); this models additive genetic effects
(A), dominant genetic effects (D) and unique environmental effects (E). However, A and D are
highly confounded and there are not enough data to separate the two effects, as was evident
from the very large 95% confidence intervals for estimates of the narrow sense heritability that
varied from 0-0.6 to 0-0.9. Dominance variation was not significant for any of the traits, even
for IT where the estimate of the additive heritability was 0. Dropping A from the model caused
a non-significant reduction in the fit (as evident from the large confidence intervals for the
Inspection time and cognitive abilities
23
heritability estimates), but a DE model is biologically not plausible. Therefore, the most
parsimonious model for these traits is the simple AE model. However, our sample size is not
large enough to conclude that non-additive genetic effects are not important for IT, hence we
lack the power to reject dominance in an ADE model
Insert Table 7 about here
Bivariate models.
Bivariate models were performed using Mx. Only the A (additive genetic) and E
(unique environment and error) terms were included, and sex and age at test were included as
covariates. The hypothesis that the genetic correlation coefficient (rg) or the unique
environmental correlation coefficient (re) were significantly different from zero was tested
using a likelihood-ratio-test. Results are shown in Table 8. The genetic correlation between
inspection time and WISC-III Performance IQ was .55 (p < .01), and that between inspection
time and Verbal IQ was .28 (p = .03). Only Verbal IQ showed a significant environmental
correlation with inspection time, at .24 (p = .04). Therefore, shared genetic influences are a
moderate to strong contributor to the phenotypic correlation between inspection time and
WISC-III IQ scores, especially Full Scale and Performance IQ.
Insert Table 8 about here
Discussion
Summary of Findings
The study reported in this paper is the first twin study of inspection time in pre- and
post-adolescent children, providing important data about the way in which inspection time
changes with age, how it relates to different cognitive abilities, its environmental and genetic
foundations, and its genetic and environmental correlations with cognitive abilities. Our data
Inspection time and cognitive abilities
24
showed an improvement in inspection time with increasing age. When children were grouped
into quintiles by age, the pattern was for inspection time to increase over each quintile. Age-
related trends were not due to confounding with background variables such as birth
characteristics or social position. Significant correlations were found between inspection time
and general intelligence measured by IQ scores. The inspection time-IQ relationship persisted
when age was taken into account. Thus, the results indicate that a similar relationship between
inspection time and IQ is found in children to that observed in adults (Grudnik & Kranzler,
2001). We found significant correlations between inspection time and all WISC-III subtests.
We also report moderately high heritability estimates for inspection time and higher estimates
for IQ; the heritability of inspection time has not previously been reported in this age group.
The models of genetic covariance of inspection time and IQ showed genetic and unique
environment contributions to the shared variance.
Age-related changes in Inspection Time
Our findings are congruent with other studies that have reported that inspection time
improves across childhood (Anderson, 1986, 1992, 2001; Nettelbeck & Lally, 1979;
Nettelbeck & Wilson, 1985; 2004). It is unlikely that this age-related trend was due to
differences in social background because, in our sample, social background was well
controlled over the different age groups tested. In particular, our data correspond with those
reported by Deary (1995), who showed an improvement in auditory inspection time across a
similar age range. While the cross-sectional design does not allow inspection time
development to be tracked in individual children, visual inspection of the data grouped by
quintiles shown in Table 2 and Figure 2 indicates an improvement in each increasing age band.
One advantage of the cross-sectional design is that it excludes practice effects.

Inspection time and cognitive abilities
25
Inspection Time and General Cognitive Ability
The correlation coefficients between age scaled IQ scores and inspection time were
somewhat lower than those commonly reported in the literature (Kranzler & Jensen, 1989).
However, they were very similar to those reported in two recent twin studies (Luciano et al.,
2001; Posthuma et al., 2001). The correlations we report and those reported by Luciano et al.
(2001) and Posthuma et al. (2001) may be lower than those reported in studies of singletons
because twin samples may be somehow different to samples of singletons, perhaps in terms of
factors such as early prenatal environment and upbringing. A large scale comparison of twins
and singletons would be necessary to address the question of potential differences in such
individuals. However, it is worth noting that approximately 40% of Posthuma et al.’s sample
were singleton siblings of twins (calculated from data presented in Table II, p.595) and they
reported that there were no differences between singletons and twins when examining mean
scores.
Alternatively, the difference in correlation coefficients between studies of twins and
studies of singletons could be a result of different sample sizes. Our sample size was larger
than that in many studies of singletons and the other two twin studies in the literature had
bigger samples still. However, these sample sizes are small compared to that available for
Kranzler & Jensen’s (1989) meta-analysis. One difference between Kranzler & Jensen’s meta-
analysis, our study and those of Luciano et al. (2001) and Posthuma et al. (2001), is that they
all encompass different age ranges. It is possible that differences in the developing brain result
in a different relationship between inspection time and IQ in children, than that observed in
adults.
Inspection time and cognitive abilities
26
Considering the relationship between chronological age, mental age (raw IQ scores)
and inspection time, we found that inspection time was related to differences in mental age
over and above the effect of chronological ageing. This suggests that mental age does
contribute to inspection time, in the direction of cleverer individuals having faster inspection
time. However, taking into account general cognitive ability, we still found a chronological
age-based improvement in inspection time. This is in contrast to the view proposed by
Anderson et al. (2001) who argued that rather than chronological ageing underlying
developmental improvements in inspection time, age related changes in strategic thought were
responsible for advances in inspection time that occur as children age.
Inspection Time and Specific Cognitive Abilities
Few studies have examined correlations between inspection time and specific cognitive
abilities in children. Using the NEPSY allowed us to assess the relationship between
inspection time and five domains of cognition: Attention/Executive, Language, Sensorimotor,
Visuospatial and Memory. Inspection time correlated significantly with all raw and age-scaled
NEPSY domain scores, with the exception of the age-scaled Visuospatial domain score. Apart
from Memory for Faces, all NEPSY subtests correlated significantly with inspection time.
Heritability and Genetic Covariance of Inspection Time and General Cognitive Ability
The genetic analyses of inspection time and IQ make a new contribution to the
literature. To date, there have been only two twin studies examining heritability of inspection
time and the genetic covariance of inspection time and IQ, neither of which investigated the
age range of late childhood to early adolescence. Previous estimates of the heritability of
inspection time were 26% (Luciano et al., 2001) and 56% (Posthuma et al., 2001) in cohorts of
16 year old children and adults, respectively. Our inspection time estimate fell between these

Inspection time and cognitive abilities
27
two, at 45%. Our data provide the first estimate of the heritability of inspection time in late
childhood/early adolescence and suggest that a high proportion of the variation in inspection
time is genetic at this stage of development.
When modelling the sources of covariance of inspection time and IQ, a model
containing genetic and unique environment factors was the best fit for the data. This model is
congruent with those reported by Luciano et al. (2001) and Posthuma et al. (2001). We
observed genetic correlations that were higher between inspection time and PIQ (.55) than
between inspection time and VIQ (.24), a set of findings that is also consistent with Luciano et
al. (2001) and Posthuma et al. (2001). Our data suggest that the foundation of the well
established correlation between inspection time and PIQ is genetic. We found a within-
individual environmental contribution to the relationship between inspection time and VIQ
(.24), but not to the relationship between inspection time and PIQ (.06).
In our data, the heritability of PIQ was 73%, VIQ was 85% and FSIQ was 83%.
Previously, IQ heritability has been estimated at approximately 50% on the basis of model-
fitting analyses that combine data from many studies (Chipuer, Rovine & Plomin, 1990;
Loehlin, 1989). IQ heritability increases across the lifespan, rising from 40% in childhood, to
60% in adulthood and 80% later in life (McGue, Bouchard, Iacono & Lykken, 1993; Pedersen,
Plomin, Nesselroade & McClearn, 1992; Plomin, 1986; Plomin & Petrill, 1997). Thus, our
data suggest a genetic contribution to IQ higher than that reported in the literature. Heritability
is related to social class; it is lower in more deprived groups of children (Turkheimer at al.,
2003). Thus, our high heritability may be associated with the advantaged status of our sample
(the majority of families were professional or managerial).
Potential Limitations
Inspection time and cognitive abilities
28
For the most part, the sample studied here comprised twins. It is possible that twins
may not be representative of the population and our results may not generalise to singletons.
Measures of cognitive ability acquired from twins have been shown to be different from
similar data acquired from singletons (Record, McKeown, & Edwards, 1970). However, it has
been demonstrated conversely that IQ scores obtained from twins do not differ from those of
singletons if the singletons to whom twins are compared are their own siblings (Posthuma, De
Geus, Bleichordt & Boomsma, 2000). Assessment of a larger singleton sample would be
necessary to examine whether our twin data extends to singletons.
Our study showed a clear age-related trend in inspection time over the whole age range
tested. A larger sample size within each of the five age quintiles would be necessary to
investigate whether inspection time increases at each of the five time points in a similar
manner. The trend may be linear across childhood, or alternatively, it may be characterised by
periods of change interspersed with periods of little or no change.
Future Work
Having established an age-related improvement in inspection time and the inspection
time-IQ relationship in children, future work should investigate the mechanistic basis of these
relationships. This could be approached in three ways. Firstly, the neural correlates of
inspection time should be investigated. Two recent studies have shown developmental changes
in brain structure over an age range similar to that tested in the present study (Courchesne et
al., 2000; Giedd et al., 1999), and these changes may be associated with the age-related
improvements in inspection time. Both studies reported that white matter volume increased in
childhood prior to adolescence, with Courchesne et al. reporting a substantial increase of 74%
from early childhood to adolescence (ages 12 to 15 years). Gray matter also increased in total
Inspection time and cognitive abilities
29
over childhood, but showed different developmental changes in different lobes (Giedd et al.,
1999).
More specifically, a recent fMRI study identified brain areas associated with
performance of a visual inspection time task. Deary et al. (2004) found bilateral activation in
the inferior fronto-opercular cortex,superior/medial frontal gyrus, and anterior cingulate gyrus,
while bilateral deactivation was observed in the posterior cingulate gyrus and precuneus. MRI
structural brain scans were acquired for a large proportion of our participants and we intend to
use Statistical Parametric Mapping software (Ashburner & Friston, 2000) to conduct Voxel
Based Morphometry (Wright, McGuire, Poline, Travere, Murray, Frith, Frackowiak, &
Friston, 1995) analyses in gray and white matter to try to identify a structural correlate of the
age-related changes in inspection time, using the areas found by Deary et al to make
predictions about localisation. Because it has been hypothesised that the development in speed
of processing may be associated with age-related increases in myelination, we would expect
white matter particularly to be implicated. In future work we intend to look at the relationship
between white matter tracts and inspection time by analysing Diffusion Tensor Image (DTI)
scans that give detailed information about white matter tracts and their connections.
Secondly, future work should include the search for specific genes that contribute to
the shared variance between inspection time and cognitive ability. Candidate genes will have
to be identified; recent research has investigated the influence of APOE polymorphisms on
cognitive function. ε4 status does not affect the level of mental ability in childhood or change
across the lifespan (Deary, Whalley, St Clair, Breen, Leaper, Lemmon, Hayward & Starr,
2002), but poorer memory performance in middle-age has been found in individuals with at
least one ε4 allele (Flory, Manuk, Ferrell, Ryan & Muldoon, 2000). APOE status may make a

Inspection time and cognitive abilities
30
good candidate for exploring the genetic basis of inspection time because it has been linked to
tasks involving processing speed (Anstey & Christensen, 2000). Blood samples were obtained
for the majority of children in our sample study and we intend to ascertain APOE status in
order to see if there is a relationship between ε4 status and inspection time.
Thirdly, environmental factors that improve the relationship between VIQ and
inspection time should be identified. In our sample, fathers’ and mothers’ qualifications were
significantly related to inspection time in children, but social code was not.
Conclusions
In conclusion, the results indicate that inspection time improves across the age range of
7 to 17 years, that inspection time is related to cognitive abilities in childhood as well as in
adulthood, that inspection time is moderately heritable, and that genetic and non-shared
environmental factors underlie the relationship between inspection time and IQ.

Inspection time and cognitive abilities
31
*Grants and Acknowledgements
This research was supported by a grant from the Medical Research Council, UK. Ian
Deary is the recipient of a Royal Society-Wolfson Research Merit Award.
We thank Alan Marshall for assessing the timings of the inspection time stimuli. We
thank those who kindly agreed to participate in the study.

Inspection time and cognitive abilities
32
References
Anderson, M. (1986). Inspection time and IQ in young children. Personality and Individual
Differences, 7, 677-686.
Anderson, M. (1992). Intelligence and development: a cognitive theory. Oxford, UK:
Blackwell.
Anderson, M. (2001). Annotation: conceptions of intelligence. Journal of Child Psychology
and Psychiatry, 42, 287-298.
Anderson, M., Reid, C., & Nelson, J. (2001). Developmental changes in inspection time: what
a difference a year makes. Intelligence, 29, 475-486.
Anstey, K., & Christensen, H. (2000). Education, activity, health, blood pressure and
apolipoprotein E as predictors of cognitive change in old age: a review. Gerontology, 46,
163-177.
Ashburner J., & Friston K. (2000). Voxel-based morphometry: The methods. NeuroImage, 11,
805-821.
Bartzokis, G. (2004). Age-related myelin breakdown: a developmental model of cognitive
decline and Alzheimer's disease. Neurobiology of Aging, 25, 5-18.
Bates, T., & Eysenck, H. J. (1993). Intelligence, inspection time and decision time.
Intelligence, 17, 523-531.
Brand, C. (1981). General intelligence and mental speed: Their relationship and development.
In M. P. Friedman, J. P. Das, & N. O’Connor (Eds.), Intelligence and learning. New
York: Plenum.
Brand, C. (1984). Intelligence and inspection time: an ontogenetic relationship. In C. J. Turner
& H. B. Miles (Eds.), The Biology of Human Intelligence: Proceedings of the twentieth

Inspection time and cognitive abilities
33
Annual Symposium of the Eugenics Society London, 1983 (pp. 53-64). Nafferton, UK:
Nafferton Books.
Brand, C. R., & Deary, I. J. (1982). Intelligence and ‘inspection time’. In H.J. Eysenck (Ed.), A
model for intelligence (pp.133-148). Berlin: Springer-Verlag.
Burns, N. R., & Nettelbeck, T. (2003). Inspection time in the structure of cognitive abilities:
Where does inspection time fit? Intelligence, 31, 237-255.
Burns, N. R., Nettelbeck, T., & Cooper, J. (1999). Inspection time correlates with general
speed of processing but not with fluid ability. Intelligence, 27, 37-44.
Carroll, J. B. (1991). No demonstration that g is not unitary, but there is more to the story:
comment on Kranzler & Jensen. Intelligence, 15, 423-436.
Ceci, S. J. (1990). On the relation between microlevel processing efficiency and macrolevel
measures of intelligence: some arguments against current reductionism. Intelligence, 14,
141-150.
Chipuer, H. M., Rovine, M., & Plomin, R. (1990). LISREL modelling: Genetic and
environmental influences on IQ revisited. Intelligence, 14, 11-29.
Courchesne, E., & Chisum, H. J., Townsend, J., Cowles, A., Covington, J., Egaas, B.,
Harwood, M., Hinds, S., & Press, G. A. (2000). Normal brain development and aging:
quantitative analysis at in vivo MR imaging in healthy volunteers. Radiology, 216, 672-
82.
Deary, I. J. (1993). Inspection time and WAIS-R IQ subtypes: a confirmatory factor analysis
study. Intelligence, 17, 223-236.
Deary, I. J. (1995). Auditory inspection time and intelligence: what is the direction of
causation? Developmental Psychology, 31, 237-250.

Inspection time and cognitive abilities
34
Deary, I. J. (2000). Looking down on human intelligence. Oxford: Oxford University Press.
Deary, I. J., Caryl, P. G., Egan, V., & Wight, D. (1989). Visual and auditory inspection times:
their interrelationship and correlations with IQ in high ability subjects. Personality and
Individual Differences, 10, 525-533.
Deary, I. J., Simonotto, E., Meyer, M., Marshall, A., Marshall, I., Goddard, N., & Wardlaw, J.
M. (2004). The functional anatomy of inspection time: an event-related fMRI study.
Neuroimage, 22, 1466-1479.
Deary, I. J., & Stough, C. (1996). Intelligence and inspection time: achievements, prospects
and problems. American Psychologist, 51, 599-608.
Deary, I. J., Whalley, L. J., St Clair, D., Breen, G., Leaper, S., Lemmon, H., Hayward, C., &
Starr, J. M. (2002). The influence of the ε4 allele of the apolipoprotein E gene on
childhood IQ, nonverbal reasoning in old age, and lifetime cognitive change.
Intelligence, 139, 1-8.
Dunn, L. M. (1965). Peabody Picture Vocabulary Test: Manual. Circle Pines, MN: American
Guidance Services.
Flory, J. D., Manuk, S. B., Ferrell, R. E., Ryan, C. M., & Muldoon, M. F. (2000). Memory
performance and the apolipoprotein E polymorphism in the TNFRSF6 gene. Human
Genetics, 107, 391-396.
Flynn, J. R. (1999). Massive IQ gains in 14 nations: what IQ tests really measure.
Psychological Bulletin, 101, 171-191.
Frearson, W., & Eysenck, H. J. (1986). Intelligence, reaction time (RT) and a new ‘odd-man-
out’ RT paradigm. Personality and Individual Differences, 7, 807-817.

Inspection time and cognitive abilities
35
Giedd, J. N., Blumenthal, J., Jeffries, N. O., Castellanos, F. X., Liu, H., Zijdenbos, A., Paus,
T., Evans, A.C., & Rapoport, J. L. (1999). Brain development during childhood and
adolescence: a longitudinal MRI study. Nature Neuroscience, 2, 861-863.
Grudnik, J. L., & Kranzler, J. H. (2001). Meta-analysis of the relationship between intelligence
and inspection time. Intelligence, 29, 523-535.
Horn, J. L., & Cattell, R. B. (1966). Refinement and test of the theory of fluid and crystallized
intelligence. Journal of Educational Psychology, 57, 53--270.
Irwin, R. J. (1984). Inspection time and its relation to intelligence. Intelligence, 8, 47-65.
Jinks, J. L., & Fulker, D. W. (1970). Comparison of the biometrical genetical, MAVA, and
classical approaches to the analysis of human behavior. Psychological Bulletin, 73, 311-
349.
Kail, R. (2000). Speed of information processing: developmental change and links to
intelligence. Journal of School Psychology, 38, 51-61.
Kline, P. (1991). Sternberg’s components: non-contingent concepts. Personality and
Individual Differences, 12, 873-876.
Korkman, M., Kirk, U., & Kemp, S. (1998). NEPSY. A developmental neuropsychological
assessment. The Psychological Corporation.
Kranzler J. H., & Jensen, A. R. (1989). Inspection time and intelligence: a meta-analysis.
Intelligence, 13¸ 329-347.

Inspection time and cognitive abilities
36
Loehlin, J. C. (1989). Partitioning environmental and genetic contributions to behavioural
development. American Psychologist, 44, 1285-1292.
Luciano, M., Smith, G. A., Wright, M. J., Geffen, G. M., Geffen, L. B., & Martin, N. G.
(2001). On the heritability of inspection time and its covariance with IQ: a twin study.
Intelligence, 29, 443-457.
Mackintosh, N. J. (1986). The biology of intelligence? British Journal of Psychology, 77, 1-18.
Mackintosh, N. J., & Bennett, E. S. (2002). IT, IQ and perceptual speed. Personality and
Individual Differences, 32, 685-693.
McGue, M., Bouchard, T. J, Iacono, W. G., & Lykken, D. T. (1993). Behavioral genetics of
cognitive ability: a life-span perspective. In R. Plomin & G. E. McClearn (Eds.), Nature,
nurture and psychology. Washington, DC: American Psychological Association.
Miller, E. M. (1994). Intelligence and brain myelination: a hypothesis. Personality and
Individual Differences, 17, 803-832.
Neale, M. C., Boker, S. M., Xie, G., & Maes, H. H. (2002). Mx: Statistical Modeling. VCU
Box 900126, Richmond, VA 23298: Department of Psychiatry. 6th Edition.
Nettelbeck, T. (1987). Inspection time and intelligence. In P. A. Vernon (Ed.), Speed of
information processing and intelligence. Norwood, NJ: Ablex.
Nettelbeck, T. (2001). Correlation between inspection time and psychometric abilities. A
personal interpretation. Intelligence, 29, 459-474.
Nettelbeck, T., & Lally, M. (1976). Inspection time and measured intelligence. British Journal
of Psychology, 67, 17-22.
Nettelbeck, T., & Vita, P. (1992). Inspection time in two childhood age cohorts: a constant or a
developmental function? British Journal of Developmental Psychology, 10, 189-197.

Inspection time and cognitive abilities
37
Nettelbeck, T., & Wilson, C. (1985). A cross-sectional analysis of developmental differences
in speed of viaual processing. Journal of Experimental Child Psychology, 40, 1-22.
Nettelbeck, T., & Wilson, C. (2004). The Flynn effect: smarter not faster. Intelligence, 32, 85-
93.
Neubauer, A. C. (1997). The mental speed approach to the assessment of intelligence. In J.
Kingma & W. Tomic (Eds.), Advances in cognition and education: Reflections on the
concept of intelligence. Greenwich, Connecticut: JAI press.
O’Connor, T. A., & Burns, N. R. (2003). Inspection time and general speed of processing.
Personality and Individual Differences, 35, 713-724.
Office of Population Census and Surveys. (1995). Standard Occupational Classification
Volumes 2 and 3 (2nd ed.). London: HMSO.
Pedersen, N. L., Plomin, R., Nesselroade, J. R., & McClearn, G. E. (1992). A quantitative
genetic analysis of cognitive abilities during the second half of the life span.
Psychological Science, 3, 346-353.
Plomin, R. (1986). Development, genetics, and psychology. Hillsdale, NJ: Earlbaum.
Plomin, R., & Petrill, S. A. (1997). Genetics and intelligence: what’s new? Intelligence, 24,
53-77.
Plomin, R., DeFries, J.C., McClearn, G.E., & McGuffin, P. (2001). Behavioral Genetics (4th
ed.). New York: Worth Publishers.
Posthuma, D., de Geus, E. J. C., & Boomsma, D. I. (2001). Perceptual speed and IQ are
associated through common genetic factors. Behavior Genetics, 31, 593-602.
Posthuma, D., De Geus, E. J. C., Bleichordt, N., & Boomsma, D. I. (2000). Twin-singleton
differences in intelligence?. Twin Research, 3, 83-87.

Inspection time and cognitive abilities
38
Pujol, J., López-Sala, A., Sebastián-Gallés, N., Deus, J., Cardoner, N., Soriano-Mas, C.,
Moreno, A., & Sans, A. (2004). Delayed myelination in children with the developmental
delay detected by volumetric MRI. NeuroImage, 22, 897-903.
Record, R. G., McKeown, T., & Edwards, J. H. (1970). An investigation of the difference in
measured intelligence between twins and single births. Annals of Human Genetics, 34,
11-20.
Roberts, R. D., & Stankov, L. (1999). Individual differences in speed of mental processing and
human cognitive abilities: toward a taxonomic model. Learning and Individual
Differences, 11, 1-120.
Sattler, J. M. (1992). Assessment of children; revised and updated (3rd Ed.). San Diego,
California: Jerome M. Sattler Publisher Inc.
Salthouse, T. A. (1996). The processing-speed theory of adult age differences in cognition.
Psychological Review, 103, 403-428.
Shenkin, S. D., Starr, J. M., & Deary, I. J. (2004). Birth weight and cognitive ability in
childhood: a systematic review. Psychological Bulletin, 130, 989-1013.
Stankov, L., & Roberts, R. D. (1997). Mental speed is not the ‘basic’ process of intelligence.
Personality and Individual Differences, 22, 69-84.
Turkheimer, E., Haley, A., Waldron, M., D’Onofrio, B., & Gottesman, I. I. (2003).
Socioeconomic status modifies heritability of IQ in young children. Psychological
Science, 14, 623-628.
Vickers, D. (1970). Evidence for an accumulator model of psychophysical discrimination.
Ergonomics, 13, 37-58.
Vickers, D. (1979). Decision processes in visual perception. London: Academic Press.

Inspection time and cognitive abilities
39
Vickers, D., Nettelbeck, T. & Wilson, R. J. (1972). Perceptual indices of performance: the
measurement of ‘inspection time’ and ‘noise’ in the visual system. Perception, 1, 263-
295.
Visscher, P. M. (2004). Power of the classical twin design revisited. Twin Research, 7, 505-
512.
Wechsler, D. (1992). Wechsler Intelligence Scales for Children. 3rd Ed. Sidcup, UK:
Psychological Corporation.
Wright, I. C., McGuire, P. K., Poline, J. B., Travere, J. M., Murray, R. M., Frith, C. D.,
Frackowiak, R. S. J., & Friston, K. J. (1995). A voxel-based method for the statistical
analysis of gray and white matter density applied to schizophrenia. NeuroImage, 2 244-
252.
Figure Captions
Figure 1. Inspection time figure.
Figure 2. Mean correct IT trials by stimulus duration and age quintiles.
Figure 3. Scatterplot of IT total correct by age at test.

Inspection time and cognitive abilities
40
Figure 1.
Cue MaskStimulus
Time
Respond:correct = “right”
Respond:correct = “left”
Response

Inspection time and cognitive abilities
41
Figure 2
IT stimulus duration
200
150
125
100
87
75
62
50
44
37
31
25
19
12
6
Me
an
nu
mb
er
corr
ect
(/1
0)
10
9
8
7
6
5
4
Age Quintiles
7,7 to 9,6 years
9,7 to 10,8 years
10,9 to 11,7 years
11,8 to 13,10 years
13,11 to 17,3 years

Inspection time and cognitive abilities
42
Figure 3.
Age at test (months)
22020018016014012010080
Insp
ect
ion
tim
e t
ota
l co
rre
ct (
/15
0)
160
150
140
130
120
110
100
90
80
70
60

Inspection time and cognitive abilities
43

Inspection time and cognitive abilities
44
Table 1. Zygosity, gender and age at test by protocol
Age group Protocol Zygositya
MZ; DZ; Sib
Gendera
M; F
Age in months
n n M range
under 13 years Younger Protocol (includes NEPSY) 86; 61; 8 88; 67 124 91-155
13 years & older Older Protocol (excludes NEPSY) 32; 18; 3 34; 19 175 155-207
All ages Intensive Week Protocol (excludes NEPSY) 16; 8;8 21; 11 142 98-199
Total All Protocols 134; 87; 19 141; 97 138 91-207
Note. a the n refer to individual children.

Inspection time and cognitive abilities
45
Table 2: Mean Inspection Time score by age quintiles
Quintile n Inspection time (total correct)
M SD
7,7 to 9,6 years 55 109.6 16.4
9,7 to 10,8 years 49 118.8 12.2
10,9 to 11,7 years 41 121.4 10.8
11,8 to 13,10 years 51 126.6 19.6
13,11 to 17,3 years 44 131.1 8.2
Total 240 121.1 14.1

Inspection time and cognitive abilities
46
Table 3: Mean scores on WISC-III IQ, Index and subtest scores and NEPSY domain and
subtest scores for the total sample
Scores Ma SDb nc
IQ and Index scores
FSIQ 108.2 15.7 240
VIQ 109.6 14.9 240
PIQ 104.5 16.7 240
Processing Speed 108.2 17.3 240
PIQ subtest scores
Picture Completion 10.7 2.8 240
Coding 10.8 3.3 240
Picture Arrangement 10.7 3.9 240
Block Design 10.4 3.0 240
Symbol Search 12.3 3.7 240
VIQ subtest Scores
Information 12.3 3.4 240
Similarities 12.2 3.1 240
Vocabulary 11.6 2.9 240
Digit Span 10.4 3.2 240
NEPSY Domain Scores
Attention/Executive 104.6 13.4 153
Language 104.0 14.8 152
Sensorimotor 100.8 14.8 150
Inspection time and cognitive abilities
47
Visuo-Spatial 111.2 14.0 153
Memory 107.8 16.3 153
Scores Ma SDb nc
Attention/Executive subtest scores
Tower 10.2 2.5 152
Auditory Attention and Response Set 10.3 1.9 155
Visual Attention 11.2 3.2 155
Language subtest scores
Phonological Processing 10.6 2.4 153
Speeded Naming 10.9 2.5 152
Comprehension of Instructions 10.4 3.4 153
Sensorimotor subset scores
Fingertip Tapping 9.8 2.5 152
Imitating Hand Positions 10.3 3.0 151
Visuomotor Precision 10.3 3.0 154
Visuospatial subtest scores
Design Copying 13.3 2.3 155
Arrows 10.3 3.5 153
Memory subtest scores
Memory for Faces 11.6 2.9 153
Memory for Names 10.3 3.1 153
Narrative Memory 11.4 3.4 153

Inspection time and cognitive abilities
48
Note. a,b WISC-III IQ scores, Index scores and NEPSY domain scores have a population
mean of 100 and a population standard deviation of 15. Subtest scores from WISC-III and
NEPSY have a population mean of 10 and standard deviation of 3.
c Every child completed all subtests from the WISC-III. The NEPSY was administered to
age-appropriate children; occasional subtests were omitted.

Inspection time and cognitive abilities
49
Table 4. Pearson correlations between IT score, WISC-III IQ scores and NEPSY domain scores in the whole sample. Age scaled
scores are below the diagonal; raw scores above the diagonal
Measure 1. 2. 3. 4. 5. 6. 7. 8. 9.
1. IT Score − .58** .50** .58** .35** .58** -.22** .33** .38**
2. FSIQ .26** − .90** .97** .54** .76** -.25** .49** .63**
3. VIQ .19** .89** − .77** .44 .73** -.20* .38** .62**
4. PIQ .27** .8** .57** − .55** .69** -.25 ** .51** .57**
5. Attention Executive .28** .58** .50** .54** − .53** -.30** .39** .43**
6. Language .30** .73** .72** .61** .59** − -.29** .49** .65**
7. Sensorimotor .22** .27** .15 .35** .42** .33** − -.23** -.19*
8. Visuospatial .11 .48** .40** .48** .29** .47** .36** − .30**
9. Memory .27** .58** .55** .48** .54** .56** .26 .18* −
* p < .05 ** p < .01
Inspection time and cognitive abilities
50
Table 5. Pearson correlations in the whole sample between WISC-III and NEPSY subtests (raw scores) and inspection time score, age
at test and partial correlations with age at test covarying inspection time score; reduction in variance accounted for in the age
correlation when inspection time score was partialled out.
Measure Corr.
with ITa
Corr.
with ageb
Corr. Age
Cov. inspection timec
% reduction in covariance with age when
inspection time-adjustedd
WISC-III
Performance subtests
Picture Completion .42** .54** .42** 39.5
Coding .57** .73** .61** 30.2
Picture Arrangement .24** .40** .33** 32.0
Block Design .58** .61** .45* 45.6
Symbol Search .49** .64** .52** 34.0
Verbal subtests

Inspection time and cognitive abilities
51
Measure Corr.
with ITa
Corr.
with ageb
Corr. Age
Cov. inspection timec
% reduction in covariance with age when
inspection time-adjustedd
Information .44** .67** .58** 25.1
Similarities .42** .56** .44** 38.3
Vocabulary .48** .67** .56** 30.1
Digit Span .41** .49** .35** 49.0
NEPSY
Attention/Executive
Tower .27** .17* .06 87.5
Auditory Attention and Response Set .26** .11 .00 100
Visual Attention .35** .32** .24** 43.8
Language

Inspection time and cognitive abilities
52
Measure Corr.
with ITa
Corr.
with ageb
Corr. Age
Cov. inspection timec
% reduction in covariance with age when
inspection time-adjustedd
Phonological Processing .28** .27** .17* 60.4
Speeded Naming .62** .40 .22** 69.8
Comp. of Instructions .37** .206* .05 99.9
Sensorimotor
Fingertip Tapping -.32** -.31** -.23** 45.0
Imitating Hand Positions .18* .17* .12 50.2
Visuomotor Precision .26** .23** .12 72.8
Visuospatial
Design Copying .29** .17* .07 83.0
Arrows .21** .10 .03 91.0
Memory

Inspection time and cognitive abilities
53
Measure Corr.
with ITa
Corr.
with ageb
Corr. Age
Cov. inspection timec
% reduction in covariance with age when
inspection time-adjustedd
Memory for Faces .08 .17* .16 11.4
Memory for Names .41** .40** .29** 47.4
Narrative Memory .29** .18* .07 84.9
Note. a the correlation between inspection time total correct and subtest score. b. the correlation between age at test and subtest score. c.
the partial correlation between age at test and subtest score, covarying inspection time total correct. d. the % reduction in covariance
between age at test and subtest score (b) when the additional variance explained by inspection time score was taken into account. This
was calculated as the difference in variance between b and c, expressed as a % of the variance in b.
* p < .05 ** p < .01

Inspection time and cognitive abilities
54
Table 6. Maximum likelihood estimates of variance components and intra-class correlation coefficients for Birthweight, IT and IQ
measures by zygosity
Trait MZ DZ
Between Within Intra-class
correlation
SE Between Within Intra-class
correlation
SE
Birthweight 138739 130680 .515 .084 133653 87485 .604 .095
FSIQ 1041.7 190.7 .845 .033 326.5 662.8 .330 .133
VIQ 226.8 33.0 .873 .027 44.0 117.4 .273 .138
PIQ 387.3 145.8 .727 .054 174.7 358.7 .328 .133
IT 78.0 77.0 .503 .086 0a 140.5 .000b .149
Note. a and b The zero estimate of between-pair variance of IT for DZ twins was from a model with sex and age fitted. When age was
dropped from the model, the estimates of the between and within variance components and the intra-class correlation were 49.5, 145.2
and .254 respectively. When age was dropped from the model for the MZ, the parameter estimates were 129.4, 76.9 and .627
respectively.

Inspection time and cognitive abilities
55
Table 7. Genetic and environmental contributions (and 95% confidence intervals) to individual differences in WISC raw scores and
inspection time scores.
Trait A C E h2 c e2 2 sex age
% Confidence
Intervals
% Confidence
Intervals
% Confidence
Intervals
esti
mate
Confidence
Intervals
esti
mate
Confidence
Intervals
FSIQ 955 0 190 0.83 0.47, 0.88 0 0, 0.36 0.17 0.12, 0.24 8.5 -2.8, 19.8 1.4 1.2, 1.6
VIQ 184 0 33 0.85 0.49, 0.90 0 0, 0.36 0.15 0.10, 0.22 -1.73 -6.7, 3.2 0.47 0.38, 0.56
PIQ 402 0 147 0.73 0.32, 0.81 0 0, 0.38 0.27 0.19, 0.38 10.2 2.6, 17.8 0.93 0.79, 1.07
IT 69 0 83 0.45 0.12, 0.62 0 0, 0.26 0.55 0.38, 0.75 3.3 -0.63, 7.2 0.28 0.20, 0.35

Inspection time and cognitive abilities
56
r r
Table 8. Estimates of genetic (rg), environmental (re) and phenotypic (rp) correlations (95% confidence intervals) and p values.
Traits rg e p
Correlation Confidence
Interval
p Correlation Confidence
Interval
p Correlation Confidence
Interval
PIQ and VIQ .67 0.54-0.79 p < .01 .08 -0.14-0.30 p = .46 .55 0.44-0.64
IT and FSIQ .48 0.25-0.69 p < .01 .15 -0.08-0.37 p = .20 .34 0.20-0.46
IT and VIQ .28 0.03-0.51 p = .03 .24 0.01-0.45 p = .04 .24 0.10-0.38
IT and PIQ .55 0.30-0.51 p < .01 .06 -0.17-0.29 p = .62 .34 0.21-0.46


