
1
Presented by:
Hanford Site
Waste Management Area C
Performance Assessment
Current Status
Chris Kemp, Deputy Federal Project Director – Office of River Protection Wednesday, January 7, 2015

2
Presentation Outline
Background and Status: Waste Management Area C
(WMA C) Performance Assessment
Selected Topics
− Tank and grout degradation modeling approach
− Evaluating effects of vadose zone heterogeneities on model results

3
Waste Management
Area C
TY Tank FarmTX Tank Farm
T Tank Farm
U Tank Farm
SY Tank Farm
S Tank Farm
SX Tank Farm
BY Tank Farm
B Tank FarmBX Tank Farm
C Tank Farm
AX Tank Farm
A Tank Farm
AP Tank Farm
AZ Tank Farm
AN Tank Farm
AW Tank Farm
AY Tank Farm
TOC-PRES-14-5064 Page 3

4
Waste Management Area C Operational History
100-Series Single-Shell Tanks (SST)
200-Series SSTs
C-301
Catch Tank
Constructed in 1943–1944
Operated from 1946
through mid-1980s storing
and transferring waste
Due to long operational
history, WMA C received
waste generated by
essentially all of the
Hanford Site major
chemical processing
operations

5
Waste Management Area C Operational Period Releases
Summary of Past Releases
C-101 37,000 Gal
C-104 28,000 Gal
C-105 2,000 Gal
C-108 18,000 Gal
C-110 2,000 Gal
C-112 7,000 Gal
UPR-81 36,000 Gal
UPR-82 2,600 Gal
UPR-86 17,000 Gal
Total Releases 149,600 Gal
RPP-ENV-33418, 2014, Hanford C-Farm Leak Assessments Report, Rev. 3.
(RPP = River Protection Project)
TOC-PRES-14-5064 Page 53

6
Waste Management Area C Retrieval Status
Ten SSTs
Retrieval complete
Inventory based on sampled residuals and
final residual volumes
Seven tanks with release rate studies1
Three SSTs
Retrieval complete and sampling underway
Inventory estimated from chemical process
knowledge and final residual volumes
Three SSTs
Retrieval ongoing
Inventory estimated from chemical process
knowledge and estimated volume at closure
1 Pacific Northwest National Laboratory has completed release rate
studies on tank residuals for Tanks C-103, C-106, C-108, C-109,
C-202, C-203, and C-204, and is starting on C-104

7
Residual Inventories of Key COPCs at Closures
Technetium-99 (Ci) Total Uranium (kg) Chromium (kg)
Retrieved SSTs 7.81E-01 4.92E+03 7.26E+01
SSTs Undergoing
Retrieval11.00E+00 1.07E+03 2.62E+01
Ancillary
Equipment5.45E-02 1.08E+03 2.94E+01
Pipelines 4.61E-02 9.12E+02 2.49E+01
Total 1.88E+00 7.98E+03 1.53E+02
1 Inventory estimated using regulatory goal for retrieval of approximately 2,700 gals.
RPP-RPT-42323, 2014, Hanford C-Farm Tank and Ancillary Equipment Residual Waste Inventory Estimates, Rev. 2.
COPC = chemical of potential concern.

8
Hanford (Hf1) gravels
Backfill
Hanford (Hf2) sandsHanford (Hf3) unsaturated gravels
Hanford (Hf3) saturated gravels
RPP-RPT-56356, 2014, Development of Alternative Digital Geologic Models of WMA C, Rev. 0.

9
Complimentary use of Process-Level and System-Level Models
10
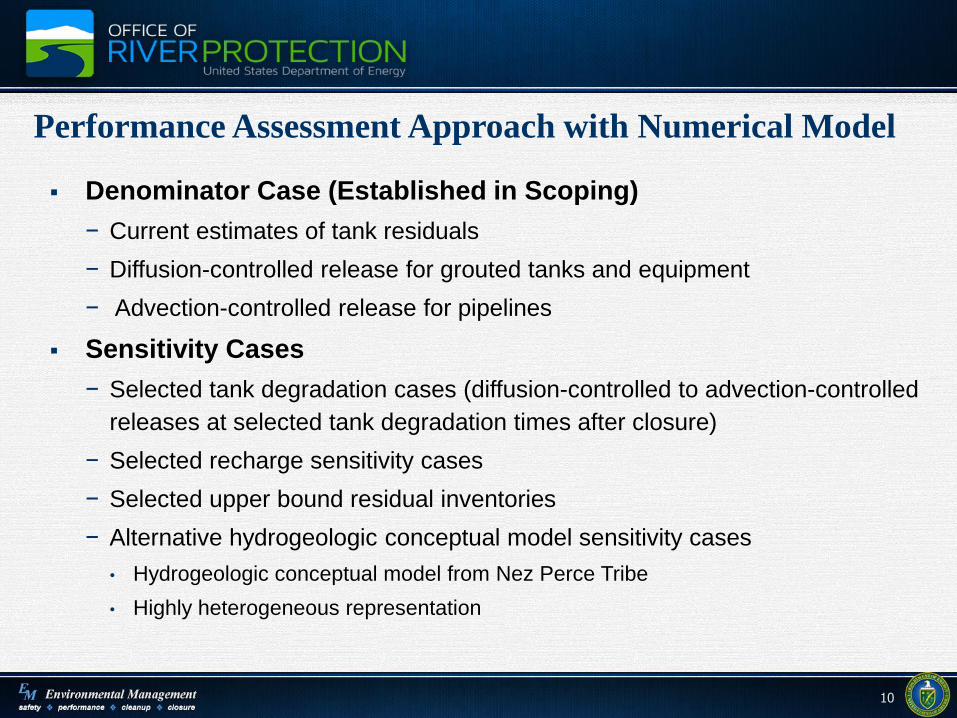
Performance Assessment Approach with Numerical Model
Denominator Case (Established in Scoping)
− Current estimates of tank residuals
− Diffusion-controlled release for grouted tanks and equipment
− Advection-controlled release for pipelines
Sensitivity Cases
− Selected tank degradation cases (diffusion-controlled to advection-controlled
releases at selected tank degradation times after closure)
− Selected recharge sensitivity cases
− Selected upper bound residual inventories
− Alternative hydrogeologic conceptual model sensitivity cases
• Hydrogeologic conceptual model from Nez Perce Tribe
• Highly heterogeneous representation

11
Denominator Case Model Based on STOMP
Unconfined
Aquifer
Vadose
Zone

12
Hydraulic Properties of Waste Management Area C Model
13
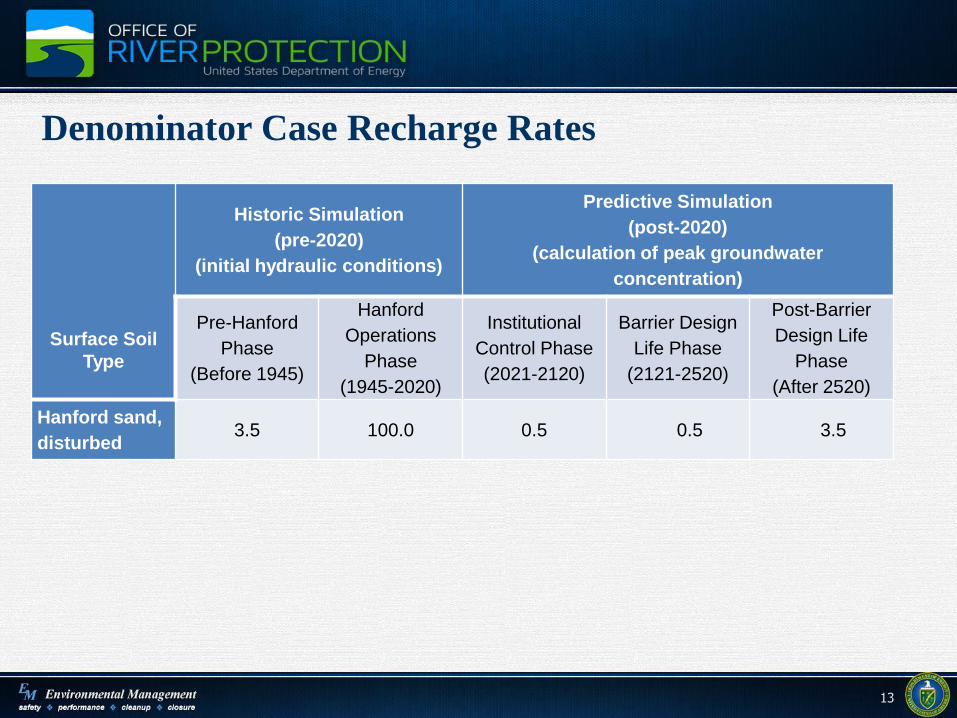
Denominator Case Recharge Rates
Surface Soil
Type
Historic Simulation
(pre-2020)
(initial hydraulic conditions)
Predictive Simulation
(post-2020)
(calculation of peak groundwater
concentration)
Pre-Hanford
Phase
(Before 1945)
Hanford
Operations
Phase
(1945-2020)
Institutional
Control Phase
(2021-2120)
Barrier Design
Life Phase
(2121-2520)
Post-Barrier
Design Life
Phase
(After 2520)
Hanford sand,
disturbed3.5 100.0 0.5 0.5 3.5
14
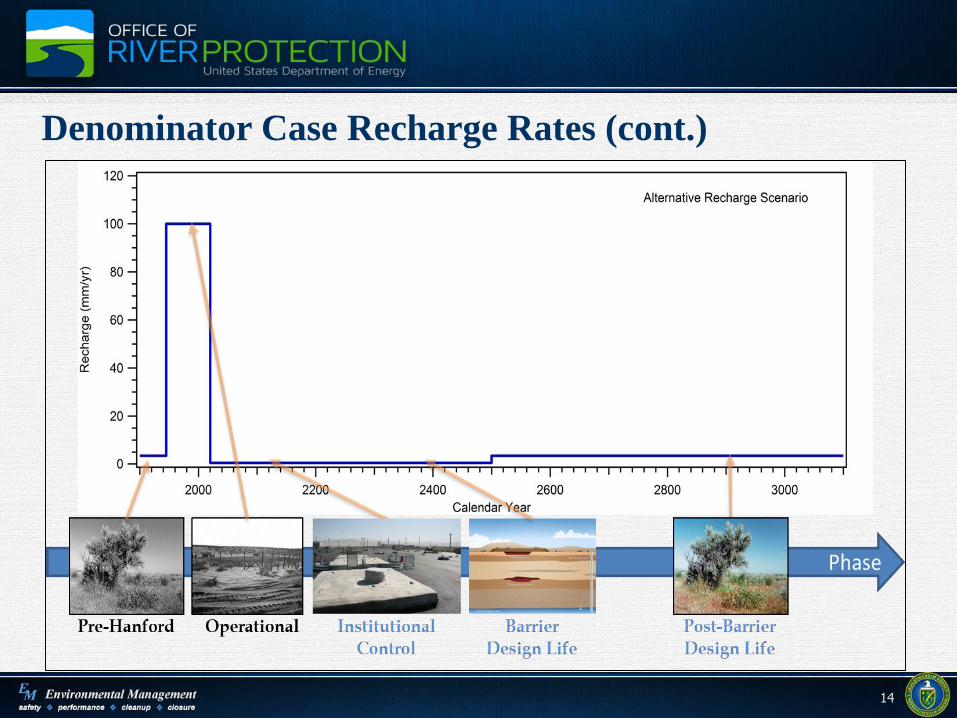
Denominator Case Recharge Rates (cont.)

15
Recharge Rates
Outside of Waste
Management Area C
(Operational Period)3.5 mm/yr
3.5 mm/yr
22 mm/yr
100 mm/yr
100 mm/yr
63 mm/yr
63 mm/yr
22 mm/yr
3.5 mm/yr
3.5 mm/yr
3.5 mm/yr
22 mm/yr
3.5 mm/yr

16
Waste Management
Area C Model
Domain and Points
of Calculation in
Groundwater
Direction of GW Flow
A
A’

17
Unconfined Aquifer Properties
Hydraulic conductivity – 3,000 m/day

18
Basic Modeling Approach
Flow field (and select
transport analysis)
calculated with STOMP− Initial period (tanks intact)
− Late period (tanks
degraded)
Flow field abstracted into
GoldSim system model
System model used for:− Release from residuals
− Contaminant transport
− Exposure-related
calculations

19
System Modeling Implementation Status
Flow abstracted and evaluated in GoldSim-based system model
− For intact and fully degraded tank cases
Working system-level models for all sources
− Twelve 100-series tanks
− Four 200-series tanks
− CR-vault
− C-301 catch tank
− Pipelines

20
System Modeling Implementation Status (cont.)
Waste release models implemented in system-level models
− Diffusion-controlled release
− Advection-controlled release
− Release models from Pacific Northwest National Laboratory waste
release experiments (technetium-99, chromium, and uranium)
Exposure scenarios
− All pathways
− Air pathway/radon transport
− Groundwater protection
− Inadvertent intruder (acute and chronic exposure)

21
Anticipated Performance Assessment Schedule
Complete and submit Performance Assessment, Rev. 0
documentation for tank residual impacts – October 2015
− DOE O 435.1 performance assessment for radiological impacts
− RCRA closure analysis for hazardous chemicals impacts
Conduct Low-Level Waste Facility Federal Review Group and
Washington State Department of Ecology review – October to
December 2015


