ATMOSPHERIC DEPOSITION IN FENNO-SCANDIA:
CHARACTERISTICS AND TRENDS
Arne Semb and Harald Dovland
Norwegian Institute for Air Research P.O. Box 130, N-2001~Lillestr~m, Norway
ABSTRACT. Chemical analyses of daily precipitation samples from "back-
ground" stations in Europe are discussed together with measurements of airborne SO2 and sulphate aerosol, and trends in energy usage and SO2 emissions° Emission sources contributing to the major part of the con-
centrations of sulphate and nitrate in precipitation are mostly 500 to
i000 km from the receptor area. Although there are no general statisti- cally significant trends in the precipitation chemistry data, minor changes point to an effect of reduced SO2 emissions in some areas. The daily data can be used to infer general conclusions with respect to pre- cipitation scavenging efficiency.
1. INTRODUCTION
The purpose of this presentation is to give an overview of the present situation with respect to long-range transport and deposition of S and
N compounds in Northern Europe. The discussion will be based on known emission trends and changes in fossil fuel consumption patterns, and a
record of precipitation chemistry and air quality data for background sampling stations since the early 1970s.
Most of the data have been obtained through the OECD Programme on Long Range Transport of Air Pollutants (OECD, 1977), the Norwegian SNSF- project (Overrein et a~.j1980) and the present Co-operative programme on monitoring and evaluation of long-range transmission of air pollu- tants in Europe (EMEP) organized under the United Economic Commission for Europe.
2. EMISSIONS
The SO2 emissions inventory developed for the OECD Programme was updated in 1978 and is currently being revised. No major change in energy con- sumptions has occurred in this period. The energy crisis in 1973 initi- ally seems to have stabilized the energy consumption. Since about 1978,
however, use of liquid fuel has declined, particularly the use of resi-
Water, Air and Soil Pollution 30 (1986) 5-16. ~) 1986 by D. Reidel Publishing Company.
6 ARNE SEMB and HARALD DOVLAND
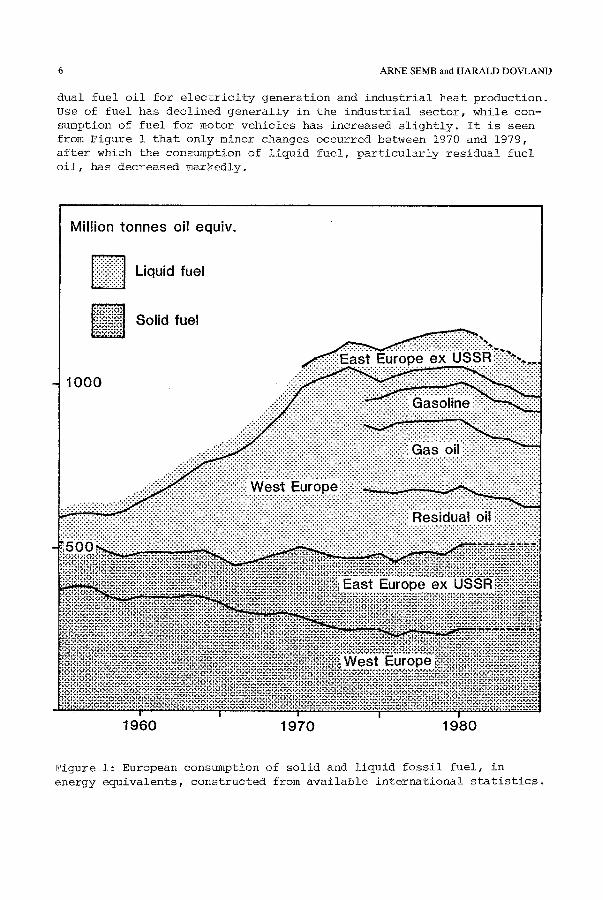
dual fuel oil for electricity generation and industrial heat production.
Use of fuel has declined generally in the industrial sector, while con- sumption of fuel for motor vehicles has increased slightly. It is seen from Figure 1 that only minor changes occurred between 1970 and 1979,
after which the consumption of liquid fuel, particularly residual fuel
oil, has decreased markedly.
Figure i: European consumption of solid and liquid fossil fuel, in
energy equivalents, constructed from available international statistics.
ATMOSPHERIC DEPOSITION IN FENNO-SCANDIA 7
It has been estimated that this changing pattern of oil consumption
resulted in a reduction of S02 emissions from oil combustion of 38%, or
3.8 Mt as S, between 1979 and 1982 (CONCAWE, 1984).
Table I gives figures for total SO2 emissions from some European countries, received from authorities in the different countries.
TABLE I. Sulphur dioxide emissions in 12 countries in north-
western Europe (kg/yr as S).
OECD/ EMEP EMEP A 1973 - 83 Country LRTAP (~ 1978) (~ 1983) (%)
(~ 1973)
Austria 221 215 147 Belgium 449 380 305 Denmark 250 228 152 Finland 274 270 179 France 1616 1800 1945 Federal Rep.
of Germany 1964 1815 1500 Ireland 80 87 70
Netherlands 290 240 170
Norway 91 75 51 Sweden 415 275 156 Switzerland 76 58 45 United Kingdom 2803 2490 1845
12 countries 8579 7933 6565
- 33
- 39
- 39
- 35 + 20
- 24
- 13
- 41
- 44
- 62
- 41
- 34
- 23
Few countries have systematic inventories of NO x emissions, and re- liable estimates are difficult to make in the absence of adequate emis-
sion factor~. This applies both for fossil fueled thermoelectric power
plants and for motor vehicles. A preliminary survey by Semb and Amble
(1981) indicated that the total emission of NO x Mtonne as NO2 as com- pared with 20 Mtonne of SO2-S. This was based on 1975 fuel consumption figures, and did not include emissions of NO from agricultural areas. Extrapolating from field measurements (Slemr and Seiler, 1984) Johansson and Granat, 1984), indicates that this emission source may be approach 1 Mtonne/yr for Europe as a whole. An important point in this respect is the constnnption of N fertilizer in Europe, which was doubled between 1970 and 1980 (United Nations, 1983). This increase in N ferti- lizer consumption, and the resulting agricultural surplus, has probably had an even larger influence on the emissions of ammonia.
8 ARNE SEMB and H A R A L D DOVLAND
3. OBSERVED CONCENTRATIONS AND DEPOSITIONS
3.1 Deposition of acidic substances
The EMEP provides data on precipitation chemistry and/or ambient con-
centrations of SO2 and sulphate aerosol from more than 80 "background stations" in 24 European countries. The objective of EMEP is to provide
governments with information on the deposition and concentration of air pollutants and on the fluxes across boundaries. Thus, the measurements are also important in order to validate the model calculations which provide the integrated information that is required for policy deci- sions.
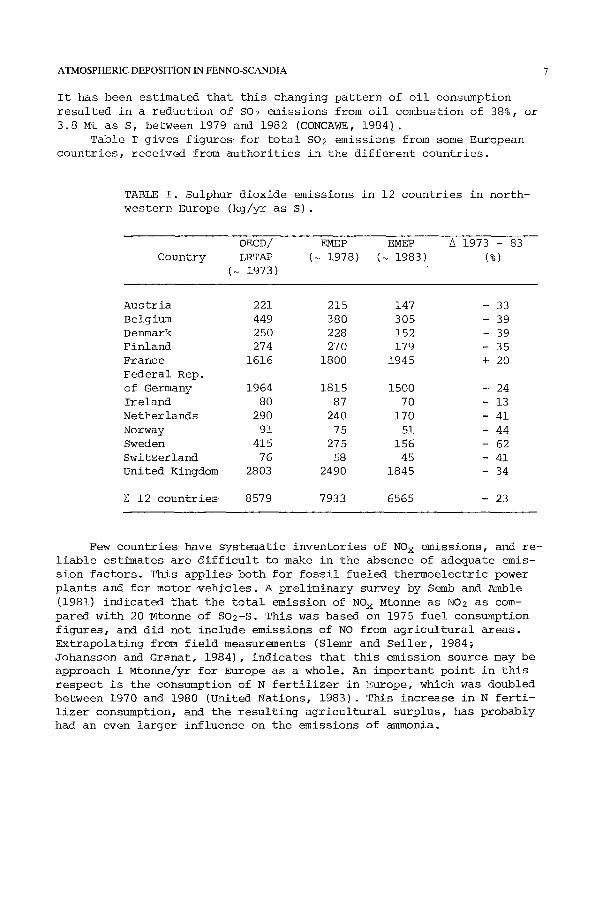
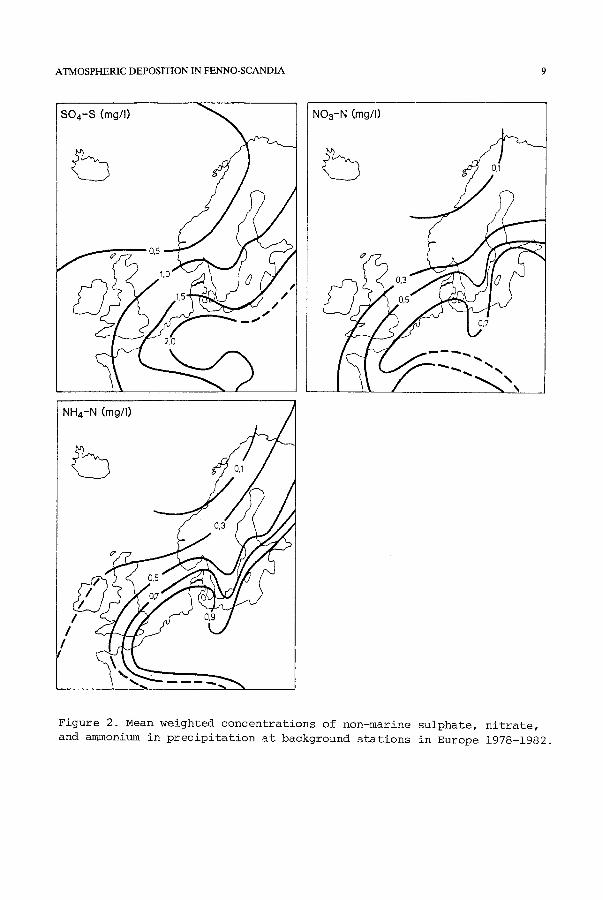
The results from the first 5 yr of the EMEP (1979.1982) have been used to give isolines for mean concentrations of sulphate, nitrate, and ammonium ions in precipitation in Europe. The main features of these maps (Figure 2 are essentially the same, with the highest concentrations
near the largest emissions. The pH in precipitation is largely determined by the balance
between sulphate and nitrate on one side, and ammonium and other soil-
derived components on the other. In general, however, the areas with
the highest emissions of SO2 and NO x also have intensive agricultural production, so that there are only small anomalies in the pH-pattern as compared with the concentration of sulphate or nitrate in precipi-
tation. The deposition of S and N occur as dry deposition or with snow
and rain. The wet deposition processes are the most important in Scandinavia, particularly in areas withheavy precipitation~ where the amounts brought down approach 15 haUl of SO4-S and 7 kg ha- of both NO3-N and NH4-N. This can be rather variable, because of the varia- tions in precipitation amounts with topographic elements. It is our experience, however, that the chemical composition of precipitation is
less variable than the amount of precipitation. Knowledge of the pre-
cipitation pattern can therefore be used to extrapolate from a limited
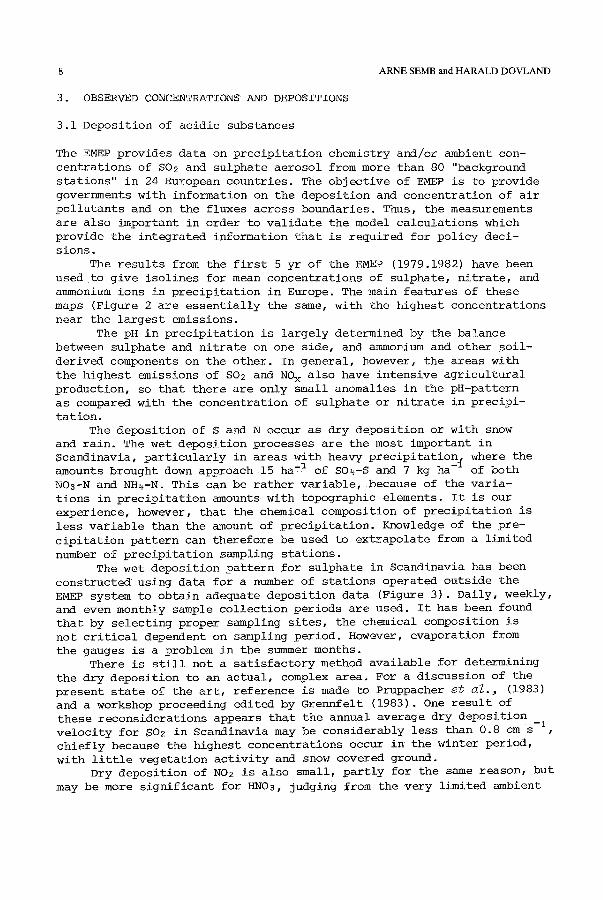
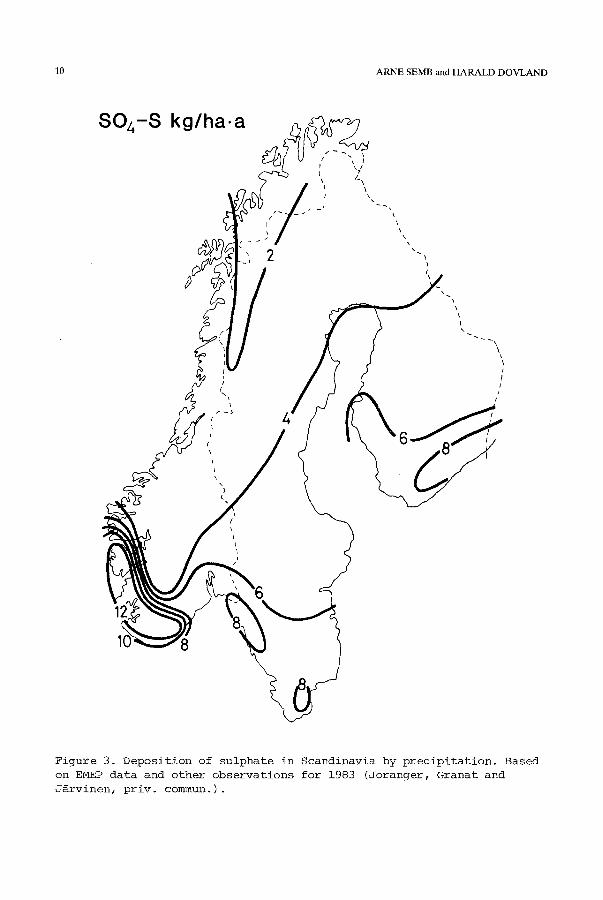
number of precipitation sampling stations. The wet deposition pattern for sulphate in Scandinavia has been
constructed using data for a number of stations operated outside the EMEP system to obtain adequate deposition data (Figure 3). Daily, weekly, and even monthly sample collection periods are used. It has been found that by selecting proper sampling sites, the chemical composition is not critical dependent on sampling period. However, evaporation from the gauges is a problem in the summer months.
There is still not a satisfactory method available for determining the dry deposition to an actual, complex area. For a discussion of the
present state of the art, reference is made to Pruppacher et ~Z.j (1983) and a workshop proceeding edited by Grennfelt (1983). One result of these reconsiderations appears that the annual average dry deposition velocity for SO2 in Scandinavia may be considerably less than 0.8 cm s -l, chiefly because the highest concentrations occur in the winter period,
with little vegetation activity and snow covered ground. Dry deposition of NO2 is also small, partly for the same reason, but
may be more significant for HNO3, judging from the very limited ambient
ATMOSPHERIC DEPOSITION IN FENNO-SCANDIA 9
NI
!
/
Figure 2. Mean weighted concentrations of non.marine sulphate, nitrate, and a[~onium in precipitation at background stations in Europe 1978-1982.
10 ARNE SEMB and HARALD DOVLAND
804-8 kg/ha.a
i
<,
/
I
I L
\
X 1
7 / , , > ' ,.
2
\ \\
I
J L
/ / /
/
12
Figure 3. Deposition of sulphate in Scandinavia by precipitation. Based on EMEP data and other observations for 1983 (Joranger, Granat and J~rvinen, priv. commun.).
ATMOSPHERIC DEPOSITION IN FENNO-SCANDIA 11
air concentration data.
The deposition of aerosols has aroused much controversy because of
the difficulty in determining important parameters such as size distri-
bution, surface area, and the complicated topography of coniferous forest canopies.
Recent studies (Wiman and ~gren, 1985; Wiman, 1985), emphasize the inhomogenity in aerosol deposition. Over-all deposition rates of
sulphate aerosols are still difficult to quantify, but the deposition -I
velocity for a forested area may be in the range 0.i to 0.5 cm s Adding together the dry depositions result in a contribution of S
and N up to 30% of the deposition by precipitation in Scandinavia. Closer to the source areas, dry deposition is much more important, and will be the major deposition process over most of Europe.
3.2 Trends
The record of measurements at EMEP sites are from 1978 to 1984. In time, these are expected to give information of changing ambient concentra-
tions and precipitation chemistry, which may be compared with emission data. For sites in Scandinavia, where weather and atmospheric transport
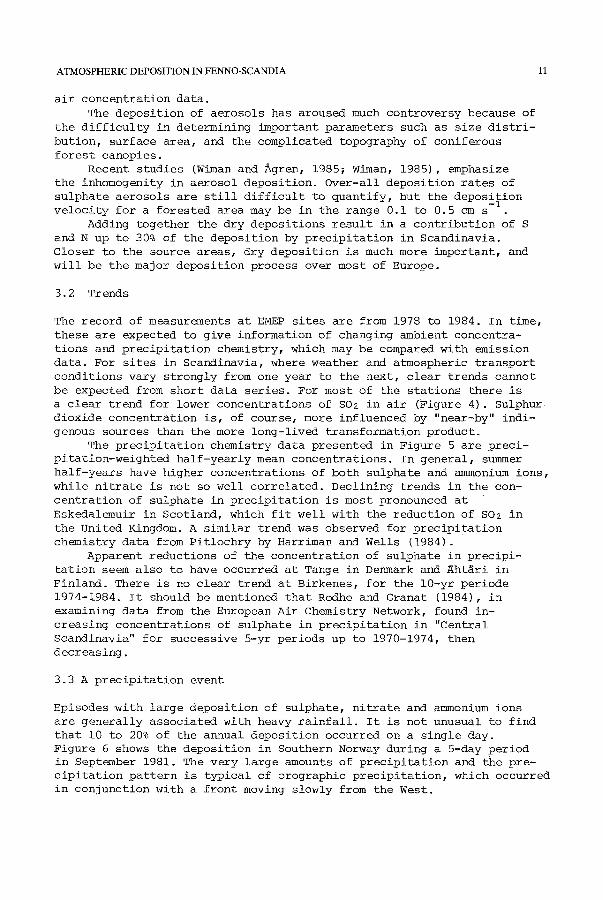
conditions vary strongly from one year to the next, clear trends cannot be expected from short data series. For most of the stations there is a clear trend for lower concentrations of SO2 in air (Figure 4). Sulphur dioxide concentration is, of course, more influenced by "near-by" indi- genous sources than the more long-lived transformation product.
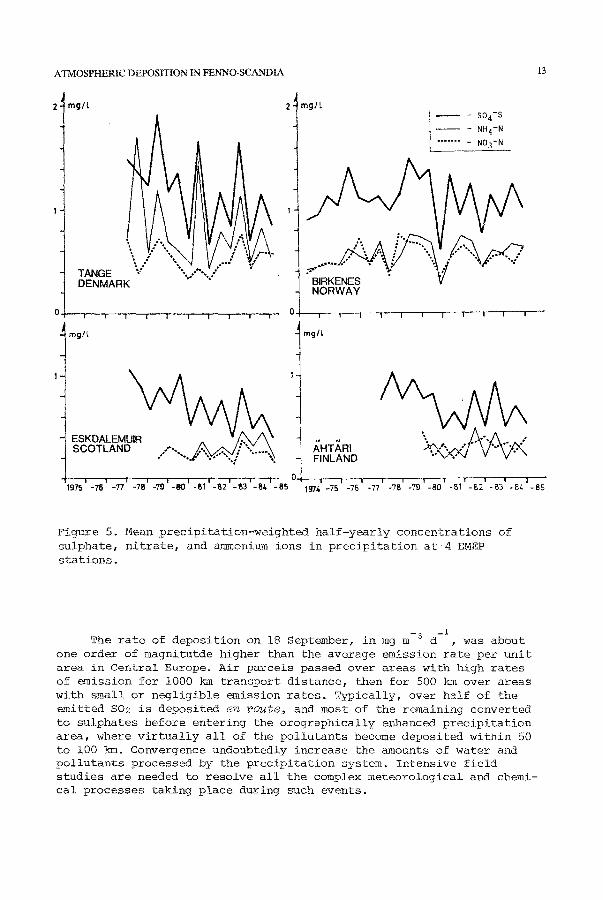
The precipitation chemistry data presented in Figure 5 are preci- pitation-weighted half-yearly mean concentrations. In general, summer half-years have higher concentrations of both sulphate and ammonium ions, while nitrate is not so well correlated. Declining trends in the con- centration of sulphate in precipitation is most pronounced at
Eskedalemuir in Scotland, which fit well with the reduction of SO2 in
the United Kingdom. A similar trend was observed for precipitation chemistry data from Pitlochry by Harriman and Wells (1984).
Apparent reductions of the concentration of sulphate in precipi- tation seem also to have occurred at Tange in Denmark and Aht~ri in
Finland. There is no clear trend at Birkenes, for the 10-yr periode 1974-1984. It should be mentioned that Rodhe and Granat (1984), in examining data from the European Air Chemistry Network, found in- creasing concentrations of sulphate in precipitation in "Central
Scandinavia" for successive 5-yr periods up to 1970-1974, then decreasing.
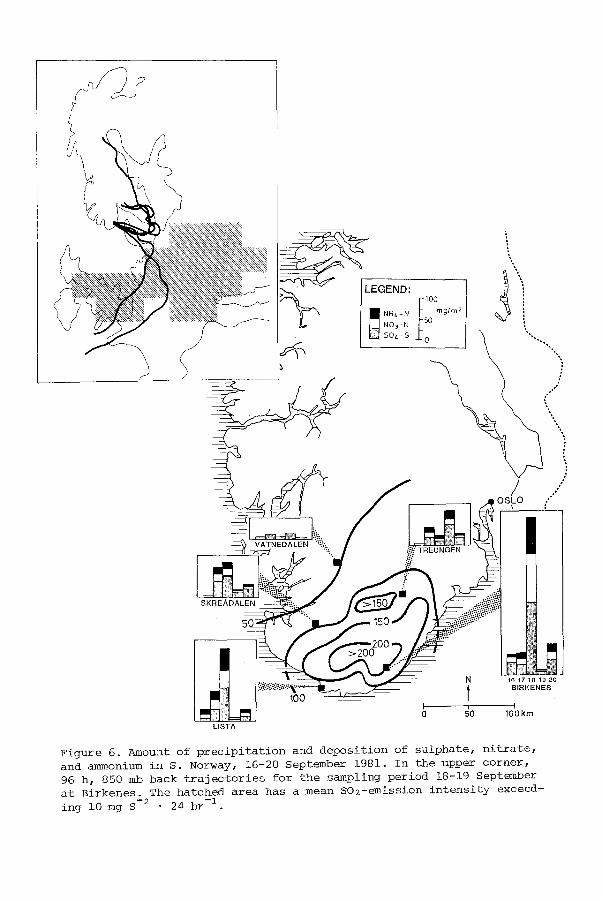
3.3 A precipitation event
Episodes with large deposition of sulphate, nitrate and ammonium ions are generally associated with heavy rainfall. It is not unusual to find that i0 to 20% of the annual deposition occurred on a single day. Figure 6 shows the deposition in Southern Norway during a 5-day period in September 1981. The very large amounts of precipitation and the pre- cipitation pattern is typical of orographic precipitation, which occurred in conjunction with a front moving slowly from the West.
12 ARNE SEMB and HARALD DOVLAND
0
- S O 2 - S
/Jg/m3 - - - SO 4- S . . . . . . . . NO 2 - N
ESKDALEMUIR $ C O T L A N ~
i i I I I I I I i I
jug/m 3
BIRKENES\ . A N O R W A Y ~
i i i I I I i i i I !
/Jg/m 3
AHTARI FINLAND
l , i ~ - 7 9 1 - 8 0 I 1975 -76 -77 -7~ -~II-~2'-~3'-8~I-85'
Figure 4. Mean half-yearly concentrations of sulphur dioxide and sul-
phate in air at 3 EMEP stations.
It is apparent from the precipitation chemistry data that concen-
trations of water-soluble ions are considerably reduced as the air passes through the precipitation field. This is more pronounced for ni-
trate than for the other components, possibly indicating that below- cloud scavenging of gaseous HNO3 may be of some importance. However,
sulphate and ammonium ion concentrations are also considerably reduced, which is not surprising in view of the precipitation intensity and per-
sistence.
ATMOSPHERIC DEPOSITION IN ~NNO-SCANDIA 13
2. rag/{.
TANGE DENMARK
I " I " 1' ' I 1 I I ' I I . . . . I
mg/t
ESKDALEM SCOTLAND
I ! I ' ~ I I I | . . . . . . . . 1 | 1975 -76 -77 -78 -79 -80 -BI -~2-~3' -8L, -85
mg/t
BIRKENES NORWAY
I 1 I " l I I
mglt
- S04-S - NH4-N
....... _ N03-N
I I I I I
, , . . . . , , i i ~ t974' -751 -761 -77 -78 -79 I_80 i -BI -52 -53 -84 -85
Figure 5. Mean precipitation-weighted half-yearly concentrations of
sulphate, nitrate, and ammonium ions in precipitation at 4 EMEP
stations.
-I The rate of deposition on 18 September, in mg m -3 d , was about
one order of magnitutde higher than the average emission rate per unit area in Central Europe. Air parcels passed over areas with high rates of emission for i000 km transport distance, then for 500 km over areas with small or negligible emission rates. Typically, over half of the emitted SO2 is deposited en rou~Gj and most of the remaining converted to sulphates before entering the orographically enhanced precipitation area, where virtually all of the pollutants become deposited within 50 to i00 km. Convergence undoubtedly increase the amounts of water and pollutants processed by the precipitation system. Intensive field studies are needed to resolve all the complex meteorological and chemi- cal processes taking place during such events.
LEGEND: F lOO
\
. j o s p ..
VATNEDALE '~":f.~i:
i o ~o 1ook~ LISTA
Figure 6. Amount of precipitation and deposition of sulphate, nitrate, and am/nonium in S. Norway, 16-20 September 1981. In the upper corner, 96 h, 850 mb back trajectories for the sampling period 18-19 September at Birkenes. The hatched area has a mean SO2-emission intensity exceed-
ing i0 mg S -2 • 24 hr -].
ATMOSPHERIC DEPOSITION IN FENNO-SCANDIA 15
3.4 Photochemical oxidants
During the last decade, photochemical oxidants and their precursors
have received increasing attention, mainly because of their potential
effects on crops and forest (e.g., Grennfelt and Schjoldager, 1984} Eliassen e9 a~.j 1982). The formation of 03 and other photochemical oxidants in the troposphere, involves emissions of NO x and volatile
organic compounds. Although research on photochemical oxidants seems to be at an earlier stage of development than research on acid depo- sition, there is evidence that large-scale formation and transport of
03 is important. Thus, photochemical oxidants is another environmental problem of international dimensions.
Available 03 measurements show that higher concentrations occur episodically in southern Scandinavia. Due to the variable summer climate in northern Europe, the frequency of episodes vary substantially. This
may be illustrated by the occurrence of O3 episodes in southern Norway during the last 8 yr (Table II). An 03 episode has been tentatively defined as a day with 03 concentrations above 120 ~g m -3 over a large
area (i.e. measured at several stations simultaneously) or concentra- tions above 200 ~g m -3 at one station.
TABLE II. Occurrence of 0s episodes in southern Norway (see
text for further explanation[.
Year 1977 1978 1979 1980 1981 1982 1983 1984
Number of
episode 2 3 5 75 17 27 9 5 days
The most pronounced oxidant episodes in southern Scandinavia are assosicated with sunny weather with light winds over northern Europe,
and transport of the polluted air masses towards Scandinavia from the
major source areas in northern Europe.
4. CONCLUDING REMARKS
Measurements of air and precipitation quality at rural sites in northern Europe may vary significantly from one year to another due to meteorolo- gical factors. Trend evaluations based on relatively short data series are therefore uncertain unless meteorological data are taken into account. A simple evaluation of available measurements indicate, however, decrea- sing concentrations of S in air and precipitation at some stations. Less data are available on N compounds, and no conclusion can be drawn, con- tinued measurements are important in order to facilitate future trend anaiysis. A better understanding an dquantitative knowledge of deposi- tion processes is an important task for future research. Such studies will most likely require extensive field studies.
At present, photochemical oxidants seem to play an increasing role
16 ARNE SEMB and HARALD DOVLAND
in relation to large-scale effects on the environment. This should be reflected in our national and international monitoring programmes. As a first approximation, acidic deposition and photochemical oxidants may be considered independently. However, in future scientific studies, it may be of importance to consider both these envionmental problems as an entity.
5. REFERENCES
CONCAWE: 1984, Sulphur dioxide emissions from oil refineries and com- bustion of oil products in western Europe in 1979 and 1982. Report No. 10/84, CONCAWE, den Haag, Netherlands.
Eliassen, A., Hov, @., Isaksen, I.S.A., Saltbones, J. and Stordal, F.: 1982, Journal of Applied Meteorology, 2__1, 1645.
Grennfelt, P. (ed.): 1983, Torrdeposition av svavel- och kv~vef~ro- reningar. SNV PM 1973 Swedish Environment Protection Board, Solna, Sweden.
Grennfelt, P. and Schjoldager, J.: 1984, Ambio, I_3, 61.
Harriman, B. and Wells, D.E.: 1984, Causes and effects of surface water acidification in Scotland. The Institute of Water Pollution Control, Maidstone, Kent, England.
Johansson, C. and Granat, L.: 1984, Tellus, 36B, 26.
OECD: 1977, The OECD Programme on long range transport of air pollutants. Measurements and Findings. OECD, Paris, France.
Overrein, L.N., Seip, H.M. and Tollan, A.: 1980, Acid Precipitation - effects on forest and fish. Final report on the SNSF-project. SNSF- project FR 19/80. Norwegian Institute for Water Research, Oslo.
Pruppacher, H.R., Semonin, R.G. and Slinn, W.G.N.: 1983, Precipitation Scavenging, Dry Deposition and Resuspension. Proceedings of the Fourth International Conference, Santa Monica, California. Elsevier, New York.
Rohde, H. and Granat, L.: 1984, Atmospheric Environment, ~, 2627.
Semb, A. and Amble, E.: 1981, Emission of nitrogen oxides from fossil combustion in Europe. NILU TR 13/81. Norwegian Institute for Air
Research, Lillest~m.
Slemr, F. and Seiler, W.: 1984, J. Atmospheric Chemistry, ~, i.
United Nations: 1983, 1981 Statistical Yearbook. New York.
Wiman, B.L.B.: 1985, Aerosol dynamics in coniferous forests. Department
of Plant Ecology, University of Lund, Sweden.
Wiman, B.L.B. and Agren, G.I.: 1985, Atmospheric Environment, !~, 335.


