Download - ARF ReThink 2015 TV+MOBILE
TV + MOBILE Video: THE Secret Weapon to Strengthen Your Dollars
Sable Mi Senior Director, Research Strategic Planning, BrightRoll @Lutemi
Ronjan Sikdar VP, Digital, Media Analytics, Nielsen @FakeRonjan
MEDIA IS THE EXTENSION OF MAN
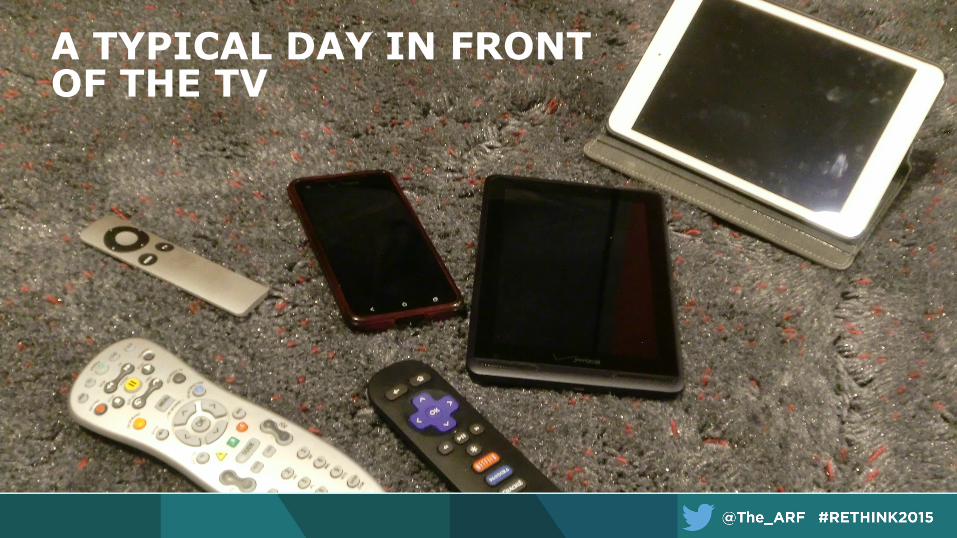
A TYPICAL DAY IN FRONT OF THE TV
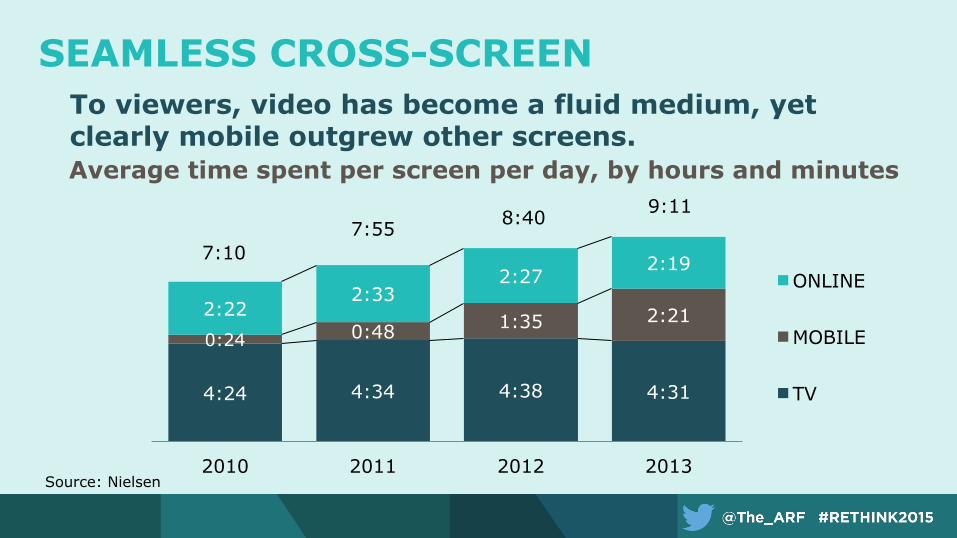
Source: Nielsen
4:24 4:34 4:38 4:31
0:24 0:48 1:35 2:21 2:22 2:33
2:27 2:19
2010 2011 2012 2013
ONLINE
MOBILE
TV
SEAMLESS CROSS-SCREEN To viewers, video has become a fluid medium, yet clearly mobile outgrew other screens. Average time spent per screen per day, by hours and minutes
7:10
9:11 8:40 7:55
0
10
20
30
40
50
60
0 1,000 2,000 3,000 4,000 5,000 6,000 7,000 8,000
REA
CH
(%
)
GRPs
SEPTEMBER 2009
SEPTEMBER 2013
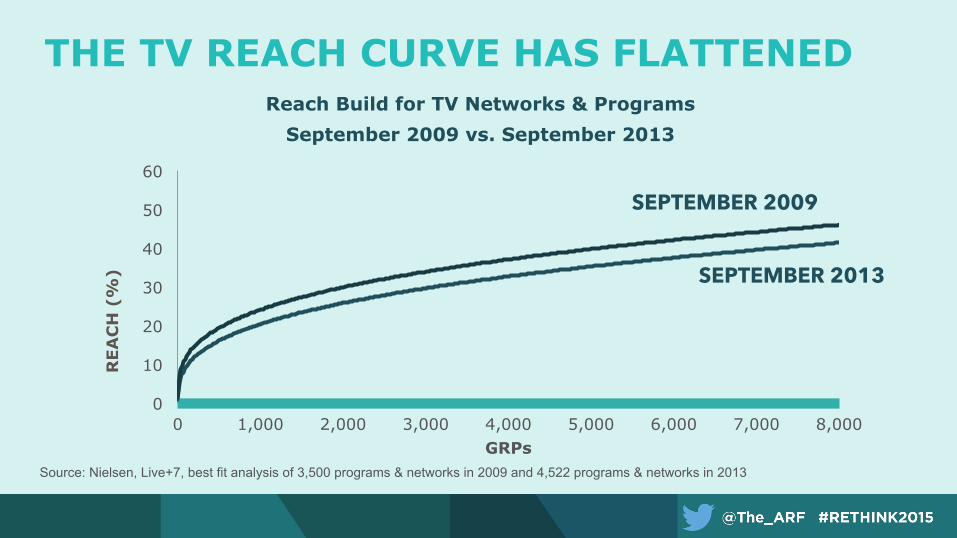
Reach Build for TV Networks & Programs September 2009 vs. September 2013
THE TV REACH CURVE HAS FLATTENED
Source: Nielsen, Live+7, best fit analysis of 3,500 programs & networks in 2009 and 4,522 programs & networks in 2013
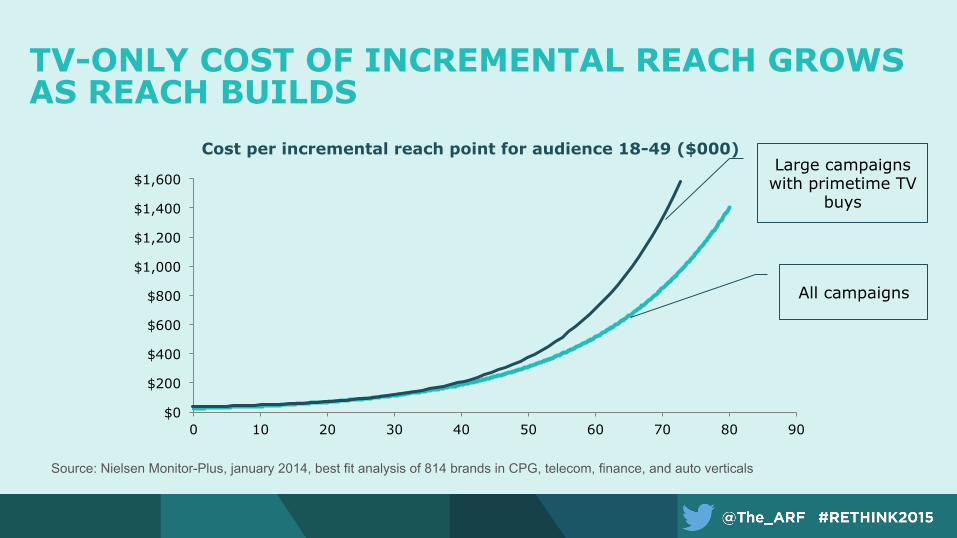
Cost per incremental reach point for audience 18-49 ($000)
TV-ONLY COST OF INCREMENTAL REACH GROWS AS REACH BUILDS
Source: Nielsen Monitor-Plus, january 2014, best fit analysis of 814 brands in CPG, telecom, finance, and auto verticals
$0
$200
$400
$600
$800
$1,000
$1,200
$1,400
$1,600
0 10 20 30 40 50 60 70 80 90
Large campaigns with primetime TV
buys
All campaigns
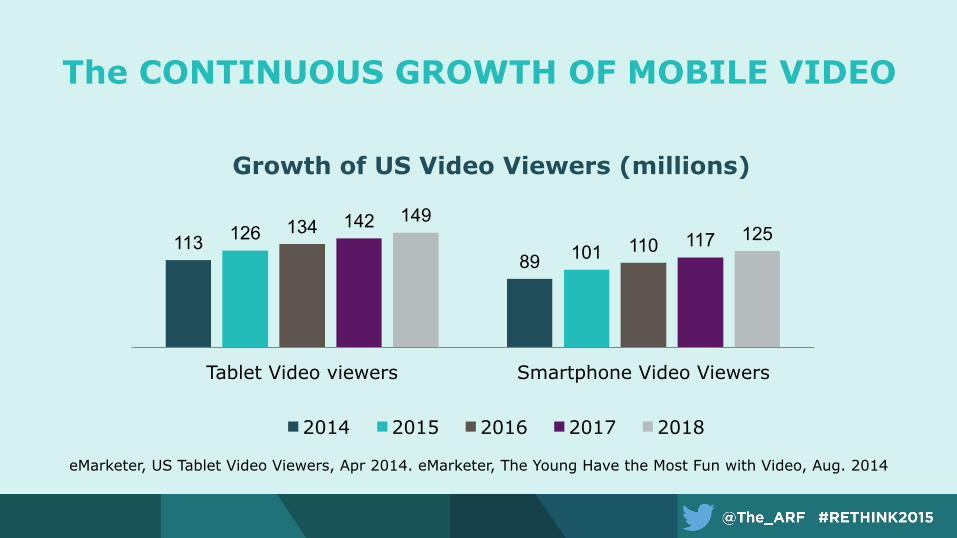
eMarketer, US Tablet Video Viewers, Apr 2014. eMarketer, The Young Have the Most Fun with Video, Aug. 2014
The CONTINUOUS GROWTH OF MOBILE VIDEO
113 89
126 101
134 110
142 117
149 125
Tablet Video viewers Smartphone Video Viewers
Growth of US Video Viewers (millions)
2014 2015 2016 2017 2018
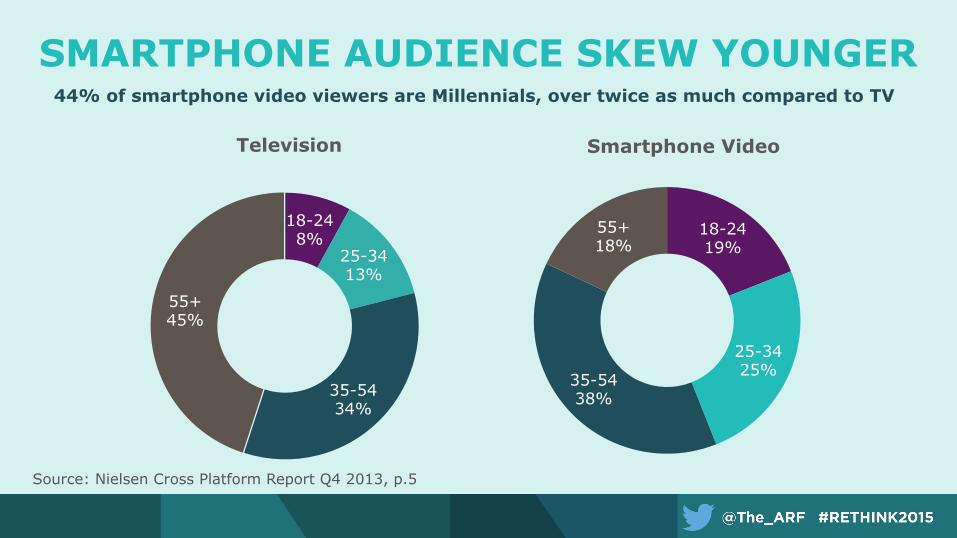
44% of smartphone video viewers are Millennials, over twice as much compared to TV
18-24 8%
25-34 13%
35-54 34%
55+ 45%
Television
18-24 19%
25-34 25% 35-54
38%
55+ 18%
Smartphone Video
Source: Nielsen Cross Platform Report Q4 2013, p.5
SMARTPHONE AUDIENCE SKEW YOUNGER
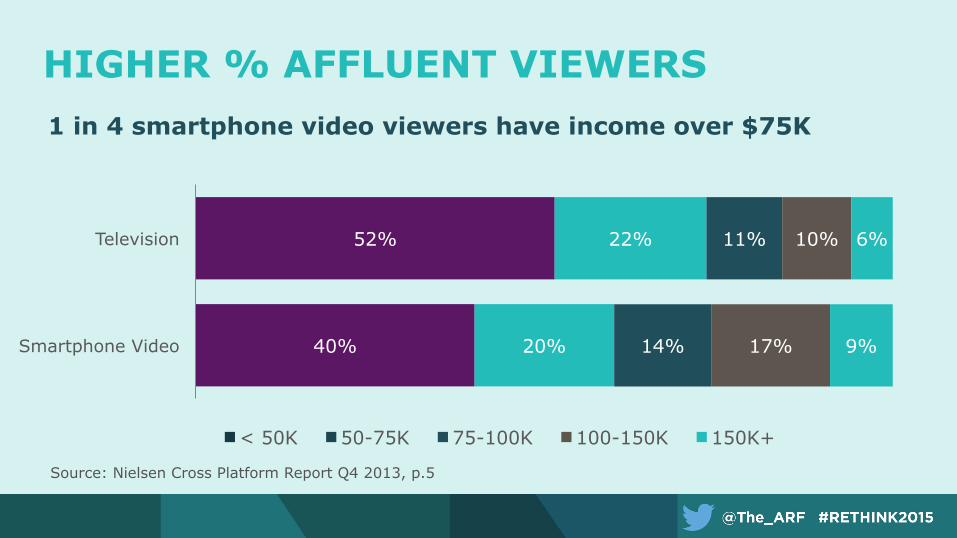
HIGHER % AFFLUENT VIEWERS
40%
52%
20%
22%
14%
11%
17%
10%
9%
6%
Smartphone Video
Television
< 50K 50-75K 75-100K 100-150K 150K+
1 in 4 smartphone video viewers have income over $75K
Source: Nielsen Cross Platform Report Q4 2013, p.5
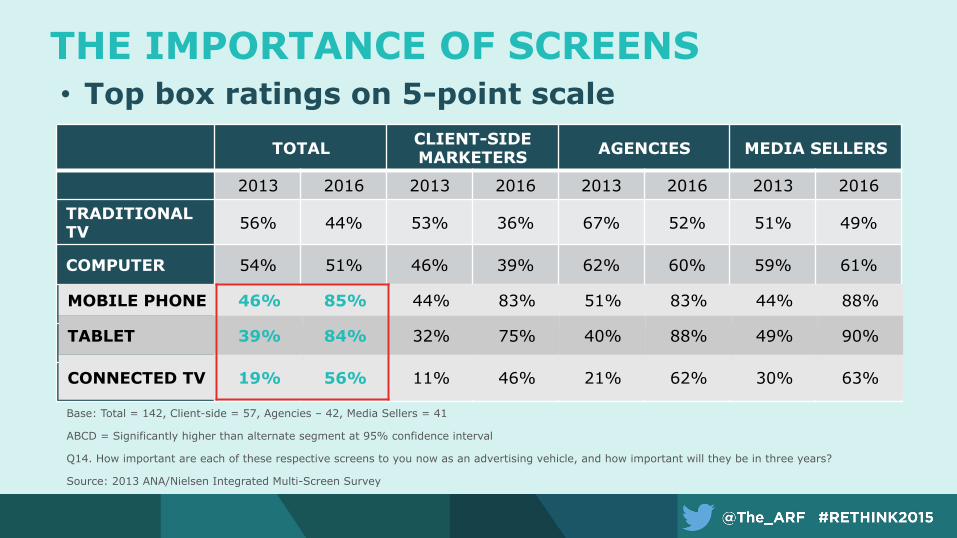
TOTAL CLIENT-SIDE MARKETERS AGENCIES MEDIA SELLERS
2013 2016 2013 2016 2013 2016 2013 2016
TRADITIONAL TV 56% 44% 53% 36% 67% 52% 51% 49%
COMPUTER 54% 51% 46% 39% 62% 60% 59% 61%
MOBILE PHONE 46% 85% 44% 83% 51% 83% 44% 88%
TABLET 39% 84% 32% 75% 40% 88% 49% 90%
CONNECTED TV 19% 56% 11% 46% 21% 62% 30% 63%
THE IMPORTANCE OF SCREENS • Top box ratings on 5-point scale
Base: Total = 142, Client-side = 57, Agencies – 42, Media Sellers = 41
ABCD = Significantly higher than alternate segment at 95% confidence interval
Q14. How important are each of these respective screens to you now as an advertising vehicle, and how important will they be in three years?
Source: 2013 ANA/Nielsen Integrated Multi-Screen Survey
MOBILE PHONE 46% 85% 44% 83% 51% 83% 44% 88%
TABLET 39% 84% 32% 75% 40% 88% 49% 90%
CONNECTED TV 19% 56% 11% 46% 21% 62% 30% 63%

MOBILE TIME SPENT VS. MOBILE AD SPEND
5% 12%
38%
25% 20% 19%
10%
45%
22%
4%
Print Radio TV Internet Mobile
Time Spent
Ad Spend
Source: Advertising spend based on IAB data for full year 2013. Print includes newspaper and magazine. Total dollar spent based on eMarketer August 2013; $27B+ opportunity calculated assuming Mobile ad spend share equal its respective time spent share. Time spent share data based on eMarketer 7/13 (adjusted to exclude outdoors/classified media spend.) Arrows denote Y/Y shift in percent share.
% of Time Spent in Media vs. % of Advertising Spending, USA 2013
~$27B+ Opportunity in USA
INTERNET AD = $43B
MOBILE AD = $7.1B
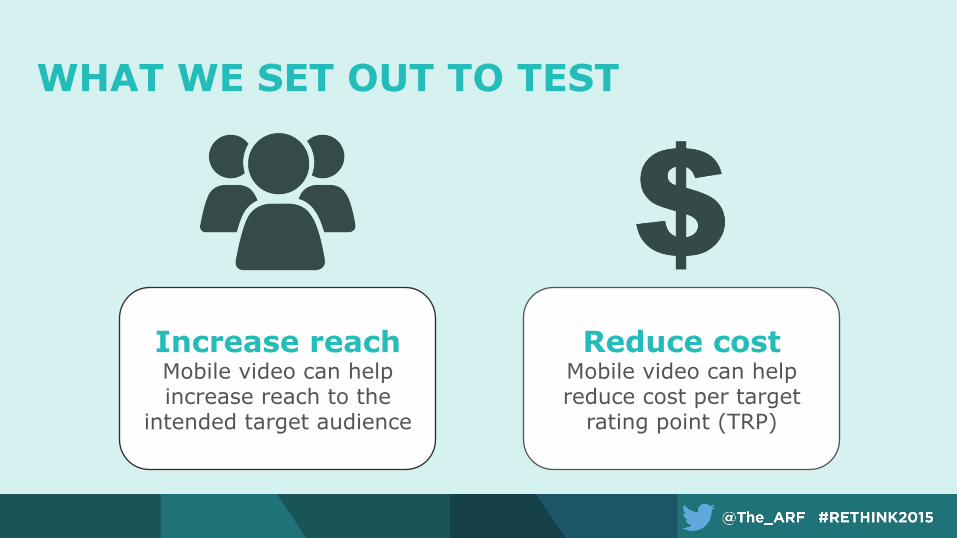
WHAT WE SET OUT TO TEST
Increase reach Mobile video can help increase reach to the
intended target audience
Reduce cost Mobile video can help reduce cost per target
rating point (TRP)
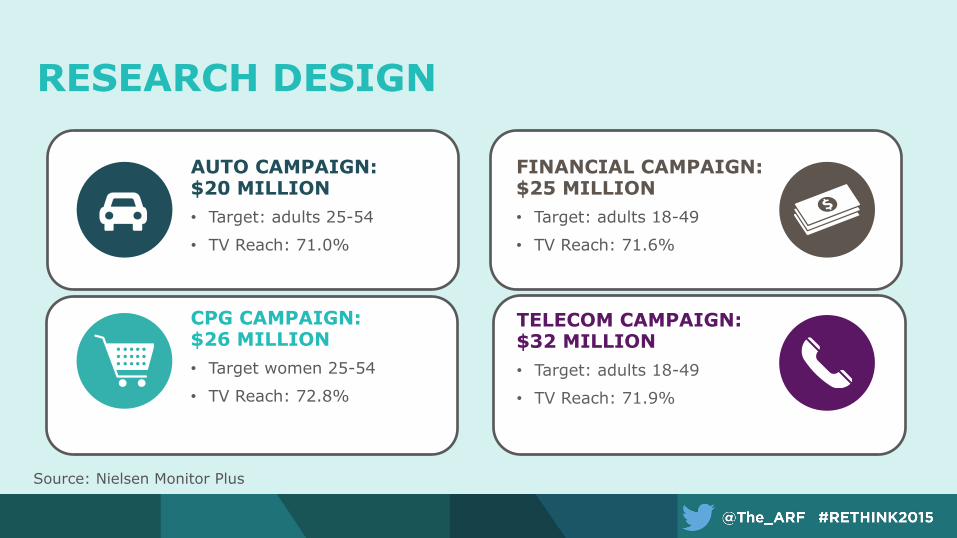
RESEARCH DESIGN
AUTO CAMPAIGN: $20 MILLION • Target: adults 25-54
• TV Reach: 71.0%
FINANCIAL CAMPAIGN: $25 MILLION • Target: adults 18-49
• TV Reach: 71.6%
TELECOM CAMPAIGN: $32 MILLION • Target: adults 18-49
• TV Reach: 71.9%
CPG CAMPAIGN: $26 MILLION • Target women 25-54
• TV Reach: 72.8%
Source: Nielsen Monitor Plus
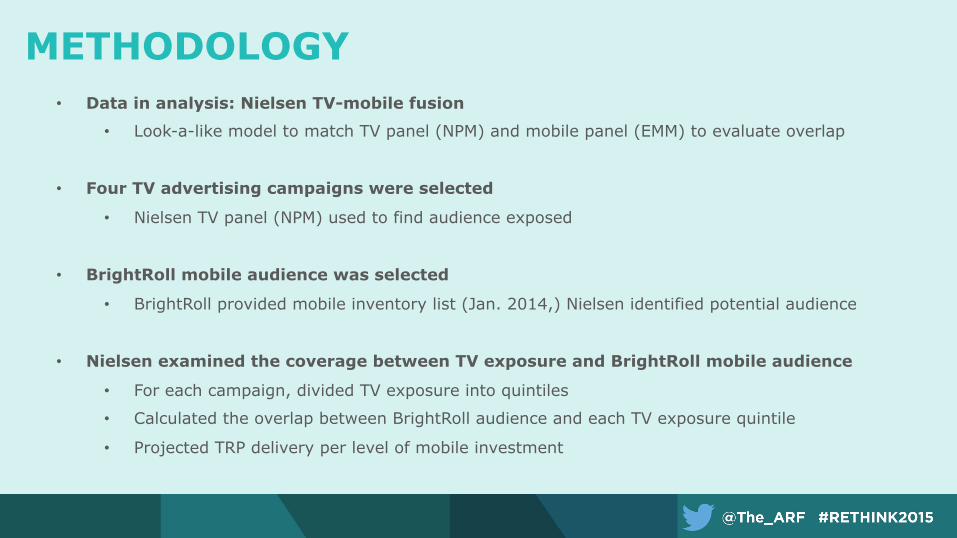
METHODOLOGY • Data in analysis: Nielsen TV-mobile fusion
• Look-a-like model to match TV panel (NPM) and mobile panel (EMM) to evaluate overlap
• Four TV advertising campaigns were selected
• Nielsen TV panel (NPM) used to find audience exposed
• BrightRoll mobile audience was selected
• BrightRoll provided mobile inventory list (Jan. 2014,) Nielsen identified potential audience
• Nielsen examined the coverage between TV exposure and BrightRoll mobile audience
• For each campaign, divided TV exposure into quintiles
• Calculated the overlap between BrightRoll audience and each TV exposure quintile
• Projected TRP delivery per level of mobile investment
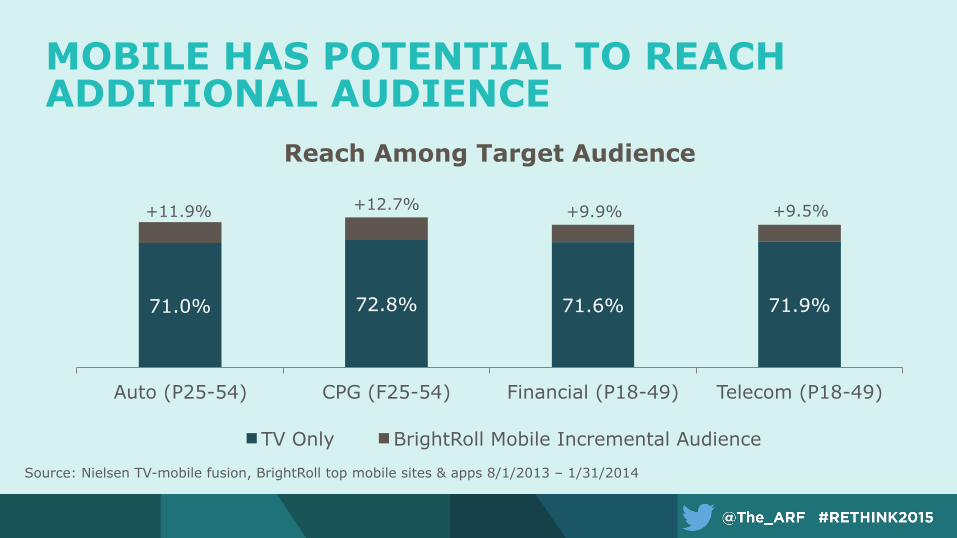
MOBILE HAS POTENTIAL TO REACH ADDITIONAL AUDIENCE
Source: Nielsen TV-mobile fusion, BrightRoll top mobile sites & apps 8/1/2013 – 1/31/2014
71.0% 72.8% 71.6% 71.9%
+11.9% +12.7% +9.9% +9.5%
Auto (P25-54) CPG (F25-54) Financial (P18-49) Telecom (P18-49)
Reach Among Target Audience
TV Only BrightRoll Mobile Incremental Audience
31.1%
15.8%
13.0%
10.3%
7.6%
22.2%
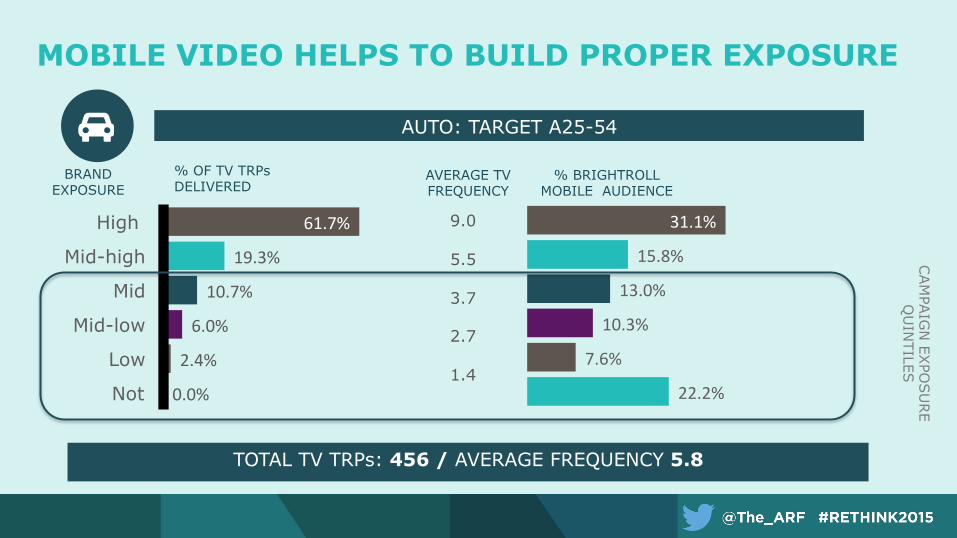
AUTO: TARGET A25-54
CAM
PAIG
N EX
POSU
RE
QU
INTILES
BRAND EXPOSURE
% OF TV TRPs DELIVERED
61.7%
19.3%
10.7%
6.0%
2.4%
0.0%
High
Mid-high
Mid
Mid-low
Low
Not
AVERAGE TV FREQUENCY
% BRIGHTROLL MOBILE AUDIENCE
9.0
5.5
3.7
2.7
1.4
TOTAL TV TRPs: 456 / AVERAGE FREQUENCY 5.8
MOBILE VIDEO HELPS TO BUILD PROPER EXPOSURE
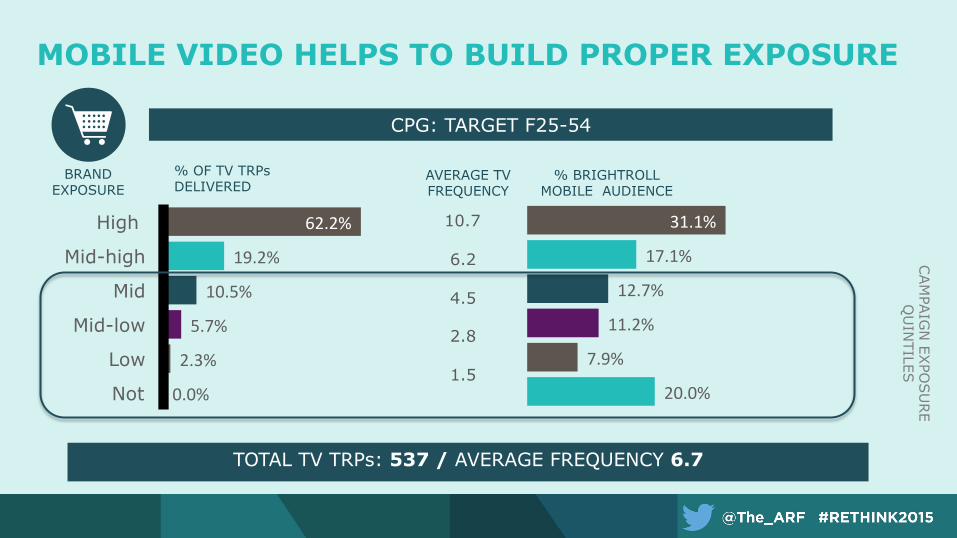
31.1%
17.1%
12.7%
11.2%
7.9%
20.0%
CPG: TARGET F25-54
CAM
PAIG
N EX
POSU
RE
QU
INTILES
BRAND EXPOSURE
% OF TV TRPs DELIVERED
62.2%
19.2%
10.5%
5.7%
2.3%
0.0%
High
Mid-high
Mid
Mid-low
Low
Not
AVERAGE TV FREQUENCY
% BRIGHTROLL MOBILE AUDIENCE
10.7
6.2
4.5
2.8
1.5
TOTAL TV TRPs: 537 / AVERAGE FREQUENCY 6.7
MOBILE VIDEO HELPS TO BUILD PROPER EXPOSURE
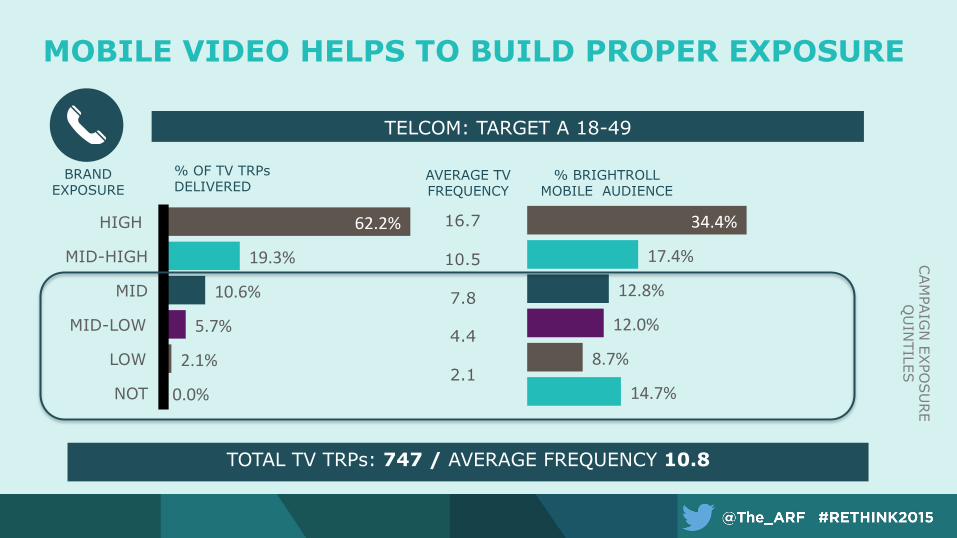
34.4%
17.4%
12.8%
12.0%
8.7%
14.7%
TELCOM: TARGET A 18-49
CAM
PAIG
N EX
POSU
RE
QU
INTILES
BRAND EXPOSURE
% OF TV TRPs DELIVERED
62.2%
19.3%
10.6%
5.7%
2.1%
0.0%
HIGH
MID-HIGH
MID
MID-LOW
LOW
NOT
AVERAGE TV FREQUENCY
% BRIGHTROLL MOBILE AUDIENCE
16.7
10.5
7.8
4.4
2.1
TOTAL TV TRPs: 747 / AVERAGE FREQUENCY 10.8
MOBILE VIDEO HELPS TO BUILD PROPER EXPOSURE
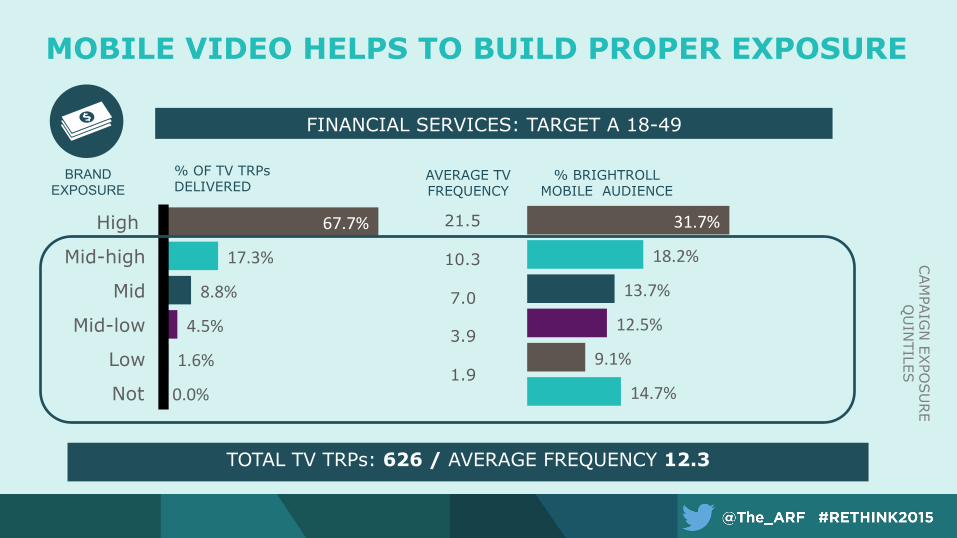
31.7%
18.2%
13.7%
12.5%
9.1%
14.7%
FINANCIAL SERVICES: TARGET A 18-49
CAM
PAIG
N EX
POSU
RE
QU
INTILES
BRAND EXPOSURE
% OF TV TRPs DELIVERED
67.7%
17.3%
8.8%
4.5%
1.6%
0.0%
High
Mid-high
Mid
Mid-low
Low
Not
AVERAGE TV FREQUENCY
% BRIGHTROLL MOBILE AUDIENCE
21.5
10.3
7.0
3.9
1.9
TOTAL TV TRPs: 626 / AVERAGE FREQUENCY 12.3
MOBILE VIDEO HELPS TO BUILD PROPER EXPOSURE
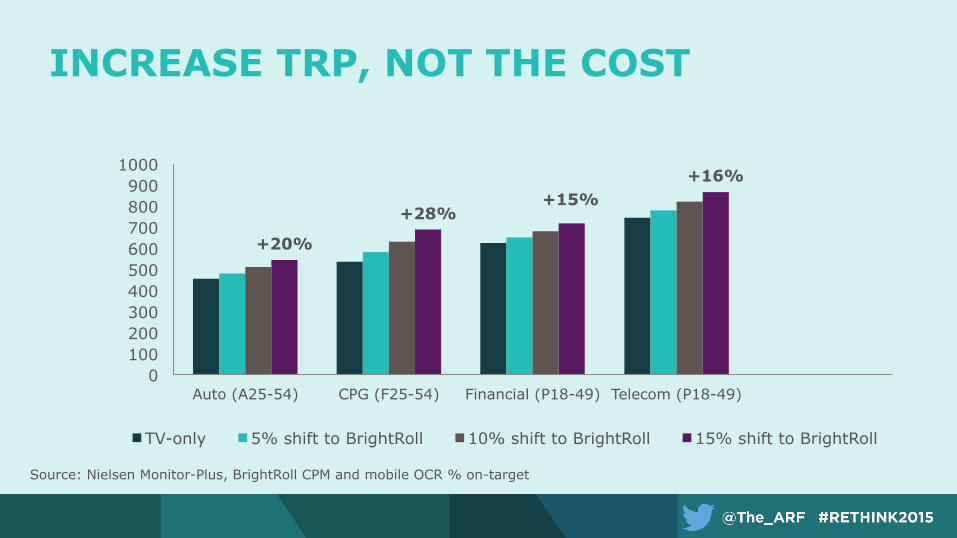
INCREASE TRP, NOT THE COST
+20%
+28% +15%
+16%
0 100 200 300 400 500 600 700 800 900
1000
Auto (A25-54) CPG (F25-54) Financial (P18-49) Telecom (P18-49)
TV-only 5% shift to BrightRoll 10% shift to BrightRoll 15% shift to BrightRoll
Source: Nielsen Monitor-Plus, BrightRoll CPM and mobile OCR % on-target
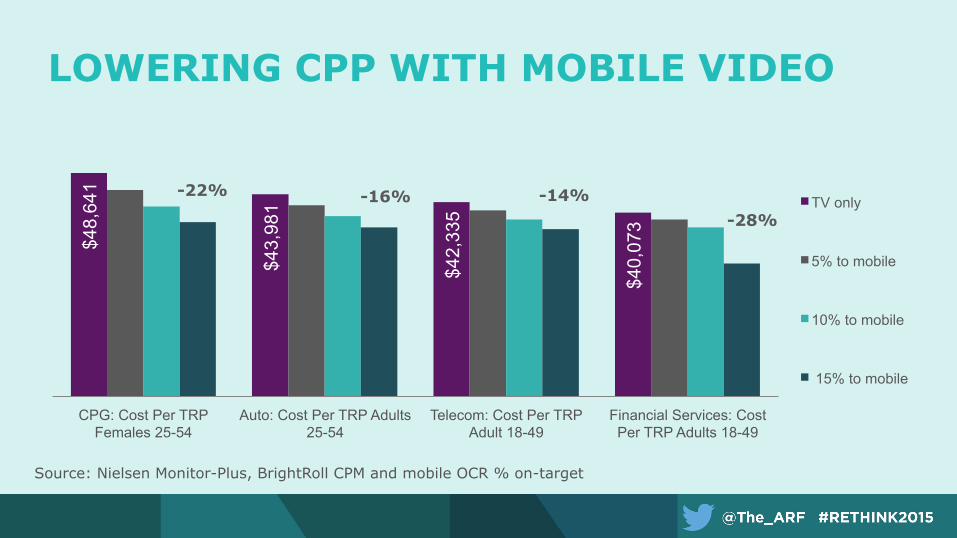
LOWERING CPP WITH MOBILE VIDEO
Source: Nielsen Monitor-Plus, BrightRoll CPM and mobile OCR % on-target
$48,
641
$43,
981
$42,
335
$40,
073
CPG: Cost Per TRP Females 25-54
Auto: Cost Per TRP Adults 25-54
Telecom: Cost Per TRP Adult 18-49
Financial Services: Cost Per TRP Adults 18-49
TV only
5% to mobile
10% to mobile
15% to mobile
-22% -16% -14% -28%
CONCLUSION: MOBILE SOLUTIONS FOR ADVERTISERS
INCREMENTAL REACH
FREQUENCY DISTRIBUTION
COST EFFICIENCY

Q&A


![[ ] ARF slides.ppt](https://cdn.vdocuments.site/doc/165x107/55ca7deabb61eb604e8b456c/-arf-slidesppt.jpg)