
- 1 -
Are New Crop Futures and Option Prices for Corn and Soybeans Biased?
An Updated Appraisal
Katie King and Carl Zulauf *,**
Paper presented at the NCCC-134 Conference on Applied Commodity Price Analysis,
Forecasting, and Market Risk Management St. Louis, Missouri, April 19-20, 2010 Copyright
2010 by Katie King and Carl Zulauf. All rights reserved. Readers may make verbatim copies of
this document for non-commercial purposes by any means, provided that this copyright notice
appears on all such copies.
* Undergraduate Student ([email protected]) and Professor ([email protected])
Department of Agricultural, Environmental, and Development Economics, The Ohio State
University,
** The authors thank Matt Roberts and Scott Irwin for their comments and insights, and Matt
Roberts for his assistance with the data. The authors also thank the College of Food,
Agricultural, and Environmental Sciences at The Ohio State University for their support of
Katie King’s Honors project.

- 2 -
Are New Crop Futures and Option Prices for Corn and Soybeans Biased?
An Updated Appraisal
Practitioner’s Abstract
This study revisits the debate over whether a bias exists in new crop December corn and
November soybeans futures and option prices. Some evidence of bias is found in December corn
futures and December corn puts, but the evidence is substantially muted when transaction costs
are taken into account. The study also examines if information contained in the widely-followed
World Agriculture Supply and Demand Reports (WASDE) issued by the U.S. Department of
Agriculture as well as the implied volatility from new crop corn and soybean options are
incorporated efficiently into December corn and November soybean futures prices. Previous
studies have examined the immediate incorporation of public information into futures prices.
This study examines whether public information is incorporated efficiently from the perspective
of the change in price from the first non-limit close after release of a WASDE report through the
first contract delivery day. The May WASDE is the first calendar year release to include
estimates for the forthcoming new crop year’s supply and demand. For both the December corn
and November soybean regressions, the intercept, change in stocks-to-use ratio between the
current and new crop year reported in the May WASDE, and option market implied volatility are
significantly different than zero at the 95 percent confidence level. The current crop year’s
stocks-to-use ratio is not statistically significant. These results held in general for both the May
and June WASDE releases, although some sensitivity occurred when the May WASDE
observation period was divided in half as well as by observation date. All variables were
statistically insignificant at the July and August WASDE release. These results are not
consistent with market efficiency until the July WASDE is released. However, because there are
only 24 observations, these results fall more into the category of something that needs to be
monitored in the future than as a direct confrontation to the theory of market efficiency.
Keywords: price bias, market efficiency, new crop futures and options, corn, and soybeans
Introduction
The existence of a bias in new crop (December) corn and new crop (November) soybean
futures prices has been addressed by several studies over the last 40 years. Tomek and Gray,
Kenyon et al., and Zulauf and Irwin do not find a bias while Wisner et al. claim that a bias can
be found if you appropriately partition the data. Zulauf and Irwin is the only study that examined
bias in new crop corn and soybeans put option prices. They found no bias using data for the
1985-1997 crop years.
The efficient market hypothesis implies that no price bias should exist (Fama, 1970 and
1991). However, numerous studies have found that markets are not perfectly efficient (for
example, Grossman and Stiglitz, 1980). Because information is costly, markets are slow to
acquire and interpret new information, thus allowing price adjustments to lag and creating
opportunity for biases to exist.
- 3 -
Existence of a price bias in new crop futures has substantial importance not only for
economic theory, but also for farmers, agribusiness managers, and government policy makers.
Considerable evidence exist that U.S. farmers use futures prices to allocate production resources
among crops (for example, Eales et al., 1990). In addition, new crop futures also are used to set
crop insurance coverage levels and premiums, which are subsidized by U.S. taxpayers.
Small data samples of variables with high variability, such as futures prices and options
premiums, have limited statistical power in tests of biasness. Analysts tend to partition the data
into pre-1973 and post-1973 periods due to the increase in price volatility that occurred in the
early 1970s (Kenyon et al.) The longest post-1973 period studied is 1974-1997 by Zulauf and
Irwin. In addition, the behavior of corn and soybeans prices since 2005 adds a new information
dimension to the analysis. For these reasons, it is important to revisit the analysis to see if
findings change with a longer data set.
This study also tests for efficient incorporation of public information into new crop corn
and soybean futures prices. The aforementioned efficient market hypothesis postulates that all
information available to the public at the time a price is quoted should be incorporated into price
(Fama, 1970 and 1991). If an item of information is fully incorporated into the price of product,
then this item of information should not explain subsequent changes in its price. Previous
studies generally find that publically-known information is incorporated efficiently.
This study specifically examines if information contained in the widely-followed World
Agriculture Supply and Demand Reports (WASDE) issued by the U.S. Department of
Agriculture is incorporated efficiently into the December corn and November soybean futures
price. The analysis also examines if implied price volatility derived from the new crop options
contract is incorporated efficiently. Previous studies have examined the immediate incorporation
of public information into futures prices. In contrast, this study examines whether the public
information is incorporated efficiently from the perspective of the change in price from the first
non-limit close after the release of a WASDE report and the first delivery day of the December
corn and November soybean futures contract.
The rest of the article is organized as follows. Existence of routine bias in the December
corn and November soybean futures contracts is examined in the next section, followed by the
examination of routine bias in the new crop option contracts. The method and materials used to
analyze public information efficiency of the new crop December and soybean futures prices is
discussed next, followed by a discussion of the results of this analysis. The paper ends with a
discussion of conclusions and information.
Test for Routine Price Bias: Futures
A routine price bias is the tendency for price on average to increase or decrease. It
should not exist in an informationally efficient market because traders should recognize that the
routine bias exists and trade it away.
To test for a routine bias in December corn and November soybean futures prices, gross
trading return was calculated to a long position. It was calculated as:
- 4 -
(1) [ln(December corn futures priceDecember 1) – ln(December corn futures pricet)]
(2) [ln(November soybean futures priceNovember 1) – ln(November soybean futures pricet)],
where t is a trading day prior to December 1 (November 1), the first day of the contract
expiration month. The futures prices used in this study are from the Chicago Mercantile
Exchange and Barchart.com.
Gross trading returns were calculated for the 249 trading days prior to December 1
(November 1). Two hundred and forty nine days is the usual number of trading days in a
calendar year. Thus, the observation period extends back to approximately December 1
(November 1) of the preceding calendar year. The date could be slightly earlier or later
depending on the exact calendar pattern and the occurrence of unusual events, such as the
September 11, 2001 terror attacks.
A mean percent return was calculated for each of the 249 trading days. The mean return
was tested to determine if it was statistically different than zero. A 95 percent confidence level
was used for the test.
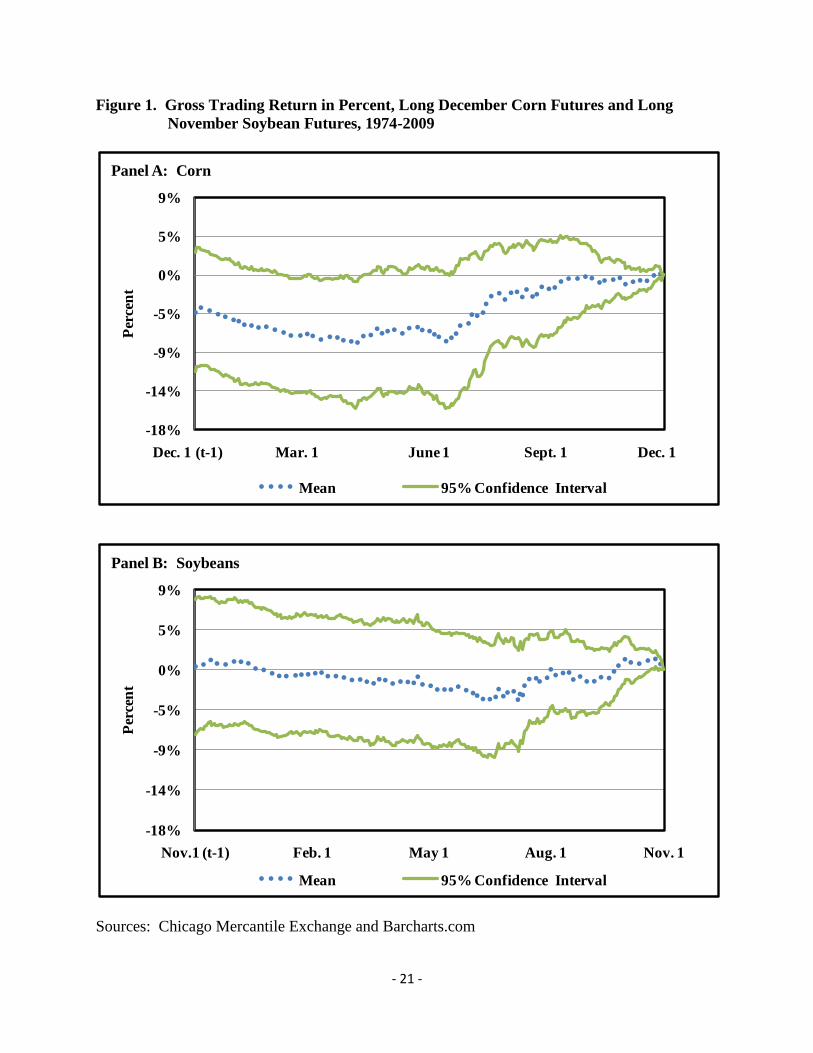
Gross trading returns for the long futures position in the new crop contract are presented
in Figure 1 for corn and soybeans, along with the 95 percent confidence band. The years
included in the observation period are 1974 through 2009. Despite the increase in price level
since 2005 and the high price variability during the 2008 crop year, the evidence suggests that
the first difference of prices has remained stationary. However, the transition phase may still be
in progress. Thus, additional data may lead to a conclusion that the first difference in price
change of new crop corn and soybean futures prices is no longer stationary post 1974.
For December corn futures, 19 percent of the individual trading day had a gross trading
return that was significant at the 95% confidence level (Panel A). Forty five of the forty seven
significant trading days occurred between 158 and 204 trading days prior to December 1. This
period extends from early February through late April. Average gross trading return to a long
position over the 47 trading days that occurred between 158 and 204 trading days prior to
December 1 was -7.2 percent. The negative return implies a bias for prices to decline, and thus
a positive return to a short position.
For soybeans, only six days had a mean percent gross trading return that was significantly
different than zero (Panel B). All occurred during the last seven days of trading. Mean return to
a long position over this period was +0.9 percent.
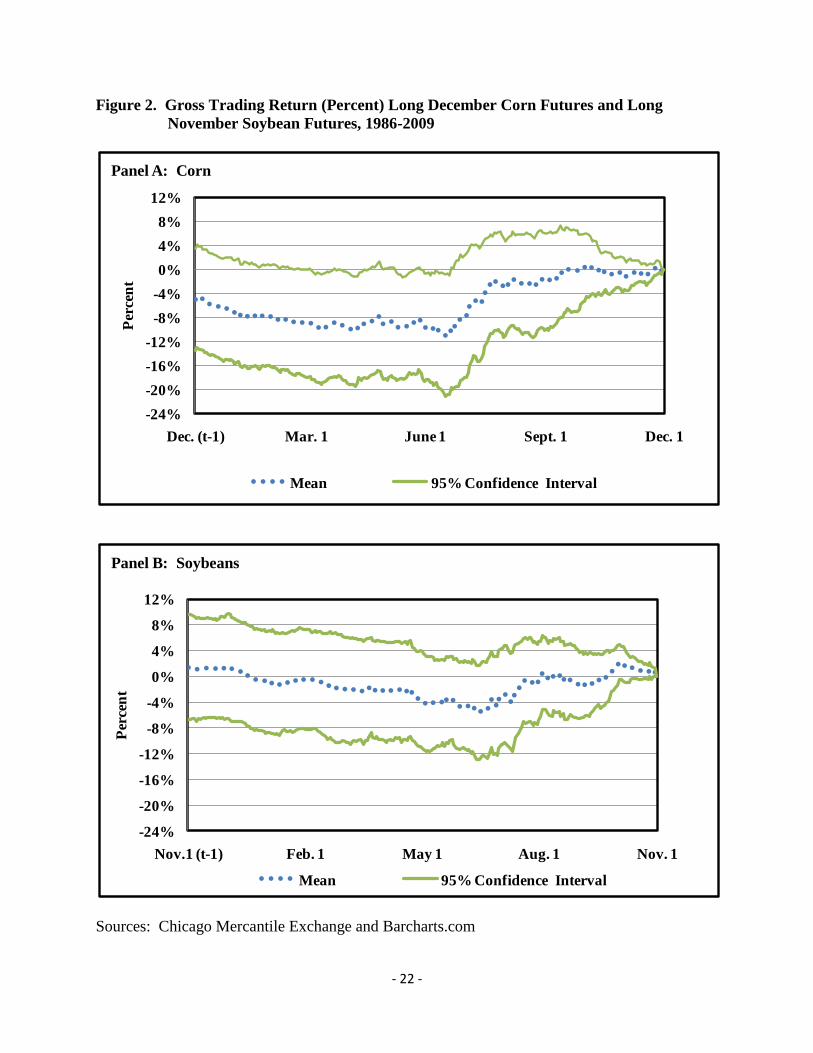
The same general conclusions hold for the period beginning with the 1986 futures
contract expiration for December corn and November soybeans. This contract expiration is the
first one for which option contracts were traded for both corn and soybeans over the year
predating the option expiration date. For December corn, 59 trading days had significant gross
returns. All occurred between 114 and 196 trading days prior to December 1. This period
extends from the mid-February through mid-June. Mean percent return to a long position over
the 83 trading days that occurred between 114 and 196 trading days prior to December 1 was 9.3
percent. In contrast, for soybeans, no trading day had a gross trading return that differed
significantly from zero at the 95 percent confidence level.
- 5 -
In order for trading to be profitable, gross returns must exceed transaction costs. At a
minimum, transaction costs include brokerage fees and liquidity costs. Based on conversations
with brokers, round turn (buy and sell) brokerage fees can vary from $10 via E-trade and other
electronic brokerage venders if the trade is made electronically (not a pit transaction) to as high
as $75. A common range for small traders using personal brokers was $40 to $60.
Liquidity cost is a payment earned by floor traders (scalpers) for filling an order to sell at
the market. Brorsen (1989) and Thompson and Waller (1987) estimated this cost to be one price
tick (1/4 cent per bushel for corn and soybeans futures) for nearby contracts and two price ticks
for more lightly traded contracts that are five or more months from delivery.
Given the large spread in brokerage fees and the range of time to expiration, we chose to
use for illustrative purposes 1.5 cents/bushel for the brokerage and liquidity costs associated with
trading new crop futures contracts. This amount was transformed into a percent using the
average futures settlement price observed over the 1974-2009 period. Liquidity plus brokerage
costs were 0.5 percent for corn and 0.2 percent for soybeans.
Including these transaction costs reduced the share of trading days with a mean return
that differed significantly from zero for corn to four percent over 1974-2009 and 10 percent over
1986-2009. For soybeans, only one trading day had significant trading returns above brokerage
and liquidity costs (it was for the 1974-2009 period). Thus, transaction costs can explain a
significant share of the statistically significant observations. It is also worth noting that, if gross
trading returns were calculated on a cents per bushel basis, they were significantly greater than
zero at the 95% confidence level for no trading day for corn and only six trading days for
soybeans (all in the 1974-2009 observation period).
Test for Routine Price Bias: Option Contracts
To test for routine bias in December corn and November soybean option prices, gross
trading return was calculated to a long position. It was calculated as:
(3) [December corn option premium for day t’s at-the-money strike price on December
option expiration date – December corn option at-the-money premium at close on day t]
(4) [November soybean option premium for day t’s at-the-money strike price on November
option expiration date – November soybean option at-the-money premium on day t],
where t is a trading day prior to December corn (November soybean) option expiration
date. The option premiums used in this study are from the Chicago Mercantile
Exchange and Barchart.com.
The above calculations yield a gross trading return in cents per bushel. The calculation
was made for both a long call and a long put position established on day t and held until option
expiration. Mean gross trading return was calculated for each trading day prior to option
expiration over the 1986 through 2009 observation period. The mean change was tested to
determine if it was statistically different than zero using a 95 percent confidence test level.

- 6 -
Option expiration day varied substantially over the observation period. It ranged from
October 17 through October 27 for the November soybean option contracts and from November
7 through November 26 for the December corn option contracts. Initial date of trading and
degree of trading activity early in the contract’s trading life also varied across the years,
especially during the first few years. Hence, we standardized the number of trading days based
on these two considerations at 234 trading days prior to option expiration date for December
corn and at 238 trading days prior to option expiration date for November soybeans.
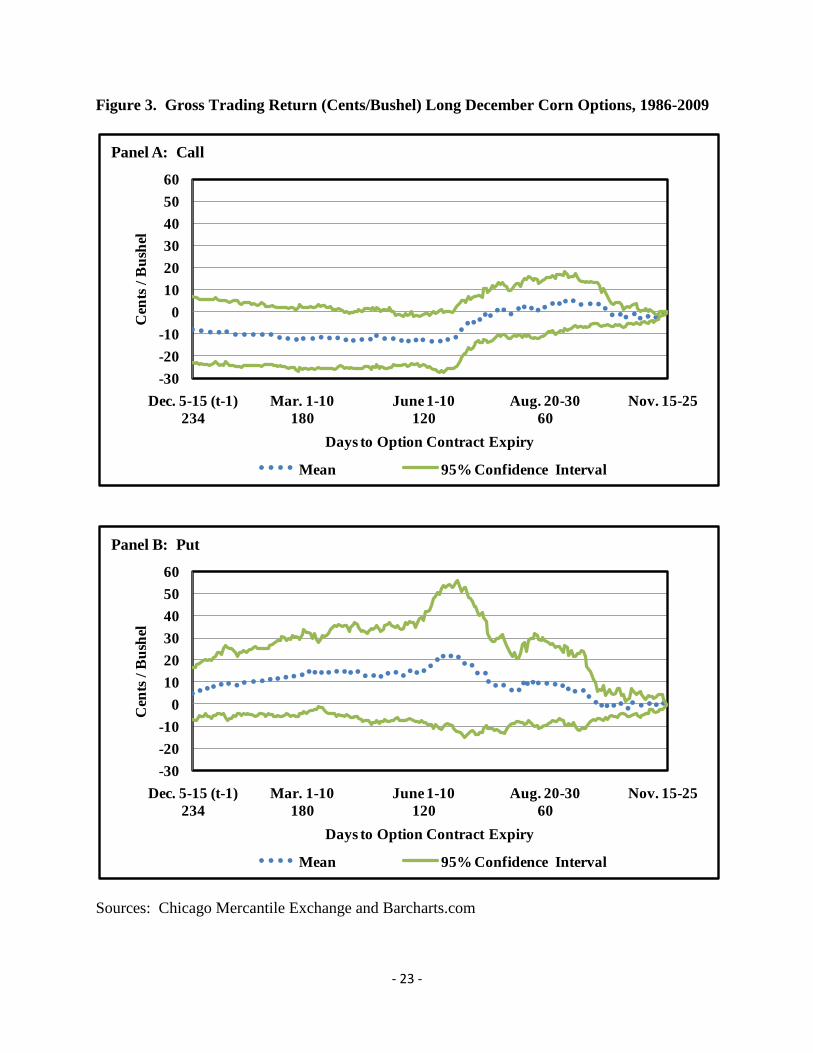
Gross trading returns for a long December corn call and put are presented in Figure 2,
while Figure 3 contains the gross trading returns for a long November soybean call and put. For
the long put position, little evidence of statistically significant trading returns exists. Only one
trading day for corn and soybeans has a statistically significant return at the 95 percent
confidence level (soybean, 5 days prior to expiration). Similarly, only one trading day has a
statistically significant return to a long call position in soybeans (next to last day before
expiration).
For the long corn call, 33 trading days had a significant trading return at the 95 percent
confidence level. Thirty of these trading days fell between 106 and 159 trading days prior to the
December option expiration date. Mean return was -13 cents per bushel over the 54 trading days
that fell between 106 and 159 trading days prior to the December option expiration date,
implying that the long call had a statistically significant loss.
These results suggest that additional analysis might focus on short December calls.
However, as with futures, including brokerage and liquidity costs substantially decrease the
number of statistically significant returns. Transaction costs of 2.2 cents per bushel would have
been sufficient to reduce statistical confidence below the 95 percent test level for all
observations. Such a level of transaction cost is not unreasonable given the relatively low
liquidity that can exist in option contracts until the contract becomes the nearby contract.
Public Information Efficiency Test – Procedures and Data
The efficient market hypothesis is the most commonly-accepted model of price behavior
in speculative markets. Among its implication is that information known by the public should
not be able to explain changes in price that occur after the information becomes known to the
public. Results from previous studies of the incorporation of new information contained in
reports released by U.S. government agencies are generally consistent with the efficient market
hypothesis (for example, French et al., Colling and Irwin, and Garcia, et al.). These studies
focused on the immediate incorporation of new information contained in the public reports over
the first few trading days after the release of the public report. This study investigates a related,
but different issue regarding the incorporation of public information. Specifically, we investigate
whether information contained in the widely-followed World Agricultural Supply and Demand
Estimates (WASDE) released monthly by the U.S. Department of Agriculture can explain
changes in December corn futures and November soybean futures price observed between the
first non-limit close after the release of WASDE and December 1 (November 1), the first trading
day in the contract expiration month. One motivation for this investigation is the idea that new
crop December corn and November soybean futures prices have a conditional bias toward a price

- 7 -
decline, with the condition being whether or not the current crop year is a short crop year in
terms of production. This condition falls into the category of public information.
A contemporaneous data set is created at the first non-limit close of the December corn
and November soybean futures contract after the release of a WASDE report. The ratio of
stocks-to-use is a summary measure of the relative availability of supply to satisfy demand. This
variable is a more encompassing measure of relative scarcity than the dummy variable associated
with whether or not the crop year is a short crop year. In addition, using the ratio of stocks to use
means that the difficulty of defining short crop years is avoided. Thus, the analysis includes the
stocks-to-use ratio for corn (soybeans) reported for the current crop year in WASDE. Because
futures markets are forward looking, the analysis also includes the change in the stocks-to-use
ratio between the current crop year and the forthcoming new crop year reported in WASDE.
Thus, the analysis includes a measure of the relative scarcity of supply in the current crop year
and a measure of expected change in the relative scarcity of supply between the current and
forthcoming crop year.
A fundamental principle of finance is that return and risk are inversely related. Since the
return to futures trading involves the change in price and prices on speculative markets are
volatile, it is reasonable to ask whether an empirical relationship exists between changes in
futures prices (i.e., return to futures trading) and the volatility at the time that the trade is placed.
Thus, to test whether the degree of price volatility is related to the subsequent change in futures
prices, the price volatility implied by the December corn (November soybean) option markets as
of the first non-limit close after the release of WASDE is included in the analysis. The implied
volatility is calculated using Black’s option model. Sources of the implied volatility are
Barchart.com and the author’s original calculations using data from the Chicago Mercantile
Exchange.
The first estimate of the forthcoming new crop year’s supply and demand is published in
the May WASDE. Information about new crop year supply and demand appears in subsequent
WASDE reports through August, the last old crop month for corn and soybeans. Therefore, one
analytical approach is to pool all WASDE reports from May through and August, and then to
estimate a fixed effects model with month of release and year dummy variables. However, the
overlapping sample that results from this approach will induce autocorrelation into the error
terms. Newey West can be used to correct for this autocorrelation. But Newey West does not
have stable properties in small samples. The observation period for this analysis is 1986-2009,
which is the period over which option trading exist. Because of this concern, we decided on the
conservative approach of estimating the regression equation only for the WASDE reports
released in May. In addition, we conducted two types of sensitivity tests: dividing the May data
in half and doing the analysis for the June WASDE release.
To summarize this discussion, the following regression equation is estimated to test for
public information efficiency in the new crop December corn and November soybean futures
contract:
(5) [ln(new crop futures pricet+n) – ln(new crop futures pricet) = f[stocks-to-use ratiocjt,
(stocks-to-use ratiockt - stocks-to-use ratiocjt), implied option volatilityt)],

- 8 -
where t+n is December 1 for corn and November 1 for soybeans, t is the date of the first
non-limit close of the December corn (November soybean) futures price after the release
of the May WASDE, c is the crop (corn or soybeans), j is the current crop year, and k is
the forthcoming new crop year.
Public Information Efficiency Test – Results
The mean and standard deviation of the regression variables are presented in Table 1.
Both the December corn and November soybean contract declined on average between the May
WASDE and first trading day of the contract expiration month over the 1986-2009 observation
period. However, the average percent decline for corn was nearly three times larger than the
average percent decline for soybeans. However, the standard deviation of the ln change in
futures price was approximately the same for corn and soybeans. The other major differences
are that corn’s average stocks-to-use ratio is approximately 50 percent higher than soybean’s
average stocks-to-use ratio reported in the May WASDE, and that the standard deviation of
corn’s stocks-to-use ratio is more than twice as large as the standard deviation of the soybean’s
stocks-to-use ratio.
For both the December corn and November soybean regressions, the intercept, change in
stocks-to-use ratio reported in WASDE, and option market implied volatility are significantly
different than zero at the 95 percent confidence level (see Tables 2 and 3). The stocks-to-use
variable is not statistically significant. Both equations are also statistically significant at the 95
percent confidence level, with an adjusted R2 of 0.46 for corn and 0.24 for soybeans.
The estimated intercept term is positive in both equations. Since the dependent variable
is measured in percent change, the intercept coefficient implies that, for example, on average the
December corn futures price will increase by 0.51 percentage point between the release of the
May WASDE and December 1.
The estimated coefficient on the change in stocks-to-use is negative in both equations.
Again, using corn as an example, each one percentage point increase in the stocks-to-use ratio
from the current crop year to the next new crop year reported in the May WASDE implies that
the December corn futures price will decrease by 2.42 percentage points after the release of the
May WASDE. The corresponding decrease for November soybean futures price is 1.57
percentage points after the release of the May WASDE.
The estimated coefficient on the implied option volatility is negative in both equations.
For corn, each one percentage point increase in the implied option volatility derived at the first
non-limit close after the May WASDE release implies that the December corn futures price will
subsequently decrease by 0.02 percentage points through December 1. The corresponding
decrease for November soybean futures price is 0.01 percentage points after the release of the
May WASDE.
To test the sensitivity of the results, the observation period was split in half: 1986-1997
and 1998-2009. In each subperiod, the change in stocks-to-use variable is significant at the 95%
confidence level and has a negative sign. In contrast, the intercept and implied option volatility

- 9 -
variable are significant in only the earlier subperiod for corn and the later subperiod for
soybeans.
As another sensitivity test, the same regression equation was analyzed at 5 time different
times: one day after the release date of the May WASDE, one week after the release date of the
May WASDE, as well as the release dates of the June, July, and August WASDEs. The specific
observation was keyed to the first non-limit close after the release of the WASDE report. Thus,
for example, the date that was one day after the release date of the May WASDE was one the
next close after the first non-limit close after the release of the WASDE report.
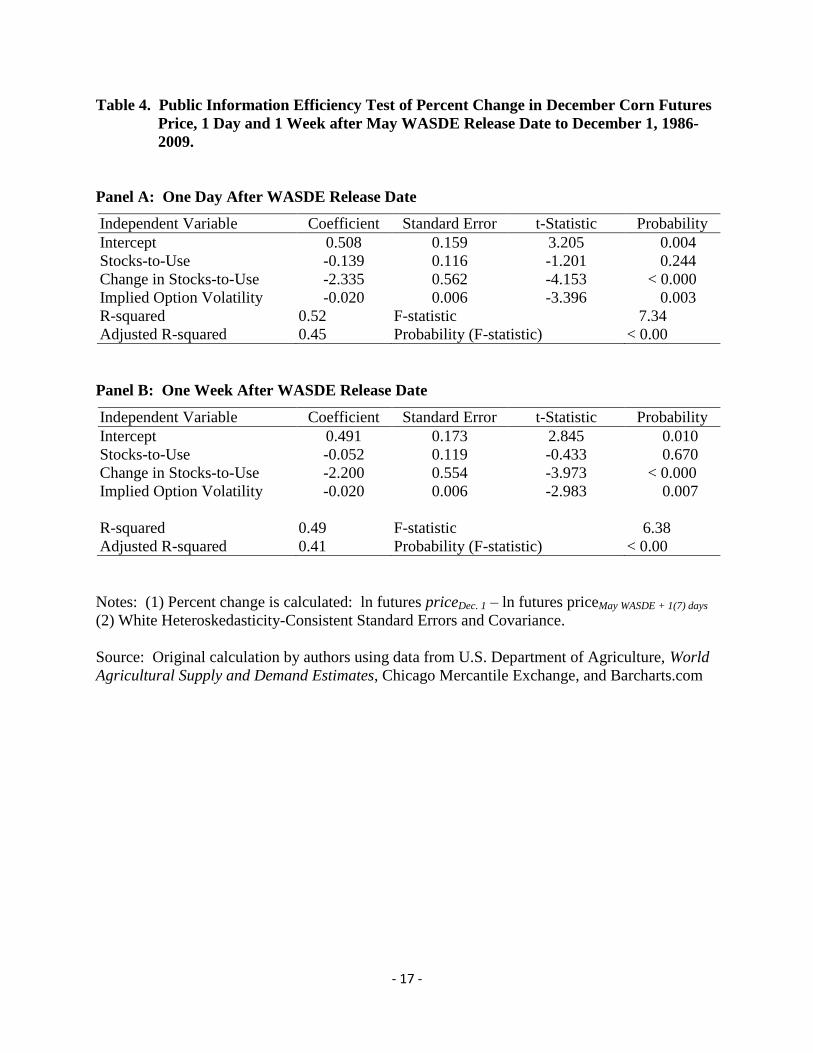
For corn, the intercept, change in stocks-to-use, and implied option volatility remained
statistically significant at the 95 percent confidence level and had the same sign as in the May
WASDE results for the regressions analyzed at one day and one week after the release date of
the May WASDE, as well as for the June WASDE (see Tables 4 and 5). All of the variables
were statistically insignificant at the 95% confidence level for the regressions at the July and
August WASDE release dates.
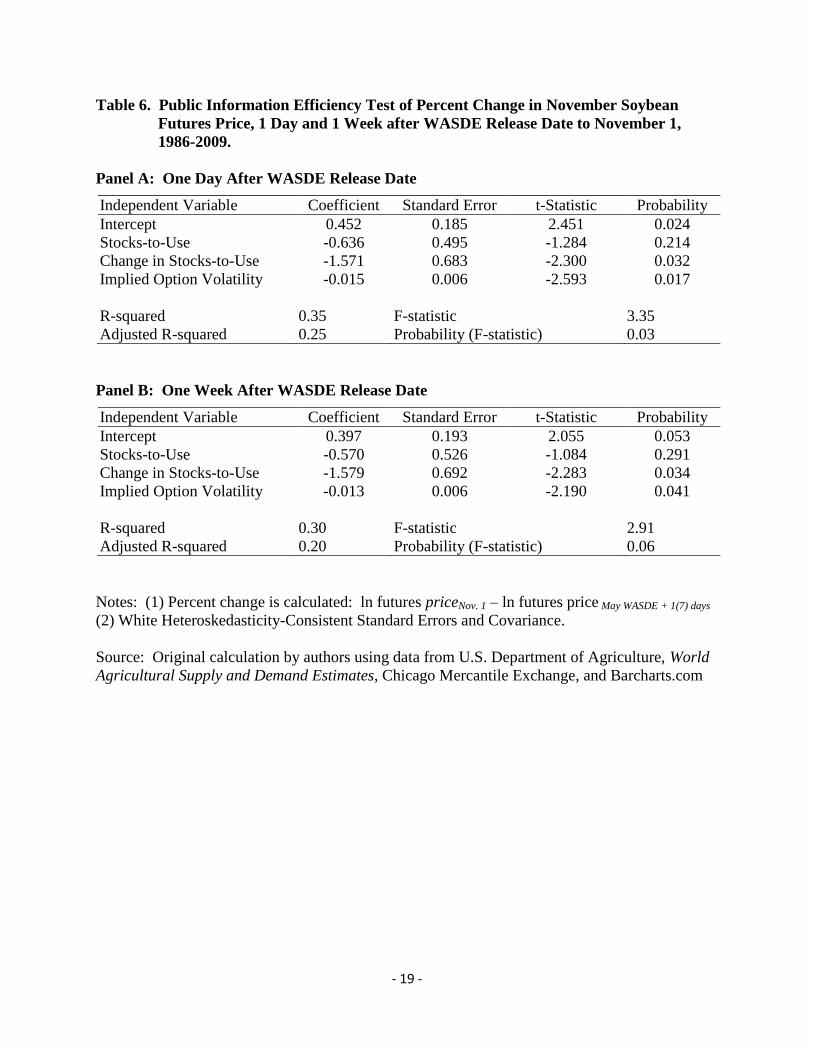
For soybeans, the intercept, change in stocks-to-use, and implied option volatility
remained statistically significant at the 95 percent confidence level and had the same sign for the
regressions for the May WASDE release date and one day after the release of the May WASDE.
The intercept was statistically insignificant for the regression estimated one week after the
release of WASDE, but returned to significance for the regression of the June WASDE (Tables 6
and 7). In contrast, change in stocks-to-use was statistically significant for the regression
estimated one week after the release of WASDE, but became insignificant for the regression of
the June WASDE. Implied option volatility was statistically significant in both regressions. As
with corn, all variables were statistically insignificant at the 95% confidence level for the
soybean regressions at the July and August WASDE release dates.
Conclusions and Implications
This study revisited the debate over whether new crop December corn and November
soybeans futures and option prices are biased. Some evidence of bias is found for December
corn futures and long December corn call positions. For December corn futures beginning with
the 1974 contract expiration, 45 of the 47 trading days that occurred between 158 and 204
trading days prior to December 1 had a statistically significant negative return to a long return.
For the long corn call using observations beginning with the contracts that expired in 1986, 33
trading days had a significant trading return at the 95 percent confidence level. Thirty of these
trading days fell between 106 and 159 trading days prior to the December option expiration date.
However, subtracting an estimate of brokerage fees and liquidity costs from the gross return
reduced the number of trading days with a mean return that differed significantly from zero for
December corn futures to less than 10 days. For corn calls, transaction costs of 2.2 cents per
bushel would have been sufficient to reduce statistical confidence below the 95 percent test level
for all observations. Such a level of transaction cost is not unreasonable given the relatively low
liquidity that can exist in option contracts until the contract becomes the nearby contract. In
summary, while some evidence is found of a bias in December corn futures and December corn
puts, the evidence is substantially muted by including transaction costs.

- 10 -
This study also examines if information contained in the widely-followed World
Agriculture Supply and Demand Reports (WASDE) issued by the U.S. Department of
Agriculture as well as the implied volatility from new crop corn and soybean options are
incorporated efficiently into the December corn and November soybean futures price. Previous
studies have examined the immediate incorporation of public information into futures prices. In
contrast, this study examines whether public information is incorporated efficiently from the
perspective of the change in price from the first non-limit close after the release of a WASDE
report and the first delivery day of the December corn and November soybean futures contract.
The May WASDE release is the first release of the calendar year to include estimates for
the forthcoming new crop year’s supply and demand. For both the December corn and
November soybean regressions centered on the May WASDE release, the intercept, change in
stocks-to-use ratio reported in WASDE, and option market implied volatility are significantly
different than zero at the 95 percent confidence level. The stocks-to-use variable is not
statistically significant. Statistical significance of the intercept and option market implied
volatility was sensitive when the period of analysis was divided in half. For corn, the intercept,
change in stocks-to-use, and implied option volatility remained statistically significant at the 95
percent confidence level and had the same sign as in the May WASDE results for the regressions
analyzed at one day and one week after the release date of the May WASDE, as well as for the
June WASDE (see Tables 4 and 5). All of the variables were statistically insignificant at the
95% confidence level for the regressions at the July and August WASDE release dates. The
same analysis for soybeans revealed more sensitivity. The intercept was statistically
insignificant for the regression estimated one week after the release of WASDE while the change
in stocks-to-use was insignificant for the regression of the June WASDE. As with corn, all
variables were statistically insignificant at the 95% confidence level for the soybean regressions
at the July and August WASDE release dates.
Before discussing the implications of these results, it is important to note that there are
only 24 observations. This limited number of observations implies caution. Additional data and
analysis is needed to assess the robustness of these findings. Given this important caveat, the
results suggest the following conclusions and implications:
(1) The lack of statistical significance of the current crop year’s stocks-to-use ratio implies
that public information on the current crop year’s supply and demand is incorporated
efficiently into the December corn and November soybean futures prices.
(2) The estimated intercept term is generally statistically significant and positive in the
equations estimated for the May and June WASDEs, which, ceteris paribus, is consistent
with the existence of normal backwardization in the December corn and November
soybean futures price.
(3) The change in stocks-to-use implies public information is generally statistically
significant and negative in the equations estimated for the May and June WASDEs. This
finding implies that new crop supply and demand is not incorporated efficiently into the
December corn and November soybean futures prices. However, this variable is no
longer statistically significant at the release of the July WASDE, implying that new crop
supply and demand information is incorporated efficiently by mid-July. The negative
sign on stocks-to-use ratio implies that, the higher is the increase in the stocks-to-use
- 11 -
ratio from the current to the next year ratio reported in the May/June WASDE report, the
greater is the decline in December corn and November soybean futures prices subsequent
to the first non-limit close after the release of the May/June WASDE and through the first
day of contract expiration.
(4) Implied option volatility is generally statistically significant and negative in the equations
estimated for the May and June WASDEs. This finding implies that new crop option
volatility is not incorporated efficiently into the December corn and November soybean
futures prices. However, this variable is no longer statistically significant at the release
of the July WASDE, implying that new crop option volatility is incorporated efficiently
by mid-July. The negative sign on implied volatility implies that, the higher is the
implied option volatility derived at the first non-limit close after the release of the
May/June WASDE, the greater the subsequent decline in the futures prices through the
first day of contract expiration.
These conclusions and implication from the public information efficiency test raise potentially
intriguing questions regarding to market efficiency and price determination in new crop corn and
soybean prices. However, as noted earlier, the same sample size places these findings more into
the category of something that needs to be monitored than as a direct confrontation to well-
established theory of market efficiency.
- 12 -
References
Brorsen, B.W. “Liquidity Costs and Scalping Costs in the Corn Futures Market.” The Journal
of Futures Markets 9(June 1989): 225-236.
Colling, P. L. and S. H. Irwin. “The Reaction of Live Hog Futures Prices to USDA Hogs and
Pigs Reports.” American Journal of Agricultural Economics. 72 (January 1990): 84-
94.
Eales, J.S., Engel B.K., Hauser R.J., and Thompson, S.R. “Grain Price Expectations of Illinois
Farmers and Grain Merchandisers.” American Journal of Agricultural Economics. 72
(August 1990): 701-708. Retrieved March 4, 2009 from JSTOR at
http://www.jstor.org/stable/2325486
Fama, E. "Efficient Capital Markets: A Review of Theory and Empirical Work." Journal of
Finance, 25 (May 1970): 383-417. Retrieved February 12, 2009 from JSTOR at
http://www.jstor.org/stable/2325486.
Fama, E. "Efficient Capital Markets: II." Journal of Finance, 46 (December 1991): 1575-1617.
Retrieved February 12, 2009 from JSTOR at http://www.jstor.org/stable/2328565.
French, K. R., R. Leftwich, and W. Uhrig. “The Effect of Scheduled Announcments on Futures
Markets.” Working Paper 273, University of Chicago, Center for Research in Security
Prices. Graduate School of Business. 1989.
Garcia, P., S. H. Irwin, R. M. Leuthold, and L. Yang. “The Value of Public Information in
Commodity Futures Markets.” Journal of Economic Behavior and Organization, 32
(1997): 559-570.
Grossman, S.J. and Stiglitz, J.E. “On the Impossibility of Informationally Efficient Markets”.
American Economic Review, 70 (June 1980): 393-408. Retrieved February 15, 2009
from JSTOR at http://www.jstor.org/stable/1805228.
Kenyon, D., Jones, E., and McGuirk, A. “Forecasting Performance of Corn and Soybean
Harvest Futures Contracts”. American Journal of Agricultural Economics, 75 (May,
1993): 399-407. Retrieved February 25, 2009 from JSTOR at
http://www.jstor.org/stable/1242924.
Tomek, W.G. and Gray, R.W. “Temporal Relationships among Prices on Commodity Futures
Markets: Their Allocative and Stabilizing Roles”. American Journal of Agricultural
Economics, 52 (August 1970): 372-38. Retrieved February 25, 2009 from JSTOR at
http://www.jstor.org/stable/1237388.
Thompson, S.R., and M.L. Waller. “The Execution Cost of Trading in Commodity Markets.”
Food Research Institute Studies 19, 2(1987): 141-163.

- 13 -
Wisner, R.N., Blue. E.N., and Baldwin, E. D. “Preharvest Marketing Strategies Increase Net
Returns for Corn and Soybean Growers”. Review of Agricultural Economics, 20
(Autumn-Winter 1998): 288-307. Retrieved February 11, 2009 from JSTOR at
http://www.jstor.org/stable/1349991.
Zulauf, C. R. and Irwin S.H. “Market Efficiency and Marketing to Enhance Income of Crop
Producers”. Review of Agricultural Economics, 20 (Autumn-Winter 1998): 308-331.
Retrieved February 11, 2009 from JSTOR at http://www.jstor.org/stable/1349992.

- 14 -
Table 1. Descriptive Statistics, Regression Variables, Corn and Soybeans, May WASDE
Release Date, 1986-2009.
---------- Corn ---------- --------- Soybeans ----------
Variable Mean Standard
Deviation Mean
Standard
Deviation
ln change in futures price -8.5% -18.1% -2.9% 16.5%
Stocks-to-Use 21.0% 16.5% 13.0% 7.0%
Change in Stocks-to-Use -0.1% 4.8% 1.2% 4.4%
Implied Option Volatility 27.7% 6.2% 24.8% 5.6%
Sources: U.S. Department of Agriculture, World Agricultural Supply and Demand Estimates,
Chicago Mercantile Exchange, and Barcharts.com

- 15 -
Table 2. Public Information Efficiency Test of Percent Change in December Corn Futures
Price, May WASDE Release Date to December 1, 1986-2009.
Panel A: Observation Period of 1986-2009
Regression Independent
Variable Coefficient Standard Error t-Statistic Probability
Intercept 0.515 0.158 3.255 0.004
Stocks-to-Use -0.192 0.116 -1.650 0.115
Change in Stocks-to-Use -2.420 0.538 -4.494 < 0.000
Implied Option Volatility -0.020 0.006 -3.444 0.003
R-squared 0.53 F-statistic 7.64
Adjusted R-squared 0.46 Probability (F-statistic) 0.00
Panel B: Observation Period of 1986-1997
Regression Independent
Variable Coefficient Standard Error t-Statistic Probability
Intercept 0.481 0.115 4.178 0.003
Stocks-to-Use -0.193 0.112 -1.730 0.122
Change in Stocks-to-Use -2.115 0.493 -4.293 0.003
Implied Option Volatility -0.019 0.004 -4.616 0.002
R-squared 0.72 F-statistic 6.75
Adjusted R-squared 0.61 Probability (F-statistic) 0.01
Panel C: Observation Period of 1998-2009
Regression Independent
Variable Coefficient Standard Error t-Statistic Probability
Intercept 0.491 0.529 0.929 0.380
Stocks-to-Use 0.310 1.482 0.209 0.839
Change in Stocks-to-Use -3.279 1.099 -2.984 0.018
Implied Option Volatility -0.022 0.013 -1.784 0.112
R-squared 0.42 F-statistic 1.97
Adjusted R-squared 0.21 Probability (F-statistic) 0.20
Notes: (1) Percent change is calculated: ln futures priceDec. 1 – ln futures priceMay WASDE
(2) White Heteroskedasticity-Consistent Standard Errors and Covariance.
Source: Original calculation by authors using data from U.S. Department of Agriculture, World
Agricultural Supply and Demand Estimates, Chicago Mercantile Exchange, and Barcharts.com

- 16 -
Table 3. Public Information Efficiency Test of Percent Change in November Soybean
Futures Price, May WASDE Release Date to November 1, 1986-2009.
Panel A: Observation Period of 1986-2009
Regression Independent
Variable Coefficient Standard Error t-Statistic Probability
Intercept 0.435 0.178 2.443 0.024
Stocks-to-Use -0.609 0.495 -1.232 0.232
Change in Stocks-to-Use -1.569 0.675 -2.323 0.031
Implied Option Volatility -0.015 0.006 -2.624 0.016
R-squared 0.34 F-statistic 3.36
Adjusted R-squared 0.24 Probability (F-statistic) 0.04
Panel B: Observation Period of 1986-1997
Regression Independent
Variable Coefficient Standard Error t-Statistic Probability
Intercept 0.298 0.222 1.344 0.216
Stocks-to-Use -0.293 0.358 -0.819 0.437
Change in Stocks-to-Use -1.583 0.587 -2.695 0.027
Implied Option Volatility -0.013 0.010 -1.314 0.225
R-squared 0.36 F-statistic 1.51
Adjusted R-squared 0.12 Probability (F-statistic) 0.28
Panel C: Observation Period of 1998-2009
Regression Independent
Variable Coefficient Standard Error t-Statistic Probability
Intercept 0.840 0.336 2.503 0.037
Stocks-to-Use -1.147 1.120 -1.024 0.336
Change in Stocks-to-Use -1.942 0.728 -2.669 0.028
Implied Option Volatility -0.025 0.008 -3.000 0.017
R-squared 0.56 F-statistic 3.33
Adjusted R-squared 0.39 Probability (F-statistic) 0.08
Notes: (1) Percent change is calculated: ln futures priceNov. 1 – ln futures priceMay WASDE
(2) White Heteroskedasticity-Consistent Standard Errors and Covariance.
Source: Original calculation by authors using data from U.S. Department of Agriculture, World
Agricultural Supply and Demand Estimates, Chicago Mercantile Exchange, and Barcharts.com
- 17 -
Table 4. Public Information Efficiency Test of Percent Change in December Corn Futures
Price, 1 Day and 1 Week after May WASDE Release Date to December 1, 1986-
2009.
Panel A: One Day After WASDE Release Date
Independent Variable Coefficient Standard Error t-Statistic Probability
Intercept 0.508 0.159 3.205 0.004
Stocks-to-Use -0.139 0.116 -1.201 0.244
Change in Stocks-to-Use -2.335 0.562 -4.153 < 0.000
Implied Option Volatility -0.020 0.006 -3.396 0.003
R-squared 0.52 F-statistic 7.34
Adjusted R-squared 0.45 Probability (F-statistic) < 0.00
Panel B: One Week After WASDE Release Date
Independent Variable Coefficient Standard Error t-Statistic Probability
Intercept 0.491 0.173 2.845 0.010
Stocks-to-Use -0.052 0.119 -0.433 0.670
Change in Stocks-to-Use -2.200 0.554 -3.973 < 0.000
Implied Option Volatility -0.020 0.006 -2.983 0.007
R-squared 0.49 F-statistic 6.38
Adjusted R-squared 0.41 Probability (F-statistic) < 0.00
Notes: (1) Percent change is calculated: ln futures priceDec. 1 – ln futures priceMay WASDE + 1(7) days
(2) White Heteroskedasticity-Consistent Standard Errors and Covariance.
Source: Original calculation by authors using data from U.S. Department of Agriculture, World
Agricultural Supply and Demand Estimates, Chicago Mercantile Exchange, and Barcharts.com

- 18 -
Table 5. Public Information Efficiency Test of Percent Change in December Corn Futures
Price, June, July, and August WASDE Release Date to December 1, 1986-2009.
Panel A: June WASDE Release Date
Independent Variable Coefficient Standard Error t-Statistic Probability
Intercept 0.514 0.162 3.174 0.005
Stocks-to-Use 0.002 0.142 0.015 0.989
Change in Stocks-to-Use -2.215 0.651 -3.403 0.003
Implied Option Volatility -0.022 0.006 -3.357 0.003
R-squared 0.49 F-statistic 6.43
Adjusted R-squared 0.41 Probability (F-statistic) 0.00
Panel B: July WASDE Release Date
Independent Variable Coefficient Standard Error t-Statistic Probability
Intercept 0.289 0.219 1.318 0.202
Stocks-to-Use 0.119 0.181 0.666 0.520
Change in Stocks-to-Use -0.563 0.634 -.0891 0.384
Implied Option Volatility -0.014 0.010 -1.450 0.163
R-squared 0.14 F-statistic 1.07
Adjusted R-squared 0.01 Probability (F-statistic) 0.38
Panel C: August WASDE Release Date
Independent Variable Coefficient Standard Error t-Statistic Probability
Intercept 0.149 0.188 0.792 0.438
Stocks-to-Use 0.131 0.104 1.263 0.221
Change in Stocks-to-Use -0.227 0.378 -0.600 0.556
Implied Option Volatility -0.008 0.009 -0.927 0.365
R-squared 0.10 F-statistic 0.72
Adjusted R-squared -0.04 Probability (F-statistic) 0.55
Notes: (1) Percent change is calculated: ln futures priceDec. 1 – ln futures price WASDE
(2) White Heteroskedasticity-Consistent Standard Errors and Covariance.
Source: Original calculation by authors using data from U.S. Department of Agriculture, World
Agricultural Supply and Demand Estimates, Chicago Mercantile Exchange, and Barcharts.com
- 19 -
Table 6. Public Information Efficiency Test of Percent Change in November Soybean
Futures Price, 1 Day and 1 Week after WASDE Release Date to November 1,
1986-2009.
Panel A: One Day After WASDE Release Date
Independent Variable Coefficient Standard Error t-Statistic Probability
Intercept 0.452 0.185 2.451 0.024
Stocks-to-Use -0.636 0.495 -1.284 0.214
Change in Stocks-to-Use -1.571 0.683 -2.300 0.032
Implied Option Volatility -0.015 0.006 -2.593 0.017
R-squared 0.35 F-statistic 3.35
Adjusted R-squared 0.25 Probability (F-statistic) 0.03
Panel B: One Week After WASDE Release Date
Independent Variable Coefficient Standard Error t-Statistic Probability
Intercept 0.397 0.193 2.055 0.053
Stocks-to-Use -0.570 0.526 -1.084 0.291
Change in Stocks-to-Use -1.579 0.692 -2.283 0.034
Implied Option Volatility -0.013 0.006 -2.190 0.041
R-squared 0.30 F-statistic 2.91
Adjusted R-squared 0.20 Probability (F-statistic) 0.06
Notes: (1) Percent change is calculated: ln futures priceNov. 1 – ln futures price May WASDE + 1(7) days
(2) White Heteroskedasticity-Consistent Standard Errors and Covariance.
Source: Original calculation by authors using data from U.S. Department of Agriculture, World
Agricultural Supply and Demand Estimates, Chicago Mercantile Exchange, and Barcharts.com

- 20 -
Table 7. Public Information Efficiency Test of Percent Change in November Soybean
Futures Price, June, July, and August WASDE Release Date to November 1,
1986-2009.
Panel A: June WASDE Release Date
Independent Variable Coefficient Standard Error t-Statistic Probability
Intercept 0.369 0.158 2.336 0.030
Stocks-to-Use -0.900 0.517 -1.741 0.097
Change in Stocks-to-Use -0.646 0.537 -1.202 0.243
Implied Option Volatility -0.010 0.003 -2.950 0.008
R-squared 0.26 F-statistic 2.37
Adjusted R-squared 0.15 Probability (F-statistic) 0.10
Panel B: July WASDE Release Date
Independent Variable Coefficient Standard Error t-Statistic Probability
Intercept 0.162 0.208 0.779 0.445
Stocks-to-Use -0.192 0.552 -0.348 0.732
Change in Stocks-to-Use 0.744 0.625 1.190 0.248
Implied Option Volatility -0.006 0.005 -1.206 0.242
R-squared 0.23 F-statistic 2.01
Adjusted R-squared 0.12 Probability (F-statistic) 0.15
Panel C: August WASDE Release Date
Independent Variable Coefficient Standard Error t-Statistic Probability
Intercept 0.221 0.162 1.363 0.188
Stocks-to-Use -0.455 0.516 -0.882 0.388
Change in Stocks-to-Use 0.333 0.374 0.889 0.385
Implied Option Volatility -0.006 0.004 -1.480 0.155
R-squared 0.18 F-statistic 1.46
Adjusted R-squared 0.06 Probability (F-statistic) 0.26
Notes: (1) Percent change is calculated: ln futures priceDec(Nov) 1 – ln futures priceWASDE
(2) White Heteroskedasticity-Consistent Standard Errors and Covariance.
Source: Original calculation by authors using data from U.S. Department of Agriculture, World
Agricultural Supply and Demand Estimates, Chicago Mercantile Exchange, and Barcharts.com
- 21 -
Figure 1. Gross Trading Return in Percent, Long December Corn Futures and Long
November Soybean Futures, 1974-2009
Sources: Chicago Mercantile Exchange and Barcharts.com
-18%
-14%
-9%
-5%
0%
5%
9%
Dec. 1 (t-1) Mar. 1 June 1 Sept. 1 Dec. 1
Per
cen
t
Panel A: Corn
Mean 95% Confidence Interval
-18%
-14%
-9%
-5%
0%
5%
9%
Nov.1 (t-1) Feb. 1 May 1 Aug. 1 Nov. 1
Per
cen
t
Panel B: Soybeans
Mean 95% Confidence Interval
- 22 -
Figure 2. Gross Trading Return (Percent) Long December Corn Futures and Long
November Soybean Futures, 1986-2009
Sources: Chicago Mercantile Exchange and Barcharts.com
-24%
-20%
-16%
-12%
-8%
-4%
0%
4%
8%
12%
Dec. (t-1) Mar. 1 June 1 Sept. 1 Dec. 1
Per
cen
t
Panel A: Corn
Mean 95% Confidence Interval
-24%
-20%
-16%
-12%
-8%
-4%
0%
4%
8%
12%
Nov.1 (t-1) Feb. 1 May 1 Aug. 1 Nov. 1
Per
cen
t
Panel B: Soybeans
Mean 95% Confidence Interval
- 23 -
Figure 3. Gross Trading Return (Cents/Bushel) Long December Corn Options, 1986-2009
Sources: Chicago Mercantile Exchange and Barcharts.com
-30
-20
-10
0
10
20
30
40
50
60
Dec. 5-15 (t-1)
234
Mar. 1-10
180
June 1-10
120
Aug. 20-30
60
Nov. 15-25
Cen
ts /
Bu
shel
Days to Option Contract Expiry
Panel A: Call
Mean 95% Confidence Interval
-30
-20
-10
0
10
20
30
40
50
60
Dec. 5-15 (t-1)
234
Mar. 1-10
180
June 1-10
120
Aug. 20-30
60
Nov. 15-25
Cen
ts /
Bu
shel
Days to Option Contract Expiry
Panel B: Put
Mean 95% Confidence Interval

- 24 -
Figure 4. Gross Trading Return (Cents/Bushel) Long November Soybean Options, 1986-
2009
Sources: Chicago Mercantile Exchange and Barcharts.com
-60
-40
-20
0
20
40
60
80
100
Nov. 5-15 (t-1)
238
Feb. 1-10
180
May 1-10
120
July 20-30
60
Oct. 15-25
Cen
ts /
Bu
shel
Days to Option Contract Expiry
Panel A: Call
Mean 95% Confidence Interval
-60
-40
-20
0
20
40
60
80
100
Nov. 5-15 (t-1)
238
Feb. 1-10
180
May 1-10
120
July 20-30
60
Oct. 15-25
Cen
ts /
Bu
shel
Days to Option Contract Expiry
Panel B: Put
Mean 95% Confidence Interval


