APPENDIX D:SYNCHRO OUTPUT FILES
2011 EXISTING CONDITION

Timings
1: East Hanover Ave & US 202 11/21/2011
Existing AM Synchro 7 - Report
Stantec Page 1
Lane Group EBL EBT WBL WBT NBL NBT SBL SBT
Act Effct Green (s) 44.0 32.0 44.0 32.0 48.4 36.0 66.0 55.4
Actuated g/C Ratio 0.40 0.29 0.40 0.29 0.44 0.33 0.60 0.50
v/c Ratio 0.71 0.89 0.50 0.62 0.16 0.89 1.11 0.56
Control Delay 38.2 49.0 29.1 34.3 11.5 54.8 105.1 22.0
Queue Delay 0.0 0.0 0.0 0.0 0.0 0.0 0.0 0.0
Total Delay 38.2 49.0 29.1 34.3 11.5 54.8 105.1 22.0
LOS D D C C B D F C
Approach Delay 47.1 33.5 49.6 65.7
Approach LOS D C D E
Intersection Summary
Cycle Length: 110
Actuated Cycle Length: 110
Offset: 0 (0%), Referenced to phase 2:NBTL and 6:SBTL, Start of Yellow
Control Type: Actuated-Coordinated
Maximum v/c Ratio: 1.11
Intersection Signal Delay: 50.4 Intersection LOS: D
Intersection Capacity Utilization 105.2% ICU Level of Service G
Analysis Period (min) 15
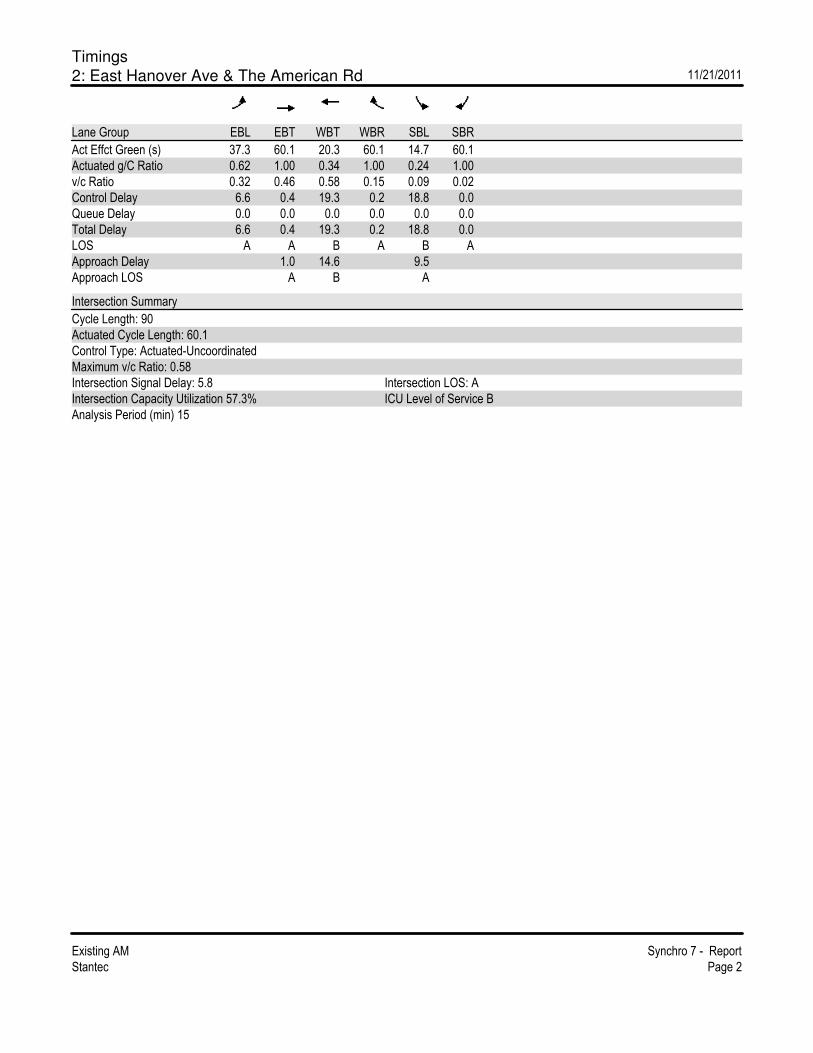
Timings
2: East Hanover Ave & The American Rd 11/21/2011
Existing AM Synchro 7 - Report
Stantec Page 2
Lane Group EBL EBT WBT WBR SBL SBR
Act Effct Green (s) 37.3 60.1 20.3 60.1 14.7 60.1
Actuated g/C Ratio 0.62 1.00 0.34 1.00 0.24 1.00
v/c Ratio 0.32 0.46 0.58 0.15 0.09 0.02
Control Delay 6.6 0.4 19.3 0.2 18.8 0.0
Queue Delay 0.0 0.0 0.0 0.0 0.0 0.0
Total Delay 6.6 0.4 19.3 0.2 18.8 0.0
LOS A A B A B A
Approach Delay 1.0 14.6 9.5
Approach LOS A B A
Intersection Summary
Cycle Length: 90
Actuated Cycle Length: 60.1
Control Type: Actuated-Uncoordinated
Maximum v/c Ratio: 0.58
Intersection Signal Delay: 5.8 Intersection LOS: A
Intersection Capacity Utilization 57.3% ICU Level of Service B
Analysis Period (min) 15
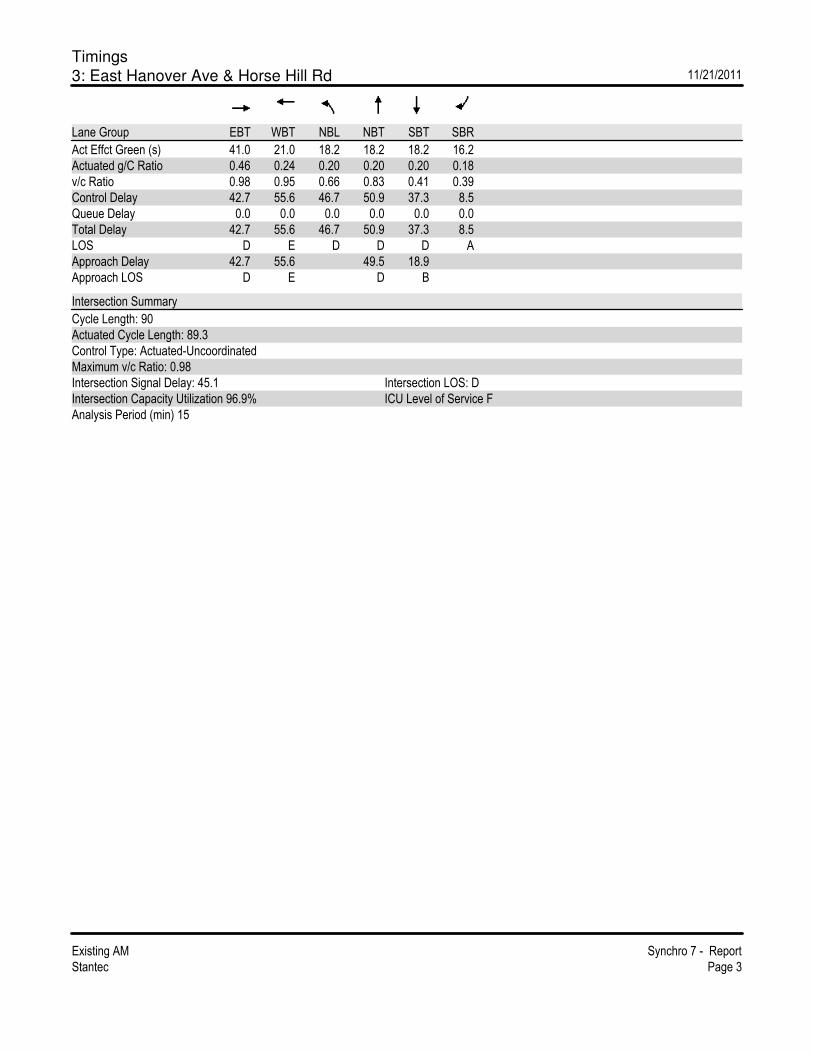
Timings
3: East Hanover Ave & Horse Hill Rd 11/21/2011
Existing AM Synchro 7 - Report
Stantec Page 3
Lane Group EBT WBT NBL NBT SBT SBR
Act Effct Green (s) 41.0 21.0 18.2 18.2 18.2 16.2
Actuated g/C Ratio 0.46 0.24 0.20 0.20 0.20 0.18
v/c Ratio 0.98 0.95 0.66 0.83 0.41 0.39
Control Delay 42.7 55.6 46.7 50.9 37.3 8.5
Queue Delay 0.0 0.0 0.0 0.0 0.0 0.0
Total Delay 42.7 55.6 46.7 50.9 37.3 8.5
LOS D E D D D A
Approach Delay 42.7 55.6 49.5 18.9
Approach LOS D E D B
Intersection Summary
Cycle Length: 90
Actuated Cycle Length: 89.3
Control Type: Actuated-Uncoordinated
Maximum v/c Ratio: 0.98
Intersection Signal Delay: 45.1 Intersection LOS: D
Intersection Capacity Utilization 96.9% ICU Level of Service F
Analysis Period (min) 15

HCM Unsignalized Intersection Capacity Analysis
4: East Hanover Ave & Monroe St 11/21/2011
Existing AM Synchro 7 - Report
Stantec Page 4
Movement EBT EBR WBL WBT NBL NBR
Lane Configurations
Volume (veh/h) 1234 3 23 775 1 98
Sign Control Free Free Stop
Grade 0% 0% 0%
Peak Hour Factor 0.95 0.95 0.95 0.95 0.95 0.95
Hourly flow rate (vph) 1299 3 24 816 1 103
Pedestrians 1
Lane Width (ft) 12.0
Walking Speed (ft/s) 4.0
Percent Blockage 0
Right turn flare (veh)
Median type None None
Median storage veh)
Upstream signal (ft) 847
pX, platoon unblocked 0.88
vC, conflicting volume 1302 1757 652
vC1, stage 1 conf vol
vC2, stage 2 conf vol
vCu, unblocked vol 1302 1585 652
tC, single (s) 4.1 6.8 6.9
tC, 2 stage (s)
tF (s) 2.2 3.5 3.3
p0 queue free % 95 99 75
cM capacity (veh/h) 528 85 410
Direction, Lane # EB 1 EB 2 WB 1 WB 2 NB 1
Volume Total 866 436 296 544 104
Volume Left 0 0 24 0 1
Volume Right 0 3 0 0 103
cSH 1700 1700 528 1700 395
Volume to Capacity 0.51 0.26 0.05 0.32 0.26
Queue Length 95th (ft) 0 0 4 0 26
Control Delay (s) 0.0 0.0 1.6 0.0 17.4
Lane LOS A C
Approach Delay (s) 0.0 0.6 17.4
Approach LOS C
Intersection Summary
Average Delay 1.0
Intersection Capacity Utilization 51.2% ICU Level of Service A
Analysis Period (min) 15
Timings
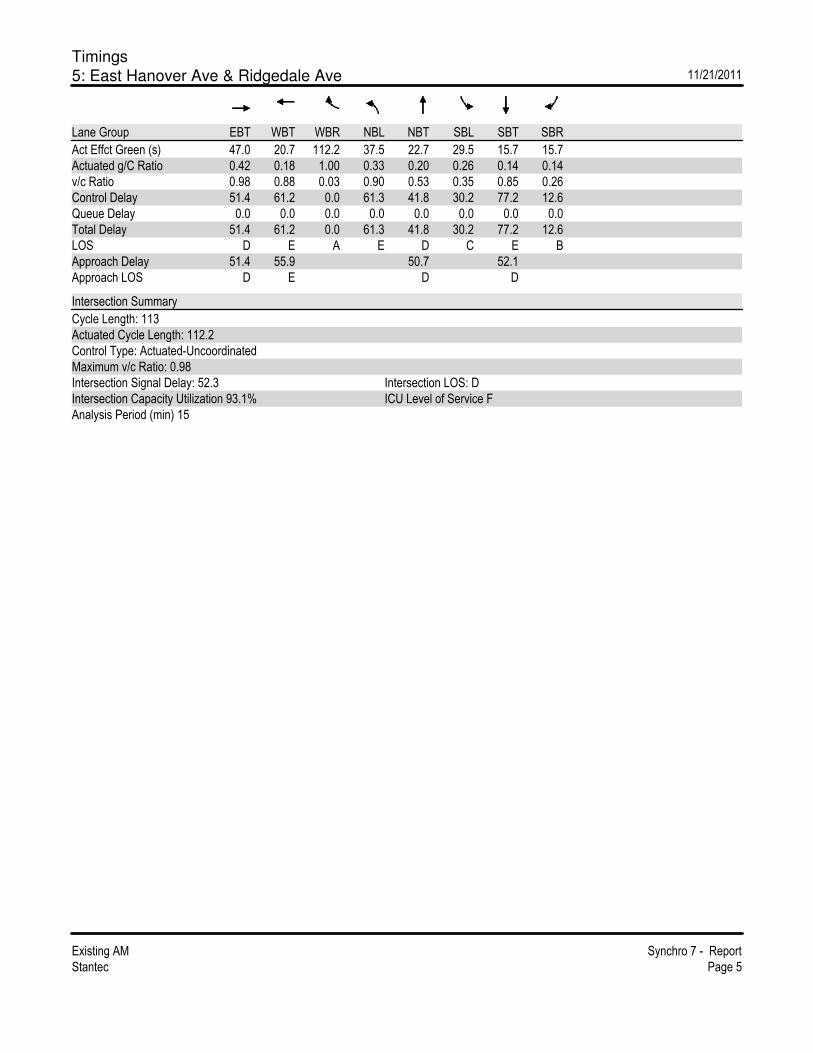
5: East Hanover Ave & Ridgedale Ave 11/21/2011
Existing AM Synchro 7 - Report
Stantec Page 5
Lane Group EBT WBT WBR NBL NBT SBL SBT SBR
Act Effct Green (s) 47.0 20.7 112.2 37.5 22.7 29.5 15.7 15.7
Actuated g/C Ratio 0.42 0.18 1.00 0.33 0.20 0.26 0.14 0.14
v/c Ratio 0.98 0.88 0.03 0.90 0.53 0.35 0.85 0.26
Control Delay 51.4 61.2 0.0 61.3 41.8 30.2 77.2 12.6
Queue Delay 0.0 0.0 0.0 0.0 0.0 0.0 0.0 0.0
Total Delay 51.4 61.2 0.0 61.3 41.8 30.2 77.2 12.6
LOS D E A E D C E B
Approach Delay 51.4 55.9 50.7 52.1
Approach LOS D E D D
Intersection Summary
Cycle Length: 113
Actuated Cycle Length: 112.2
Control Type: Actuated-Uncoordinated
Maximum v/c Ratio: 0.98
Intersection Signal Delay: 52.3 Intersection LOS: D
Intersection Capacity Utilization 93.1% ICU Level of Service F
Analysis Period (min) 15
Timings
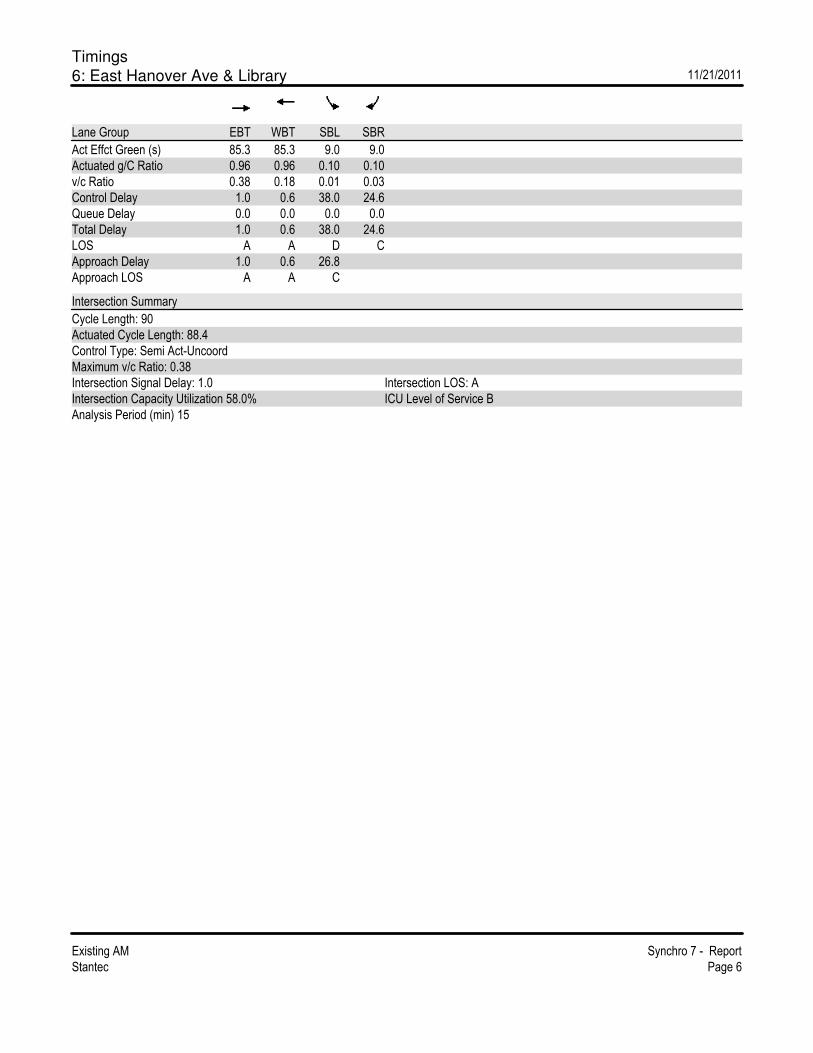
6: East Hanover Ave & Library 11/21/2011
Existing AM Synchro 7 - Report
Stantec Page 6
Lane Group EBT WBT SBL SBR
Act Effct Green (s) 85.3 85.3 9.0 9.0
Actuated g/C Ratio 0.96 0.96 0.10 0.10
v/c Ratio 0.38 0.18 0.01 0.03
Control Delay 1.0 0.6 38.0 24.6
Queue Delay 0.0 0.0 0.0 0.0
Total Delay 1.0 0.6 38.0 24.6
LOS A A D C
Approach Delay 1.0 0.6 26.8
Approach LOS A A C
Intersection Summary
Cycle Length: 90
Actuated Cycle Length: 88.4
Control Type: Semi Act-Uncoord
Maximum v/c Ratio: 0.38
Intersection Signal Delay: 1.0 Intersection LOS: A
Intersection Capacity Utilization 58.0% ICU Level of Service B
Analysis Period (min) 15

Timings
7: East Hanover Ave & Whippany Rd 11/21/2011
Existing AM Synchro 7 - Report
Stantec Page 7
Lane Group EBL EBT NBL NBT NBR SBL SBT SBR
Act Effct Green (s) 58.0 56.0 10.2 22.9 22.9 17.1 32.1 110.0
Actuated g/C Ratio 0.53 0.51 0.09 0.21 0.21 0.16 0.29 1.00
v/c Ratio 0.36 0.99 0.27 0.24 0.09 0.75 0.32 0.38
Control Delay 16.5 55.5 49.8 37.7 36.8 61.6 32.8 0.7
Queue Delay 0.0 0.0 0.0 0.0 0.0 0.0 0.0 0.0
Total Delay 16.5 55.5 49.8 37.7 36.8 61.6 32.8 0.7
LOS B E D D D E C A
Approach Delay 45.3 39.8 21.0
Approach LOS D D C
Intersection Summary
Cycle Length: 110
Actuated Cycle Length: 110
Offset: 0 (0%), Referenced to phase 2:NBT and 6:SBT, Start of Yellow, Master Intersection
Control Type: Actuated-Coordinated
Maximum v/c Ratio: 0.99
Intersection Signal Delay: 34.2 Intersection LOS: C
Intersection Capacity Utilization 76.5% ICU Level of Service D
Analysis Period (min) 15

Lanes, Volumes, Timings
1: East Hanover Ave & US 202 11/21/2011
Existing PM Synchro 7 - Report
Stantec Page 1
Lane Group EBL EBT EBR WBL WBT WBR NBL NBT NBR SBL SBT SBR
Lane Configurations
Ideal Flow (vphpl) 1900 1900 1900 1900 1900 1900 1900 1900 1900 1900 1900 1900
Lane Width (ft) 12 12 16 12 12 12 12 12 12 12 13 12
Storage Length (ft) 200 0 200 0 0 0 0 0
Storage Lanes 1 1 1 0 1 0 1 0
Taper Length (ft) 30 150 95 25 25 25 25 25
Right Turn on Red Yes Yes Yes No
Link Speed (mph) 30 30 35 35
Link Distance (ft) 511 579 467 663
Travel Time (s) 11.6 13.2 9.1 12.9
Act Effct Green (s) 45.0 32.0 45.0 32.0 54.7 41.0 55.0 41.3
Actuated g/C Ratio 0.45 0.32 0.45 0.32 0.55 0.41 0.55 0.41
v/c Ratio 0.56 0.41 0.45 1.00 0.49 0.83 0.76 0.71
Control Delay 25.5 26.9 20.8 60.3 16.2 37.0 34.2 31.0
Queue Delay 0.0 0.0 0.0 0.0 0.0 0.0 0.0 0.0
Total Delay 25.5 26.9 20.8 60.3 16.2 37.0 34.2 31.0
LOS C C C E B D C C
Approach Delay 26.5 54.5 32.2 32.0
Approach LOS C D C C
Intersection Summary
Area Type: Other
Cycle Length: 100
Actuated Cycle Length: 100
Offset: 0 (0%), Referenced to phase 2:NBTL and 6:SBTL, Start of Yellow
Control Type: Actuated-Coordinated
Maximum v/c Ratio: 1.00
Intersection Signal Delay: 39.3 Intersection LOS: D
Intersection Capacity Utilization 95.8% ICU Level of Service F
Analysis Period (min) 15

Lanes, Volumes, Timings
2: East Hanover Ave & The American Rd 11/21/2011
Existing PM Synchro 7 - Report
Stantec Page 2
Lane Group EBL EBT WBT WBR SBL SBR
Lane Configurations
Ideal Flow (vphpl) 1900 1900 1900 1900 1900 1900
Lane Width (ft) 12 12 12 12 15 15
Storage Length (ft) 285 300 0 250
Storage Lanes 1 1 1 1
Taper Length (ft) 100 100 25 100
Right Turn on Red Yes Yes
Link Speed (mph) 25 30 30
Link Distance (ft) 1343 418 932
Travel Time (s) 36.6 9.5 21.2
Act Effct Green (s) 44.7 65.3 31.7 65.3 12.4 65.3
Actuated g/C Ratio 0.68 1.00 0.49 1.00 0.19 1.00
v/c Ratio 0.18 0.21 0.65 0.04 0.51 0.11
Control Delay 4.7 0.1 16.1 0.0 30.8 0.1
Queue Delay 0.0 0.0 0.0 0.0 0.0 0.0
Total Delay 4.7 0.1 16.1 0.0 30.8 0.1
LOS A A B A C A
Approach Delay 0.5 15.3 15.2
Approach LOS A B B
Intersection Summary
Area Type: Other
Cycle Length: 90
Actuated Cycle Length: 65.3
Control Type: Actuated-Uncoordinated
Maximum v/c Ratio: 0.65
Intersection Signal Delay: 10.2 Intersection LOS: B
Intersection Capacity Utilization 57.8% ICU Level of Service B
Analysis Period (min) 15
Lanes, Volumes, Timings
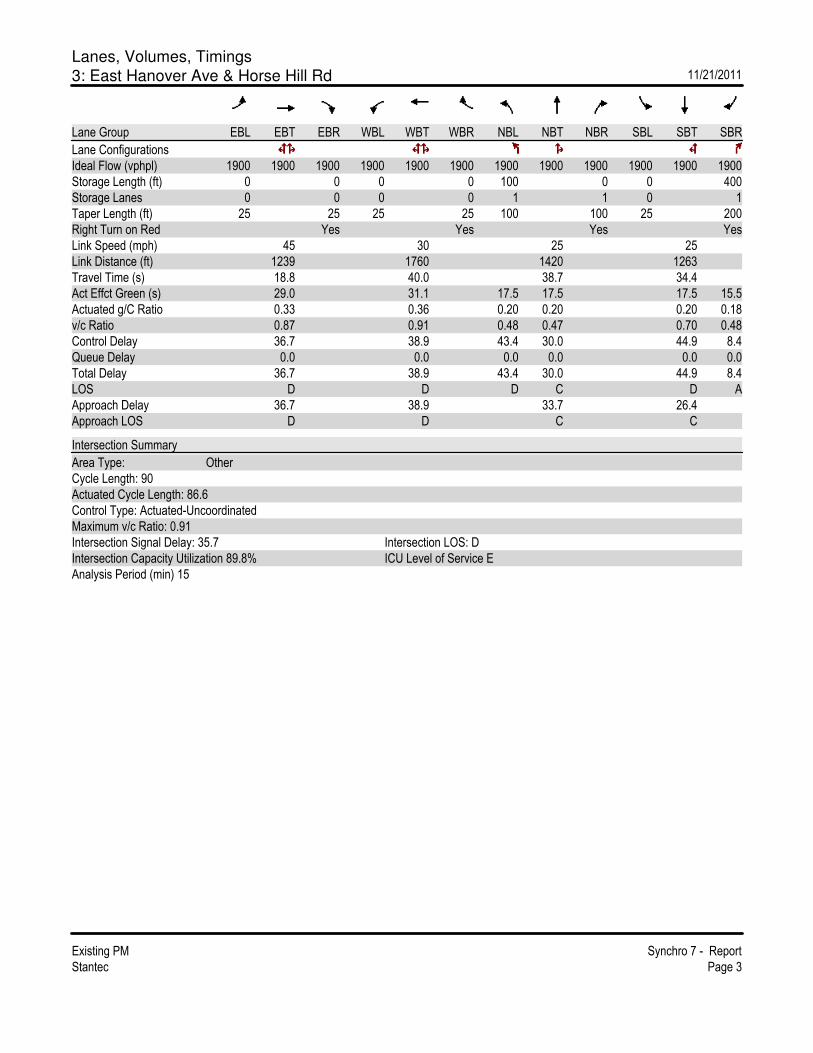
3: East Hanover Ave & Horse Hill Rd 11/21/2011
Existing PM Synchro 7 - Report
Stantec Page 3
Lane Group EBL EBT EBR WBL WBT WBR NBL NBT NBR SBL SBT SBR
Lane Configurations
Ideal Flow (vphpl) 1900 1900 1900 1900 1900 1900 1900 1900 1900 1900 1900 1900
Storage Length (ft) 0 0 0 0 100 0 0 400
Storage Lanes 0 0 0 0 1 1 0 1
Taper Length (ft) 25 25 25 25 100 100 25 200
Right Turn on Red Yes Yes Yes Yes
Link Speed (mph) 45 30 25 25
Link Distance (ft) 1239 1760 1420 1263
Travel Time (s) 18.8 40.0 38.7 34.4
Act Effct Green (s) 29.0 31.1 17.5 17.5 17.5 15.5
Actuated g/C Ratio 0.33 0.36 0.20 0.20 0.20 0.18
v/c Ratio 0.87 0.91 0.48 0.47 0.70 0.48
Control Delay 36.7 38.9 43.4 30.0 44.9 8.4
Queue Delay 0.0 0.0 0.0 0.0 0.0 0.0
Total Delay 36.7 38.9 43.4 30.0 44.9 8.4
LOS D D D C D A
Approach Delay 36.7 38.9 33.7 26.4
Approach LOS D D C C
Intersection Summary
Area Type: Other
Cycle Length: 90
Actuated Cycle Length: 86.6
Control Type: Actuated-Uncoordinated
Maximum v/c Ratio: 0.91
Intersection Signal Delay: 35.7 Intersection LOS: D
Intersection Capacity Utilization 89.8% ICU Level of Service E
Analysis Period (min) 15
Lanes, Volumes, Timings
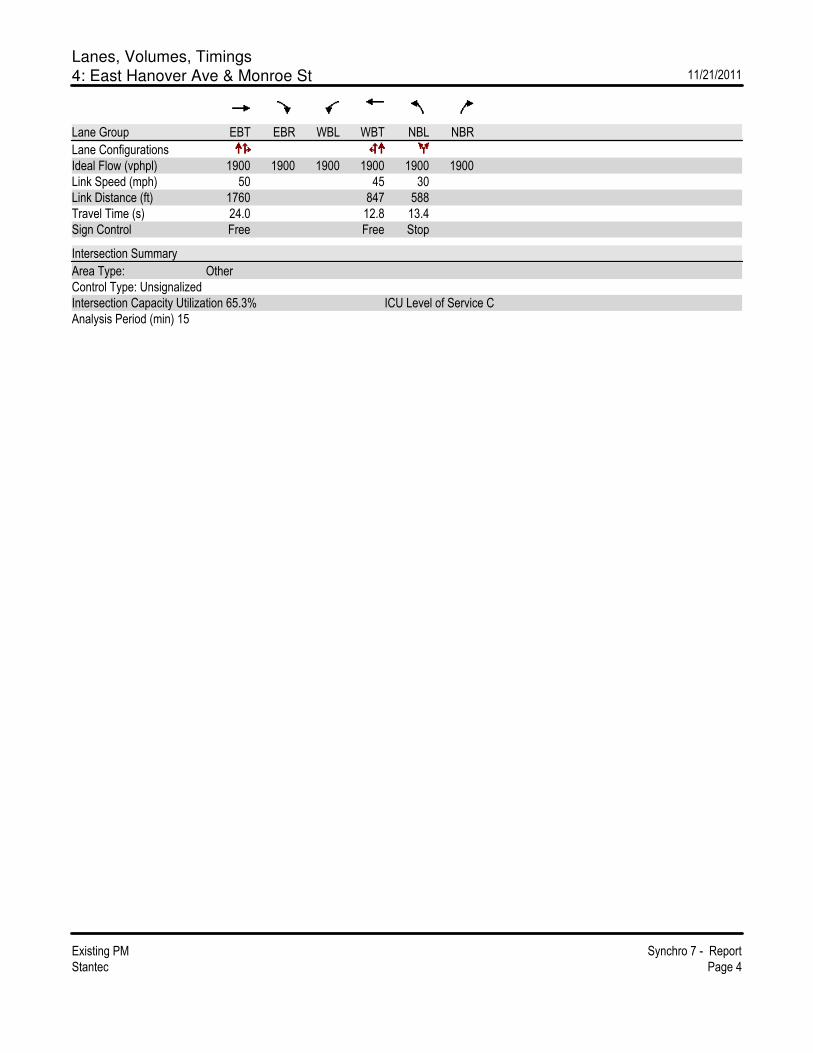
4: East Hanover Ave & Monroe St 11/21/2011
Existing PM Synchro 7 - Report
Stantec Page 4
Lane Group EBT EBR WBL WBT NBL NBR
Lane Configurations
Ideal Flow (vphpl) 1900 1900 1900 1900 1900 1900
Link Speed (mph) 50 45 30
Link Distance (ft) 1760 847 588
Travel Time (s) 24.0 12.8 13.4
Sign Control Free Free Stop
Intersection Summary
Area Type: Other
Control Type: Unsignalized
Intersection Capacity Utilization 65.3% ICU Level of Service C
Analysis Period (min) 15
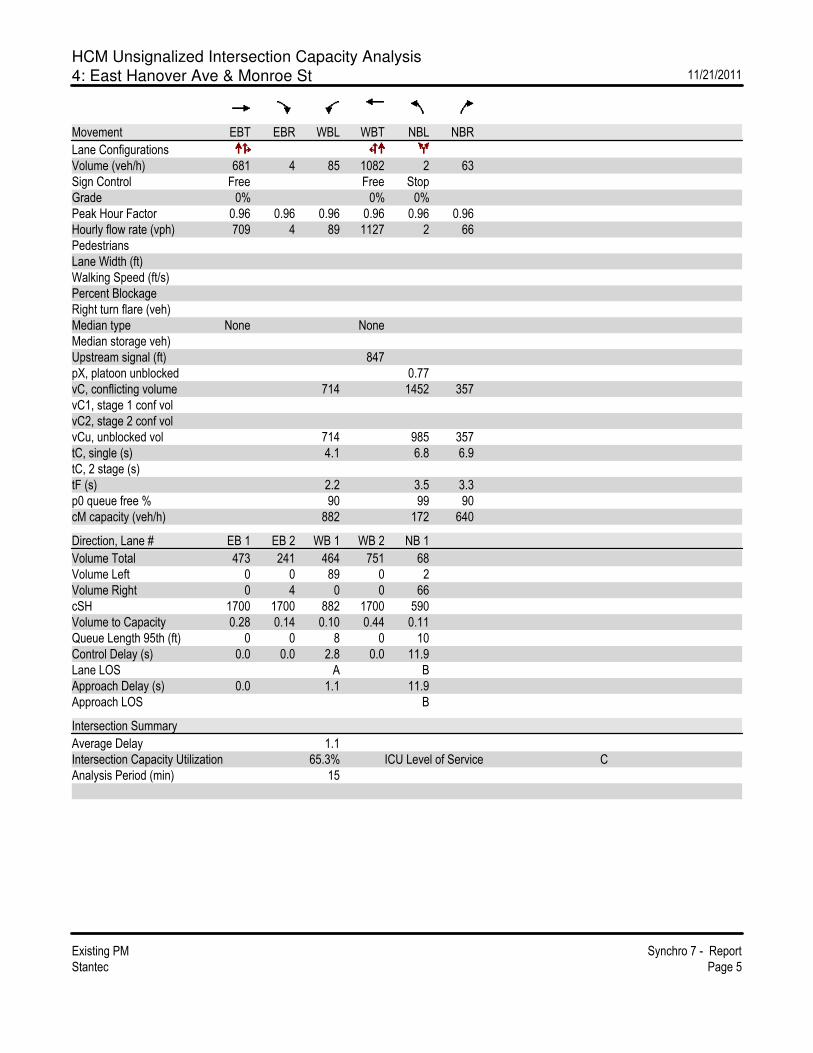
HCM Unsignalized Intersection Capacity Analysis
4: East Hanover Ave & Monroe St 11/21/2011
Existing PM Synchro 7 - Report
Stantec Page 5
Movement EBT EBR WBL WBT NBL NBR
Lane Configurations
Volume (veh/h) 681 4 85 1082 2 63
Sign Control Free Free Stop
Grade 0% 0% 0%
Peak Hour Factor 0.96 0.96 0.96 0.96 0.96 0.96
Hourly flow rate (vph) 709 4 89 1127 2 66
Pedestrians
Lane Width (ft)
Walking Speed (ft/s)
Percent Blockage
Right turn flare (veh)
Median type None None
Median storage veh)
Upstream signal (ft) 847
pX, platoon unblocked 0.77
vC, conflicting volume 714 1452 357
vC1, stage 1 conf vol
vC2, stage 2 conf vol
vCu, unblocked vol 714 985 357
tC, single (s) 4.1 6.8 6.9
tC, 2 stage (s)
tF (s) 2.2 3.5 3.3
p0 queue free % 90 99 90
cM capacity (veh/h) 882 172 640
Direction, Lane # EB 1 EB 2 WB 1 WB 2 NB 1
Volume Total 473 241 464 751 68
Volume Left 0 0 89 0 2
Volume Right 0 4 0 0 66
cSH 1700 1700 882 1700 590
Volume to Capacity 0.28 0.14 0.10 0.44 0.11
Queue Length 95th (ft) 0 0 8 0 10
Control Delay (s) 0.0 0.0 2.8 0.0 11.9
Lane LOS A B
Approach Delay (s) 0.0 1.1 11.9
Approach LOS B
Intersection Summary
Average Delay 1.1
Intersection Capacity Utilization 65.3% ICU Level of Service C
Analysis Period (min) 15

Lanes, Volumes, Timings
5: East Hanover Ave & Ridgedale Ave 11/21/2011
Existing PM Synchro 7 - Report
Stantec Page 6
Lane Group EBL EBT EBR WBL WBT WBR NBL NBT NBR SBL SBT SBR
Lane Configurations
Ideal Flow (vphpl) 1900 1900 1900 1900 1900 1900 1900 1900 1900 1900 1900 1900
Lane Width (ft) 12 12 13 12 12 15 10 11 11 11 11 11
Storage Length (ft) 0 0 0 230 100 0 250 0
Storage Lanes 0 0 0 1 1 0 1 1
Taper Length (ft) 25 25 25 25 180 25 75 25
Right Turn on Red No Yes Yes Yes
Link Speed (mph) 25 25 35 35
Link Distance (ft) 847 742 331 588
Travel Time (s) 23.1 20.2 6.4 11.5
Act Effct Green (s) 28.7 36.0 107.9 35.8 19.0 33.3 17.1 17.1
Actuated g/C Ratio 0.27 0.33 1.00 0.33 0.18 0.31 0.16 0.16
v/c Ratio 0.87 0.83 0.06 0.79 0.82 0.59 1.00 0.43
Control Delay 49.9 40.6 0.1 49.1 55.1 36.4 101.0 10.6
Queue Delay 0.0 0.0 0.0 0.0 0.0 0.0 0.0 0.0
Total Delay 49.9 40.6 0.1 49.1 55.1 36.4 101.0 10.6
LOS D D A D E D F B
Approach Delay 49.9 36.5 53.1 59.2
Approach LOS D D D E
Intersection Summary
Area Type: Other
Cycle Length: 113
Actuated Cycle Length: 107.9
Control Type: Semi Act-Uncoord
Maximum v/c Ratio: 1.00
Intersection Signal Delay: 47.9 Intersection LOS: D
Intersection Capacity Utilization 87.7% ICU Level of Service E
Analysis Period (min) 15
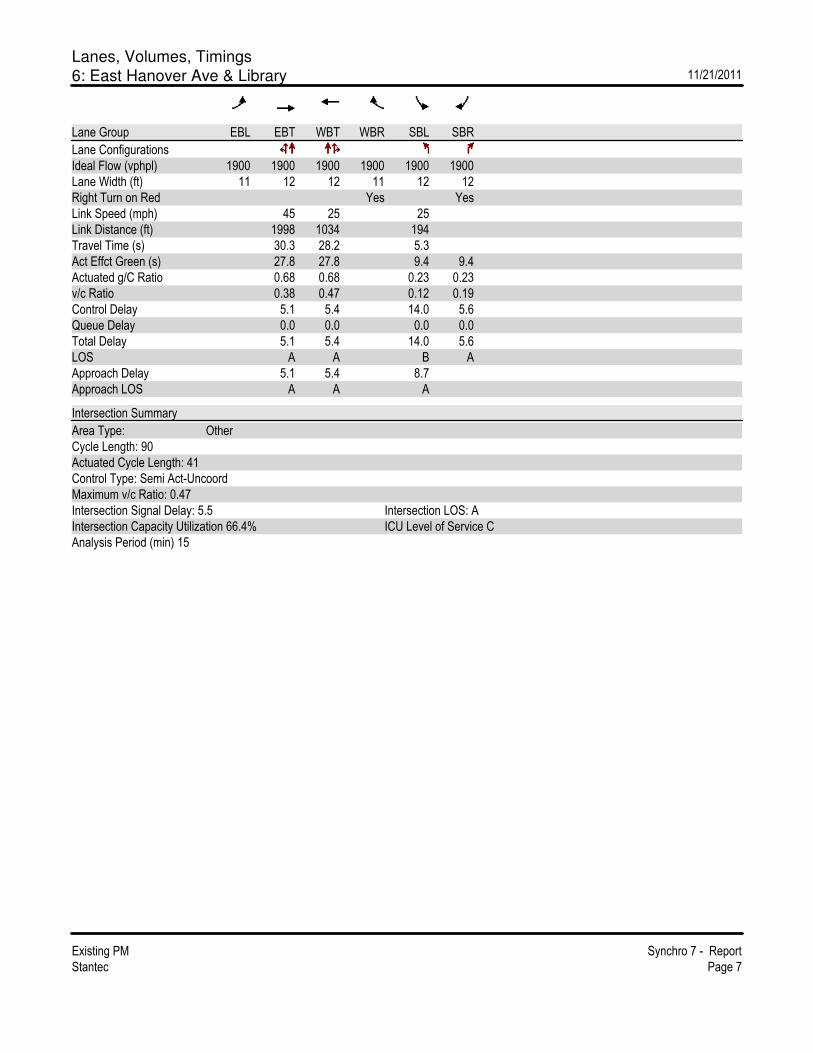
Lanes, Volumes, Timings
6: East Hanover Ave & Library 11/21/2011
Existing PM Synchro 7 - Report
Stantec Page 7
Lane Group EBL EBT WBT WBR SBL SBR
Lane Configurations
Ideal Flow (vphpl) 1900 1900 1900 1900 1900 1900
Lane Width (ft) 11 12 12 11 12 12
Right Turn on Red Yes Yes
Link Speed (mph) 45 25 25
Link Distance (ft) 1998 1034 194
Travel Time (s) 30.3 28.2 5.3
Act Effct Green (s) 27.8 27.8 9.4 9.4
Actuated g/C Ratio 0.68 0.68 0.23 0.23
v/c Ratio 0.38 0.47 0.12 0.19
Control Delay 5.1 5.4 14.0 5.6
Queue Delay 0.0 0.0 0.0 0.0
Total Delay 5.1 5.4 14.0 5.6
LOS A A B A
Approach Delay 5.1 5.4 8.7
Approach LOS A A A
Intersection Summary
Area Type: Other
Cycle Length: 90
Actuated Cycle Length: 41
Control Type: Semi Act-Uncoord
Maximum v/c Ratio: 0.47
Intersection Signal Delay: 5.5 Intersection LOS: A
Intersection Capacity Utilization 66.4% ICU Level of Service C
Analysis Period (min) 15
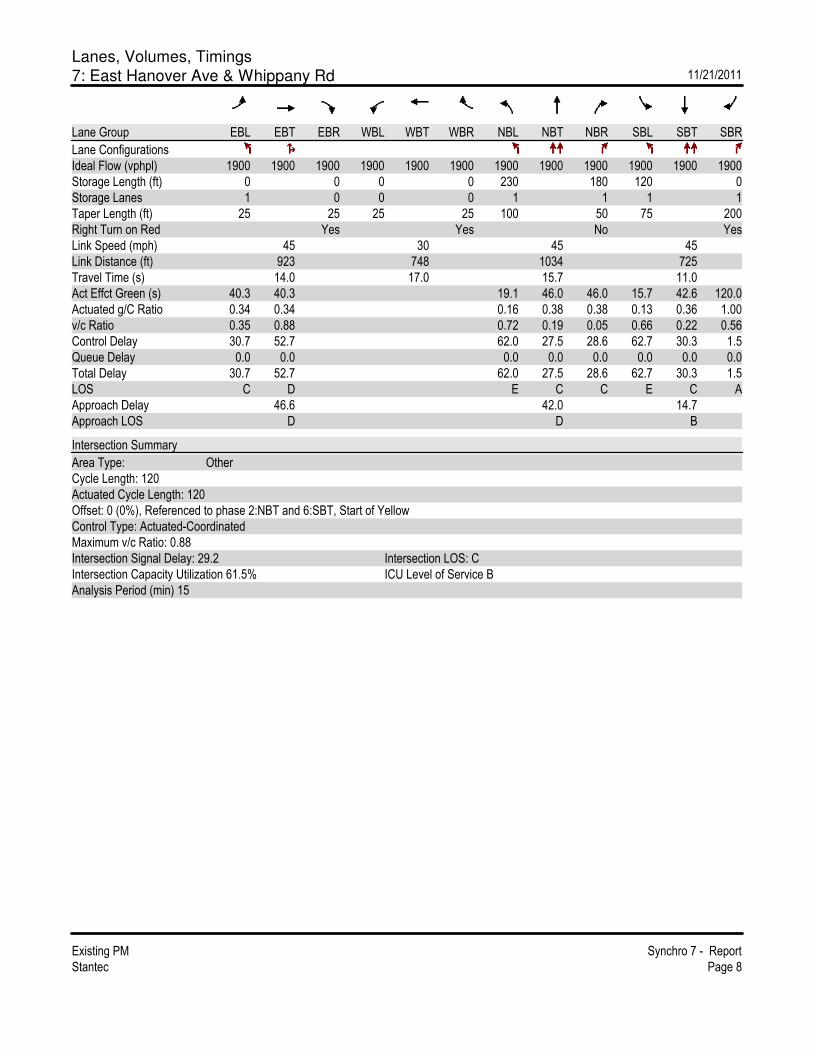
Lanes, Volumes, Timings
7: East Hanover Ave & Whippany Rd 11/21/2011
Existing PM Synchro 7 - Report
Stantec Page 8
Lane Group EBL EBT EBR WBL WBT WBR NBL NBT NBR SBL SBT SBR
Lane Configurations
Ideal Flow (vphpl) 1900 1900 1900 1900 1900 1900 1900 1900 1900 1900 1900 1900
Storage Length (ft) 0 0 0 0 230 180 120 0
Storage Lanes 1 0 0 0 1 1 1 1
Taper Length (ft) 25 25 25 25 100 50 75 200
Right Turn on Red Yes Yes No Yes
Link Speed (mph) 45 30 45 45
Link Distance (ft) 923 748 1034 725
Travel Time (s) 14.0 17.0 15.7 11.0
Act Effct Green (s) 40.3 40.3 19.1 46.0 46.0 15.7 42.6 120.0
Actuated g/C Ratio 0.34 0.34 0.16 0.38 0.38 0.13 0.36 1.00
v/c Ratio 0.35 0.88 0.72 0.19 0.05 0.66 0.22 0.56
Control Delay 30.7 52.7 62.0 27.5 28.6 62.7 30.3 1.5
Queue Delay 0.0 0.0 0.0 0.0 0.0 0.0 0.0 0.0
Total Delay 30.7 52.7 62.0 27.5 28.6 62.7 30.3 1.5
LOS C D E C C E C A
Approach Delay 46.6 42.0 14.7
Approach LOS D D B
Intersection Summary
Area Type: Other
Cycle Length: 120
Actuated Cycle Length: 120
Offset: 0 (0%), Referenced to phase 2:NBT and 6:SBT, Start of Yellow
Control Type: Actuated-Coordinated
Maximum v/c Ratio: 0.88
Intersection Signal Delay: 29.2 Intersection LOS: C
Intersection Capacity Utilization 61.5% ICU Level of Service B
Analysis Period (min) 15

2015 NO BUILD CONDITION
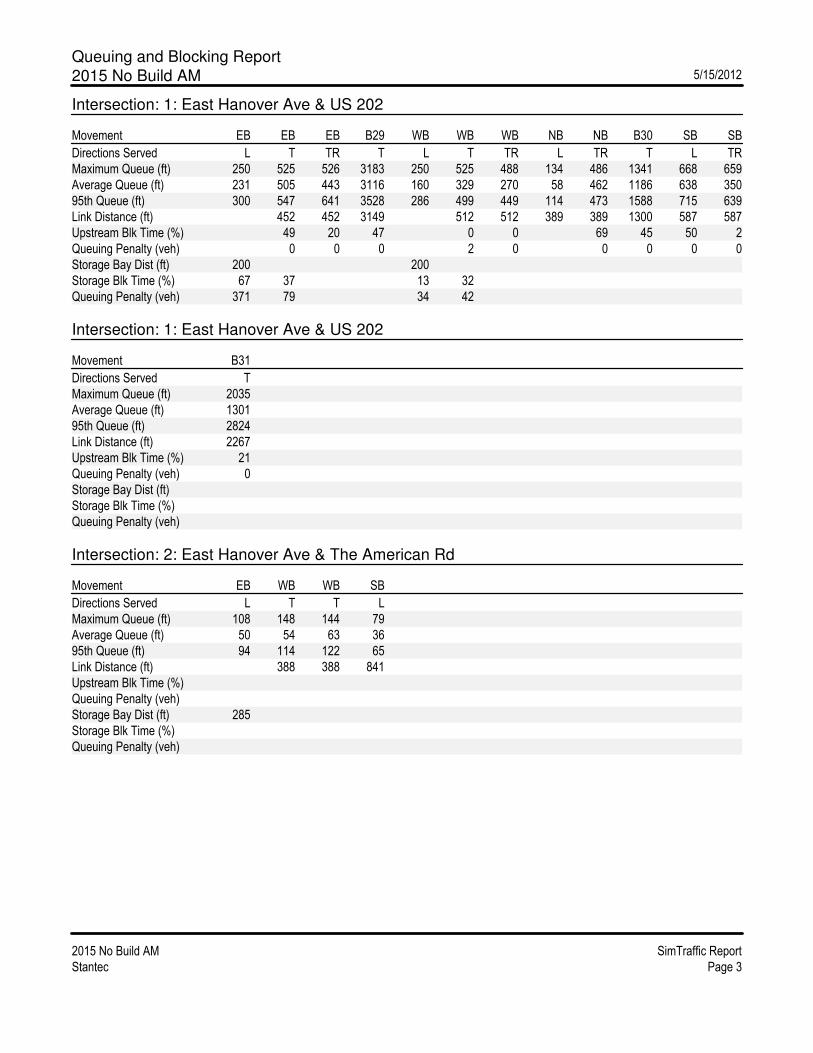
Queuing and Blocking Report
2015 No Build AM 5/15/2012
2015 No Build AM SimTraffic Report
Stantec Page 3
Intersection: 1: East Hanover Ave & US 202
Movement EB EB EB B29 WB WB WB NB NB B30 SB SB
Directions Served L T TR T L T TR L TR T L TR
Maximum Queue (ft) 250 525 526 3183 250 525 488 134 486 1341 668 659
Average Queue (ft) 231 505 443 3116 160 329 270 58 462 1186 638 350
95th Queue (ft) 300 547 641 3528 286 499 449 114 473 1588 715 639
Link Distance (ft) 452 452 3149 512 512 389 389 1300 587 587
Upstream Blk Time (%) 49 20 47 0 0 69 45 50 2
Queuing Penalty (veh) 0 0 0 2 0 0 0 0 0
Storage Bay Dist (ft) 200 200
Storage Blk Time (%) 67 37 13 32
Queuing Penalty (veh) 371 79 34 42
Intersection: 1: East Hanover Ave & US 202
Movement B31
Directions Served T
Maximum Queue (ft) 2035
Average Queue (ft) 1301
95th Queue (ft) 2824
Link Distance (ft) 2267
Upstream Blk Time (%) 21
Queuing Penalty (veh) 0
Storage Bay Dist (ft)
Storage Blk Time (%)
Queuing Penalty (veh)
Intersection: 2: East Hanover Ave & The American Rd
Movement EB WB WB SB
Directions Served L T T L
Maximum Queue (ft) 108 148 144 79
Average Queue (ft) 50 54 63 36
95th Queue (ft) 94 114 122 65
Link Distance (ft) 388 388 841
Upstream Blk Time (%)
Queuing Penalty (veh)
Storage Bay Dist (ft) 285
Storage Blk Time (%)
Queuing Penalty (veh)
Queuing and Blocking Report
2015 No Build AM 5/15/2012
2015 No Build AM SimTraffic Report
Stantec Page 4
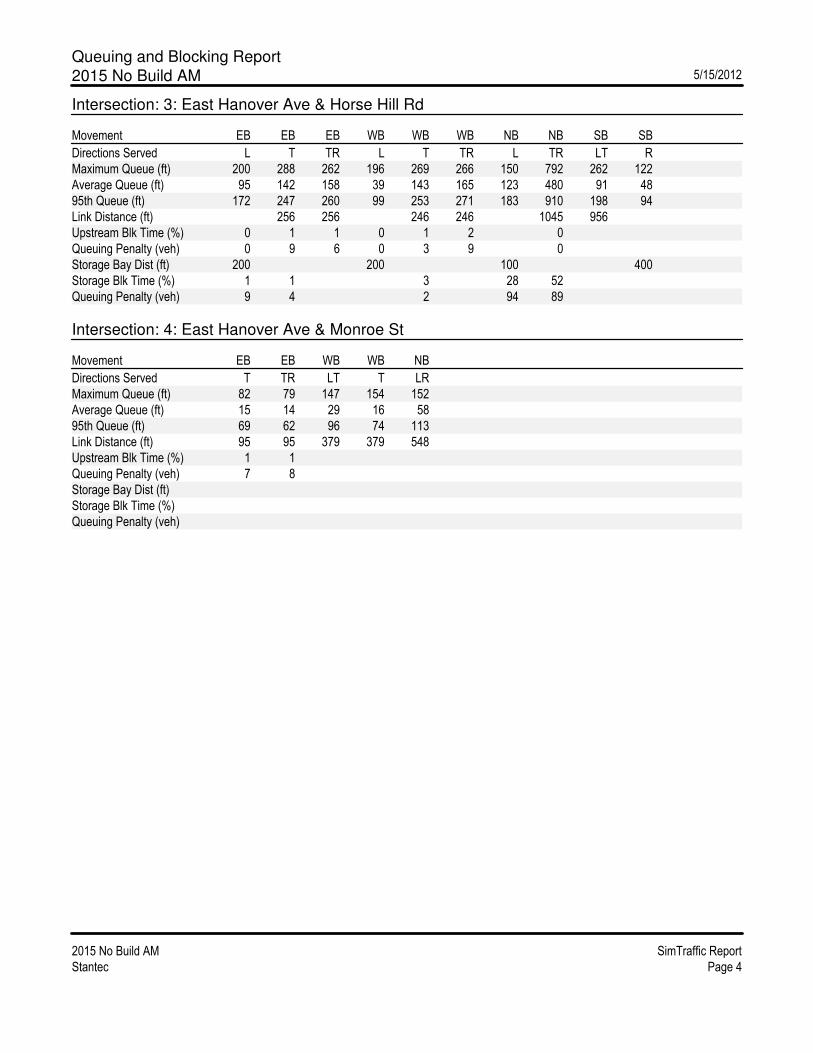
Intersection: 3: East Hanover Ave & Horse Hill Rd
Movement EB EB EB WB WB WB NB NB SB SB
Directions Served L T TR L T TR L TR LT R
Maximum Queue (ft) 200 288 262 196 269 266 150 792 262 122
Average Queue (ft) 95 142 158 39 143 165 123 480 91 48
95th Queue (ft) 172 247 260 99 253 271 183 910 198 94
Link Distance (ft) 256 256 246 246 1045 956
Upstream Blk Time (%) 0 1 1 0 1 2 0
Queuing Penalty (veh) 0 9 6 0 3 9 0
Storage Bay Dist (ft) 200 200 100 400
Storage Blk Time (%) 1 1 3 28 52
Queuing Penalty (veh) 9 4 2 94 89
Intersection: 4: East Hanover Ave & Monroe St
Movement EB EB WB WB NB
Directions Served T TR LT T LR
Maximum Queue (ft) 82 79 147 154 152
Average Queue (ft) 15 14 29 16 58
95th Queue (ft) 69 62 96 74 113
Link Distance (ft) 95 95 379 379 548
Upstream Blk Time (%) 1 1
Queuing Penalty (veh) 7 8
Storage Bay Dist (ft)
Storage Blk Time (%)
Queuing Penalty (veh)

Queuing and Blocking Report
2015 No Build AM 5/15/2012
2015 No Build AM SimTraffic Report
Stantec Page 5
Intersection: 5: East Hanover Ave & Ridgedale Ave
Movement EB EB WB WB WB B17 B17 NB NB NB B20 B20
Directions Served LT TR LT T R T T L T TR T T
Maximum Queue (ft) 432 438 685 681 280 413 432 150 354 351 599 557
Average Queue (ft) 402 405 572 577 77 182 188 149 327 186 300 75
95th Queue (ft) 481 474 845 845 282 571 588 152 388 324 631 354
Link Distance (ft) 347 347 659 659 1933 1933 262 262 572 572
Upstream Blk Time (%) 38 43 32 33 72 4 6 1
Queuing Penalty (veh) 283 321 120 120 0 0 0 0
Storage Bay Dist (ft) 230 100
Storage Blk Time (%) 71 79 9
Queuing Penalty (veh) 40 122 30
Intersection: 5: East Hanover Ave & Ridgedale Ave
Movement SB SB SB B19 B19
Directions Served L T R T T
Maximum Queue (ft) 300 593 563 389 300
Average Queue (ft) 162 461 98 114 34
95th Queue (ft) 345 737 380 350 162
Link Distance (ft) 507 507 522 522
Upstream Blk Time (%) 41 2 0
Queuing Penalty (veh) 0 0 0
Storage Bay Dist (ft) 250
Storage Blk Time (%) 61
Queuing Penalty (veh) 82
Intersection: 6: East Hanover Ave & Library
Movement EB EB WB WB SB SB
Directions Served LT T T TR L R
Maximum Queue (ft) 1564 1592 38 66 10 30
Average Queue (ft) 773 786 4 9 0 7
95th Queue (ft) 1713 1739 22 39 5 27
Link Distance (ft) 1933 1933 962 962 151 151
Upstream Blk Time (%)
Queuing Penalty (veh)
Storage Bay Dist (ft)
Storage Blk Time (%)
Queuing Penalty (veh)

Queuing and Blocking Report
2015 No Build AM 5/15/2012
2015 No Build AM SimTraffic Report
Stantec Page 6
Intersection: 7: East Hanover Ave & Whippany Rd
Movement EB EB B25 B25 NB NB NB NB SB SB SB
Directions Served L TR T T L T T R L T T
Maximum Queue (ft) 379 876 1058 1013 96 111 140 69 169 295 241
Average Queue (ft) 119 860 788 847 26 42 61 22 132 117 93
95th Queue (ft) 280 886 1506 1309 71 87 112 55 195 263 168
Link Distance (ft) 793 793 962 962 956 956 588 588
Upstream Blk Time (%) 53 36 39
Queuing Penalty (veh) 396 267 293
Storage Bay Dist (ft) 230 180 120
Storage Blk Time (%) 0 26 1
Queuing Penalty (veh) 0 46 2
Intersection: 8: East Hanover Ave & Shoprite Driveway1
Movement EB WB SB
Directions Served L TR LR
Maximum Queue (ft) 36 7 39
Average Queue (ft) 7 0 11
95th Queue (ft) 28 4 35
Link Distance (ft) 381 264
Upstream Blk Time (%)
Queuing Penalty (veh)
Storage Bay Dist (ft) 150
Storage Blk Time (%)
Queuing Penalty (veh)
Intersection: 9: East Hanover Ave & Shoprite Driveway2
Movement EB EB EB WB SB
Directions Served L T T TR LR
Maximum Queue (ft) 31 61 88 7 38
Average Queue (ft) 3 4 6 0 8
95th Queue (ft) 16 48 40 4 31
Link Distance (ft) 381 381 256 302
Upstream Blk Time (%)
Queuing Penalty (veh)
Storage Bay Dist (ft) 150
Storage Blk Time (%) 0
Queuing Penalty (veh) 0
Queuing and Blocking Report
2015 No Build AM 5/15/2012
2015 No Build AM SimTraffic Report
Stantec Page 7
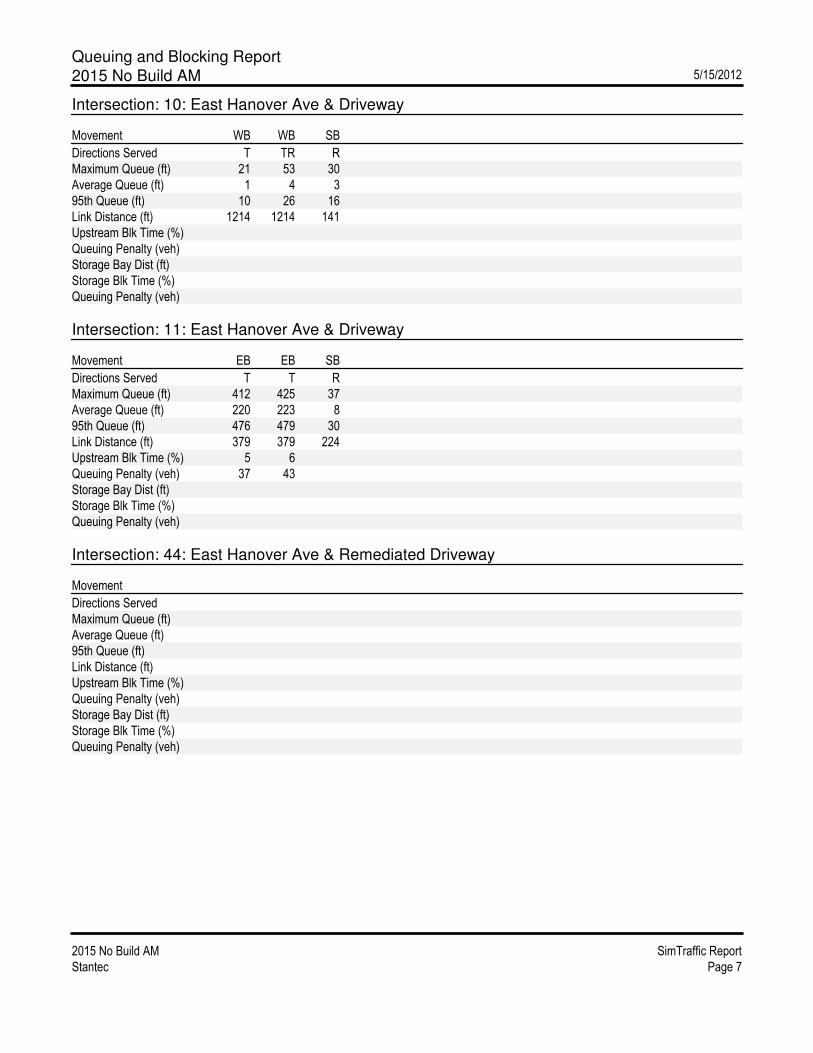
Intersection: 10: East Hanover Ave & Driveway
Movement WB WB SB
Directions Served T TR R
Maximum Queue (ft) 21 53 30
Average Queue (ft) 1 4 3
95th Queue (ft) 10 26 16
Link Distance (ft) 1214 1214 141
Upstream Blk Time (%)
Queuing Penalty (veh)
Storage Bay Dist (ft)
Storage Blk Time (%)
Queuing Penalty (veh)
Intersection: 11: East Hanover Ave & Driveway
Movement EB EB SB
Directions Served T T R
Maximum Queue (ft) 412 425 37
Average Queue (ft) 220 223 8
95th Queue (ft) 476 479 30
Link Distance (ft) 379 379 224
Upstream Blk Time (%) 5 6
Queuing Penalty (veh) 37 43
Storage Bay Dist (ft)
Storage Blk Time (%)
Queuing Penalty (veh)
Intersection: 44: East Hanover Ave & Remediated Driveway
Movement
Directions Served
Maximum Queue (ft)
Average Queue (ft)
95th Queue (ft)
Link Distance (ft)
Upstream Blk Time (%)
Queuing Penalty (veh)
Storage Bay Dist (ft)
Storage Blk Time (%)
Queuing Penalty (veh)
Queuing and Blocking Report
2015 No Build AM 5/15/2012
2015 No Build AM SimTraffic Report
Stantec Page 8
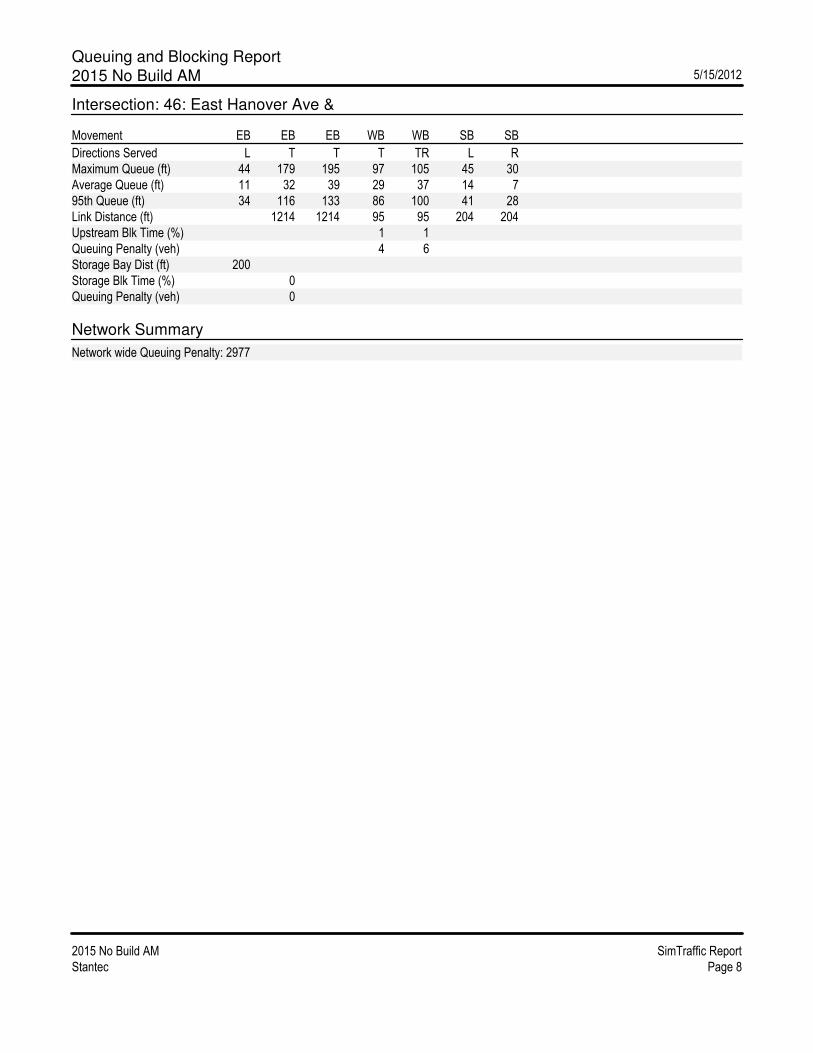
Intersection: 46: East Hanover Ave &
Movement EB EB EB WB WB SB SB
Directions Served L T T T TR L R
Maximum Queue (ft) 44 179 195 97 105 45 30
Average Queue (ft) 11 32 39 29 37 14 7
95th Queue (ft) 34 116 133 86 100 41 28
Link Distance (ft) 1214 1214 95 95 204 204
Upstream Blk Time (%) 1 1
Queuing Penalty (veh) 4 6
Storage Bay Dist (ft) 200
Storage Blk Time (%) 0
Queuing Penalty (veh) 0
Network Summary
Network wide Queuing Penalty: 2977
Queuing and Blocking Report
2015 No Build PM 5/15/2012
2015 No Build PM SimTraffic Report
Stantec Page 3
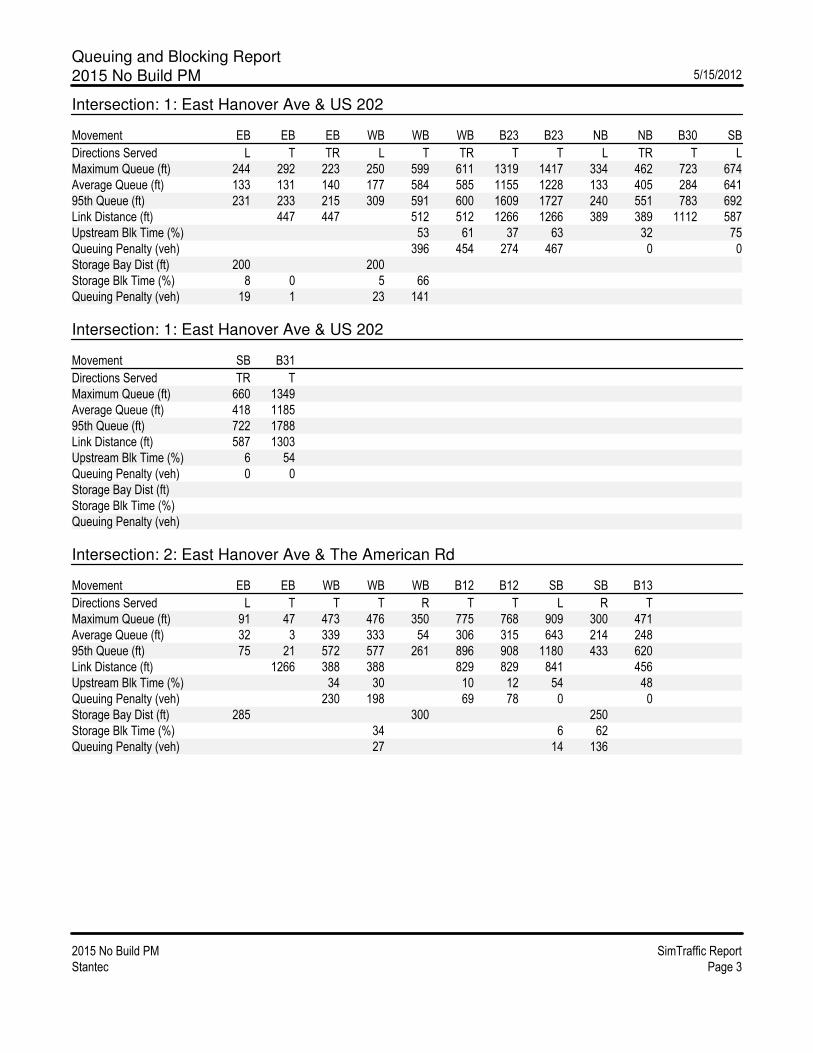
Intersection: 1: East Hanover Ave & US 202
Movement EB EB EB WB WB WB B23 B23 NB NB B30 SB
Directions Served L T TR L T TR T T L TR T L
Maximum Queue (ft) 244 292 223 250 599 611 1319 1417 334 462 723 674
Average Queue (ft) 133 131 140 177 584 585 1155 1228 133 405 284 641
95th Queue (ft) 231 233 215 309 591 600 1609 1727 240 551 783 692
Link Distance (ft) 447 447 512 512 1266 1266 389 389 1112 587
Upstream Blk Time (%) 53 61 37 63 32 75
Queuing Penalty (veh) 396 454 274 467 0 0
Storage Bay Dist (ft) 200 200
Storage Blk Time (%) 8 0 5 66
Queuing Penalty (veh) 19 1 23 141
Intersection: 1: East Hanover Ave & US 202
Movement SB B31
Directions Served TR T
Maximum Queue (ft) 660 1349
Average Queue (ft) 418 1185
95th Queue (ft) 722 1788
Link Distance (ft) 587 1303
Upstream Blk Time (%) 6 54
Queuing Penalty (veh) 0 0
Storage Bay Dist (ft)
Storage Blk Time (%)
Queuing Penalty (veh)
Intersection: 2: East Hanover Ave & The American Rd
Movement EB EB WB WB WB B12 B12 SB SB B13
Directions Served L T T T R T T L R T
Maximum Queue (ft) 91 47 473 476 350 775 768 909 300 471
Average Queue (ft) 32 3 339 333 54 306 315 643 214 248
95th Queue (ft) 75 21 572 577 261 896 908 1180 433 620
Link Distance (ft) 1266 388 388 829 829 841 456
Upstream Blk Time (%) 34 30 10 12 54 48
Queuing Penalty (veh) 230 198 69 78 0 0
Storage Bay Dist (ft) 285 300 250
Storage Blk Time (%) 34 6 62
Queuing Penalty (veh) 27 14 136

Queuing and Blocking Report
2015 No Build PM 5/15/2012
2015 No Build PM SimTraffic Report
Stantec Page 4
Intersection: 3: East Hanover Ave & Horse Hill Rd
Movement EB EB EB WB WB WB NB NB SB SB B21
Directions Served L T TR L T TR L TR LT R T
Maximum Queue (ft) 239 230 247 235 299 278 138 221 1244 450 467
Average Queue (ft) 114 113 133 102 230 236 49 88 795 295 72
95th Queue (ft) 201 202 227 231 314 298 111 164 1500 597 311
Link Distance (ft) 257 257 242 242 1337 1166 853
Upstream Blk Time (%) 0 0 0 1 15 23 14
Queuing Penalty (veh) 0 0 1 0 111 165 0
Storage Bay Dist (ft) 200 200 100 400
Storage Blk Time (%) 2 0 2 22 1 6 43 8
Queuing Penalty (veh) 6 0 10 33 3 5 103 29
Intersection: 4: East Hanover Ave & Monroe St
Movement EB EB WB WB NB
Directions Served T TR LT T LR
Maximum Queue (ft) 162 130 406 447 566
Average Queue (ft) 100 97 256 247 303
95th Queue (ft) 141 130 460 468 637
Link Distance (ft) 88 88 392 392 548
Upstream Blk Time (%) 54 56 7 4 26
Queuing Penalty (veh) 240 248 52 28 0
Storage Bay Dist (ft)
Storage Blk Time (%)
Queuing Penalty (veh)

Queuing and Blocking Report
2015 No Build PM 5/15/2012
2015 No Build PM SimTraffic Report
Stantec Page 5
Intersection: 5: East Hanover Ave & Ridgedale Ave
Movement EB EB WB WB WB B17 B17 NB NB NB B20 B20
Directions Served LT TR LT T R T T L T TR T T
Maximum Queue (ft) 426 431 730 755 280 1950 1952 150 354 364 622 606
Average Queue (ft) 406 407 729 730 83 1187 1202 148 335 321 498 436
95th Queue (ft) 424 420 731 744 291 2138 2148 162 355 386 770 775
Link Distance (ft) 335 335 659 659 1933 1933 262 262 572 572
Upstream Blk Time (%) 64 74 62 59 5 6 82 60 51 11
Queuing Penalty (veh) 303 351 417 400 33 39 0 0 0 0
Storage Bay Dist (ft) 230 100
Storage Blk Time (%) 63 79 29
Queuing Penalty (veh) 75 165 88
Intersection: 5: East Hanover Ave & Ridgedale Ave
Movement SB SB SB B19 B19
Directions Served L T R T T
Maximum Queue (ft) 300 592 570 686 672
Average Queue (ft) 197 569 313 626 537
95th Queue (ft) 371 578 691 796 840
Link Distance (ft) 496 496 645 645
Upstream Blk Time (%) 78 8 70 11
Queuing Penalty (veh) 0 0 0 0
Storage Bay Dist (ft) 250
Storage Blk Time (%) 1 81
Queuing Penalty (veh) 4 162
Intersection: 6: East Hanover Ave & Library
Movement EB EB WB WB B25 B25 SB SB
Directions Served LT T T TR T T L R
Maximum Queue (ft) 219 214 540 564 230 347 71 89
Average Queue (ft) 98 80 226 247 55 78 29 35
95th Queue (ft) 181 159 720 729 337 492 59 71
Link Distance (ft) 1933 1933 962 962 793 793 151 151
Upstream Blk Time (%) 7 7 2 0
Queuing Penalty (veh) 43 45 14 0
Storage Bay Dist (ft)
Storage Blk Time (%)
Queuing Penalty (veh)

Queuing and Blocking Report
2015 No Build PM 5/15/2012
2015 No Build PM SimTraffic Report
Stantec Page 6
Intersection: 7: East Hanover Ave & Whippany Rd
Movement EB EB NB NB NB NB SB SB SB SB B28
Directions Served L TR L T T R L T T R T
Maximum Queue (ft) 242 662 272 114 141 80 169 310 141 221 94
Average Queue (ft) 109 393 140 42 69 18 124 92 80 29 4
95th Queue (ft) 199 617 233 86 121 54 189 217 134 247 53
Link Distance (ft) 793 793 953 953 588 588 588 396
Upstream Blk Time (%) 1
Queuing Penalty (veh) 0
Storage Bay Dist (ft) 230 180 120
Storage Blk Time (%) 1 16 0
Queuing Penalty (veh) 2 26 1
Intersection: 46: East Hanover Ave &
Movement EB EB EB WB WB SB SB
Directions Served L T T T TR L R
Maximum Queue (ft) 249 881 879 114 114 122 44
Average Queue (ft) 41 433 441 65 75 34 18
95th Queue (ft) 146 944 942 128 134 94 42
Link Distance (ft) 1229 1229 88 88 267 267
Upstream Blk Time (%) 6 10
Queuing Penalty (veh) 45 74
Storage Bay Dist (ft) 200
Storage Blk Time (%) 43
Queuing Penalty (veh) 13
Zone Summary
Zone wide Queuing Penalty: 5860

2015 ALTERNATIVE 1
Timings
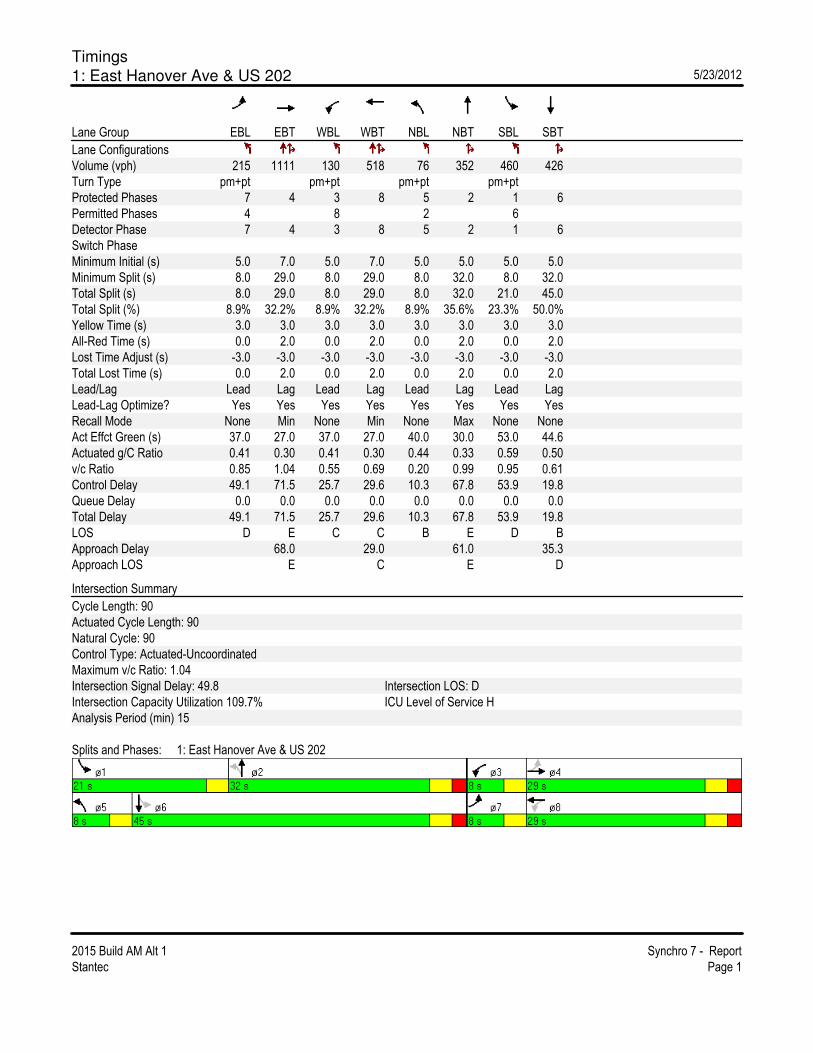
1: East Hanover Ave & US 202 5/23/2012
2015 Build AM Alt 1 Synchro 7 - Report
Stantec Page 1
Lane Group EBL EBT WBL WBT NBL NBT SBL SBT
Lane Configurations
Volume (vph) 215 1111 130 518 76 352 460 426
Turn Type pm+pt pm+pt pm+pt pm+pt
Protected Phases 7 4 3 8 5 2 1 6
Permitted Phases 4 8 2 6
Detector Phase 7 4 3 8 5 2 1 6
Switch Phase
Minimum Initial (s) 5.0 7.0 5.0 7.0 5.0 5.0 5.0 5.0
Minimum Split (s) 8.0 29.0 8.0 29.0 8.0 32.0 8.0 32.0
Total Split (s) 8.0 29.0 8.0 29.0 8.0 32.0 21.0 45.0
Total Split (%) 8.9% 32.2% 8.9% 32.2% 8.9% 35.6% 23.3% 50.0%
Yellow Time (s) 3.0 3.0 3.0 3.0 3.0 3.0 3.0 3.0
All-Red Time (s) 0.0 2.0 0.0 2.0 0.0 2.0 0.0 2.0
Lost Time Adjust (s) -3.0 -3.0 -3.0 -3.0 -3.0 -3.0 -3.0 -3.0
Total Lost Time (s) 0.0 2.0 0.0 2.0 0.0 2.0 0.0 2.0
Lead/Lag Lead Lag Lead Lag Lead Lag Lead Lag
Lead-Lag Optimize? Yes Yes Yes Yes Yes Yes Yes Yes
Recall Mode None Min None Min None Max None None
Act Effct Green (s) 37.0 27.0 37.0 27.0 40.0 30.0 53.0 44.6
Actuated g/C Ratio 0.41 0.30 0.41 0.30 0.44 0.33 0.59 0.50
v/c Ratio 0.85 1.04 0.55 0.69 0.20 0.99 0.95 0.61
Control Delay 49.1 71.5 25.7 29.6 10.3 67.8 53.9 19.8
Queue Delay 0.0 0.0 0.0 0.0 0.0 0.0 0.0 0.0
Total Delay 49.1 71.5 25.7 29.6 10.3 67.8 53.9 19.8
LOS D E C C B E D B
Approach Delay 68.0 29.0 61.0 35.3
Approach LOS E C E D
Intersection Summary
Cycle Length: 90
Actuated Cycle Length: 90
Natural Cycle: 90
Control Type: Actuated-Uncoordinated
Maximum v/c Ratio: 1.04
Intersection Signal Delay: 49.8 Intersection LOS: D
Intersection Capacity Utilization 109.7% ICU Level of Service H
Analysis Period (min) 15
Splits and Phases: 1: East Hanover Ave & US 202

Timings
2: East Hanover Ave & The American Rd 5/23/2012
2015 Build AM Alt 1 Synchro 7 - Report
Stantec Page 2
Lane Group EBL EBT WBT WBR SBL SBR ø2
Lane Configurations
Volume (vph) 202 1586 756 260 61 55
Turn Type custom Free Free
Protected Phases 5 2 4! 6 4! 2
Permitted Phases 2 Free Free
Detector Phase 5 2 4 6 4
Switch Phase
Minimum Initial (s) 7.0 7.0 7.0 5.0
Minimum Split (s) 10.0 26.0 12.0 12.0
Total Split (s) 11.0 50.0 26.0 0.0 13.0 0.0 37.0
Total Split (%) 22.0% 100.0% 52.0% 0.0% 26.0% 0.0% 74%
Yellow Time (s) 3.0 5.0 3.0 5.0
All-Red Time (s) 0.0 2.0 2.0 2.0
Lost Time Adjust (s) 0.0 0.0 0.0 0.0 0.0 0.0
Total Lost Time (s) 3.0 7.0 7.0 4.0 5.0 4.0
Lead/Lag Lead Lag
Lead-Lag Optimize? Yes Yes
Recall Mode None Min None None
Act Effct Green (s) 32.1 48.1 19.4 48.1 8.0 48.1
Actuated g/C Ratio 0.67 1.00 0.40 1.00 0.17 1.00
v/c Ratio 0.40 0.48 0.56 0.18 0.20 0.03
Control Delay 5.3 0.5 13.8 0.3 19.7 0.0
Queue Delay 0.0 0.0 0.0 0.0 0.0 0.0
Total Delay 5.3 0.5 13.8 0.3 19.7 0.0
LOS A A B A B A
Approach Delay 1.0 10.3 10.4
Approach LOS A B B
Intersection Summary
Cycle Length: 50
Actuated Cycle Length: 48.1
Natural Cycle: 50
Control Type: Actuated-Uncoordinated
Maximum v/c Ratio: 0.56
Intersection Signal Delay: 4.6 Intersection LOS: A
Intersection Capacity Utilization 59.7% ICU Level of Service B
Analysis Period (min) 15
! Phase conflict between lane groups.
Splits and Phases: 2: East Hanover Ave & The American Rd

Timings
3: East Hanover Ave & Horse Hill Rd 5/23/2012
2015 Build AM Alt 1 Synchro 7 - Report
Stantec Page 3
Lane Group EBL EBT WBL WBT NBL NBT SBL SBT SBR
Lane Configurations
Volume (vph) 299 1207 73 785 171 218 62 72 176
Turn Type pm+pt pm+pt pm+pt Perm Perm
Protected Phases 5 2 1 6 3 8 4
Permitted Phases 2 6 8 4 4
Detector Phase 5 2 1 6 3 8 4 4 4
Switch Phase
Minimum Initial (s) 7.0 7.0 7.0 7.0 5.0 7.0 7.0 7.0 7.0
Minimum Split (s) 10.0 32.0 10.0 32.0 10.0 27.0 27.0 27.0 27.0
Total Split (s) 17.0 43.0 10.0 36.0 10.0 37.0 27.0 27.0 27.0
Total Split (%) 18.9% 47.8% 11.1% 40.0% 11.1% 41.1% 30.0% 30.0% 30.0%
Yellow Time (s) 3.0 4.0 3.0 4.0 3.0 3.0 3.0 3.0 3.0
All-Red Time (s) 0.0 2.0 0.0 2.0 0.0 2.0 2.0 2.0 2.0
Lost Time Adjust (s) -2.0 -2.0 -2.0 -2.0 -2.0 -2.0 -2.0 -2.0 0.0
Total Lost Time (s) 1.0 4.0 1.0 4.0 1.0 3.0 3.0 3.0 5.0
Lead/Lag Lead Lag Lead Lag Lead Lag Lag Lag
Lead-Lag Optimize? Yes Yes Yes Yes Yes Yes Yes Yes
Recall Mode None C-Min None C-Min None None None None None
Act Effct Green (s) 59.1 47.9 52.4 40.2 28.9 26.9 16.7 14.7
Actuated g/C Ratio 0.66 0.53 0.58 0.45 0.32 0.30 0.19 0.16
v/c Ratio 0.65 0.75 0.28 0.56 0.48 0.65 0.60 0.45
Control Delay 15.4 21.6 18.2 13.9 26.8 29.9 43.4 8.5
Queue Delay 0.0 0.0 0.0 0.0 0.0 0.0 0.0 0.0
Total Delay 15.4 21.6 18.2 13.9 26.8 29.9 43.4 8.5
LOS B C B B C C D A
Approach Delay 20.5 14.2 28.8 23.6
Approach LOS C B C C
Intersection Summary
Cycle Length: 90
Actuated Cycle Length: 90
Offset: 67 (74%), Referenced to phase 2:EBTL and 6:WBTL, Start of Yellow
Natural Cycle: 80
Control Type: Actuated-Coordinated
Maximum v/c Ratio: 0.75
Intersection Signal Delay: 20.3 Intersection LOS: C
Intersection Capacity Utilization 82.7% ICU Level of Service E
Analysis Period (min) 15
Splits and Phases: 3: East Hanover Ave & Horse Hill Rd

HCM Unsignalized Intersection Capacity Analysis
4: East Hanover Ave & Monroe St 5/23/2012
2015 Build AM Alt 1 Synchro 7 - Report
Stantec Page 4
Movement EBT EBR WBL WBT NBL NBR
Lane Configurations
Volume (veh/h) 1365 3 25 914 1 115
Sign Control Free Free Stop
Grade 0% 0% 0%
Peak Hour Factor 0.95 0.95 0.95 0.95 0.95 0.95
Hourly flow rate (vph) 1437 3 26 962 1 121
Pedestrians 1
Lane Width (ft) 12.0
Walking Speed (ft/s) 4.0
Percent Blockage 0
Right turn flare (veh)
Median type None None
Median storage veh)
Upstream signal (ft) 161 847
pX, platoon unblocked 0.87 0.93 0.87
vC, conflicting volume 1440 1972 721
vC1, stage 1 conf vol
vC2, stage 2 conf vol
vCu, unblocked vol 1204 1284 376
tC, single (s) 4.1 6.8 6.9
tC, 2 stage (s)
tF (s) 2.2 3.5 3.3
p0 queue free % 95 99 78
cM capacity (veh/h) 500 141 539
Direction, Lane # EB 1 EB 2 WB 1 WB 2 NB 1
Volume Total 958 482 347 641 122
Volume Left 0 0 26 0 1
Volume Right 0 3 0 0 121
cSH 1700 1700 500 1700 527
Volume to Capacity 0.56 0.28 0.05 0.38 0.23
Queue Length 95th (ft) 0 0 4 0 22
Control Delay (s) 0.0 0.0 1.7 0.0 13.9
Lane LOS A B
Approach Delay (s) 0.0 0.6 13.9
Approach LOS B
Intersection Summary
Average Delay 0.9
Intersection Capacity Utilization 57.4% ICU Level of Service B
Analysis Period (min) 15

Timings
5: East Hanover Ave & Ridgedale Ave 5/23/2012
2015 Build AM Alt 1 Synchro 7 - Report
Stantec Page 5
Lane Group EBT WBT WBR NBL NBT SBL SBT SBR
Lane Configurations
Volume (vph) 1218 545 57 338 310 133 232 77
Turn Type Free pm+pt pm+pt Perm
Protected Phases 2 6 3 8 7 4
Permitted Phases Free 8 4 4
Detector Phase 2 6 3 8 7 4 4
Switch Phase
Minimum Initial (s) 7.0 7.0 5.0 7.0 5.0 7.0 7.0
Minimum Split (s) 13.0 13.0 8.0 31.0 8.0 27.0 27.0
Total Split (s) 34.0 17.0 0.0 12.0 31.0 8.0 27.0 27.0
Total Split (%) 37.8% 18.9% 0.0% 13.3% 34.4% 8.9% 30.0% 30.0%
Yellow Time (s) 4.0 4.0 3.0 4.0 3.0 4.0 4.0
All-Red Time (s) 2.0 2.0 0.0 2.0 0.0 2.0 2.0
Lost Time Adjust (s) -2.0 -2.0 0.0 -2.0 -2.0 -2.0 -2.0 -2.0
Total Lost Time (s) 4.0 4.0 4.0 1.0 4.0 1.0 4.0 4.0
Lead/Lag Lead Lag Lead Lag Lag
Lead-Lag Optimize? Yes Yes Yes Yes Yes
Recall Mode C-Max Max None Min None Min Min
Act Effct Green (s) 34.9 13.0 90.0 33.1 22.1 28.1 18.1 18.1
Actuated g/C Ratio 0.39 0.14 1.00 0.37 0.25 0.31 0.20 0.20
v/c Ratio 1.22 1.36 0.03 1.05 0.48 0.41 0.67 0.22
Control Delay 127.9 206.4 0.0 89.2 28.2 22.6 42.2 8.1
Queue Delay 0.0 0.0 0.0 0.0 0.0 0.0 0.0 0.0
Total Delay 127.9 206.4 0.0 89.2 28.2 22.6 42.2 8.1
LOS F F A F C C D A
Approach Delay 127.9 190.0 57.0 30.4
Approach LOS F F E C
Intersection Summary
Cycle Length: 90
Actuated Cycle Length: 90
Offset: 0 (0%), Referenced to phase 2:EBTL, Start of Yellow, Master Intersection
Natural Cycle: 130
Control Type: Actuated-Coordinated
Maximum v/c Ratio: 1.36
Intersection Signal Delay: 113.5 Intersection LOS: F
Intersection Capacity Utilization 106.4% ICU Level of Service G
Analysis Period (min) 15
Splits and Phases: 5: East Hanover Ave & Ridgedale Ave

Timings
6: East Hanover Ave & Library 5/23/2012
2015 Build AM Alt 1 Synchro 7 - Report
Stantec Page 6
Lane Group EBL EBT WBT SBL SBR
Lane Configurations
Volume (vph) 17 1492 732 1 5
Turn Type Perm Perm
Protected Phases 2 6 4
Permitted Phases 2 4
Detector Phase 2 2 6 4 4
Switch Phase
Minimum Initial (s) 5.0 5.0 5.0 5.0 5.0
Minimum Split (s) 29.0 29.0 29.0 30.0 30.0
Total Split (s) 60.0 60.0 60.0 30.0 30.0
Total Split (%) 66.7% 66.7% 66.7% 33.3% 33.3%
Yellow Time (s) 5.0 5.0 5.0 3.0 3.0
All-Red Time (s) 2.0 2.0 2.0 2.0 2.0
Lost Time Adjust (s) 0.0 -2.0 -2.0 -2.0 -2.0
Total Lost Time (s) 7.0 5.0 5.0 3.0 3.0
Lead/Lag
Lead-Lag Optimize?
Recall Mode C-Max C-Max C-Max None None
Act Effct Green (s) 86.7 86.7 7.7 7.7
Actuated g/C Ratio 0.96 0.96 0.09 0.09
v/c Ratio 0.47 0.22 0.01 0.04
Control Delay 2.0 0.6 37.0 23.8
Queue Delay 0.0 0.0 0.0 0.0
Total Delay 2.0 0.6 37.0 23.8
LOS A A D C
Approach Delay 2.0 0.6 26.0
Approach LOS A A C
Intersection Summary
Cycle Length: 90
Actuated Cycle Length: 90
Offset: 78 (87%), Referenced to phase 2:EBTL and 6:WBT, Start of Yellow
Natural Cycle: 65
Control Type: Actuated-Coordinated
Maximum v/c Ratio: 0.47
Intersection Signal Delay: 1.6 Intersection LOS: A
Intersection Capacity Utilization 64.9% ICU Level of Service C
Analysis Period (min) 15
Splits and Phases: 6: East Hanover Ave & Library

Timings
7: East Hanover Ave & Whippany Rd 5/23/2012
2015 Build AM Alt 1 Synchro 7 - Report
Stantec Page 7
Lane Group EBL EBT NBL NBT NBR SBL SBT SBR
Lane Configurations
Volume (vph) 487 869 59 243 29 220 345 688
Turn Type Prot pm+pt Perm pm+pt Free
Protected Phases 7 4 5 2 1 6
Permitted Phases 2 2 6 Free
Detector Phase 7 4 5 2 2 1 6
Switch Phase
Minimum Initial (s) 7.0 7.0 5.0 7.0 7.0 5.0 7.0
Minimum Split (s) 23.0 13.0 9.0 13.0 13.0 9.0 28.0
Total Split (s) 53.0 53.0 9.0 23.0 23.0 14.0 28.0 0.0
Total Split (%) 58.9% 58.9% 10.0% 25.6% 25.6% 15.6% 31.1% 0.0%
Yellow Time (s) 4.0 4.0 4.0 4.0 4.0 4.0 4.0
All-Red Time (s) 2.0 2.0 0.0 2.0 2.0 0.0 2.0
Lost Time Adjust (s) -2.0 0.0 -2.0 -2.0 -2.0 -2.0 -2.0 -2.0
Total Lost Time (s) 4.0 6.0 2.0 4.0 4.0 2.0 4.0 2.0
Lead/Lag Lead Lag Lag Lead Lag
Lead-Lag Optimize? Yes Yes Yes Yes Yes
Recall Mode None C-Max None Max Max None Min
Act Effct Green (s) 49.0 47.0 28.2 19.2 19.2 35.0 25.8 90.0
Actuated g/C Ratio 0.54 0.52 0.31 0.21 0.21 0.39 0.29 1.00
v/c Ratio 0.53 1.09 0.16 0.34 0.09 0.48 0.35 0.45
Control Delay 6.9 69.3 18.9 31.7 29.5 23.2 27.4 0.9
Queue Delay 0.0 0.0 0.0 0.0 0.0 0.0 0.0 0.0
Total Delay 6.9 69.3 18.9 31.7 29.5 23.2 27.4 0.9
LOS A E B C C C C A
Approach Delay 48.9 29.2 12.1
Approach LOS D C B
Intersection Summary
Cycle Length: 90
Actuated Cycle Length: 90
Offset: 75 (83%), Referenced to phase 4:EBT, Start of Yellow
Natural Cycle: 90
Control Type: Actuated-Coordinated
Maximum v/c Ratio: 1.09
Intersection Signal Delay: 31.8 Intersection LOS: C
Intersection Capacity Utilization 84.6% ICU Level of Service E
Analysis Period (min) 15
Splits and Phases: 7: East Hanover Ave & Whippany Rd
Timings
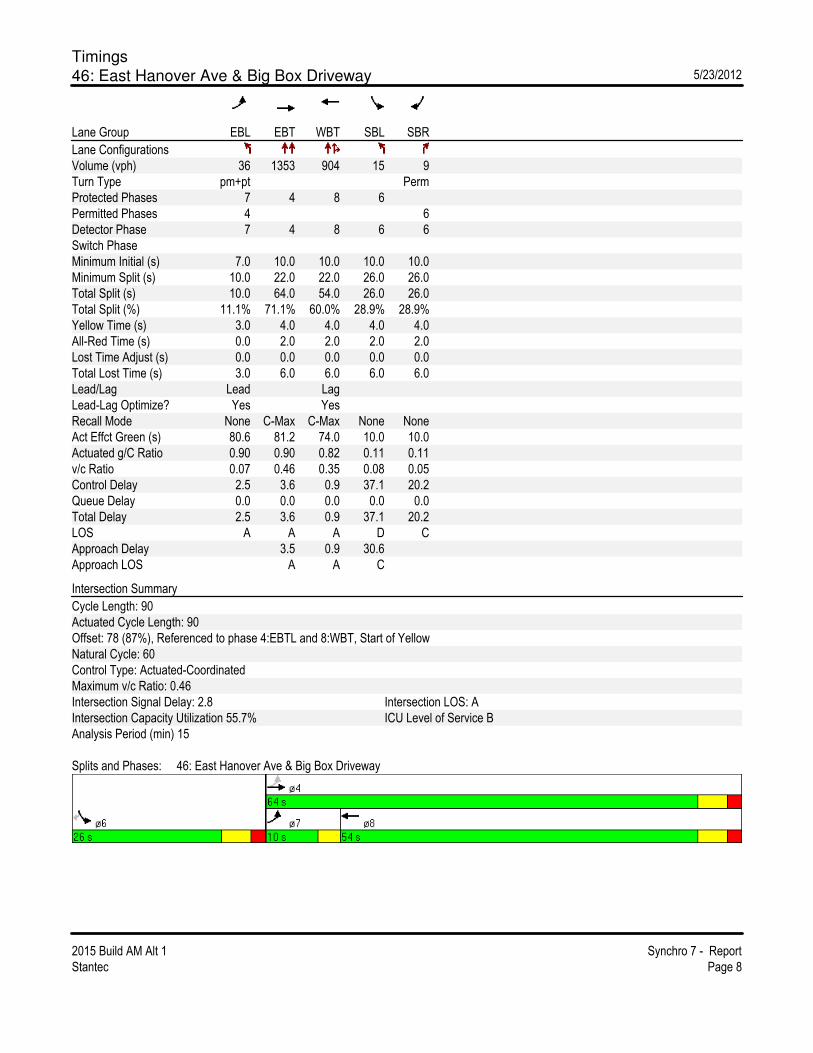
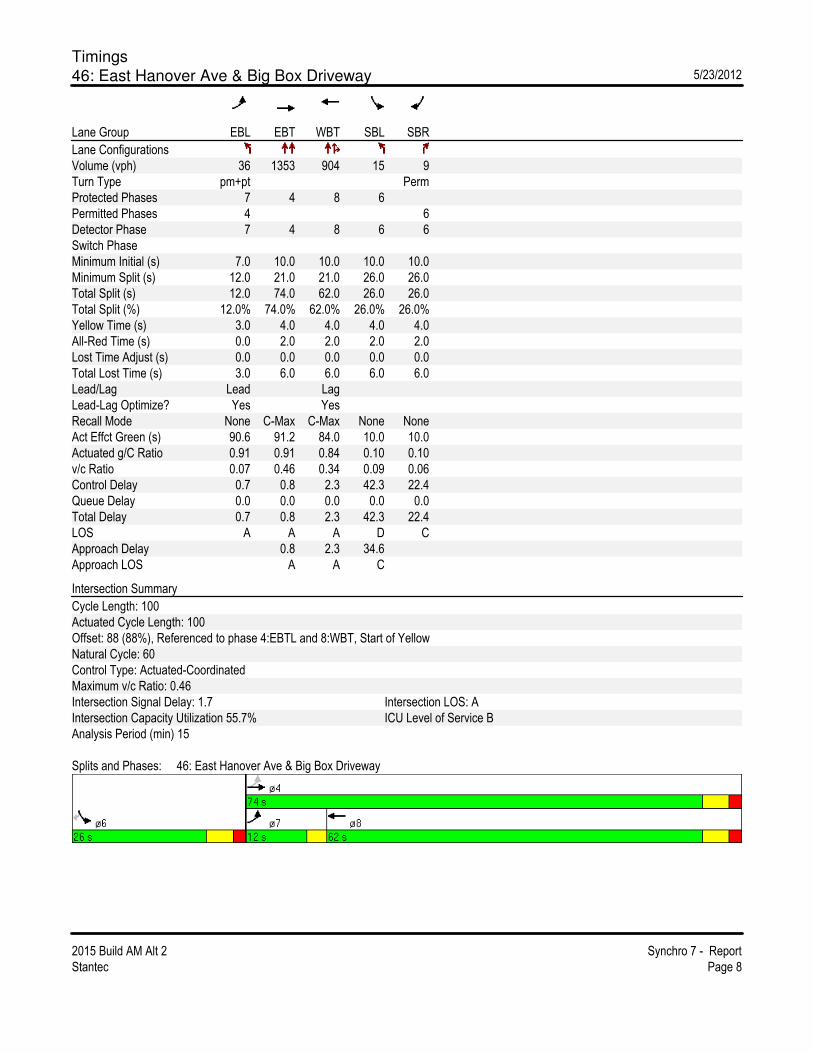
46: East Hanover Ave & Big Box Driveway 5/23/2012
2015 Build AM Alt 1 Synchro 7 - Report
Stantec Page 8
Lane Group EBL EBT WBT SBL SBR
Lane Configurations
Volume (vph) 36 1353 904 15 9
Turn Type pm+pt Perm
Protected Phases 7 4 8 6
Permitted Phases 4 6
Detector Phase 7 4 8 6 6
Switch Phase
Minimum Initial (s) 7.0 10.0 10.0 10.0 10.0
Minimum Split (s) 10.0 22.0 22.0 26.0 26.0
Total Split (s) 10.0 64.0 54.0 26.0 26.0
Total Split (%) 11.1% 71.1% 60.0% 28.9% 28.9%
Yellow Time (s) 3.0 4.0 4.0 4.0 4.0
All-Red Time (s) 0.0 2.0 2.0 2.0 2.0
Lost Time Adjust (s) 0.0 0.0 0.0 0.0 0.0
Total Lost Time (s) 3.0 6.0 6.0 6.0 6.0
Lead/Lag Lead Lag
Lead-Lag Optimize? Yes Yes
Recall Mode None C-Max C-Max None None
Act Effct Green (s) 80.6 81.2 74.0 10.0 10.0
Actuated g/C Ratio 0.90 0.90 0.82 0.11 0.11
v/c Ratio 0.07 0.46 0.35 0.08 0.05
Control Delay 2.5 3.6 0.9 37.1 20.2
Queue Delay 0.0 0.0 0.0 0.0 0.0
Total Delay 2.5 3.6 0.9 37.1 20.2
LOS A A A D C
Approach Delay 3.5 0.9 30.6
Approach LOS A A C
Intersection Summary
Cycle Length: 90
Actuated Cycle Length: 90
Offset: 78 (87%), Referenced to phase 4:EBTL and 8:WBT, Start of Yellow
Natural Cycle: 60
Control Type: Actuated-Coordinated
Maximum v/c Ratio: 0.46
Intersection Signal Delay: 2.8 Intersection LOS: A
Intersection Capacity Utilization 55.7% ICU Level of Service B
Analysis Period (min) 15
Splits and Phases: 46: East Hanover Ave & Big Box Driveway
Timings
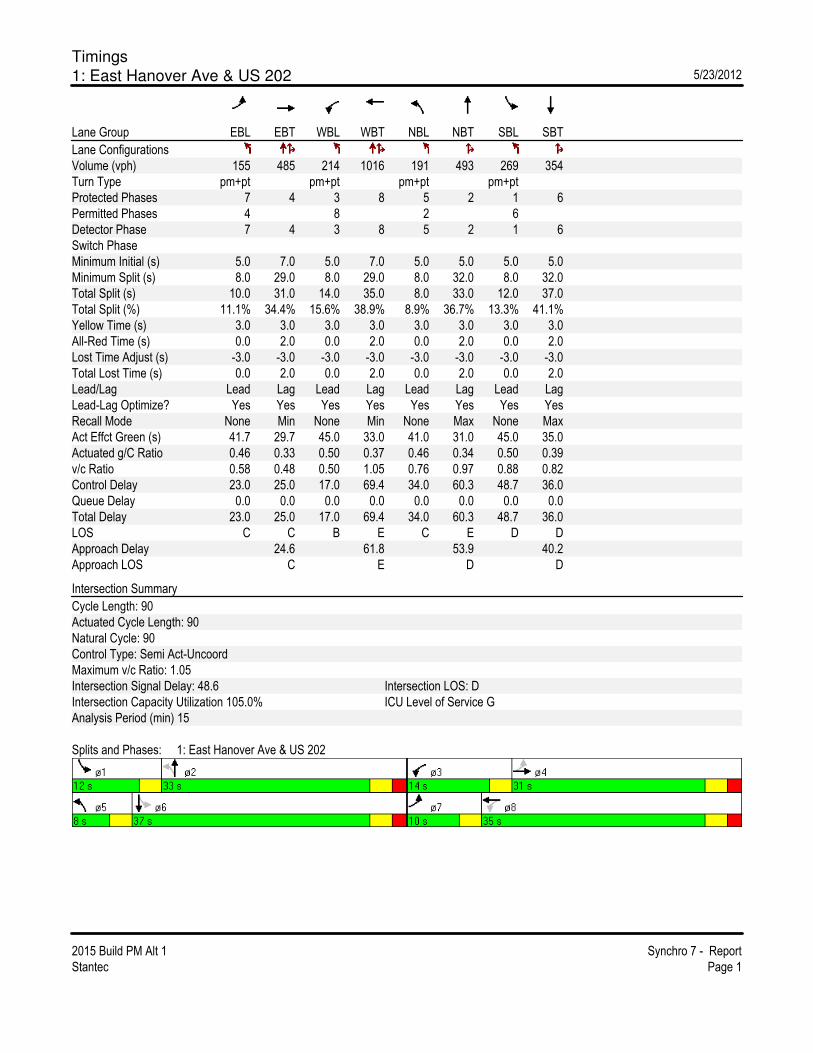
1: East Hanover Ave & US 202 5/23/2012
2015 Build PM Alt 1 Synchro 7 - Report
Stantec Page 1
Lane Group EBL EBT WBL WBT NBL NBT SBL SBT
Lane Configurations
Volume (vph) 155 485 214 1016 191 493 269 354
Turn Type pm+pt pm+pt pm+pt pm+pt
Protected Phases 7 4 3 8 5 2 1 6
Permitted Phases 4 8 2 6
Detector Phase 7 4 3 8 5 2 1 6
Switch Phase
Minimum Initial (s) 5.0 7.0 5.0 7.0 5.0 5.0 5.0 5.0
Minimum Split (s) 8.0 29.0 8.0 29.0 8.0 32.0 8.0 32.0
Total Split (s) 10.0 31.0 14.0 35.0 8.0 33.0 12.0 37.0
Total Split (%) 11.1% 34.4% 15.6% 38.9% 8.9% 36.7% 13.3% 41.1%
Yellow Time (s) 3.0 3.0 3.0 3.0 3.0 3.0 3.0 3.0
All-Red Time (s) 0.0 2.0 0.0 2.0 0.0 2.0 0.0 2.0
Lost Time Adjust (s) -3.0 -3.0 -3.0 -3.0 -3.0 -3.0 -3.0 -3.0
Total Lost Time (s) 0.0 2.0 0.0 2.0 0.0 2.0 0.0 2.0
Lead/Lag Lead Lag Lead Lag Lead Lag Lead Lag
Lead-Lag Optimize? Yes Yes Yes Yes Yes Yes Yes Yes
Recall Mode None Min None Min None Max None Max
Act Effct Green (s) 41.7 29.7 45.0 33.0 41.0 31.0 45.0 35.0
Actuated g/C Ratio 0.46 0.33 0.50 0.37 0.46 0.34 0.50 0.39
v/c Ratio 0.58 0.48 0.50 1.05 0.76 0.97 0.88 0.82
Control Delay 23.0 25.0 17.0 69.4 34.0 60.3 48.7 36.0
Queue Delay 0.0 0.0 0.0 0.0 0.0 0.0 0.0 0.0
Total Delay 23.0 25.0 17.0 69.4 34.0 60.3 48.7 36.0
LOS C C B E C E D D
Approach Delay 24.6 61.8 53.9 40.2
Approach LOS C E D D
Intersection Summary
Cycle Length: 90
Actuated Cycle Length: 90
Natural Cycle: 90
Control Type: Semi Act-Uncoord
Maximum v/c Ratio: 1.05
Intersection Signal Delay: 48.6 Intersection LOS: D
Intersection Capacity Utilization 105.0% ICU Level of Service G
Analysis Period (min) 15
Splits and Phases: 1: East Hanover Ave & US 202
Timings
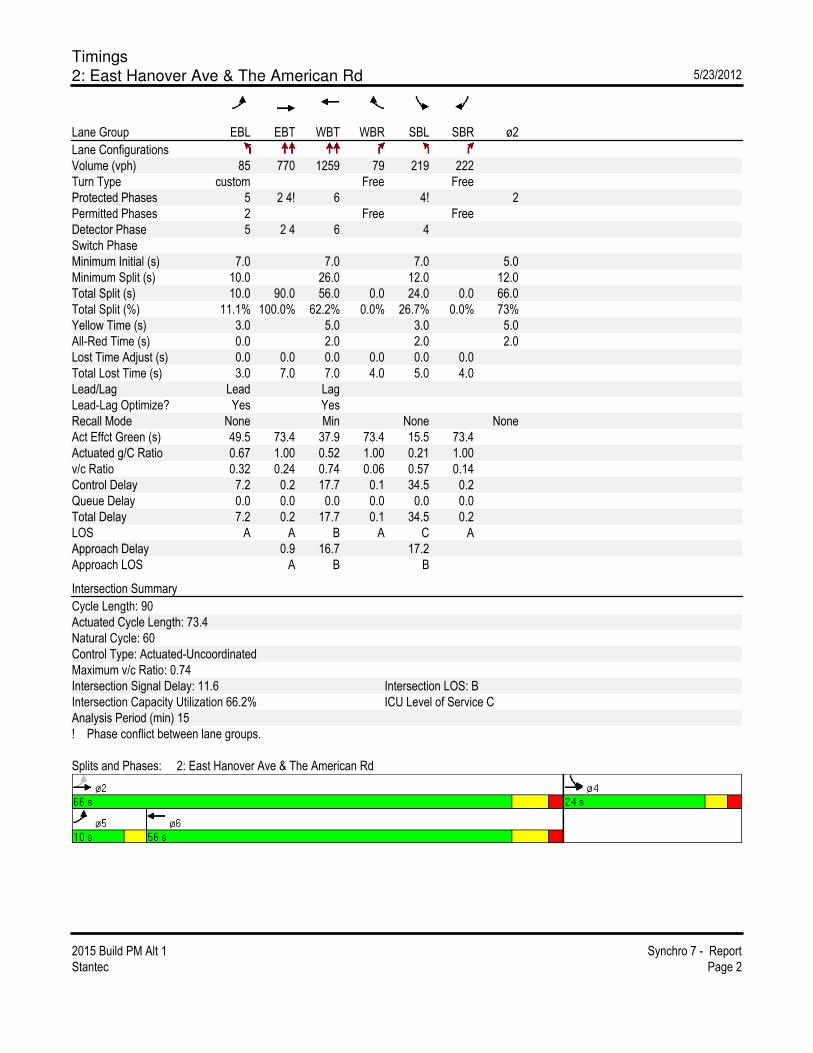
2: East Hanover Ave & The American Rd 5/23/2012
2015 Build PM Alt 1 Synchro 7 - Report
Stantec Page 2
Lane Group EBL EBT WBT WBR SBL SBR ø2
Lane Configurations
Volume (vph) 85 770 1259 79 219 222
Turn Type custom Free Free
Protected Phases 5 2 4! 6 4! 2
Permitted Phases 2 Free Free
Detector Phase 5 2 4 6 4
Switch Phase
Minimum Initial (s) 7.0 7.0 7.0 5.0
Minimum Split (s) 10.0 26.0 12.0 12.0
Total Split (s) 10.0 90.0 56.0 0.0 24.0 0.0 66.0
Total Split (%) 11.1% 100.0% 62.2% 0.0% 26.7% 0.0% 73%
Yellow Time (s) 3.0 5.0 3.0 5.0
All-Red Time (s) 0.0 2.0 2.0 2.0
Lost Time Adjust (s) 0.0 0.0 0.0 0.0 0.0 0.0
Total Lost Time (s) 3.0 7.0 7.0 4.0 5.0 4.0
Lead/Lag Lead Lag
Lead-Lag Optimize? Yes Yes
Recall Mode None Min None None
Act Effct Green (s) 49.5 73.4 37.9 73.4 15.5 73.4
Actuated g/C Ratio 0.67 1.00 0.52 1.00 0.21 1.00
v/c Ratio 0.32 0.24 0.74 0.06 0.57 0.14
Control Delay 7.2 0.2 17.7 0.1 34.5 0.2
Queue Delay 0.0 0.0 0.0 0.0 0.0 0.0
Total Delay 7.2 0.2 17.7 0.1 34.5 0.2
LOS A A B A C A
Approach Delay 0.9 16.7 17.2
Approach LOS A B B
Intersection Summary
Cycle Length: 90
Actuated Cycle Length: 73.4
Natural Cycle: 60
Control Type: Actuated-Uncoordinated
Maximum v/c Ratio: 0.74
Intersection Signal Delay: 11.6 Intersection LOS: B
Intersection Capacity Utilization 66.2% ICU Level of Service C
Analysis Period (min) 15
! Phase conflict between lane groups.
Splits and Phases: 2: East Hanover Ave & The American Rd
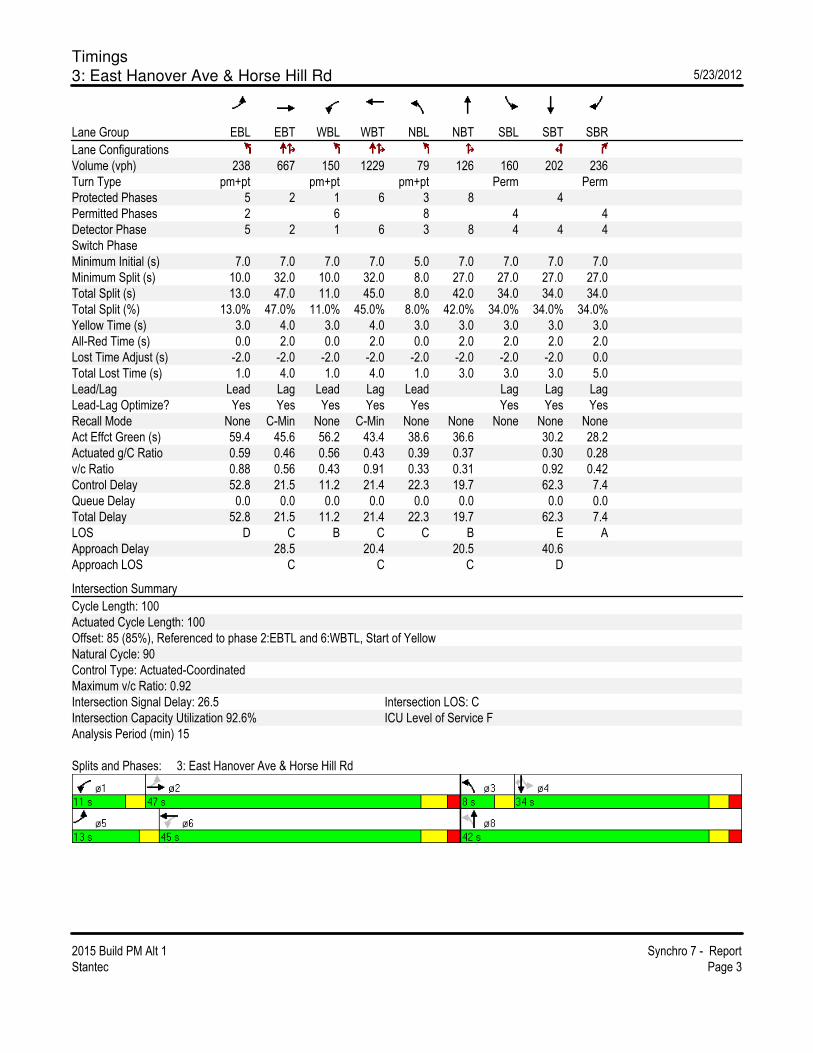
Timings
3: East Hanover Ave & Horse Hill Rd 5/23/2012
2015 Build PM Alt 1 Synchro 7 - Report
Stantec Page 3
Lane Group EBL EBT WBL WBT NBL NBT SBL SBT SBR
Lane Configurations
Volume (vph) 238 667 150 1229 79 126 160 202 236
Turn Type pm+pt pm+pt pm+pt Perm Perm
Protected Phases 5 2 1 6 3 8 4
Permitted Phases 2 6 8 4 4
Detector Phase 5 2 1 6 3 8 4 4 4
Switch Phase
Minimum Initial (s) 7.0 7.0 7.0 7.0 5.0 7.0 7.0 7.0 7.0
Minimum Split (s) 10.0 32.0 10.0 32.0 8.0 27.0 27.0 27.0 27.0
Total Split (s) 13.0 47.0 11.0 45.0 8.0 42.0 34.0 34.0 34.0
Total Split (%) 13.0% 47.0% 11.0% 45.0% 8.0% 42.0% 34.0% 34.0% 34.0%
Yellow Time (s) 3.0 4.0 3.0 4.0 3.0 3.0 3.0 3.0 3.0
All-Red Time (s) 0.0 2.0 0.0 2.0 0.0 2.0 2.0 2.0 2.0
Lost Time Adjust (s) -2.0 -2.0 -2.0 -2.0 -2.0 -2.0 -2.0 -2.0 0.0
Total Lost Time (s) 1.0 4.0 1.0 4.0 1.0 3.0 3.0 3.0 5.0
Lead/Lag Lead Lag Lead Lag Lead Lag Lag Lag
Lead-Lag Optimize? Yes Yes Yes Yes Yes Yes Yes Yes
Recall Mode None C-Min None C-Min None None None None None
Act Effct Green (s) 59.4 45.6 56.2 43.4 38.6 36.6 30.2 28.2
Actuated g/C Ratio 0.59 0.46 0.56 0.43 0.39 0.37 0.30 0.28
v/c Ratio 0.88 0.56 0.43 0.91 0.33 0.31 0.92 0.42
Control Delay 52.8 21.5 11.2 21.4 22.3 19.7 62.3 7.4
Queue Delay 0.0 0.0 0.0 0.0 0.0 0.0 0.0 0.0
Total Delay 52.8 21.5 11.2 21.4 22.3 19.7 62.3 7.4
LOS D C B C C B E A
Approach Delay 28.5 20.4 20.5 40.6
Approach LOS C C C D
Intersection Summary
Cycle Length: 100
Actuated Cycle Length: 100
Offset: 85 (85%), Referenced to phase 2:EBTL and 6:WBTL, Start of Yellow
Natural Cycle: 90
Control Type: Actuated-Coordinated
Maximum v/c Ratio: 0.92
Intersection Signal Delay: 26.5 Intersection LOS: C
Intersection Capacity Utilization 92.6% ICU Level of Service F
Analysis Period (min) 15
Splits and Phases: 3: East Hanover Ave & Horse Hill Rd

HCM Unsignalized Intersection Capacity Analysis
4: East Hanover Ave & Monroe St 5/23/2012
2015 Build PM Alt 1 Synchro 7 - Report
Stantec Page 4
Movement EBT EBR WBL WBT NBL NBR
Lane Configurations
Volume (veh/h) 879 4 95 1417 2 68
Sign Control Free Free Stop
Grade 0% 0% 0%
Peak Hour Factor 0.96 0.96 0.96 0.96 0.96 0.96
Hourly flow rate (vph) 916 4 99 1476 2 71
Pedestrians
Lane Width (ft)
Walking Speed (ft/s)
Percent Blockage
Right turn flare (veh)
Median type None None
Median storage veh)
Upstream signal (ft) 153 847
pX, platoon unblocked 0.94 0.74 0.94
vC, conflicting volume 920 1854 460
vC1, stage 1 conf vol
vC2, stage 2 conf vol
vCu, unblocked vol 778 1065 287
tC, single (s) 4.1 6.8 6.9
tC, 2 stage (s)
tF (s) 2.2 3.5 3.3
p0 queue free % 87 99 89
cM capacity (veh/h) 781 143 665
Direction, Lane # EB 1 EB 2 WB 1 WB 2 NB 1
Volume Total 610 309 591 984 73
Volume Left 0 0 99 0 2
Volume Right 0 4 0 0 71
cSH 1700 1700 781 1700 602
Volume to Capacity 0.36 0.18 0.13 0.58 0.12
Queue Length 95th (ft) 0 0 11 0 10
Control Delay (s) 0.0 0.0 3.2 0.0 11.8
Lane LOS A B
Approach Delay (s) 0.0 1.2 11.8
Approach LOS B
Intersection Summary
Average Delay 1.1
Intersection Capacity Utilization 80.7% ICU Level of Service D
Analysis Period (min) 15
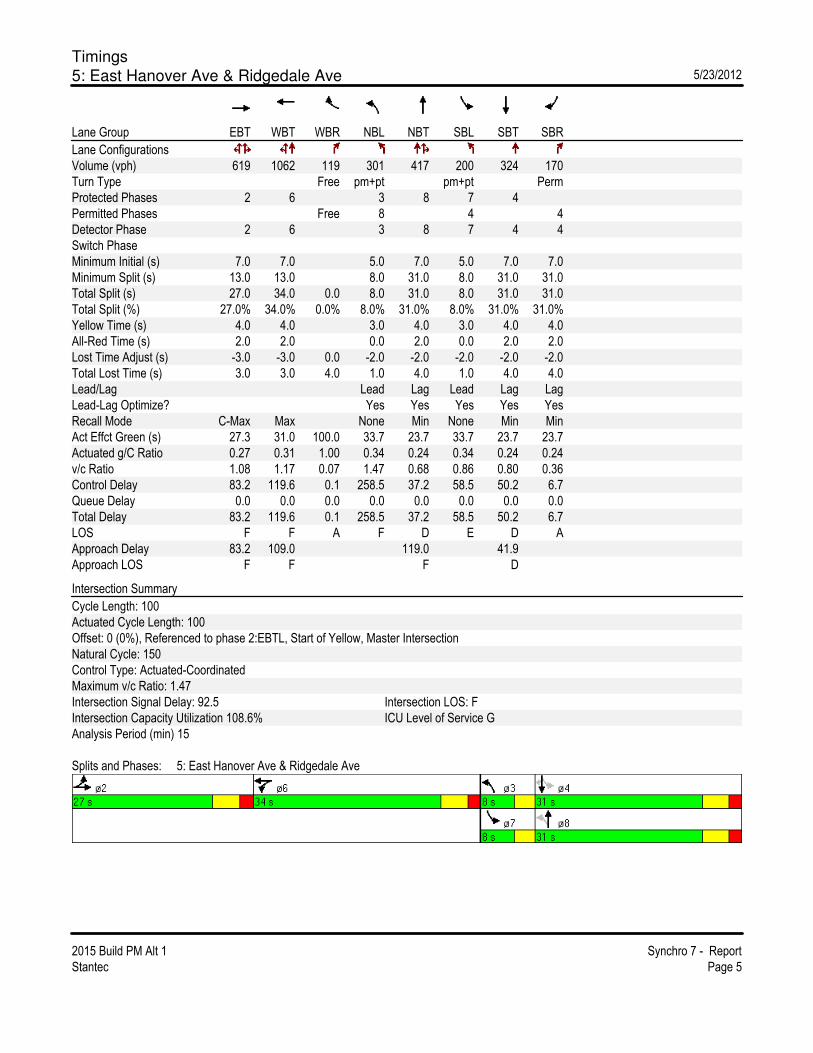
Timings
5: East Hanover Ave & Ridgedale Ave 5/23/2012
2015 Build PM Alt 1 Synchro 7 - Report
Stantec Page 5
Lane Group EBT WBT WBR NBL NBT SBL SBT SBR
Lane Configurations
Volume (vph) 619 1062 119 301 417 200 324 170
Turn Type Free pm+pt pm+pt Perm
Protected Phases 2 6 3 8 7 4
Permitted Phases Free 8 4 4
Detector Phase 2 6 3 8 7 4 4
Switch Phase
Minimum Initial (s) 7.0 7.0 5.0 7.0 5.0 7.0 7.0
Minimum Split (s) 13.0 13.0 8.0 31.0 8.0 31.0 31.0
Total Split (s) 27.0 34.0 0.0 8.0 31.0 8.0 31.0 31.0
Total Split (%) 27.0% 34.0% 0.0% 8.0% 31.0% 8.0% 31.0% 31.0%
Yellow Time (s) 4.0 4.0 3.0 4.0 3.0 4.0 4.0
All-Red Time (s) 2.0 2.0 0.0 2.0 0.0 2.0 2.0
Lost Time Adjust (s) -3.0 -3.0 0.0 -2.0 -2.0 -2.0 -2.0 -2.0
Total Lost Time (s) 3.0 3.0 4.0 1.0 4.0 1.0 4.0 4.0
Lead/Lag Lead Lag Lead Lag Lag
Lead-Lag Optimize? Yes Yes Yes Yes Yes
Recall Mode C-Max Max None Min None Min Min
Act Effct Green (s) 27.3 31.0 100.0 33.7 23.7 33.7 23.7 23.7
Actuated g/C Ratio 0.27 0.31 1.00 0.34 0.24 0.34 0.24 0.24
v/c Ratio 1.08 1.17 0.07 1.47 0.68 0.86 0.80 0.36
Control Delay 83.2 119.6 0.1 258.5 37.2 58.5 50.2 6.7
Queue Delay 0.0 0.0 0.0 0.0 0.0 0.0 0.0 0.0
Total Delay 83.2 119.6 0.1 258.5 37.2 58.5 50.2 6.7
LOS F F A F D E D A
Approach Delay 83.2 109.0 119.0 41.9
Approach LOS F F F D
Intersection Summary
Cycle Length: 100
Actuated Cycle Length: 100
Offset: 0 (0%), Referenced to phase 2:EBTL, Start of Yellow, Master Intersection
Natural Cycle: 150
Control Type: Actuated-Coordinated
Maximum v/c Ratio: 1.47
Intersection Signal Delay: 92.5 Intersection LOS: F
Intersection Capacity Utilization 108.6% ICU Level of Service G
Analysis Period (min) 15
Splits and Phases: 5: East Hanover Ave & Ridgedale Ave

Timings
6: East Hanover Ave & Library 5/23/2012
2015 Build PM Alt 1 Synchro 7 - Report
Stantec Page 6
Lane Group EBL EBT WBT SBL SBR
Lane Configurations
Volume (vph) 50 866 1263 49 82
Turn Type Perm Perm
Protected Phases 2 6 4
Permitted Phases 2 4
Detector Phase 2 2 6 4 4
Switch Phase
Minimum Initial (s) 7.0 7.0 7.0 7.0 7.0
Minimum Split (s) 29.0 29.0 29.0 28.0 28.0
Total Split (s) 71.0 71.0 71.0 29.0 29.0
Total Split (%) 71.0% 71.0% 71.0% 29.0% 29.0%
Yellow Time (s) 5.0 5.0 5.0 3.0 3.0
All-Red Time (s) 2.0 2.0 2.0 2.0 2.0
Lost Time Adjust (s) 0.0 -2.0 -2.0 -2.0 -2.0
Total Lost Time (s) 7.0 5.0 5.0 3.0 3.0
Lead/Lag
Lead-Lag Optimize?
Recall Mode C-Max C-Max C-Max None None
Act Effct Green (s) 84.7 84.7 10.7 10.7
Actuated g/C Ratio 0.85 0.85 0.11 0.11
v/c Ratio 0.42 0.47 0.28 0.38
Control Delay 0.9 2.9 44.3 18.8
Queue Delay 0.0 0.0 0.0 0.0
Total Delay 0.9 2.9 44.3 18.8
LOS A A D B
Approach Delay 0.9 2.9 28.4
Approach LOS A A C
Intersection Summary
Cycle Length: 100
Actuated Cycle Length: 100
Offset: 50 (50%), Referenced to phase 2:EBTL and 6:WBT, Start of Yellow
Natural Cycle: 60
Control Type: Actuated-Coordinated
Maximum v/c Ratio: 0.47
Intersection Signal Delay: 3.5 Intersection LOS: A
Intersection Capacity Utilization 74.6% ICU Level of Service D
Analysis Period (min) 15
Splits and Phases: 6: East Hanover Ave & Library
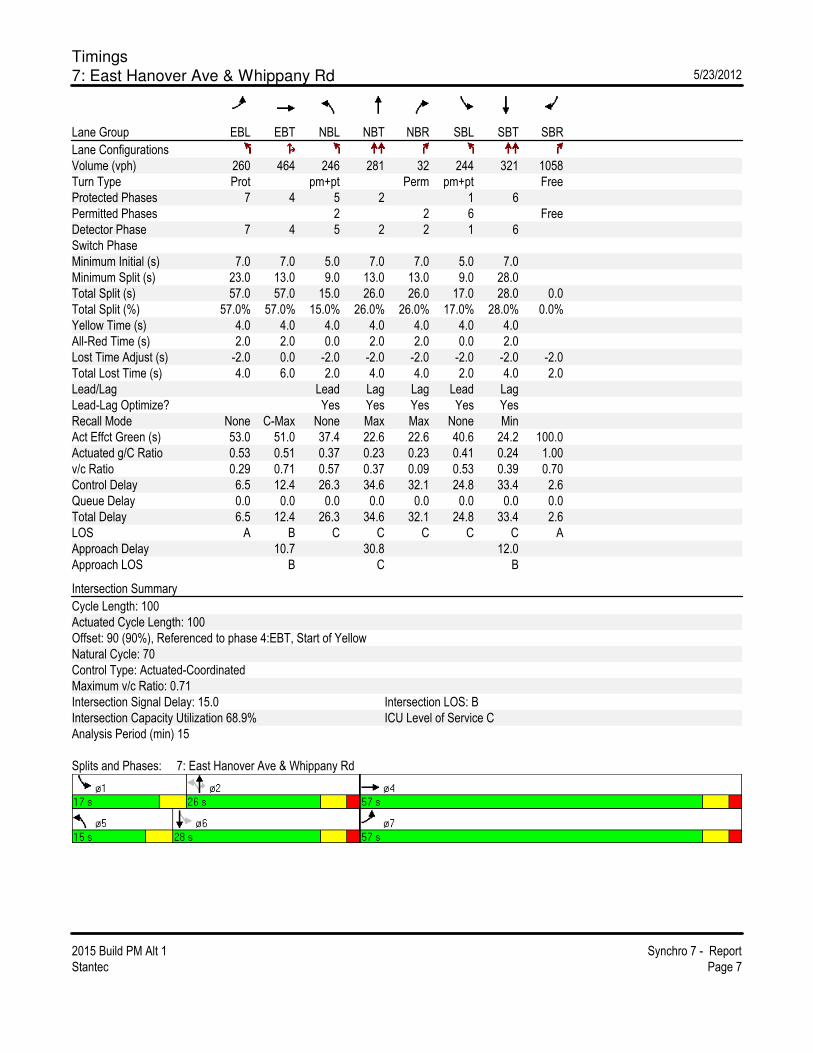
Timings
7: East Hanover Ave & Whippany Rd 5/23/2012
2015 Build PM Alt 1 Synchro 7 - Report
Stantec Page 7
Lane Group EBL EBT NBL NBT NBR SBL SBT SBR
Lane Configurations
Volume (vph) 260 464 246 281 32 244 321 1058
Turn Type Prot pm+pt Perm pm+pt Free
Protected Phases 7 4 5 2 1 6
Permitted Phases 2 2 6 Free
Detector Phase 7 4 5 2 2 1 6
Switch Phase
Minimum Initial (s) 7.0 7.0 5.0 7.0 7.0 5.0 7.0
Minimum Split (s) 23.0 13.0 9.0 13.0 13.0 9.0 28.0
Total Split (s) 57.0 57.0 15.0 26.0 26.0 17.0 28.0 0.0
Total Split (%) 57.0% 57.0% 15.0% 26.0% 26.0% 17.0% 28.0% 0.0%
Yellow Time (s) 4.0 4.0 4.0 4.0 4.0 4.0 4.0
All-Red Time (s) 2.0 2.0 0.0 2.0 2.0 0.0 2.0
Lost Time Adjust (s) -2.0 0.0 -2.0 -2.0 -2.0 -2.0 -2.0 -2.0
Total Lost Time (s) 4.0 6.0 2.0 4.0 4.0 2.0 4.0 2.0
Lead/Lag Lead Lag Lag Lead Lag
Lead-Lag Optimize? Yes Yes Yes Yes Yes
Recall Mode None C-Max None Max Max None Min
Act Effct Green (s) 53.0 51.0 37.4 22.6 22.6 40.6 24.2 100.0
Actuated g/C Ratio 0.53 0.51 0.37 0.23 0.23 0.41 0.24 1.00
v/c Ratio 0.29 0.71 0.57 0.37 0.09 0.53 0.39 0.70
Control Delay 6.5 12.4 26.3 34.6 32.1 24.8 33.4 2.6
Queue Delay 0.0 0.0 0.0 0.0 0.0 0.0 0.0 0.0
Total Delay 6.5 12.4 26.3 34.6 32.1 24.8 33.4 2.6
LOS A B C C C C C A
Approach Delay 10.7 30.8 12.0
Approach LOS B C B
Intersection Summary
Cycle Length: 100
Actuated Cycle Length: 100
Offset: 90 (90%), Referenced to phase 4:EBT, Start of Yellow
Natural Cycle: 70
Control Type: Actuated-Coordinated
Maximum v/c Ratio: 0.71
Intersection Signal Delay: 15.0 Intersection LOS: B
Intersection Capacity Utilization 68.9% ICU Level of Service C
Analysis Period (min) 15
Splits and Phases: 7: East Hanover Ave & Whippany Rd

Timings
46: East Hanover Ave & Big Box Driveway 5/23/2012
2015 Build PM Alt 1 Synchro 7 - Report
Stantec Page 8
Lane Group EBL EBT WBT SBL SBR
Lane Configurations
Volume (vph) 31 861 1400 22 29
Turn Type pm+pt Perm
Protected Phases 7 4 8 6
Permitted Phases 4 6
Detector Phase 7 4 8 6 6
Switch Phase
Minimum Initial (s) 5.0 10.0 10.0 10.0 10.0
Minimum Split (s) 10.0 22.0 22.0 26.0 26.0
Total Split (s) 10.0 74.0 64.0 26.0 26.0
Total Split (%) 10.0% 74.0% 64.0% 26.0% 26.0%
Yellow Time (s) 3.0 4.0 4.0 4.0 4.0
All-Red Time (s) 0.0 2.0 2.0 2.0 2.0
Lost Time Adjust (s) 0.0 0.0 0.0 0.0 0.0
Total Lost Time (s) 3.0 6.0 6.0 6.0 6.0
Lead/Lag Lead Lag
Lead-Lag Optimize? Yes Yes
Recall Mode None C-Max C-Max None None
Act Effct Green (s) 87.4 86.8 81.4 10.0 10.0
Actuated g/C Ratio 0.87 0.87 0.81 0.10 0.10
v/c Ratio 0.11 0.30 0.54 0.13 0.17
Control Delay 2.4 2.9 1.8 43.1 16.9
Queue Delay 0.0 0.0 0.0 0.0 0.0
Total Delay 2.4 2.9 1.8 43.1 16.9
LOS A A A D B
Approach Delay 2.8 1.8 28.1
Approach LOS A A C
Intersection Summary
Cycle Length: 100
Actuated Cycle Length: 100
Offset: 87 (87%), Referenced to phase 4:EBTL and 8:WBT, Start of Yellow
Natural Cycle: 75
Control Type: Actuated-Coordinated
Maximum v/c Ratio: 0.54
Intersection Signal Delay: 2.8 Intersection LOS: A
Intersection Capacity Utilization 57.6% ICU Level of Service B
Analysis Period (min) 15
Splits and Phases: 46: East Hanover Ave & Big Box Driveway
2015 ALTERNATIVE 2
Timings
1: East Hanover Ave & US 202 5/23/2012
2015 Build AM Alt 2 Synchro 7 - Report
Stantec Page 1
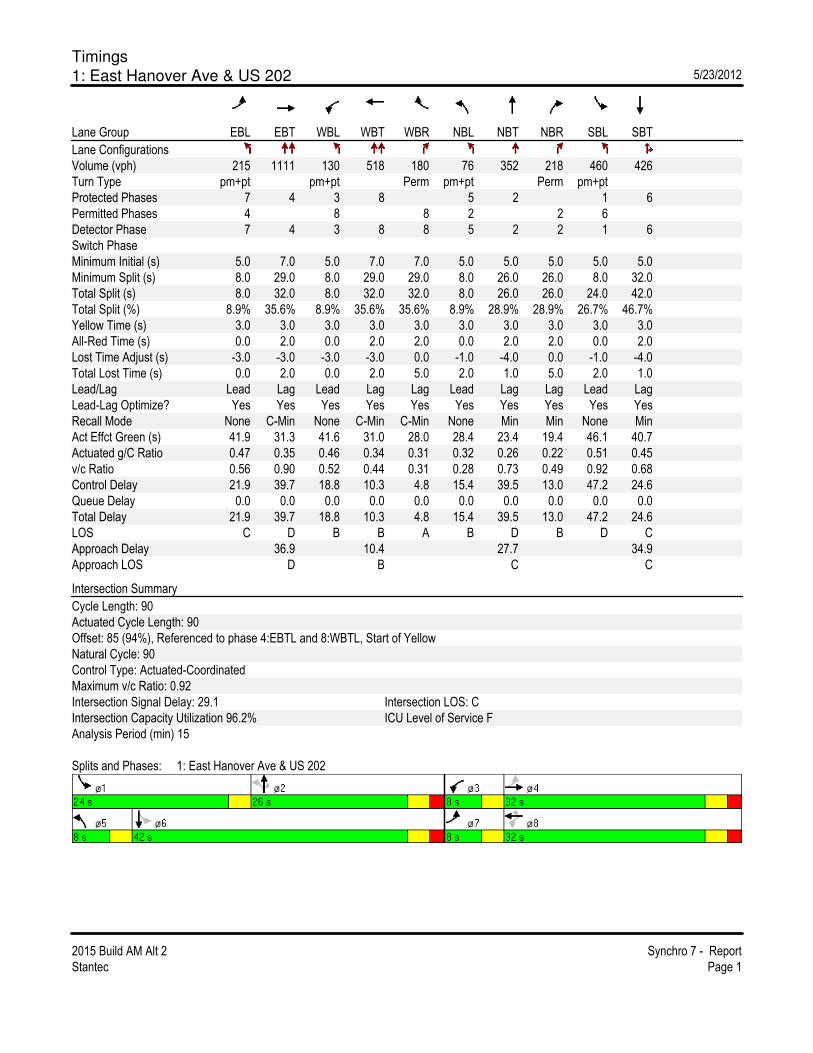
Lane Group EBL EBT WBL WBT WBR NBL NBT NBR SBL SBT
Lane Configurations
Volume (vph) 215 1111 130 518 180 76 352 218 460 426
Turn Type pm+pt pm+pt Perm pm+pt Perm pm+pt
Protected Phases 7 4 3 8 5 2 1 6
Permitted Phases 4 8 8 2 2 6
Detector Phase 7 4 3 8 8 5 2 2 1 6
Switch Phase
Minimum Initial (s) 5.0 7.0 5.0 7.0 7.0 5.0 5.0 5.0 5.0 5.0
Minimum Split (s) 8.0 29.0 8.0 29.0 29.0 8.0 26.0 26.0 8.0 32.0
Total Split (s) 8.0 32.0 8.0 32.0 32.0 8.0 26.0 26.0 24.0 42.0
Total Split (%) 8.9% 35.6% 8.9% 35.6% 35.6% 8.9% 28.9% 28.9% 26.7% 46.7%
Yellow Time (s) 3.0 3.0 3.0 3.0 3.0 3.0 3.0 3.0 3.0 3.0
All-Red Time (s) 0.0 2.0 0.0 2.0 2.0 0.0 2.0 2.0 0.0 2.0
Lost Time Adjust (s) -3.0 -3.0 -3.0 -3.0 0.0 -1.0 -4.0 0.0 -1.0 -4.0
Total Lost Time (s) 0.0 2.0 0.0 2.0 5.0 2.0 1.0 5.0 2.0 1.0
Lead/Lag Lead Lag Lead Lag Lag Lead Lag Lag Lead Lag
Lead-Lag Optimize? Yes Yes Yes Yes Yes Yes Yes Yes Yes Yes
Recall Mode None C-Min None C-Min C-Min None Min Min None Min
Act Effct Green (s) 41.9 31.3 41.6 31.0 28.0 28.4 23.4 19.4 46.1 40.7
Actuated g/C Ratio 0.47 0.35 0.46 0.34 0.31 0.32 0.26 0.22 0.51 0.45
v/c Ratio 0.56 0.90 0.52 0.44 0.31 0.28 0.73 0.49 0.92 0.68
Control Delay 21.9 39.7 18.8 10.3 4.8 15.4 39.5 13.0 47.2 24.6
Queue Delay 0.0 0.0 0.0 0.0 0.0 0.0 0.0 0.0 0.0 0.0
Total Delay 21.9 39.7 18.8 10.3 4.8 15.4 39.5 13.0 47.2 24.6
LOS C D B B A B D B D C
Approach Delay 36.9 10.4 27.7 34.9
Approach LOS D B C C
Intersection Summary
Cycle Length: 90
Actuated Cycle Length: 90
Offset: 85 (94%), Referenced to phase 4:EBTL and 8:WBTL, Start of Yellow
Natural Cycle: 90
Control Type: Actuated-Coordinated
Maximum v/c Ratio: 0.92
Intersection Signal Delay: 29.1 Intersection LOS: C
Intersection Capacity Utilization 96.2% ICU Level of Service F
Analysis Period (min) 15
Splits and Phases: 1: East Hanover Ave & US 202

Timings
2: East Hanover Ave & The American Rd 5/23/2012
2015 Build AM Alt 2 Synchro 7 - Report
Stantec Page 2
Lane Group EBL EBT WBT WBR SBL SBR ø2
Lane Configurations
Volume (vph) 202 1586 756 260 61 55
Turn Type custom Free Free
Protected Phases 5 2 4! 6 4! 2
Permitted Phases 2 Free Free
Detector Phase 5 2 4 6 4
Switch Phase
Minimum Initial (s) 7.0 7.0 7.0 5.0
Minimum Split (s) 10.0 26.0 12.0 12.0
Total Split (s) 21.0 90.0 39.0 0.0 30.0 0.0 60.0
Total Split (%) 23.3% 100.0% 43.3% 0.0% 33.3% 0.0% 67%
Yellow Time (s) 3.0 4.0 3.0 4.0
All-Red Time (s) 0.0 2.0 2.0 2.0
Lost Time Adjust (s) 0.0 0.0 0.0 0.0 0.0 0.0
Total Lost Time (s) 3.0 6.0 6.0 4.0 5.0 4.0
Lead/Lag Lead Lag
Lead-Lag Optimize? Yes Yes
Recall Mode None C-Min None C-Max
Act Effct Green (s) 62.1 90.0 46.4 90.0 19.9 90.0
Actuated g/C Ratio 0.69 1.00 0.52 1.00 0.22 1.00
v/c Ratio 0.44 0.48 0.44 0.18 0.15 0.03
Control Delay 3.9 0.5 15.8 0.3 27.3 0.0
Queue Delay 0.0 0.0 0.0 0.0 0.0 0.0
Total Delay 3.9 0.5 15.8 0.3 27.3 0.0
LOS A A B A C A
Approach Delay 0.9 11.8 14.3
Approach LOS A B B
Intersection Summary
Cycle Length: 90
Actuated Cycle Length: 90
Offset: 56 (62%), Referenced to phase 2:EBTL and 6:WBT, Start of Yellow
Natural Cycle: 50
Control Type: Actuated-Coordinated
Maximum v/c Ratio: 0.48
Intersection Signal Delay: 5.2 Intersection LOS: A
Intersection Capacity Utilization 58.8% ICU Level of Service B
Analysis Period (min) 15
! Phase conflict between lane groups.
Splits and Phases: 2: East Hanover Ave & The American Rd

Timings
3: East Hanover Ave & Horse Hill Rd 5/23/2012
2015 Build AM Alt 2 Synchro 7 - Report
Stantec Page 3
Lane Group EBL EBT WBL WBT NBL NBT SBL SBT SBR
Lane Configurations
Volume (vph) 299 1207 73 785 171 218 62 72 176
Turn Type pm+pt pm+pt pm+pt pm+pt Perm
Protected Phases 5 2 1 6 3 8 7 4
Permitted Phases 2 6 8 4 4
Detector Phase 5 2 1 6 3 8 7 4 4
Switch Phase
Minimum Initial (s) 7.0 7.0 7.0 7.0 5.0 7.0 5.0 7.0 7.0
Minimum Split (s) 10.0 32.0 10.0 32.0 10.0 27.0 10.0 27.0 27.0
Total Split (s) 23.0 51.0 10.0 38.0 10.0 29.0 10.0 29.0 29.0
Total Split (%) 23.0% 51.0% 10.0% 38.0% 10.0% 29.0% 10.0% 29.0% 29.0%
Yellow Time (s) 3.0 4.0 3.0 4.0 3.0 3.0 3.0 3.0 3.0
All-Red Time (s) 0.0 2.0 0.0 2.0 0.0 2.0 0.0 2.0 2.0
Lost Time Adjust (s) -2.0 -2.0 -2.0 -2.0 -2.0 -2.0 -2.0 -2.0 0.0
Total Lost Time (s) 1.0 4.0 1.0 4.0 1.0 3.0 1.0 3.0 5.0
Lead/Lag Lead Lag Lead Lag Lead Lag Lead Lag Lag
Lead-Lag Optimize? Yes Yes Yes Yes Yes Yes Yes Yes Yes
Recall Mode None C-Max None C-Max None None None None None
Act Effct Green (s) 64.0 53.0 54.8 42.8 33.2 24.0 32.7 22.0 20.0
Actuated g/C Ratio 0.64 0.53 0.55 0.43 0.33 0.24 0.33 0.22 0.20
v/c Ratio 0.67 0.75 0.31 0.58 0.41 0.80 0.27 0.19 0.40
Control Delay 18.2 23.7 14.5 22.5 26.2 47.6 23.4 30.6 7.6
Queue Delay 0.0 0.0 0.0 0.0 0.0 0.0 0.0 0.0 0.0
Total Delay 18.2 23.7 14.5 22.5 26.2 47.6 23.4 30.6 7.6
LOS B C B C C D C C A
Approach Delay 22.7 21.8 40.4 16.1
Approach LOS C C D B
Intersection Summary
Cycle Length: 100
Actuated Cycle Length: 100
Offset: 61 (61%), Referenced to phase 2:EBTL and 6:WBTL, Start of Yellow
Natural Cycle: 80
Control Type: Actuated-Coordinated
Maximum v/c Ratio: 0.80
Intersection Signal Delay: 24.5 Intersection LOS: C
Intersection Capacity Utilization 79.2% ICU Level of Service D
Analysis Period (min) 15
Splits and Phases: 3: East Hanover Ave & Horse Hill Rd
HCM Unsignalized Intersection Capacity Analysis
4: East Hanover Ave & Monroe St 5/23/2012
2015 Build AM Alt 2 Synchro 7 - Report
Stantec Page 4
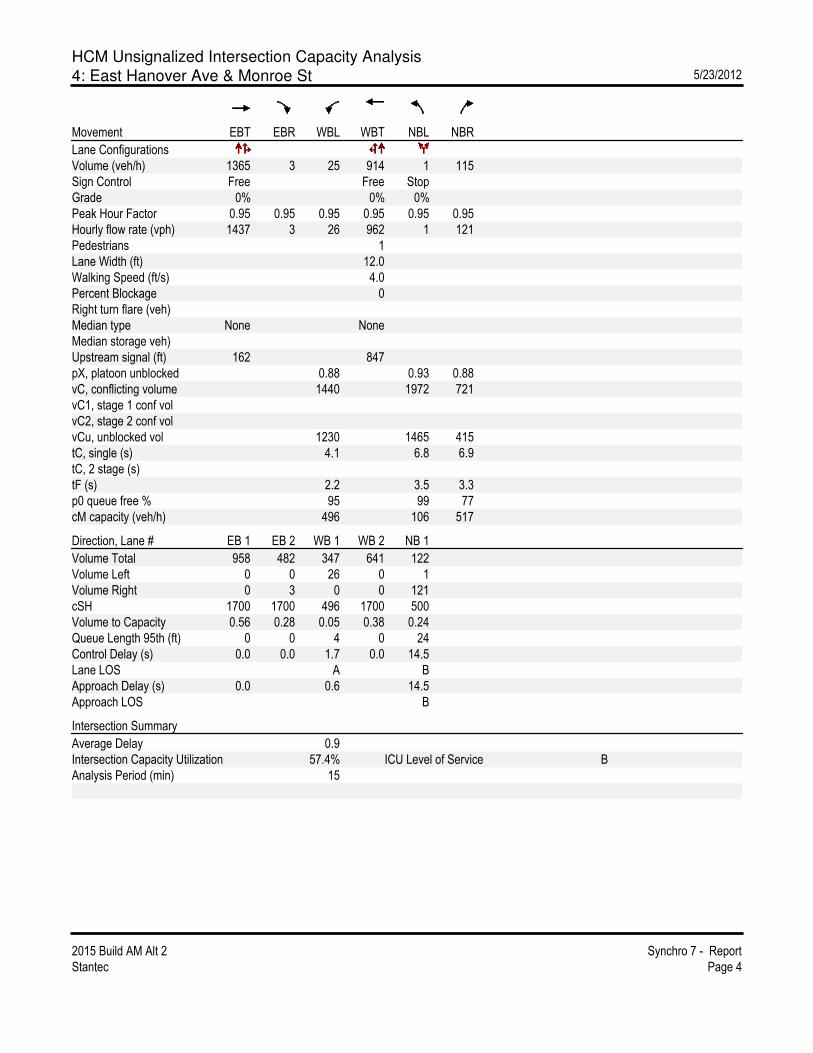
Movement EBT EBR WBL WBT NBL NBR
Lane Configurations
Volume (veh/h) 1365 3 25 914 1 115
Sign Control Free Free Stop
Grade 0% 0% 0%
Peak Hour Factor 0.95 0.95 0.95 0.95 0.95 0.95
Hourly flow rate (vph) 1437 3 26 962 1 121
Pedestrians 1
Lane Width (ft) 12.0
Walking Speed (ft/s) 4.0
Percent Blockage 0
Right turn flare (veh)
Median type None None
Median storage veh)
Upstream signal (ft) 162 847
pX, platoon unblocked 0.88 0.93 0.88
vC, conflicting volume 1440 1972 721
vC1, stage 1 conf vol
vC2, stage 2 conf vol
vCu, unblocked vol 1230 1465 415
tC, single (s) 4.1 6.8 6.9
tC, 2 stage (s)
tF (s) 2.2 3.5 3.3
p0 queue free % 95 99 77
cM capacity (veh/h) 496 106 517
Direction, Lane # EB 1 EB 2 WB 1 WB 2 NB 1
Volume Total 958 482 347 641 122
Volume Left 0 0 26 0 1
Volume Right 0 3 0 0 121
cSH 1700 1700 496 1700 500
Volume to Capacity 0.56 0.28 0.05 0.38 0.24
Queue Length 95th (ft) 0 0 4 0 24
Control Delay (s) 0.0 0.0 1.7 0.0 14.5
Lane LOS A B
Approach Delay (s) 0.0 0.6 14.5
Approach LOS B
Intersection Summary
Average Delay 0.9
Intersection Capacity Utilization 57.4% ICU Level of Service B
Analysis Period (min) 15
Timings
5: East Hanover Ave & Ridgedale Ave 5/23/2012
2015 Build AM Alt 2 Synchro 7 - Report
Stantec Page 5
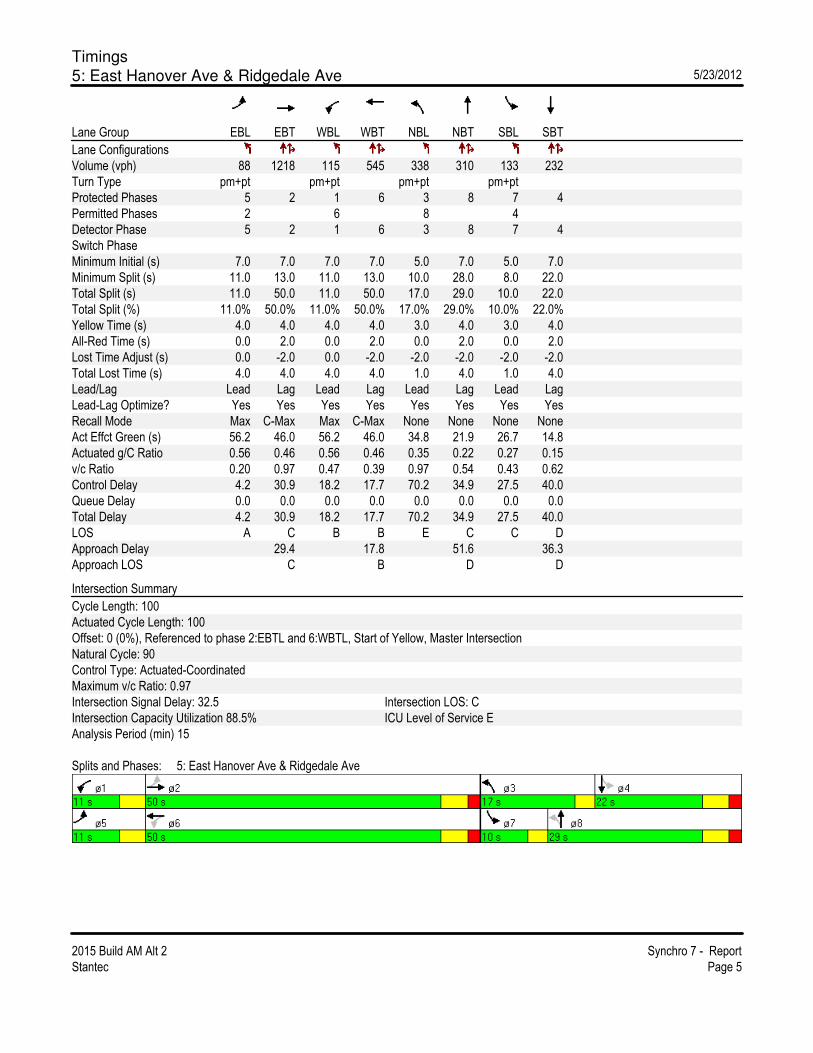
Lane Group EBL EBT WBL WBT NBL NBT SBL SBT
Lane Configurations
Volume (vph) 88 1218 115 545 338 310 133 232
Turn Type pm+pt pm+pt pm+pt pm+pt
Protected Phases 5 2 1 6 3 8 7 4
Permitted Phases 2 6 8 4
Detector Phase 5 2 1 6 3 8 7 4
Switch Phase
Minimum Initial (s) 7.0 7.0 7.0 7.0 5.0 7.0 5.0 7.0
Minimum Split (s) 11.0 13.0 11.0 13.0 10.0 28.0 8.0 22.0
Total Split (s) 11.0 50.0 11.0 50.0 17.0 29.0 10.0 22.0
Total Split (%) 11.0% 50.0% 11.0% 50.0% 17.0% 29.0% 10.0% 22.0%
Yellow Time (s) 4.0 4.0 4.0 4.0 3.0 4.0 3.0 4.0
All-Red Time (s) 0.0 2.0 0.0 2.0 0.0 2.0 0.0 2.0
Lost Time Adjust (s) 0.0 -2.0 0.0 -2.0 -2.0 -2.0 -2.0 -2.0
Total Lost Time (s) 4.0 4.0 4.0 4.0 1.0 4.0 1.0 4.0
Lead/Lag Lead Lag Lead Lag Lead Lag Lead Lag
Lead-Lag Optimize? Yes Yes Yes Yes Yes Yes Yes Yes
Recall Mode Max C-Max Max C-Max None None None None
Act Effct Green (s) 56.2 46.0 56.2 46.0 34.8 21.9 26.7 14.8
Actuated g/C Ratio 0.56 0.46 0.56 0.46 0.35 0.22 0.27 0.15
v/c Ratio 0.20 0.97 0.47 0.39 0.97 0.54 0.43 0.62
Control Delay 4.2 30.9 18.2 17.7 70.2 34.9 27.5 40.0
Queue Delay 0.0 0.0 0.0 0.0 0.0 0.0 0.0 0.0
Total Delay 4.2 30.9 18.2 17.7 70.2 34.9 27.5 40.0
LOS A C B B E C C D
Approach Delay 29.4 17.8 51.6 36.3
Approach LOS C B D D
Intersection Summary
Cycle Length: 100
Actuated Cycle Length: 100
Offset: 0 (0%), Referenced to phase 2:EBTL and 6:WBTL, Start of Yellow, Master Intersection
Natural Cycle: 90
Control Type: Actuated-Coordinated
Maximum v/c Ratio: 0.97
Intersection Signal Delay: 32.5 Intersection LOS: C
Intersection Capacity Utilization 88.5% ICU Level of Service E
Analysis Period (min) 15
Splits and Phases: 5: East Hanover Ave & Ridgedale Ave
Timings
6: East Hanover Ave & Library 5/23/2012
2015 Build AM Alt 2 Synchro 7 - Report
Stantec Page 6
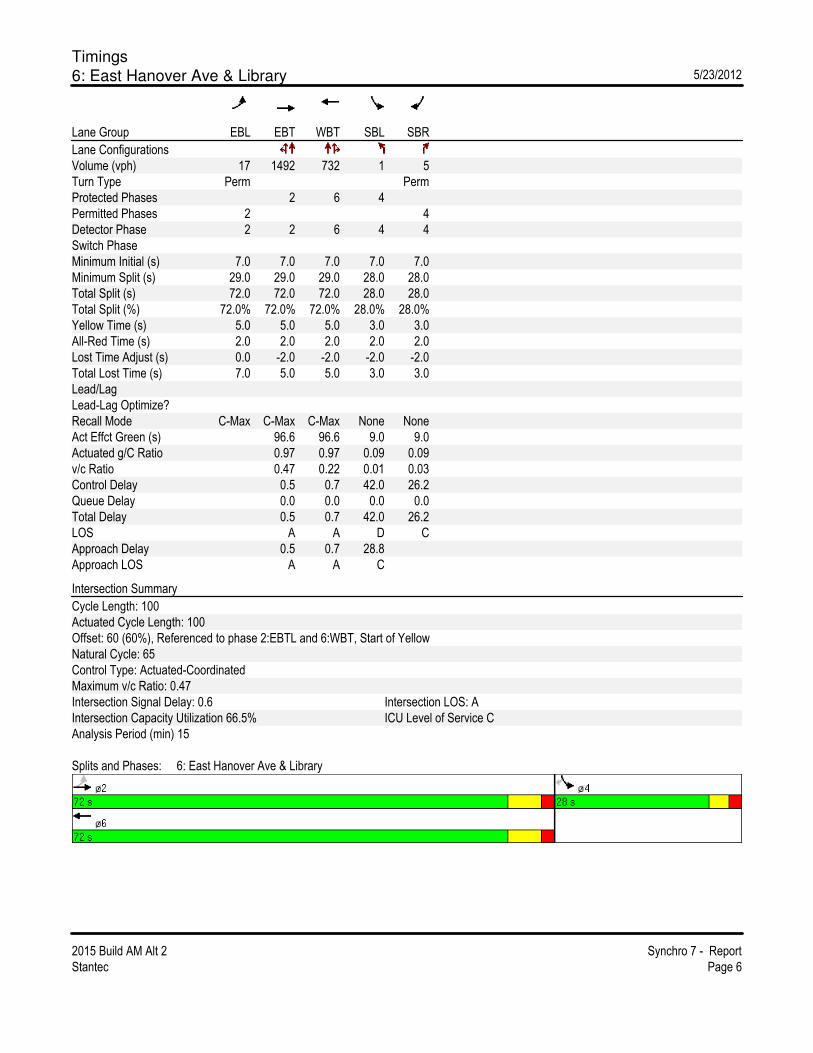
Lane Group EBL EBT WBT SBL SBR
Lane Configurations
Volume (vph) 17 1492 732 1 5
Turn Type Perm Perm
Protected Phases 2 6 4
Permitted Phases 2 4
Detector Phase 2 2 6 4 4
Switch Phase
Minimum Initial (s) 7.0 7.0 7.0 7.0 7.0
Minimum Split (s) 29.0 29.0 29.0 28.0 28.0
Total Split (s) 72.0 72.0 72.0 28.0 28.0
Total Split (%) 72.0% 72.0% 72.0% 28.0% 28.0%
Yellow Time (s) 5.0 5.0 5.0 3.0 3.0
All-Red Time (s) 2.0 2.0 2.0 2.0 2.0
Lost Time Adjust (s) 0.0 -2.0 -2.0 -2.0 -2.0
Total Lost Time (s) 7.0 5.0 5.0 3.0 3.0
Lead/Lag
Lead-Lag Optimize?
Recall Mode C-Max C-Max C-Max None None
Act Effct Green (s) 96.6 96.6 9.0 9.0
Actuated g/C Ratio 0.97 0.97 0.09 0.09
v/c Ratio 0.47 0.22 0.01 0.03
Control Delay 0.5 0.7 42.0 26.2
Queue Delay 0.0 0.0 0.0 0.0
Total Delay 0.5 0.7 42.0 26.2
LOS A A D C
Approach Delay 0.5 0.7 28.8
Approach LOS A A C
Intersection Summary
Cycle Length: 100
Actuated Cycle Length: 100
Offset: 60 (60%), Referenced to phase 2:EBTL and 6:WBT, Start of Yellow
Natural Cycle: 65
Control Type: Actuated-Coordinated
Maximum v/c Ratio: 0.47
Intersection Signal Delay: 0.6 Intersection LOS: A
Intersection Capacity Utilization 66.5% ICU Level of Service C
Analysis Period (min) 15
Splits and Phases: 6: East Hanover Ave & Library

Timings
7: East Hanover Ave & Whippany Rd 5/23/2012
2015 Build AM Alt 2 Synchro 7 - Report
Stantec Page 7
Lane Group EBL EBT NBL NBT NBR SBL SBT SBR
Lane Configurations
Volume (vph) 487 869 59 243 29 220 345 688
Turn Type Prot pm+pt Perm pm+pt Free
Protected Phases 7 4 5 2 1 6
Permitted Phases 2 2 6 Free
Detector Phase 7 4 5 2 2 1 6
Switch Phase
Minimum Initial (s) 7.0 7.0 5.0 7.0 7.0 5.0 7.0
Minimum Split (s) 23.0 13.0 9.0 13.0 13.0 9.0 23.0
Total Split (s) 78.0 78.0 9.0 19.0 19.0 13.0 23.0 0.0
Total Split (%) 70.9% 70.9% 8.2% 17.3% 17.3% 11.8% 20.9% 0.0%
Yellow Time (s) 4.0 4.0 4.0 4.0 4.0 4.0 4.0
All-Red Time (s) 2.0 2.0 0.0 2.0 2.0 0.0 2.0
Lost Time Adjust (s) -2.0 0.0 -2.0 -2.0 -2.0 -2.0 -2.0 -2.0
Total Lost Time (s) 4.0 6.0 2.0 4.0 4.0 2.0 4.0 2.0
Lead/Lag Lead Lag Lag Lead Lag
Lead-Lag Optimize? Yes Yes Yes Yes Yes
Recall Mode None C-Max None Min Min None Min
Act Effct Green (s) 74.9 72.9 23.1 14.1 14.1 29.1 19.9 110.0
Actuated g/C Ratio 0.68 0.66 0.21 0.13 0.13 0.26 0.18 1.00
v/c Ratio 0.42 0.86 0.25 0.57 0.15 0.76 0.56 0.45
Control Delay 9.4 24.0 33.3 50.3 44.1 51.7 45.4 0.9
Queue Delay 0.0 0.0 0.0 0.0 0.0 0.0 0.0 0.0
Total Delay 9.4 24.0 33.3 50.3 44.1 51.7 45.4 0.9
LOS A C C D D D D A
Approach Delay 19.3 46.8 22.1
Approach LOS B D C
Intersection Summary
Cycle Length: 110
Actuated Cycle Length: 110
Offset: 0 (0%), Referenced to phase 4:EBT, Start of Yellow
Natural Cycle: 90
Control Type: Actuated-Coordinated
Maximum v/c Ratio: 0.86
Intersection Signal Delay: 23.4 Intersection LOS: C
Intersection Capacity Utilization 84.6% ICU Level of Service E
Analysis Period (min) 15
Splits and Phases: 7: East Hanover Ave & Whippany Rd
Timings
46: East Hanover Ave & Big Box Driveway 5/23/2012
2015 Build AM Alt 2 Synchro 7 - Report
Stantec Page 8
Lane Group EBL EBT WBT SBL SBR
Lane Configurations
Volume (vph) 36 1353 904 15 9
Turn Type pm+pt Perm
Protected Phases 7 4 8 6
Permitted Phases 4 6
Detector Phase 7 4 8 6 6
Switch Phase
Minimum Initial (s) 7.0 10.0 10.0 10.0 10.0
Minimum Split (s) 12.0 21.0 21.0 26.0 26.0
Total Split (s) 12.0 74.0 62.0 26.0 26.0
Total Split (%) 12.0% 74.0% 62.0% 26.0% 26.0%
Yellow Time (s) 3.0 4.0 4.0 4.0 4.0
All-Red Time (s) 0.0 2.0 2.0 2.0 2.0
Lost Time Adjust (s) 0.0 0.0 0.0 0.0 0.0
Total Lost Time (s) 3.0 6.0 6.0 6.0 6.0
Lead/Lag Lead Lag
Lead-Lag Optimize? Yes Yes
Recall Mode None C-Max C-Max None None
Act Effct Green (s) 90.6 91.2 84.0 10.0 10.0
Actuated g/C Ratio 0.91 0.91 0.84 0.10 0.10
v/c Ratio 0.07 0.46 0.34 0.09 0.06
Control Delay 0.7 0.8 2.3 42.3 22.4
Queue Delay 0.0 0.0 0.0 0.0 0.0
Total Delay 0.7 0.8 2.3 42.3 22.4
LOS A A A D C
Approach Delay 0.8 2.3 34.6
Approach LOS A A C
Intersection Summary
Cycle Length: 100
Actuated Cycle Length: 100
Offset: 88 (88%), Referenced to phase 4:EBTL and 8:WBT, Start of Yellow
Natural Cycle: 60
Control Type: Actuated-Coordinated
Maximum v/c Ratio: 0.46
Intersection Signal Delay: 1.7 Intersection LOS: A
Intersection Capacity Utilization 55.7% ICU Level of Service B
Analysis Period (min) 15
Splits and Phases: 46: East Hanover Ave & Big Box Driveway
Timings
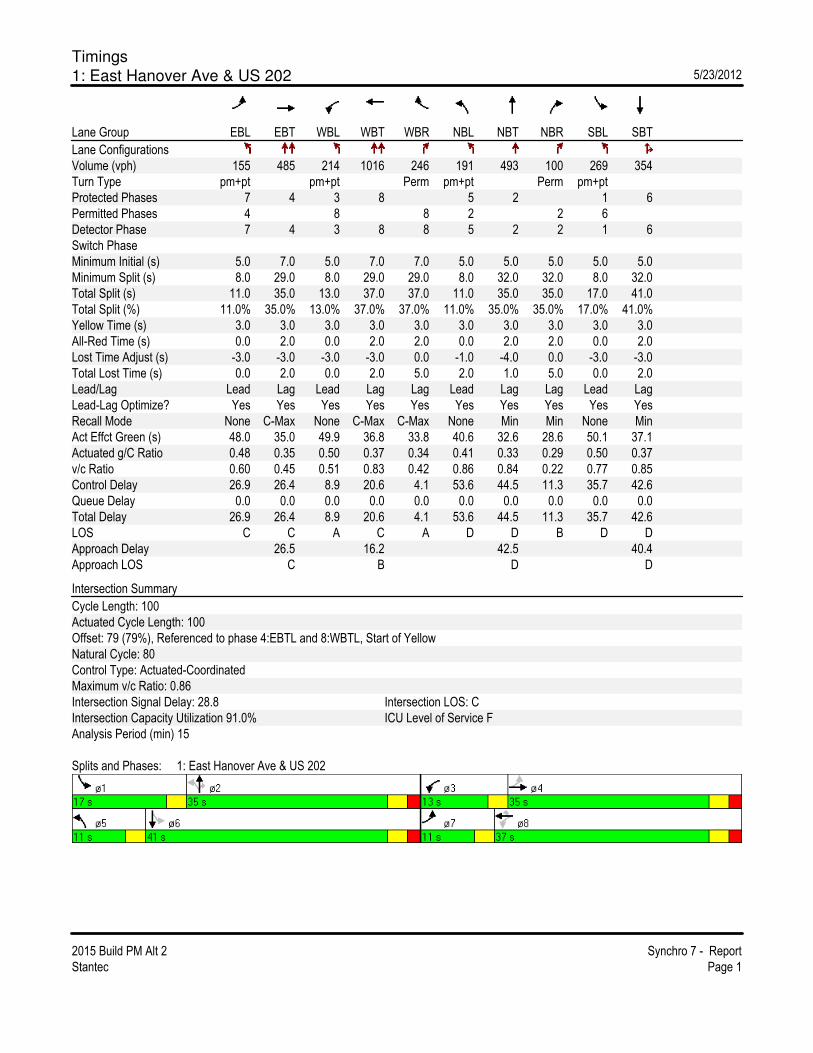
1: East Hanover Ave & US 202 5/23/2012
2015 Build PM Alt 2 Synchro 7 - Report
Stantec Page 1
Lane Group EBL EBT WBL WBT WBR NBL NBT NBR SBL SBT
Lane Configurations
Volume (vph) 155 485 214 1016 246 191 493 100 269 354
Turn Type pm+pt pm+pt Perm pm+pt Perm pm+pt
Protected Phases 7 4 3 8 5 2 1 6
Permitted Phases 4 8 8 2 2 6
Detector Phase 7 4 3 8 8 5 2 2 1 6
Switch Phase
Minimum Initial (s) 5.0 7.0 5.0 7.0 7.0 5.0 5.0 5.0 5.0 5.0
Minimum Split (s) 8.0 29.0 8.0 29.0 29.0 8.0 32.0 32.0 8.0 32.0
Total Split (s) 11.0 35.0 13.0 37.0 37.0 11.0 35.0 35.0 17.0 41.0
Total Split (%) 11.0% 35.0% 13.0% 37.0% 37.0% 11.0% 35.0% 35.0% 17.0% 41.0%
Yellow Time (s) 3.0 3.0 3.0 3.0 3.0 3.0 3.0 3.0 3.0 3.0
All-Red Time (s) 0.0 2.0 0.0 2.0 2.0 0.0 2.0 2.0 0.0 2.0
Lost Time Adjust (s) -3.0 -3.0 -3.0 -3.0 0.0 -1.0 -4.0 0.0 -3.0 -3.0
Total Lost Time (s) 0.0 2.0 0.0 2.0 5.0 2.0 1.0 5.0 0.0 2.0
Lead/Lag Lead Lag Lead Lag Lag Lead Lag Lag Lead Lag
Lead-Lag Optimize? Yes Yes Yes Yes Yes Yes Yes Yes Yes Yes
Recall Mode None C-Max None C-Max C-Max None Min Min None Min
Act Effct Green (s) 48.0 35.0 49.9 36.8 33.8 40.6 32.6 28.6 50.1 37.1
Actuated g/C Ratio 0.48 0.35 0.50 0.37 0.34 0.41 0.33 0.29 0.50 0.37
v/c Ratio 0.60 0.45 0.51 0.83 0.42 0.86 0.84 0.22 0.77 0.85
Control Delay 26.9 26.4 8.9 20.6 4.1 53.6 44.5 11.3 35.7 42.6
Queue Delay 0.0 0.0 0.0 0.0 0.0 0.0 0.0 0.0 0.0 0.0
Total Delay 26.9 26.4 8.9 20.6 4.1 53.6 44.5 11.3 35.7 42.6
LOS C C A C A D D B D D
Approach Delay 26.5 16.2 42.5 40.4
Approach LOS C B D D
Intersection Summary
Cycle Length: 100
Actuated Cycle Length: 100
Offset: 79 (79%), Referenced to phase 4:EBTL and 8:WBTL, Start of Yellow
Natural Cycle: 80
Control Type: Actuated-Coordinated
Maximum v/c Ratio: 0.86
Intersection Signal Delay: 28.8 Intersection LOS: C
Intersection Capacity Utilization 91.0% ICU Level of Service F
Analysis Period (min) 15
Splits and Phases: 1: East Hanover Ave & US 202

Timings
2: East Hanover Ave & The American Rd 5/23/2012
2015 Build PM Alt 2 Synchro 7 - Report
Stantec Page 2
Lane Group EBL EBT WBT WBR SBL SBR ø2
Lane Configurations
Volume (vph) 85 770 1259 79 219 222
Turn Type custom Free Free
Protected Phases 5 2 4! 6 4! 2
Permitted Phases 2 Free Free
Detector Phase 5 2 4 6 4
Switch Phase
Minimum Initial (s) 7.0 7.0 7.0 5.0
Minimum Split (s) 10.0 26.0 12.0 12.0
Total Split (s) 10.0 100.0 63.0 0.0 27.0 0.0 73.0
Total Split (%) 10.0% 100.0% 63.0% 0.0% 27.0% 0.0% 73%
Yellow Time (s) 3.0 4.0 3.0 4.0
All-Red Time (s) 0.0 2.0 2.0 2.0
Lost Time Adjust (s) 0.0 0.0 0.0 0.0 0.0 0.0
Total Lost Time (s) 3.0 6.0 6.0 4.0 5.0 4.0
Lead/Lag Lead Lag
Lead-Lag Optimize? Yes Yes
Recall Mode None C-Min None C-Max
Act Effct Green (s) 73.5 100.0 62.5 100.0 18.5 100.0
Actuated g/C Ratio 0.74 1.00 0.62 1.00 0.18 1.00
v/c Ratio 0.32 0.24 0.61 0.06 0.65 0.14
Control Delay 4.9 0.1 4.2 0.1 46.1 0.2
Queue Delay 0.0 0.0 0.0 0.0 0.0 0.0
Total Delay 4.9 0.1 4.2 0.1 46.1 0.2
LOS A A A A D A
Approach Delay 0.6 4.0 22.9
Approach LOS A A C
Intersection Summary
Cycle Length: 100
Actuated Cycle Length: 100
Offset: 59 (59%), Referenced to phase 2:EBTL and 6:WBT, Start of Yellow
Natural Cycle: 60
Control Type: Actuated-Coordinated
Maximum v/c Ratio: 0.65
Intersection Signal Delay: 6.1 Intersection LOS: A
Intersection Capacity Utilization 65.3% ICU Level of Service C
Analysis Period (min) 15
! Phase conflict between lane groups.
Splits and Phases: 2: East Hanover Ave & The American Rd

Timings
3: East Hanover Ave & Horse Hill Rd 5/23/2012
2015 Build PM Alt 2 Synchro 7 - Report
Stantec Page 3
Lane Group EBL EBT WBL WBT NBL NBT SBL SBT SBR
Lane Configurations
Volume (vph) 238 667 150 1229 79 126 160 202 236
Turn Type pm+pt pm+pt pm+pt pm+pt Perm
Protected Phases 5 2 1 6 3 8 7 4
Permitted Phases 2 6 8 4 4
Detector Phase 5 2 1 6 3 8 7 4 4
Switch Phase
Minimum Initial (s) 7.0 7.0 7.0 7.0 5.0 7.0 5.0 7.0 7.0
Minimum Split (s) 10.0 32.0 10.0 32.0 8.0 26.0 10.0 26.0 26.0
Total Split (s) 13.0 51.0 13.0 51.0 10.0 26.0 10.0 26.0 26.0
Total Split (%) 13.0% 51.0% 13.0% 51.0% 10.0% 26.0% 10.0% 26.0% 26.0%
Yellow Time (s) 3.0 4.0 3.0 4.0 3.0 3.0 3.0 3.0 3.0
All-Red Time (s) 0.0 2.0 0.0 2.0 0.0 2.0 0.0 2.0 2.0
Lost Time Adjust (s) -2.0 -2.0 -2.0 -2.0 -2.0 -2.0 -2.0 -2.0 0.0
Total Lost Time (s) 1.0 4.0 1.0 4.0 1.0 3.0 1.0 3.0 5.0
Lead/Lag Lead Lag Lead Lag Lead Lag Lead Lag Lag
Lead-Lag Optimize? Yes Yes Yes Yes Yes Yes Yes Yes Yes
Recall Mode None C-Max None C-Max None None None None None
Act Effct Green (s) 67.3 52.8 63.6 49.9 29.3 18.5 29.7 20.5 18.5
Actuated g/C Ratio 0.67 0.53 0.64 0.50 0.29 0.18 0.30 0.20 0.18
v/c Ratio 0.81 0.49 0.36 0.79 0.28 0.60 0.59 0.57 0.51
Control Delay 38.1 13.9 6.2 13.5 26.5 39.6 34.8 42.0 8.4
Queue Delay 0.0 0.0 0.0 0.0 0.0 0.0 0.0 0.0 0.0
Total Delay 38.1 13.9 6.2 13.5 26.5 39.6 34.8 42.0 8.4
LOS D B A B C D C D A
Approach Delay 19.4 12.7 35.8 26.8
Approach LOS B B D C
Intersection Summary
Cycle Length: 100
Actuated Cycle Length: 100
Offset: 93 (93%), Referenced to phase 2:EBTL and 6:WBTL, Start of Yellow
Natural Cycle: 90
Control Type: Actuated-Coordinated
Maximum v/c Ratio: 0.81
Intersection Signal Delay: 19.2 Intersection LOS: B
Intersection Capacity Utilization 82.0% ICU Level of Service E
Analysis Period (min) 15
Splits and Phases: 3: East Hanover Ave & Horse Hill Rd

HCM Unsignalized Intersection Capacity Analysis
4: East Hanover Ave & Monroe St 5/23/2012
2015 Build PM Alt 2 Synchro 7 - Report
Stantec Page 4
Movement EBT EBR WBL WBT NBL NBR
Lane Configurations
Volume (veh/h) 879 4 95 1417 2 68
Sign Control Free Free Stop
Grade 0% 0% 0%
Peak Hour Factor 0.96 0.96 0.96 0.96 0.96 0.96
Hourly flow rate (vph) 916 4 99 1476 2 71
Pedestrians
Lane Width (ft)
Walking Speed (ft/s)
Percent Blockage
Right turn flare (veh)
Median type None None
Median storage veh)
Upstream signal (ft) 161 847
pX, platoon unblocked 0.94 0.73 0.94
vC, conflicting volume 920 1854 460
vC1, stage 1 conf vol
vC2, stage 2 conf vol
vCu, unblocked vol 778 1028 287
tC, single (s) 4.1 6.8 6.9
tC, 2 stage (s)
tF (s) 2.2 3.5 3.3
p0 queue free % 87 99 89
cM capacity (veh/h) 781 148 664
Direction, Lane # EB 1 EB 2 WB 1 WB 2 NB 1
Volume Total 610 309 591 984 73
Volume Left 0 0 99 0 2
Volume Right 0 4 0 0 71
cSH 1700 1700 781 1700 604
Volume to Capacity 0.36 0.18 0.13 0.58 0.12
Queue Length 95th (ft) 0 0 11 0 10
Control Delay (s) 0.0 0.0 3.2 0.0 11.8
Lane LOS A B
Approach Delay (s) 0.0 1.2 11.8
Approach LOS B
Intersection Summary
Average Delay 1.1
Intersection Capacity Utilization 80.7% ICU Level of Service D
Analysis Period (min) 15

Timings
5: East Hanover Ave & Ridgedale Ave 5/23/2012
2015 Build PM Alt 2 Synchro 7 - Report
Stantec Page 5
Lane Group EBL EBT WBL WBT NBL NBT SBL SBT
Lane Configurations
Volume (vph) 145 619 164 1062 301 417 200 324
Turn Type pm+pt pm+pt pm+pt pm+pt
Protected Phases 5 2 1 6 3 8 7 4
Permitted Phases 2 6 8 4
Detector Phase 5 2 1 6 3 8 7 4
Switch Phase
Minimum Initial (s) 7.0 7.0 7.0 7.0 5.0 7.0 5.0 7.0
Minimum Split (s) 11.0 13.0 11.0 13.0 8.0 27.0 8.0 23.0
Total Split (s) 13.0 46.0 11.0 44.0 20.0 27.0 16.0 23.0
Total Split (%) 13.0% 46.0% 11.0% 44.0% 20.0% 27.0% 16.0% 23.0%
Yellow Time (s) 4.0 4.0 4.0 4.0 3.0 4.0 3.0 4.0
All-Red Time (s) 0.0 2.0 0.0 2.0 0.0 2.0 0.0 2.0
Lost Time Adjust (s) 0.0 -2.0 0.0 -2.0 -2.0 -2.0 -2.0 -2.0
Total Lost Time (s) 4.0 4.0 4.0 4.0 1.0 4.0 1.0 4.0
Lead/Lag Lead Lag Lead Lag Lead Lag Lead Lag
Lead-Lag Optimize? Yes Yes Yes Yes Yes Yes Yes Yes
Recall Mode Max C-Max Max C-Max None None None None
Act Effct Green (s) 52.6 42.0 48.6 40.0 40.4 22.9 34.4 17.9
Actuated g/C Ratio 0.53 0.42 0.49 0.40 0.40 0.23 0.34 0.18
v/c Ratio 0.58 0.59 0.55 0.88 0.85 0.71 0.60 0.80
Control Delay 27.1 22.0 15.2 30.2 44.5 39.4 27.7 43.2
Queue Delay 0.0 0.0 0.0 0.0 0.0 0.0 0.0 0.0
Total Delay 27.1 22.0 15.2 30.2 44.5 39.4 27.7 43.2
LOS C C B C D D C D
Approach Delay 22.8 28.3 41.3 38.7
Approach LOS C C D D
Intersection Summary
Cycle Length: 100
Actuated Cycle Length: 100
Offset: 54 (54%), Referenced to phase 2:EBTL and 6:WBTL, Start of Yellow
Natural Cycle: 80
Control Type: Actuated-Coordinated
Maximum v/c Ratio: 0.88
Intersection Signal Delay: 31.6 Intersection LOS: C
Intersection Capacity Utilization 85.7% ICU Level of Service E
Analysis Period (min) 15
Splits and Phases: 5: East Hanover Ave & Ridgedale Ave

Timings
6: East Hanover Ave & Library 5/23/2012
2015 Build PM Alt 2 Synchro 7 - Report
Stantec Page 6
Lane Group EBL EBT WBT SBL SBR
Lane Configurations
Volume (vph) 50 866 1263 49 82
Turn Type Perm Perm
Protected Phases 2 6 4
Permitted Phases 2 4
Detector Phase 2 2 6 4 4
Switch Phase
Minimum Initial (s) 7.0 7.0 7.0 7.0 7.0
Minimum Split (s) 29.0 29.0 29.0 28.0 28.0
Total Split (s) 71.0 71.0 71.0 29.0 29.0
Total Split (%) 71.0% 71.0% 71.0% 29.0% 29.0%
Yellow Time (s) 5.0 5.0 5.0 3.0 3.0
All-Red Time (s) 2.0 2.0 2.0 2.0 2.0
Lost Time Adjust (s) 0.0 -2.0 -2.0 -2.0 -2.0
Total Lost Time (s) 7.0 5.0 5.0 3.0 3.0
Lead/Lag
Lead-Lag Optimize?
Recall Mode C-Max C-Max C-Max None None
Act Effct Green (s) 84.7 84.7 10.7 10.7
Actuated g/C Ratio 0.85 0.85 0.11 0.11
v/c Ratio 0.42 0.47 0.28 0.38
Control Delay 1.5 2.4 44.3 18.8
Queue Delay 0.0 0.0 0.0 0.0
Total Delay 1.5 2.4 44.3 18.8
LOS A A D B
Approach Delay 1.5 2.4 28.4
Approach LOS A A C
Intersection Summary
Cycle Length: 100
Actuated Cycle Length: 100
Offset: 35 (35%), Referenced to phase 2:EBTL and 6:WBT, Start of Yellow
Natural Cycle: 60
Control Type: Actuated-Coordinated
Maximum v/c Ratio: 0.47
Intersection Signal Delay: 3.5 Intersection LOS: A
Intersection Capacity Utilization 74.6% ICU Level of Service D
Analysis Period (min) 15
Splits and Phases: 6: East Hanover Ave & Library
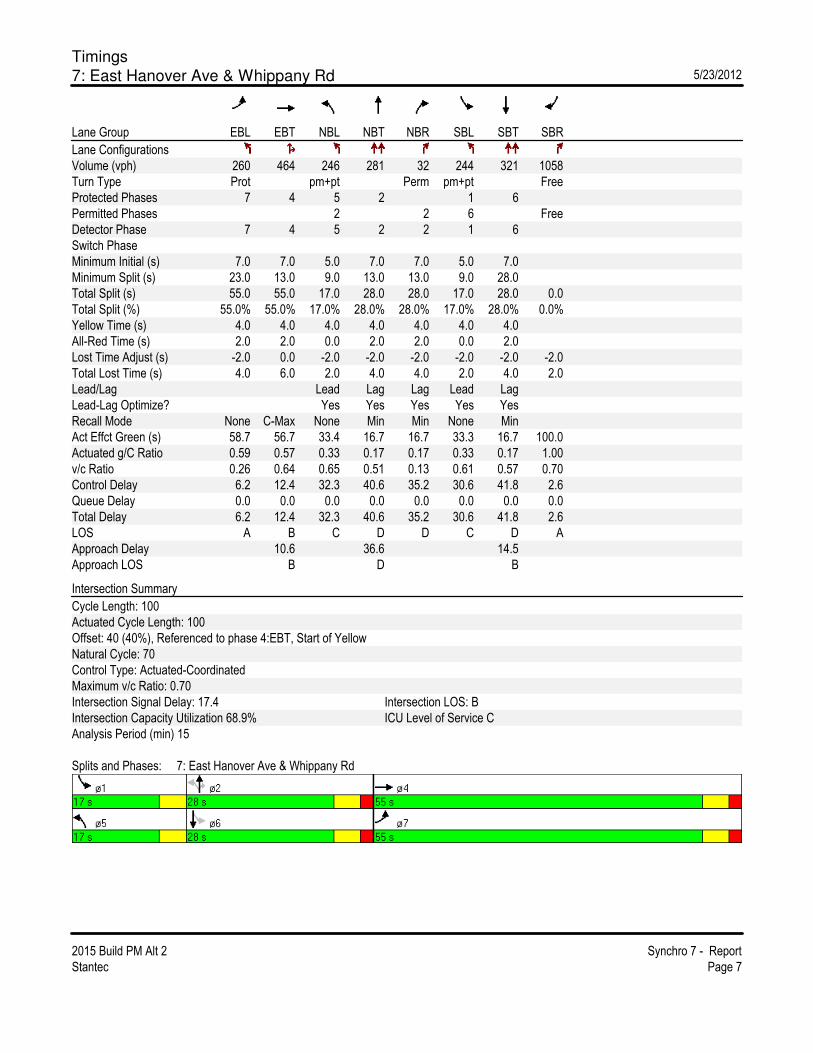
Timings
7: East Hanover Ave & Whippany Rd 5/23/2012
2015 Build PM Alt 2 Synchro 7 - Report
Stantec Page 7
Lane Group EBL EBT NBL NBT NBR SBL SBT SBR
Lane Configurations
Volume (vph) 260 464 246 281 32 244 321 1058
Turn Type Prot pm+pt Perm pm+pt Free
Protected Phases 7 4 5 2 1 6
Permitted Phases 2 2 6 Free
Detector Phase 7 4 5 2 2 1 6
Switch Phase
Minimum Initial (s) 7.0 7.0 5.0 7.0 7.0 5.0 7.0
Minimum Split (s) 23.0 13.0 9.0 13.0 13.0 9.0 28.0
Total Split (s) 55.0 55.0 17.0 28.0 28.0 17.0 28.0 0.0
Total Split (%) 55.0% 55.0% 17.0% 28.0% 28.0% 17.0% 28.0% 0.0%
Yellow Time (s) 4.0 4.0 4.0 4.0 4.0 4.0 4.0
All-Red Time (s) 2.0 2.0 0.0 2.0 2.0 0.0 2.0
Lost Time Adjust (s) -2.0 0.0 -2.0 -2.0 -2.0 -2.0 -2.0 -2.0
Total Lost Time (s) 4.0 6.0 2.0 4.0 4.0 2.0 4.0 2.0
Lead/Lag Lead Lag Lag Lead Lag
Lead-Lag Optimize? Yes Yes Yes Yes Yes
Recall Mode None C-Max None Min Min None Min
Act Effct Green (s) 58.7 56.7 33.4 16.7 16.7 33.3 16.7 100.0
Actuated g/C Ratio 0.59 0.57 0.33 0.17 0.17 0.33 0.17 1.00
v/c Ratio 0.26 0.64 0.65 0.51 0.13 0.61 0.57 0.70
Control Delay 6.2 12.4 32.3 40.6 35.2 30.6 41.8 2.6
Queue Delay 0.0 0.0 0.0 0.0 0.0 0.0 0.0 0.0
Total Delay 6.2 12.4 32.3 40.6 35.2 30.6 41.8 2.6
LOS A B C D D C D A
Approach Delay 10.6 36.6 14.5
Approach LOS B D B
Intersection Summary
Cycle Length: 100
Actuated Cycle Length: 100
Offset: 40 (40%), Referenced to phase 4:EBT, Start of Yellow
Natural Cycle: 70
Control Type: Actuated-Coordinated
Maximum v/c Ratio: 0.70
Intersection Signal Delay: 17.4 Intersection LOS: B
Intersection Capacity Utilization 68.9% ICU Level of Service C
Analysis Period (min) 15
Splits and Phases: 7: East Hanover Ave & Whippany Rd

Timings
46: East Hanover Ave & Big Box Driveway 5/23/2012
2015 Build PM Alt 2 Synchro 7 - Report
Stantec Page 8
Lane Group EBL EBT WBT SBL SBR
Lane Configurations
Volume (vph) 31 861 1400 22 29
Turn Type pm+pt Perm
Protected Phases 7 4 8 6
Permitted Phases 4 6
Detector Phase 7 4 8 6 6
Switch Phase
Minimum Initial (s) 7.0 10.0 10.0 10.0 10.0
Minimum Split (s) 12.0 21.0 22.0 26.0 26.0
Total Split (s) 12.0 74.0 62.0 26.0 26.0
Total Split (%) 12.0% 74.0% 62.0% 26.0% 26.0%
Yellow Time (s) 3.0 4.0 4.0 4.0 4.0
All-Red Time (s) 0.0 2.0 2.0 2.0 2.0
Lost Time Adjust (s) 0.0 0.0 0.0 0.0 0.0
Total Lost Time (s) 3.0 6.0 6.0 6.0 6.0
Lead/Lag Lead Lag
Lead-Lag Optimize? Yes Yes
Recall Mode None C-Max C-Max None None
Act Effct Green (s) 87.4 86.8 80.8 10.0 10.0
Actuated g/C Ratio 0.87 0.87 0.81 0.10 0.10
v/c Ratio 0.11 0.30 0.55 0.13 0.17
Control Delay 2.1 2.2 3.3 43.1 16.9
Queue Delay 0.0 0.0 0.0 0.0 0.0
Total Delay 2.1 2.2 3.3 43.1 16.9
LOS A A A D B
Approach Delay 2.2 3.3 28.1
Approach LOS A A C
Intersection Summary
Cycle Length: 100
Actuated Cycle Length: 100
Offset: 93 (93%), Referenced to phase 4:EBTL and 8:WBT, Start of Yellow
Natural Cycle: 80
Control Type: Actuated-Coordinated
Maximum v/c Ratio: 0.55
Intersection Signal Delay: 3.4 Intersection LOS: A
Intersection Capacity Utilization 57.6% ICU Level of Service B
Analysis Period (min) 15
Splits and Phases: 46: East Hanover Ave & Big Box Driveway

2015 ALTERNATIVE 3
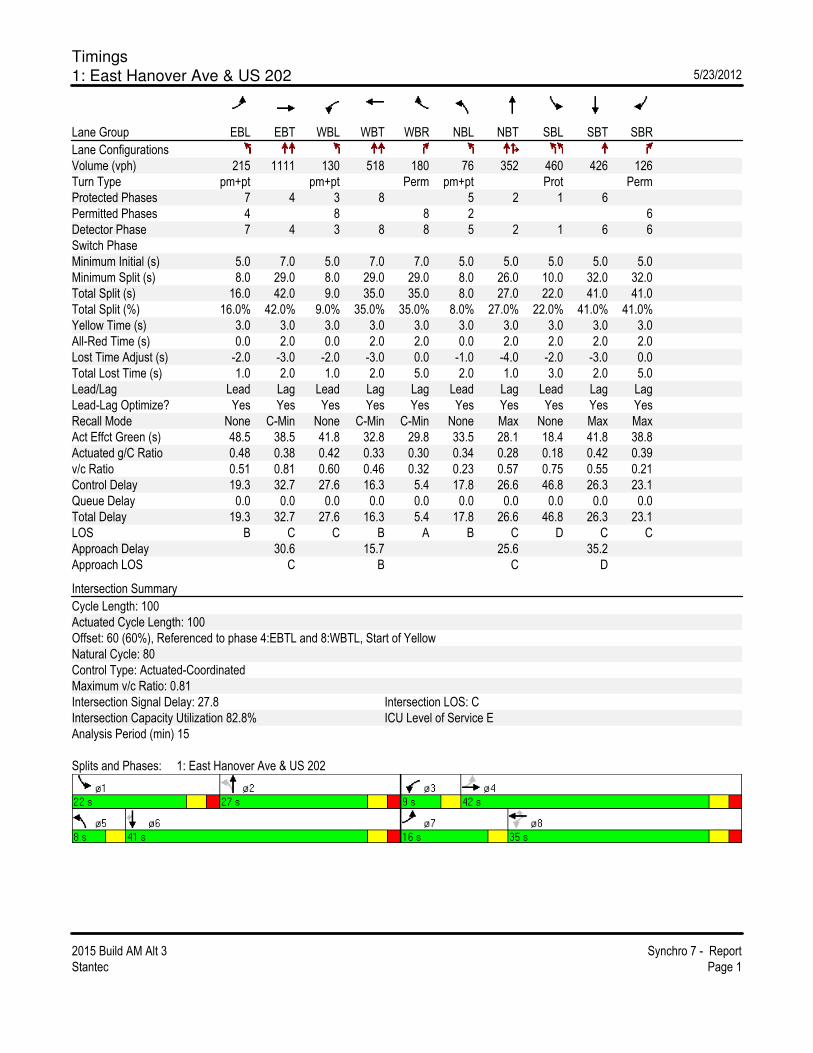
Timings
1: East Hanover Ave & US 202 5/23/2012
2015 Build AM Alt 3 Synchro 7 - Report
Stantec Page 1
Lane Group EBL EBT WBL WBT WBR NBL NBT SBL SBT SBR
Lane Configurations
Volume (vph) 215 1111 130 518 180 76 352 460 426 126
Turn Type pm+pt pm+pt Perm pm+pt Prot Perm
Protected Phases 7 4 3 8 5 2 1 6
Permitted Phases 4 8 8 2 6
Detector Phase 7 4 3 8 8 5 2 1 6 6
Switch Phase
Minimum Initial (s) 5.0 7.0 5.0 7.0 7.0 5.0 5.0 5.0 5.0 5.0
Minimum Split (s) 8.0 29.0 8.0 29.0 29.0 8.0 26.0 10.0 32.0 32.0
Total Split (s) 16.0 42.0 9.0 35.0 35.0 8.0 27.0 22.0 41.0 41.0
Total Split (%) 16.0% 42.0% 9.0% 35.0% 35.0% 8.0% 27.0% 22.0% 41.0% 41.0%
Yellow Time (s) 3.0 3.0 3.0 3.0 3.0 3.0 3.0 3.0 3.0 3.0
All-Red Time (s) 0.0 2.0 0.0 2.0 2.0 0.0 2.0 2.0 2.0 2.0
Lost Time Adjust (s) -2.0 -3.0 -2.0 -3.0 0.0 -1.0 -4.0 -2.0 -3.0 0.0
Total Lost Time (s) 1.0 2.0 1.0 2.0 5.0 2.0 1.0 3.0 2.0 5.0
Lead/Lag Lead Lag Lead Lag Lag Lead Lag Lead Lag Lag
Lead-Lag Optimize? Yes Yes Yes Yes Yes Yes Yes Yes Yes Yes
Recall Mode None C-Min None C-Min C-Min None Max None Max Max
Act Effct Green (s) 48.5 38.5 41.8 32.8 29.8 33.5 28.1 18.4 41.8 38.8
Actuated g/C Ratio 0.48 0.38 0.42 0.33 0.30 0.34 0.28 0.18 0.42 0.39
v/c Ratio 0.51 0.81 0.60 0.46 0.32 0.23 0.57 0.75 0.55 0.21
Control Delay 19.3 32.7 27.6 16.3 5.4 17.8 26.6 46.8 26.3 23.1
Queue Delay 0.0 0.0 0.0 0.0 0.0 0.0 0.0 0.0 0.0 0.0
Total Delay 19.3 32.7 27.6 16.3 5.4 17.8 26.6 46.8 26.3 23.1
LOS B C C B A B C D C C
Approach Delay 30.6 15.7 25.6 35.2
Approach LOS C B C D
Intersection Summary
Cycle Length: 100
Actuated Cycle Length: 100
Offset: 60 (60%), Referenced to phase 4:EBTL and 8:WBTL, Start of Yellow
Natural Cycle: 80
Control Type: Actuated-Coordinated
Maximum v/c Ratio: 0.81
Intersection Signal Delay: 27.8 Intersection LOS: C
Intersection Capacity Utilization 82.8% ICU Level of Service E
Analysis Period (min) 15
Splits and Phases: 1: East Hanover Ave & US 202

Timings
2: East Hanover Ave & The American Rd 5/23/2012
2015 Build AM Alt 3 Synchro 7 - Report
Stantec Page 2
Lane Group EBL EBT WBT WBR SBL SBR ø2
Lane Configurations
Volume (vph) 202 1586 756 260 61 55
Turn Type custom Free Free
Protected Phases 5 2 4! 6 4! 2
Permitted Phases 2 Free Free
Detector Phase 5 2 4 6 4
Switch Phase
Minimum Initial (s) 7.0 7.0 7.0 5.0
Minimum Split (s) 10.0 26.0 12.0 12.0
Total Split (s) 19.0 100.0 64.0 0.0 17.0 0.0 83.0
Total Split (%) 19.0% 100.0% 64.0% 0.0% 17.0% 0.0% 83%
Yellow Time (s) 3.0 4.0 3.0 4.0
All-Red Time (s) 0.0 2.0 2.0 2.0
Lost Time Adjust (s) 0.0 0.0 0.0 0.0 0.0 0.0
Total Lost Time (s) 3.0 6.0 6.0 4.0 5.0 4.0
Lead/Lag Lead Lag
Lead-Lag Optimize? Yes Yes
Recall Mode None C-Min None C-Max
Act Effct Green (s) 80.0 100.0 65.7 100.0 12.0 100.0
Actuated g/C Ratio 0.80 1.00 0.66 1.00 0.12 1.00
v/c Ratio 0.38 0.48 0.34 0.18 0.27 0.03
Control Delay 3.4 0.3 4.4 0.2 43.5 0.0
Queue Delay 0.0 0.0 0.0 0.0 0.0 0.0
Total Delay 3.4 0.3 4.4 0.2 43.5 0.0
LOS A A A A D A
Approach Delay 0.7 3.3 22.8
Approach LOS A A C
Intersection Summary
Cycle Length: 100
Actuated Cycle Length: 100
Offset: 46 (46%), Referenced to phase 2:EBTL and 6:WBT, Start of Yellow
Natural Cycle: 50
Control Type: Actuated-Coordinated
Maximum v/c Ratio: 0.48
Intersection Signal Delay: 2.5 Intersection LOS: A
Intersection Capacity Utilization 58.8% ICU Level of Service B
Analysis Period (min) 15
! Phase conflict between lane groups.
Splits and Phases: 2: East Hanover Ave & The American Rd
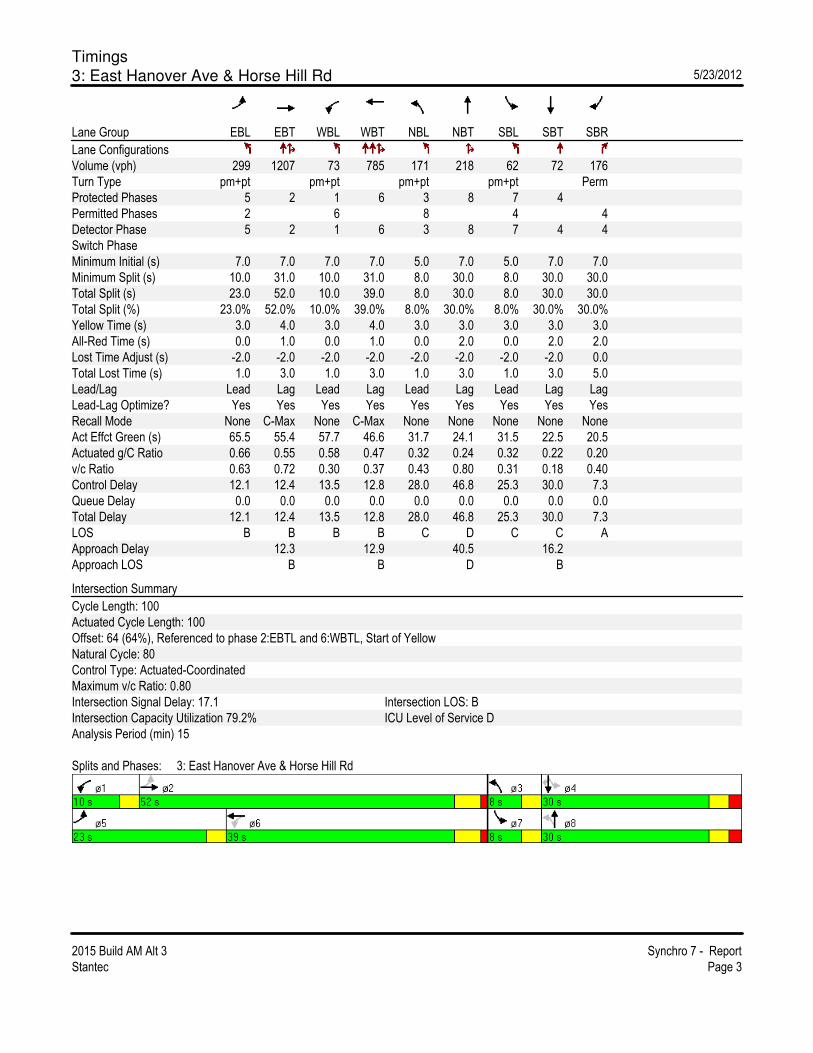
Timings
3: East Hanover Ave & Horse Hill Rd 5/23/2012
2015 Build AM Alt 3 Synchro 7 - Report
Stantec Page 3
Lane Group EBL EBT WBL WBT NBL NBT SBL SBT SBR
Lane Configurations
Volume (vph) 299 1207 73 785 171 218 62 72 176
Turn Type pm+pt pm+pt pm+pt pm+pt Perm
Protected Phases 5 2 1 6 3 8 7 4
Permitted Phases 2 6 8 4 4
Detector Phase 5 2 1 6 3 8 7 4 4
Switch Phase
Minimum Initial (s) 7.0 7.0 7.0 7.0 5.0 7.0 5.0 7.0 7.0
Minimum Split (s) 10.0 31.0 10.0 31.0 8.0 30.0 8.0 30.0 30.0
Total Split (s) 23.0 52.0 10.0 39.0 8.0 30.0 8.0 30.0 30.0
Total Split (%) 23.0% 52.0% 10.0% 39.0% 8.0% 30.0% 8.0% 30.0% 30.0%
Yellow Time (s) 3.0 4.0 3.0 4.0 3.0 3.0 3.0 3.0 3.0
All-Red Time (s) 0.0 1.0 0.0 1.0 0.0 2.0 0.0 2.0 2.0
Lost Time Adjust (s) -2.0 -2.0 -2.0 -2.0 -2.0 -2.0 -2.0 -2.0 0.0
Total Lost Time (s) 1.0 3.0 1.0 3.0 1.0 3.0 1.0 3.0 5.0
Lead/Lag Lead Lag Lead Lag Lead Lag Lead Lag Lag
Lead-Lag Optimize? Yes Yes Yes Yes Yes Yes Yes Yes Yes
Recall Mode None C-Max None C-Max None None None None None
Act Effct Green (s) 65.5 55.4 57.7 46.6 31.7 24.1 31.5 22.5 20.5
Actuated g/C Ratio 0.66 0.55 0.58 0.47 0.32 0.24 0.32 0.22 0.20
v/c Ratio 0.63 0.72 0.30 0.37 0.43 0.80 0.31 0.18 0.40
Control Delay 12.1 12.4 13.5 12.8 28.0 46.8 25.3 30.0 7.3
Queue Delay 0.0 0.0 0.0 0.0 0.0 0.0 0.0 0.0 0.0
Total Delay 12.1 12.4 13.5 12.8 28.0 46.8 25.3 30.0 7.3
LOS B B B B C D C C A
Approach Delay 12.3 12.9 40.5 16.2
Approach LOS B B D B
Intersection Summary
Cycle Length: 100
Actuated Cycle Length: 100
Offset: 64 (64%), Referenced to phase 2:EBTL and 6:WBTL, Start of Yellow
Natural Cycle: 80
Control Type: Actuated-Coordinated
Maximum v/c Ratio: 0.80
Intersection Signal Delay: 17.1 Intersection LOS: B
Intersection Capacity Utilization 79.2% ICU Level of Service D
Analysis Period (min) 15
Splits and Phases: 3: East Hanover Ave & Horse Hill Rd
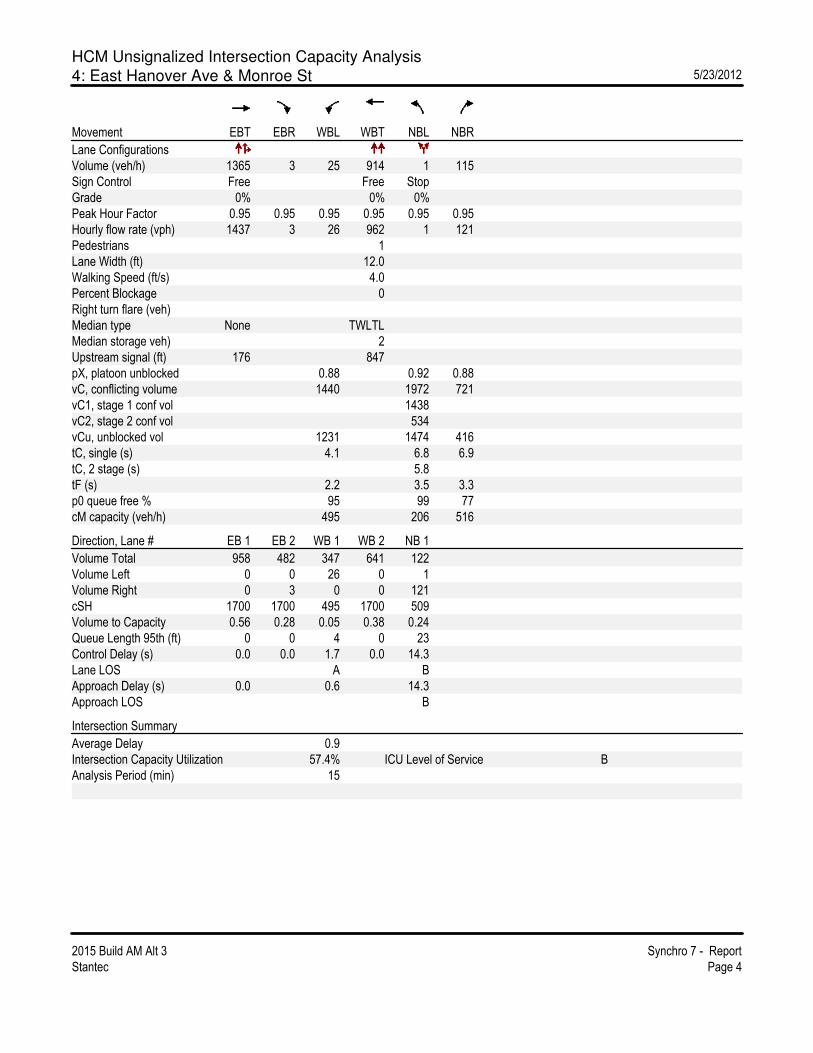
HCM Unsignalized Intersection Capacity Analysis
4: East Hanover Ave & Monroe St 5/23/2012
2015 Build AM Alt 3 Synchro 7 - Report
Stantec Page 4
Movement EBT EBR WBL WBT NBL NBR
Lane Configurations
Volume (veh/h) 1365 3 25 914 1 115
Sign Control Free Free Stop
Grade 0% 0% 0%
Peak Hour Factor 0.95 0.95 0.95 0.95 0.95 0.95
Hourly flow rate (vph) 1437 3 26 962 1 121
Pedestrians 1
Lane Width (ft) 12.0
Walking Speed (ft/s) 4.0
Percent Blockage 0
Right turn flare (veh)
Median type None TWLTL
Median storage veh) 2
Upstream signal (ft) 176 847
pX, platoon unblocked 0.88 0.92 0.88
vC, conflicting volume 1440 1972 721
vC1, stage 1 conf vol 1438
vC2, stage 2 conf vol 534
vCu, unblocked vol 1231 1474 416
tC, single (s) 4.1 6.8 6.9
tC, 2 stage (s) 5.8
tF (s) 2.2 3.5 3.3
p0 queue free % 95 99 77
cM capacity (veh/h) 495 206 516
Direction, Lane # EB 1 EB 2 WB 1 WB 2 NB 1
Volume Total 958 482 347 641 122
Volume Left 0 0 26 0 1
Volume Right 0 3 0 0 121
cSH 1700 1700 495 1700 509
Volume to Capacity 0.56 0.28 0.05 0.38 0.24
Queue Length 95th (ft) 0 0 4 0 23
Control Delay (s) 0.0 0.0 1.7 0.0 14.3
Lane LOS A B
Approach Delay (s) 0.0 0.6 14.3
Approach LOS B
Intersection Summary
Average Delay 0.9
Intersection Capacity Utilization 57.4% ICU Level of Service B
Analysis Period (min) 15

Timings
5: East Hanover Ave & Ridgedale Ave 5/23/2012
2015 Build AM Alt 3 Synchro 7 - Report
Stantec Page 5
Lane Group EBL EBT WBL WBT NBL NBT SBL SBT SBR
Lane Configurations
Volume (vph) 88 1218 115 545 338 310 133 232 77
Turn Type pm+pt pm+pt Prot pm+pt Free
Protected Phases 5 2 1 6 3 8 7 4
Permitted Phases 2 6 4 Free
Detector Phase 5 2 1 6 3 8 7 4
Switch Phase
Minimum Initial (s) 7.0 7.0 7.0 7.0 5.0 7.0 5.0 7.0
Minimum Split (s) 11.0 13.0 11.0 13.0 10.0 28.0 8.0 24.0
Total Split (s) 11.0 47.0 11.0 47.0 18.0 28.0 14.0 24.0 0.0
Total Split (%) 11.0% 47.0% 11.0% 47.0% 18.0% 28.0% 14.0% 24.0% 0.0%
Yellow Time (s) 4.0 4.0 4.0 4.0 3.0 4.0 3.0 4.0
All-Red Time (s) 0.0 2.0 0.0 2.0 2.0 2.0 0.0 2.0
Lost Time Adjust (s) 0.0 -2.0 0.0 -2.0 -2.0 -2.0 -2.0 -2.0 -2.0
Total Lost Time (s) 4.0 4.0 4.0 4.0 3.0 4.0 1.0 4.0 2.0
Lead/Lag Lead Lag Lead Lag Lead Lag Lead Lag
Lead-Lag Optimize? Yes Yes Yes Yes Yes Yes Yes Yes
Recall Mode None C-Max None C-Max None Min None Min
Act Effct Green (s) 56.1 48.6 57.5 51.1 14.7 19.1 28.4 13.9 100.0
Actuated g/C Ratio 0.56 0.49 0.58 0.51 0.15 0.19 0.28 0.14 1.00
v/c Ratio 0.20 0.91 0.57 0.35 0.78 0.62 0.41 0.51 0.05
Control Delay 5.2 23.1 25.3 14.6 53.9 39.0 26.4 43.2 0.1
Queue Delay 0.0 0.0 0.0 0.0 0.0 0.0 0.0 0.0 0.0
Total Delay 5.2 23.1 25.3 14.6 53.9 39.0 26.4 43.2 0.1
LOS A C C B D D C D A
Approach Delay 22.1 16.3 46.1 30.6
Approach LOS C B D C
Intersection Summary
Cycle Length: 100
Actuated Cycle Length: 100
Offset: 0 (0%), Referenced to phase 2:EBTL and 6:WBTL, Start of Yellow, Master Intersection
Natural Cycle: 90
Control Type: Actuated-Coordinated
Maximum v/c Ratio: 0.91
Intersection Signal Delay: 27.0 Intersection LOS: C
Intersection Capacity Utilization 79.5% ICU Level of Service D
Analysis Period (min) 15
Splits and Phases: 5: East Hanover Ave & Ridgedale Ave

Timings
6: East Hanover Ave & Library 5/23/2012
2015 Build AM Alt 3 Synchro 7 - Report
Stantec Page 6
Lane Group EBL EBT WBT SBL SBR
Lane Configurations
Volume (vph) 17 1492 732 1 5
Turn Type Perm Perm
Protected Phases 2 6 4
Permitted Phases 2 4
Detector Phase 2 2 6 4 4
Switch Phase
Minimum Initial (s) 7.0 7.0 7.0 7.0 7.0
Minimum Split (s) 29.0 29.0 29.0 28.0 28.0
Total Split (s) 72.0 72.0 72.0 28.0 28.0
Total Split (%) 72.0% 72.0% 72.0% 28.0% 28.0%
Yellow Time (s) 5.0 5.0 5.0 3.0 3.0
All-Red Time (s) 2.0 2.0 2.0 2.0 2.0
Lost Time Adjust (s) 0.0 -2.0 -2.0 -2.0 -2.0
Total Lost Time (s) 7.0 5.0 5.0 3.0 3.0
Lead/Lag
Lead-Lag Optimize?
Recall Mode C-Max C-Max C-Max None None
Act Effct Green (s) 96.6 96.6 9.0 9.0
Actuated g/C Ratio 0.97 0.97 0.09 0.09
v/c Ratio 0.47 0.22 0.01 0.03
Control Delay 0.8 0.6 42.0 26.2
Queue Delay 0.0 0.0 0.0 0.0
Total Delay 0.8 0.6 42.0 26.2
LOS A A D C
Approach Delay 0.8 0.6 28.8
Approach LOS A A C
Intersection Summary
Cycle Length: 100
Actuated Cycle Length: 100
Offset: 59 (59%), Referenced to phase 2:EBTL and 6:WBT, Start of Yellow
Natural Cycle: 65
Control Type: Actuated-Coordinated
Maximum v/c Ratio: 0.47
Intersection Signal Delay: 0.8 Intersection LOS: A
Intersection Capacity Utilization 66.5% ICU Level of Service C
Analysis Period (min) 15
Splits and Phases: 6: East Hanover Ave & Library

Timings
7: East Hanover Ave & Whippany Rd 5/23/2012
2015 Build AM Alt 3 Synchro 7 - Report
Stantec Page 7
Lane Group EBT NBL NBT NBR SBL SBT SBR ø7
Lane Configurations
Volume (vph) 869 59 243 29 220 345 688
Turn Type pm+pt Perm pm+pt Free
Protected Phases 4 5 2 1 6 7
Permitted Phases 2 2 6 Free
Detector Phase 4 5 2 2 1 6
Switch Phase
Minimum Initial (s) 7.0 5.0 7.0 7.0 5.0 7.0 7.0
Minimum Split (s) 13.0 9.0 13.0 13.0 9.0 28.0 13.0
Total Split (s) 63.0 9.0 20.0 20.0 17.0 28.0 0.0 63.0
Total Split (%) 63.0% 9.0% 20.0% 20.0% 17.0% 28.0% 0.0% 63%
Yellow Time (s) 4.0 4.0 4.0 4.0 4.0 4.0 4.0
All-Red Time (s) 2.0 0.0 2.0 2.0 0.0 2.0 2.0
Lost Time Adjust (s) 0.0 -2.0 -2.0 -2.0 -2.0 -2.0 -2.0
Total Lost Time (s) 6.0 2.0 4.0 4.0 2.0 4.0 2.0
Lead/Lag Lead Lag Lag Lead Lag
Lead-Lag Optimize? Yes Yes Yes Yes Yes
Recall Mode C-Max None Min Min None Min None
Act Effct Green (s) 59.4 23.1 14.1 14.1 32.6 23.4 100.0
Actuated g/C Ratio 0.59 0.23 0.14 0.14 0.33 0.23 1.00
v/c Ratio 0.76 0.21 0.52 0.14 0.57 0.43 0.45
Control Delay 6.1 25.0 43.4 38.2 31.5 34.6 0.9
Queue Delay 0.0 0.0 0.0 0.0 0.0 0.0 0.0
Total Delay 6.1 25.0 43.4 38.2 31.5 34.6 0.9
LOS A C D D C C A
Approach Delay 6.1 39.7 15.6
Approach LOS A D B
Intersection Summary
Cycle Length: 100
Actuated Cycle Length: 100
Offset: 83 (83%), Referenced to phase 4:EBTL, Start of Yellow
Natural Cycle: 80
Control Type: Actuated-Coordinated
Maximum v/c Ratio: 0.76
Intersection Signal Delay: 13.6 Intersection LOS: B
Intersection Capacity Utilization 73.1% ICU Level of Service D
Analysis Period (min) 15
Splits and Phases: 7: East Hanover Ave & Whippany Rd

Timings
46: East Hanover Ave & Big Box Driveway 5/23/2012
2015 Build AM Alt 3 Synchro 7 - Report
Stantec Page 8
Lane Group EBL EBT WBT SBL SBR
Lane Configurations
Volume (vph) 36 1353 904 15 9
Turn Type pm+pt Perm
Protected Phases 7 4 8 6
Permitted Phases 4 6
Detector Phase 7 4 8 6 6
Switch Phase
Minimum Initial (s) 7.0 10.0 10.0 10.0 10.0
Minimum Split (s) 12.0 21.0 22.0 26.0 26.0
Total Split (s) 12.0 74.0 62.0 26.0 26.0
Total Split (%) 12.0% 74.0% 62.0% 26.0% 26.0%
Yellow Time (s) 3.0 4.0 4.0 4.0 4.0
All-Red Time (s) 0.0 2.0 2.0 2.0 2.0
Lost Time Adjust (s) 0.0 0.0 0.0 0.0 0.0
Total Lost Time (s) 3.0 6.0 6.0 6.0 6.0
Lead/Lag Lead Lag
Lead-Lag Optimize? Yes Yes
Recall Mode None C-Max C-Max None None
Act Effct Green (s) 90.6 91.2 84.0 10.0 10.0
Actuated g/C Ratio 0.91 0.91 0.84 0.10 0.10
v/c Ratio 0.07 0.46 0.34 0.09 0.06
Control Delay 0.7 0.9 3.6 42.3 22.4
Queue Delay 0.0 0.0 0.0 0.0 0.0
Total Delay 0.7 0.9 3.6 42.3 22.4
LOS A A A D C
Approach Delay 0.9 3.6 34.6
Approach LOS A A C
Intersection Summary
Cycle Length: 100
Actuated Cycle Length: 100
Offset: 91 (91%), Referenced to phase 4:EBTL and 8:WBT, Start of Yellow
Natural Cycle: 60
Control Type: Actuated-Coordinated
Maximum v/c Ratio: 0.46
Intersection Signal Delay: 2.3 Intersection LOS: A
Intersection Capacity Utilization 55.7% ICU Level of Service B
Analysis Period (min) 15
Splits and Phases: 46: East Hanover Ave & Big Box Driveway
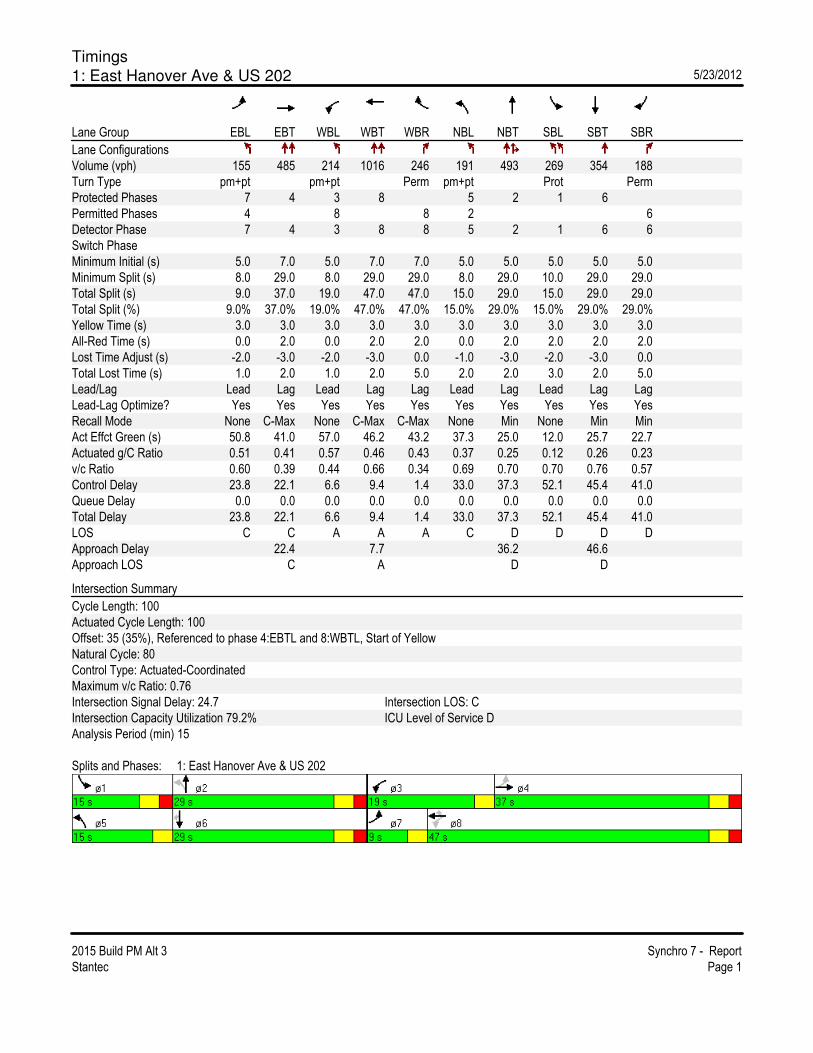
Timings
1: East Hanover Ave & US 202 5/23/2012
2015 Build PM Alt 3 Synchro 7 - Report
Stantec Page 1
Lane Group EBL EBT WBL WBT WBR NBL NBT SBL SBT SBR
Lane Configurations
Volume (vph) 155 485 214 1016 246 191 493 269 354 188
Turn Type pm+pt pm+pt Perm pm+pt Prot Perm
Protected Phases 7 4 3 8 5 2 1 6
Permitted Phases 4 8 8 2 6
Detector Phase 7 4 3 8 8 5 2 1 6 6
Switch Phase
Minimum Initial (s) 5.0 7.0 5.0 7.0 7.0 5.0 5.0 5.0 5.0 5.0
Minimum Split (s) 8.0 29.0 8.0 29.0 29.0 8.0 29.0 10.0 29.0 29.0
Total Split (s) 9.0 37.0 19.0 47.0 47.0 15.0 29.0 15.0 29.0 29.0
Total Split (%) 9.0% 37.0% 19.0% 47.0% 47.0% 15.0% 29.0% 15.0% 29.0% 29.0%
Yellow Time (s) 3.0 3.0 3.0 3.0 3.0 3.0 3.0 3.0 3.0 3.0
All-Red Time (s) 0.0 2.0 0.0 2.0 2.0 0.0 2.0 2.0 2.0 2.0
Lost Time Adjust (s) -2.0 -3.0 -2.0 -3.0 0.0 -1.0 -3.0 -2.0 -3.0 0.0
Total Lost Time (s) 1.0 2.0 1.0 2.0 5.0 2.0 2.0 3.0 2.0 5.0
Lead/Lag Lead Lag Lead Lag Lag Lead Lag Lead Lag Lag
Lead-Lag Optimize? Yes Yes Yes Yes Yes Yes Yes Yes Yes Yes
Recall Mode None C-Max None C-Max C-Max None Min None Min Min
Act Effct Green (s) 50.8 41.0 57.0 46.2 43.2 37.3 25.0 12.0 25.7 22.7
Actuated g/C Ratio 0.51 0.41 0.57 0.46 0.43 0.37 0.25 0.12 0.26 0.23
v/c Ratio 0.60 0.39 0.44 0.66 0.34 0.69 0.70 0.70 0.76 0.57
Control Delay 23.8 22.1 6.6 9.4 1.4 33.0 37.3 52.1 45.4 41.0
Queue Delay 0.0 0.0 0.0 0.0 0.0 0.0 0.0 0.0 0.0 0.0
Total Delay 23.8 22.1 6.6 9.4 1.4 33.0 37.3 52.1 45.4 41.0
LOS C C A A A C D D D D
Approach Delay 22.4 7.7 36.2 46.6
Approach LOS C A D D
Intersection Summary
Cycle Length: 100
Actuated Cycle Length: 100
Offset: 35 (35%), Referenced to phase 4:EBTL and 8:WBTL, Start of Yellow
Natural Cycle: 80
Control Type: Actuated-Coordinated
Maximum v/c Ratio: 0.76
Intersection Signal Delay: 24.7 Intersection LOS: C
Intersection Capacity Utilization 79.2% ICU Level of Service D
Analysis Period (min) 15
Splits and Phases: 1: East Hanover Ave & US 202
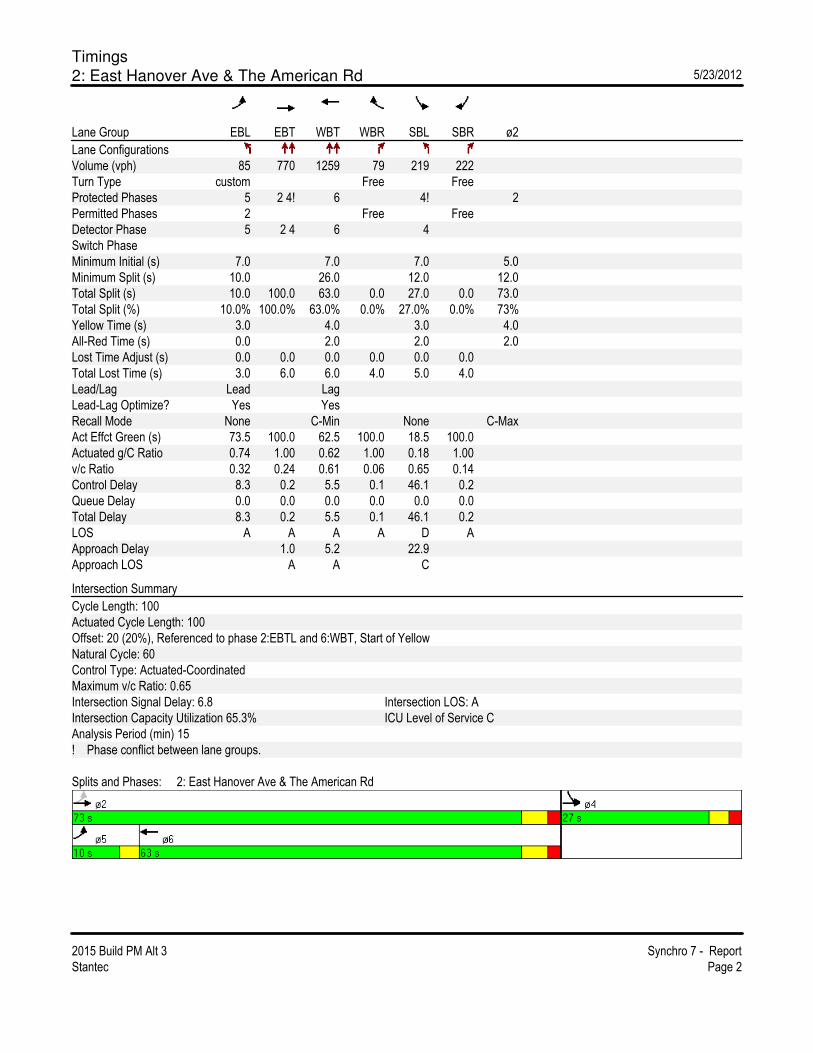
Timings
2: East Hanover Ave & The American Rd 5/23/2012
2015 Build PM Alt 3 Synchro 7 - Report
Stantec Page 2
Lane Group EBL EBT WBT WBR SBL SBR ø2
Lane Configurations
Volume (vph) 85 770 1259 79 219 222
Turn Type custom Free Free
Protected Phases 5 2 4! 6 4! 2
Permitted Phases 2 Free Free
Detector Phase 5 2 4 6 4
Switch Phase
Minimum Initial (s) 7.0 7.0 7.0 5.0
Minimum Split (s) 10.0 26.0 12.0 12.0
Total Split (s) 10.0 100.0 63.0 0.0 27.0 0.0 73.0
Total Split (%) 10.0% 100.0% 63.0% 0.0% 27.0% 0.0% 73%
Yellow Time (s) 3.0 4.0 3.0 4.0
All-Red Time (s) 0.0 2.0 2.0 2.0
Lost Time Adjust (s) 0.0 0.0 0.0 0.0 0.0 0.0
Total Lost Time (s) 3.0 6.0 6.0 4.0 5.0 4.0
Lead/Lag Lead Lag
Lead-Lag Optimize? Yes Yes
Recall Mode None C-Min None C-Max
Act Effct Green (s) 73.5 100.0 62.5 100.0 18.5 100.0
Actuated g/C Ratio 0.74 1.00 0.62 1.00 0.18 1.00
v/c Ratio 0.32 0.24 0.61 0.06 0.65 0.14
Control Delay 8.3 0.2 5.5 0.1 46.1 0.2
Queue Delay 0.0 0.0 0.0 0.0 0.0 0.0
Total Delay 8.3 0.2 5.5 0.1 46.1 0.2
LOS A A A A D A
Approach Delay 1.0 5.2 22.9
Approach LOS A A C
Intersection Summary
Cycle Length: 100
Actuated Cycle Length: 100
Offset: 20 (20%), Referenced to phase 2:EBTL and 6:WBT, Start of Yellow
Natural Cycle: 60
Control Type: Actuated-Coordinated
Maximum v/c Ratio: 0.65
Intersection Signal Delay: 6.8 Intersection LOS: A
Intersection Capacity Utilization 65.3% ICU Level of Service C
Analysis Period (min) 15
! Phase conflict between lane groups.
Splits and Phases: 2: East Hanover Ave & The American Rd

Timings
3: East Hanover Ave & Horse Hill Rd 5/23/2012
2015 Build PM Alt 3 Synchro 7 - Report
Stantec Page 3
Lane Group EBL EBT WBL WBT NBL NBT SBL SBT SBR
Lane Configurations
Volume (vph) 238 667 150 1229 79 126 160 202 236
Turn Type pm+pt pm+pt pm+pt pm+pt Perm
Protected Phases 5 2 1 6 3 8 7 4
Permitted Phases 2 6 8 4 4
Detector Phase 5 2 1 6 3 8 7 4 4
Switch Phase
Minimum Initial (s) 7.0 7.0 7.0 7.0 5.0 7.0 5.0 7.0 7.0
Minimum Split (s) 10.0 31.0 10.0 31.0 8.0 27.0 8.0 27.0 27.0
Total Split (s) 20.0 52.0 10.0 42.0 8.0 27.0 11.0 30.0 30.0
Total Split (%) 20.0% 52.0% 10.0% 42.0% 8.0% 27.0% 11.0% 30.0% 30.0%
Yellow Time (s) 3.0 4.0 3.0 4.0 3.0 3.0 3.0 3.0 3.0
All-Red Time (s) 0.0 1.0 0.0 1.0 0.0 2.0 0.0 2.0 2.0
Lost Time Adjust (s) -2.0 -2.0 -2.0 -2.0 -2.0 -2.0 -2.0 -2.0 0.0
Total Lost Time (s) 1.0 3.0 1.0 3.0 1.0 3.0 1.0 3.0 5.0
Lead/Lag Lead Lag Lead Lag Lead Lag Lead Lag Lag
Lead-Lag Optimize? Yes Yes Yes Yes Yes Yes Yes Yes Yes
Recall Mode None C-Max None C-Max None None None None None
Act Effct Green (s) 67.2 54.2 61.1 49.0 26.7 17.7 30.7 22.3 20.3
Actuated g/C Ratio 0.67 0.54 0.61 0.49 0.27 0.18 0.31 0.22 0.20
v/c Ratio 0.68 0.47 0.37 0.56 0.29 0.62 0.56 0.52 0.49
Control Delay 19.9 13.1 6.9 8.3 26.5 40.9 33.2 38.7 7.5
Queue Delay 0.0 0.0 0.0 0.0 0.0 0.0 0.0 0.0 0.0
Total Delay 19.9 13.1 6.9 8.3 26.5 40.9 33.2 38.7 7.5
LOS B B A A C D C D A
Approach Delay 14.6 8.2 36.7 24.9
Approach LOS B A D C
Intersection Summary
Cycle Length: 100
Actuated Cycle Length: 100
Offset: 53 (53%), Referenced to phase 2:EBTL and 6:WBTL, Start of Yellow
Natural Cycle: 80
Control Type: Actuated-Coordinated
Maximum v/c Ratio: 0.68
Intersection Signal Delay: 15.5 Intersection LOS: B
Intersection Capacity Utilization 71.2% ICU Level of Service C
Analysis Period (min) 15
Splits and Phases: 3: East Hanover Ave & Horse Hill Rd

HCM Unsignalized Intersection Capacity Analysis
4: East Hanover Ave & Monroe St 5/23/2012
2015 Build PM Alt 3 Synchro 7 - Report
Stantec Page 4
Movement EBT EBR WBL WBT NBL NBR
Lane Configurations
Volume (veh/h) 879 4 95 1417 2 68
Sign Control Free Free Stop
Grade 0% 0% 0%
Peak Hour Factor 0.96 0.96 0.96 0.96 0.96 0.96
Hourly flow rate (vph) 916 4 99 1476 2 71
Pedestrians
Lane Width (ft)
Walking Speed (ft/s)
Percent Blockage
Right turn flare (veh)
Median type None TWLTL
Median storage veh) 2
Upstream signal (ft) 161 847
pX, platoon unblocked 0.94 0.74 0.94
vC, conflicting volume 920 1854 460
vC1, stage 1 conf vol 918
vC2, stage 2 conf vol 936
vCu, unblocked vol 778 1071 286
tC, single (s) 4.1 6.8 6.9
tC, 2 stage (s) 5.8
tF (s) 2.2 3.5 3.3
p0 queue free % 87 99 89
cM capacity (veh/h) 781 340 665
Direction, Lane # EB 1 EB 2 WB 1 WB 2 NB 1
Volume Total 610 309 591 984 73
Volume Left 0 0 99 0 2
Volume Right 0 4 0 0 71
cSH 1700 1700 781 1700 647
Volume to Capacity 0.36 0.18 0.13 0.58 0.11
Queue Length 95th (ft) 0 0 11 0 9
Control Delay (s) 0.0 0.0 3.2 0.0 11.3
Lane LOS A B
Approach Delay (s) 0.0 1.2 11.3
Approach LOS B
Intersection Summary
Average Delay 1.1
Intersection Capacity Utilization 80.7% ICU Level of Service D
Analysis Period (min) 15

Timings
5: East Hanover Ave & Ridgedale Ave 5/23/2012
2015 Build PM Alt 3 Synchro 7 - Report
Stantec Page 5
Lane Group EBL EBT WBL WBT NBL NBT SBL SBT SBR
Lane Configurations
Volume (vph) 145 619 164 1062 301 417 200 324 170
Turn Type pm+pt pm+pt Prot pm+pt Free
Protected Phases 5 2 1 6 3 8 7 4
Permitted Phases 2 6 4 Free
Detector Phase 5 2 1 6 3 8 7 4
Switch Phase
Minimum Initial (s) 7.0 7.0 7.0 7.0 5.0 7.0 5.0 7.0
Minimum Split (s) 11.0 13.0 11.0 13.0 10.0 28.0 8.0 24.0
Total Split (s) 16.0 44.0 14.0 42.0 18.0 28.0 14.0 24.0 0.0
Total Split (%) 16.0% 44.0% 14.0% 42.0% 18.0% 28.0% 14.0% 24.0% 0.0%
Yellow Time (s) 4.0 4.0 4.0 4.0 3.0 4.0 3.0 4.0
All-Red Time (s) 0.0 2.0 0.0 2.0 2.0 2.0 0.0 2.0
Lost Time Adjust (s) 0.0 -2.0 0.0 -2.0 -2.0 -2.0 -2.0 -2.0 -2.0
Total Lost Time (s) 4.0 4.0 4.0 4.0 3.0 4.0 1.0 4.0 2.0
Lead/Lag Lead Lag Lead Lag Lead Lag Lead Lag
Lead-Lag Optimize? Yes Yes Yes Yes Yes Yes Yes Yes
Recall Mode None C-Max None C-Max None None None None
Act Effct Green (s) 53.5 44.3 52.7 43.9 14.4 21.3 33.1 17.5 100.0
Actuated g/C Ratio 0.54 0.44 0.53 0.44 0.14 0.21 0.33 0.18 1.00
v/c Ratio 0.64 0.56 0.51 0.80 0.71 0.76 0.66 0.57 0.12
Control Delay 32.7 17.9 13.3 24.7 50.2 42.1 32.3 41.4 0.2
Queue Delay 0.0 0.0 0.0 0.0 0.0 0.0 0.0 0.0 0.0
Total Delay 32.7 17.9 13.3 24.7 50.2 42.1 32.3 41.4 0.2
LOS C B B C D D C D A
Approach Delay 20.2 23.3 45.1 28.6
Approach LOS C C D C
Intersection Summary
Cycle Length: 100
Actuated Cycle Length: 100
Offset: 0 (0%), Referenced to phase 2:EBTL and 6:WBTL, Start of Yellow, Master Intersection
Natural Cycle: 80
Control Type: Actuated-Coordinated
Maximum v/c Ratio: 0.80
Intersection Signal Delay: 28.2 Intersection LOS: C
Intersection Capacity Utilization 80.4% ICU Level of Service D
Analysis Period (min) 15
Splits and Phases: 5: East Hanover Ave & Ridgedale Ave

Timings
6: East Hanover Ave & Library 5/23/2012
2015 Build PM Alt 3 Synchro 7 - Report
Stantec Page 6
Lane Group EBL EBT WBT SBL SBR
Lane Configurations
Volume (vph) 50 866 1263 49 82
Turn Type Perm Perm
Protected Phases 2 6 4
Permitted Phases 2 4
Detector Phase 2 2 6 4 4
Switch Phase
Minimum Initial (s) 7.0 7.0 7.0 7.0 7.0
Minimum Split (s) 29.0 29.0 29.0 28.0 28.0
Total Split (s) 71.0 71.0 71.0 29.0 29.0
Total Split (%) 71.0% 71.0% 71.0% 29.0% 29.0%
Yellow Time (s) 5.0 5.0 5.0 3.0 3.0
All-Red Time (s) 2.0 2.0 2.0 2.0 2.0
Lost Time Adjust (s) 0.0 -2.0 -2.0 -2.0 -2.0
Total Lost Time (s) 7.0 5.0 5.0 3.0 3.0
Lead/Lag
Lead-Lag Optimize?
Recall Mode C-Max C-Max C-Max None None
Act Effct Green (s) 84.7 84.7 10.7 10.7
Actuated g/C Ratio 0.85 0.85 0.11 0.11
v/c Ratio 0.42 0.47 0.28 0.38
Control Delay 1.7 2.4 44.3 18.8
Queue Delay 0.0 0.0 0.0 0.0
Total Delay 1.7 2.4 44.3 18.8
LOS A A D B
Approach Delay 1.7 2.4 28.4
Approach LOS A A C
Intersection Summary
Cycle Length: 100
Actuated Cycle Length: 100
Offset: 83 (83%), Referenced to phase 2:EBTL and 6:WBT, Start of Yellow
Natural Cycle: 60
Control Type: Actuated-Coordinated
Maximum v/c Ratio: 0.47
Intersection Signal Delay: 3.5 Intersection LOS: A
Intersection Capacity Utilization 74.6% ICU Level of Service D
Analysis Period (min) 15
Splits and Phases: 6: East Hanover Ave & Library
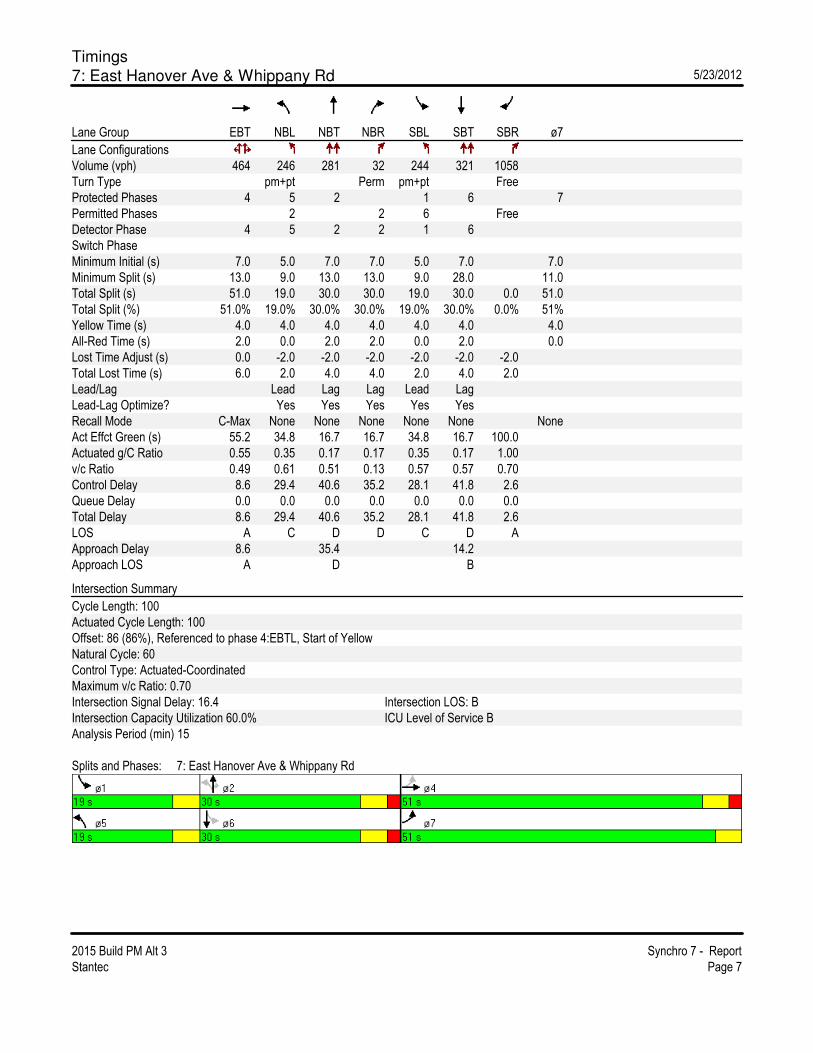
Timings
7: East Hanover Ave & Whippany Rd 5/23/2012
2015 Build PM Alt 3 Synchro 7 - Report
Stantec Page 7
Lane Group EBT NBL NBT NBR SBL SBT SBR ø7
Lane Configurations
Volume (vph) 464 246 281 32 244 321 1058
Turn Type pm+pt Perm pm+pt Free
Protected Phases 4 5 2 1 6 7
Permitted Phases 2 2 6 Free
Detector Phase 4 5 2 2 1 6
Switch Phase
Minimum Initial (s) 7.0 5.0 7.0 7.0 5.0 7.0 7.0
Minimum Split (s) 13.0 9.0 13.0 13.0 9.0 28.0 11.0
Total Split (s) 51.0 19.0 30.0 30.0 19.0 30.0 0.0 51.0
Total Split (%) 51.0% 19.0% 30.0% 30.0% 19.0% 30.0% 0.0% 51%
Yellow Time (s) 4.0 4.0 4.0 4.0 4.0 4.0 4.0
All-Red Time (s) 2.0 0.0 2.0 2.0 0.0 2.0 0.0
Lost Time Adjust (s) 0.0 -2.0 -2.0 -2.0 -2.0 -2.0 -2.0
Total Lost Time (s) 6.0 2.0 4.0 4.0 2.0 4.0 2.0
Lead/Lag Lead Lag Lag Lead Lag
Lead-Lag Optimize? Yes Yes Yes Yes Yes
Recall Mode C-Max None None None None None None
Act Effct Green (s) 55.2 34.8 16.7 16.7 34.8 16.7 100.0
Actuated g/C Ratio 0.55 0.35 0.17 0.17 0.35 0.17 1.00
v/c Ratio 0.49 0.61 0.51 0.13 0.57 0.57 0.70
Control Delay 8.6 29.4 40.6 35.2 28.1 41.8 2.6
Queue Delay 0.0 0.0 0.0 0.0 0.0 0.0 0.0
Total Delay 8.6 29.4 40.6 35.2 28.1 41.8 2.6
LOS A C D D C D A
Approach Delay 8.6 35.4 14.2
Approach LOS A D B
Intersection Summary
Cycle Length: 100
Actuated Cycle Length: 100
Offset: 86 (86%), Referenced to phase 4:EBTL, Start of Yellow
Natural Cycle: 60
Control Type: Actuated-Coordinated
Maximum v/c Ratio: 0.70
Intersection Signal Delay: 16.4 Intersection LOS: B
Intersection Capacity Utilization 60.0% ICU Level of Service B
Analysis Period (min) 15
Splits and Phases: 7: East Hanover Ave & Whippany Rd

Timings
46: East Hanover Ave & Big Box Driveway 5/23/2012
2015 Build PM Alt 3 Synchro 7 - Report
Stantec Page 8
Lane Group EBL EBT WBT SBL SBR
Lane Configurations
Volume (vph) 31 861 1400 22 29
Turn Type pm+pt Perm
Protected Phases 7 4 8 6
Permitted Phases 4 6
Detector Phase 7 4 8 6 6
Switch Phase
Minimum Initial (s) 7.0 10.0 10.0 10.0 10.0
Minimum Split (s) 10.0 22.0 22.0 26.0 26.0
Total Split (s) 12.0 74.0 62.0 26.0 26.0
Total Split (%) 12.0% 74.0% 62.0% 26.0% 26.0%
Yellow Time (s) 3.0 4.0 4.0 4.0 4.0
All-Red Time (s) 0.0 2.0 2.0 2.0 2.0
Lost Time Adjust (s) 0.0 0.0 0.0 0.0 0.0
Total Lost Time (s) 3.0 6.0 6.0 6.0 6.0
Lead/Lag Lead Lag
Lead-Lag Optimize? Yes Yes
Recall Mode None C-Max C-Max None None
Act Effct Green (s) 87.4 86.8 80.8 10.0 10.0
Actuated g/C Ratio 0.87 0.87 0.81 0.10 0.10
v/c Ratio 0.11 0.30 0.55 0.13 0.17
Control Delay 3.4 4.3 1.4 43.1 16.9
Queue Delay 0.0 0.0 0.0 0.0 0.0
Total Delay 3.4 4.3 1.4 43.1 16.9
LOS A A A D B
Approach Delay 4.2 1.4 28.1
Approach LOS A A C
Intersection Summary
Cycle Length: 100
Actuated Cycle Length: 100
Offset: 41 (41%), Referenced to phase 4:EBTL and 8:WBT, Start of Yellow
Natural Cycle: 75
Control Type: Actuated-Coordinated
Maximum v/c Ratio: 0.55
Intersection Signal Delay: 3.0 Intersection LOS: A
Intersection Capacity Utilization 57.6% ICU Level of Service B
Analysis Period (min) 15
Splits and Phases: 46: East Hanover Ave & Big Box Driveway

2035 NO BUILD CONDITION
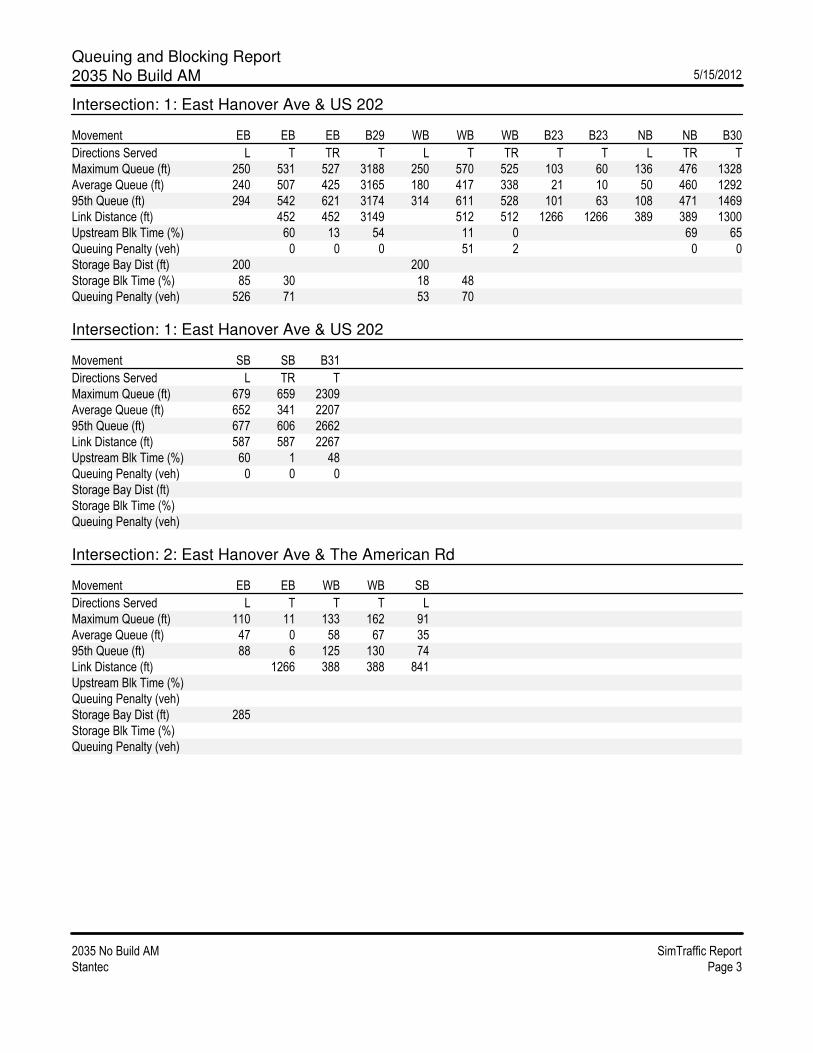
Queuing and Blocking Report
2035 No Build AM 5/15/2012
2035 No Build AM SimTraffic Report
Stantec Page 3
Intersection: 1: East Hanover Ave & US 202
Movement EB EB EB B29 WB WB WB B23 B23 NB NB B30
Directions Served L T TR T L T TR T T L TR T
Maximum Queue (ft) 250 531 527 3188 250 570 525 103 60 136 476 1328
Average Queue (ft) 240 507 425 3165 180 417 338 21 10 50 460 1292
95th Queue (ft) 294 542 621 3174 314 611 528 101 63 108 471 1469
Link Distance (ft) 452 452 3149 512 512 1266 1266 389 389 1300
Upstream Blk Time (%) 60 13 54 11 0 69 65
Queuing Penalty (veh) 0 0 0 51 2 0 0
Storage Bay Dist (ft) 200 200
Storage Blk Time (%) 85 30 18 48
Queuing Penalty (veh) 526 71 53 70
Intersection: 1: East Hanover Ave & US 202
Movement SB SB B31
Directions Served L TR T
Maximum Queue (ft) 679 659 2309
Average Queue (ft) 652 341 2207
95th Queue (ft) 677 606 2662
Link Distance (ft) 587 587 2267
Upstream Blk Time (%) 60 1 48
Queuing Penalty (veh) 0 0 0
Storage Bay Dist (ft)
Storage Blk Time (%)
Queuing Penalty (veh)
Intersection: 2: East Hanover Ave & The American Rd
Movement EB EB WB WB SB
Directions Served L T T T L
Maximum Queue (ft) 110 11 133 162 91
Average Queue (ft) 47 0 58 67 35
95th Queue (ft) 88 6 125 130 74
Link Distance (ft) 1266 388 388 841
Upstream Blk Time (%)
Queuing Penalty (veh)
Storage Bay Dist (ft) 285
Storage Blk Time (%)
Queuing Penalty (veh)
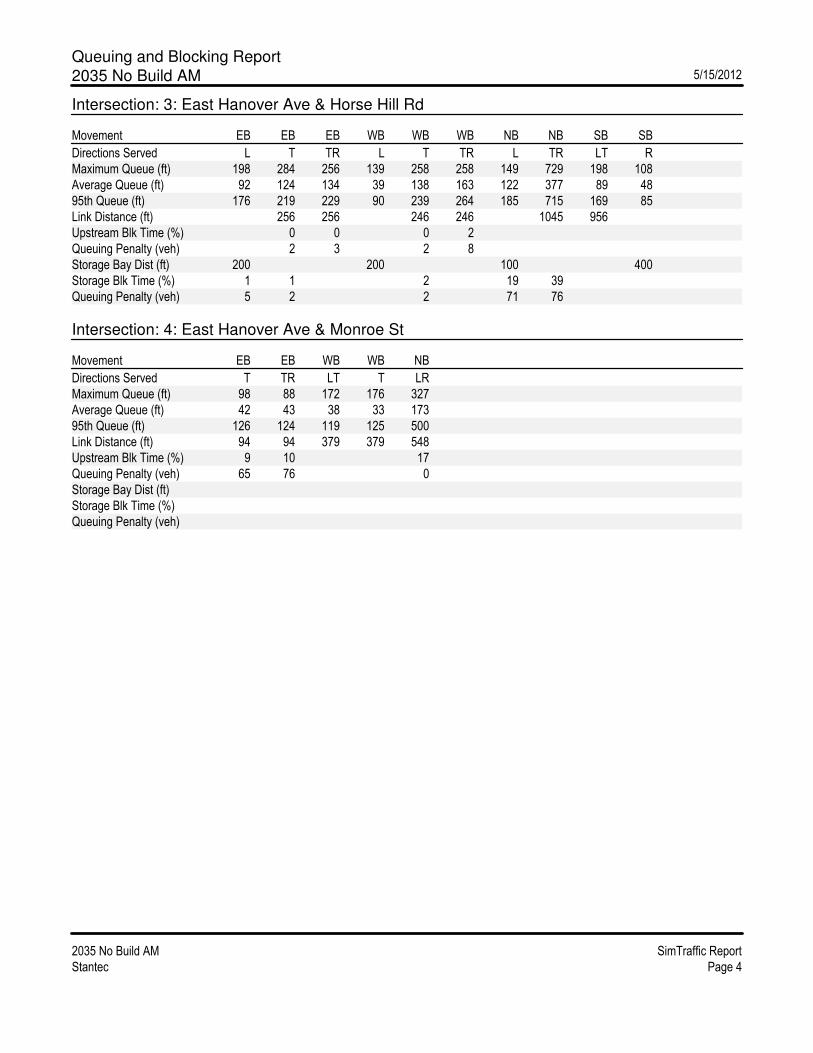
Queuing and Blocking Report
2035 No Build AM 5/15/2012
2035 No Build AM SimTraffic Report
Stantec Page 4
Intersection: 3: East Hanover Ave & Horse Hill Rd
Movement EB EB EB WB WB WB NB NB SB SB
Directions Served L T TR L T TR L TR LT R
Maximum Queue (ft) 198 284 256 139 258 258 149 729 198 108
Average Queue (ft) 92 124 134 39 138 163 122 377 89 48
95th Queue (ft) 176 219 229 90 239 264 185 715 169 85
Link Distance (ft) 256 256 246 246 1045 956
Upstream Blk Time (%) 0 0 0 2
Queuing Penalty (veh) 2 3 2 8
Storage Bay Dist (ft) 200 200 100 400
Storage Blk Time (%) 1 1 2 19 39
Queuing Penalty (veh) 5 2 2 71 76
Intersection: 4: East Hanover Ave & Monroe St
Movement EB EB WB WB NB
Directions Served T TR LT T LR
Maximum Queue (ft) 98 88 172 176 327
Average Queue (ft) 42 43 38 33 173
95th Queue (ft) 126 124 119 125 500
Link Distance (ft) 94 94 379 379 548
Upstream Blk Time (%) 9 10 17
Queuing Penalty (veh) 65 76 0
Storage Bay Dist (ft)
Storage Blk Time (%)
Queuing Penalty (veh)

Queuing and Blocking Report
2035 No Build AM 5/15/2012
2035 No Build AM SimTraffic Report
Stantec Page 5
Intersection: 5: East Hanover Ave & Ridgedale Ave
Movement EB EB WB WB WB B17 B17 NB NB NB B20 B20
Directions Served LT TR LT T R T T L T TR T T
Maximum Queue (ft) 425 446 760 746 280 1542 1556 150 365 356 620 604
Average Queue (ft) 404 408 728 725 98 802 815 149 338 308 538 396
95th Queue (ft) 473 474 762 752 316 1643 1660 149 353 399 744 772
Link Distance (ft) 347 347 659 659 1933 1933 262 262 572 572
Upstream Blk Time (%) 43 47 75 72 83 38 62 5
Queuing Penalty (veh) 352 389 303 290 0 0 0 0
Storage Bay Dist (ft) 230 100
Storage Blk Time (%) 80 81 17
Queuing Penalty (veh) 50 138 66
Intersection: 5: East Hanover Ave & Ridgedale Ave
Movement SB SB SB B19 B19
Directions Served L T R T T
Maximum Queue (ft) 300 595 559 505 467
Average Queue (ft) 170 481 192 220 144
95th Queue (ft) 356 721 565 595 483
Link Distance (ft) 507 507 522 522
Upstream Blk Time (%) 46 4 21 3
Queuing Penalty (veh) 0 0 0 0
Storage Bay Dist (ft) 250
Storage Blk Time (%) 1 64
Queuing Penalty (veh) 2 93
Intersection: 6: East Hanover Ave & Library
Movement EB EB B17 B17 WB WB SB SB
Directions Served LT T T T T TR L R
Maximum Queue (ft) 1827 1815 137 140 74 80 10 30
Average Queue (ft) 802 824 12 11 5 7 1 5
95th Queue (ft) 1926 1948 85 85 34 40 7 23
Link Distance (ft) 1933 1933 659 659 962 962 151 151
Upstream Blk Time (%) 4 3
Queuing Penalty (veh) 31 28
Storage Bay Dist (ft)
Storage Blk Time (%)
Queuing Penalty (veh)
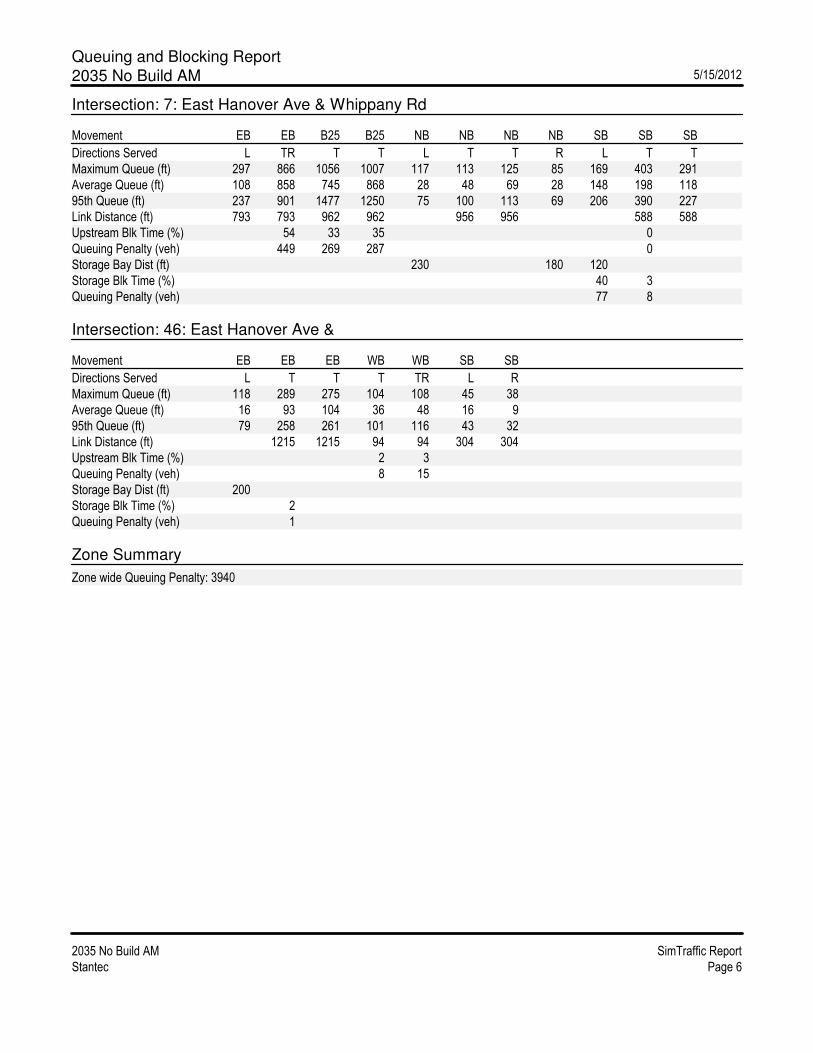
Queuing and Blocking Report
2035 No Build AM 5/15/2012
2035 No Build AM SimTraffic Report
Stantec Page 6
Intersection: 7: East Hanover Ave & Whippany Rd
Movement EB EB B25 B25 NB NB NB NB SB SB SB
Directions Served L TR T T L T T R L T T
Maximum Queue (ft) 297 866 1056 1007 117 113 125 85 169 403 291
Average Queue (ft) 108 858 745 868 28 48 69 28 148 198 118
95th Queue (ft) 237 901 1477 1250 75 100 113 69 206 390 227
Link Distance (ft) 793 793 962 962 956 956 588 588
Upstream Blk Time (%) 54 33 35 0
Queuing Penalty (veh) 449 269 287 0
Storage Bay Dist (ft) 230 180 120
Storage Blk Time (%) 40 3
Queuing Penalty (veh) 77 8
Intersection: 46: East Hanover Ave &
Movement EB EB EB WB WB SB SB
Directions Served L T T T TR L R
Maximum Queue (ft) 118 289 275 104 108 45 38
Average Queue (ft) 16 93 104 36 48 16 9
95th Queue (ft) 79 258 261 101 116 43 32
Link Distance (ft) 1215 1215 94 94 304 304
Upstream Blk Time (%) 2 3
Queuing Penalty (veh) 8 15
Storage Bay Dist (ft) 200
Storage Blk Time (%) 2
Queuing Penalty (veh) 1
Zone Summary
Zone wide Queuing Penalty: 3940
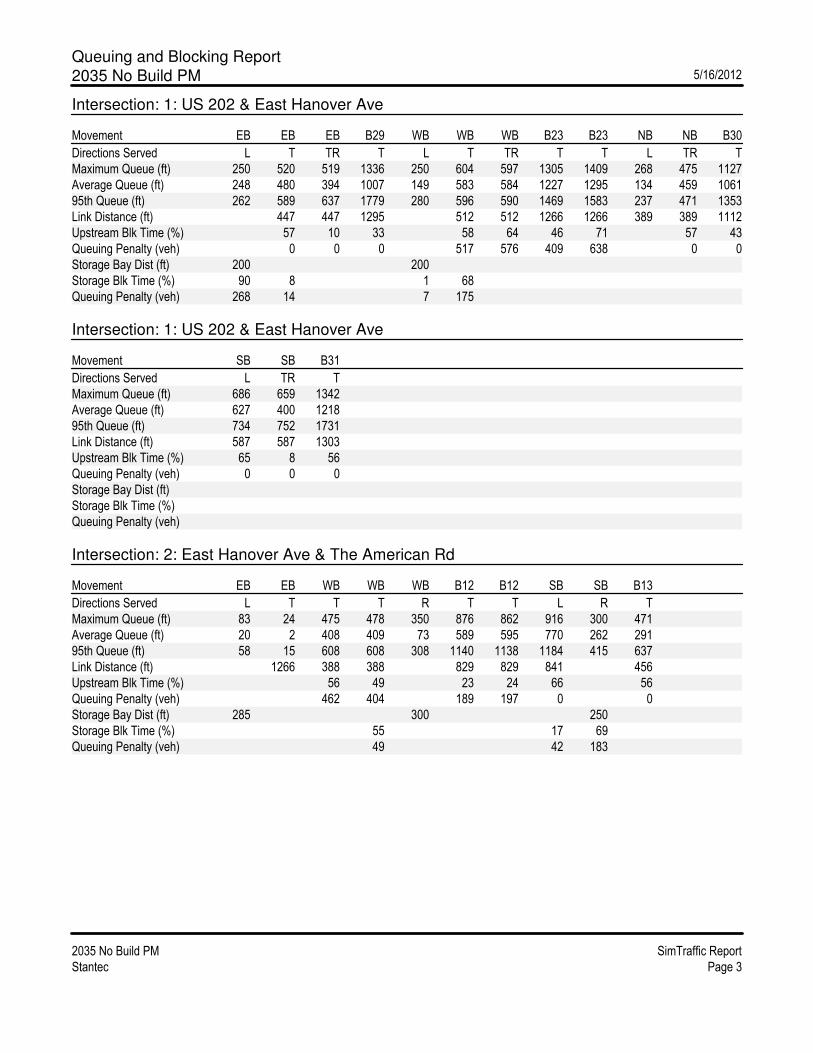
Queuing and Blocking Report
2035 No Build PM 5/16/2012
2035 No Build PM SimTraffic Report
Stantec Page 3
Intersection: 1: US 202 & East Hanover Ave
Movement EB EB EB B29 WB WB WB B23 B23 NB NB B30
Directions Served L T TR T L T TR T T L TR T
Maximum Queue (ft) 250 520 519 1336 250 604 597 1305 1409 268 475 1127
Average Queue (ft) 248 480 394 1007 149 583 584 1227 1295 134 459 1061
95th Queue (ft) 262 589 637 1779 280 596 590 1469 1583 237 471 1353
Link Distance (ft) 447 447 1295 512 512 1266 1266 389 389 1112
Upstream Blk Time (%) 57 10 33 58 64 46 71 57 43
Queuing Penalty (veh) 0 0 0 517 576 409 638 0 0
Storage Bay Dist (ft) 200 200
Storage Blk Time (%) 90 8 1 68
Queuing Penalty (veh) 268 14 7 175
Intersection: 1: US 202 & East Hanover Ave
Movement SB SB B31
Directions Served L TR T
Maximum Queue (ft) 686 659 1342
Average Queue (ft) 627 400 1218
95th Queue (ft) 734 752 1731
Link Distance (ft) 587 587 1303
Upstream Blk Time (%) 65 8 56
Queuing Penalty (veh) 0 0 0
Storage Bay Dist (ft)
Storage Blk Time (%)
Queuing Penalty (veh)
Intersection: 2: East Hanover Ave & The American Rd
Movement EB EB WB WB WB B12 B12 SB SB B13
Directions Served L T T T R T T L R T
Maximum Queue (ft) 83 24 475 478 350 876 862 916 300 471
Average Queue (ft) 20 2 408 409 73 589 595 770 262 291
95th Queue (ft) 58 15 608 608 308 1140 1138 1184 415 637
Link Distance (ft) 1266 388 388 829 829 841 456
Upstream Blk Time (%) 56 49 23 24 66 56
Queuing Penalty (veh) 462 404 189 197 0 0
Storage Bay Dist (ft) 285 300 250
Storage Blk Time (%) 55 17 69
Queuing Penalty (veh) 49 42 183
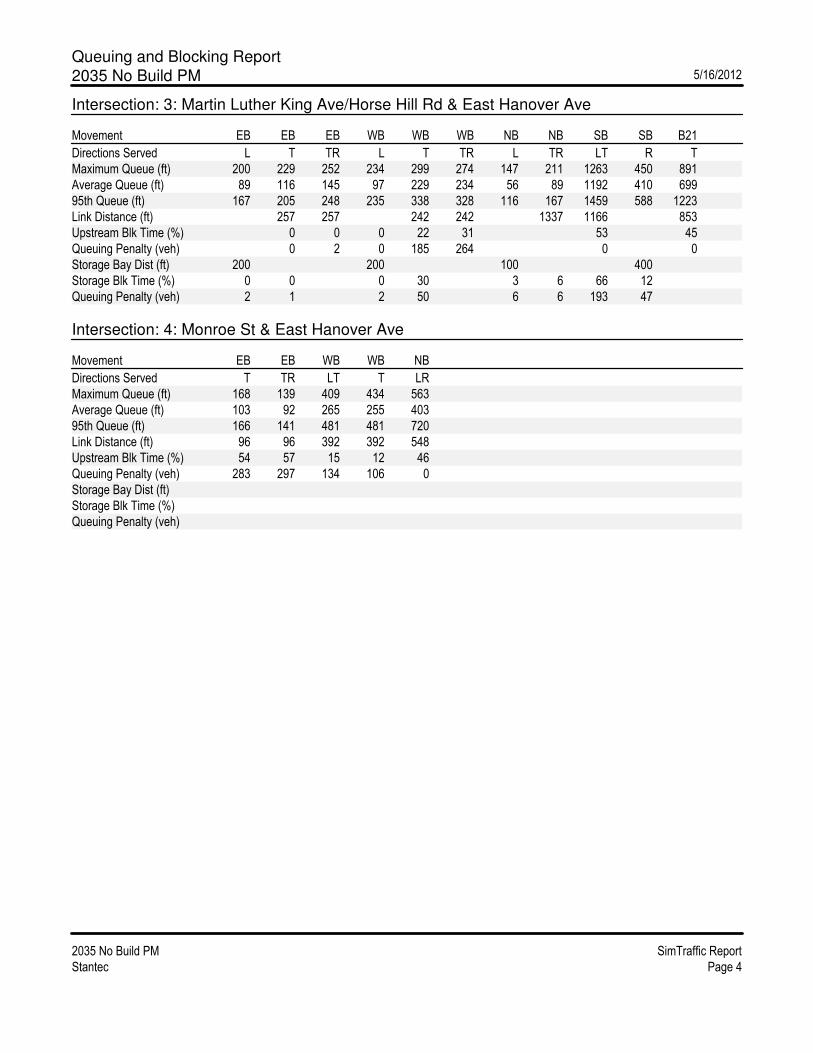
Queuing and Blocking Report
2035 No Build PM 5/16/2012
2035 No Build PM SimTraffic Report
Stantec Page 4
Intersection: 3: Martin Luther King Ave/Horse Hill Rd & East Hanover Ave
Movement EB EB EB WB WB WB NB NB SB SB B21
Directions Served L T TR L T TR L TR LT R T
Maximum Queue (ft) 200 229 252 234 299 274 147 211 1263 450 891
Average Queue (ft) 89 116 145 97 229 234 56 89 1192 410 699
95th Queue (ft) 167 205 248 235 338 328 116 167 1459 588 1223
Link Distance (ft) 257 257 242 242 1337 1166 853
Upstream Blk Time (%) 0 0 0 22 31 53 45
Queuing Penalty (veh) 0 2 0 185 264 0 0
Storage Bay Dist (ft) 200 200 100 400
Storage Blk Time (%) 0 0 0 30 3 6 66 12
Queuing Penalty (veh) 2 1 2 50 6 6 193 47
Intersection: 4: Monroe St & East Hanover Ave
Movement EB EB WB WB NB
Directions Served T TR LT T LR
Maximum Queue (ft) 168 139 409 434 563
Average Queue (ft) 103 92 265 255 403
95th Queue (ft) 166 141 481 481 720
Link Distance (ft) 96 96 392 392 548
Upstream Blk Time (%) 54 57 15 12 46
Queuing Penalty (veh) 283 297 134 106 0
Storage Bay Dist (ft)
Storage Blk Time (%)
Queuing Penalty (veh)

Queuing and Blocking Report
2035 No Build PM 5/16/2012
2035 No Build PM SimTraffic Report
Stantec Page 5
Intersection: 5: Ridgedale Ave & East Hanover Ave
Movement EB EB WB WB WB B17 B17 NB NB NB B20 B20
Directions Served LT TR LT T R T T L T TR T T
Maximum Queue (ft) 417 432 754 749 280 1960 1968 150 366 347 614 595
Average Queue (ft) 407 407 730 729 68 1773 1778 149 335 301 571 446
95th Queue (ft) 413 425 740 738 265 2371 2374 151 351 421 679 810
Link Distance (ft) 335 335 659 659 1933 1933 262 262 572 572
Upstream Blk Time (%) 62 70 66 63 28 29 85 50 69 12
Queuing Penalty (veh) 348 392 518 491 217 227 0 0 0 0
Storage Bay Dist (ft) 230 100
Storage Blk Time (%) 66 83 27
Queuing Penalty (veh) 86 191 96
Intersection: 5: Ridgedale Ave & East Hanover Ave
Movement SB SB SB B19 B19
Directions Served L T R T T
Maximum Queue (ft) 300 576 575 674 686
Average Queue (ft) 204 568 323 653 609
95th Queue (ft) 374 575 682 713 798
Link Distance (ft) 496 496 645 645
Upstream Blk Time (%) 76 7 75 18
Queuing Penalty (veh) 0 0 0 0
Storage Bay Dist (ft) 250
Storage Blk Time (%) 1 81
Queuing Penalty (veh) 4 177
Intersection: 6: East Hanover Ave & Library
Movement EB EB WB WB B25 B25 SB SB
Directions Served LT T T TR T T L R
Maximum Queue (ft) 1016 1023 1059 1042 848 1018 74 140
Average Queue (ft) 539 556 749 761 405 557 29 51
95th Queue (ft) 1089 1088 1398 1389 979 1352 59 106
Link Distance (ft) 1933 1933 962 962 793 793 151 151
Upstream Blk Time (%) 41 43 5 24 2
Queuing Penalty (veh) 310 323 40 185 0
Storage Bay Dist (ft)
Storage Blk Time (%)
Queuing Penalty (veh)

Queuing and Blocking Report
2035 No Build PM 5/16/2012
2035 No Build PM SimTraffic Report
Stantec Page 6
Intersection: 7: Whippany Rd & East Hanover Ave
Movement EB EB NB NB NB NB SB SB SB SB B28 B28
Directions Served L TR L T T R L T T R T T
Maximum Queue (ft) 652 690 279 369 129 67 169 366 226 676 385 427
Average Queue (ft) 240 407 183 77 68 17 113 97 76 338 40 200
95th Queue (ft) 545 616 291 235 124 50 205 265 162 884 236 537
Link Distance (ft) 793 793 953 953 588 588 588 396 396
Upstream Blk Time (%) 0 27 1 27
Queuing Penalty (veh) 0 0 0 0
Storage Bay Dist (ft) 230 180 120
Storage Blk Time (%) 8 17 1
Queuing Penalty (veh) 12 30 3
Intersection: 44: East Hanover Ave & Remediated Driveway
Movement EB EB WB WB B36 B36 SB
Directions Served LT T T TR T T LR
Maximum Queue (ft) 309 285 886 931 157 151 290
Average Queue (ft) 101 48 304 318 62 62 268
95th Queue (ft) 226 180 989 1002 311 310 287
Link Distance (ft) 829 829 1000 1000 432 432 259
Upstream Blk Time (%) 8 9 4 4 98
Queuing Penalty (veh) 75 82 37 40 0
Storage Bay Dist (ft)
Storage Blk Time (%)
Queuing Penalty (veh)
Intersection: 46: East Hanover Ave &
Movement EB EB EB WB WB SB SB
Directions Served L T T T TR L R
Maximum Queue (ft) 249 1098 1103 126 126 102 54
Average Queue (ft) 28 619 628 57 73 39 23
95th Queue (ft) 121 1247 1258 127 138 92 50
Link Distance (ft) 1221 1221 96 96 268 268
Upstream Blk Time (%) 6 6 4 6
Queuing Penalty (veh) 30 33 35 53
Storage Bay Dist (ft) 200
Storage Blk Time (%) 57
Queuing Penalty (veh) 18
Zone Summary
Zone wide Queuing Penalty: 9761
2035 ALTERNATIVE 1
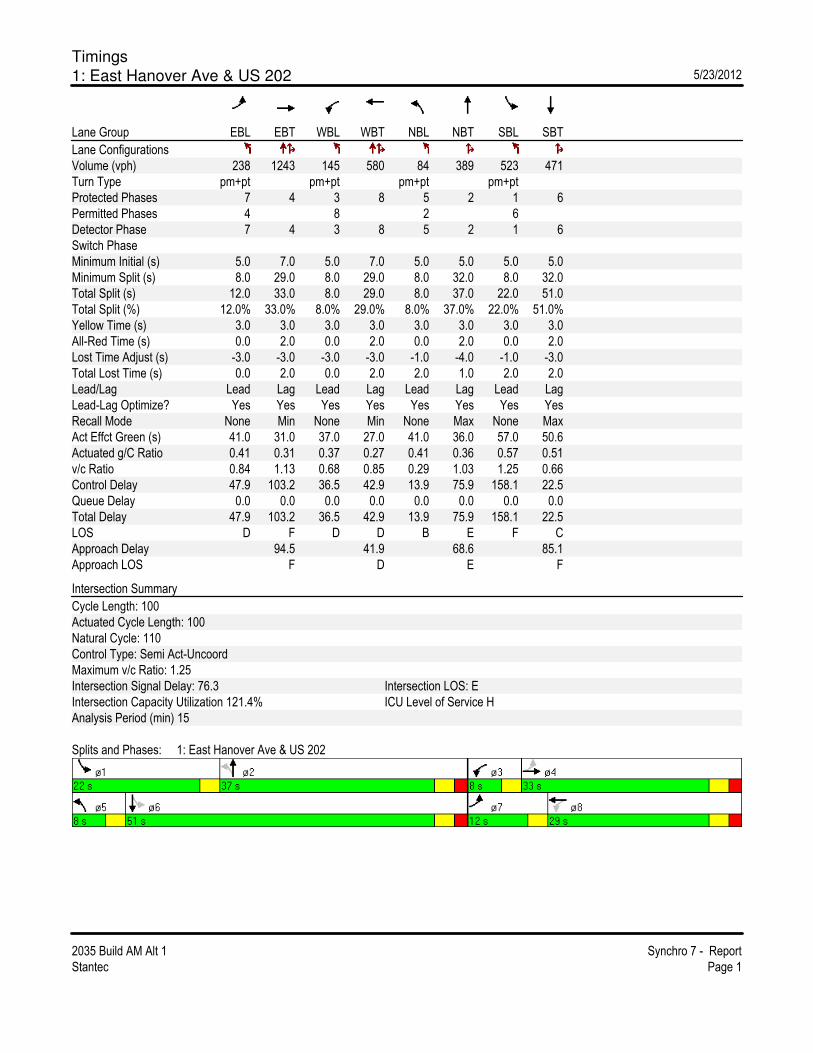
Timings
1: East Hanover Ave & US 202 5/23/2012
2035 Build AM Alt 1 Synchro 7 - Report
Stantec Page 1
Lane Group EBL EBT WBL WBT NBL NBT SBL SBT
Lane Configurations
Volume (vph) 238 1243 145 580 84 389 523 471
Turn Type pm+pt pm+pt pm+pt pm+pt
Protected Phases 7 4 3 8 5 2 1 6
Permitted Phases 4 8 2 6
Detector Phase 7 4 3 8 5 2 1 6
Switch Phase
Minimum Initial (s) 5.0 7.0 5.0 7.0 5.0 5.0 5.0 5.0
Minimum Split (s) 8.0 29.0 8.0 29.0 8.0 32.0 8.0 32.0
Total Split (s) 12.0 33.0 8.0 29.0 8.0 37.0 22.0 51.0
Total Split (%) 12.0% 33.0% 8.0% 29.0% 8.0% 37.0% 22.0% 51.0%
Yellow Time (s) 3.0 3.0 3.0 3.0 3.0 3.0 3.0 3.0
All-Red Time (s) 0.0 2.0 0.0 2.0 0.0 2.0 0.0 2.0
Lost Time Adjust (s) -3.0 -3.0 -3.0 -3.0 -1.0 -4.0 -1.0 -3.0
Total Lost Time (s) 0.0 2.0 0.0 2.0 2.0 1.0 2.0 2.0
Lead/Lag Lead Lag Lead Lag Lead Lag Lead Lag
Lead-Lag Optimize? Yes Yes Yes Yes Yes Yes Yes Yes
Recall Mode None Min None Min None Max None Max
Act Effct Green (s) 41.0 31.0 37.0 27.0 41.0 36.0 57.0 50.6
Actuated g/C Ratio 0.41 0.31 0.37 0.27 0.41 0.36 0.57 0.51
v/c Ratio 0.84 1.13 0.68 0.85 0.29 1.03 1.25 0.66
Control Delay 47.9 103.2 36.5 42.9 13.9 75.9 158.1 22.5
Queue Delay 0.0 0.0 0.0 0.0 0.0 0.0 0.0 0.0
Total Delay 47.9 103.2 36.5 42.9 13.9 75.9 158.1 22.5
LOS D F D D B E F C
Approach Delay 94.5 41.9 68.6 85.1
Approach LOS F D E F
Intersection Summary
Cycle Length: 100
Actuated Cycle Length: 100
Natural Cycle: 110
Control Type: Semi Act-Uncoord
Maximum v/c Ratio: 1.25
Intersection Signal Delay: 76.3 Intersection LOS: E
Intersection Capacity Utilization 121.4% ICU Level of Service H
Analysis Period (min) 15
Splits and Phases: 1: East Hanover Ave & US 202
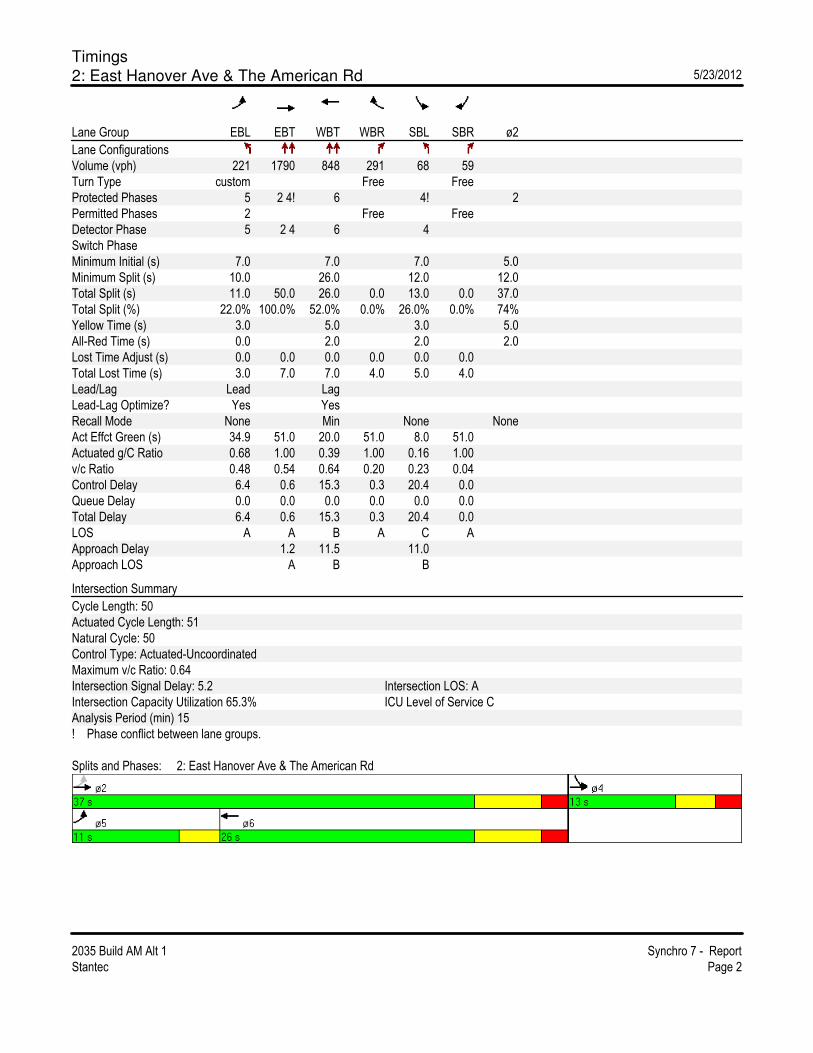
Timings
2: East Hanover Ave & The American Rd 5/23/2012
2035 Build AM Alt 1 Synchro 7 - Report
Stantec Page 2
Lane Group EBL EBT WBT WBR SBL SBR ø2
Lane Configurations
Volume (vph) 221 1790 848 291 68 59
Turn Type custom Free Free
Protected Phases 5 2 4! 6 4! 2
Permitted Phases 2 Free Free
Detector Phase 5 2 4 6 4
Switch Phase
Minimum Initial (s) 7.0 7.0 7.0 5.0
Minimum Split (s) 10.0 26.0 12.0 12.0
Total Split (s) 11.0 50.0 26.0 0.0 13.0 0.0 37.0
Total Split (%) 22.0% 100.0% 52.0% 0.0% 26.0% 0.0% 74%
Yellow Time (s) 3.0 5.0 3.0 5.0
All-Red Time (s) 0.0 2.0 2.0 2.0
Lost Time Adjust (s) 0.0 0.0 0.0 0.0 0.0 0.0
Total Lost Time (s) 3.0 7.0 7.0 4.0 5.0 4.0
Lead/Lag Lead Lag
Lead-Lag Optimize? Yes Yes
Recall Mode None Min None None
Act Effct Green (s) 34.9 51.0 20.0 51.0 8.0 51.0
Actuated g/C Ratio 0.68 1.00 0.39 1.00 0.16 1.00
v/c Ratio 0.48 0.54 0.64 0.20 0.23 0.04
Control Delay 6.4 0.6 15.3 0.3 20.4 0.0
Queue Delay 0.0 0.0 0.0 0.0 0.0 0.0
Total Delay 6.4 0.6 15.3 0.3 20.4 0.0
LOS A A B A C A
Approach Delay 1.2 11.5 11.0
Approach LOS A B B
Intersection Summary
Cycle Length: 50
Actuated Cycle Length: 51
Natural Cycle: 50
Control Type: Actuated-Uncoordinated
Maximum v/c Ratio: 0.64
Intersection Signal Delay: 5.2 Intersection LOS: A
Intersection Capacity Utilization 65.3% ICU Level of Service C
Analysis Period (min) 15
! Phase conflict between lane groups.
Splits and Phases: 2: East Hanover Ave & The American Rd

Timings
3: East Hanover Ave & Horse Hill Rd 5/23/2012
2035 Build AM Alt 1 Synchro 7 - Report
Stantec Page 3
Lane Group EBL EBT WBL WBT NBL NBT SBL SBT SBR
Lane Configurations
Volume (vph) 336 1346 81 884 194 241 66 79 199
Turn Type pm+pt pm+pt pm+pt Perm Perm
Protected Phases 5 2 1 6 3 8 4
Permitted Phases 2 6 8 4 4
Detector Phase 5 2 1 6 3 8 4 4 4
Switch Phase
Minimum Initial (s) 7.0 7.0 7.0 7.0 5.0 7.0 7.0 7.0 7.0
Minimum Split (s) 10.0 32.0 10.0 32.0 10.0 27.0 27.0 27.0 27.0
Total Split (s) 17.0 43.0 10.0 36.0 10.0 37.0 27.0 27.0 27.0
Total Split (%) 18.9% 47.8% 11.1% 40.0% 11.1% 41.1% 30.0% 30.0% 30.0%
Yellow Time (s) 3.0 4.0 3.0 4.0 3.0 3.0 3.0 3.0 3.0
All-Red Time (s) 0.0 2.0 0.0 2.0 0.0 2.0 2.0 2.0 2.0
Lost Time Adjust (s) -2.0 -2.0 -2.0 -2.0 -2.0 -2.0 -2.0 -2.0 0.0
Total Lost Time (s) 1.0 4.0 1.0 4.0 1.0 3.0 3.0 3.0 5.0
Lead/Lag Lead Lag Lead Lag Lead Lag Lag Lag
Lead-Lag Optimize? Yes Yes Yes Yes Yes Yes Yes Yes
Recall Mode None C-Min None C-Min None None None None None
Act Effct Green (s) 58.4 47.2 49.0 36.8 29.6 27.6 17.6 15.6
Actuated g/C Ratio 0.65 0.52 0.54 0.41 0.33 0.31 0.20 0.17
v/c Ratio 0.76 0.85 0.31 0.69 0.55 0.70 0.70 0.47
Control Delay 27.5 26.6 19.4 21.2 27.9 31.4 50.2 8.1
Queue Delay 0.0 0.0 0.0 0.0 0.0 0.0 0.0 0.0
Total Delay 27.5 26.6 19.4 21.2 27.9 31.4 50.2 8.1
LOS C C B C C C D A
Approach Delay 26.7 21.0 30.2 25.8
Approach LOS C C C C
Intersection Summary
Cycle Length: 90
Actuated Cycle Length: 90
Offset: 61 (68%), Referenced to phase 2:EBTL and 6:WBTL, Start of Yellow
Natural Cycle: 90
Control Type: Actuated-Coordinated
Maximum v/c Ratio: 0.85
Intersection Signal Delay: 25.6 Intersection LOS: C
Intersection Capacity Utilization 89.5% ICU Level of Service E
Analysis Period (min) 15
Splits and Phases: 3: East Hanover Ave & Horse Hill Rd

HCM Unsignalized Intersection Capacity Analysis
4: East Hanover Ave & Monroe St 5/23/2012
2035 Build AM Alt 1 Synchro 7 - Report
Stantec Page 4
Movement EBT EBR WBL WBT NBL NBR
Lane Configurations
Volume (veh/h) 1518 4 28 1025 3 126
Sign Control Free Free Stop
Grade 0% 0% 0%
Peak Hour Factor 0.95 0.95 0.95 0.95 0.95 0.95
Hourly flow rate (vph) 1598 4 29 1079 3 133
Pedestrians 1
Lane Width (ft) 12.0
Walking Speed (ft/s) 4.0
Percent Blockage 0
Right turn flare (veh)
Median type None None
Median storage veh)
Upstream signal (ft) 147 847
pX, platoon unblocked 0.86 0.91 0.86
vC, conflicting volume 1602 2198 802
vC1, stage 1 conf vol
vC2, stage 2 conf vol
vCu, unblocked vol 1371 1411 438
tC, single (s) 4.1 6.8 6.9
tC, 2 stage (s)
tF (s) 2.2 3.5 3.3
p0 queue free % 93 97 73
cM capacity (veh/h) 426 111 485
Direction, Lane # EB 1 EB 2 WB 1 WB 2 NB 1
Volume Total 1065 537 389 719 136
Volume Left 0 0 29 0 3
Volume Right 0 4 0 0 133
cSH 1700 1700 426 1700 450
Volume to Capacity 0.63 0.32 0.07 0.42 0.30
Queue Length 95th (ft) 0 0 6 0 31
Control Delay (s) 0.0 0.0 2.2 0.0 16.4
Lane LOS A C
Approach Delay (s) 0.0 0.8 16.4
Approach LOS C
Intersection Summary
Average Delay 1.1
Intersection Capacity Utilization 63.4% ICU Level of Service B
Analysis Period (min) 15

Timings
5: East Hanover Ave & Ridgedale Ave 5/23/2012
2035 Build AM Alt 1 Synchro 7 - Report
Stantec Page 5
Lane Group EBT WBT WBR NBL NBT SBL SBT SBR
Lane Configurations
Volume (vph) 1349 608 63 379 341 145 255 87
Turn Type Free pm+pt pm+pt Perm
Protected Phases 2 6 3 8 7 4
Permitted Phases Free 8 4 4
Detector Phase 2 6 3 8 7 4 4
Switch Phase
Minimum Initial (s) 7.0 7.0 5.0 7.0 5.0 7.0 7.0
Minimum Split (s) 13.0 13.0 8.0 31.0 8.0 20.0 20.0
Total Split (s) 30.0 21.0 0.0 19.0 31.0 8.0 20.0 20.0
Total Split (%) 33.3% 23.3% 0.0% 21.1% 34.4% 8.9% 22.2% 22.2%
Yellow Time (s) 4.0 4.0 3.0 4.0 3.0 4.0 4.0
All-Red Time (s) 2.0 2.0 0.0 2.0 0.0 2.0 2.0
Lost Time Adjust (s) -3.0 -3.0 0.0 -2.0 -3.0 -2.0 -3.0 -3.0
Total Lost Time (s) 3.0 3.0 4.0 1.0 3.0 1.0 3.0 3.0
Lead/Lag Lead Lag Lead Lag Lag
Lead-Lag Optimize? Yes Yes Yes Yes Yes
Recall Mode C-Max Max None Min None Min Min
Act Effct Green (s) 27.4 18.0 90.0 37.6 27.6 25.6 16.6 16.6
Actuated g/C Ratio 0.30 0.20 1.00 0.42 0.31 0.28 0.18 0.18
v/c Ratio 1.72 1.09 0.04 0.98 0.53 0.51 0.81 0.26
Control Delay 350.7 96.7 0.0 62.7 22.1 24.8 55.3 9.1
Queue Delay 0.0 0.0 0.0 0.0 0.0 0.0 0.0 0.0
Total Delay 350.7 96.7 0.0 62.7 22.1 24.8 55.3 9.1
LOS F F A E C C E A
Approach Delay 350.7 89.1 39.1 37.9
Approach LOS F F D D
Intersection Summary
Cycle Length: 90
Actuated Cycle Length: 90
Offset: 0 (0%), Referenced to phase 2:EBTL, Start of Yellow, Master Intersection
Natural Cycle: 130
Control Type: Actuated-Coordinated
Maximum v/c Ratio: 1.72
Intersection Signal Delay: 185.9 Intersection LOS: F
Intersection Capacity Utilization 116.8% ICU Level of Service H
Analysis Period (min) 15
Splits and Phases: 5: East Hanover Ave & Ridgedale Ave

Timings
6: East Hanover Ave & Library 5/23/2012
2035 Build AM Alt 1 Synchro 7 - Report
Stantec Page 6
Lane Group EBL EBT WBT SBL SBR
Lane Configurations
Volume (vph) 19 1651 805 1 6
Turn Type Perm Perm
Protected Phases 2 6 4
Permitted Phases 2 4
Detector Phase 2 2 6 4 4
Switch Phase
Minimum Initial (s) 7.0 7.0 7.0 7.0 7.0
Minimum Split (s) 29.0 29.0 29.0 28.0 28.0
Total Split (s) 60.0 60.0 60.0 30.0 30.0
Total Split (%) 66.7% 66.7% 66.7% 33.3% 33.3%
Yellow Time (s) 5.0 5.0 5.0 3.0 3.0
All-Red Time (s) 2.0 2.0 2.0 2.0 2.0
Lost Time Adjust (s) 0.0 -2.0 -2.0 -2.0 -2.0
Total Lost Time (s) 7.0 5.0 5.0 3.0 3.0
Lead/Lag
Lead-Lag Optimize?
Recall Mode C-Max C-Max C-Max None None
Act Effct Green (s) 86.6 86.6 9.0 9.0
Actuated g/C Ratio 0.96 0.96 0.10 0.10
v/c Ratio 0.53 0.24 0.01 0.04
Control Delay 4.5 0.7 37.0 22.8
Queue Delay 0.0 0.0 0.0 0.0
Total Delay 4.5 0.7 37.0 22.8
LOS A A D C
Approach Delay 4.5 0.7 24.9
Approach LOS A A C
Intersection Summary
Cycle Length: 90
Actuated Cycle Length: 90
Offset: 83 (92%), Referenced to phase 2:EBTL and 6:WBT, Start of Yellow
Natural Cycle: 70
Control Type: Actuated-Coordinated
Maximum v/c Ratio: 0.53
Intersection Signal Delay: 3.3 Intersection LOS: A
Intersection Capacity Utilization 72.4% ICU Level of Service C
Analysis Period (min) 15
Splits and Phases: 6: East Hanover Ave & Library

Timings
7: East Hanover Ave & Whippany Rd 5/23/2012
2035 Build AM Alt 1 Synchro 7 - Report
Stantec Page 7
Lane Group EBL EBT NBL NBT NBR SBL SBT SBR
Lane Configurations
Volume (vph) 529 971 68 261 32 243 381 764
Turn Type Prot pm+pt Perm pm+pt Free
Protected Phases 7 4 5 2 1 6
Permitted Phases 2 2 6 Free
Detector Phase 7 4 5 2 2 1 6
Switch Phase
Minimum Initial (s) 7.0 7.0 5.0 7.0 7.0 5.0 7.0
Minimum Split (s) 23.0 13.0 9.0 13.0 13.0 9.0 20.0
Total Split (s) 53.0 53.0 9.0 23.0 23.0 14.0 28.0 0.0
Total Split (%) 58.9% 58.9% 10.0% 25.6% 25.6% 15.6% 31.1% 0.0%
Yellow Time (s) 4.0 4.0 4.0 4.0 4.0 4.0 4.0
All-Red Time (s) 2.0 2.0 0.0 2.0 2.0 0.0 2.0
Lost Time Adjust (s) -2.0 0.0 -2.0 -2.0 -2.0 -2.0 -2.0 -2.0
Total Lost Time (s) 4.0 6.0 2.0 4.0 4.0 2.0 4.0 2.0
Lead/Lag Lead Lag Lag Lead Lag
Lead-Lag Optimize? Yes Yes Yes Yes Yes
Recall Mode None C-Max None Max Max None Min
Act Effct Green (s) 49.0 47.0 28.1 19.1 19.1 35.0 25.8 90.0
Actuated g/C Ratio 0.54 0.52 0.31 0.21 0.21 0.39 0.29 1.00
v/c Ratio 0.58 1.22 0.20 0.37 0.10 0.54 0.39 0.50
Control Delay 9.6 124.6 19.3 32.1 29.7 24.6 27.9 1.1
Queue Delay 0.0 0.0 0.0 0.0 0.0 0.0 0.0 0.0
Total Delay 9.6 124.6 19.3 32.1 29.7 24.6 27.9 1.1
LOS A F B C C C C A
Approach Delay 87.8 29.5 12.6
Approach LOS F C B
Intersection Summary
Cycle Length: 90
Actuated Cycle Length: 90
Offset: 78 (87%), Referenced to phase 4:EBT, Start of Yellow
Natural Cycle: 90
Control Type: Actuated-Coordinated
Maximum v/c Ratio: 1.22
Intersection Signal Delay: 50.9 Intersection LOS: D
Intersection Capacity Utilization 92.7% ICU Level of Service F
Analysis Period (min) 15
Splits and Phases: 7: East Hanover Ave & Whippany Rd

Timings
46: East Hanover Ave & Big Box Driveway 5/23/2012
2035 Build AM Alt 1 Synchro 7 - Report
Stantec Page 8
Lane Group EBL EBT WBT SBL SBR
Lane Configurations
Volume (vph) 31 1507 1015 15 9
Turn Type pm+pt Perm
Protected Phases 7 4 8 6
Permitted Phases 4 6
Detector Phase 7 4 8 6 6
Switch Phase
Minimum Initial (s) 7.0 10.0 10.0 10.0 10.0
Minimum Split (s) 10.0 22.0 22.0 26.0 26.0
Total Split (s) 10.0 64.0 54.0 26.0 26.0
Total Split (%) 11.1% 71.1% 60.0% 28.9% 28.9%
Yellow Time (s) 3.0 4.0 4.0 4.0 4.0
All-Red Time (s) 0.0 2.0 2.0 2.0 2.0
Lost Time Adjust (s) -2.0 -2.0 -2.0 -2.0 -2.0
Total Lost Time (s) 1.0 4.0 4.0 4.0 4.0
Lead/Lag Lead Lag
Lead-Lag Optimize? Yes Yes
Recall Mode None C-Max C-Max None None
Act Effct Green (s) 82.6 82.0 75.2 12.0 12.0
Actuated g/C Ratio 0.92 0.91 0.84 0.13 0.13
v/c Ratio 0.06 0.51 0.38 0.07 0.05
Control Delay 1.5 3.1 0.6 35.0 19.0
Queue Delay 0.0 0.0 0.0 0.0 0.0
Total Delay 1.5 3.1 0.6 35.0 19.0
LOS A A A C B
Approach Delay 3.1 0.6 28.8
Approach LOS A A C
Intersection Summary
Cycle Length: 90
Actuated Cycle Length: 90
Offset: 77 (86%), Referenced to phase 4:EBTL and 8:WBT, Start of Yellow
Natural Cycle: 60
Control Type: Actuated-Coordinated
Maximum v/c Ratio: 0.51
Intersection Signal Delay: 2.3 Intersection LOS: A
Intersection Capacity Utilization 56.7% ICU Level of Service B
Analysis Period (min) 15
Splits and Phases: 46: East Hanover Ave & Big Box Driveway

Timings
1: East Hanover Ave & US 202 5/23/2012
2035 Build PM Alt 1 Synchro 7 - Report
Stantec Page 1
Lane Group EBL EBT WBL WBT NBL NBT SBL SBT
Lane Configurations
Volume (vph) 171 595 258 1230 210 544 319 391
Turn Type pm+pt pm+pt pm+pt pm+pt
Protected Phases 7 4 3 8 5 2 1 6
Permitted Phases 4 8 2 6
Detector Phase 7 4 3 8 5 2 1 6
Switch Phase
Minimum Initial (s) 5.0 7.0 5.0 7.0 5.0 5.0 5.0 5.0
Minimum Split (s) 8.0 29.0 8.0 29.0 8.0 32.0 8.0 32.0
Total Split (s) 8.0 29.0 19.0 40.0 8.0 41.0 11.0 44.0
Total Split (%) 8.0% 29.0% 19.0% 40.0% 8.0% 41.0% 11.0% 44.0%
Yellow Time (s) 3.0 3.0 3.0 3.0 3.0 3.0 3.0 3.0
All-Red Time (s) 0.0 2.0 0.0 2.0 0.0 2.0 0.0 2.0
Lost Time Adjust (s) -3.0 -3.0 -3.0 -3.0 -1.0 -4.0 -1.0 -3.0
Total Lost Time (s) 0.0 2.0 0.0 2.0 2.0 1.0 2.0 2.0
Lead/Lag Lead Lag Lead Lag Lead Lag Lead Lag
Lead-Lag Optimize? Yes Yes Yes Yes Yes Yes Yes Yes
Recall Mode None Min None Min None Max None Max
Act Effct Green (s) 39.0 29.0 48.0 38.0 45.0 40.0 50.0 42.0
Actuated g/C Ratio 0.39 0.29 0.48 0.38 0.45 0.40 0.50 0.42
v/c Ratio 0.82 0.66 0.67 1.24 1.15 0.96 1.42 0.83
Control Delay 50.3 34.6 25.9 141.9 133.4 55.3 236.5 37.5
Queue Delay 0.0 0.0 0.0 0.0 0.0 0.0 0.0 0.0
Total Delay 50.3 34.6 25.9 141.9 133.4 55.3 236.5 37.5
LOS D C C F F E F D
Approach Delay 37.8 125.1 73.9 106.7
Approach LOS D F E F
Intersection Summary
Cycle Length: 100
Actuated Cycle Length: 100
Natural Cycle: 100
Control Type: Semi Act-Uncoord
Maximum v/c Ratio: 1.42
Intersection Signal Delay: 94.5 Intersection LOS: F
Intersection Capacity Utilization 120.8% ICU Level of Service H
Analysis Period (min) 15
Splits and Phases: 1: East Hanover Ave & US 202

Timings
2: East Hanover Ave & The American Rd 5/23/2012
2035 Build PM Alt 1 Synchro 7 - Report
Stantec Page 2
Lane Group EBL EBT WBT WBR SBL SBR ø2
Lane Configurations
Volume (vph) 92 954 1549 89 265 243
Turn Type custom Free Free
Protected Phases 5 2 4! 6 4! 2
Permitted Phases 2 Free Free
Detector Phase 5 2 4 6 4
Switch Phase
Minimum Initial (s) 7.0 7.0 7.0 5.0
Minimum Split (s) 10.0 26.0 12.0 12.0
Total Split (s) 10.0 60.0 33.0 0.0 17.0 0.0 43.0
Total Split (%) 16.7% 100.0% 55.0% 0.0% 28.3% 0.0% 72%
Yellow Time (s) 3.0 5.0 3.0 5.0
All-Red Time (s) 0.0 2.0 2.0 2.0
Lost Time Adjust (s) 0.0 0.0 0.0 0.0 0.0 0.0
Total Lost Time (s) 3.0 7.0 7.0 4.0 5.0 4.0
Lead/Lag Lead Lag
Lead-Lag Optimize? Yes Yes
Recall Mode None Min None None
Act Effct Green (s) 39.6 59.2 27.7 59.2 11.6 59.2
Actuated g/C Ratio 0.67 1.00 0.47 1.00 0.20 1.00
v/c Ratio 0.29 0.30 1.01 0.06 0.75 0.15
Control Delay 5.8 0.2 43.8 0.1 37.1 0.2
Queue Delay 0.0 0.0 0.0 0.0 0.0 0.0
Total Delay 5.8 0.2 43.8 0.1 37.1 0.2
LOS A A D A D A
Approach Delay 0.7 41.4 19.4
Approach LOS A D B
Intersection Summary
Cycle Length: 60
Actuated Cycle Length: 59.2
Natural Cycle: 70
Control Type: Actuated-Uncoordinated
Maximum v/c Ratio: 1.01
Intersection Signal Delay: 24.6 Intersection LOS: C
Intersection Capacity Utilization 76.7% ICU Level of Service D
Analysis Period (min) 15
! Phase conflict between lane groups.
Splits and Phases: 2: East Hanover Ave & The American Rd

Timings
3: East Hanover Ave & Horse Hill Rd 5/23/2012
2035 Build PM Alt 1 Synchro 7 - Report
Stantec Page 3
Lane Group EBL EBT WBL WBT NBL NBT SBL SBT SBR
Lane Configurations
Volume (vph) 293 824 165 1474 95 138 165 220 291
Turn Type pm+pt pm+pt pm+pt Perm Perm
Protected Phases 5 2 1 6 3 8 4
Permitted Phases 2 6 8 4 4
Detector Phase 5 2 1 6 3 8 4 4 4
Switch Phase
Minimum Initial (s) 7.0 7.0 7.0 7.0 5.0 7.0 7.0 7.0 7.0
Minimum Split (s) 10.0 32.0 10.0 32.0 8.0 27.0 27.0 27.0 27.0
Total Split (s) 16.0 45.0 12.0 41.0 10.0 43.0 33.0 33.0 33.0
Total Split (%) 16.0% 45.0% 12.0% 41.0% 10.0% 43.0% 33.0% 33.0% 33.0%
Yellow Time (s) 3.0 4.0 3.0 4.0 3.0 3.0 3.0 3.0 3.0
All-Red Time (s) 0.0 2.0 0.0 2.0 0.0 2.0 2.0 2.0 2.0
Lost Time Adjust (s) -2.0 -2.0 -2.0 -2.0 -2.0 -2.0 -2.0 -2.0 0.0
Total Lost Time (s) 1.0 4.0 1.0 4.0 1.0 3.0 3.0 3.0 5.0
Lead/Lag Lead Lag Lead Lag Lead Lag Lag Lag
Lead-Lag Optimize? Yes Yes Yes Yes Yes Yes Yes Yes
Recall Mode None C-Min None C-Min None None None None None
Act Effct Green (s) 57.0 42.4 51.6 38.0 41.0 39.0 31.0 29.0
Actuated g/C Ratio 0.57 0.42 0.52 0.38 0.41 0.39 0.31 0.29
v/c Ratio 0.91 0.75 0.61 1.24 0.37 0.33 0.96 0.48
Control Delay 56.0 27.8 31.1 135.7 22.1 19.3 69.7 8.0
Queue Delay 0.0 0.0 0.0 0.0 0.0 0.0 0.0 0.0
Total Delay 56.0 27.8 31.1 135.7 22.1 19.3 69.7 8.0
LOS E C C F C B E A
Approach Delay 34.1 125.5 20.1 43.2
Approach LOS C F C D
Intersection Summary
Cycle Length: 100
Actuated Cycle Length: 100
Offset: 75 (75%), Referenced to phase 2:EBTL and 6:WBTL, Start of Yellow
Natural Cycle: 100
Control Type: Actuated-Coordinated
Maximum v/c Ratio: 1.24
Intersection Signal Delay: 73.5 Intersection LOS: E
Intersection Capacity Utilization 104.9% ICU Level of Service G
Analysis Period (min) 15
Splits and Phases: 3: East Hanover Ave & Horse Hill Rd

HCM Unsignalized Intersection Capacity Analysis
4: East Hanover Ave & Monroe St 5/23/2012
2035 Build PM Alt 1 Synchro 7 - Report
Stantec Page 4
Movement EBT EBR WBL WBT NBL NBR
Lane Configurations
Volume (veh/h) 1046 5 105 1680 5 75
Sign Control Free Free Stop
Grade 0% 0% 0%
Peak Hour Factor 0.96 0.96 0.96 0.96 0.96 0.96
Hourly flow rate (vph) 1090 5 109 1750 5 78
Pedestrians
Lane Width (ft)
Walking Speed (ft/s)
Percent Blockage
Right turn flare (veh)
Median type None None
Median storage veh)
Upstream signal (ft) 167 847
pX, platoon unblocked 0.93 0.77 0.93
vC, conflicting volume 1095 2186 547
vC1, stage 1 conf vol
vC2, stage 2 conf vol
vCu, unblocked vol 942 1508 351
tC, single (s) 4.1 6.8 6.9
tC, 2 stage (s)
tF (s) 2.2 3.5 3.3
p0 queue free % 84 93 87
cM capacity (veh/h) 670 73 597
Direction, Lane # EB 1 EB 2 WB 1 WB 2 NB 1
Volume Total 726 368 693 1167 83
Volume Left 0 0 109 0 5
Volume Right 0 5 0 0 78
cSH 1700 1700 670 1700 413
Volume to Capacity 0.43 0.22 0.16 0.69 0.20
Queue Length 95th (ft) 0 0 15 0 19
Control Delay (s) 0.0 0.0 4.2 0.0 15.9
Lane LOS A C
Approach Delay (s) 0.0 1.6 15.9
Approach LOS C
Intersection Summary
Average Delay 1.4
Intersection Capacity Utilization 93.5% ICU Level of Service F
Analysis Period (min) 15

Timings
5: East Hanover Ave & Ridgedale Ave 5/23/2012
2035 Build PM Alt 1 Synchro 7 - Report
Stantec Page 5
Lane Group EBT WBT WBR NBL NBT SBL SBT SBR
Lane Configurations
Volume (vph) 732 1247 131 353 459 219 355 205
Turn Type Free pm+pt pm+pt Perm
Protected Phases 2 6 3 8 7 4
Permitted Phases Free 8 4 4
Detector Phase 2 6 3 8 7 4 4
Switch Phase
Minimum Initial (s) 7.0 7.0 5.0 7.0 5.0 7.0 7.0
Minimum Split (s) 13.0 13.0 8.0 17.0 8.0 18.0 18.0
Total Split (s) 29.0 32.0 0.0 8.0 31.0 8.0 31.0 31.0
Total Split (%) 29.0% 32.0% 0.0% 8.0% 31.0% 8.0% 31.0% 31.0%
Yellow Time (s) 4.0 4.0 3.0 4.0 3.0 4.0 4.0
All-Red Time (s) 2.0 2.0 0.0 2.0 0.0 2.0 2.0
Lost Time Adjust (s) -2.0 -2.0 0.0 -2.0 -2.0 -2.0 -2.0 -2.0
Total Lost Time (s) 4.0 4.0 4.0 1.0 4.0 1.0 4.0 4.0
Lead/Lag Lead Lag Lead Lag Lag
Lead-Lag Optimize? Yes Yes Yes Yes Yes
Recall Mode C-Max Max None Min None Min Min
Act Effct Green (s) 27.1 28.0 100.0 34.9 24.9 34.9 24.9 24.9
Actuated g/C Ratio 0.27 0.28 1.00 0.35 0.25 0.35 0.25 0.25
v/c Ratio 1.29 1.51 0.08 1.81 0.72 0.99 0.83 0.40
Control Delay 163.1 265.1 0.1 404.0 37.7 84.3 52.4 6.5
Queue Delay 0.0 0.0 0.0 0.0 0.0 0.0 0.0 0.0
Total Delay 163.1 265.1 0.1 404.0 37.7 84.3 52.4 6.5
LOS F F A F D F D A
Approach Delay 163.1 242.8 178.5 49.3
Approach LOS F F F D
Intersection Summary
Cycle Length: 100
Actuated Cycle Length: 100
Offset: 0 (0%), Referenced to phase 2:EBTL, Start of Yellow, Master Intersection
Natural Cycle: 130
Control Type: Actuated-Coordinated
Maximum v/c Ratio: 1.81
Intersection Signal Delay: 174.4 Intersection LOS: F
Intersection Capacity Utilization 123.6% ICU Level of Service H
Analysis Period (min) 15
Splits and Phases: 5: East Hanover Ave & Ridgedale Ave
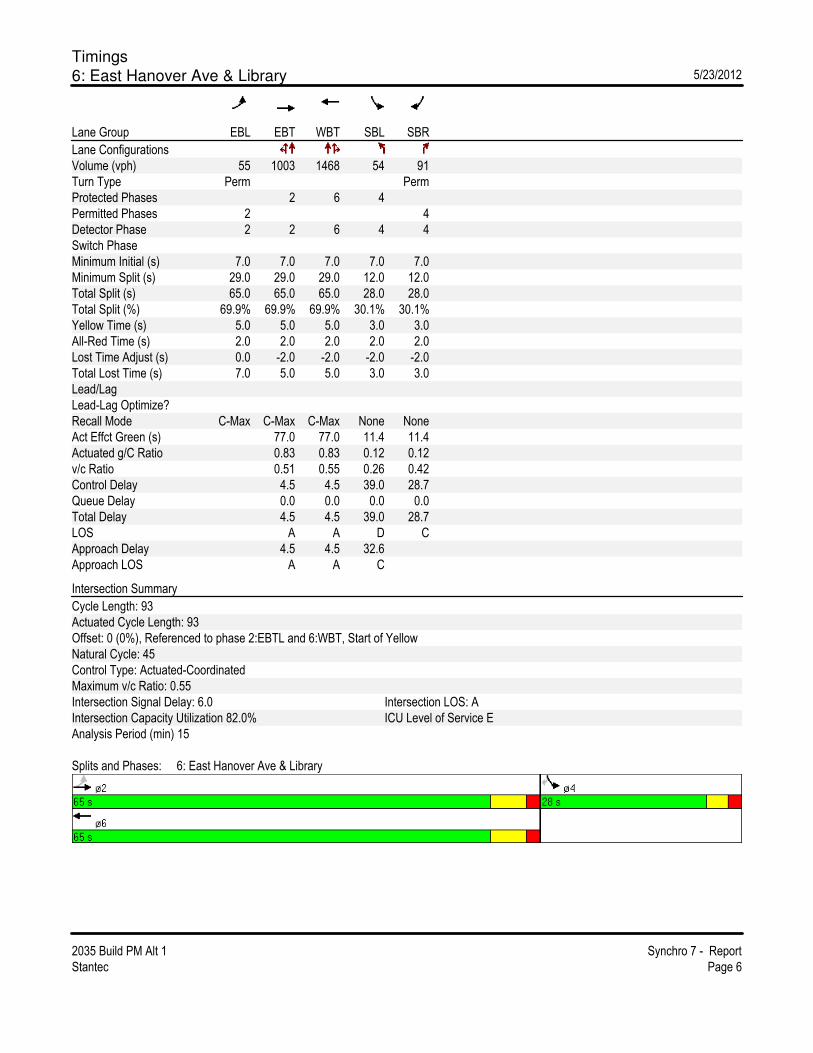
Timings
6: East Hanover Ave & Library 5/23/2012
2035 Build PM Alt 1 Synchro 7 - Report
Stantec Page 6
Lane Group EBL EBT WBT SBL SBR
Lane Configurations
Volume (vph) 55 1003 1468 54 91
Turn Type Perm Perm
Protected Phases 2 6 4
Permitted Phases 2 4
Detector Phase 2 2 6 4 4
Switch Phase
Minimum Initial (s) 7.0 7.0 7.0 7.0 7.0
Minimum Split (s) 29.0 29.0 29.0 12.0 12.0
Total Split (s) 65.0 65.0 65.0 28.0 28.0
Total Split (%) 69.9% 69.9% 69.9% 30.1% 30.1%
Yellow Time (s) 5.0 5.0 5.0 3.0 3.0
All-Red Time (s) 2.0 2.0 2.0 2.0 2.0
Lost Time Adjust (s) 0.0 -2.0 -2.0 -2.0 -2.0
Total Lost Time (s) 7.0 5.0 5.0 3.0 3.0
Lead/Lag
Lead-Lag Optimize?
Recall Mode C-Max C-Max C-Max None None
Act Effct Green (s) 77.0 77.0 11.4 11.4
Actuated g/C Ratio 0.83 0.83 0.12 0.12
v/c Ratio 0.51 0.55 0.26 0.42
Control Delay 4.5 4.5 39.0 28.7
Queue Delay 0.0 0.0 0.0 0.0
Total Delay 4.5 4.5 39.0 28.7
LOS A A D C
Approach Delay 4.5 4.5 32.6
Approach LOS A A C
Intersection Summary
Cycle Length: 93
Actuated Cycle Length: 93
Offset: 0 (0%), Referenced to phase 2:EBTL and 6:WBT, Start of Yellow
Natural Cycle: 45
Control Type: Actuated-Coordinated
Maximum v/c Ratio: 0.55
Intersection Signal Delay: 6.0 Intersection LOS: A
Intersection Capacity Utilization 82.0% ICU Level of Service E
Analysis Period (min) 15
Splits and Phases: 6: East Hanover Ave & Library

Timings
7: East Hanover Ave & Whippany Rd 5/23/2012
2035 Build PM Alt 1 Synchro 7 - Report
Stantec Page 7
Lane Group EBL EBT NBL NBT NBR SBL SBT SBR
Lane Configurations
Volume (vph) 300 540 281 308 36 261 351 1232
Turn Type Prot pm+pt Perm pm+pt Free
Protected Phases 7 4 5 2 1 6
Permitted Phases 2 2 6 Free
Detector Phase 7 4 5 2 2 1 6
Switch Phase
Minimum Initial (s) 7.0 7.0 5.0 7.0 7.0 5.0 7.0
Minimum Split (s) 23.0 13.0 9.0 13.0 13.0 9.0 15.0
Total Split (s) 57.0 57.0 15.0 26.0 26.0 17.0 28.0 0.0
Total Split (%) 57.0% 57.0% 15.0% 26.0% 26.0% 17.0% 28.0% 0.0%
Yellow Time (s) 4.0 4.0 4.0 4.0 4.0 4.0 4.0
All-Red Time (s) 2.0 2.0 0.0 2.0 2.0 0.0 2.0
Lost Time Adjust (s) -2.0 0.0 -2.0 -2.0 -2.0 -2.0 -2.0 -2.0
Total Lost Time (s) 4.0 6.0 2.0 4.0 4.0 2.0 4.0 2.0
Lead/Lag Lead Lag Lag Lead Lag
Lead-Lag Optimize? Yes Yes Yes Yes Yes
Recall Mode None C-Max None Max Max None Min
Act Effct Green (s) 53.0 51.0 37.5 22.5 22.5 40.5 24.0 100.0
Actuated g/C Ratio 0.53 0.51 0.38 0.22 0.22 0.40 0.24 1.00
v/c Ratio 0.34 0.83 0.67 0.41 0.11 0.58 0.43 0.81
Control Delay 14.7 29.4 30.4 35.2 32.3 26.1 34.1 4.6
Queue Delay 0.0 0.0 0.0 0.0 0.0 0.0 0.0 0.0
Total Delay 14.7 29.4 30.4 35.2 32.3 26.1 34.1 4.6
LOS B C C D C C C A
Approach Delay 25.1 32.9 13.3
Approach LOS C C B
Intersection Summary
Cycle Length: 100
Actuated Cycle Length: 100
Offset: 0 (0%), Referenced to phase 4:EBT, Start of Yellow
Natural Cycle: 60
Control Type: Actuated-Coordinated
Maximum v/c Ratio: 0.83
Intersection Signal Delay: 20.3 Intersection LOS: C
Intersection Capacity Utilization 77.2% ICU Level of Service D
Analysis Period (min) 15
Splits and Phases: 7: East Hanover Ave & Whippany Rd

Timings
46: East Hanover Ave & Big Box Driveway 5/23/2012
2035 Build PM Alt 1 Synchro 7 - Report
Stantec Page 8
Lane Group EBL EBT WBT SBL SBR
Lane Configurations
Volume (vph) 31 1029 1663 22 29
Turn Type pm+pt Perm
Protected Phases 7 4 8 6
Permitted Phases 4 6
Detector Phase 7 4 8 6 6
Switch Phase
Minimum Initial (s) 7.0 10.0 10.0 10.0 10.0
Minimum Split (s) 12.0 21.0 22.0 26.0 26.0
Total Split (s) 12.0 74.0 62.0 26.0 26.0
Total Split (%) 12.0% 74.0% 62.0% 26.0% 26.0%
Yellow Time (s) 3.0 4.0 4.0 4.0 4.0
All-Red Time (s) 0.0 2.0 2.0 2.0 2.0
Lost Time Adjust (s) -2.0 -2.0 -2.0 -2.0 -2.0
Total Lost Time (s) 1.0 4.0 4.0 4.0 4.0
Lead/Lag Lead Lag
Lead-Lag Optimize? Yes Yes
Recall Mode None C-Max C-Max None None
Act Effct Green (s) 89.4 88.0 82.0 12.0 12.0
Actuated g/C Ratio 0.89 0.88 0.82 0.12 0.12
v/c Ratio 0.12 0.36 0.64 0.11 0.15
Control Delay 2.0 2.3 4.3 40.8 15.7
Queue Delay 0.0 0.0 0.0 0.0 0.0
Total Delay 2.0 2.3 4.3 40.8 15.7
LOS A A A D B
Approach Delay 2.3 4.3 26.4
Approach LOS A A C
Intersection Summary
Cycle Length: 100
Actuated Cycle Length: 100
Offset: 85 (85%), Referenced to phase 4:EBTL and 8:WBT, Start of Yellow
Natural Cycle: 90
Control Type: Actuated-Coordinated
Maximum v/c Ratio: 0.64
Intersection Signal Delay: 4.0 Intersection LOS: A
Intersection Capacity Utilization 61.7% ICU Level of Service B
Analysis Period (min) 15
Splits and Phases: 46: East Hanover Ave & Big Box Driveway

2035 ALTERNATIVE 2

Timings
1: East Hanover Ave & US 202 5/23/2012
2035 Build AM Alt 2 Synchro 7 - Report
Stantec Page 1
Lane Group EBL EBT WBL WBT WBR NBL NBT NBR SBL SBT
Lane Configurations
Volume (vph) 238 1243 145 580 201 84 389 245 523 471
Turn Type pm+pt pm+pt Perm pm+pt Perm pm+pt
Protected Phases 7 4 3 8 5 2 1 6
Permitted Phases 4 8 8 2 2 6
Detector Phase 7 4 3 8 8 5 2 2 1 6
Switch Phase
Minimum Initial (s) 5.0 7.0 5.0 7.0 7.0 5.0 5.0 5.0 5.0 5.0
Minimum Split (s) 8.0 29.0 8.0 29.0 29.0 8.0 26.0 26.0 8.0 32.0
Total Split (s) 15.0 38.0 8.0 31.0 31.0 8.0 26.0 26.0 28.0 46.0
Total Split (%) 15.0% 38.0% 8.0% 31.0% 31.0% 8.0% 26.0% 26.0% 28.0% 46.0%
Yellow Time (s) 3.0 3.0 3.0 3.0 3.0 3.0 3.0 3.0 3.0 3.0
All-Red Time (s) 0.0 2.0 0.0 2.0 2.0 0.0 2.0 2.0 0.0 2.0
Lost Time Adjust (s) -3.0 -3.0 -3.0 -3.0 0.0 -1.0 -3.0 0.0 -2.0 -3.0
Total Lost Time (s) 0.0 2.0 0.0 2.0 5.0 2.0 2.0 5.0 1.0 2.0
Lead/Lag Lead Lag Lead Lag Lag Lead Lag Lag Lead Lag
Lead-Lag Optimize? Yes Yes Yes Yes Yes Yes Yes Yes Yes Yes
Recall Mode None C-Min None C-Min C-Min None Max Max None Max
Act Effct Green (s) 46.0 36.0 39.5 29.5 26.5 30.0 24.0 21.0 53.0 45.6
Actuated g/C Ratio 0.46 0.36 0.40 0.30 0.26 0.30 0.24 0.21 0.53 0.46
v/c Ratio 0.62 0.97 0.67 0.57 0.37 0.35 0.87 0.58 0.97 0.74
Control Delay 24.5 51.4 40.5 18.2 3.9 19.3 57.5 20.9 58.2 29.7
Queue Delay 0.0 0.0 0.0 0.0 0.0 0.0 0.0 0.0 0.0 0.0
Total Delay 24.5 51.4 40.5 18.2 3.9 19.3 57.5 20.9 58.2 29.7
LOS C D D B A B E C E C
Approach Delay 47.2 18.6 40.5 42.9
Approach LOS D B D D
Intersection Summary
Cycle Length: 100
Actuated Cycle Length: 100
Offset: 46 (46%), Referenced to phase 4:EBTL and 8:WBTL, Start of Yellow
Natural Cycle: 90
Control Type: Actuated-Coordinated
Maximum v/c Ratio: 0.97
Intersection Signal Delay: 38.8 Intersection LOS: D
Intersection Capacity Utilization 106.2% ICU Level of Service G
Analysis Period (min) 15
Splits and Phases: 1: East Hanover Ave & US 202

Timings
2: East Hanover Ave & The American Rd 5/23/2012
2035 Build AM Alt 2 Synchro 7 - Report
Stantec Page 2
Lane Group EBL EBT WBT WBR SBL SBR ø2
Lane Configurations
Volume (vph) 221 1790 848 291 68 59
Turn Type custom Free Free
Protected Phases 5 2 4! 6 4! 2
Permitted Phases 2 Free Free
Detector Phase 5 2 4 6 4
Switch Phase
Minimum Initial (s) 7.0 7.0 7.0 5.0
Minimum Split (s) 10.0 26.0 12.0 12.0
Total Split (s) 19.0 100.0 64.0 0.0 17.0 0.0 83.0
Total Split (%) 19.0% 100.0% 64.0% 0.0% 17.0% 0.0% 83%
Yellow Time (s) 3.0 4.0 3.0 4.0
All-Red Time (s) 0.0 2.0 2.0 2.0
Lost Time Adjust (s) 0.0 0.0 0.0 0.0 0.0 0.0
Total Lost Time (s) 3.0 6.0 6.0 4.0 5.0 4.0
Lead/Lag Lead Lag
Lead-Lag Optimize? Yes Yes
Recall Mode None C-Min None C-Max
Act Effct Green (s) 80.0 100.0 65.4 100.0 12.0 100.0
Actuated g/C Ratio 0.80 1.00 0.65 1.00 0.12 1.00
v/c Ratio 0.45 0.54 0.39 0.20 0.31 0.04
Control Delay 4.1 0.7 3.3 0.2 44.2 0.0
Queue Delay 0.0 0.0 0.0 0.0 0.0 0.0
Total Delay 4.1 0.7 3.3 0.2 44.2 0.0
LOS A A A A D A
Approach Delay 1.0 2.5 23.8
Approach LOS A A C
Intersection Summary
Cycle Length: 100
Actuated Cycle Length: 100
Offset: 38 (38%), Referenced to phase 2:EBTL and 6:WBT, Start of Yellow
Natural Cycle: 50
Control Type: Actuated-Coordinated
Maximum v/c Ratio: 0.54
Intersection Signal Delay: 2.4 Intersection LOS: A
Intersection Capacity Utilization 64.5% ICU Level of Service C
Analysis Period (min) 15
! Phase conflict between lane groups.
Splits and Phases: 2: East Hanover Ave & The American Rd
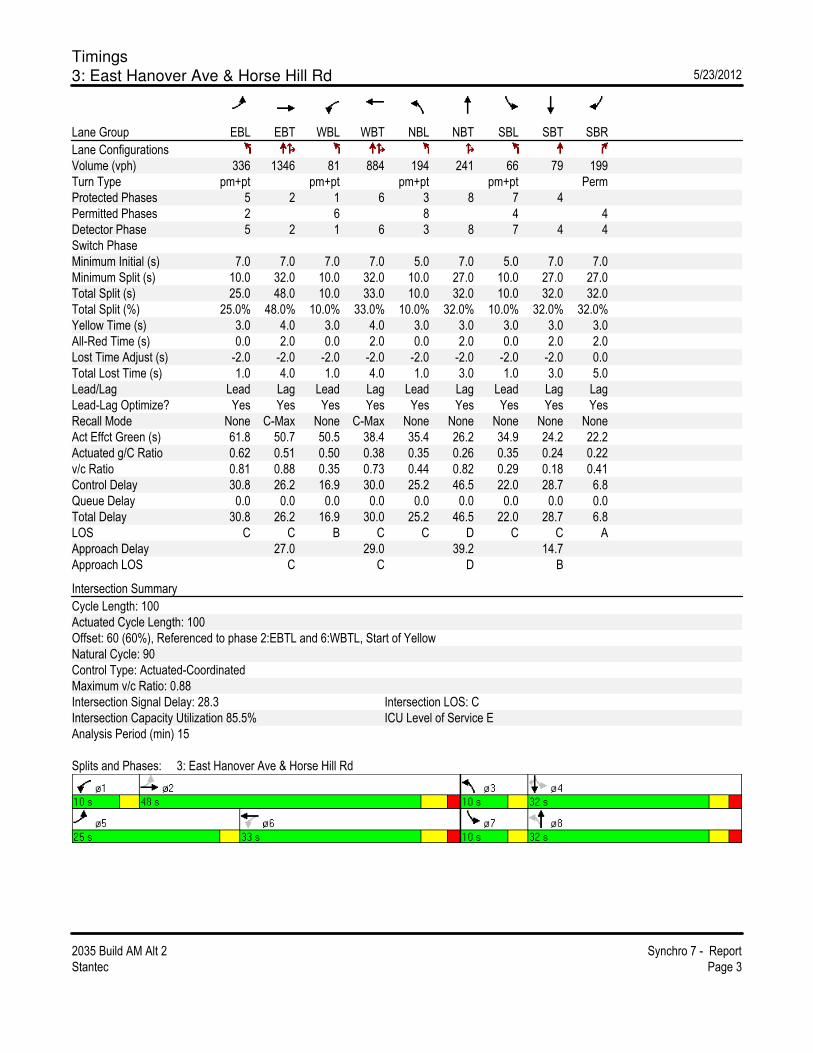
Timings
3: East Hanover Ave & Horse Hill Rd 5/23/2012
2035 Build AM Alt 2 Synchro 7 - Report
Stantec Page 3
Lane Group EBL EBT WBL WBT NBL NBT SBL SBT SBR
Lane Configurations
Volume (vph) 336 1346 81 884 194 241 66 79 199
Turn Type pm+pt pm+pt pm+pt pm+pt Perm
Protected Phases 5 2 1 6 3 8 7 4
Permitted Phases 2 6 8 4 4
Detector Phase 5 2 1 6 3 8 7 4 4
Switch Phase
Minimum Initial (s) 7.0 7.0 7.0 7.0 5.0 7.0 5.0 7.0 7.0
Minimum Split (s) 10.0 32.0 10.0 32.0 10.0 27.0 10.0 27.0 27.0
Total Split (s) 25.0 48.0 10.0 33.0 10.0 32.0 10.0 32.0 32.0
Total Split (%) 25.0% 48.0% 10.0% 33.0% 10.0% 32.0% 10.0% 32.0% 32.0%
Yellow Time (s) 3.0 4.0 3.0 4.0 3.0 3.0 3.0 3.0 3.0
All-Red Time (s) 0.0 2.0 0.0 2.0 0.0 2.0 0.0 2.0 2.0
Lost Time Adjust (s) -2.0 -2.0 -2.0 -2.0 -2.0 -2.0 -2.0 -2.0 0.0
Total Lost Time (s) 1.0 4.0 1.0 4.0 1.0 3.0 1.0 3.0 5.0
Lead/Lag Lead Lag Lead Lag Lead Lag Lead Lag Lag
Lead-Lag Optimize? Yes Yes Yes Yes Yes Yes Yes Yes Yes
Recall Mode None C-Max None C-Max None None None None None
Act Effct Green (s) 61.8 50.7 50.5 38.4 35.4 26.2 34.9 24.2 22.2
Actuated g/C Ratio 0.62 0.51 0.50 0.38 0.35 0.26 0.35 0.24 0.22
v/c Ratio 0.81 0.88 0.35 0.73 0.44 0.82 0.29 0.18 0.41
Control Delay 30.8 26.2 16.9 30.0 25.2 46.5 22.0 28.7 6.8
Queue Delay 0.0 0.0 0.0 0.0 0.0 0.0 0.0 0.0 0.0
Total Delay 30.8 26.2 16.9 30.0 25.2 46.5 22.0 28.7 6.8
LOS C C B C C D C C A
Approach Delay 27.0 29.0 39.2 14.7
Approach LOS C C D B
Intersection Summary
Cycle Length: 100
Actuated Cycle Length: 100
Offset: 60 (60%), Referenced to phase 2:EBTL and 6:WBTL, Start of Yellow
Natural Cycle: 90
Control Type: Actuated-Coordinated
Maximum v/c Ratio: 0.88
Intersection Signal Delay: 28.3 Intersection LOS: C
Intersection Capacity Utilization 85.5% ICU Level of Service E
Analysis Period (min) 15
Splits and Phases: 3: East Hanover Ave & Horse Hill Rd

HCM Unsignalized Intersection Capacity Analysis
4: East Hanover Ave & Monroe St 5/23/2012
2035 Build AM Alt 2 Synchro 7 - Report
Stantec Page 4
Movement EBT EBR WBL WBT NBL NBR
Lane Configurations
Volume (veh/h) 1518 4 28 1025 3 126
Sign Control Free Free Stop
Grade 0% 0% 0%
Peak Hour Factor 0.95 0.95 0.95 0.95 0.95 0.95
Hourly flow rate (vph) 1598 4 29 1079 3 133
Pedestrians 1
Lane Width (ft) 12.0
Walking Speed (ft/s) 4.0
Percent Blockage 0
Right turn flare (veh)
Median type None None
Median storage veh)
Upstream signal (ft) 176 847
pX, platoon unblocked 0.87 0.92 0.87
vC, conflicting volume 1602 2198 802
vC1, stage 1 conf vol
vC2, stage 2 conf vol
vCu, unblocked vol 1395 1624 477
tC, single (s) 4.1 6.8 6.9
tC, 2 stage (s)
tF (s) 2.2 3.5 3.3
p0 queue free % 93 96 71
cM capacity (veh/h) 423 82 465
Direction, Lane # EB 1 EB 2 WB 1 WB 2 NB 1
Volume Total 1065 537 389 719 136
Volume Left 0 0 29 0 3
Volume Right 0 4 0 0 133
cSH 1700 1700 423 1700 419
Volume to Capacity 0.63 0.32 0.07 0.42 0.32
Queue Length 95th (ft) 0 0 6 0 35
Control Delay (s) 0.0 0.0 2.2 0.0 17.6
Lane LOS A C
Approach Delay (s) 0.0 0.8 17.6
Approach LOS C
Intersection Summary
Average Delay 1.1
Intersection Capacity Utilization 63.4% ICU Level of Service B
Analysis Period (min) 15
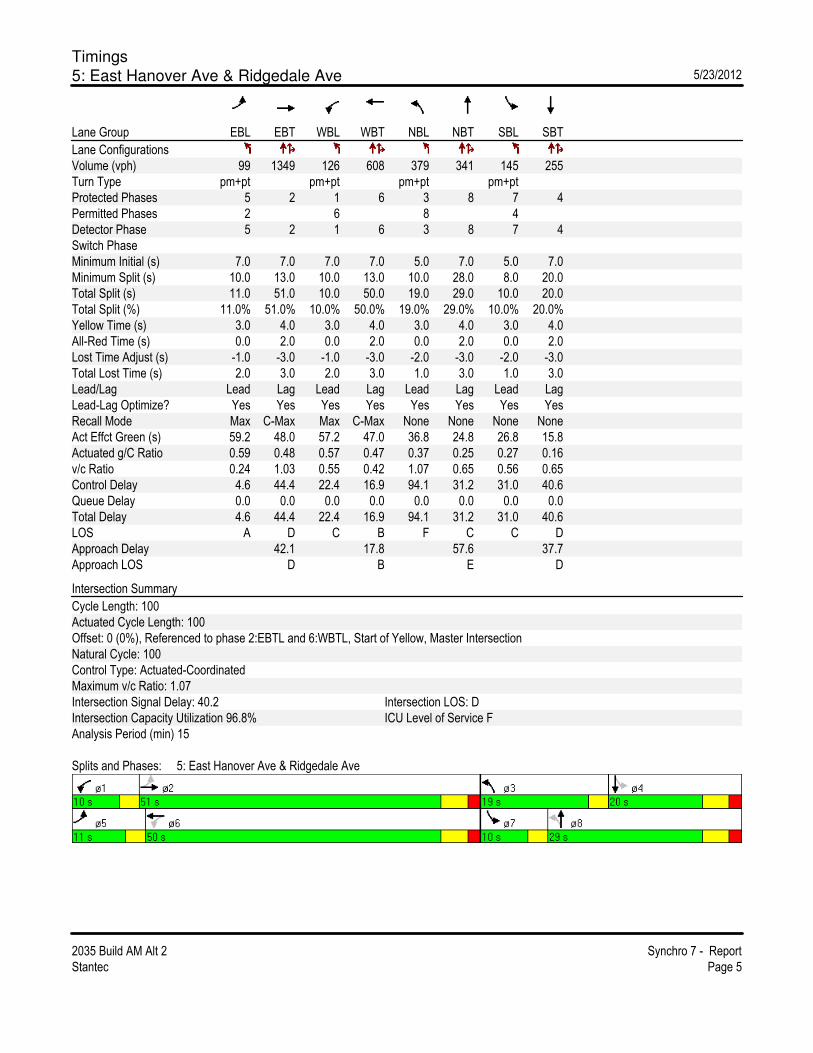
Timings
5: East Hanover Ave & Ridgedale Ave 5/23/2012
2035 Build AM Alt 2 Synchro 7 - Report
Stantec Page 5
Lane Group EBL EBT WBL WBT NBL NBT SBL SBT
Lane Configurations
Volume (vph) 99 1349 126 608 379 341 145 255
Turn Type pm+pt pm+pt pm+pt pm+pt
Protected Phases 5 2 1 6 3 8 7 4
Permitted Phases 2 6 8 4
Detector Phase 5 2 1 6 3 8 7 4
Switch Phase
Minimum Initial (s) 7.0 7.0 7.0 7.0 5.0 7.0 5.0 7.0
Minimum Split (s) 10.0 13.0 10.0 13.0 10.0 28.0 8.0 20.0
Total Split (s) 11.0 51.0 10.0 50.0 19.0 29.0 10.0 20.0
Total Split (%) 11.0% 51.0% 10.0% 50.0% 19.0% 29.0% 10.0% 20.0%
Yellow Time (s) 3.0 4.0 3.0 4.0 3.0 4.0 3.0 4.0
All-Red Time (s) 0.0 2.0 0.0 2.0 0.0 2.0 0.0 2.0
Lost Time Adjust (s) -1.0 -3.0 -1.0 -3.0 -2.0 -3.0 -2.0 -3.0
Total Lost Time (s) 2.0 3.0 2.0 3.0 1.0 3.0 1.0 3.0
Lead/Lag Lead Lag Lead Lag Lead Lag Lead Lag
Lead-Lag Optimize? Yes Yes Yes Yes Yes Yes Yes Yes
Recall Mode Max C-Max Max C-Max None None None None
Act Effct Green (s) 59.2 48.0 57.2 47.0 36.8 24.8 26.8 15.8
Actuated g/C Ratio 0.59 0.48 0.57 0.47 0.37 0.25 0.27 0.16
v/c Ratio 0.24 1.03 0.55 0.42 1.07 0.65 0.56 0.65
Control Delay 4.6 44.4 22.4 16.9 94.1 31.2 31.0 40.6
Queue Delay 0.0 0.0 0.0 0.0 0.0 0.0 0.0 0.0
Total Delay 4.6 44.4 22.4 16.9 94.1 31.2 31.0 40.6
LOS A D C B F C C D
Approach Delay 42.1 17.8 57.6 37.7
Approach LOS D B E D
Intersection Summary
Cycle Length: 100
Actuated Cycle Length: 100
Offset: 0 (0%), Referenced to phase 2:EBTL and 6:WBTL, Start of Yellow, Master Intersection
Natural Cycle: 100
Control Type: Actuated-Coordinated
Maximum v/c Ratio: 1.07
Intersection Signal Delay: 40.2 Intersection LOS: D
Intersection Capacity Utilization 96.8% ICU Level of Service F
Analysis Period (min) 15
Splits and Phases: 5: East Hanover Ave & Ridgedale Ave

Timings
6: East Hanover Ave & Library 5/23/2012
2035 Build AM Alt 2 Synchro 7 - Report
Stantec Page 6
Lane Group EBL EBT WBT SBL SBR
Lane Configurations
Volume (vph) 19 1651 805 1 6
Turn Type Perm Perm
Protected Phases 2 6 4
Permitted Phases 2 4
Detector Phase 2 2 6 4 4
Switch Phase
Minimum Initial (s) 7.0 7.0 7.0 7.0 7.0
Minimum Split (s) 29.0 29.0 29.0 28.0 28.0
Total Split (s) 72.0 72.0 72.0 28.0 28.0
Total Split (%) 72.0% 72.0% 72.0% 28.0% 28.0%
Yellow Time (s) 5.0 5.0 5.0 3.0 3.0
All-Red Time (s) 2.0 2.0 2.0 2.0 2.0
Lost Time Adjust (s) 0.0 -2.0 -2.0 -2.0 -2.0
Total Lost Time (s) 7.0 5.0 5.0 3.0 3.0
Lead/Lag
Lead-Lag Optimize?
Recall Mode C-Max C-Max C-Max None None
Act Effct Green (s) 96.6 96.6 9.0 9.0
Actuated g/C Ratio 0.97 0.97 0.09 0.09
v/c Ratio 0.52 0.24 0.01 0.04
Control Delay 0.3 0.6 42.0 25.5
Queue Delay 0.0 0.0 0.0 0.0
Total Delay 0.3 0.6 42.0 25.5
LOS A A D C
Approach Delay 0.3 0.6 27.9
Approach LOS A A C
Intersection Summary
Cycle Length: 100
Actuated Cycle Length: 100
Offset: 76 (76%), Referenced to phase 2:EBTL and 6:WBT, Start of Yellow
Natural Cycle: 70
Control Type: Actuated-Coordinated
Maximum v/c Ratio: 0.52
Intersection Signal Delay: 0.5 Intersection LOS: A
Intersection Capacity Utilization 72.4% ICU Level of Service C
Analysis Period (min) 15
Splits and Phases: 6: East Hanover Ave & Library
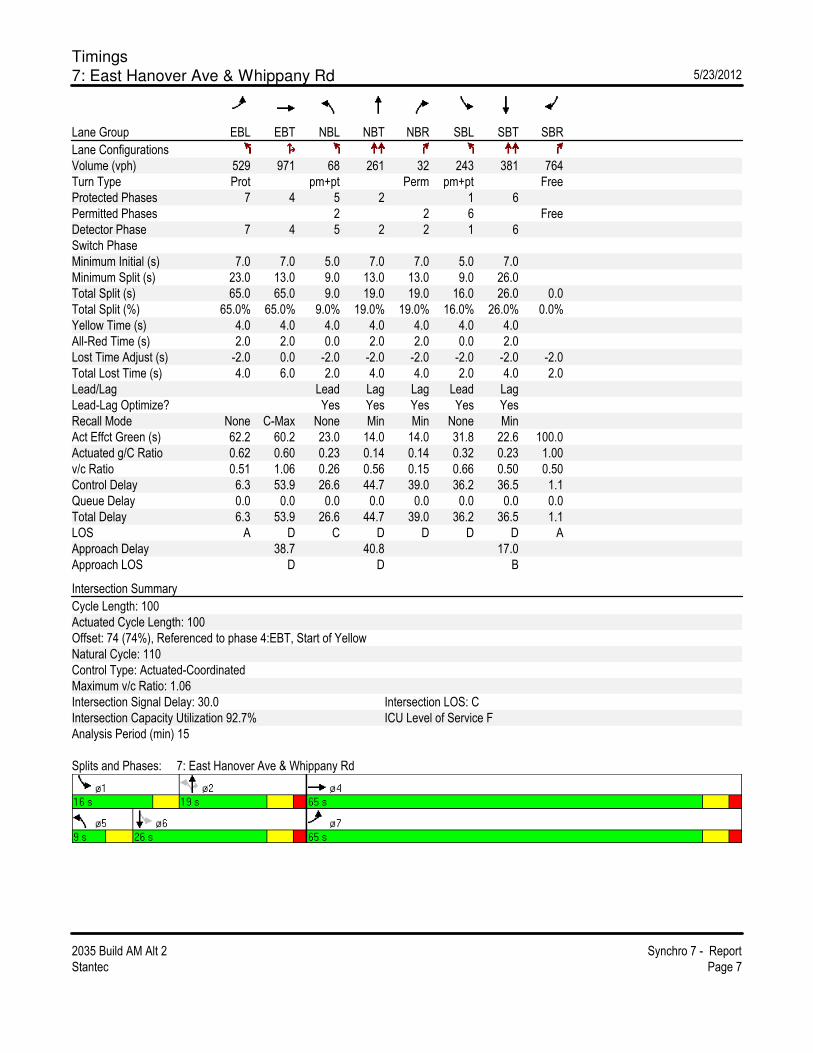
Timings
7: East Hanover Ave & Whippany Rd 5/23/2012
2035 Build AM Alt 2 Synchro 7 - Report
Stantec Page 7
Lane Group EBL EBT NBL NBT NBR SBL SBT SBR
Lane Configurations
Volume (vph) 529 971 68 261 32 243 381 764
Turn Type Prot pm+pt Perm pm+pt Free
Protected Phases 7 4 5 2 1 6
Permitted Phases 2 2 6 Free
Detector Phase 7 4 5 2 2 1 6
Switch Phase
Minimum Initial (s) 7.0 7.0 5.0 7.0 7.0 5.0 7.0
Minimum Split (s) 23.0 13.0 9.0 13.0 13.0 9.0 26.0
Total Split (s) 65.0 65.0 9.0 19.0 19.0 16.0 26.0 0.0
Total Split (%) 65.0% 65.0% 9.0% 19.0% 19.0% 16.0% 26.0% 0.0%
Yellow Time (s) 4.0 4.0 4.0 4.0 4.0 4.0 4.0
All-Red Time (s) 2.0 2.0 0.0 2.0 2.0 0.0 2.0
Lost Time Adjust (s) -2.0 0.0 -2.0 -2.0 -2.0 -2.0 -2.0 -2.0
Total Lost Time (s) 4.0 6.0 2.0 4.0 4.0 2.0 4.0 2.0
Lead/Lag Lead Lag Lag Lead Lag
Lead-Lag Optimize? Yes Yes Yes Yes Yes
Recall Mode None C-Max None Min Min None Min
Act Effct Green (s) 62.2 60.2 23.0 14.0 14.0 31.8 22.6 100.0
Actuated g/C Ratio 0.62 0.60 0.23 0.14 0.14 0.32 0.23 1.00
v/c Ratio 0.51 1.06 0.26 0.56 0.15 0.66 0.50 0.50
Control Delay 6.3 53.9 26.6 44.7 39.0 36.2 36.5 1.1
Queue Delay 0.0 0.0 0.0 0.0 0.0 0.0 0.0 0.0
Total Delay 6.3 53.9 26.6 44.7 39.0 36.2 36.5 1.1
LOS A D C D D D D A
Approach Delay 38.7 40.8 17.0
Approach LOS D D B
Intersection Summary
Cycle Length: 100
Actuated Cycle Length: 100
Offset: 74 (74%), Referenced to phase 4:EBT, Start of Yellow
Natural Cycle: 110
Control Type: Actuated-Coordinated
Maximum v/c Ratio: 1.06
Intersection Signal Delay: 30.0 Intersection LOS: C
Intersection Capacity Utilization 92.7% ICU Level of Service F
Analysis Period (min) 15
Splits and Phases: 7: East Hanover Ave & Whippany Rd
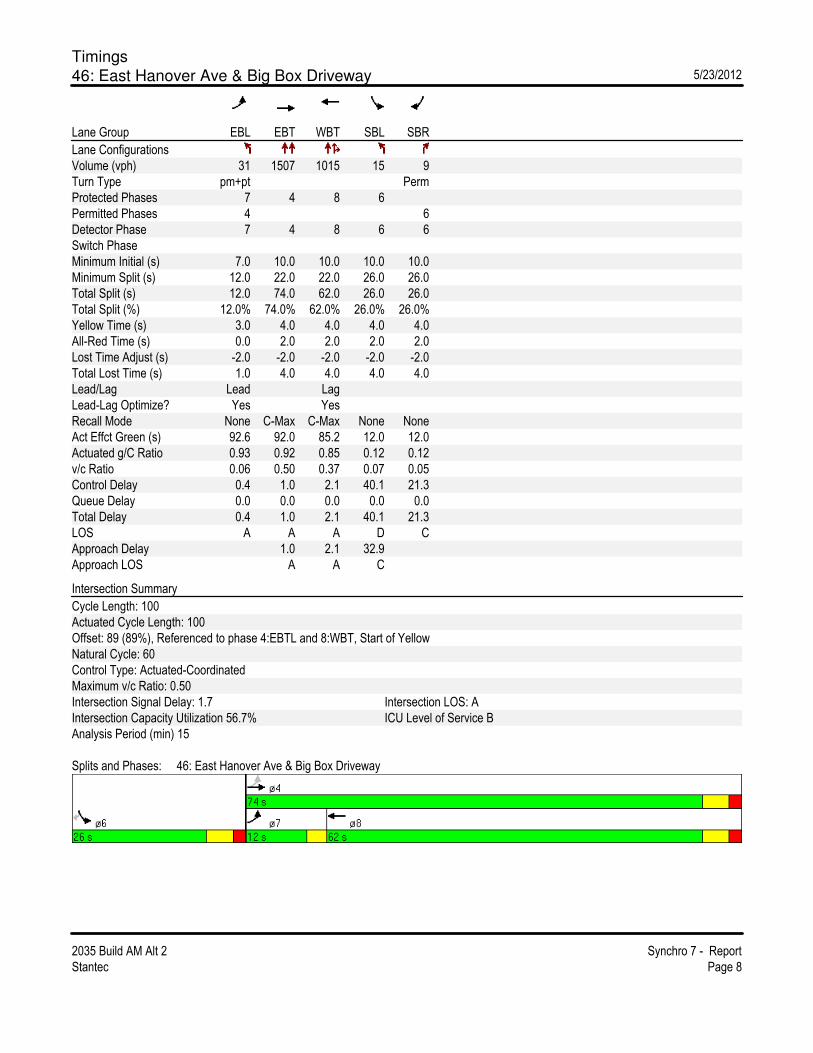
Timings
46: East Hanover Ave & Big Box Driveway 5/23/2012
2035 Build AM Alt 2 Synchro 7 - Report
Stantec Page 8
Lane Group EBL EBT WBT SBL SBR
Lane Configurations
Volume (vph) 31 1507 1015 15 9
Turn Type pm+pt Perm
Protected Phases 7 4 8 6
Permitted Phases 4 6
Detector Phase 7 4 8 6 6
Switch Phase
Minimum Initial (s) 7.0 10.0 10.0 10.0 10.0
Minimum Split (s) 12.0 22.0 22.0 26.0 26.0
Total Split (s) 12.0 74.0 62.0 26.0 26.0
Total Split (%) 12.0% 74.0% 62.0% 26.0% 26.0%
Yellow Time (s) 3.0 4.0 4.0 4.0 4.0
All-Red Time (s) 0.0 2.0 2.0 2.0 2.0
Lost Time Adjust (s) -2.0 -2.0 -2.0 -2.0 -2.0
Total Lost Time (s) 1.0 4.0 4.0 4.0 4.0
Lead/Lag Lead Lag
Lead-Lag Optimize? Yes Yes
Recall Mode None C-Max C-Max None None
Act Effct Green (s) 92.6 92.0 85.2 12.0 12.0
Actuated g/C Ratio 0.93 0.92 0.85 0.12 0.12
v/c Ratio 0.06 0.50 0.37 0.07 0.05
Control Delay 0.4 1.0 2.1 40.1 21.3
Queue Delay 0.0 0.0 0.0 0.0 0.0
Total Delay 0.4 1.0 2.1 40.1 21.3
LOS A A A D C
Approach Delay 1.0 2.1 32.9
Approach LOS A A C
Intersection Summary
Cycle Length: 100
Actuated Cycle Length: 100
Offset: 89 (89%), Referenced to phase 4:EBTL and 8:WBT, Start of Yellow
Natural Cycle: 60
Control Type: Actuated-Coordinated
Maximum v/c Ratio: 0.50
Intersection Signal Delay: 1.7 Intersection LOS: A
Intersection Capacity Utilization 56.7% ICU Level of Service B
Analysis Period (min) 15
Splits and Phases: 46: East Hanover Ave & Big Box Driveway
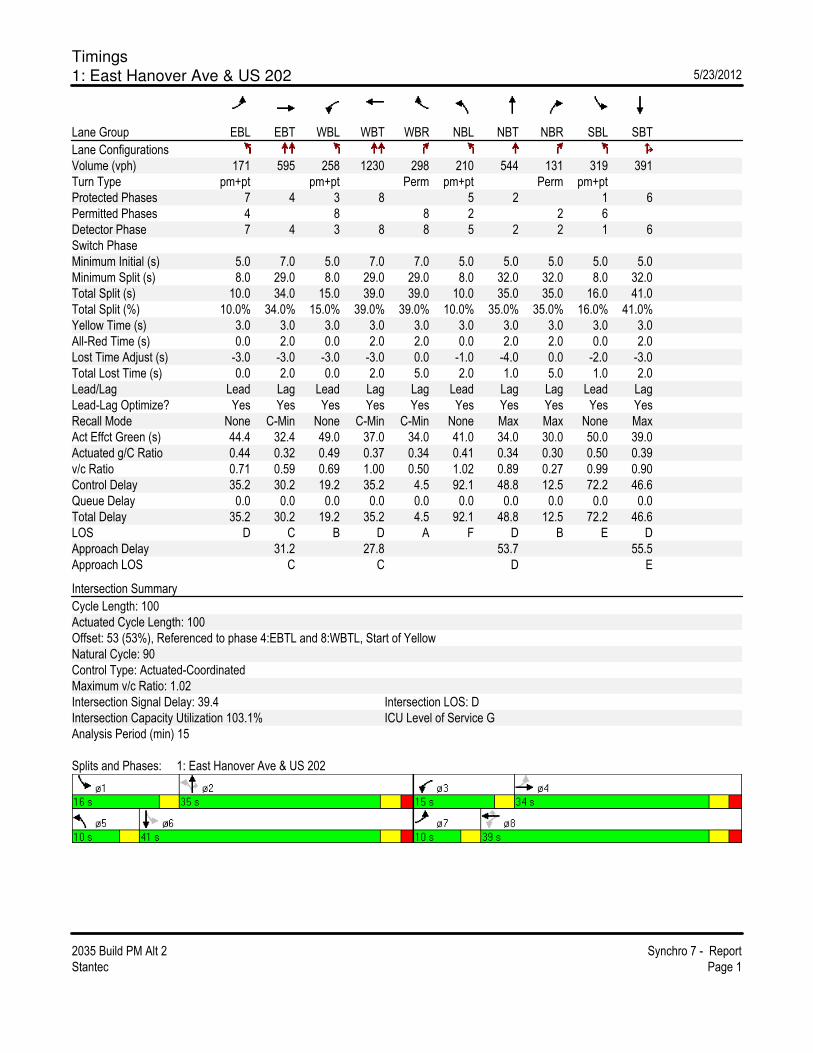
Timings
1: East Hanover Ave & US 202 5/23/2012
2035 Build PM Alt 2 Synchro 7 - Report
Stantec Page 1
Lane Group EBL EBT WBL WBT WBR NBL NBT NBR SBL SBT
Lane Configurations
Volume (vph) 171 595 258 1230 298 210 544 131 319 391
Turn Type pm+pt pm+pt Perm pm+pt Perm pm+pt
Protected Phases 7 4 3 8 5 2 1 6
Permitted Phases 4 8 8 2 2 6
Detector Phase 7 4 3 8 8 5 2 2 1 6
Switch Phase
Minimum Initial (s) 5.0 7.0 5.0 7.0 7.0 5.0 5.0 5.0 5.0 5.0
Minimum Split (s) 8.0 29.0 8.0 29.0 29.0 8.0 32.0 32.0 8.0 32.0
Total Split (s) 10.0 34.0 15.0 39.0 39.0 10.0 35.0 35.0 16.0 41.0
Total Split (%) 10.0% 34.0% 15.0% 39.0% 39.0% 10.0% 35.0% 35.0% 16.0% 41.0%
Yellow Time (s) 3.0 3.0 3.0 3.0 3.0 3.0 3.0 3.0 3.0 3.0
All-Red Time (s) 0.0 2.0 0.0 2.0 2.0 0.0 2.0 2.0 0.0 2.0
Lost Time Adjust (s) -3.0 -3.0 -3.0 -3.0 0.0 -1.0 -4.0 0.0 -2.0 -3.0
Total Lost Time (s) 0.0 2.0 0.0 2.0 5.0 2.0 1.0 5.0 1.0 2.0
Lead/Lag Lead Lag Lead Lag Lag Lead Lag Lag Lead Lag
Lead-Lag Optimize? Yes Yes Yes Yes Yes Yes Yes Yes Yes Yes
Recall Mode None C-Min None C-Min C-Min None Max Max None Max
Act Effct Green (s) 44.4 32.4 49.0 37.0 34.0 41.0 34.0 30.0 50.0 39.0
Actuated g/C Ratio 0.44 0.32 0.49 0.37 0.34 0.41 0.34 0.30 0.50 0.39
v/c Ratio 0.71 0.59 0.69 1.00 0.50 1.02 0.89 0.27 0.99 0.90
Control Delay 35.2 30.2 19.2 35.2 4.5 92.1 48.8 12.5 72.2 46.6
Queue Delay 0.0 0.0 0.0 0.0 0.0 0.0 0.0 0.0 0.0 0.0
Total Delay 35.2 30.2 19.2 35.2 4.5 92.1 48.8 12.5 72.2 46.6
LOS D C B D A F D B E D
Approach Delay 31.2 27.8 53.7 55.5
Approach LOS C C D E
Intersection Summary
Cycle Length: 100
Actuated Cycle Length: 100
Offset: 53 (53%), Referenced to phase 4:EBTL and 8:WBTL, Start of Yellow
Natural Cycle: 90
Control Type: Actuated-Coordinated
Maximum v/c Ratio: 1.02
Intersection Signal Delay: 39.4 Intersection LOS: D
Intersection Capacity Utilization 103.1% ICU Level of Service G
Analysis Period (min) 15
Splits and Phases: 1: East Hanover Ave & US 202

Timings
2: East Hanover Ave & The American Rd 5/23/2012
2035 Build PM Alt 2 Synchro 7 - Report
Stantec Page 2
Lane Group EBL EBT WBT WBR SBL SBR ø2
Lane Configurations
Volume (vph) 92 954 1549 89 265 243
Turn Type custom Free Free
Protected Phases 5 2 4! 6 4! 2
Permitted Phases 2 Free Free
Detector Phase 5 2 4 6 4
Switch Phase
Minimum Initial (s) 7.0 7.0 7.0 5.0
Minimum Split (s) 10.0 26.0 12.0 12.0
Total Split (s) 10.0 100.0 55.0 0.0 35.0 0.0 65.0
Total Split (%) 10.0% 100.0% 55.0% 0.0% 35.0% 0.0% 65%
Yellow Time (s) 3.0 4.0 3.0 4.0
All-Red Time (s) 0.0 2.0 2.0 2.0
Lost Time Adjust (s) 0.0 0.0 0.0 0.0 0.0 0.0
Total Lost Time (s) 3.0 6.0 6.0 4.0 5.0 4.0
Lead/Lag Lead Lag
Lead-Lag Optimize? Yes Yes
Recall Mode None C-Min None C-Max
Act Effct Green (s) 68.9 100.0 57.6 100.0 23.1 100.0
Actuated g/C Ratio 0.69 1.00 0.58 1.00 0.23 1.00
v/c Ratio 0.49 0.30 0.82 0.06 0.63 0.15
Control Delay 18.4 0.2 11.1 0.0 40.3 0.2
Queue Delay 0.0 0.0 0.0 0.0 0.0 0.0
Total Delay 18.4 0.2 11.1 0.0 40.3 0.2
LOS B A B A D A
Approach Delay 1.8 10.5 21.1
Approach LOS A B C
Intersection Summary
Cycle Length: 100
Actuated Cycle Length: 100
Offset: 23 (23%), Referenced to phase 2:EBTL and 6:WBT, Start of Yellow
Natural Cycle: 70
Control Type: Actuated-Coordinated
Maximum v/c Ratio: 0.82
Intersection Signal Delay: 9.3 Intersection LOS: A
Intersection Capacity Utilization 75.8% ICU Level of Service D
Analysis Period (min) 15
! Phase conflict between lane groups.
Splits and Phases: 2: East Hanover Ave & The American Rd
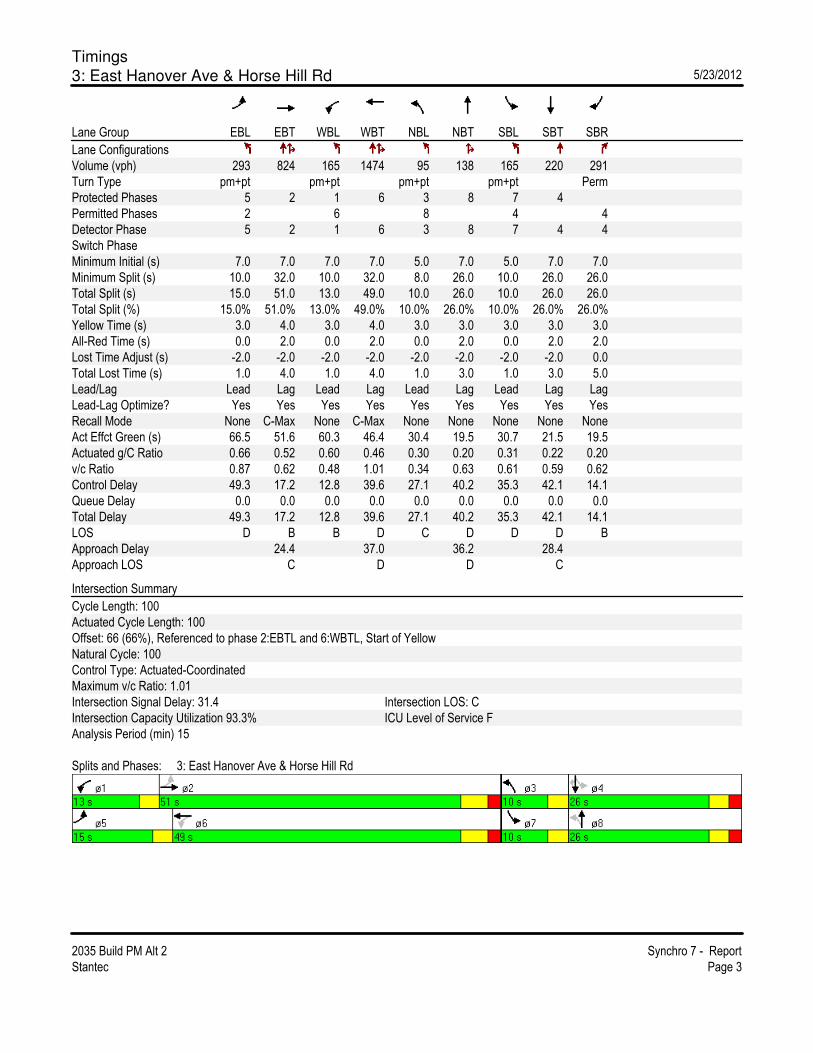
Timings
3: East Hanover Ave & Horse Hill Rd 5/23/2012
2035 Build PM Alt 2 Synchro 7 - Report
Stantec Page 3
Lane Group EBL EBT WBL WBT NBL NBT SBL SBT SBR
Lane Configurations
Volume (vph) 293 824 165 1474 95 138 165 220 291
Turn Type pm+pt pm+pt pm+pt pm+pt Perm
Protected Phases 5 2 1 6 3 8 7 4
Permitted Phases 2 6 8 4 4
Detector Phase 5 2 1 6 3 8 7 4 4
Switch Phase
Minimum Initial (s) 7.0 7.0 7.0 7.0 5.0 7.0 5.0 7.0 7.0
Minimum Split (s) 10.0 32.0 10.0 32.0 8.0 26.0 10.0 26.0 26.0
Total Split (s) 15.0 51.0 13.0 49.0 10.0 26.0 10.0 26.0 26.0
Total Split (%) 15.0% 51.0% 13.0% 49.0% 10.0% 26.0% 10.0% 26.0% 26.0%
Yellow Time (s) 3.0 4.0 3.0 4.0 3.0 3.0 3.0 3.0 3.0
All-Red Time (s) 0.0 2.0 0.0 2.0 0.0 2.0 0.0 2.0 2.0
Lost Time Adjust (s) -2.0 -2.0 -2.0 -2.0 -2.0 -2.0 -2.0 -2.0 0.0
Total Lost Time (s) 1.0 4.0 1.0 4.0 1.0 3.0 1.0 3.0 5.0
Lead/Lag Lead Lag Lead Lag Lead Lag Lead Lag Lag
Lead-Lag Optimize? Yes Yes Yes Yes Yes Yes Yes Yes Yes
Recall Mode None C-Max None C-Max None None None None None
Act Effct Green (s) 66.5 51.6 60.3 46.4 30.4 19.5 30.7 21.5 19.5
Actuated g/C Ratio 0.66 0.52 0.60 0.46 0.30 0.20 0.31 0.22 0.20
v/c Ratio 0.87 0.62 0.48 1.01 0.34 0.63 0.61 0.59 0.62
Control Delay 49.3 17.2 12.8 39.6 27.1 40.2 35.3 42.1 14.1
Queue Delay 0.0 0.0 0.0 0.0 0.0 0.0 0.0 0.0 0.0
Total Delay 49.3 17.2 12.8 39.6 27.1 40.2 35.3 42.1 14.1
LOS D B B D C D D D B
Approach Delay 24.4 37.0 36.2 28.4
Approach LOS C D D C
Intersection Summary
Cycle Length: 100
Actuated Cycle Length: 100
Offset: 66 (66%), Referenced to phase 2:EBTL and 6:WBTL, Start of Yellow
Natural Cycle: 100
Control Type: Actuated-Coordinated
Maximum v/c Ratio: 1.01
Intersection Signal Delay: 31.4 Intersection LOS: C
Intersection Capacity Utilization 93.3% ICU Level of Service F
Analysis Period (min) 15
Splits and Phases: 3: East Hanover Ave & Horse Hill Rd

HCM Unsignalized Intersection Capacity Analysis
4: East Hanover Ave & Monroe St 5/23/2012
2035 Build PM Alt 2 Synchro 7 - Report
Stantec Page 4
Movement EBT EBR WBL WBT NBL NBR
Lane Configurations
Volume (veh/h) 1046 5 105 1680 5 75
Sign Control Free Free Stop
Grade 0% 0% 0%
Peak Hour Factor 0.96 0.96 0.96 0.96 0.96 0.96
Hourly flow rate (vph) 1090 5 109 1750 5 78
Pedestrians
Lane Width (ft)
Walking Speed (ft/s)
Percent Blockage
Right turn flare (veh)
Median type None None
Median storage veh)
Upstream signal (ft) 161 847
pX, platoon unblocked 0.93 0.66 0.93
vC, conflicting volume 1095 2186 547
vC1, stage 1 conf vol
vC2, stage 2 conf vol
vCu, unblocked vol 942 1259 351
tC, single (s) 4.1 6.8 6.9
tC, 2 stage (s)
tF (s) 2.2 3.5 3.3
p0 queue free % 84 94 87
cM capacity (veh/h) 670 91 597
Direction, Lane # EB 1 EB 2 WB 1 WB 2 NB 1
Volume Total 726 368 693 1167 83
Volume Left 0 0 109 0 5
Volume Right 0 5 0 0 78
cSH 1700 1700 670 1700 444
Volume to Capacity 0.43 0.22 0.16 0.69 0.19
Queue Length 95th (ft) 0 0 15 0 17
Control Delay (s) 0.0 0.0 4.2 0.0 15.0
Lane LOS A B
Approach Delay (s) 0.0 1.6 15.0
Approach LOS B
Intersection Summary
Average Delay 1.4
Intersection Capacity Utilization 93.5% ICU Level of Service F
Analysis Period (min) 15
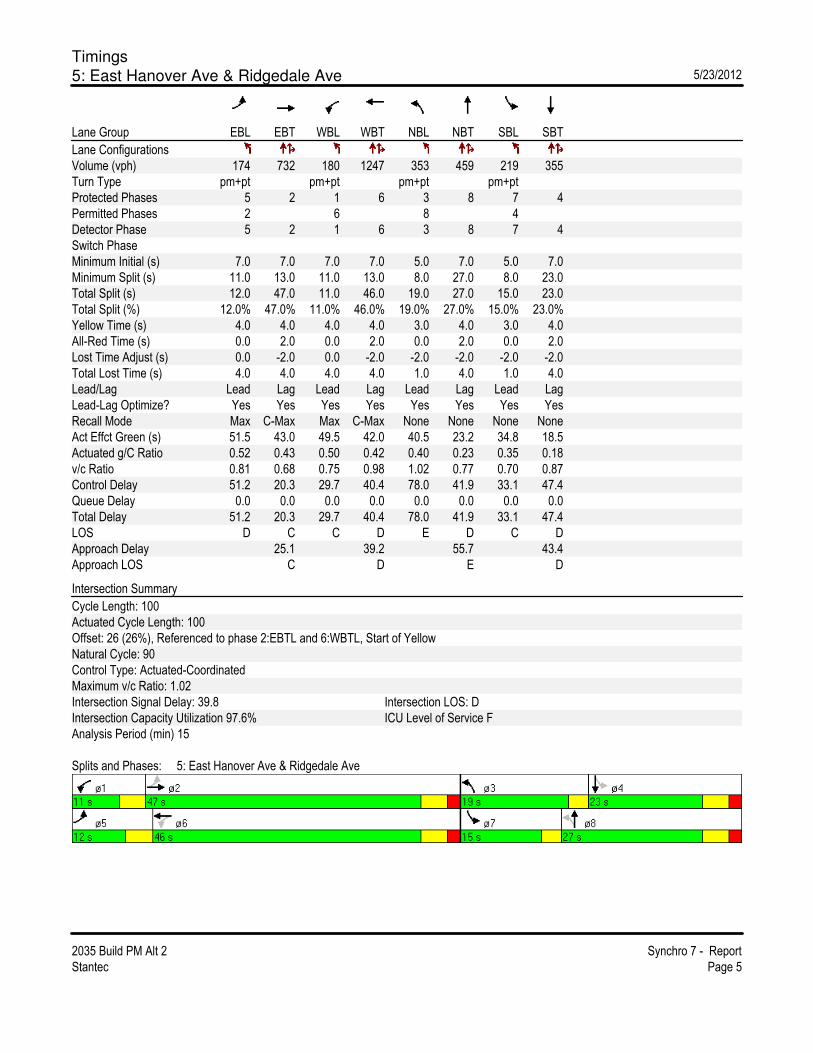
Timings
5: East Hanover Ave & Ridgedale Ave 5/23/2012
2035 Build PM Alt 2 Synchro 7 - Report
Stantec Page 5
Lane Group EBL EBT WBL WBT NBL NBT SBL SBT
Lane Configurations
Volume (vph) 174 732 180 1247 353 459 219 355
Turn Type pm+pt pm+pt pm+pt pm+pt
Protected Phases 5 2 1 6 3 8 7 4
Permitted Phases 2 6 8 4
Detector Phase 5 2 1 6 3 8 7 4
Switch Phase
Minimum Initial (s) 7.0 7.0 7.0 7.0 5.0 7.0 5.0 7.0
Minimum Split (s) 11.0 13.0 11.0 13.0 8.0 27.0 8.0 23.0
Total Split (s) 12.0 47.0 11.0 46.0 19.0 27.0 15.0 23.0
Total Split (%) 12.0% 47.0% 11.0% 46.0% 19.0% 27.0% 15.0% 23.0%
Yellow Time (s) 4.0 4.0 4.0 4.0 3.0 4.0 3.0 4.0
All-Red Time (s) 0.0 2.0 0.0 2.0 0.0 2.0 0.0 2.0
Lost Time Adjust (s) 0.0 -2.0 0.0 -2.0 -2.0 -2.0 -2.0 -2.0
Total Lost Time (s) 4.0 4.0 4.0 4.0 1.0 4.0 1.0 4.0
Lead/Lag Lead Lag Lead Lag Lead Lag Lead Lag
Lead-Lag Optimize? Yes Yes Yes Yes Yes Yes Yes Yes
Recall Mode Max C-Max Max C-Max None None None None
Act Effct Green (s) 51.5 43.0 49.5 42.0 40.5 23.2 34.8 18.5
Actuated g/C Ratio 0.52 0.43 0.50 0.42 0.40 0.23 0.35 0.18
v/c Ratio 0.81 0.68 0.75 0.98 1.02 0.77 0.70 0.87
Control Delay 51.2 20.3 29.7 40.4 78.0 41.9 33.1 47.4
Queue Delay 0.0 0.0 0.0 0.0 0.0 0.0 0.0 0.0
Total Delay 51.2 20.3 29.7 40.4 78.0 41.9 33.1 47.4
LOS D C C D E D C D
Approach Delay 25.1 39.2 55.7 43.4
Approach LOS C D E D
Intersection Summary
Cycle Length: 100
Actuated Cycle Length: 100
Offset: 26 (26%), Referenced to phase 2:EBTL and 6:WBTL, Start of Yellow
Natural Cycle: 90
Control Type: Actuated-Coordinated
Maximum v/c Ratio: 1.02
Intersection Signal Delay: 39.8 Intersection LOS: D
Intersection Capacity Utilization 97.6% ICU Level of Service F
Analysis Period (min) 15
Splits and Phases: 5: East Hanover Ave & Ridgedale Ave

Timings
6: East Hanover Ave & Library 5/23/2012
2035 Build PM Alt 2 Synchro 7 - Report
Stantec Page 6
Lane Group EBL EBT WBT SBL SBR
Lane Configurations
Volume (vph) 55 1003 1468 54 91
Turn Type Perm Perm
Protected Phases 2 6 4
Permitted Phases 2 4
Detector Phase 2 2 6 4 4
Switch Phase
Minimum Initial (s) 7.0 7.0 7.0 7.0 7.0
Minimum Split (s) 29.0 29.0 29.0 28.0 28.0
Total Split (s) 72.0 72.0 72.0 28.0 28.0
Total Split (%) 72.0% 72.0% 72.0% 28.0% 28.0%
Yellow Time (s) 5.0 5.0 5.0 3.0 3.0
All-Red Time (s) 2.0 2.0 2.0 2.0 2.0
Lost Time Adjust (s) 0.0 -2.0 -2.0 -2.0 -2.0
Total Lost Time (s) 7.0 5.0 5.0 3.0 3.0
Lead/Lag
Lead-Lag Optimize?
Recall Mode C-Max C-Max C-Max None None
Act Effct Green (s) 84.0 84.0 11.4 11.4
Actuated g/C Ratio 0.84 0.84 0.11 0.11
v/c Ratio 0.99 0.55 0.28 0.44
Control Delay 33.8 3.0 43.1 29.3
Queue Delay 0.0 0.0 0.0 0.0
Total Delay 33.8 3.0 43.1 29.3
LOS C A D C
Approach Delay 33.8 3.0 34.4
Approach LOS C A C
Intersection Summary
Cycle Length: 100
Actuated Cycle Length: 100
Offset: 0 (0%), Referenced to phase 2:EBTL and 6:WBT, Start of Yellow, Master Intersection
Natural Cycle: 150
Control Type: Actuated-Coordinated
Maximum v/c Ratio: 0.99
Intersection Signal Delay: 16.7 Intersection LOS: B
Intersection Capacity Utilization 82.0% ICU Level of Service E
Analysis Period (min) 15
Splits and Phases: 6: East Hanover Ave & Library

Timings
7: East Hanover Ave & Whippany Rd 5/23/2012
2035 Build PM Alt 2 Synchro 7 - Report
Stantec Page 7
Lane Group EBL EBT NBL NBT NBR SBL SBT SBR
Lane Configurations
Volume (vph) 300 540 281 308 36 261 351 1232
Turn Type Prot pm+pt Perm pm+pt Free
Protected Phases 7 4 5 2 1 6
Permitted Phases 2 2 6 Free
Detector Phase 7 4 5 2 2 1 6
Switch Phase
Minimum Initial (s) 7.0 7.0 5.0 7.0 7.0 5.0 7.0
Minimum Split (s) 23.0 13.0 9.0 13.0 13.0 9.0 28.0
Total Split (s) 55.0 55.0 17.0 28.0 28.0 17.0 28.0 0.0
Total Split (%) 55.0% 55.0% 17.0% 28.0% 28.0% 17.0% 28.0% 0.0%
Yellow Time (s) 4.0 4.0 4.0 4.0 4.0 4.0 4.0
All-Red Time (s) 2.0 2.0 0.0 2.0 2.0 0.0 2.0
Lost Time Adjust (s) -2.0 0.0 -2.0 -2.0 -2.0 -2.0 -2.0 -2.0
Total Lost Time (s) 4.0 6.0 2.0 4.0 4.0 2.0 4.0 2.0
Lead/Lag Lead Lag Lag Lead Lag
Lead-Lag Optimize? Yes Yes Yes Yes Yes
Recall Mode None C-Max None Min Min None Min
Act Effct Green (s) 57.6 55.6 34.6 17.7 17.7 34.3 17.6 100.0
Actuated g/C Ratio 0.58 0.56 0.35 0.18 0.18 0.34 0.18 1.00
v/c Ratio 0.31 0.76 0.75 0.52 0.14 0.65 0.59 0.81
Control Delay 6.6 13.2 36.7 40.1 34.7 31.4 41.6 4.6
Queue Delay 0.0 0.0 0.0 0.0 0.0 0.0 0.0 0.0
Total Delay 6.6 13.2 36.7 40.1 34.7 31.4 41.6 4.6
LOS A B D D C C D A
Approach Delay 11.3 38.2 15.4
Approach LOS B D B
Intersection Summary
Cycle Length: 100
Actuated Cycle Length: 100
Offset: 30 (30%), Referenced to phase 4:EBT, Start of Yellow
Natural Cycle: 80
Control Type: Actuated-Coordinated
Maximum v/c Ratio: 0.81
Intersection Signal Delay: 18.3 Intersection LOS: B
Intersection Capacity Utilization 77.2% ICU Level of Service D
Analysis Period (min) 15
Splits and Phases: 7: East Hanover Ave & Whippany Rd

Timings
46: East Hanover Ave & Big Box Driveway 5/23/2012
2035 Build PM Alt 2 Synchro 7 - Report
Stantec Page 8
Lane Group EBL EBT WBT SBL SBR
Lane Configurations
Volume (vph) 31 1029 1663 22 29
Turn Type pm+pt Perm
Protected Phases 7 4 8 6
Permitted Phases 4 6
Detector Phase 7 4 8 6 6
Switch Phase
Minimum Initial (s) 7.0 10.0 10.0 10.0 10.0
Minimum Split (s) 12.0 22.0 22.0 26.0 26.0
Total Split (s) 12.0 74.0 62.0 26.0 26.0
Total Split (%) 12.0% 74.0% 62.0% 26.0% 26.0%
Yellow Time (s) 3.0 4.0 4.0 4.0 4.0
All-Red Time (s) 0.0 2.0 2.0 2.0 2.0
Lost Time Adjust (s) -2.0 -2.0 -2.0 -2.0 -2.0
Total Lost Time (s) 1.0 4.0 4.0 4.0 4.0
Lead/Lag Lead Lag
Lead-Lag Optimize? Yes Yes
Recall Mode None C-Max C-Max None None
Act Effct Green (s) 89.4 88.0 82.0 12.0 12.0
Actuated g/C Ratio 0.89 0.88 0.82 0.12 0.12
v/c Ratio 0.12 0.36 0.64 0.11 0.15
Control Delay 3.2 4.6 3.8 40.8 15.7
Queue Delay 0.0 0.0 0.0 0.0 0.0
Total Delay 3.2 4.6 3.8 40.8 15.7
LOS A A A D B
Approach Delay 4.6 3.8 26.4
Approach LOS A A C
Intersection Summary
Cycle Length: 100
Actuated Cycle Length: 100
Offset: 57 (57%), Referenced to phase 4:EBTL and 8:WBT, Start of Yellow
Natural Cycle: 90
Control Type: Actuated-Coordinated
Maximum v/c Ratio: 0.64
Intersection Signal Delay: 4.5 Intersection LOS: A
Intersection Capacity Utilization 61.7% ICU Level of Service B
Analysis Period (min) 15
Splits and Phases: 46: East Hanover Ave & Big Box Driveway
2035 ALTERNATIVE 3
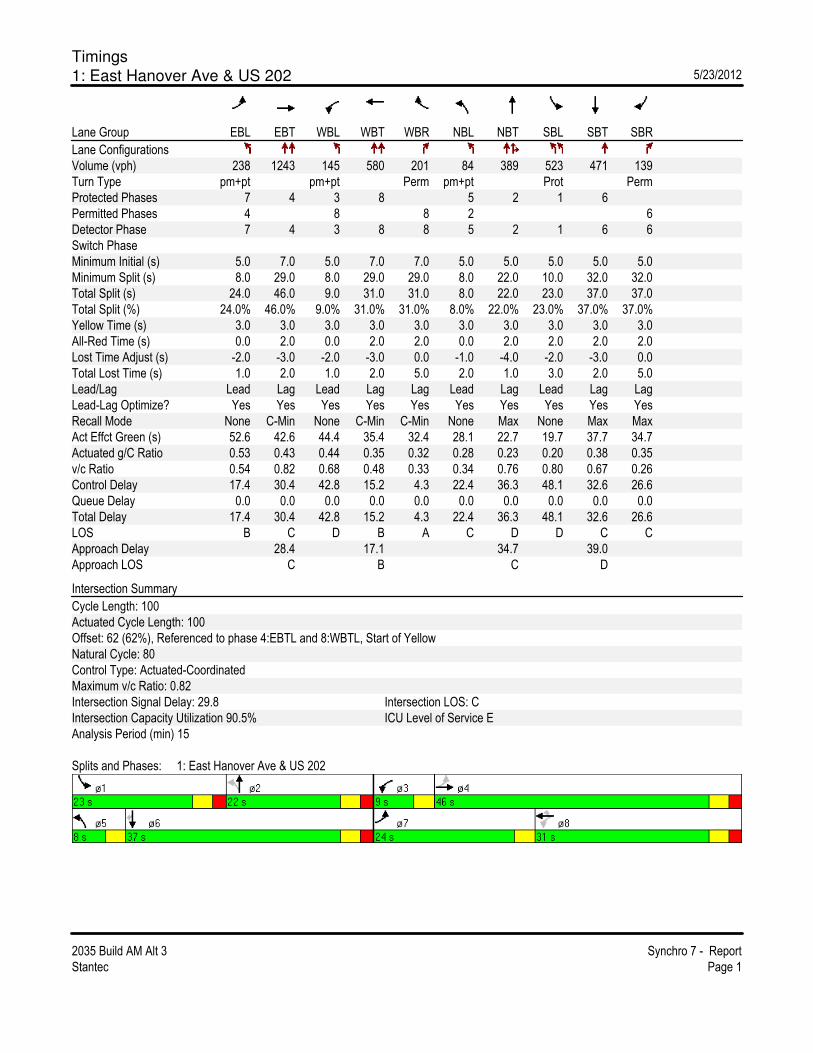
Timings
1: East Hanover Ave & US 202 5/23/2012
2035 Build AM Alt 3 Synchro 7 - Report
Stantec Page 1
Lane Group EBL EBT WBL WBT WBR NBL NBT SBL SBT SBR
Lane Configurations
Volume (vph) 238 1243 145 580 201 84 389 523 471 139
Turn Type pm+pt pm+pt Perm pm+pt Prot Perm
Protected Phases 7 4 3 8 5 2 1 6
Permitted Phases 4 8 8 2 6
Detector Phase 7 4 3 8 8 5 2 1 6 6
Switch Phase
Minimum Initial (s) 5.0 7.0 5.0 7.0 7.0 5.0 5.0 5.0 5.0 5.0
Minimum Split (s) 8.0 29.0 8.0 29.0 29.0 8.0 22.0 10.0 32.0 32.0
Total Split (s) 24.0 46.0 9.0 31.0 31.0 8.0 22.0 23.0 37.0 37.0
Total Split (%) 24.0% 46.0% 9.0% 31.0% 31.0% 8.0% 22.0% 23.0% 37.0% 37.0%
Yellow Time (s) 3.0 3.0 3.0 3.0 3.0 3.0 3.0 3.0 3.0 3.0
All-Red Time (s) 0.0 2.0 0.0 2.0 2.0 0.0 2.0 2.0 2.0 2.0
Lost Time Adjust (s) -2.0 -3.0 -2.0 -3.0 0.0 -1.0 -4.0 -2.0 -3.0 0.0
Total Lost Time (s) 1.0 2.0 1.0 2.0 5.0 2.0 1.0 3.0 2.0 5.0
Lead/Lag Lead Lag Lead Lag Lag Lead Lag Lead Lag Lag
Lead-Lag Optimize? Yes Yes Yes Yes Yes Yes Yes Yes Yes Yes
Recall Mode None C-Min None C-Min C-Min None Max None Max Max
Act Effct Green (s) 52.6 42.6 44.4 35.4 32.4 28.1 22.7 19.7 37.7 34.7
Actuated g/C Ratio 0.53 0.43 0.44 0.35 0.32 0.28 0.23 0.20 0.38 0.35
v/c Ratio 0.54 0.82 0.68 0.48 0.33 0.34 0.76 0.80 0.67 0.26
Control Delay 17.4 30.4 42.8 15.2 4.3 22.4 36.3 48.1 32.6 26.6
Queue Delay 0.0 0.0 0.0 0.0 0.0 0.0 0.0 0.0 0.0 0.0
Total Delay 17.4 30.4 42.8 15.2 4.3 22.4 36.3 48.1 32.6 26.6
LOS B C D B A C D D C C
Approach Delay 28.4 17.1 34.7 39.0
Approach LOS C B C D
Intersection Summary
Cycle Length: 100
Actuated Cycle Length: 100
Offset: 62 (62%), Referenced to phase 4:EBTL and 8:WBTL, Start of Yellow
Natural Cycle: 80
Control Type: Actuated-Coordinated
Maximum v/c Ratio: 0.82
Intersection Signal Delay: 29.8 Intersection LOS: C
Intersection Capacity Utilization 90.5% ICU Level of Service E
Analysis Period (min) 15
Splits and Phases: 1: East Hanover Ave & US 202
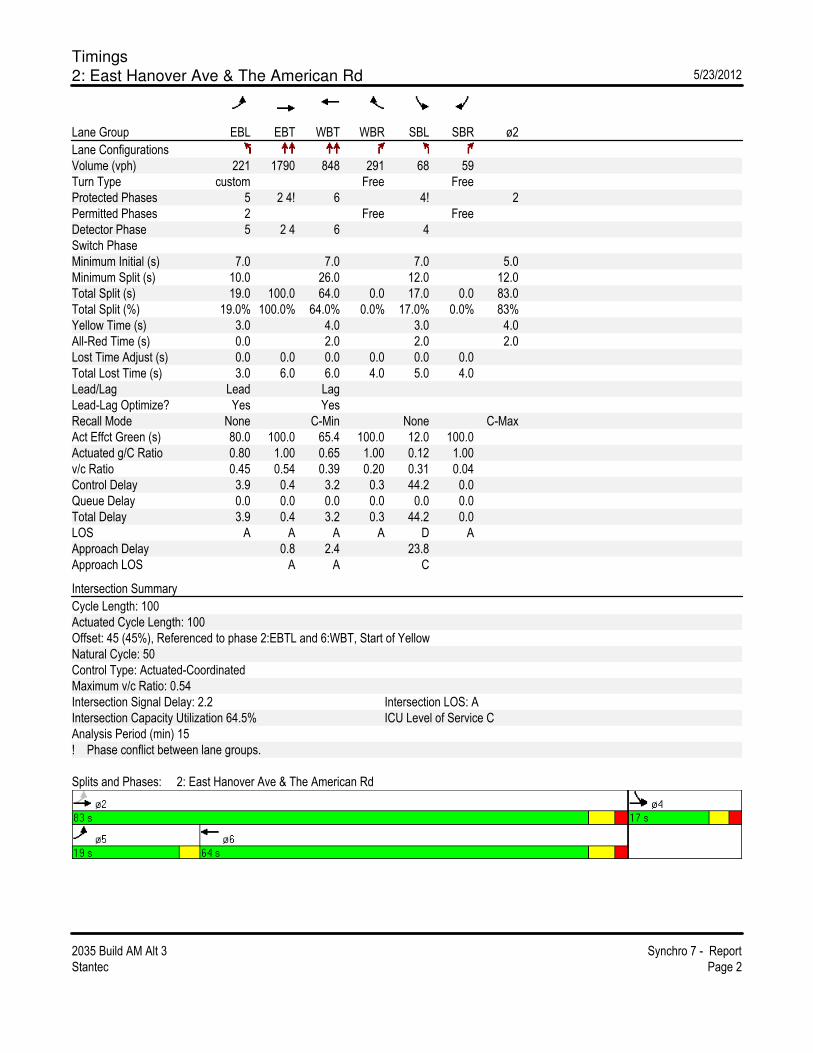
Timings
2: East Hanover Ave & The American Rd 5/23/2012
2035 Build AM Alt 3 Synchro 7 - Report
Stantec Page 2
Lane Group EBL EBT WBT WBR SBL SBR ø2
Lane Configurations
Volume (vph) 221 1790 848 291 68 59
Turn Type custom Free Free
Protected Phases 5 2 4! 6 4! 2
Permitted Phases 2 Free Free
Detector Phase 5 2 4 6 4
Switch Phase
Minimum Initial (s) 7.0 7.0 7.0 5.0
Minimum Split (s) 10.0 26.0 12.0 12.0
Total Split (s) 19.0 100.0 64.0 0.0 17.0 0.0 83.0
Total Split (%) 19.0% 100.0% 64.0% 0.0% 17.0% 0.0% 83%
Yellow Time (s) 3.0 4.0 3.0 4.0
All-Red Time (s) 0.0 2.0 2.0 2.0
Lost Time Adjust (s) 0.0 0.0 0.0 0.0 0.0 0.0
Total Lost Time (s) 3.0 6.0 6.0 4.0 5.0 4.0
Lead/Lag Lead Lag
Lead-Lag Optimize? Yes Yes
Recall Mode None C-Min None C-Max
Act Effct Green (s) 80.0 100.0 65.4 100.0 12.0 100.0
Actuated g/C Ratio 0.80 1.00 0.65 1.00 0.12 1.00
v/c Ratio 0.45 0.54 0.39 0.20 0.31 0.04
Control Delay 3.9 0.4 3.2 0.3 44.2 0.0
Queue Delay 0.0 0.0 0.0 0.0 0.0 0.0
Total Delay 3.9 0.4 3.2 0.3 44.2 0.0
LOS A A A A D A
Approach Delay 0.8 2.4 23.8
Approach LOS A A C
Intersection Summary
Cycle Length: 100
Actuated Cycle Length: 100
Offset: 45 (45%), Referenced to phase 2:EBTL and 6:WBT, Start of Yellow
Natural Cycle: 50
Control Type: Actuated-Coordinated
Maximum v/c Ratio: 0.54
Intersection Signal Delay: 2.2 Intersection LOS: A
Intersection Capacity Utilization 64.5% ICU Level of Service C
Analysis Period (min) 15
! Phase conflict between lane groups.
Splits and Phases: 2: East Hanover Ave & The American Rd
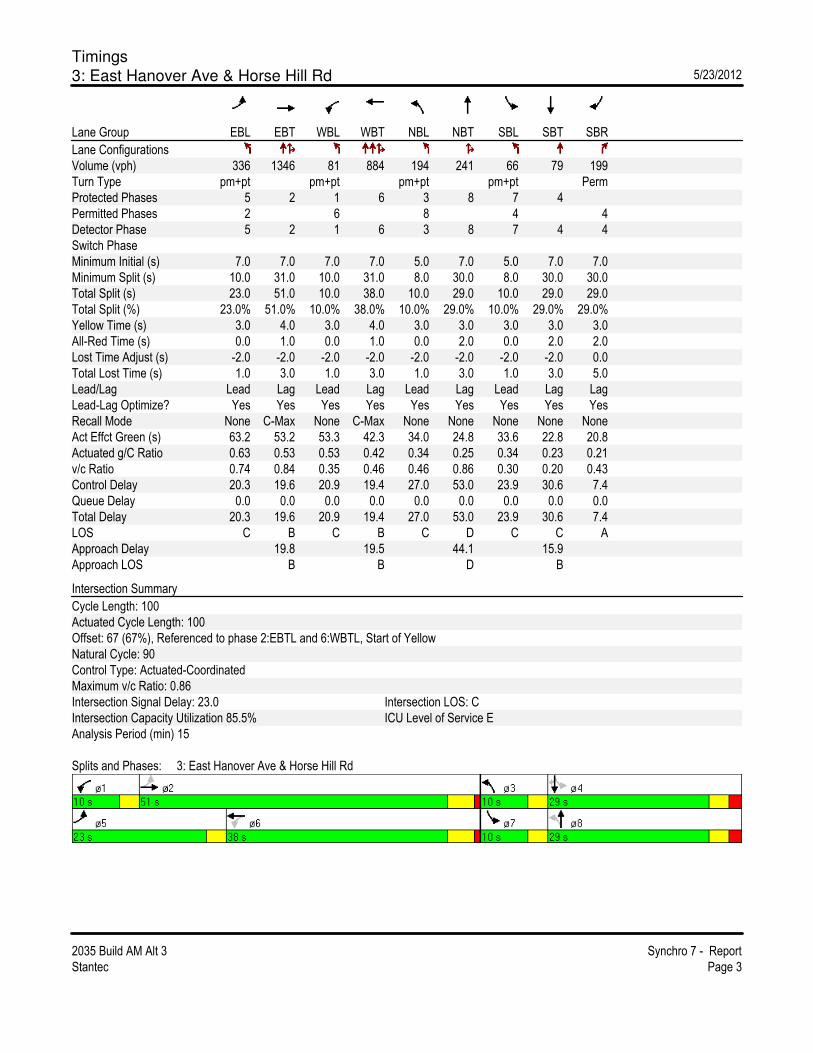
Timings
3: East Hanover Ave & Horse Hill Rd 5/23/2012
2035 Build AM Alt 3 Synchro 7 - Report
Stantec Page 3
Lane Group EBL EBT WBL WBT NBL NBT SBL SBT SBR
Lane Configurations
Volume (vph) 336 1346 81 884 194 241 66 79 199
Turn Type pm+pt pm+pt pm+pt pm+pt Perm
Protected Phases 5 2 1 6 3 8 7 4
Permitted Phases 2 6 8 4 4
Detector Phase 5 2 1 6 3 8 7 4 4
Switch Phase
Minimum Initial (s) 7.0 7.0 7.0 7.0 5.0 7.0 5.0 7.0 7.0
Minimum Split (s) 10.0 31.0 10.0 31.0 8.0 30.0 8.0 30.0 30.0
Total Split (s) 23.0 51.0 10.0 38.0 10.0 29.0 10.0 29.0 29.0
Total Split (%) 23.0% 51.0% 10.0% 38.0% 10.0% 29.0% 10.0% 29.0% 29.0%
Yellow Time (s) 3.0 4.0 3.0 4.0 3.0 3.0 3.0 3.0 3.0
All-Red Time (s) 0.0 1.0 0.0 1.0 0.0 2.0 0.0 2.0 2.0
Lost Time Adjust (s) -2.0 -2.0 -2.0 -2.0 -2.0 -2.0 -2.0 -2.0 0.0
Total Lost Time (s) 1.0 3.0 1.0 3.0 1.0 3.0 1.0 3.0 5.0
Lead/Lag Lead Lag Lead Lag Lead Lag Lead Lag Lag
Lead-Lag Optimize? Yes Yes Yes Yes Yes Yes Yes Yes Yes
Recall Mode None C-Max None C-Max None None None None None
Act Effct Green (s) 63.2 53.2 53.3 42.3 34.0 24.8 33.6 22.8 20.8
Actuated g/C Ratio 0.63 0.53 0.53 0.42 0.34 0.25 0.34 0.23 0.21
v/c Ratio 0.74 0.84 0.35 0.46 0.46 0.86 0.30 0.20 0.43
Control Delay 20.3 19.6 20.9 19.4 27.0 53.0 23.9 30.6 7.4
Queue Delay 0.0 0.0 0.0 0.0 0.0 0.0 0.0 0.0 0.0
Total Delay 20.3 19.6 20.9 19.4 27.0 53.0 23.9 30.6 7.4
LOS C B C B C D C C A
Approach Delay 19.8 19.5 44.1 15.9
Approach LOS B B D B
Intersection Summary
Cycle Length: 100
Actuated Cycle Length: 100
Offset: 67 (67%), Referenced to phase 2:EBTL and 6:WBTL, Start of Yellow
Natural Cycle: 90
Control Type: Actuated-Coordinated
Maximum v/c Ratio: 0.86
Intersection Signal Delay: 23.0 Intersection LOS: C
Intersection Capacity Utilization 85.5% ICU Level of Service E
Analysis Period (min) 15
Splits and Phases: 3: East Hanover Ave & Horse Hill Rd

HCM Unsignalized Intersection Capacity Analysis
4: East Hanover Ave & Monroe St 5/23/2012
2035 Build AM Alt 3 Synchro 7 - Report
Stantec Page 4
Movement EBT EBR WBL WBT NBL NBR
Lane Configurations
Volume (veh/h) 1518 4 28 1025 3 126
Sign Control Free Free Stop
Grade 0% 0% 0%
Peak Hour Factor 0.95 0.95 0.95 0.95 0.95 0.95
Hourly flow rate (vph) 1598 4 29 1079 3 133
Pedestrians 1
Lane Width (ft) 12.0
Walking Speed (ft/s) 4.0
Percent Blockage 0
Right turn flare (veh)
Median type None TWLTL
Median storage veh) 2
Upstream signal (ft) 161 847
pX, platoon unblocked 0.73 0.78 0.73
vC, conflicting volume 1602 2198 802
vC1, stage 1 conf vol 1600
vC2, stage 2 conf vol 598
vCu, unblocked vol 1076 1377 0
tC, single (s) 4.1 6.8 6.9
tC, 2 stage (s) 5.8
tF (s) 2.2 3.5 3.3
p0 queue free % 94 98 83
cM capacity (veh/h) 468 204 787
Direction, Lane # EB 1 EB 2 WB 1 WB 2 NB 1
Volume Total 1065 537 389 719 136
Volume Left 0 0 29 0 3
Volume Right 0 4 0 0 133
cSH 1700 1700 468 1700 738
Volume to Capacity 0.63 0.32 0.06 0.42 0.18
Queue Length 95th (ft) 0 0 5 0 17
Control Delay (s) 0.0 0.0 2.0 0.0 11.0
Lane LOS A B
Approach Delay (s) 0.0 0.7 11.0
Approach LOS B
Intersection Summary
Average Delay 0.8
Intersection Capacity Utilization 63.4% ICU Level of Service B
Analysis Period (min) 15
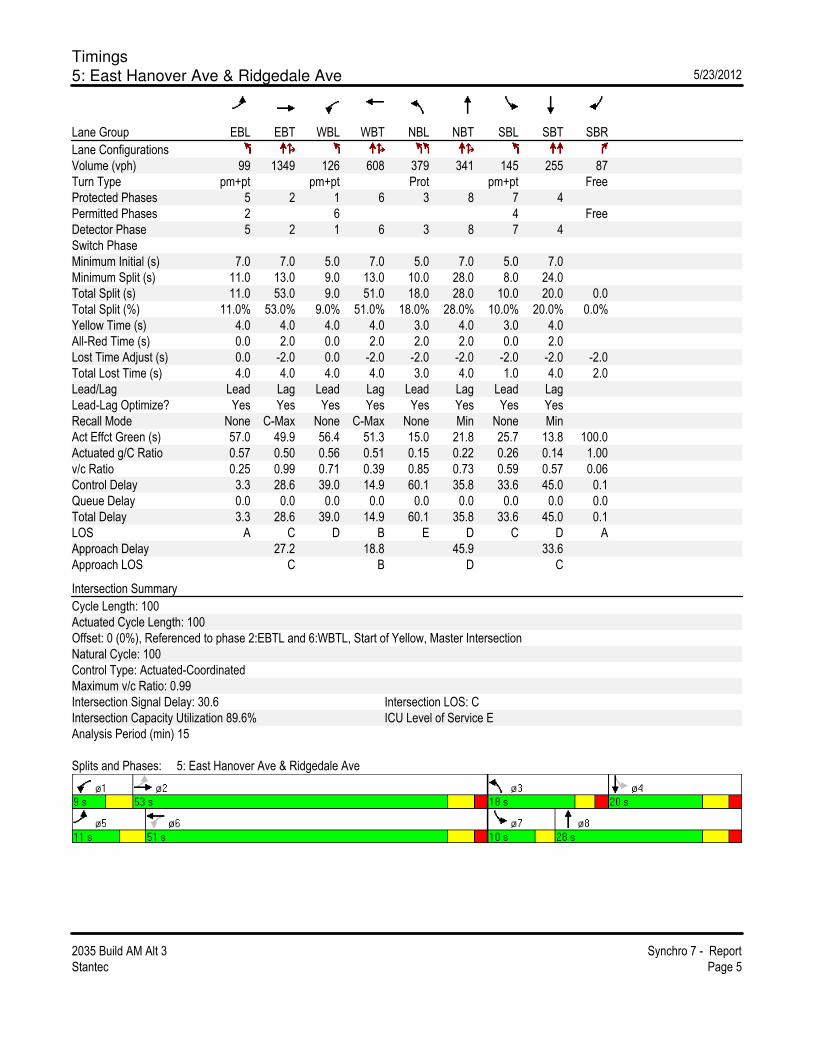
Timings
5: East Hanover Ave & Ridgedale Ave 5/23/2012
2035 Build AM Alt 3 Synchro 7 - Report
Stantec Page 5
Lane Group EBL EBT WBL WBT NBL NBT SBL SBT SBR
Lane Configurations
Volume (vph) 99 1349 126 608 379 341 145 255 87
Turn Type pm+pt pm+pt Prot pm+pt Free
Protected Phases 5 2 1 6 3 8 7 4
Permitted Phases 2 6 4 Free
Detector Phase 5 2 1 6 3 8 7 4
Switch Phase
Minimum Initial (s) 7.0 7.0 5.0 7.0 5.0 7.0 5.0 7.0
Minimum Split (s) 11.0 13.0 9.0 13.0 10.0 28.0 8.0 24.0
Total Split (s) 11.0 53.0 9.0 51.0 18.0 28.0 10.0 20.0 0.0
Total Split (%) 11.0% 53.0% 9.0% 51.0% 18.0% 28.0% 10.0% 20.0% 0.0%
Yellow Time (s) 4.0 4.0 4.0 4.0 3.0 4.0 3.0 4.0
All-Red Time (s) 0.0 2.0 0.0 2.0 2.0 2.0 0.0 2.0
Lost Time Adjust (s) 0.0 -2.0 0.0 -2.0 -2.0 -2.0 -2.0 -2.0 -2.0
Total Lost Time (s) 4.0 4.0 4.0 4.0 3.0 4.0 1.0 4.0 2.0
Lead/Lag Lead Lag Lead Lag Lead Lag Lead Lag
Lead-Lag Optimize? Yes Yes Yes Yes Yes Yes Yes Yes
Recall Mode None C-Max None C-Max None Min None Min
Act Effct Green (s) 57.0 49.9 56.4 51.3 15.0 21.8 25.7 13.8 100.0
Actuated g/C Ratio 0.57 0.50 0.56 0.51 0.15 0.22 0.26 0.14 1.00
v/c Ratio 0.25 0.99 0.71 0.39 0.85 0.73 0.59 0.57 0.06
Control Delay 3.3 28.6 39.0 14.9 60.1 35.8 33.6 45.0 0.1
Queue Delay 0.0 0.0 0.0 0.0 0.0 0.0 0.0 0.0 0.0
Total Delay 3.3 28.6 39.0 14.9 60.1 35.8 33.6 45.0 0.1
LOS A C D B E D C D A
Approach Delay 27.2 18.8 45.9 33.6
Approach LOS C B D C
Intersection Summary
Cycle Length: 100
Actuated Cycle Length: 100
Offset: 0 (0%), Referenced to phase 2:EBTL and 6:WBTL, Start of Yellow, Master Intersection
Natural Cycle: 100
Control Type: Actuated-Coordinated
Maximum v/c Ratio: 0.99
Intersection Signal Delay: 30.6 Intersection LOS: C
Intersection Capacity Utilization 89.6% ICU Level of Service E
Analysis Period (min) 15
Splits and Phases: 5: East Hanover Ave & Ridgedale Ave

Timings
6: East Hanover Ave & Library 5/23/2012
2035 Build AM Alt 3 Synchro 7 - Report
Stantec Page 6
Lane Group EBL EBT WBT SBL SBR
Lane Configurations
Volume (vph) 19 1651 805 1 6
Turn Type Perm Perm
Protected Phases 2 6 4
Permitted Phases 2 4
Detector Phase 2 2 6 4 4
Switch Phase
Minimum Initial (s) 7.0 7.0 7.0 7.0 7.0
Minimum Split (s) 29.0 29.0 29.0 28.0 28.0
Total Split (s) 72.0 72.0 72.0 28.0 28.0
Total Split (%) 72.0% 72.0% 72.0% 28.0% 28.0%
Yellow Time (s) 5.0 5.0 5.0 3.0 3.0
All-Red Time (s) 2.0 2.0 2.0 2.0 2.0
Lost Time Adjust (s) 0.0 -2.0 -2.0 -2.0 -2.0
Total Lost Time (s) 7.0 5.0 5.0 3.0 3.0
Lead/Lag
Lead-Lag Optimize?
Recall Mode C-Max C-Max C-Max None None
Act Effct Green (s) 96.6 96.6 9.0 9.0
Actuated g/C Ratio 0.97 0.97 0.09 0.09
v/c Ratio 0.52 0.24 0.01 0.04
Control Delay 0.3 0.6 42.0 25.5
Queue Delay 0.0 0.0 0.0 0.0
Total Delay 0.3 0.6 42.0 25.5
LOS A A D C
Approach Delay 0.3 0.6 27.9
Approach LOS A A C
Intersection Summary
Cycle Length: 100
Actuated Cycle Length: 100
Offset: 74 (74%), Referenced to phase 2:EBTL and 6:WBT, Start of Yellow
Natural Cycle: 70
Control Type: Actuated-Coordinated
Maximum v/c Ratio: 0.52
Intersection Signal Delay: 0.5 Intersection LOS: A
Intersection Capacity Utilization 72.4% ICU Level of Service C
Analysis Period (min) 15
Splits and Phases: 6: East Hanover Ave & Library
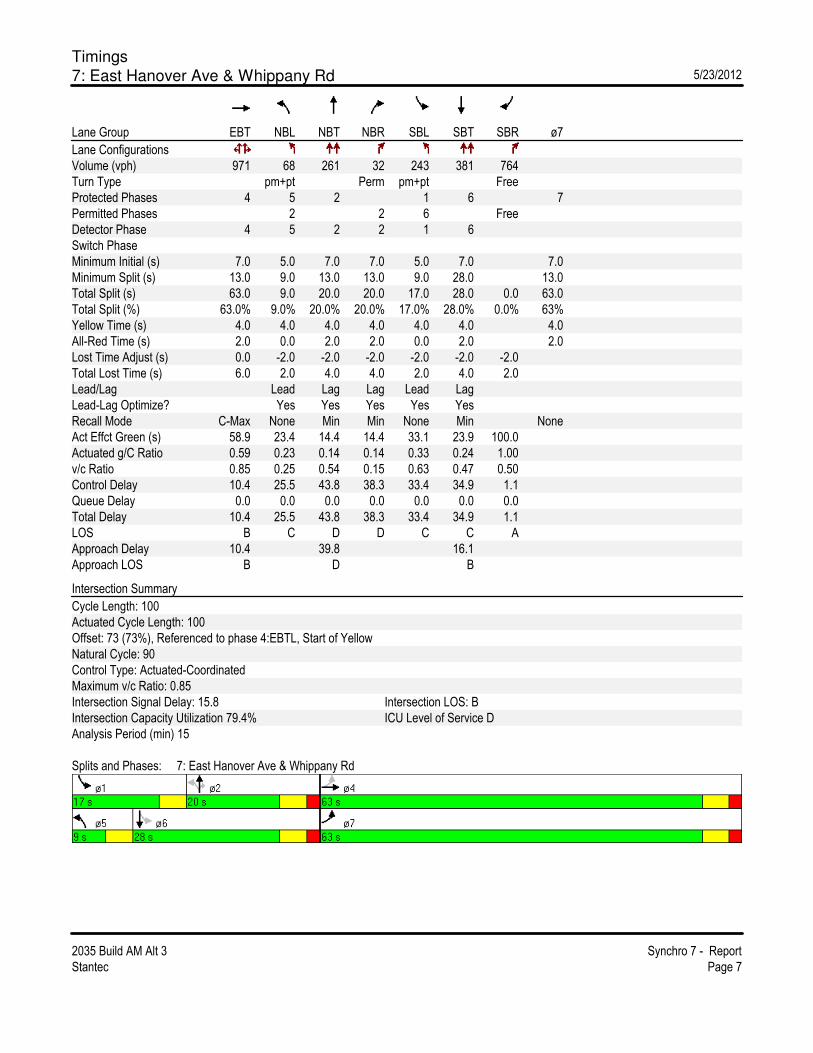
Timings
7: East Hanover Ave & Whippany Rd 5/23/2012
2035 Build AM Alt 3 Synchro 7 - Report
Stantec Page 7
Lane Group EBT NBL NBT NBR SBL SBT SBR ø7
Lane Configurations
Volume (vph) 971 68 261 32 243 381 764
Turn Type pm+pt Perm pm+pt Free
Protected Phases 4 5 2 1 6 7
Permitted Phases 2 2 6 Free
Detector Phase 4 5 2 2 1 6
Switch Phase
Minimum Initial (s) 7.0 5.0 7.0 7.0 5.0 7.0 7.0
Minimum Split (s) 13.0 9.0 13.0 13.0 9.0 28.0 13.0
Total Split (s) 63.0 9.0 20.0 20.0 17.0 28.0 0.0 63.0
Total Split (%) 63.0% 9.0% 20.0% 20.0% 17.0% 28.0% 0.0% 63%
Yellow Time (s) 4.0 4.0 4.0 4.0 4.0 4.0 4.0
All-Red Time (s) 2.0 0.0 2.0 2.0 0.0 2.0 2.0
Lost Time Adjust (s) 0.0 -2.0 -2.0 -2.0 -2.0 -2.0 -2.0
Total Lost Time (s) 6.0 2.0 4.0 4.0 2.0 4.0 2.0
Lead/Lag Lead Lag Lag Lead Lag
Lead-Lag Optimize? Yes Yes Yes Yes Yes
Recall Mode C-Max None Min Min None Min None
Act Effct Green (s) 58.9 23.4 14.4 14.4 33.1 23.9 100.0
Actuated g/C Ratio 0.59 0.23 0.14 0.14 0.33 0.24 1.00
v/c Ratio 0.85 0.25 0.54 0.15 0.63 0.47 0.50
Control Delay 10.4 25.5 43.8 38.3 33.4 34.9 1.1
Queue Delay 0.0 0.0 0.0 0.0 0.0 0.0 0.0
Total Delay 10.4 25.5 43.8 38.3 33.4 34.9 1.1
LOS B C D D C C A
Approach Delay 10.4 39.8 16.1
Approach LOS B D B
Intersection Summary
Cycle Length: 100
Actuated Cycle Length: 100
Offset: 73 (73%), Referenced to phase 4:EBTL, Start of Yellow
Natural Cycle: 90
Control Type: Actuated-Coordinated
Maximum v/c Ratio: 0.85
Intersection Signal Delay: 15.8 Intersection LOS: B
Intersection Capacity Utilization 79.4% ICU Level of Service D
Analysis Period (min) 15
Splits and Phases: 7: East Hanover Ave & Whippany Rd

Timings
46: East Hanover Ave & Big Box Driveway 5/23/2012
2035 Build AM Alt 3 Synchro 7 - Report
Stantec Page 8
Lane Group EBL EBT WBT SBL SBR
Lane Configurations
Volume (vph) 31 1507 1015 15 9
Turn Type pm+pt Perm
Protected Phases 7 4 8 6
Permitted Phases 4 6
Detector Phase 7 4 8 6 6
Switch Phase
Minimum Initial (s) 5.0 5.0 5.0 5.0 5.0
Minimum Split (s) 10.0 22.0 22.0 26.0 26.0
Total Split (s) 10.0 73.0 63.0 27.0 27.0
Total Split (%) 10.0% 73.0% 63.0% 27.0% 27.0%
Yellow Time (s) 3.0 4.0 4.0 4.0 4.0
All-Red Time (s) 0.0 2.0 2.0 2.0 2.0
Lost Time Adjust (s) -2.0 -2.0 -2.0 -2.0 -2.0
Total Lost Time (s) 1.0 4.0 4.0 4.0 4.0
Lead/Lag Lead Lag
Lead-Lag Optimize? Yes Yes
Recall Mode None C-Max C-Max Max Max
Act Effct Green (s) 72.0 69.0 63.4 23.0 23.0
Actuated g/C Ratio 0.72 0.69 0.63 0.23 0.23
v/c Ratio 0.09 0.67 0.50 0.04 0.03
Control Delay 2.4 4.9 9.4 30.4 16.1
Queue Delay 0.0 0.0 0.0 0.0 0.0
Total Delay 2.4 4.9 9.4 30.4 16.1
LOS A A A C B
Approach Delay 4.9 9.4 24.9
Approach LOS A A C
Intersection Summary
Cycle Length: 100
Actuated Cycle Length: 100
Offset: 85 (85%), Referenced to phase 4:EBTL and 8:WBT, Start of Yellow
Natural Cycle: 60
Control Type: Actuated-Coordinated
Maximum v/c Ratio: 0.67
Intersection Signal Delay: 6.9 Intersection LOS: A
Intersection Capacity Utilization 52.5% ICU Level of Service A
Analysis Period (min) 15
Splits and Phases: 46: East Hanover Ave & Big Box Driveway

Timings
1: East Hanover Ave & US 202 5/23/2012
2035 Build PM Alt 3 Synchro 7 - Report
Stantec Page 1
Lane Group EBL EBT WBL WBT WBR NBL NBT SBL SBT SBR
Lane Configurations
Volume (vph) 171 595 258 1230 298 210 544 319 391 208
Turn Type pm+pt pm+pt Perm pm+pt Prot Free
Protected Phases 7 4 3 8 5 2 1 6
Permitted Phases 4 8 8 2 Free
Detector Phase 7 4 3 8 8 5 2 1 6
Switch Phase
Minimum Initial (s) 5.0 7.0 5.0 7.0 7.0 5.0 5.0 5.0 5.0
Minimum Split (s) 8.0 29.0 8.0 29.0 29.0 8.0 29.0 10.0 32.0
Total Split (s) 11.0 40.0 14.0 43.0 43.0 15.0 28.0 18.0 31.0 0.0
Total Split (%) 11.0% 40.0% 14.0% 43.0% 43.0% 15.0% 28.0% 18.0% 31.0% 0.0%
Yellow Time (s) 3.0 3.0 3.0 3.0 3.0 3.0 3.0 3.0 3.0
All-Red Time (s) 0.0 2.0 0.0 2.0 2.0 0.0 2.0 2.0 2.0
Lost Time Adjust (s) -2.0 -3.0 -2.0 -4.0 0.0 -2.0 -3.0 -3.0 -3.0 0.0
Total Lost Time (s) 1.0 2.0 1.0 1.0 5.0 1.0 2.0 2.0 2.0 4.0
Lead/Lag Lead Lag Lead Lag Lag Lead Lag Lead Lag
Lead-Lag Optimize? Yes Yes Yes Yes Yes Yes Yes Yes Yes
Recall Mode None C-Max None C-Max C-Max None Min None Min
Act Effct Green (s) 50.6 39.5 54.3 43.2 39.2 39.5 25.1 15.6 28.3 100.0
Actuated g/C Ratio 0.51 0.40 0.54 0.43 0.39 0.40 0.25 0.16 0.28 1.00
v/c Ratio 0.71 0.49 0.65 0.85 0.44 0.70 0.80 0.63 0.76 0.14
Control Delay 34.5 23.9 17.3 13.2 2.7 32.2 41.2 45.4 43.3 0.2
Queue Delay 0.0 0.0 0.0 0.0 0.0 0.0 0.0 0.0 0.0 0.0
Total Delay 34.5 23.9 17.3 13.2 2.7 32.2 41.2 45.4 43.3 0.2
LOS C C B B A C D D D A
Approach Delay 26.1 12.1 39.0 34.3
Approach LOS C B D C
Intersection Summary
Cycle Length: 100
Actuated Cycle Length: 100
Offset: 41 (41%), Referenced to phase 4:EBTL and 8:WBTL, Start of Yellow
Natural Cycle: 80
Control Type: Actuated-Coordinated
Maximum v/c Ratio: 0.85
Intersection Signal Delay: 24.7 Intersection LOS: C
Intersection Capacity Utilization 89.6% ICU Level of Service E
Analysis Period (min) 15
Splits and Phases: 1: East Hanover Ave & US 202
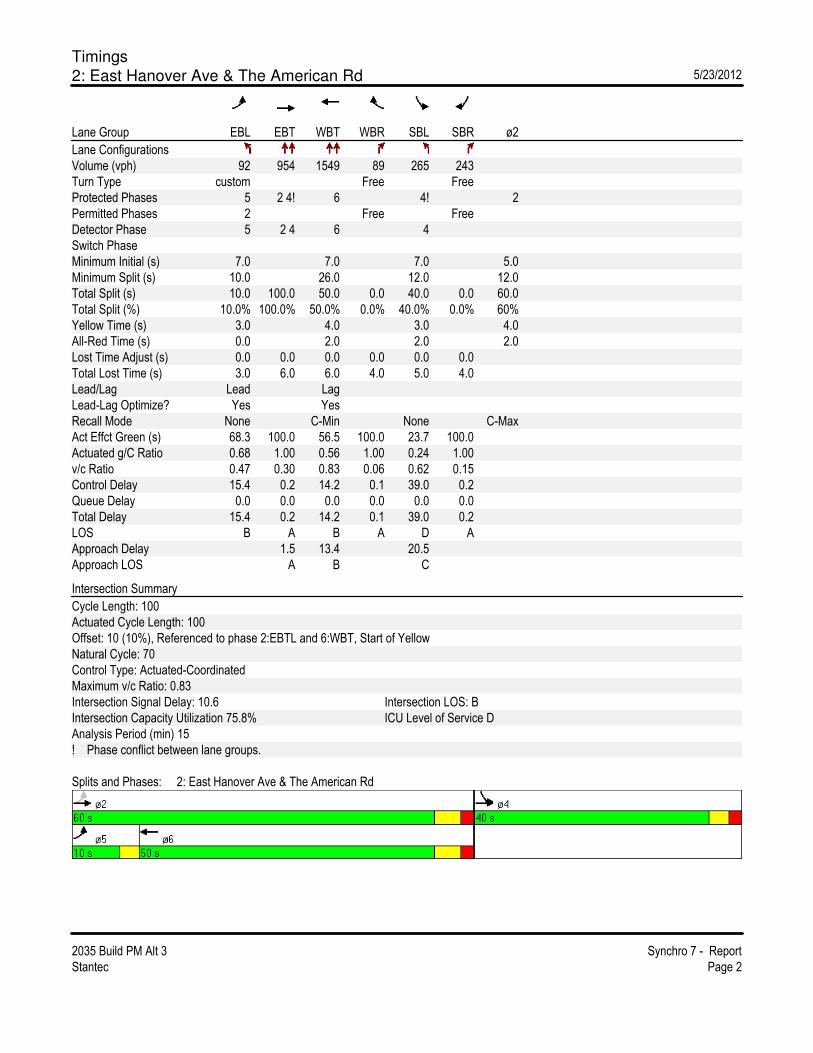
Timings
2: East Hanover Ave & The American Rd 5/23/2012
2035 Build PM Alt 3 Synchro 7 - Report
Stantec Page 2
Lane Group EBL EBT WBT WBR SBL SBR ø2
Lane Configurations
Volume (vph) 92 954 1549 89 265 243
Turn Type custom Free Free
Protected Phases 5 2 4! 6 4! 2
Permitted Phases 2 Free Free
Detector Phase 5 2 4 6 4
Switch Phase
Minimum Initial (s) 7.0 7.0 7.0 5.0
Minimum Split (s) 10.0 26.0 12.0 12.0
Total Split (s) 10.0 100.0 50.0 0.0 40.0 0.0 60.0
Total Split (%) 10.0% 100.0% 50.0% 0.0% 40.0% 0.0% 60%
Yellow Time (s) 3.0 4.0 3.0 4.0
All-Red Time (s) 0.0 2.0 2.0 2.0
Lost Time Adjust (s) 0.0 0.0 0.0 0.0 0.0 0.0
Total Lost Time (s) 3.0 6.0 6.0 4.0 5.0 4.0
Lead/Lag Lead Lag
Lead-Lag Optimize? Yes Yes
Recall Mode None C-Min None C-Max
Act Effct Green (s) 68.3 100.0 56.5 100.0 23.7 100.0
Actuated g/C Ratio 0.68 1.00 0.56 1.00 0.24 1.00
v/c Ratio 0.47 0.30 0.83 0.06 0.62 0.15
Control Delay 15.4 0.2 14.2 0.1 39.0 0.2
Queue Delay 0.0 0.0 0.0 0.0 0.0 0.0
Total Delay 15.4 0.2 14.2 0.1 39.0 0.2
LOS B A B A D A
Approach Delay 1.5 13.4 20.5
Approach LOS A B C
Intersection Summary
Cycle Length: 100
Actuated Cycle Length: 100
Offset: 10 (10%), Referenced to phase 2:EBTL and 6:WBT, Start of Yellow
Natural Cycle: 70
Control Type: Actuated-Coordinated
Maximum v/c Ratio: 0.83
Intersection Signal Delay: 10.6 Intersection LOS: B
Intersection Capacity Utilization 75.8% ICU Level of Service D
Analysis Period (min) 15
! Phase conflict between lane groups.
Splits and Phases: 2: East Hanover Ave & The American Rd

Timings
3: East Hanover Ave & Horse Hill Rd 5/23/2012
2035 Build PM Alt 3 Synchro 7 - Report
Stantec Page 3
Lane Group EBL EBT WBL WBT NBL NBT SBL SBT SBR
Lane Configurations
Volume (vph) 293 824 165 1474 95 138 165 220 291
Turn Type pm+pt pm+pt pm+pt pm+pt Perm
Protected Phases 5 2 1 6 3 8 7 4
Permitted Phases 2 6 8 4 4
Detector Phase 5 2 1 6 3 8 7 4 4
Switch Phase
Minimum Initial (s) 7.0 7.0 7.0 7.0 5.0 7.0 5.0 7.0 7.0
Minimum Split (s) 10.0 31.0 10.0 31.0 8.0 27.0 8.0 27.0 27.0
Total Split (s) 17.0 49.0 13.0 45.0 10.0 28.0 10.0 27.0 27.0
Total Split (%) 17.0% 49.0% 13.0% 45.0% 10.0% 28.0% 10.0% 27.0% 27.0%
Yellow Time (s) 3.0 4.0 3.0 4.0 3.0 3.0 3.0 3.0 3.0
All-Red Time (s) 0.0 1.0 0.0 1.0 0.0 2.0 0.0 2.0 2.0
Lost Time Adjust (s) -2.0 -2.0 -2.0 -2.0 -2.0 -2.0 -2.0 -2.0 0.0
Total Lost Time (s) 1.0 3.0 1.0 3.0 1.0 3.0 1.0 3.0 5.0
Lead/Lag Lead Lag Lead Lag Lead Lag Lead Lag Lag
Lead-Lag Optimize? Yes Yes Yes Yes Yes Yes Yes Yes Yes
Recall Mode None C-Max None C-Max None None None None None
Act Effct Green (s) 65.9 51.9 59.0 46.0 31.0 20.1 31.3 22.1 20.1
Actuated g/C Ratio 0.66 0.52 0.59 0.46 0.31 0.20 0.31 0.22 0.20
v/c Ratio 0.84 0.61 0.49 0.71 0.33 0.61 0.60 0.58 0.58
Control Delay 39.5 18.5 13.9 11.4 26.2 38.7 33.8 40.7 10.8
Queue Delay 0.0 0.0 0.0 0.0 0.0 0.0 0.0 0.0 0.0
Total Delay 39.5 18.5 13.9 11.4 26.2 38.7 33.8 40.7 10.8
LOS D B B B C D C D B
Approach Delay 23.2 11.7 34.9 26.1
Approach LOS C B C C
Intersection Summary
Cycle Length: 100
Actuated Cycle Length: 100
Offset: 53 (53%), Referenced to phase 2:EBTL and 6:WBTL, Start of Yellow
Natural Cycle: 80
Control Type: Actuated-Coordinated
Maximum v/c Ratio: 0.84
Intersection Signal Delay: 19.7 Intersection LOS: B
Intersection Capacity Utilization 80.4% ICU Level of Service D
Analysis Period (min) 15
Splits and Phases: 3: East Hanover Ave & Horse Hill Rd
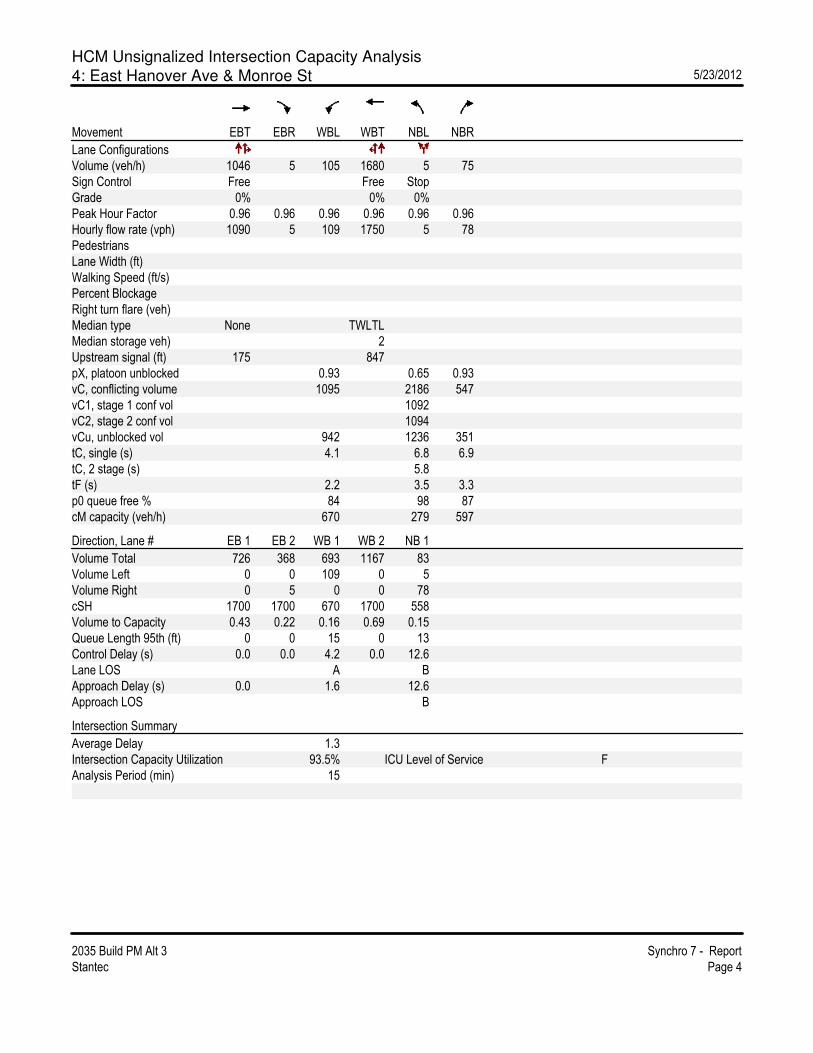
HCM Unsignalized Intersection Capacity Analysis
4: East Hanover Ave & Monroe St 5/23/2012
2035 Build PM Alt 3 Synchro 7 - Report
Stantec Page 4
Movement EBT EBR WBL WBT NBL NBR
Lane Configurations
Volume (veh/h) 1046 5 105 1680 5 75
Sign Control Free Free Stop
Grade 0% 0% 0%
Peak Hour Factor 0.96 0.96 0.96 0.96 0.96 0.96
Hourly flow rate (vph) 1090 5 109 1750 5 78
Pedestrians
Lane Width (ft)
Walking Speed (ft/s)
Percent Blockage
Right turn flare (veh)
Median type None TWLTL
Median storage veh) 2
Upstream signal (ft) 175 847
pX, platoon unblocked 0.93 0.65 0.93
vC, conflicting volume 1095 2186 547
vC1, stage 1 conf vol 1092
vC2, stage 2 conf vol 1094
vCu, unblocked vol 942 1236 351
tC, single (s) 4.1 6.8 6.9
tC, 2 stage (s) 5.8
tF (s) 2.2 3.5 3.3
p0 queue free % 84 98 87
cM capacity (veh/h) 670 279 597
Direction, Lane # EB 1 EB 2 WB 1 WB 2 NB 1
Volume Total 726 368 693 1167 83
Volume Left 0 0 109 0 5
Volume Right 0 5 0 0 78
cSH 1700 1700 670 1700 558
Volume to Capacity 0.43 0.22 0.16 0.69 0.15
Queue Length 95th (ft) 0 0 15 0 13
Control Delay (s) 0.0 0.0 4.2 0.0 12.6
Lane LOS A B
Approach Delay (s) 0.0 1.6 12.6
Approach LOS B
Intersection Summary
Average Delay 1.3
Intersection Capacity Utilization 93.5% ICU Level of Service F
Analysis Period (min) 15
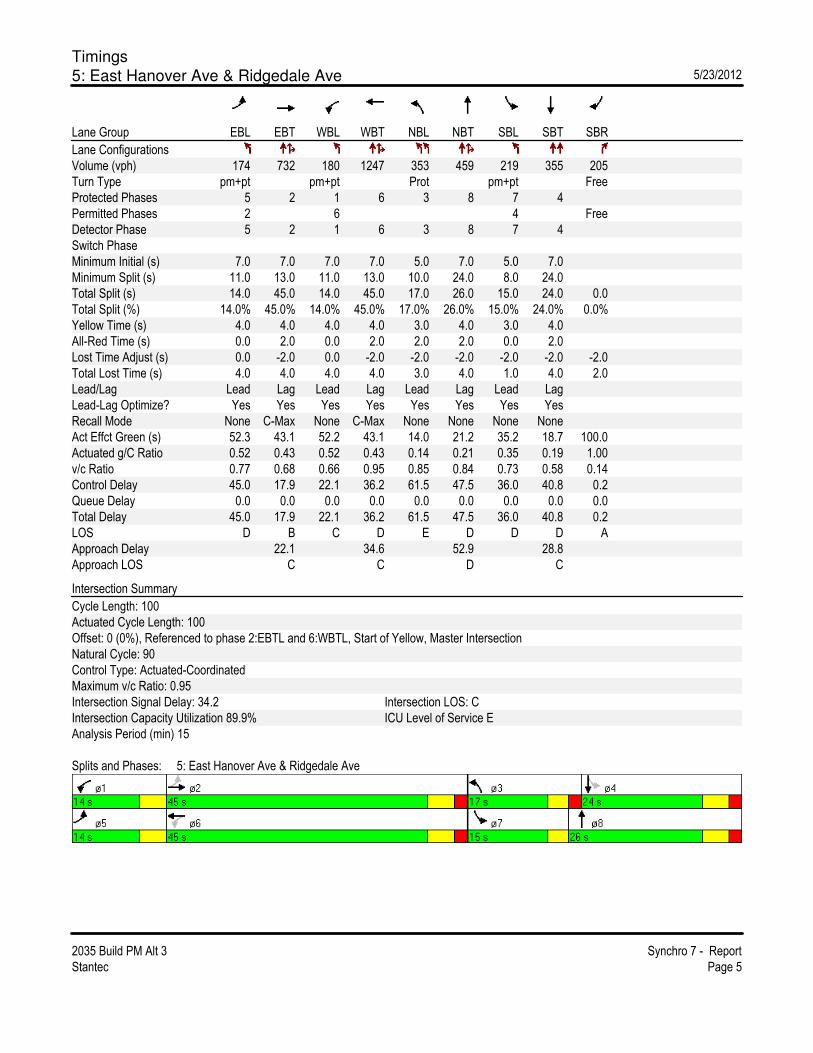
Timings
5: East Hanover Ave & Ridgedale Ave 5/23/2012
2035 Build PM Alt 3 Synchro 7 - Report
Stantec Page 5
Lane Group EBL EBT WBL WBT NBL NBT SBL SBT SBR
Lane Configurations
Volume (vph) 174 732 180 1247 353 459 219 355 205
Turn Type pm+pt pm+pt Prot pm+pt Free
Protected Phases 5 2 1 6 3 8 7 4
Permitted Phases 2 6 4 Free
Detector Phase 5 2 1 6 3 8 7 4
Switch Phase
Minimum Initial (s) 7.0 7.0 7.0 7.0 5.0 7.0 5.0 7.0
Minimum Split (s) 11.0 13.0 11.0 13.0 10.0 24.0 8.0 24.0
Total Split (s) 14.0 45.0 14.0 45.0 17.0 26.0 15.0 24.0 0.0
Total Split (%) 14.0% 45.0% 14.0% 45.0% 17.0% 26.0% 15.0% 24.0% 0.0%
Yellow Time (s) 4.0 4.0 4.0 4.0 3.0 4.0 3.0 4.0
All-Red Time (s) 0.0 2.0 0.0 2.0 2.0 2.0 0.0 2.0
Lost Time Adjust (s) 0.0 -2.0 0.0 -2.0 -2.0 -2.0 -2.0 -2.0 -2.0
Total Lost Time (s) 4.0 4.0 4.0 4.0 3.0 4.0 1.0 4.0 2.0
Lead/Lag Lead Lag Lead Lag Lead Lag Lead Lag
Lead-Lag Optimize? Yes Yes Yes Yes Yes Yes Yes Yes
Recall Mode None C-Max None C-Max None None None None
Act Effct Green (s) 52.3 43.1 52.2 43.1 14.0 21.2 35.2 18.7 100.0
Actuated g/C Ratio 0.52 0.43 0.52 0.43 0.14 0.21 0.35 0.19 1.00
v/c Ratio 0.77 0.68 0.66 0.95 0.85 0.84 0.73 0.58 0.14
Control Delay 45.0 17.9 22.1 36.2 61.5 47.5 36.0 40.8 0.2
Queue Delay 0.0 0.0 0.0 0.0 0.0 0.0 0.0 0.0 0.0
Total Delay 45.0 17.9 22.1 36.2 61.5 47.5 36.0 40.8 0.2
LOS D B C D E D D D A
Approach Delay 22.1 34.6 52.9 28.8
Approach LOS C C D C
Intersection Summary
Cycle Length: 100
Actuated Cycle Length: 100
Offset: 0 (0%), Referenced to phase 2:EBTL and 6:WBTL, Start of Yellow, Master Intersection
Natural Cycle: 90
Control Type: Actuated-Coordinated
Maximum v/c Ratio: 0.95
Intersection Signal Delay: 34.2 Intersection LOS: C
Intersection Capacity Utilization 89.9% ICU Level of Service E
Analysis Period (min) 15
Splits and Phases: 5: East Hanover Ave & Ridgedale Ave

Timings
6: East Hanover Ave & Library 5/23/2012
2035 Build PM Alt 3 Synchro 7 - Report
Stantec Page 6
Lane Group EBL EBT WBT SBL SBR
Lane Configurations
Volume (vph) 55 1003 1468 54 91
Turn Type Perm Perm
Protected Phases 2 6 4
Permitted Phases 2 4
Detector Phase 2 2 6 4 4
Switch Phase
Minimum Initial (s) 7.0 7.0 7.0 7.0 7.0
Minimum Split (s) 29.0 29.0 29.0 28.0 28.0
Total Split (s) 72.0 72.0 72.0 28.0 28.0
Total Split (%) 72.0% 72.0% 72.0% 28.0% 28.0%
Yellow Time (s) 5.0 5.0 5.0 3.0 3.0
All-Red Time (s) 2.0 2.0 2.0 2.0 2.0
Lost Time Adjust (s) 0.0 -2.0 -2.0 -2.0 -2.0
Total Lost Time (s) 7.0 5.0 5.0 3.0 3.0
Lead/Lag
Lead-Lag Optimize?
Recall Mode C-Max C-Max C-Max None None
Act Effct Green (s) 84.0 84.0 11.4 11.4
Actuated g/C Ratio 0.84 0.84 0.11 0.11
v/c Ratio 0.51 0.55 0.28 0.44
Control Delay 1.5 3.1 43.1 29.3
Queue Delay 0.0 0.0 0.0 0.0
Total Delay 1.5 3.1 43.1 29.3
LOS A A D C
Approach Delay 1.5 3.1 34.4
Approach LOS A A C
Intersection Summary
Cycle Length: 100
Actuated Cycle Length: 100
Offset: 73 (73%), Referenced to phase 2:EBTL and 6:WBT, Start of Yellow
Natural Cycle: 70
Control Type: Actuated-Coordinated
Maximum v/c Ratio: 0.55
Intersection Signal Delay: 4.2 Intersection LOS: A
Intersection Capacity Utilization 82.0% ICU Level of Service E
Analysis Period (min) 15
Splits and Phases: 6: East Hanover Ave & Library

Timings
7: East Hanover Ave & Whippany Rd 5/23/2012
2035 Build PM Alt 3 Synchro 7 - Report
Stantec Page 7
Lane Group EBT NBL NBT NBR SBL SBT SBR ø7
Lane Configurations
Volume (vph) 540 281 308 36 261 351 1232
Turn Type pm+pt Perm pm+pt Free
Protected Phases 4 5 2 1 6 7
Permitted Phases 2 2 6 Free
Detector Phase 4 5 2 2 1 6
Switch Phase
Minimum Initial (s) 7.0 5.0 7.0 7.0 5.0 7.0 7.0
Minimum Split (s) 13.0 9.0 13.0 13.0 9.0 28.0 11.0
Total Split (s) 50.0 20.0 31.0 31.0 19.0 30.0 0.0 50.0
Total Split (%) 50.0% 20.0% 31.0% 31.0% 19.0% 30.0% 0.0% 50%
Yellow Time (s) 4.0 4.0 4.0 4.0 4.0 4.0 4.0
All-Red Time (s) 2.0 0.0 2.0 2.0 0.0 2.0 0.0
Lost Time Adjust (s) 0.0 -2.0 -2.0 -2.0 -2.0 -2.0 -2.0
Total Lost Time (s) 6.0 2.0 4.0 4.0 2.0 4.0 2.0
Lead/Lag Lead Lag Lag Lead Lag
Lead-Lag Optimize? Yes Yes Yes Yes Yes
Recall Mode C-Max None None None None None None
Act Effct Green (s) 53.2 37.7 18.5 18.5 35.8 17.6 100.0
Actuated g/C Ratio 0.53 0.38 0.18 0.18 0.36 0.18 1.00
v/c Ratio 0.59 0.68 0.50 0.13 0.60 0.59 0.81
Control Delay 16.0 30.2 38.9 33.8 27.4 41.5 4.6
Queue Delay 0.0 0.0 0.0 0.0 0.0 0.0 0.0
Total Delay 16.0 30.2 38.9 33.8 27.4 41.5 4.6
LOS B C D C C D A
Approach Delay 16.0 34.7 14.9
Approach LOS B C B
Intersection Summary
Cycle Length: 100
Actuated Cycle Length: 100
Offset: 4 (4%), Referenced to phase 4:EBTL, Start of Yellow
Natural Cycle: 65
Control Type: Actuated-Coordinated
Maximum v/c Ratio: 0.81
Intersection Signal Delay: 18.8 Intersection LOS: B
Intersection Capacity Utilization 66.8% ICU Level of Service C
Analysis Period (min) 15
Splits and Phases: 7: East Hanover Ave & Whippany Rd

Timings
46: East Hanover Ave & Big Box Driveway 5/23/2012
2035 Build PM Alt 3 Synchro 7 - Report
Stantec Page 8
Lane Group EBL EBT WBT SBL SBR
Lane Configurations
Volume (vph) 31 1029 1663 22 29
Turn Type pm+pt Perm
Protected Phases 7 4 8 6
Permitted Phases 4 6
Detector Phase 7 4 8 6 6
Switch Phase
Minimum Initial (s) 5.0 10.0 10.0 10.0 10.0
Minimum Split (s) 10.0 21.0 22.0 26.0 26.0
Total Split (s) 10.0 74.0 64.0 26.0 26.0
Total Split (%) 10.0% 74.0% 64.0% 26.0% 26.0%
Yellow Time (s) 3.0 4.0 4.0 4.0 4.0
All-Red Time (s) 0.0 2.0 2.0 2.0 2.0
Lost Time Adjust (s) -2.0 -2.0 -2.0 -2.0 -2.0
Total Lost Time (s) 1.0 4.0 4.0 4.0 4.0
Lead/Lag Lead Lag
Lead-Lag Optimize? Yes Yes
Recall Mode None C-Max C-Max None None
Act Effct Green (s) 89.4 88.0 82.6 12.0 12.0
Actuated g/C Ratio 0.89 0.88 0.83 0.12 0.12
v/c Ratio 0.12 0.36 0.63 0.11 0.15
Control Delay 3.4 5.4 1.5 40.8 15.7
Queue Delay 0.0 0.0 0.0 0.0 0.0
Total Delay 3.4 5.4 1.5 40.8 15.7
LOS A A A D B
Approach Delay 5.3 1.5 26.4
Approach LOS A A C
Intersection Summary
Cycle Length: 100
Actuated Cycle Length: 100
Offset: 41 (41%), Referenced to phase 4:EBTL and 8:WBT, Start of Yellow
Natural Cycle: 90
Control Type: Actuated-Coordinated
Maximum v/c Ratio: 0.63
Intersection Signal Delay: 3.4 Intersection LOS: A
Intersection Capacity Utilization 61.7% ICU Level of Service B
Analysis Period (min) 15
Splits and Phases: 46: East Hanover Ave & Big Box Driveway


