Annual Report 2017Year ended March 31, 2017
Yamah
a Co
rpo
ration
An
nu
al Rep
ort 2017

Sharing Passion & Performance
As the world’s largest comprehensive musical instruments manufacturer, the Yamaha Group
has expanded its business while responding to a wide variety of needs related to music,
education, and culture. During this expansion, the Group has continued to provide
technologies, products, and services that help inspire culture for people around the world.
Going forward, to become an enterprise whose existence is even more essential
in people’s daily lives, we will further enhance our brand power and performance by
creating new kinds of excitement and cultural inspiration.

Contents
9 To Our Stakeholders
10 Yamaha’s Highlights
12 Message from the President
22 Board of Directors
25 Research and Development and Intellectual Property
28 Corporate Social Responsibility (CSR)
32 Yamaha’s Approach to Human Resources
34 TOPICS: Messages from the Outside Directors
36 Corporate Governance
49 Risk Factors
53 Management’s Discussion and Analysis
68 Consolidated Financial Statements
Management Strategy
Growth Foundation
Financial Section
About Yamaha
Cover Story
105 Investor Information
106 Our History
108 Yamaha Product History
110 Our Business
114 Main Networks
116 Stock Information
117 Website Guide
page 8
page 24
page 52
page 104
page 2
Forward-looking statements
The plans and strategies regarding Yamaha’s future prospects presented in this annual report have been drawn up by the Company’s management based on information available at the time of writing and, therefore, are subject to risks and uncertainties. Accordingly, our actual performance may differ significantly from our predictions depending on changes in the operating and economic environments, demand trends, the value of key currencies, such as the U.S. dollar and the euro, technological advancements, and developments in intellectual property litigation.
Yamaha Corporation Annual Report 2017 1

Technology
Years of accumulated technological capabilities
Since its founding in 1887, Yamaha has spent many years cultivating technologies and sensibilities in the world of sound and music. These technologies and sensibilities have provided the core for the Company’s growth. Yamaha has also accumulated expertise and know-how in the manufacturing of acoustic musical instruments. Additionally, in the field of digital instruments and audio equipment, the Company has worked to develop ground-breaking electronics technology that makes use of such expertise and know-how.
As a result of these efforts, we have created unique products that combine traditional technologies and the latest digital technologies, thereby creating distinctive music and new value.
Key Dynamics
130
2

Human Resources
Number of employees in 31 countries around the world
The individual strengths of each employee are indispensable for supporting the Company’s growth and continuing to accen-tuate the Yamaha brand on a global scale. In every stage of our business, including technological development, manufacturing, sales, and services, our employees around the world carry on the spirit of their prede-cessors and share a strong passion for their work. Going forward, we will leverage the indi-vidual craftsmanship skills of our employees to realize sustainable growth.
28,113
Yamaha Corporation Annual Report 2017 3

Results for the First Year of NEXT STAGE 12Under the current medium-term management plan NEXT STAGE 12, the Yamaha Group aims to boost brand power to become a highly profitable enterprise and has adopted the management objective of realizing an operating income ratio of 12% by fiscal 2019 (the year ending March 31, 2019). In fiscal 2017, the year ended March 31, 2017, we achieved record levels of operating income and net income for the fifth consecutive year. In addition, we realized double-digit growth in the operating income to sales ratio for the first time ever. Regarding the results for the first year of NEXT STAGE 12, we believe we made steady progress toward achieving the plan’s targets.
Operating income to sales (for the first year of NEXT STAGE 12)
10.9%
Performance
17/316/315/30
30
20
10
40
50
0
9
6
3
12
15
40.744.3
30.1 9.3
10.9
7.0
Operating Income / Operating Income RatioBillions of yen %
4
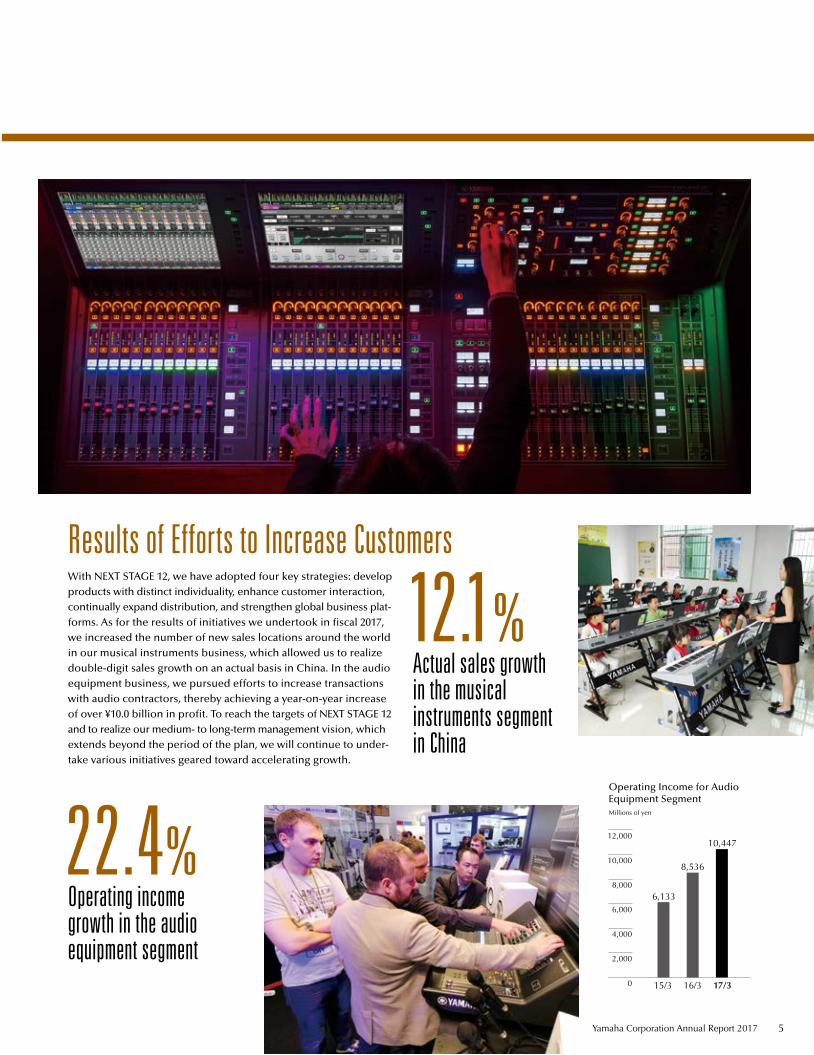
Results of Efforts to Increase CustomersWith NEXT STAGE 12, we have adopted four key strategies: develop products with distinct individuality, enhance customer interaction, continually expand distribution, and strengthen global business plat-forms. As for the results of initiatives we undertook in fiscal 2017, we increased the number of new sales locations around the world in our musical instruments business, which allowed us to realize double-digit sales growth on an actual basis in China. In the audio equipment business, we pursued efforts to increase transactions with audio contractors, thereby achieving a year-on-year increase of over ¥10.0 billion in profit. To reach the targets of NEXT STAGE 12 and to realize our medium- to long-term management vision, which extends beyond the period of the plan, we will continue to under-take various initiatives geared toward accelerating growth.
Actual sales growth in the musical instruments segment in China
12.1%
Operating income growth in the audio equipment segment
22.4%
17/316/315/3
8,536
10,447
6,133
0
2,000
4,000
6,000
8,000
10,000
12,000
Operating Income for Audio Equipment SegmentMillions of yen
Yamaha Corporation Annual Report 2017 5

EnthusiasmConstantly emphasizing the concepts laid out in its corporate philosophy, "With our unique expertise and sen-sibilities, gained from our devotion to sound and music, we are committed to creating excitement and cultural inspiration together with people around the world,” the Yamaha Group will use the power of sound to respond to people’s needs and passion, providing solutions to music scenes while expanding its business activities in a sustainable manner.
“Sharing Passion & Performance”
6
Yamaha Corporation Annual Report 2017 7
page 9 To Our Stakeholders
page 10 Yamaha’s Highlights
page 12 Message from the President
page 22 Board of Directors
Management Strategy
8

Currently, Yamaha is moving forward with NEXT STAGE 12, its
three-year medium-term management plan ending in fiscal 2019.
In fiscal 2017, the first year of this plan, net sales decreased over
¥30.0 billion compared with the previous fiscal year due to the
effects of foreign exchange rates. These unfavorable exchange
rates also had a negative impact of over ¥10.0 billion in terms of
operating income. However, in addition to an increase in sales on
an actual basis, the Company was able to achieve increases at
each income level for the fifth consecutive year through such
efforts as revising selling prices and steadily promoting initiatives
to lower costs. While operating income rose 8.9%, to ¥44.3 billion,
I view the improvement in our operating income ratio as our
greatest achievement for fiscal 2017. Thanks to the success of
selling price revisions and cost reduction initiatives, the operating
income ratio improved 1.6 points, to 10.9%. To reach our target
operating income ratio of 12% under NEXT STAGE 12, we hope
for a 1-point improvement each year from the fiscal 2016 level of
9.3%, for a total increase of 3 points over the three-year period of
the plan. I believe that the solid progress we made in the first year
of the plan reflects the fact that our strategies and initiatives are
headed in the right direction.
In fiscal 2018, the second year of the plan, we are planning
for operating income of ¥48.5 billion and an operating income
ratio of 11.4%. This is an ambitious plan that aims to surpass our
record high operating income of ¥45.1 billion, which was
recorded in fiscal 2004. At that time, the semiconductor business
was performing extremely well, accounting for over half of the
Company’s profits, and our core businesses of musical instruments
and audio equipment were not making significant profit contribu-
tions. However, now, we are steadily enhancing profitability,
primarily in our musical instruments and audio equipment
businesses, through structural and organizational reforms. This
means that our core businesses are now the ones driving profit
growth. Leveraging an ideal business structure that generates
profits through our mainstay products of musical instruments and
audio equipment, we will put forth every effort to realize record-
high profits.
To continue to realize growth and constantly offer new value
and solutions to our customers around the world, not only do we
have to enhance our brand power and pursue innovative product
development, we must also carry out structural and organiza-
tional reforms. In addition to the organizational reforms that we
have already completed, we revised the organizational model
of our corporate governance in June 2017, transitioning from a
Company with a Board of Auditors to Company with Three
Committees (Nominating, Audit, and Compensation). Through
this transition, we will strengthen the supervisory functions of
the Company’s management. At the same time, we will further
accelerate the pace of decision-making related to business
execution by transferring authority to those in the newly estab-
lished position of executive officer.
While having made steady progress in the first year of the
current medium-term management plan, we will remain commit-
ted to making every effort possible to achieve the plan’s targets
and realize our medium- to long-term management vision of
“Becoming an Indispensable, Brilliantly Individual Company.”
To this end, we will leverage Yamaha’s unique strengths, which
include its technological and proposal-making capabilities,
sensibilities, and diversity, to their full extent while boldly taking
on challenges to address various issues. We ask all of our stake-
holders for their continued support as we pursue these
endeavors going forward.
Takuya NakataPresident and Representative Executive Officer
To Our Stakeholders
Yamaha Corporation Annual Report 2017 9
Financial SectionGrowth FoundationManagement Strategy About Yamaha
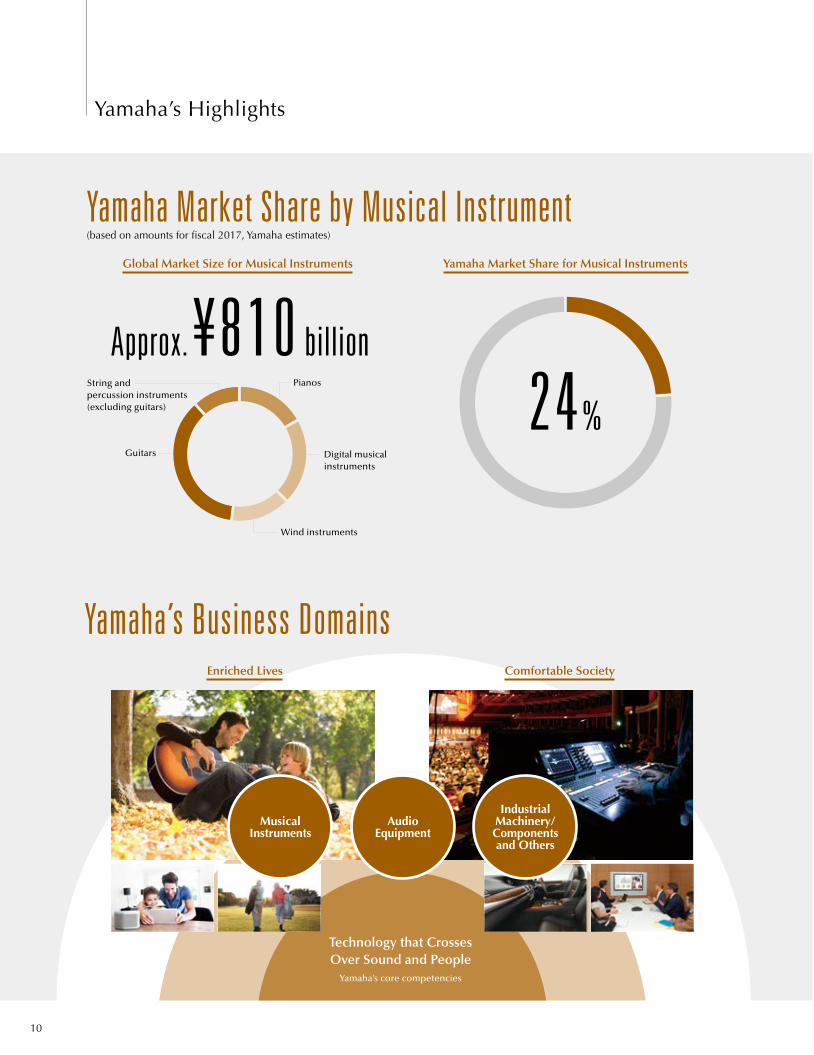
Approx. ¥810 billion
Yamaha’s Business Domains
Digital musical instruments
Guitars
String and percussion instruments (excluding guitars)
Pianos
Wind instruments
24 %
Yamaha Market Share by Musical Instrument(based on amounts for fiscal 2017, Yamaha estimates)
Technology that Crosses Over Sound and People
Yamaha’s core competencies
Musical Instruments
Audio Equipment
Industrial Machinery/Components and Others
Yamaha Market Share for Musical Instruments Global Market Size for Musical Instruments
Enriched Lives Comfortable Society
10
Yamaha’s Highlights

Key Financial Figures (fiscal 2017)
Musical instruments
63.1%
Others
8.6%
Audio equipment
28.3%
¥408.2 billion– 6.3 %
¥44 .3 billion+8.9 %
¥46 .7 billion+43.2 %
14 .0 %+3.9 points
¥29 .5 billion– 31.4 %
Sales Proportion by Region
Segment Sales CompositionNet Sales ROE
Free Cash FlowOperating Income
Net Income
18.7 %
Europe
15.9 %
Other areas
11.2 %
China
33.9 %
Japan
20.3 %
North America
Yamaha Corporation Annual Report 2017 11
Financial SectionGrowth FoundationManagement Strategy About Yamaha

Under NEXT STAGE 12, our current medium-term manage-
ment plan ending in fiscal 2019, we are drawing on the
structural reforms we carried out in our two previous
medium-term management plans—YMP125 and YMP2016—
to further enhance our brand power. In doing so, we aim to
become a highly profitable enterprise with an operating
income of 12%, an ROE around the 10% level, and an EPS at
the ¥200 level, even amid yen appreciation. In fiscal 2017,
we were able to achieve significant results by enhancing
profitability. In this section, I would like to talk about the
progress we are making under NEXT STAGE 12 as well as the
specific results we have achieved thus far.
Fiscal 2017—Making Steady Progress in the First Year of the Current Medium-Term Management PlanIn contrast to the favorable foreign exchange rates in the
previous fiscal year, yen appreciation in the fiscal year
under review led to a ¥33.4 billion decrease in net sales
and also placed downward pressure on operating income to
the extent of ¥11.1 billion. However, we were able to over-
come the negative impact of yen appreciation and realize
profit increases due to a rise in sales on an actual basis,
primarily in the musical instruments and audio equipment
businesses, as well as efforts to reduce costs and revise
selling prices.
Looking at each business segment, sales declined in the
musical instruments segment due to unfavorable foreign
exchange rates and the negative effect of the transfer of
musical school management. However, excluding the
impact of foreign exchange rates, double-digit sales growth
was recorded in China on an actual basis and a strong per-
formance was realized in each market aside from Japan.
In addition to our mainstay pianos and digital musical
instruments, nearly every product group, including guitars,
enjoyed healthy sales. Turning to the audio equipment seg-
ment, while foreign exchange rates had a negative impact,
we achieved double-digit sales growth in Japan and North
America on an actual basis that excludes this impact, in
addition to realizing solid sales in Europe. By securing sales
increases on an actual basis and working to further reduce
costs and revise selling prices, operating income in the
12
Message from the President
audio equipment segment exceeded ¥10.0 billion and the
operating income ratio reached 9%. This means that we
have already achieved our fiscal 2019 target for this seg-
ment’s operating income ratio under NEXT STAGE 12. In the
others segment, the golf business performed strongly, with
profits increasing significantly compared with the previous
fiscal year. While we had initially anticipated a profit
decrease in this segment, solid sales of new golf products
and a recovery in the gross margin of the electronic devices
business allowed us to realize significant improvement in
profitability.
To provide an overview from the perspective of our
major products, sales steadily grew in all product catego-
ries. Among these, sales of digital musical instruments
returned to a course for growth at the beginning of the
calendar year after recording negative growth in 2016 from
fall to winter, confirming once again the underlying strength
of these products. In addition, while we consistently aim for
10% growth in sales of PA equipment, sales in fiscal 2017
increased only 8%. Although this represents a slightly
unsatisfactory result numerically, if we break down this
growth, we see that commercial audio equipment—a main-
stay product for PA equipment—recorded double-digit sales
growth, up 12%. I therefore believe that PA equipment
performed extremely well.
Seeing Significant Results from Initiatives to Strengthen Profitability
Over the three years of NEXT STAGE 12, we aim for a gross
reduction in costs totaling ¥14.0 billion. This reduction will
more than offset the increase in labor costs, representing
a net reduction of ¥8.0 billion. In fiscal 2017, we worked
to improve production efficiency through such means as
switching to in-house production of components, promoting
new production methods, and shifting to mechanization.
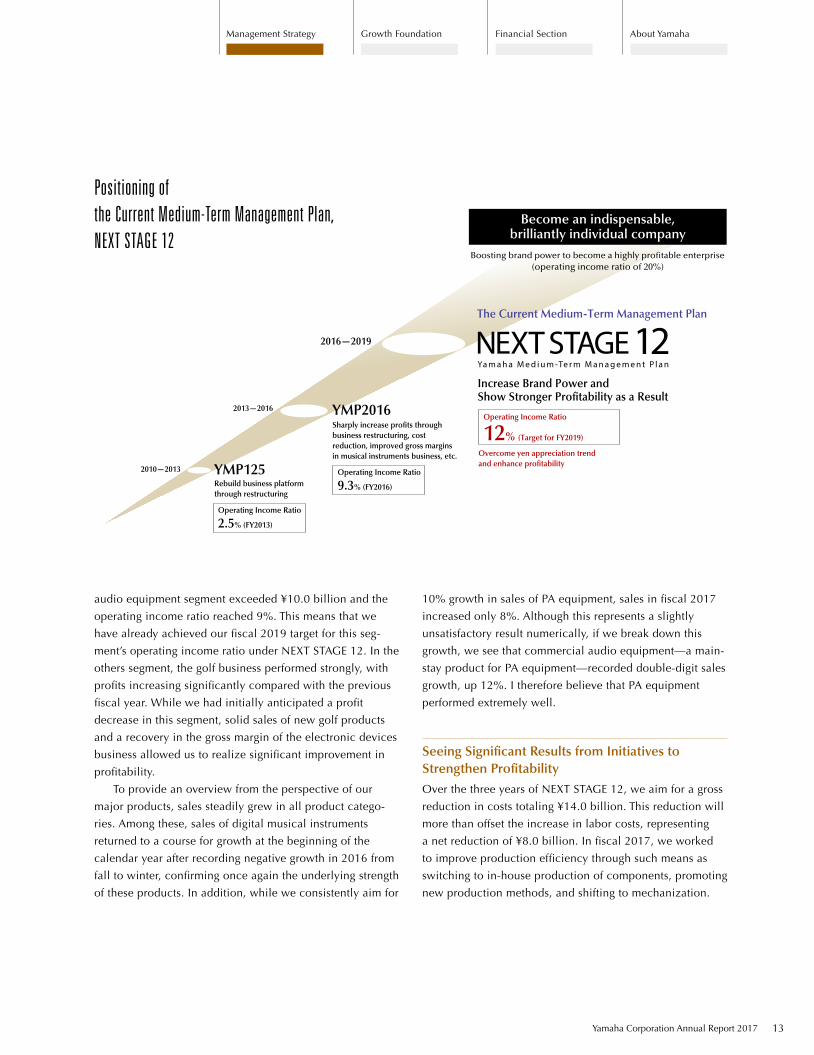
Positioning of the Current Medium-Term Management Plan, NEXT STAGE 12
2010—2013
2013—2016
The Current Medium-Term Management Plan
Rebuild business platform through restructuring
Sharply increase profits through business restructuring, cost reduction, improved gross margins in musical instruments business, etc.
Increase Brand Power and Show Stronger Profitability as a Result
Overcome yen appreciation trend and enhance profitability
Become an indispensable,
brilliantly individual company
Operating Income Ratio
9.3% (FY2016)
Operating Income Ratio
2.5% (FY2013)
Operating Income Ratio
12% (Target for FY2019)
YMP2016
YMP125
2016—2019
Yamaha Corporation Annual Report 2017 13
Financial SectionGrowth FoundationManagement Strategy About Yamaha
Furthermore, we reduced procurement and administrative
costs by integrating purchasing and procurement operations
by area, rather than conducting these operations by factory,
as we have done in the past. As a result of these efforts, we
realized cost reductions totaling ¥4.9 billion.
Another major result we achieved was the revisions we
made to selling prices. In fiscal 2017 alone, selling price
revisions helped improve profits by ¥3.5 billion. Selling
price revisions are not a measure we carry out with the pur-
pose of raising prices. For example, after thoroughly exam-
ining the strengths of a product, if we believe that lowering
its selling price will lead to higher sales volumes and, in
turn, higher profits, then we will lower the price. However,
I have repeatedly called for raising the selling price of prod-
ucts that have a relatively inexpensive price in comparison
with their quality and demand. Moreover, we are currently
carrying out thorough selling price revisions in conjunction
with the launch of new products. In the past, when intro-
ducing a new product into the market, we often kept the
selling price of a product at the same level as existing prod-
ucts even if said product had better performance. However,
I have stressed the importance of selecting an appropriate
selling price commensurate with the value of a product. As
this idea takes hold, I believe profitability will naturally rise
each time we improve the strength of a product.
Revising Our Organization and Accelerating the Development of Highly Competitive Products
By revising product development structure by business and
centralizing the expertise and technological capabilities
that were previously scattered throughout the Company, we
are now able to provide products with even higher added
value. For example, in terms of IoT, which has become a
keyword recently, we have developed a product that com-
bines hybrid pianos with network technologies. The techno-
logical capabilities of this product were highly praised
when the product was on display at a trade show. As for the
combination of audio products and network technologies,
in January 2017, we announced the release of an audio
product that is compatible with Amazon Echo, Amazon’s
audio assistant device that is equipped with the voice
recognition function Alexa. This announcement was met
with an extremely positive response, and we are looking
forward to commencing sales of this equipment in the fall.
We hope to accelerate these kinds of technological
combinations after the construction of our Innovation
Center, which is scheduled to be completed in spring 2018.
Emphasizing the Importance of Marketing Strategies
As Yamaha has traditionally been a manufacturer, we have
had a tendency to adhere to a “product out” approach that
focused on the idea that products will sell if they are high
quality. Accordingly, we did not place importance on sales
strategies that emphasize marketing. As a result, I believe
that there have been many instances in which we were
unable to leverage the full potential of the Yamaha brand.
If we want to expand our lineup of premium products that
have a significant difference between manufacturing cost
and selling price, strong brand power is a must. To establish
such brand power, we have decided to more thoroughly
incorporate marketing in our business strategies, and we
established the Company’s first-ever marketing division in
2016. In collaboration with local subsidiaries, we are cur-
rently realizing solid results in new product planning and
development that place the needs of customers first. In
addition, we have established specific KPI and are moving
forward with discussions on how to further enhance our
marketing activities. On average, we develop and launch
over 200 product models a year. By putting the needs of the
market and our customers first, we have shortened the time
Message from the President
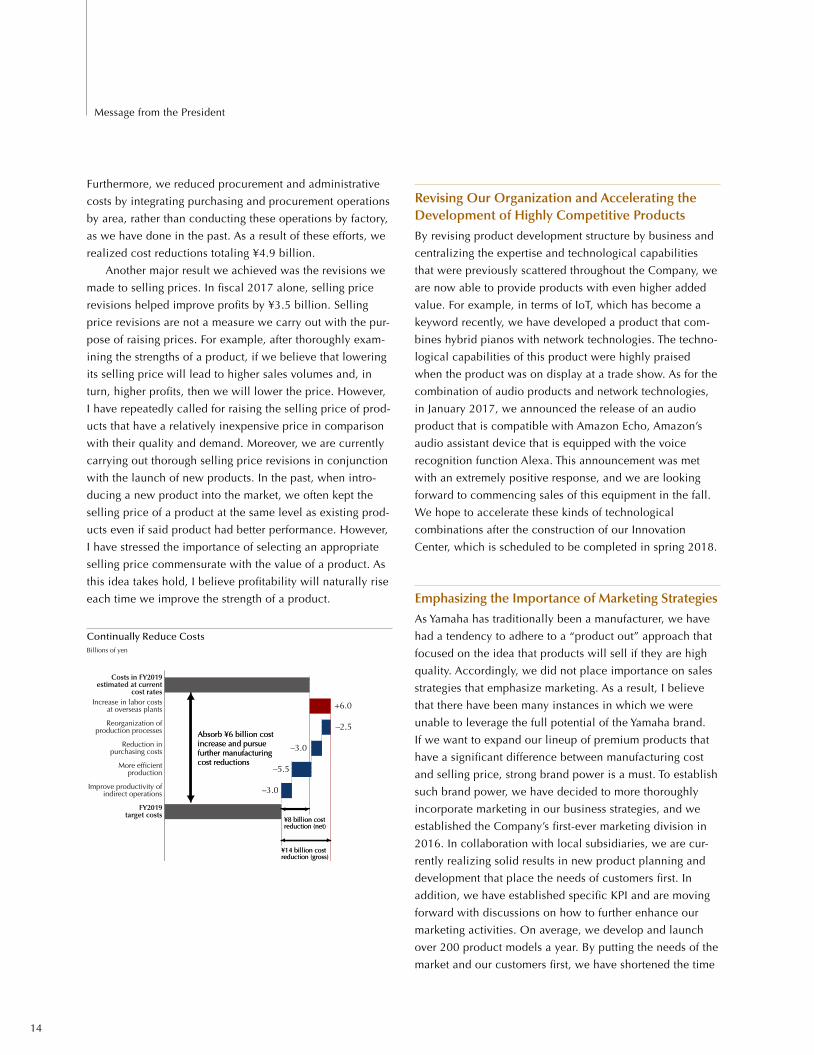
Improve productivity ofindirect operations
Reorganization ofproduction processes
Increase in labor costsat overseas plants
Costs in FY2019estimated at current
cost rates
Reduction inpurchasing costs
More ef�cientproduction
FY2019target costs
41.0
33.0
+6.0
–2.5–2.5
–3.0
–5.5
–3.0
Absorb ¥6 billion costincrease and pursuefurther manufacturingcost reductions
Absorb ¥6 billion costincrease and pursuefurther manufacturingcost reductions
¥14 billion costreduction (gross)¥14 billion costreduction (gross)
¥8 billion costreduction (net)¥8 billion costreduction (net)
Continually Reduce CostsBillions of yen
14

between product design and product launch, which, in con-
junction with our technological capabilities, has allowed us
to hammer out highly competitive products that can secure
solid profits. I believe this is an extremely significant
accomplishment.
Our tasks going forward are to enhance the Yamaha
brand itself and promote well-balanced marketing strate-
gies. In terms of enhancing the Yamaha brand, investigations
we have carried out have shown us that Yamaha’s brand
image differs greatly by country and region. We therefore
plan to enhance our corporate brand by investing a certain
amount of funds to customize and promote the appeal of
the Yamaha brand by country. Meanwhile, for marketing
strategies, we will focus our efforts on newly developed net-
work audio products. At the same time, we will invest funds
to promote the capabilities of our guitars, a product cate-
gory that has faced various issues. Demand for guitars has
been rising in China, and our guitar marketing efforts in the
country have enjoyed great success. As a result, we are now
able to sell not only low-end guitars but also medium- to
high-end guitars. Without limiting ourselves to China, we
will pursue marketing strategies in a variety of countries and
regions that focus on a solid balance between the sale of
affordable products that customers can easily enjoy and the
sale of high-class products that give customers a sense of
satisfaction in owning.
Adopting a New Perspective in Expanding Our Customer Network
Focusing on customers in domains in which we have yet to
do business, we have divided our customer network into
two categories—consumers, and corporate clients and B2B
customers—and are promoting initiatives in each. For con-
sumers, we are steadily expanding our sales network and
pursuing activities to popularize music based on local
needs. In fiscal 2017, we held events in Vietnam, Indonesia,
Malaysia, Russia, and other countries targeting people who
have yet to have the opportunity to play and enjoy musical
instruments. In Vietnam, we worked together with public
elementary schools to create educational music programs
that also worked to nurture music teachers. Held after
school, these programs use musical instruments provided by
the Company to communicate the appeal of musical instru-
ments to both students and teachers alike. As of March
2017, these programs have been held at 250 elementary
schools in Vietnam. We hope that efforts such as these lead
to increased enrollment in our musical schools and
purchases of our musical instruments.
Develop Products with Distinctive Individuality
Add original value to excellent basic functions and develop products others cannot imitate
Joy Beauty Confidence Discovery
Fusion of Technology
Technology that Crosses Over Sound and People
Materials/analysis technologies to bring out the best qualities in raw materials
Sensing technologies to accurately track motion
Mechatronics technologies to express minute movements
others
Signal processing technologies for rich sound processing
High-quality, easy-to-operate network technologies
Evaluation technology to scientifically assess human sensitivities
and sound recognition
Sound generator technologies enabling diverse expression
Yamaha Corporation Annual Report 2017 15
Financial SectionGrowth FoundationManagement Strategy About Yamaha
For our corporate clients and B2B customers, we are
working to establish audio contractors as a new sales route.
When selling audio equipment, we have been realizing
solid results by having our sales staff and specialized tech-
nicians expand their focus by approaching not only audio
technicians but also other parties such as electrical
Establishing a Structure for Nurturing Global Human Resources
Overseas sales already account for two-thirds, or 66%, of the
Company’s total sales, and we have 53 overseas locations
located in 31 different countries and regions. Under NEXT
STAGE 12, we aim to strengthen our global marketing capa-
bilities and reduce costs. To do so, we believe it is essential
to transfer authority to the local personnel in each country
and develop human resources that are active on a global
scale. Based on this belief, we are promoting a global grad-
ing system for professional positions in each country as well
as the cross-border stationing of personnel. As part of such
efforts, we established a global human resources division in
2016 and worked to improve motivation by clarifying the
position, role, and career plan of each employee at our over-
seas locations. For example, top management positions at
overseas subsidiaries have traditionally been given to
Japanese employees. However, in 2016, we appointed a
German national to the top management role at our
European subsidiary. In doing so, we conveyed to local staff
that anyone can have the opportunity of being in a top man-
agement role. As such, the attitude of these employees has
equipment companies. Furthermore, the need for connec-
tion with information networks is rising alongside the need
for audio networks. As we possess routers and other com-
munications equipment, we hope to increase sales by estab-
lishing a support structure that can sufficiently respond to
the need for both audio and information networks.
changed and they have been carrying out their work duties
with an even higher level of earnestness. While the top
management roles at our U.S. subsidiaries are still held by
Japanese employees, the example set by our European sub-
sidiaries has changed the way our American staff approach
their work. In all areas of operations, there has been a height-
ened awareness toward budget attainment and a significant
change in employee behavior and expression. This is some-
thing that I am extremely pleased with. Additionally, there
has been an increase in overseas hires taking on positions at
our headquarters in Japan. This has naturally led to our
Japanese staff developing a more diverse, global perspective,
in addition to many other synergistic effects.
Steadily Planting Seeds in Our Industrial Machinery and Components Business
In NEXT STAGE 12, we have positioned the industrial
machinery and components business as our third key
domain. As such, we aim to establish a solid foundation for
this business during the three-year period of the plan. Due
to the fact that this business will not offer products to con-
sumers, we do not expect to promptly realize results.
Message from the President
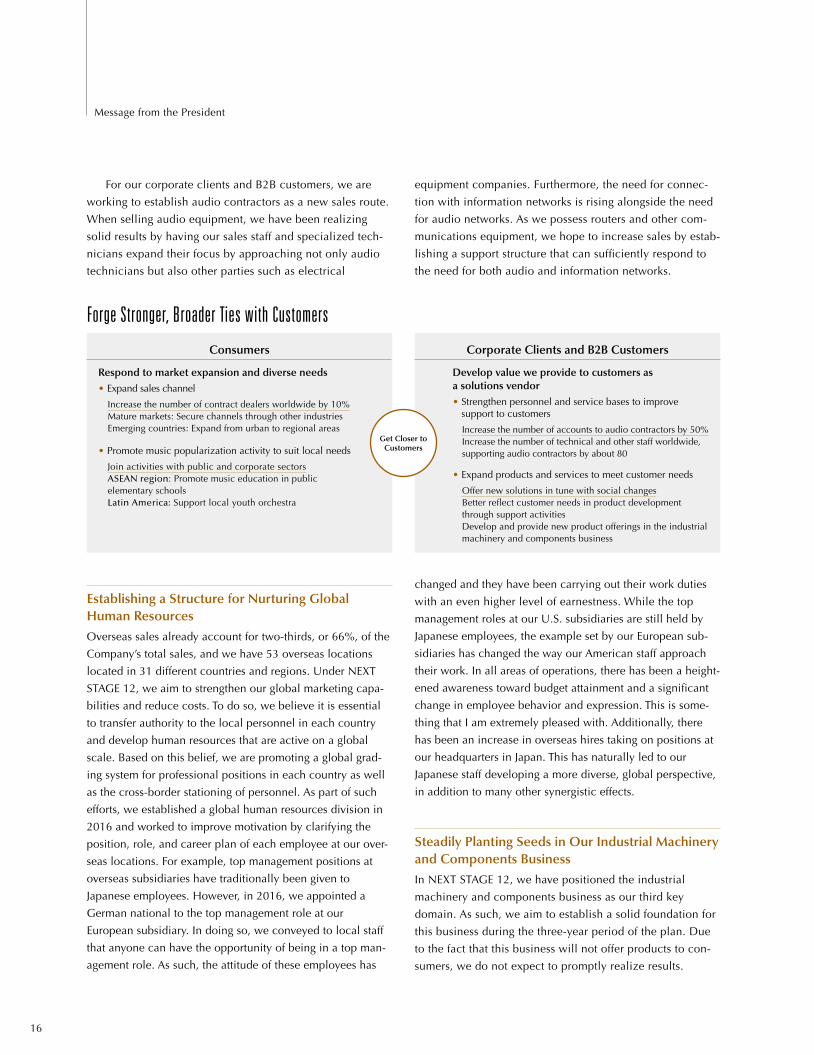
Forge Stronger, Broader Ties with Customers
Respond to market expansion and diverse needs
• Expand sales channel
Increase the number of contract dealers worldwide by 10% Mature markets: Secure channels through other industries Emerging countries: Expand from urban to regional areas
• Promote music popularization activity to suit local needs
Join activities with public and corporate sectors ASEAN region: Promote music education in public elementary schools Latin America: Support local youth orchestra
Develop value we provide to customers as a solutions vendor
• Strengthen personnel and service bases to improve support to customers
Increase the number of accounts to audio contractors by 50% Increase the number of technical and other staff worldwide,
supporting audio contractors by about 80
• Expand products and services to meet customer needs
Offer new solutions in tune with social changes Better reflect customer needs in product development
through support activities Develop and provide new product offerings in the industrial
machinery and components business
Corporate Clients and B2B CustomersConsumers
Get Closer to Customers
16

However, we plan to plant seeds in the first one to two
years of this business that will allow it to contribute to prof-
its from its third year and onward.
To develop the industrial machinery and components
business into a third business pillar, we will leverage the
technology and know-how we possess in our musical
instruments and audio equipment businesses. For industrial
machinery and components, we will transform from a semi-
conductor manufacturer to a solutions vendor that provides
added value by offering modules in a packaged format that
include signal processors, microphones, and speakers. The
diverse range of technologies that we possess includes sound
processing and recognition technologies, and, for signal
processing, we have a solid track record in terms of devices
and software. With these technologies, we are setting our
sights on the onboard device market. There are various
noises that occur inside a vehicle, and, by their very nature,
automobiles make for a rather poor sound environment.
Accordingly, we intend to offer automobile and other manu-
facturers a package of products—including semiconductors—
that provide solutions to counter this. As equipment for
automobiles needs to be highly reliable, it is necessary to
carry out extensive verification tests for these products over
and over again. We are currently getting involved in such
tests and hope to gradually transition to the phase of
launching products in the near future. At the same time, we
are working to develop thermoelectric solutions that
address issues related to exhaust gas and fuel consumption
with the aim of realizing a more eco-friendly motorized
society.
Aiming for Record-High Operating Income in Fiscal 2018While there are many uncertain elements in the business
environment in fiscal 2018, we anticipate an increase in
sales and profit as our most recent forecasts indicate an
exchange rate of ¥110 per US$1 and ¥120 per €1. We
expect operating income to rise ¥4.2 billion, to ¥48.5 billion.
While SG&A expenses will be higher due to strategic invest-
ments in marketing, new product development, and other
areas, we aim to continue the steady profit increases that
occurred in fiscal 2017 through higher sales and production
volumes, selling price revisions, and cost reductions.
In the musical instruments segment, we forecast an
increase in both sales and profits, driven by double-digit
sales growth in the Chinese market. For markets that experi-
enced stagnant growth in fiscal 2017, we anticipate high
levels of growth through the introduction of new products.
In the audio equipment segment, not only do we expect PA
equipment to act as a major growth driver, we also antici-
pate higher sales and profits based on the continued healthy
Facilitate international careers
• Establish global core positions (approx. 200) to implement global grading system
• Promote cross-border personnel assignment
• Select candidates for core positions of the next generation and promote development program
Optimize IT, logistics, finance, and administrative functions on a global scale
• Establish regional IT headquarters in three regions: Europe, U.S., and Japan (Asia) - Establish 24-hour surveillance and service system using resources in the three regions
• Build efficient logistics system - Aim for logistics cost reductions through optimizing distribution network, improving efficiency of packing
and lading, centralizing procurement distribution, and promoting application of preferential tariffs
• Prepare for introduction of International Financial Reporting Standards (IFRS)* * Consider introduction of IFRS in fiscal 2020
- Aim for improvement in possibilities for international comparability of financial information and uniformity in Group financial information
• Strengthen global support systems of HQ corporate staff - Improve management level of regional offices in all countries
Develop Human Resources to Support Global Business Operations and Reinforce Infrastructure
Proportion of total sales made overseas
66%(As of April 2017)
Overseas business bases
53 in 31 countries(As of April 2017)
Yamaha Corporation Annual Report 2017 17
Financial SectionGrowth FoundationManagement Strategy About Yamaha
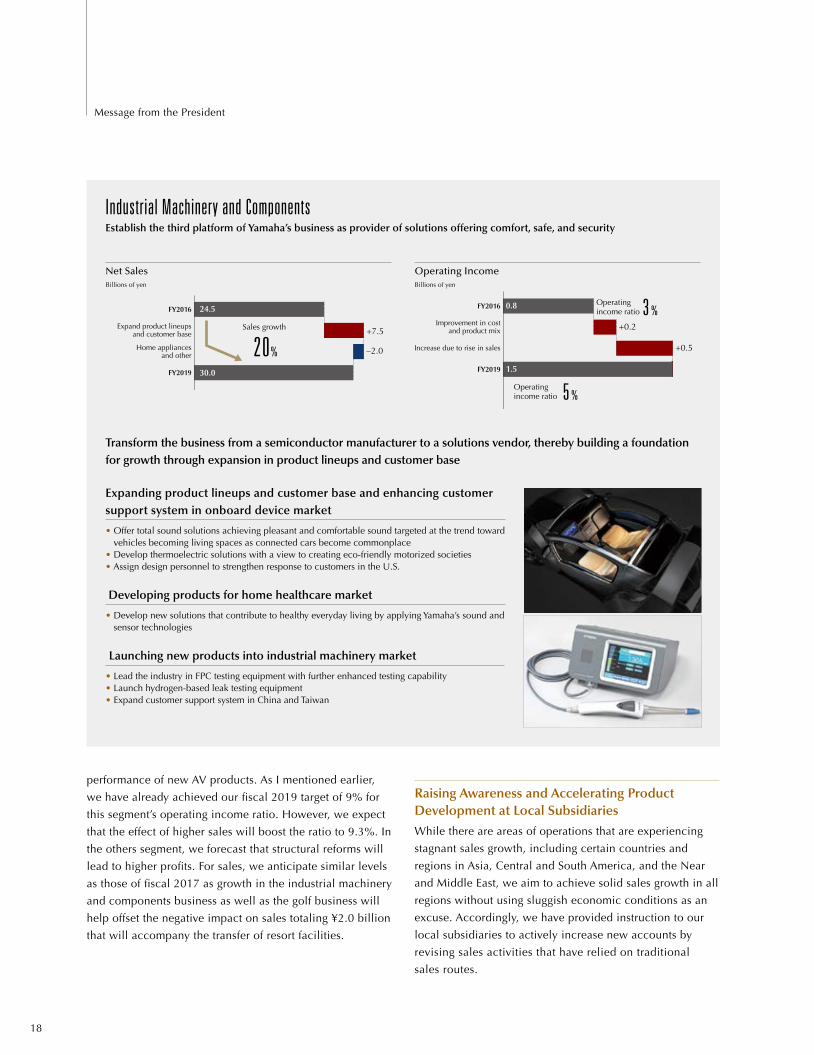
Transform the business from a semiconductor manufacturer to a solutions vendor, thereby building a foundation for growth through expansion in product lineups and customer base
Expanding product lineups and customer base and enhancing customer support system in onboard device market
• Offer total sound solutions achieving pleasant and comfortable sound targeted at the trend toward vehicles becoming living spaces as connected cars become commonplace
• Develop thermoelectric solutions with a view to creating eco-friendly motorized societies• Assign design personnel to strengthen response to customers in the U.S.
Developing products for home healthcare market
• Develop new solutions that contribute to healthy everyday living by applying Yamaha’s sound and sensor technologies
Launching new products into industrial machinery market
• Lead the industry in FPC testing equipment with further enhanced testing capability• Launch hydrogen-based leak testing equipment• Expand customer support system in China and Taiwan
Industrial Machinery and ComponentsEstablish the third platform of Yamaha’s business as provider of solutions offering comfort, safe, and security
Operating IncomeBillions of yen
FY2016
FY2019
0.8
1.5
+0.2
+0.5
Improvement in costand product mix
Increase due to rise in sales
5 %Operating income ratio
3 %Operating income ratio
Net SalesBillions of yen
FY2016
FY2019 30.0
24.5
+7.5
–2.0
Expand product lineupsand customer base
Home appliancesand other 20%
Sales growth
performance of new AV products. As I mentioned earlier,
we have already achieved our fiscal 2019 target of 9% for
this segment’s operating income ratio. However, we expect
that the effect of higher sales will boost the ratio to 9.3%. In
the others segment, we forecast that structural reforms will
lead to higher profits. For sales, we anticipate similar levels
as those of fiscal 2017 as growth in the industrial machinery
and components business as well as the golf business will
help offset the negative impact on sales totaling ¥2.0 billion
that will accompany the transfer of resort facilities.
Raising Awareness and Accelerating Product Development at Local Subsidiaries
While there are areas of operations that are experiencing
stagnant sales growth, including certain countries and
regions in Asia, Central and South America, and the Near
and Middle East, we aim to achieve solid sales growth in all
regions without using sluggish economic conditions as an
excuse. Accordingly, we have provided instruction to our
local subsidiaries to actively increase new accounts by
revising sales activities that have relied on traditional
sales routes.
18
Message from the President
By transitioning from a business-specific product devel-
opment structure to a function-specific organizational struc-
ture, we have already achieved a remarkable increase in the
speed of product development. However, considering the
recent pace of technological innovations, we have yet to
reach sufficient results. With the aim of enhancing our
product development and marketing capabilities, we have
been making reforms to our conventional organizational
structure since April, establishing a new organization that
integrates product development and marketing divisions.
Under this new organization, we will further strengthen and
accelerate product development going forward.
Creating ESG Value Unique to YamahaWe recognize that a company that lacks awareness toward
ESG is a company that will no longer be accepted by soci-
ety. Based on this recognition, we are promoting a wide
variety of ESG-related initiatives within NEXT STAGE 12.
We believe that, as a company, we should work to
resolve social issues through the products and services we
provide. For example, we have been promoting activities
to popularize music in regions with poor public safety for
over 10 years. These efforts have helped play a role in
reducing misconduct and improving public safety in such
regions. While this is only one example of our many social
initiatives, we believe that the resolution of social issues
helps create business opportunities for the Company over
the medium to long term.
From the perspective of the environment, a company’s
approach can be categorized as “defensive” or “offensive.”
As an example of a “defensive” approach, we are increas-
ing our utilization of timber from certified forests where
wood materials are managed in an appropriate and legal
manner. As a corporate group that makes use of timber, we
view the sustainable procurement of resources as a high-
priority issue. Meanwhile, to improve our product strength
and enhance our competitiveness, we are conducting
research on raw wood materials within the research pro-
cess for sound, as one of our “offensive” approaches. We
believe that we can utilize the expertise we have gained
through such research to develop a substitute material for
timber in the event that its use becomes restricted under
environmental regulations in the future. These kinds of
environmentally conscious initiatives provide us with a
sharp competitive edge.
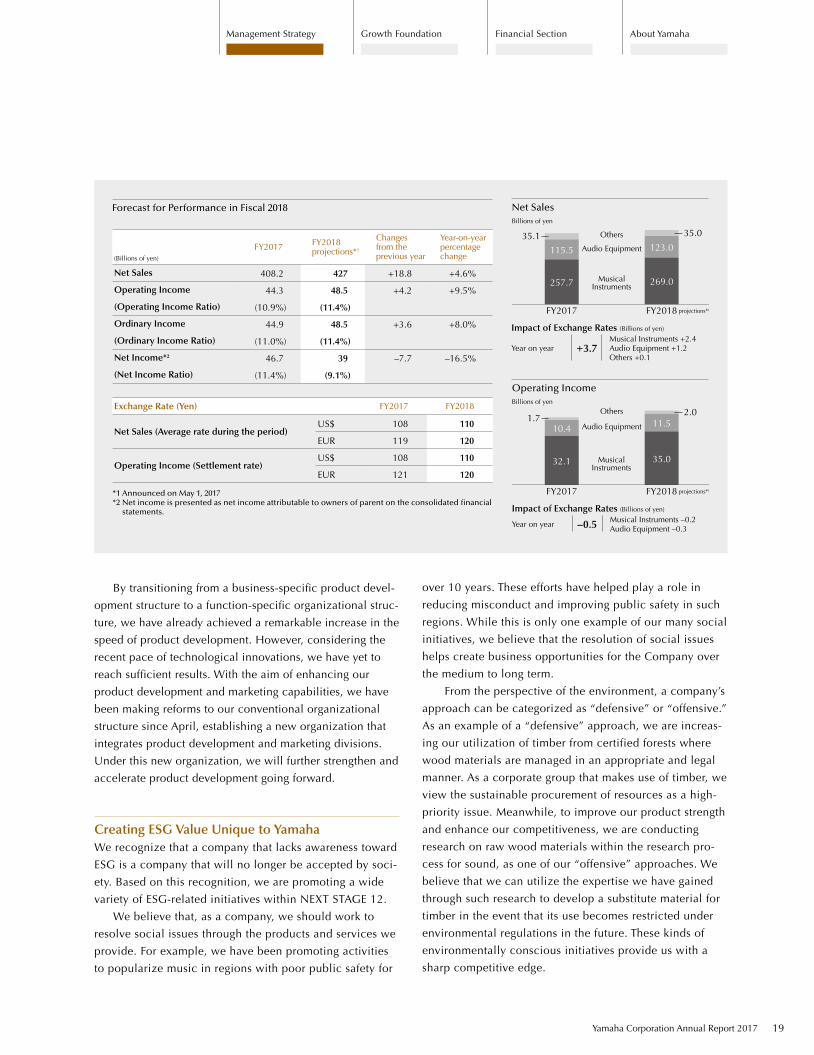
(Billions of yen)
FY2017 FY2018 projections*1
Changes from the previous year
Year-on-year percentage change
Net Sales 408.2 427 +18.8 +4.6%
Operating Income 44.3 48.5 +4.2 +9.5%
(Operating Income Ratio) (10.9%) (11.4%)
Ordinary Income 44.9 48.5 +3.6 +8.0%
(Ordinary Income Ratio) (11.0%) (11.4%)
Net Income*2 46.7 39 –7.7 –16.5%
(Net Income Ratio) (11.4%) (9.1%)
Exchange Rate (Yen) FY2017 FY2018
Net Sales (Average rate during the period)US$ 108 110
EUR 119 120
Operating Income (Settlement rate)US$ 108 110
EUR 121 120
*1 Announced on May 1, 2017*2 Net income is presented as net income attributable to owners of parent on the consolidated financial
statements.
Forecast for Performance in Fiscal 2018 Net SalesBillions of yen
Operating IncomeBillions of yen
Impact of Exchange Rates (Billions of yen)
Year on year +3.7Musical Instruments +2.4Audio Equipment +1.2Others +0.1
Impact of Exchange Rates (Billions of yen)
Year on year –0.5 Musical Instruments –0.2Audio Equipment –0.3
FY2017 FY2018
FY2017 FY2018
Audio Equipment
Others
Musical Instruments
35.035.1
1.7
123.0
11.52.0
115.5
10.4
269.0
35.0
257.7
32.1
Audio Equipment
Others
Musical Instruments
projections*1
projections*1
Yamaha Corporation Annual Report 2017 19
Financial SectionGrowth FoundationManagement Strategy About Yamaha

(1) Reduce environmental impact in business processes
• Use timber sustainably• Reduce greenhouse gas emissions
(2) Enhance development of environmentally friendly products and technologies
• Develop environmentally friendly materials (develop alternative materials
for rare wood, etc.)
• Encourage Yamaha Eco-Products Program*
* Program to promote environmentally friendly products certified
in accordance with original Yamaha standards
• Develop technologies for reducing greenhouse gas emissions (thermoelectric devices, hydrogen sensors, etc.)
Environmental Promote activities to create a sustainable society by reducing environmental impact
Yamaha Forest reforestation activity in Indonesia
(1) Corporate Governance Initiatives
Yamaha transitioned to a Company with Three Committees (Nominating, Audit, and Compensation) on June 22, 2017.
• Enhance the overall management oversight function • Board of Directors to consist of 9 members
(two-thirds of whom will be outside directors) • Nominating Committee, Audit Committee, and
Compensation Committee to be established as provided for by law (Each Committee includes a majority of outside directors)
• Speed up the execution of management • New executive officer structure: 7 executive officers Board of Directors to delegate extensive authority to
executive officers
(2) Initiatives for Strengthening Internal Controls
• Receive a higher appraisal from external specialists for Yamaha’s internal auditing systems and methods
• Improve Yamaha Group corporate governance, including overseas Group companies, as a result of further improve-ments in quality of internal control systems
• In addition to an existing corporate culture with a strong sense of ethics, improve capabilities for dealing with risks by introducing more advanced risk management structure
(1) Enhance development of products and services that address issues facing society
• Apply sound-related knowledge and technology, and introduce more universal design products
(2) Develop regional community-based business (music popularization activities, cultural events, and corpo-rate citizenship activities)
• Resolve social issues through music and contribute to commu-nity development
(3) Take systematic initiatives to promote diversity, socially responsible procurement, and respect for human rights
• Carry out activities in line with the United Nations Global Compact*
* Signed by Yamaha in 2011
Wearable Sensors for Healthcare field
El Sistema (Photo: Provided by Fundamusical)
Social Promote activities to create a sustainable society through responding to social issues, enhancing employment policies, etc.
Governance Continue to improve organizational structures and mechanisms to maintain and advance transparent, highly effective management that operates in an appropriate and prompt manner
E
S
G
20
Message from the President

0
20
60
40
0
20
60
40
15/3 16/3 17/314/313/3
10
47.0
36
28.0 26.1
44
20.9
26.927
22.8
5256
18/3Plan
Plans for Returns to ShareholdersDuring the three-year period of NEXT STAGE 12, we intend
to generate ¥150 billion in cash flows from operating activi-
ties. In doing so, we plan to carry out shareholder returns in
a flexible manner with the purpose of improving capital
efficiency after first giving consideration to maintaining a
balance with an appropriate amount of internal reserves for
future growth investments. We also aim for a consolidated
payout ratio of 30% or more.
• The annual dividend for fiscal 2017 is
¥52, representing an increase for the
fourth consecutive year.
• The annual dividend for fiscal 2018 is
forecast to be ¥56.
Returns to ShareholdersYen %
(Fiscal year ended)
Annual per-share dividend (yen) Dividend payout ratio (%)
Yamaha Corporation Annual Report 2017 21
Financial SectionGrowth FoundationManagement Strategy About Yamaha

Takuya NakataDirector, President and
Representative Executive Officer
Masahito HosoiDirector
Junya HakodaOutside Director
Shigeru NosakaOutside Director
Board of Directors (As of June 23, 2017)
22

Satoshi YamahataDirector and Managing Executive Officer
Yoshimi NakajimaOutside Director
Taku FukuiOutside Director
Hiroyuki YanagiOutside Director
Masatoshi ItoOutside Director
Yamaha Corporation Annual Report 2017 23
Financial SectionGrowth FoundationManagement Strategy About Yamaha

page 25 Research and Development and Intellectual Property
page 28 Corporate Social Responsibility (CSR)
page 32 Yamaha’s Approach to Human Resources
page 34 TOPICS: Messages from the Outside Directors
page 36 Corporate Governance
page 49 Risk Factors
Growth Foundation
24

Research and Development
Without being limited to sound itself, Yamaha is promoting R&D activities in a wide variety of technological fields that support the utilization of sound, from fundamental technologies to application methods. These fields include technologies related to materials and analysis, sensing, mechatronics, sound generation, signal pro-cessing, networks, and sensitivity evaluation. In fiscal 2017, Yamaha identified sound, music, networks, and devices as focus areas. In particular, Yamaha endeavored to enhance its scientific understanding of what constitutes “good sound” and advanced R&D initiatives to actually apply “good sound” to its musical instruments and audio equipment design processes. In addition, Yamaha took initiatives to upgrade its vari-ous technologies, such as physical modeling, musical analysis, and singing voice synthesis, as well as to advance the develop-ment of high-quality sound transmission technology for the net-work generation and technology related to wireless connectivity. Yamaha’s R&D structure consists of two sections. The first sec-tion is the Research and Development Division, which is located within the Technology Unit. This section oversees the R&D functions for enhancing the Company’s foundational elemental technologies and creating new businesses. The other section is the Technology Development Division, which handles the product development functions of each business division as well as subsidiaries.
Technologies Accumulated through R&DGuided by the expertise passed on from generation to generation and a sensitivity toward sound creation, Yamaha has accumulated a vast array of original technologies over its long history of manu-facturing acoustic instruments. In the field of digital instruments and audio equipment, Yamaha has developed groundbreaking electronics technology. In recent years, Yamaha has expanded the scope of its technologies through the addition of new companies to the Group. By drawing on the strengths of these technologies and fusing them together, Yamaha has continued to provide new value that only it can create as well as new ways to enjoy and utilize sound and music.
(1) Technologies in the Musical Instruments Domain In the musical instruments domain, Yamaha processes wood
and metal materials in order to provide its customers with even more fulfilling sound and music. In addition, through the con-tinued research of technologies related to the mechanisms of keyboard actions, sound generation and effects, as well as acoustics, the Company actively pursues good sound and superior performance.
• Wood reforming technology A.R.E (Acoustic Resonance
Enhancement): Yamaha’s original wood reforming technol-ogy that ages wood in a short period of time
• Research on instrument structure; research and analysis on the vibrations and sounds that occur within acoustic instruments
• Sound source development: Development of FM sound generator, AWM sound generator, and physical model sound generator
(2) Technologies in the Audio Equipment Domain In the audio equipment domain, Yamaha draws on the strengths
of cutting-edge software and electronics technologies, centered primarily on digital signal processing and network technologies, using its expertise and know-how related to sound. Yamaha offers high-value-added products such as AV products and PA equipment as well as network devices.
• Fluid sound control technology, Twisted Flare Port™ • Virtual Circuitry Modeling (VCM) technology, RIVAGE™ • MusicCast® wireless transmission technology
Yamaha has adopted the corporate slogan of “Sharing Passion & Performance” and a corporate philosophy of “with our unique expertise and sensibilities, gained from our devotion to sound and music, we are committed to creating excitement and cultural inspiration together with people around the world.” In addition, Yamaha has established a medium- to long-term management vision of becoming an indispensable, brilliantly individual company. Guided by this slogan, philosophy, and vision, Yamaha has designated the technologies it has amassed in the fields of sound and music as core technologies in order to promote its business activities, and is conducting R&D activities with the aim of further advancing and extending these technologies. In addition, Yamaha is further sharpening its competitive edge by linking together its R&D strategies and intellectual property strategies.
YVN500S Artida™ violin with A.R.E.™ technology
Analysis of the vibrations of guitar surface
DX7 Synthesizer
FM sound generator: A method for modulating the frequency of waveform and creating tone
SY77 Synthesizer
AWM sound generator: A method for creating tone by recorded sound of an instrument
VL1 Synthesizer
Physical model sound generator: A method that virtually creates an instrument’s structure to make sound
Preamplifiers with VCM technology used in RIVAGETM
Yamaha Corporation Annual Report 2017 25
Financial SectionGrowth FoundationManagement Strategy About Yamaha
Research and Development and Intellectual Property

(3) Technological Fusion and Creating More Value Not only does Yamaha evolve the technologies it has cultivated over many years, the Company promotes the fusion
of its technologies to offer new hybrid instruments as well as to innovate its existing products. At the same time, the Company is creating entirely new products in new businesses, thereby providing customers with both surprise and excitement.
• TransAcoustic™ Piano• TransAcoustic™ Guitar• Brass instrument silencing system, SILENT Brass™• Flagship Speaker, NS-5000• VOCALOID™• Omotenashi Guide™
Motion Control Synthesis Engine
The Motion Control Synthesis Engine is a comprehensive tone gener-ation system that combines two types of sound generators and three types of controllers, giving it the power to realize a dynamic and overwhelmingly expressive musical performance in a manner more fluid than conventional synthesizers. The engine combines the excel-lent sound reproduction of the Advanced Wave Memory™ 2 (AWM2) sound generator with the dynamic tonal expression of the newly developed FM-X frequency modulation sound generator. The engine also comes equipped with Motion Control, which continually shifts complex sound across a diverse control source. Motion Control drastically changes sounds in line with the musi-cian’s performance and synchronizes these changes with the rhythm, thereby delivering a sound rich in expression. In addition, Motion
Control is able to reflect the pas-sion of the musician in the instrument through the color and motion of light that is emit-ted in response to changes in sound. This allows for an emotionally rich performance, almost as if the musician and the instrument were having a conversation. In these ways, the function generates truly high-dimensional sound. The Motion Control Synthesis Engine was first applied to Yamaha’s flagship synthesizer model, the MONTAGE™, which was launched in 2016. Going forward, Yamaha will further expand this technology, making it a key feature of its synthesizers.
NS-5000 Flagship Speaker
The NS-5000 is Yamaha’s flagship speaker that brings together the latest speaker and analysis technologies. The speaker unit, which uses newly developed diaphragms, and the cabinet, which incorpo-rates the latest R&D accomplishments, realize unlimited quietness and a clear sound, allowing for music to be clearly reproduced as is. The newly developed diaphragms of the tweeter, mid-range, and woofer use ZYLON®—the world’s strongest fiber with an ideal elastic modulus and a speed of sound that rivals beryllium. This allows the NS-5000 to reproduce extremely pleasant sounds with a high level of sophistication by realizing uniform tone quality across all fre-quency bands. Moreover, in order to control the unnecessary sound that is emitted from the back of the tweeter and mid-range units, the NS-5000 is equipped with a resonance suppression (R.S.) chamber, which has a flat frequency response that negates tube resonance without using a large amount of acoustic absorbent materials.
In these ways, the NS-5000 is able to achieve reproduction of even higher resolution. As for the cabinet box sound, which is background noise that occurs when vibration is present, the NS-5000 controls even micro-scopic box sounds through the use of the latest finite element method (FEM) analysis that lever-ages the strengths of laser scan measurements. Going forward, Yamaha plans on expanding its product lineup of speakers that utilize these technologies.* ZYLON® is a registered trademark of Toyobo Co., Ltd. in Japan
Disklavier ENSPIRE + MusicCast—Connecting Musical Instruments with Audio Systems
Offering a new way to enjoy music at home through the integration of Disklavier ENSPIRE, a hybrid piano equipped with an automatic performance function, with the audio system MusicCast. Through the integration of the world’s most advanced piano, the Disklavier ENSPIRE, with Yamaha’s high-fidelity MusicCast wire-less audio system, customers can enjoy the sound and music of a real acoustic piano in any room of their house. This seamless integra-tion allows customers to experience the sound of the Disklavier ENSPIRE piano directly in the room where it is located, or send the piano performance wirelessly to other areas of their home using the MusicCast mobile app.
R&D Achievements
VOCALOID™
TransAcousticTM Guitar, incorporating actuator to generate reverb and chorus effects
26
Research and Development and Intellectual Property
Intellectual Property
The foundation that supports Yamaha’s extensive business develop-ment is the technology and know-how that it has accumulated within the Group over many years of R&D activities. To support this technology and know-how and to accelerate the further accu-mulation of intellectual property rights, Yamaha has actively invested resources in its R&D activities. Moreover, with a primary goal of maintaining and improving the competitive edge of the technolo-gies it possesses, Yamaha is expanding its activities to acquire, maintain, and utilize other related intellectual property rights. Since its founding, Yamaha has sought to acquire its various patents and other intellectual property rights while simultaneously respecting the intellectual property rights held by third parties. More recently, the Company has taken steps to integrate its busi-ness, R&D, and intellectual property strategies by implementing a number of measures designed to maximize the contribution of its intellectual property on its business earnings.
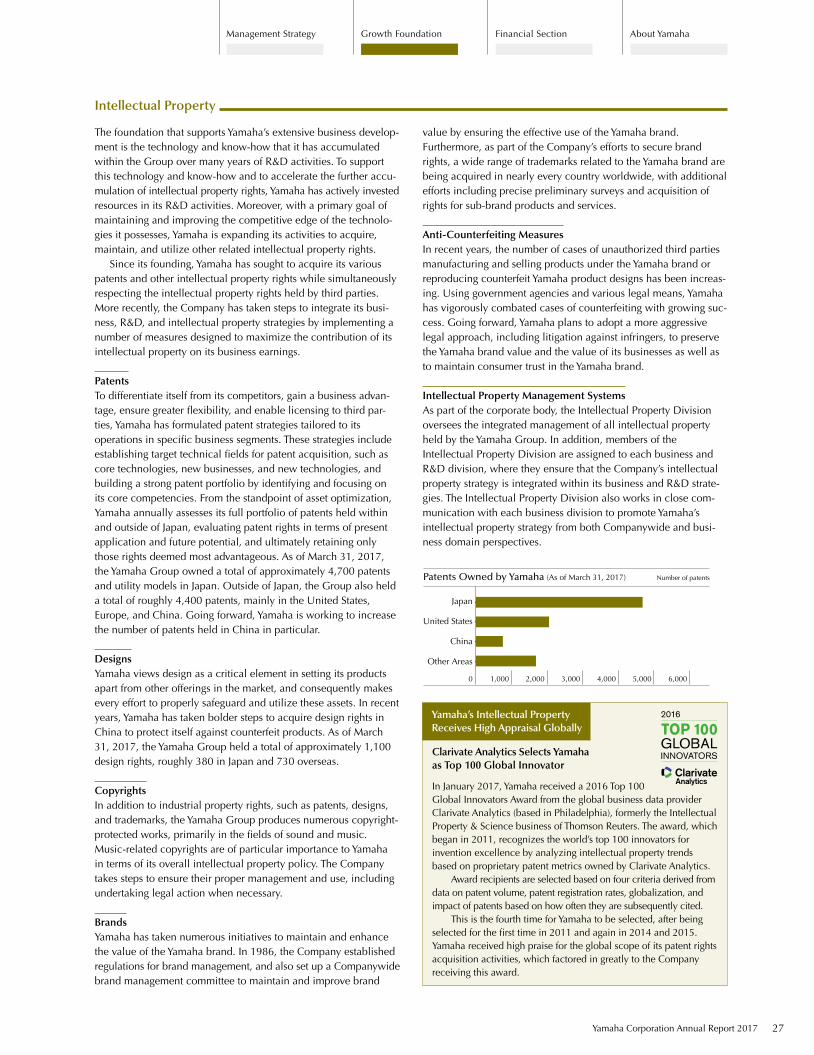
PatentsTo differentiate itself from its competitors, gain a business advan-tage, ensure greater flexibility, and enable licensing to third par-ties, Yamaha has formulated patent strategies tailored to its operations in specific business segments. These strategies include establishing target technical fields for patent acquisition, such as core technologies, new businesses, and new technologies, and building a strong patent portfolio by identifying and focusing on its core competencies. From the standpoint of asset optimization, Yamaha annually assesses its full portfolio of patents held within and outside of Japan, evaluating patent rights in terms of present application and future potential, and ultimately retaining only those rights deemed most advantageous. As of March 31, 2017, the Yamaha Group owned a total of approximately 4,700 patents and utility models in Japan. Outside of Japan, the Group also held a total of roughly 4,400 patents, mainly in the United States, Europe, and China. Going forward, Yamaha is working to increase the number of patents held in China in particular.
DesignsYamaha views design as a critical element in setting its products apart from other offerings in the market, and consequently makes every effort to properly safeguard and utilize these assets. In recent years, Yamaha has taken bolder steps to acquire design rights in China to protect itself against counterfeit products. As of March 31, 2017, the Yamaha Group held a total of approximately 1,100 design rights, roughly 380 in Japan and 730 overseas.
CopyrightsIn addition to industrial property rights, such as patents, designs, and trademarks, the Yamaha Group produces numerous copyright-protected works, primarily in the fields of sound and music. Music-related copyrights are of particular importance to Yamaha in terms of its overall intellectual property policy. The Company takes steps to ensure their proper management and use, including undertaking legal action when necessary.
BrandsYamaha has taken numerous initiatives to maintain and enhance the value of the Yamaha brand. In 1986, the Company established regulations for brand management, and also set up a Companywide brand management committee to maintain and improve brand
value by ensuring the effective use of the Yamaha brand. Furthermore, as part of the Company’s efforts to secure brand rights, a wide range of trademarks related to the Yamaha brand are being acquired in nearly every country worldwide, with additional efforts including precise preliminary surveys and acquisition of rights for sub-brand products and services.
Anti-Counterfeiting MeasuresIn recent years, the number of cases of unauthorized third parties manufacturing and selling products under the Yamaha brand or reproducing counterfeit Yamaha product designs has been increas-ing. Using government agencies and various legal means, Yamaha has vigorously combated cases of counterfeiting with growing suc-cess. Going forward, Yamaha plans to adopt a more aggressive legal approach, including litigation against infringers, to preserve the Yamaha brand value and the value of its businesses as well as to maintain consumer trust in the Yamaha brand.
Intellectual Property Management SystemsAs part of the corporate body, the Intellectual Property Division oversees the integrated management of all intellectual property held by the Yamaha Group. In addition, members of the Intellectual Property Division are assigned to each business and R&D division, where they ensure that the Company’s intellectual property strategy is integrated within its business and R&D strate-gies. The Intellectual Property Division also works in close com-munication with each business division to promote Yamaha’s intellectual property strategy from both Companywide and busi-ness domain perspectives.
Clarivate Analytics Selects Yamaha as Top 100 Global Innovator
In January 2017, Yamaha received a 2016 Top 100 Global Innovators Award from the global business data provider Clarivate Analytics (based in Philadelphia), formerly the Intellectual Property & Science business of Thomson Reuters. The award, which began in 2011, recognizes the world’s top 100 innovators for invention excellence by analyzing intellectual property trends based on proprietary patent metrics owned by Clarivate Analytics. Award recipients are selected based on four criteria derived from data on patent volume, patent registration rates, globalization, and impact of patents based on how often they are subsequently cited. This is the fourth time for Yamaha to be selected, after being selected for the first time in 2011 and again in 2014 and 2015. Yamaha received high praise for the global scope of its patent rights acquisition activities, which factored in greatly to the Company receiving this award.
Yamaha’s Intellectual Property Receives High Appraisal Globally
Patents Owned by Yamaha (As of March 31, 2017) Number of patents
0 1,000 2,000 4,000 5,000 6,0003,000
Japan
United States
China
Other Areas
Yamaha Corporation Annual Report 2017 27
Financial SectionGrowth FoundationManagement Strategy About Yamaha

In all its interactions with stakeholders, the Yamaha Group seeks through its business activities to exceed customer expectations and create excitement. Through activities grounded in the fields of sound and music, we will continue to share passion and performance and enrich culture along with people around the world.
Basic Approach to CSR
The mission of the Yamaha Group is to continue pursuing its corporate philosophy of “with our unique expertise and sensibilities, gained from our devotion to sound and music, we are committed to creating excitement and cultural inspiration together with
people around the world.” To put this philosophy into practice, Yamaha works to establish and maintain bonds of trust with its stakeholders while also contributing to the creation of a sustain-able society through its business activities.
Policy and Framework for CSR Promotion
The Yamaha Group continues to engage in a variety of CSR issues by offering products and services and engaging in business processes and corporate activities in regional societies. The Group uses the social responsibility international guideline ISO 26000 to identify and organize the CSR issues it involves itself in. By taking into account the importance of these issues to the Group and their impact on stakeholders, we decide which issues to prioritize as well as the details of our efforts toward these issues. In fiscal 2016, a council made up of our top management established strategic CSR themes in which the Group should strengthen its initiatives. Along with the revision of our CSR policy in fiscal 2017 based on these themes, we incorporated them into our medium-term management plan as part of our ESG agenda. The status of initia-tives pertaining to each theme is followed up on through review at management meetings headed by the President.
Strategic CSR Themes• Development of products and services with a focus on social
issues (universal design, environmentally friendly products, application of sound technologies, etc.)
• Development of regional community-based business and social contribution activities (resolution of regional issues through music, contribution to the development of regional communi-ties, etc.)
• Lowering of greenhouse gas emissions (emission management that expands the scope of emissions throughout the entire supply chain, etc.) Sustainable procurement of timber (stringent verification of traceability and lawfulness, expanded use of certified timber, etc.)
• Socially responsible procurement (by confirming adherence to the Yamaha Supplier CSR Code of Conduct and making requests for improvements when necessary, etc.)
• Systematic initiatives for the respect of human rights (evaluating the influence of our business activities on human rights, etc.)
• Promotion of diversity and human resources development (promotion of the active role of female workers, cultivation of global human resources, etc.)
28
Corporate Social Responsibility (CSR)
Yamaha Corporation Group CSR Policy
Our aim is “Sharing Passion & Performance”
The Corporate Philosophy of the Yamaha Corporation Group is, “With our unique expertise and sensibilities, gained from our devotion to sound and music, we are committed to creating excitement and cultural inspiration together with people around the world.” Based on this philosophy, Yamaha conducts its CSR activities according to the following guidelines, seeking to contribute to the sustainable development of society and to further strengthen the bond of trust with its stakeholders through sound, transparent management methods, and corporate activities that balance social and environmental concerns.
1 By creating new values through products and services focused on social and environmental issues, Yamaha contributes to the sustainable development of society.
2 Through business development and social contributions based in each region of the globe, Yamaha contributes to the promo-tion and popularization of music, and to the development of communities.
3 By understanding the significance of protecting the natural environment and maintaining biodiversity, and by promoting the reduction of environmental burden through measures such as sustainable procurement of timber and lowering greenhouse gas emissions, Yamaha works to maintain a healthy global environment.
4 Yamaha observes laws, ordinances, and social norms, and moreover, conducts business in a fair and impartial manner throughout the entire value chain, including activities such as socially responsible procurement carried out in cooperation with business partners.
5 Yamaha endeavors to prevent abuses of human rights, responding appropriately to the effect of its business activities as well as to any attendant risks to human rights, with the goal of achieving a society that safeguards the dignity of all.
6 Yamaha works to create an atmosphere that holds in high regard the employee diversity that is a source of the new values created within the Company, and which allows each person to fully demonstrate their sensibilities and creativity through training and use, without regard to race, nationality, gender, or age.
Formulated in February 2010 and revised in June 2016
Participation in the United Nations Global Compact
Yamaha endorses the United Nations Global Compact, a voluntary code of conduct that encourages businesses worldwide to adopt sustainable and socially responsible policies. Yamaha signed the Compact in June 2011 and has been promoting initiatives in adherence with the Compact’s 10 principles in the four areas of
human rights, labor, environment, and anti-corruption. At the same time, the Company has been actively cooperating with Global Compact Network Japan in such ways as managing
subcommittees.
External Evaluation
Socially responsible investment (SRI) is an investing activity that values companies not only from a financial perspective but also from social and environmental viewpoints as well. SRI indexes are used by investors to determine what companies to invest in based on whether or not a company is fulfilling their social responsibilities. Yamaha is listed on such major international
SRI indexes as the FTSE4Good Global Index, MSCI Global Sustainability Indexes, and Morningstar Social Responsibility Index (MS-SRI).
CSR Education
In promoting initiatives based on our CSR Policy, the Yamaha Group believes it is important to deepen employee understanding of CSR and raise awareness for environmental and social issues. The Yamaha Group engages in educational and awareness-raising
activities by sending CSR information via its website and Intranet, as well as training for all employees, from managers to new recruits, with the aim of promoting CSR throughout each aspect of its business operations.
Fiscal 2017 ResultsItem Target Content Number of participants
Basic CSR training New recruits, etc.Introduction to CSR, Explanation of Yamaha Group CSR Policy and measures, etc.
47
E-learning Domestic Group employees Comprehension check of CSR reports 828
CSR Intranet Domestic Group employeesExplanation of key CSR themes, Introduction of best practices in Yamaha and other companies, etc.
—
Yamaha Corporation Annual Report 2017 29
Financial SectionGrowth FoundationManagement Strategy About Yamaha

Yamaha Eco-Products Program
Guided by its Environmental Policy, the Yamaha Group is working to create environmentally friendly products in order to contribute to the creation of a sustainable society. To support this effort, Yamaha established the Yamaha Eco-Products Program in 2015, which certifies environmentally friendly products that meet standards established by the Company. The Yamaha Eco-Label is attached to products that meet the Company’s standards. By providing customers with easy-to- understand information on the environment, the program aims to assist customers in selecting which products to purchase.
Yamaha Forest
Yamaha Corporation and its six local Indonesian subsidiaries contribute to local communities in Indonesia, where the Yamaha Group has its production and sales offices, by carrying out Yamaha Forest project activities, such as environmental preservation through tree-planting and educational support. Indonesia is a treasure trove of diverse world species. In recent years, however, that bounty of biodiversity has been in rapid decline. Phase I (fiscal 2006–2010) of the Yamaha Forest project, conducted in conjunction with the Yamaha Motor Group, involved planting roughly 110,000 saplings over approximately 127 hect-ares of public land in Sukabumi, West Java in efforts to restore the functionality of the forest. This area has been designated as hutan kota (city forest preserve) and is thus appropriately managed by the provincial government. Phase II (fiscal 2011–2015) of the project involved planting roughly 50,000 saplings over approxi-mately 50 hectares of arid land in Gunung Ciremai National Park in Kuningan, West Java with the goal of restoring natural forests and ecosystems of the area. Fiscal 2016–2017 involved mainte-nance work, such as cutting grass and addressing moisture reten-tion. Once completed, we transferred control of the newly grown
trees to Gunung Ciremai National Park, which will appropriately manage them going forward. At present, the two phases are showing steady growth. Moving forward, Yamaha Forest will persist in its conservation efforts under the management of local governments and concerned parties.
Promoting Introduction of Instrumental Music Education in Vietnam
Music education programs teaching children how to play instru-ments have been adopted on a large scale in schools worldwide. However, due to a lack of equipment and instructors, as well as curriculum issues, instrumental music education is not provided, or is of insufficient quality, in music classes in some countries. Yamaha is developing a “school project” program to offer opportu-nities to play instruments and allow as many children as possible to experience the joy of musical instruments. As an element of the “school project,” Yamaha began support activities in January 2016 for the introduction and sustainment of musical instrument instruction as part of music classes in primary and secondary education in Vietnam. The “Course of Study” in
Number of Directors Number of Employees
2013/3 2014/3 2015/3 2016/3 2017/3Percentage of female employees 21.6% 20.0% 17.2% 17.8% 17.5%Percentage of female employees in management positions 4.4% 4.7% 4.8% 4.8% 4.6%Average years of continuous employment (years) 20.1 20.6 20.3 19.8 20.9Percentage of persons with disabilities employed 2.08% 2.15% 2.38% 2.42% 2.35%
Human Resources Data
Topics
Note: Figures in this table are for Yamaha Corporation only
Standing directors Outside directors
Domestic Overseas Temporary employees, etc.
0
3
6
12
9
6 6667
15/3 16/314/313/3 17/3 0
10,000
20,000
40,000
30,000 27,886 27,714 27,737 28,338 28,113
15/3 (Fiscal year ended)16/314/313/3 17/3
30
Corporate Social Responsibility (CSR)

elementary and junior high schools in Vietnam does not include the actual playing of musical instruments as part of musical educa-tion. For that reason, teaching in music classes is focused on reading music and music theory/knowledge, with singing as the only form of practice. As a comprehensive musical instruments manufacturer, Yamaha has been spreading the advantages of instrumental music education in music classrooms all over the world. Based on this experience, Yamaha is working in cooperation with Vietnam’s Ministry of Education and Training toward revising the “Course of Study” for primary and secondary education to include musical instrument instruction, slated to begin in 2018. In fiscal 2017, this initiative was chosen as an official project by the Ministry of Education, Culture, Sports, Science and Technology for their ongoing “EDU-Port Japan” project to spread Japanese-style education overseas. Yamaha is working with the Japanese government to enrich music education and improve the overall quality of education in Vietnam through the introduction and sustainment of musical instrument instruction.
Omotenashi Guide: A system supporting the universal design of sound
Yamaha Corporation has been conducting demonstration experi-ments of the Omotenashi Guide service since 2015. This service supports the development of conve-nient guides featuring a number of written and spoken languages for use by businesses, public institutions, and tourist destinations looking to promote themselves to inbound tourists and become more barrier free. In places where voice announcements are made using this technology, Omotenashi Guide users can receive real-time infor-mation translated into their required language simply by opening the application on their smartphone or tablet. Through this service, people who do not speak Japanese, are elderly or have difficulty hearing will have easy access to the contents of spoken Japanese announcements. As a global sound and music company, Yamaha aims to help even more people gain easy access to useful information through advancing initiatives to support universal design of sound. Furthermore, the IAUD (International Association for Universal Design) Award 2016 Selection Committee chose the Omotenashi Guide for a gold award, praising its simplicity and utility, particu-larly with the approaching influx of foreign visitors arriving for the 2020 Olympic and Paralympic Games. The service was further recognized by the Japanese Cabinet Office for “demonstrating outstanding achievements in promoting barrier-free universal design in fiscal 2017” and earned the Minister of State Encouragement Award.
For more in-depth reporting on Yamaha’s CSR activities, please visit
“Corporate Social Responsibility” on Yamaha’s website: https://www.yamaha.com/en/csr/
GHG (Greenhouse Gas) Emissionst-CO2
Water Usage Amountsm3
Environmental Performance Data
Notes: 1. The environmental performance data includes figures of Yamaha headquarters, all the production sites, and resort facilities covering more than 90% of the group site.
2. Total of direct CO2 emissions from purchased energy and steam generation, direct CO2 emissions from private power generation and use of heat, and the amount of GHG used and emitted in the manufacturing processes
3. Numerical figures differ from previous measurements as recalculations have been broken down by fiscal year and according to the CO2 emission coefficient of manufacturing bases by power company and region.
0
100,000
200,000
300,000
15/3 16/314/313/3
198,689 196,478 189,740166,406 157,062
17/3 0
1,000,000
2,000,000
4,000,000
3,000,000 2,679,621 2,807,6492,978,292
2,404,8062,210,447
15/3 16/314/313/3 17/3
Yamaha Corporation Annual Report 2017 31
Financial SectionGrowth FoundationManagement Strategy About Yamaha

Yamaha considers human resources to be its most important management resource in supporting corporate growth. As such, the Company believes that, regardless of age, gender, or nation-ality, leveraging a diverse group of employees with various life-styles, including those with time constraints due to raising children or caregiving, will help reinforce the Company’s competitiveness and lead to further growth and development. In addition to ensuring fairness in the Company’s hiring processes, Yamaha makes efforts so that all employees are able to demonstrate their abilities and express themselves freely, regardless of race, age, or gender. At the same time, the Company has established personnel development programs to help employees grow as professionals. In these ways, Yamaha is working to create a pleasant work envi-ronment supported by active dialogue with its employees. Yamaha conducts its business at 53 locations throughout 31 countries, with overseas sales accounting for 66% of the Company’s overall sales. As a key policy, Yamaha makes focused efforts to employ global human resources and strengthen its devel-opment of these human resources so that they can be active on
a global scale. Further, the Company is actively promoting initia-tives to assign local talent to key positions at overseas subsidiaries. As of March 31, 2017, the Yamaha Group had 20,175 employees worldwide (in addition to 7,938 temporary employees).
Number of employees Number of temporary employees (yearly average)
Yamaha’s Human Resources Development
Yamaha has in place a human resources development system that focuses equally on employee education and training and career development to create a mutually beneficial relationship between the employee and the Company. With the underlying goal of developing human resources that are active on a global scale, Yamaha implements training and education programs tailored to a specific objective in one of the following categories: Stratified Training, Strategic Personnel Development, Position-Specific Training, and Self-Development Education. In Stratified Training, Yamaha carries out training programs in accordance with the respective career turning points of each employee. These programs work to raise the overall level of human resources by enhancing the skills of individual employees. In Strategic Personnel Development, Yamaha offers programs designed to cultivate the next generation of core employees through the Yamaha Global Institute and the Yamaha Management Institute,
which aim to develop global human resources who will act as the backbone of the Company in the future. Yamaha also operates the Yamaha Sales Company Executive College (Y-SEC), which provides sales management training in Japan and overseas, and the Senior Specialist Institute (SSI), which conducts manufacturing manage-ment training for personnel at all Group production plants in Asia. At production sites in Japan, the Company has set up the Yamaha Advanced Skill School as well as the Technology Training Center. For Position-Specific Training, Yamaha implements courses for craftsmanship skill development and quality management, international education programs, and core technology training programs (signal processing, sound and vibration, and materials engineering). In Self-Development Education, Yamaha provides support for employees’ self-directed studies, including through the Yamaha Business School, a correspondence education program.
Implementation DetailsAnnual number of participants
Training hours per employee
Total number of lecture attendees
Stratified Training Enhancement of skills of employees in accordance with their respective career turning points 400 15–30 hours a year
2,000 (most recent 5 years)
Yamaha Global Institute Cultivation of core human resources who will be involved in future management (Last implemented in 2013) 17 15 days a year 51
Yamaha Management Institute Cultivation of core human resources who will be involved in future management (Not implemented in 2016) 18 27 days a year 90
Group Production Plant Management Development program (SKIP)
Cultivation of managers at production plants (Last implemented in 2012) 6 80 days a year 26
Senior Specialist Institute (SSI) Cultivation of human resources involved in production management 12 40 days 38
Yamaha Sales Company Executive College
Cultivation of human resources (sales office directors and managers, etc.) involved in sales management (Commenced in February 2017) 8 12 days (96 hours) 0
From–To Program Transmission of core techniques for manufacturing musical instruments 20 — 500
Yamaha Advanced Skill School Cultivation of managers at domestic Group production plants 16 370 hours 700Yamaha Technology Training Center Cultivation of human resources who will act as the backbone
of domestic Group production plants 30 180 hours 1,500Overseas / Language training Study abroad for the purpose of learning a foreign language
and improving speaking capability 2 6 months 29Yamaha Business School (correspondence education program)
Support for the self-directed studies of employees (correspondence education) 250 —
Conditions of Training Programs Implemented in Fiscal 2017
Number of Employees by Region (As of March 31, 2017)
0
Japan
North America
Europe
China
Other
2,000 4,000 8,000 10,000 14,00012,0006,000
32
Yamaha’s Approach to Human Resources
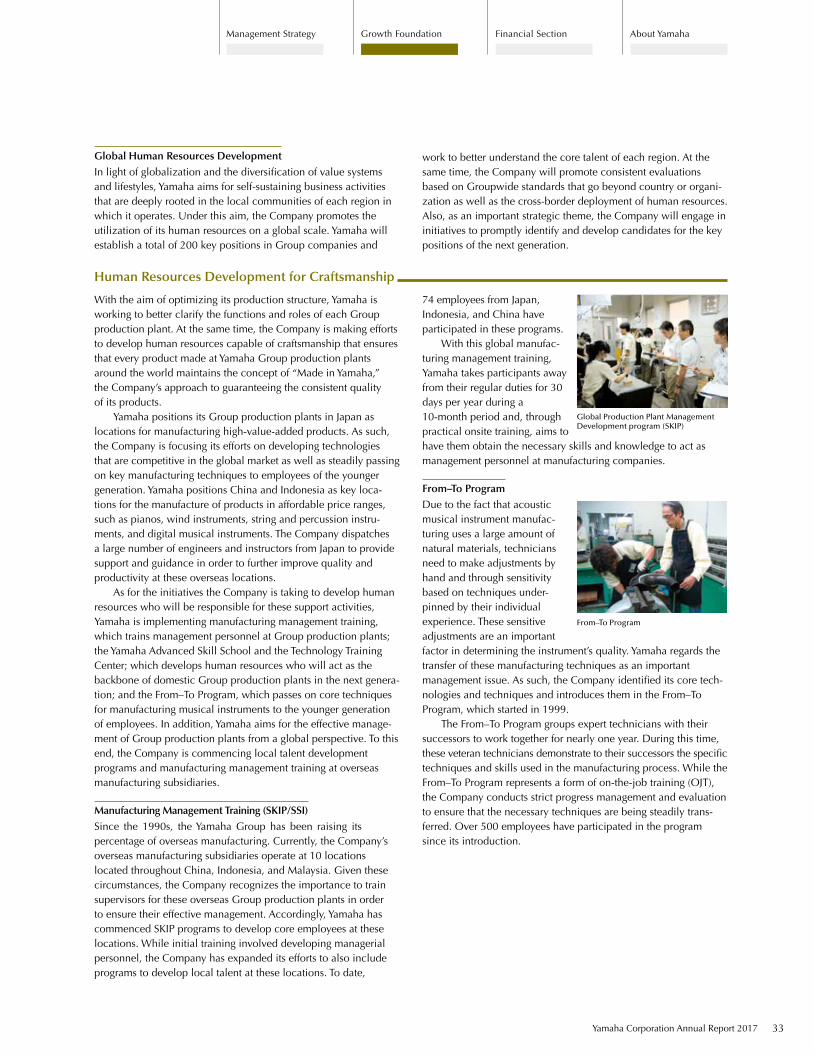
Global Human Resources Development
In light of globalization and the diversification of value systems and lifestyles, Yamaha aims for self-sustaining business activities that are deeply rooted in the local communities of each region in which it operates. Under this aim, the Company promotes the utilization of its human resources on a global scale. Yamaha will establish a total of 200 key positions in Group companies and
work to better understand the core talent of each region. At the same time, the Company will promote consistent evaluations based on Groupwide standards that go beyond country or organi-zation as well as the cross-border deployment of human resources. Also, as an important strategic theme, the Company will engage in initiatives to promptly identify and develop candidates for the key positions of the next generation.
Human Resources Development for Craftsmanship
With the aim of optimizing its production structure, Yamaha is working to better clarify the functions and roles of each Group production plant. At the same time, the Company is making efforts to develop human resources capable of craftsmanship that ensures that every product made at Yamaha Group production plants around the world maintains the concept of “Made in Yamaha,” the Company’s approach to guaranteeing the consistent quality of its products. Yamaha positions its Group production plants in Japan as locations for manufacturing high-value-added products. As such, the Company is focusing its efforts on developing technologies that are competitive in the global market as well as steadily passing on key manufacturing techniques to employees of the younger generation. Yamaha positions China and Indonesia as key loca-tions for the manufacture of products in affordable price ranges, such as pianos, wind instruments, string and percussion instru-ments, and digital musical instruments. The Company dispatches a large number of engineers and instructors from Japan to provide support and guidance in order to further improve quality and productivity at these overseas locations. As for the initiatives the Company is taking to develop human resources who will be responsible for these support activities, Yamaha is implementing manufacturing management training, which trains management personnel at Group production plants; the Yamaha Advanced Skill School and the Technology Training Center; which develops human resources who will act as the backbone of domestic Group production plants in the next genera-tion; and the From–To Program, which passes on core techniques for manufacturing musical instruments to the younger generation of employees. In addition, Yamaha aims for the effective manage-ment of Group production plants from a global perspective. To this end, the Company is commencing local talent development programs and manufacturing management training at overseas manufacturing subsidiaries.
Manufacturing Management Training (SKIP/SSI)
Since the 1990s, the Yamaha Group has been raising its percentage of overseas manufacturing. Currently, the Company’s overseas manufacturing subsidiaries operate at 10 locations located throughout China, Indonesia, and Malaysia. Given these circumstances, the Company recognizes the importance to train supervisors for these overseas Group production plants in order to ensure their effective management. Accordingly, Yamaha has commenced SKIP programs to develop core employees at these locations. While initial training involved developing managerial personnel, the Company has expanded its efforts to also include programs to develop local talent at these locations. To date,
74 employees from Japan, Indonesia, and China have participated in these programs. With this global manufac-turing management training, Yamaha takes participants away from their regular duties for 30 days per year during a 10-month period and, through practical onsite training, aims to have them obtain the necessary skills and knowledge to act as management personnel at manufacturing companies.
From–To Program
Due to the fact that acoustic musical instrument manufac-turing uses a large amount of natural materials, technicians need to make adjustments by hand and through sensitivity based on techniques under-pinned by their individual experience. These sensitive adjustments are an important factor in determining the instrument’s quality. Yamaha regards the transfer of these manufacturing techniques as an important management issue. As such, the Company identified its core tech-nologies and techniques and introduces them in the From–To Program, which started in 1999. The From–To Program groups expert technicians with their successors to work together for nearly one year. During this time, these veteran technicians demonstrate to their successors the specific techniques and skills used in the manufacturing process. While the From–To Program represents a form of on-the-job training (OJT), the Company conducts strict progress management and evaluation to ensure that the necessary techniques are being steadily trans-ferred. Over 500 employees have participated in the program since its introduction.
From–To Program
Global Production Plant Management Development program (SKIP)
Yamaha Corporation Annual Report 2017 33
Financial SectionGrowth FoundationManagement Strategy About Yamaha

Two years have passed since I was appointed as an outside
director at Yamaha. During this time, I have noticed that even
before the formulation of Japan’s Corporate Governance Code,
Yamaha’s corporate culture has emphasized the utilization of
outside opinions within the Company’s management, rather
than just relying on decisions made internally. With an aware-
ness of the importance and necessity of incorporating diverse
perspectives into its management, Yamaha has been fulfilling
the responsibilities it has to its stakeholders. At the same time,
within the core of its corporate governance structure, the
Company has firmly established the idea of bolstering a busi-
ness foundation that creates new value. Amid Yamaha’s transi-
tion to a Company with Three Committees (Nominating, Audit,
and Compensation), the Company has had an underlying
desire to not only incorporate more diverse opinions and carry
out more effective decision-making, but also promote timely
business execution and enhance corporate value in a sustain-
able manner, even within an uncertain business environment.
As for the current state of the Board of Directors, I truly
believe that the Board operates with a high level of effective-
ness and takes into account the opinions of the outside direc-
tors. While the inside directors respect our opinions, I feel that
they could also voice their opinions more actively at Board
meetings. The inside directors oversee the Company’s business
execution and have to take responsibility for their manage-
ment decisions. As such, it is necessary to have support from
an outside perspective when deciding on items that are
accompanied by risk. By transitioning to a Company with
Three Committees (Nominating, Audit, and Compensation),
the Company has further clarified the separation between the
roles of business execution and business supervision. As such,
the outside directors, including myself, will fulfill the role of
monitoring, evaluating, and supporting the inside directors as
they carry out the task of business execution. Going forward,
I believe the Company must further enhance the effectiveness
of the Board of Directors through the support of business exe-
cution by the outside directors and through efforts to encour-
age livelier discussion at the Board of Directors’ meetings.
Guided by its technologies that create sound, Yamaha is
a company with a sustainable corporate mission that
involves improving its core technologies while continuing to
enhance its product lineup and offer excitement to its
customers. To realize this mission, it is important for Yamaha
to secure profits, as they provide the source for investment.
As a management indicator, Yamaha has adopted a target of
maintaining ROE at the 10% level in its current medium-term
management plan. To continue to achieve this level for ROE,
I am aware of my responsibility to thoroughly monitor the
Company’s PDCA method to ensure that the new plan is car-
ried out smoothly. I also bear the responsibility of supporting
and encouraging the Company’s management while keeping
an eye on the balance between reinvestments for growth and
capital costs. Going forward, I will continue to proactively
offer advice and support for the Company as it pursues initia-
tives to enhance corporate value.
I am aware of my responsibility to thoroughly monitor the Company’s PDCA method to ensure that the new plan is carried out smoothly.
Shigeru Nosaka
Outside Director
(Director, Executive Vice
President & CFO of Oracle
Corporation Japan)
34
TOPICS: Messages from the Outside Directors

I have been involved in the corporate governance of Yamaha
as an outside director since June 2016. In my honest opinion,
I feel that the Company’s management operates extremely
well. Yamaha’s organizational design is simple, and there is
only a small number of inside and outside directors. As such,
I feel the Company has a very open environment that makes it
easy to hold discussions. As for the proceedings of the Board
of Directors’ meetings, the Board selects agenda items that are
of high importance and require a shared awareness among the
directors, thereby eliminating unproductive debate and
encouraging meaningful conversation. I believe this to be
a very effective approach.
Over the past year, the Board of Directors has held numer-
ous discussions on how to further advance governance and
strengthen the Company’s flexibility. These discussions
eventually led to the Company’s transition to a new organiza-
tional structure. I believe a key point for future discussions is
how to incorporate the new frameworks of this structure into
Yamaha’s management while also leveraging the Company’s
business execution capabilities. After further clarifying the
separation between the roles of business supervision and busi-
ness execution, which was the main reason for this transition,
the Company will work to enact frameworks that accelerate
the pace of business execution.
The outside directors, who come from many different
backgrounds, actively provide their opinions as members of
the Board of Directors. Given my own experience, I aim to
help expand business opportunities for Yamaha from the
perspectives of marketing and both domestic and overseas
business development. For a company such as Yamaha that is
expanding its business globally, it is important to continue to
create examples of business success that are applicable in
both Japan and overseas and realize results not by country,
but rather through an integrated global format. I would like to
fulfill my role as an outside director by offering Yamaha
advice on how to enhance one more step up of their current
business format.
Guided by a clear corporate philosophy that melds seam-
lessly with its corporate behavior, Yamaha carries out its day-
to-day business activities. Going forward, I will help Yamaha
devise methods of communication that help deepen the
understanding of its stakeholders around the world. I will also
help the Company develop frameworks for reflecting stake-
holder opinions in its business activities and product develop-
ment both in Japan and overseas.
Going forward, I will help Yamaha devise methods of communication that help deepen the understanding of its stakeholders around the world.
Masatoshi Ito
Outside Director
(Representative Director
and Chairman of the Board
of Ajinomoto Co., Inc.)
Yamaha Corporation Annual Report 2017 35
Financial SectionGrowth FoundationManagement Strategy About Yamaha

Corporate Governance
Fundamental Approach to Corporate Governance
Adopting the Yamaha Philosophy and its Promise to Stakeholders, which applies to shareholders and all other related parties, Yamaha Corporation and Yamaha Group companies are working to secure global competitiveness and a high level of profitability based on effective management. At the same time, the Company is making efforts to realize sustainable growth and improve corporate value over the medium to long term by fulfilling its social responsibilities in such areas as compliance, the environment, safety, and social contributions. To accomplish these tasks, the Company has established insti-tutional designs for management—in addition to an organizational structure and systems—and is implementing a wide variety of gov-ernance-related measures based on its Basic Policies for Corporate Governance, stated below. At the same time, Yamaha realizes transparent and high-quality management through the appropriate disclosure of information.
Basic Policies for Corporate Governance
• From a shareholder’s perspective, ensure the rights and equal treatment of shareholders
• Taking into consideration our relationships with all stakeholders, proactively fulfill the Company’s social responsibilities
• Ensure that information is disclosed appropriately and that management is transparent
• By separating the oversight and executive functions and strengthening the oversight function, ensure that the Board of Directors is highly effective and is able to execute decisions appropriately and with a sense of urgency
• Proactively engage in dialogue with shareholders
Yamaha Philosophy
• Corporate Slogan: Sharing Passion & Performance• Corporate Philosophy: With our unique expertise and sensibili-
ties, gained from our devotion to sound and music, we are com-mitted to creating excitement and cultural inspiration together with people around the world.
• Customer Experience*1: Joy, Beauty, Confidence, Discovery• Yamaha Quality*2: Excellence, Authenticity, Innovation
• Yamaha Way*3: Embrace Your Will, Stand on Integrity, Take Proactive Actions, Go Beyond the Limits, Stick to the Goals
*1 Customer Experience exemplifies the meaning of “Sharing Passion & Performance” from the customer’s viewpoint. When customers experience, use, or own Yamaha products and services they should experience a profound response that will stimulate both their emotions and senses.
*2 Yamaha Quality is a set of criteria that supports Yamaha’s insistence on quality in products and services and the Company’s dedication to excellence in manufacturing. These criteria assist in making the Corporate Philosophy a reality.
*3 The Yamaha Way explains the mindset that all employees of the Yamaha Group should adopt, and the manner in which they should act on a daily basis, in order to put the Corporate Philosophy into practice.
Promises to Stakeholders
• Customer-Oriented and Quality-Conscious Management
Yamaha fully satisfies its customers by offering quality products and services that incorporate new and traditional technologies as well as refined creativity and artistry.
• Transparent and Sound Management
Yamaha delivers proper returns to shareholders by ensuring a solid business performance and achieves lasting development through transparent and sound management.
• Valuing People
Yamaha strives to be an organization where each person’s individ-uality and creativity are respected and all can demonstrate their full potential through their work.
• Harmony with Society
Yamaha is a good corporate citizen that contributes to the development of society, culture, and the economy by observing laws, demonstrating high ethical standards, and endeavoring to protect the environment.
Moreover, the organizational structure and systems that Yamaha has established for corporate governance conforms to Japan’s Corporate Governance Code. Items of our organizational structure and systems that are not based on the Code are explained and disclosed in sections of our Corporate Governance Report.https://www.yamaha.com/en/ir/governance/
Basic Corporate Governance Structure
Yamaha has transitioned to a Company with Three Committees (Nominating, Audit, and Compensation). Yamaha deems this new organizational model to be appropriate as it will allow the Company to clarify the separation between the roles of business supervision and business execution, ensure a highly effective Board of Directors through the strengthening of oversight func-tions, and realize accurate and swift business execution. Independent outside directors make up a significant propor-tion of outside directors, and the Company has established the
Nominating Committee, the Audit Committee, and the Compensation Committee, which are required by law to consist of a majority of outside directors. In doing so, the Company leverages supervisory functions that are highly transparent and objective. Furthermore, the executive officers, who fulfill a direct respon-sibility to the shareholders, have received the authority from the Board of Directors to oversee important decision-making related to business execution, thereby allowing the Company to realize accurate and swift business execution going forward.
Yamaha aims to further clarify the division between the roles of business execution and business supervision within its management while bolstering the supervisory functions of the Board of Directors and increasing the pace of business execution. Guided by this aim, Yamaha transitioned to a Company with Three Committees (Nominating, Audit, and Compensation) organizational model on June 22, 2017.
36
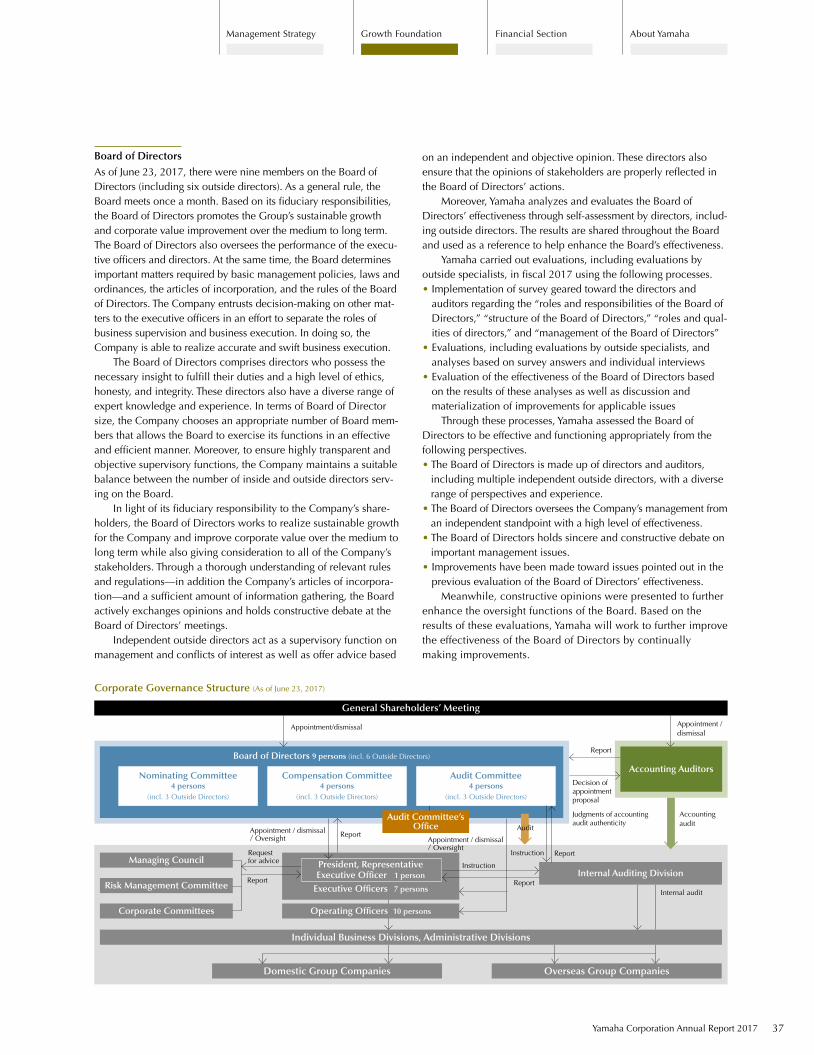
Board of Directors 9 persons (incl. 6 Outside Directors)
Board of Directors
As of June 23, 2017, there were nine members on the Board of Directors (including six outside directors). As a general rule, the Board meets once a month. Based on its fiduciary responsibilities, the Board of Directors promotes the Group’s sustainable growth and corporate value improvement over the medium to long term. The Board of Directors also oversees the performance of the execu-tive officers and directors. At the same time, the Board determines important matters required by basic management policies, laws and ordinances, the articles of incorporation, and the rules of the Board of Directors. The Company entrusts decision-making on other mat-ters to the executive officers in an effort to separate the roles of business supervision and business execution. In doing so, the Company is able to realize accurate and swift business execution. The Board of Directors comprises directors who possess the necessary insight to fulfill their duties and a high level of ethics, honesty, and integrity. These directors also have a diverse range of expert knowledge and experience. In terms of Board of Director size, the Company chooses an appropriate number of Board mem-bers that allows the Board to exercise its functions in an effective and efficient manner. Moreover, to ensure highly transparent and objective supervisory functions, the Company maintains a suitable balance between the number of inside and outside directors serv-ing on the Board. In light of its fiduciary responsibility to the Company’s share-holders, the Board of Directors works to realize sustainable growth for the Company and improve corporate value over the medium to long term while also giving consideration to all of the Company’s stakeholders. Through a thorough understanding of relevant rules and regulations—in addition the Company’s articles of incorpora-tion—and a sufficient amount of information gathering, the Board actively exchanges opinions and holds constructive debate at the Board of Directors’ meetings. Independent outside directors act as a supervisory function on management and conflicts of interest as well as offer advice based
on an independent and objective opinion. These directors also ensure that the opinions of stakeholders are properly reflected in the Board of Directors’ actions. Moreover, Yamaha analyzes and evaluates the Board of Directors’ effectiveness through self-assessment by directors, includ-ing outside directors. The results are shared throughout the Board and used as a reference to help enhance the Board’s effectiveness. Yamaha carried out evaluations, including evaluations by outside specialists, in fiscal 2017 using the following processes.• Implementation of survey geared toward the directors and
auditors regarding the “roles and responsibilities of the Board of Directors,” “structure of the Board of Directors,” “roles and qual-ities of directors,” and “management of the Board of Directors”
• Evaluations, including evaluations by outside specialists, and analyses based on survey answers and individual interviews
• Evaluation of the effectiveness of the Board of Directors based on the results of these analyses as well as discussion and materialization of improvements for applicable issues
Through these processes, Yamaha assessed the Board of Directors to be effective and functioning appropriately from the following perspectives.• The Board of Directors is made up of directors and auditors,
including multiple independent outside directors, with a diverse range of perspectives and experience.
• The Board of Directors oversees the Company’s management from an independent standpoint with a high level of effectiveness.
• The Board of Directors holds sincere and constructive debate on important management issues.
• Improvements have been made toward issues pointed out in the previous evaluation of the Board of Directors’ effectiveness.
Meanwhile, constructive opinions were presented to further enhance the oversight functions of the Board. Based on the results of these evaluations, Yamaha will work to further improve the effectiveness of the Board of Directors by continually making improvements.
Corporate Governance Structure (As of June 23, 2017)
General Shareholders’ Meeting
Nominating Committee4 persons
(incl. 3 Outside Directors)
Individual Business Divisions, Administrative Divisions
President, Representative Executive Officer 1 person
Executive Officers 7 persons
Operating Officers 10 persons
Overseas Group CompaniesDomestic Group Companies
Internal Auditing DivisionRisk Management Committee
Managing Council
Corporate Committees
Compensation Committee4 persons
(incl. 3 Outside Directors)
Audit Committee4 persons
(incl. 3 Outside Directors)
Accounting Auditors
Appointment/dismissal
Report
Accounting audit
Request for advice
Appointment / dismissal/Oversight
Report
Instruction
Audit
Instruction
Report
Report
Report
Internal audit
Decision of appointment proposal
Judgments of accounting audit authenticity
Appointment /dismissal
Audit Committee’s Office
Appointment / dismissal/Oversight
Yamaha Corporation Annual Report 2017 37
Financial SectionGrowth FoundationManagement Strategy About Yamaha
2001 Adopted an executive officer system to separate management decision-making/supervision and execution functions
2003 Reduced the number of full-time directors from nine to eight, appointed an outside director, increased the number of out-side corporate auditors from one to two, and established the Corporate Auditors’ Office
2005 Clearly defined directors’ management responsibilities and reduced the term of directors from two years to one year to create a system that can swiftly respond to changing business environments
2006 Adopted a group manager system that concedes business execution authority to full-time directors so they can swiftly respond to management issues
2009 Increased the number of outside corporate auditors from two to three
2010 Decreased the number of full-time directors from eight to three, increased the number of outside directors from one to two, and registered one outside director as an independent officer as stipulated by Japan’s Financial Instruments and Exchange Act
2011 Reorganized Internal Auditing Division to centralize audit functions and to promote comprehensive audits
2012 Increased the number of outside directors from two to three
2014 Increased the number of full-time directors from three to four
2015 Reduced the number of full-time directors from four to three
2017 Transitioned to a Company with Three Committees (Nominating, Audit, and Compensation)
Reorganization of Systems and Structure to Strengthen Corporate Governance
Nominating Committee
As of June 23, 2017, the Nominating Committee consisted of four members (three of whom were outside directors). Outside direc-tors account for the majority of the Committee, whose members and chair are determined by the Board of Directors. The Nominating Committee decides on the content of propos-als regarding the appointment and dismissal of directors, which are submitted at the General Shareholders’ Meeting. The Committee also determines the content of proposals for the appointment and dismissal of executive officers and operating offi-cers, which are submitted to the Board of Directors. Furthermore, the Committee oversees succession plans for the president and representative executive officer, in addition to other important positions, through the development of human resources to serve as future directors, executive officers, and operating officers.
Nominating Committee
Name Position
Member Takuya Nakata Director
Hiroyuki Yanagi Outside director
Shigeru Nosaka Outside director
Masatoshi Ito Outside director
Audit Committee
As of June 23, 2017, the Audit Committee had four members (three of whom were outside directors). Outside directors com-prise the majority of the Audit Committee, whose members and chair are determined by the Board of Directors. The chair of the Audit Committee is chosen from a group of independent outside officers. The Audit Committee conducts both independent audits and audits in collaboration with the Internal Auditing Division regarding the establishment and operational status of internal control systems at the Company and Group companies. Based on the results of these audits, the Committee conducts further audits to determine the legitimacy and validity of the performance of executive officers and directors.
When deemed necessary, the Audit Committee reports and expresses opinions to the Board of Directors regarding the perfor-mance of executive officers and directors. The Committee also has the authority to demand the cessation of an executive officer or director’s actions. Moreover, the Committee determines the con-tent of proposals regarding the appointment or dismissal of accounting auditors, which are submitted at the General Shareholders’ Meeting. Yamaha appoints one full-time member to the Audit Committee in order to enhance the Committee’s ability to gather internal information. In addition, the Company has established the Auditing Office as a full-time organization under the direct juris-diction of the Audit Committee that assists the Committee with its work. The Company requires the approval of the Audit Committee to carry out evaluations, reassignments, and disciplinary action of the Auditing Office’s personnel, thereby ensuring the Office’s inde-pendence from the executive officers and other parties responsible for business execution. The Audit Committee has secured a sufficiently appropriate structure for determining the necessary items to consider when auditing the performance of executive officers and directors. The system includes collaboration and information exchange with the accounting auditor and the Internal Auditing Division. Through this system, the Committee works to improve the quality and efficiency of its audits. The Internal Auditing Division reports the results of its audits to the Audit Committee on a regular basis and additionally when necessary. At the same time, the Division must make reports to the Audit Committee at any time the Committee requests it to do so. The Audit Committee is allowed to provide instruction regard-ing the audits of the Internal Auditing Division when necessary. In the event that the instruction provided to the Internal Auditing Division by the Audit Committee regarding the content of audits conflicts with instruction provided by the president and representative executive officer, the Company gives priority to the Audit Committee’s instruction. The Audit Committee also offers its opinion on the reassign-ment of Internal Auditing Division managers before such reassign-ments take place.
38
Corporate Governance

Audit Committee
Name Position
Member Masahito Hosoi Director
Junya Hakoda Outside director
Yoshimi Nakajima Outside director
Taku Fukui Outside director
Compensation Committee
As of June 23, 2017, the Compensation Committee had four mem-bers (three of whom were outside directors). Outside directors comprise the majority of the Compensation Committee, whose members and chair are determined by the Board of Directors.The Compensation Committee has formulated the policy for deter-mining director, executive officer, and operating officer remunera-tion and decides on individual remuneration amounts based on this policy.
Compensation Committee
Name Position
Member Takuya Nakata Director
Hiroyuki Yanagi Outside director
Shigeru Nosaka Outside director
Masatoshi Ito Outside director
Executive Officers
Yamaha appoints executive officers to oversee business execution. As of June 23, 2017, the Company had seven officers. With a Companywide perspective, the executive officers conduct
important decision-making regarding the tasks they are entrusted to execute and carry out by the Board of Directors under the Board’s supervision. The representative executive officer is the chief executive of the Company’s business execution. The representative executive officer oversees the execution of the Company’s business in accor-dance with basic policies determined by the Board of Directors. The Company had one representative executive officer as of June 23, 2017, who also serves as Company president. The executive officers assist with the work carried out by the representative executive officer while acting as the heads of busi-ness and administrative groups, or assuming a role with an equiva-lent level of responsibility as the heads of such groups.
Managing Council
Yamaha established the Managing Council, comprising executive officers, which acts as an advisory body to the president and repre-sentative executive officer. In principle, the Managing Council holds meetings twice a month to engage in debate on important management issues.
Corporate Committees
The Company has established corporate committees that act as advisory bodies to the president and representative executive offi-cer. These committees hold discussions on the direction and important themes of examinations and initiatives that are continu-ously carried out on a cross-organizational and management level basis. The committees report the results of these discussions to the president and representative executive officer.
Name Independent officer Reasons for appointment Views on their independence Board of Directors’
meetings attended
Hiroyuki Yanagi No
∙ Has excellent character and insight∙ Has management experience as the representative director of Yamaha Motor Co., Ltd.
∙ Can be counted on to strengthen Yamaha’s governance functions, improve brand value, and provide appropriate advice from an objective standpoint
Although he has not been made an indepen-dent director due to the fact that he also serves as the representative director of Yamaha Motor, of which the Company is a major shareholder, he has been appointed as an outside director for the reasons listed.
12 of 13
Shigeru Nosaka Yes
∙ Has excellent character and insight∙ Has management experience in other industries∙ Can be counted on to strengthen Yamaha’s governance functions and provide appropriate advice from an objec-tive standpoint
He has been appointed as an independent officer as he fulfills the legal and Tokyo Stock Exchange requirements for independence as well as the Company’s in-house standards for evaluating officer independence.
13 of 13
Masatoshi Ito Yes
∙ Has excellent character and insight∙ Has management experience in other industries∙ Can be counted on to strengthen Yamaha’s governance functions and provide appropriate advice from an objec-tive standpoint
He has been appointed as an independent officer as he fulfills the legal and Tokyo Stock Exchange requirements for independence as well as the Company’s in-house standards for evaluating officer independence.
8 of 10
Junya Hakoda Yes
∙ Has excellent character and insight∙ Is a CPA with expertise in corporate accounting∙ Can be counted on to provide equitable and fair audits from an objective standpoint
He has been appointed as an independent officer as he fulfills the legal and Tokyo Stock Exchange requirements for independence as well as the Company’s in-house standards for evaluating officer independence.
Board of Directors’ meetings13 of 13Board of Auditors’ meetings14 of 15
Outside Directors (As of June 23, 2017)
Yamaha Corporation Annual Report 2017 39
Financial SectionGrowth FoundationManagement Strategy About Yamaha

Risk Management Committee
Yamaha established the Risk Management Committee as an advi-sory body to the president and representative executive officer, who acts as the Committee’s chair. From a Companywide perspective, the Risk Management Committee holds debate on such themes as BCP and disaster mitigation measures, internal control systems, compliance, export inspections, and information security. The results of these debates are reported to the president and representa-tive executive officer.
Operating Officers
With a Companywide perspective, the operating officers conduct the work they are responsible for under the supervision of the executive officers and in accordance with importance decisions regarding business execution made by the Board of Directors and the executive officers. The operating officers oversee such roles as heads of important business and administrative groups and manag-ers at important Group companies. As of June 23, 2017, Yamaha had 10 operating officers.
Internal Audits
Yamaha established the Internal Auditing Division (11 staff mem-bers as of June 23, 2017) under the direct control of the president and representative executive officer. The Division’s role is to closely examine and evaluate management and operations sys-tems, as well as operational execution, for all management activi-ties undertaken by the Company and Group companies from the standpoint of legality, effectiveness, and efficiency. Based on the results of these examinations and evaluations, the Division pro-vides information and offers advice and proposals for improve-ment. The Company selects one member of the Internal Auditing Division to oversee internal audits in an effort to improve internal auditing functions. The Internal Auditing Division has in place a structure for close collaboration with the Audit Committee based on policies for ensuring the effectiveness of the Audit Committee’s audits, which are determined by the Board of Directors. At the same time, the Division works to boost audit efficiency by keeping in close contact and conducting precise adjustments with the accounting auditors.
Support System for Outside Directors
A meeting to examine management issues is held monthly, in principle, to provide an opportunity for all directors and execu-tive officers to discuss and share opinions regarding such matters as important management issues and the direction of business strategies. In addition, explanations on individual Board of Director proposals and items reported to the Board are provided when necessary. Yamaha also creates opportunities at the time of appointment to explain to outside directors the Yamaha Philosophy, corporate governance systems, internal regulations, and the progress of the medium-term management plan, thereby promoting their under-standing of the current situation and enhancing their recognition of management issues. When necessary, outside directors are indi-vidually provided with explanations about proposals and reports to be submitted to the Board of Directors. With respect to agenda items at meetings of the Board of Directors and the Board of Auditors to be attended by outside corporate auditors, full-time staff members send documents and other materials to them prior to the meeting and provide explanations as necessary to enable them to perform a complete preliminary study of the agenda. With regard to other material matters, the Company strives at all times to maintain an effective auditing environment, including by providing information, supply-ing documentation, listening to opinions, and supporting research and data collection.
Registration of Independent Officers
Yamaha has registered outside directors Shigeru Nosaka, Masatoshi Ito, Junya Hakoda, Yoshimi Nakajima and Taku Fukui as independent officers under the provisions of the Tokyo Stock Exchange (TSE). In addition to provisions pertaining to officer independence in Japan’s Companies Act and the TSE, Yamaha has established the following in-house standards for evaluating officer independence.
1 If any of the following items are applicable to the individual, the Company, in principle, will not appoint him or her as an indepen-dent officer. Furthermore, if any of the following items become applicable after an individual has been appointed as an inde-pendent officer, he or she will be removed from the position.
Name Independent officer Reasons for appointment Views on their independence Board of Directors’
meetings attended
Yoshimi Nakajima Yes
∙ Has excellent character and considerable insight as a director
∙ Has extensive experience in running businesses in other industries
∙ Can be counted on to oversee and provide appropriate advice from an objective standpoint
She has been appointed as an independent officer as she fulfills the legal and Tokyo Stock Exchange requirements for independence as well as the Company’s in-house standards for evaluating officer independence.
—
Taku Fukui Yes
∙ Has excellent character and considerable insight as a director
∙ Is an attorney at law and is acquainted with laws and regulations
∙ Can be counted on to oversee and provide appropriate advice from an objective standpoint
He has been appointed as an independent officer as he fulfills the legal and Tokyo Stock Exchange requirements for independence as well as the Company’s in-house standards for evaluating officer independence.
—
Note: The Company has entered into a limited liability agreement with each non-active director under Article 423, Paragraph 1 of the Companies Act. Based on this agreement, the limit of liability of such directors is set as the minimum amount stipulated by laws and regulations.
40
Corporate Governance

Classification Total compensation (Millions of yen)
Compensation by Type (Millions of yen) Number of directors and
corporate auditorsFixed compensation
Performance-based compensation Bonuses
Directors(Excluding outside directors) 247 125 46 76 3
Corporate Auditors(Excluding outside corporate auditors) 60 60 — — 2
Outside Directors andOutside Corporate Auditors 39 39 — — 6
Notes: 1. In June 2017, the Company transitioned to a Company with Three Committees (Nominating, Audit, and Compensation) organizational model. 2. The above list of outside directors includes a director who resigned as of the 192nd Ordinary General Shareholders’ Meeting held on June 22, 2016.
A. Any individual who does not meet the qualification require-ments for an outside director or auditor as stipulated in the Companies Act
B. Any individual who is a member of a party that places the Group as a primary business partner or does business with such a party, or any individual who is a member of a party the Group places as a primary business partner or does business with such a party “Primary business partner” refers to a party from which, in any of the past three business years, Yamaha has received com-pensation that exceeds 2% of the Company’s consolidated net sales, or any party to which Yamaha has paid compensation that exceeds that 2% of that party’s consolidated net sales. “Primary business partner” also includes the top five banks that Yamaha does business with.
C. Any individual who is a primary shareholder of the Company or who does business with a primary shareholder of the Company, as well as any director or auditor of a company of which Yamaha is a primary shareholder “Primary shareholder” refers to an individual or entity that possesses shares or interests that total over 10% of the total shares issued by the Company.
D. Any individual who has been dispatched within the Group as a director or auditor
E. Any consultant or accounting or legal expert that receives large monetary amounts or other assets from the Company, excluding director remuneration (in the event that a corpora-tion, union, or another kind of organization is receiving the asset, this refers to individuals that are affiliated with such an organization) “Large monetary amounts or other assets” refers to cases where the Company has made payments of over ¥10 million in any of the past three business years (in the case that the Company provided non-financial compensation, the fair market valuation at the time the compensation was provided is used).
F. Any near relative (within the second degree) of an individual to which the following is applicable 1. Any individual described in B through D 2. An individual who does business with the Company or its
subsidiaries 3. An individual who was appointed as a director to which (2)
was applicable to at the time that the most recent General Shareholders’ Meeting concluded
2 Even in the event that B, C, or D apply to an individual, if it becomes clear that there is no substantial risk of the individual creating a conflict of interest with the general shareholders, that individual may be appointed as an independent director, or avoid being removed as an independent director, using that reason.
Policy on Determining Remuneration Amounts
Director remuneration consists of a fixed compensation that is set within a limit preapproved at the General Shareholders’ Meeting, a performance-based compensation, and a director bonus that reflects short-term performance. Director remuneration also con-sists of a share acquisition-based compensation to enhance the incentive for directors to improve corporate value over the
medium to long term. The policy for director remuneration is determined by the Board of Directors after deliberations by the Corporate Directors Personnel Committee. Remuneration for cor-porate auditors is set within a limit decided on at the General Shareholders’ Meeting and is determined through deliberations among corporate auditors.
NameTotal
compensation (Millions of yen)
Director category Company categoryCompensation by Type (Millions of yen)
Fixed compensation
Performance-based compensation Bonuses
Takuya Nakata 138President and
Representative DirectorSubmitting Company 69 28 40
Note: Only directors whose total consolidated remuneration is ¥100 million or more are listed.
Remuneration by Director for Fiscal 2017
Yamaha Corporation Annual Report 2017 41
Financial SectionGrowth FoundationManagement Strategy About Yamaha

Remuneration for Accounting Auditor in Fiscal 2016 and 2017
Classification Fiscal 2016 Fiscal 2017
Compensation based on audit certificate services
(Millions of yen)
Compensation based on non-auditing services
(Millions of yen)
Compensation based on audit certificate services
(Millions of yen)
Compensation based on non-auditing services
(Millions of yen)
Filing company 66 — 67 8
Consolidated affiliates 22 21 21 22
Total 88 21 88 30
Notes: Other important remunerationFiscal 2017: Yamaha Corporation of America, a consolidated subsidiary of Yamaha Corporation, and 17 other companies paid ¥127 million in compensation based on audit certificate services and ¥43 million based on non-auditing services to Ernst & Young, which is affiliated with the same auditing accounting auditor network as Yamaha Corporation.Fiscal 2016: Yamaha Corporation of America, a consolidated subsidiary of Yamaha Corporation, and 17 other companies paid ¥135 million in compensation based on audit certificate services and ¥7 million based on non-auditing services to Ernst & Young, which is affiliated with the same auditing accounting auditor network as Yamaha Corporation.
Remuneration for directors other than outside directors comprises (1) a fixed compensation, (2) a performance-based compensation, and (3) a director bonus. The performance-based compensation is assessed based on the rate of year-on-year growth in return on sales (ROS), return on equity (ROE), and consolidated net sales, as well as the year-on-year improvement rate of consolidated operating income, and ranges from 0 to 50% of fixed compensation depending on indi-vidual performance. The director bonus is paid within a compen-sation framework predetermined at the General Shareholders’ Meeting. With an upper limit of 0.5% of consolidated net income of fiscal 2016, the bonuses are calculated in correlation with net income of fiscal 2017. In addition, since July 2015, directors have acquired 12.5% of fixed compensation in the form of the Company’s shares through the Company’s Director Shareholding Association and have main-tained possession of those shares throughout their term of service. This will further enhance the performance incentive for directors over the medium to long term. Remuneration for outside directors is limited to only a fixed compensation and amounts are determined taking into account such factors as whether said remuneration is in balance with that of other directors and the scale of Yamaha Corporation’s business. Remuneration for corporate auditors is limited to a fixed com-pensation and is kept within a limit preapproved at the General Shareholders’ Meeting. Amounts are determined through consulta-tion with the corporate auditors, taking into account such factors as whether said remuneration is in balance with that of directors and the scale of Yamaha Corporation’s business. In accordance with Yamaha’s transition to a Company with Three Committees (Nominating, Audit, and Compensation), which occurred on June 22, 2017, policies for determining compensation for directors and executive officers, as well as individual compen-sation amounts, will be decided by the Compensation Committee. In addition, as of July 2017, the Compensation Committee has determined the following policies for director and executive offi-cer compensation.
Compensation for directors, excluding outside directors and directors who are Audit Committee members, and executive officers, excluding executive officers who oversee internal audits, com-prises (1) a fixed compensation, (2) a performance-based bonus, and (3) a restricted stock compensation. Of these three parts, the fixed compensation accounts for roughly 50% of overall compen-sation, with the performance-based bonus and restricted stock compensation accounting for 30% and 20%, respectively. The per-formance-based bonus is connected to year-on-year growth in consolidated net income and consolidated return on equity (ROE) and is calculated after taking into consideration individual perfor-mance. Individual performance is evaluated based on business and function-specific indicators within the respective field of each director and executive officer. The restricted stock compensation has been introduced with the aim of continuously improving corporate value and sharing value with the Company’s sharehold-ers. Two-thirds of this compensation is linked to the overall business performance of the Company with the purpose of enhancing motivation for achieving the targets of the medium-term management plan. The Company has established growth in consolidated return on sales (ROS), earnings per share (EPS), and ROE, which represent key targets adopted under the medium-term management plan, as equally important indicators for evaluating business performance. Furthermore, the Company has set the restriction period for stock transfer at ten years after the conclusion of the medium-term management plan with the intention of sharing value with the shareholders over a long-term period. In accordance with the respective responsibilities of each director or executive officer, the Company has also established a clawback provision in which all or a certain amount of the accumulated restricted stock compensation is withheld in the event of improper accounting or a major profit loss. Compensation for outside directors, directors who are Audit Committee members, and executive officers who oversee internal audits is limited to a fixed salary.
Accounting Auditor
Yamaha has appointed Ernst & Young ShinNihon LLC as its accounting auditor. Takahiro Takiguchi and Tomoaki Ito, CPAs of said accounting auditor firm, have performed Yamaha’s accounting audit. Ernst & Young ShinNihon has voluntarily adopted a rotating
system for its managing partners and has taken measures to ensure that the number of continuous years of service does not exceed a fixed period of time. In addition, 12 CPAs and 29 staff assist with the audits.
42
Corporate Governance

So-Called Policy Cross-Holdings
Yamaha’s principle policy on the ownership of shares is to only possess shares in cases where it is reasonable to do so for the purpose of contributing to sustainable growth and medium- to long-term improvement in corporate value. Such cases refer to possessing shares to continue stable relationships with important business partners and financial institutions, which in turn will enhance brand value, support sustainable growth, and ensure a solid financial foundation. Yamaha shares its brand with Yamaha Motor Co., Ltd. and has established a Joint Brand Committee, the Yamaha Brand Charter, and the Joint Brand Regulations between the two companies, car-rying out a variety of collaborative initiatives. At the same time, through the mutual possession of shares and dispatch of directors, both companies can appropriately monitor each other’s initiatives geared toward sustainable growth. Yamaha believes that by
working to maintain and improve the Yamaha brand value through this mutual monitoring and collaborative relationship with Yamaha Motor, it can contribute to improving the Company’s corporate value over the medium to long term. Also, the Board of Directors regularly and continuously verifies the reasonableness of each policy shareholding. When voting on policy cross-holdings, the pros and cons of each proposal are comprehensively evaluated from the perspective of how the policy cross-holding will work to improve the medium- to long-term corporate value of the company concerned, rather or not the policy cross-holding conforms to Yamaha’s principle policy on the ownership of shares, and how the policy shareholding will lead to improvement in the Company’s corporate value over the medium to long term.
Basic Concept of the Internal Control System
The Company has established an internal control system pursuant to Japan’s Companies Act and the Enforcement Regulations of the Companies Act. This system aims to improve the efficiency of the Company’s business activities, ensure reporting liability and thorough compliance with laws and regulations, maintain Company assets, and enhance risk management. Furthermore, Yamaha requires subsidiaries to establish internal controls that confirm with the Group’s internal control policy, which was determined by the Company, based on the Group Management Charter, which stipulates Group management policies. In regard to decisions on certain important items, other than
management information, that impact Group management, subsidiaries are required to receive consent from the Company in advance, and must also report the results of decisions on certain items. Yamaha has developed and put into operation internal con-trols for financial reporting based on implementation standards for internal control reporting systems (the Financial Instruments and Exchange Act). We will maintain and more firmly establish this internal control system to ensure the reliability of our financial reporting.
Compliance Framework
Not only does the Yamaha Group observe laws and regulations, it seeks strict compliance management that addresses social norms and corporate ethics. The Working Group for Compliance was established as a subordinate body to the Risk Management Committee, an advisory body to the president and representative executive officer, to promote and strengthen compliance in coop-eration with the staff and departments in charge of laws and regulations. In 2003, Yamaha established the Compliance Code of Conduct, a compilation of items to be strictly observed that is disseminated to all Group officers and employees (including part-time and contract employees) through worksite briefings. We also implement training sessions on a regular basis to ensure the thorough enforcement of the Code. Since its establishment, we have localized the Code by creating overseas and regional
versions based on the laws, regulations, and social norms of the countries in which our Group companies are based, and have introduced translated versions of the code at 32 companies. In 2006, 2011 and 2016, we revised the Code to respond to changes in the operating environment. Furthermore, Yamaha conducts routine compliance surveys with the goal of raising Group employee awareness and gaining a better understanding of potential risks. As a system for handling compliance-related inquiries and reports from employees, Yamaha has established a Compliance Help Line that connects to the Working Group for Compliance executive office and an outside attorney. The Compliance Help Line accepts inquiries not only from employees but also from interested parties including business partners.
Yamaha Corporation Annual Report 2017 43
Financial SectionGrowth FoundationManagement Strategy About Yamaha

General Shareholders’ Meetings
Yamaha has positioned the General Shareholders’ Meeting as the highest decision-making body of the Company. At these meetings, decisions are made on important matters and reports are given on audit results such as consolidated financial statements. As a general rule, invitations are sent out at least three weeks prior to the date the meeting is to be held. In addition, Yamaha avoids holding the meeting on dates that conflict with the meetings of other companies in an effort to have as many shareholders participate as possible. In regard to exercising voting rights, Yamaha implements elec-tronic voting via the Internet, in addition to conventional voting
methods via mail, in order to allow those shareholders who could not participate in the meeting the chance to vote. The Company also uses an electronic voting platform geared toward institutional investors to allow those with substantial voting rights to vote. At the General Shareholders’ Meeting, business reports are made using video to deepen the understanding of the shareholders in attendance. After the meeting concludes, the Company carries out events such as a mini concert that introduces its products. In addi-tion, items that are reported and items that are voted on are uploaded to the Company’s website after the meeting finishes.https://www.yamaha.com/en/ir/shareholder_info/
Items Voted On at the Fiscal 2017 General Shareholders’ Meeting
The number of votes for and against items proposed at the 193rd General Shareholders’ Meeting, held on June 22, 2017, the number of abstained votes, the necessary conditions for proposed items to be approved, and the results of each proposal are as follows.
Proposal Number of votes for
Number of votes against
Number of abstained votes
Approval percentage Result
Proposal 1: Appropriation of surplus 1,570,512 4,273 1,969 98.3 Approved
Proposal 2: Partial revision to the Articles of Incorporation 1,569,816 4,981 1,969 98.2 Approved
Proposal 3: Election of Nine Directors
Takuya Nakata 1,534,639 40,139 1,985 96.0 Approved
Satoshi Yamahata 1,567,906 6,877 1,985 98.1 Approved
Masahito Hosoi 1,544,706 30,073 1,985 96.6 Approved
Hiroyuki Yanagi 1,103,812 470,967 1,985 69.1 Approved
Shigeru Nosaka 1,569,103 5,680 1,985 98.2 Approved
Masatoshi Ito 1,561,543 13,238 1,985 97.7 Approved
Junya Hakoda 1,568,910 5,873 1,985 98.2 Approved
Yoshimi Nakajima 1,424,321 150,457 1,985 89.1 Approved
Taku Fukui 1,572,388 2,396 1,985 98.4 Approved
Notes: 1. The necessary conditions for each proposal to be approved are as follows. (1) Proposal 1 requires a majority of votes in favor from the shareholders in attendance. (2) Proposal 2 was approved at a General Shareholders’ Meeting in which a minimum of one-third of shareholders with voting rights attended and with over two-thirds of votes in
favor from the shareholders in attendance. (3) Proposal 3 was approved at a General Shareholders’ Meeting in which a minimum of one-third of shareholders with voting rights attended and with a majority of votes in favor
from shareholders in attendance. 2. Reason why a part of votes from shareholders who attended the General Shareholders’ Meeting were not included in the vote count
The requirements for passage of the resolutions have been met as a result of aggregating the number of voting rights indicating approval or rejection exercised in advance on or before the day prior to the day of this General Shareholders’ Meeting and the voting rights of certain shareholders who attended the meeting and whose intention to approve or reject the propositions have been confirmed, and the resolutions were thereby enacted lawfully under the Companies Act. Accordingly, the results of the exercise of voting rights by shareholders who attended the meeting but whose intention to approve or reject the proposition or to abstain from the votes cannot be confirmed are not included in the vote count.
44
Corporate Governance
Investor Relations (IR)
The Company’s disclosure policy is listed on its website and states that the Company aims for the fair and prompt disclosure of accu-rate information. Guided by this policy, the Company endeavors to actively disclose information to institutional and private investors without discrepancy in a timely manner. At the same time, Yamaha is carrying out activities to enhance investors’ understanding of the Company. In addition to holding financial results briefings for securities analysts and institutional investors, Yamaha holds explanatory meetings on its management policies and individual businesses and offers educational tours of its factories and facilities as needed. For overseas investors, the Company uploads English translations of presentation documents and Q&A sessions from events held in Japan on its website. In addition, the president and representative executive officer, as well as directors, visit investors overseas several times a year to explain the Company’s
management plans and conditions of its business. In this way, the Company endeavors to promote mutual understanding through direct dialogue with investors. Yamaha holds briefings for private investors in cities across Japan to encourage more people to become loyal fans and share-holders of the Company. The IR manager in charge shares the opinions of shareholders and investors, which are gathered through these kinds of initiatives in communication, with the relevant internal departments. Responsible directors and executive officers report the results of their efforts to the Board of Directors in an appropriate manner and receive management-related feedback. This feedback is used to help make future improvements. Also, the Company sets a quiet period every quarter from the quarter settling day to the day that financial results are announced in which it avoids dialogue on financial information.
Business Continuity Plan (BCP)
The Risk Management Committee and its subsidiary body, the Working Group for BCP and Disaster Prevention Management, have put the necessary systems and countermeasures in place to respond to a wide range of risks. In fiscal 2009, Yamaha formulated the BCP Guidelines—its basic Companywide policy for its business continuity plan— which is designed to enable the immediate resumption of
operations in the event of an earthquake in Japan’s Tokai region, where Yamaha’s headquarters are located, or another major natural disaster that could cause damage to Yamaha’s buildings or facili-ties. In January 2012, Yamaha established various guidelines including BCP/Disaster Basic Countermeasures, Earthquake Countermeasures, and Fire Countermeasures, which update and supersede the BCP Guidelines.
Activities Frequency Content
For analysts and institutional investors Financial results briefings 4 Briefings on the results of the quarter
Business briefings 1 Briefings on the musical instruments and audio equipment business
One-on-one meetings 260 IR interviews
For overseas investors Overseas roadshows 3 Visits by the president and representative director and other responsible officers (North America, Europe, Asia)
For private investors Explanatory meetings for private investors 1 Tokyo
Major IR Activities in Fiscal 2017
Yamaha Corporation Annual Report 2017 45
Financial SectionGrowth FoundationManagement Strategy About Yamaha

Corporate Governance
Takuya NakataDirector, President and Representative Executive Officer
1981 Joined Nippon Gakki Co., Ltd.*
2005 General Manager of Pro Audio & Digital Musical Instruments Division
2006 Executive Officer
2009 Director and Executive Officer
2010 Senior Executive Officer of Yamaha Corporation President of Yamaha Corporation of America
2013 Deputy Executive General Manager of Musical Instruments & Audio Products Sales & Marketing Unit of Yamaha Corporation President and Representative Director
2014 Director of Yamaha Motor Co., Ltd. (Outside Director) (to the present)
2015 President of Yamaha Music Foundation (to the present)
2017 Executive General Manager of Musical Instruments & Audio Products Business Unit Director, President and Representative Executive Officer (to the present)
Satoshi YamahataDirector and Managing Executive Officer
1988 Joined Yamaha Corporation
2009 General Manager of Accounting and Finance Division
2013 Executive Officer and General Manager of Corporate Planning Division
2015 Director, Senior Executive Officer and Executive General Manager of Operations Unit (to the present)
2016 Executive General Manager of Corporate Management Unit (to the present)
2017 Director and Managing Executive Officer (to the present)
Masahito HosoiDirector
1978 Joined Nippon Gakki Co., Ltd.*
2005 General Manager of Human Resources Division
2009 Executive Officer
2013 Senior Executive Officer and Executive General Manager of Corporate Administration Unit
2014 Full-Time Corporate Auditor
2017 Director of Yamaha Corporation (to the present)
*Currently Yamaha Corporation
2357 1 4 6 8 9
Board of Directors
1 2
3
Board of Directors and Corporate Officers (As of June 23, 2017)
46

Junya HakodaOutside Director
1974 Joined Mitsubishi Rayon Co., Ltd.
1980 Joined Pricewaterhouse CPA Office
1983 Joined Aoyama Audit Corporation
1984 Registered as a Certified Public Accountant
2006 Representative of Arata Audit Corporation
2012 Representative of Junya Hakoda & Co. (to the present)
2014 Corporate Auditor (Part-Time) of Schroder Investment Management (Japan) Limited (to the present)
2015 Outside Director of AEON Financial Service Co., Ltd. (to the present) Outside Corporate Auditor of Yamaha Corporation
2017 Outside Director of Yamaha Corporation (to the present)
Yoshimi NakajimaOutside Director
1980 Joined The Yasuda Trust and Banking Co., Ltd. (currently Mizuho Trust & Banking Co., Ltd.)
1982 Joined AVON PRODUCTS Co., Ltd., Tokyo Japan
1997 Joined Citibank N.A. as Vice President of Consumer Banking Headquarters
2000 Joined Societe Generale Securities Japan Limited as Senior General Manager
2002 Joined American Express International, Inc. as Vice President and Head of Global Travelers Cheques and Prepaid Services, Japan
2003 Vice President, Head of Marketing, International Consumer and Small Business Services Division, Japan branch of American Express International, Inc.
2011 Country Manager (President), Singapore branch of American Express International, Inc.
2014 Senior Vice President, Head of Acquisition Marketing, International Consumer and Small Business Services Division, Japan branch of American Express International, Inc. President and Representative Director of American Express Japan Co., Ltd.
2016 Resigned from American Express International, Inc. Retired as President and Representative Director of American Express Japan Co., Ltd.
2017 Outside Director of Yamaha Corporation (to the present)
Taku FukuiOutside Director
1987 Registered as an attorney Joined Kashiwagi Sogo Law Offices
2004 Professor of Keio University Law School (to the present)
2005 Outside Audit & Supervisory Board Member of Shin-Etsu Chemical Co., Ltd. (to the present)
2009 Managing Partner of Kashiwagi Sogo Law Offices (to the present)
2011 Supervisory Director of HEIWA REAL ESTATE REIT, Inc. (to the present)
2017 Outside Director of Yamaha Corporation (to the present)
Hiroyuki YanagiOutside Director (President, Chief Executive Officer and Representative Director of Yamaha Motor Co., Ltd.)
1978 Joined Yamaha Motor Co., Ltd.
2007 Executive Officer of Yamaha Motor Co., Ltd.
2009 Senior Executive Officer of Yamaha Motor Co., Ltd.
2010 President, Chief Executive Officer and Representative Director of Yamaha Motor Co., Ltd. (to the present)
2011 Outside Director of Yamaha Corporation (to the present)
Shigeru NosakaOutside Director (Director, Executive Vice President & CFO of Oracle Corporation Japan)
1976 Joined Marubeni Corporation
1989 Joined Apple Computer KK
1996 Joined Allergan, Inc, Joined Japan Communications Inc. as Senior Executive Officer
2002 Joined Oracle Corporation Japan, and became Director and Managing Executive Officer
2005 Retired from Oracle Corporation Japan
2007 Joined again as Senior Managing Executive Officer of Oracle Corporation Japan
2008 Director and Senior Managing Executive Officer of Oracle Corporation Japan
2011 Director and Executive Vice President of Oracle Corporation Japan (to the present)
2015 Outside Director of Yamaha Corporation (to the present)
Masatoshi ItoOutside Director (Representative Director and Chairman of the Board of Ajinomoto Co., Inc.)
1971 Joined Ajinomoto Co., Inc.
1999 Member of the Board and General Manager of Food Products Business Unit Ajinomoto Co., Inc.
2003 Member of the Board of Ajinomoto Co., Inc. and President of Ajinomoto Frozen Foods Co., Inc.
2006 Representative Director and Corporate Senior Vice President, and President of Food Products Company of Ajinomoto Co., Inc.
2009 Representative Director, President and Chief Executive Officer of Ajinomoto Co., Inc.
2015 Representative Director and Chairman of the Board of Ajinomoto Co., Inc. (to the present)
2016 Outside Director of Yamaha Corporation (to the present) Outside Director of Japan Airlines Co., Ltd. (to the present)
4
5
6
7
8
9
Yamaha Corporation Annual Report 2017 47
Financial SectionGrowth FoundationManagement Strategy About Yamaha
President and Representative Executive OfficerTakuya NakataExecutive General Manager of Musical Instruments & Audio Products Business Unit
Please refer to page 46 for career summaries
Managing Executive Officers
Shinobu KawaseExecutive General Manager of Musical Instruments & Audio Products Production Unit
1983 Joined Nippon Gakki Co., Ltd.*1
2004 President of Yamaha Fine Technologies Co., Ltd.
2011 General Manager of Wind, String & Percussion Instruments Division
2013 General Manager of Acoustic Musical Instruments Production Division, Musical Instruments & Audio Products Production Unit
2014 Executive Officer
2015 Senior Executive Officer Executive General Manager of Musical Instruments & Audio Products Production Unit
2016 Managing Executive Officer
2017 Managing Executive Officer*2 (to the present)
Satoshi YamahataExecutive General Manager of Corporate Management Unit and Operations Unit
Please refer to page 46 for career summaries
Executive Officers
Shigeki FujiiExecutive General Manager of IMC Business Unit
1983 Joined Nippon Gakki Co., Ltd.*1
2005 General Manager of Advanced System Division Center
2009 General Manager of Semiconductor Division
2013 Executive Officer
2013 Executive General Manager of IMC Business Unit
2015 Senior Executive Officer
2017 Executive Officer*2 (to the present)
Akira IizukaExecutive General Manager of Technology Unit
1980 Joined Nippon Gakki Co., Ltd.*1
2005 General Manager of Pro Audio & Digital Musical Instruments Division
2007 General Manager of INFO-Sound Division
2009 Executive Officer
2013 General Manager of Research & Development Division, Musical Instruments & Audio Products Development Unit
2015 Executive General Manager of Technology Unit (to the present)
2016 Senior Executive Officer
2017 Executive officer*2 (to the present)
Seiichi YamaguchiExecutive General Manager of Musical Instruments & Audio Products Sales & Marketing Unit
1985 Joined Nippon Gakki Co., Ltd.*1
2006 Director and President of Yamaha Scandinavia AB
2010 President of Yamaha Music & Electronics (China) Co., Ltd.
2013 Executive Officer
2014 General Manager of Business Planning Division, Musical Instruments & Audio Products Sales & Marketing Unit
2015 Executive General Manager of Service Business Unit
2016 Senior Executive Officer
2017 Executive General Manager of Musical Instruments & Audio Products Sales Unit Executive Officer*2 (to the present)
Takashi DairokunoIn charge of internal audits
1982 Joined Nippon Gakki Co., Ltd.*1
2002 Director and President of Yamaha Electronique Alsace S.A.
2005 General Manager of Pro Audio & Digital Musical Instruments Division
2011 General Manager of Human Resources Division
2012 General Manager of Human Resources & General Administration Division
2014 General Manager of Internal Auditing Division
2015 Full-Time Corporate Auditor
2017 Executive Officer*2 (to the present)
Operating Officers
Hirofumi OsawaSenior General Manager of Audio Products Business Division, Musical Instruments & Audio Products Business Unit
Kazunori KobayashiPresident of Yamaha Music Japan Co., Ltd.
Hitoshi FukutomePresident of Yamaha Corporation of America
Teruhiko TsurumiChairman and President of Yamaha Music & Electronics (China) Co., Ltd.
Kimiyasu ItoSenior General Manager of Musical Instruments Business Division and Musical Instruments Development Division, Musical Instruments & Audio Products Business Unit
Masato TakaiExecutive General Manager of Human Resources and General Administration Unit
Shinichi TakenagaPresident and Director of PT. Yamaha Musik Indonesia (Distributor)
Masato OshikiSenior General Manager of Asia-Pacific Sales Division, Musical Instruments & Audio Products Sales Unit
Thomas SchöpePresident of Yamaha Music Europe GmbH
Takashi HagaCorporate Managing Director of Yamaha Music India Pvt. Ltd.
*1Currently Yamaha Corporation
*2 The role of Executive Officer has changed from June 2017 following the transition to a Company with Three Comittees (Nominating, Audit, and Compensation)
Executive Officers
48
Corporate Governance

Risk Factors
1 Economic Conditions
The Yamaha Group has a global business presence and therefore is subject to the influence of economic conditions in Japan and other countries. Recessions in world markets and accompanying declines in demand may have a negative effect on the Group’s business results and the development of its business.
2 Price Competition
The Yamaha Group confronts severe competition in each of its business segments. For example, in the musical instruments seg-ment, the Company is a comprehensive manufacturer of musical instruments and sells high-quality, high-performance instruments covering a broad price spectrum. However, the Company confronts competitors in each musical instruments segment, and competition in the lower price segments has become more intense, especially in recent years. Also, in the audio equipment segment, the Yamaha Group is subject to competition from low-priced products. Changes in logistics and distribution and new technology trends could expose this business to even greater price competition, which could have an impact on the Group’s current strong position.
3 New Technology Development
The Yamaha Group will focus its management resources on the core business domains of sound and music. The Group will firmly establish itself as the world’s leading comprehensive musical instruments manufacturer. The audio equipment segment has been expanded, with a focus on the AV products category and PA equipment. The others segment has also been expanded, mainly in the areas of onboard devices, amusement equipment, and indus-trial parts and machinery. Differentiating the Group’s technologies in the fields of sound, music, networks, and devices is essential for the Group’s further development and growth. In developing these technologies, if the Group does not continue to correctly forecast future market needs and adequately meet them, the added value of its products in the musical instruments segment will decline, which may lead to price competition. As a result, the Group may be unable to stimulate new demand for its products and may find it difficult to sustain the audio equipment and others businesses.
4 Business Investment
The Group makes business investments including capital invest-ments to promote business growth. However, when making investment decisions, even though the Group monitors investment return and risk both qualitatively and quantitatively and makes careful, considered judgments, depending on circumstances, the Group may be unable to recover a portion or the full amount of its investments, or may decide to withdraw from a business, thereby resulting in additional losses. In such cases, the value of assets invested in such businesses may be subject to impairment.
5 Business Alliances
In recent years, partnership strategies, including alliances, joint ventures, and investments in other companies, have increased in importance for the Group. In some cases, the anticipated effects of such alliances and investments may not materialize because of conflicts of interest, or changes in the business strategies of the partner, or other reasons.
6 Dependence on Customers in Materials and Parts Business
The semiconductors, automobile interior wood components, and materials and parts that the Group manufactures and sells are affected by the business performance of the manufacturers who buy them. When the bonds of trust between such customers and Group companies are impaired by delivery, quality, or other issues, this may have a negative impact on future orders. Moreover, customers may ask Group companies to compensate them for quality prob-lems or other defects.
7 International Business and Overseas Expansion
The Yamaha Group has established a global presence, with pro-duction and sales bases in various parts of the world. Of the Group’s 66 consolidated subsidiaries, 46 are foreign corporations, of which 24 are manufacturing and production companies, with principal bases of operation in China, Indonesia, and Malaysia. Overseas sales comprise 66.1% of the Group’s net sales.
Among the matters covered in this annual report, items that may have a material impact on the decisions of investors include those listed and described below. In addition, information related to future events as described in the text is based on judgments made by the Yamaha Group at the end of the fiscal year under review.
Yamaha Corporation Annual Report 2017 49
Financial SectionGrowth FoundationManagement Strategy About Yamaha
Various risks, including those listed below, are inherent to the expansion of business overseas. If such risks materialize, including adverse effects caused by an over-concentration of manufacturing facilities in a particular region, the Group may not be able to provide stable supplies of its products. Such risks include:(a) Political and economic turmoil, terrorism, and war(b) Introduction of adverse policies or imposition of, or changes in
regulations(c) Unexpected changes in laws or regulations(d) Difficulty in recruiting personnel(e) Sharp rises in personnel expenses and commodity prices(f) Difficulty in procuring raw materials and parts as well as issues
related to the level of technology(g) Interruption of distribution due to harbor strikes, etc.(h) Imposition of taxes under transfer pricing regulations( i ) Labor disputes including strikes
8 Raw Material Prices, Raw Material Supplies, and Logistics Costs
To manufacture its products, the Group uses raw materials, including lumber, metals such as copper, and plastics, for parts. Increases in the prices of these materials raise manufacturing costs. In addition, specific suppliers supply the Group with different raw materials. Supply conditions for those materials could have an impact on the Group’s manufacturing activities. In addition, when logistics costs increase due to sharply rising crude oil prices, the ratio of manufacturing costs and cost of sales to net sales may increase.
9 Declining Birthrates
In the Yamaha Group’s core business of musical instruments, schools constitute an important sales channel, in addition to the Group’s music schools and English language schools, whose students are primarily children. Declining birthrates, particularly in Japan, could lead to decreasing sales through these channels.
10 Recruitment and Training of Personnel
The average age of the Company’s employees is relatively high, with a significant number in the upper age brackets and many approaching the set retirement age. Therefore, an important chal-lenge for the Company is to address the changing composition of the workforce by passing on musical instrument manufacturing know-how and recruiting and training a new generation of employees. If the Company is unable to respond sufficiently to changes in the composition of its workforce, this could interfere with its business activities and future growth.
11 Protection and Use of Intellectual Property
The Group possesses intellectual property rights, including patents based on its proprietary technologies, and accumulated business know-how. Some of this intellectual property cannot be fully protected, or can only be partially protected because of legal constraints in certain regions. Therefore, the Group may not be able to effectively prevent third parties from using its intellec-tual property. As a result, some products of other companies may appear on the market that are similar to, or copies of, those of Group companies, thus interfering with Group sales. In addition, third parties may claim that Group products infringe on their own intellectual property rights. As a result, sales of Group products that employ said intellectual property may be delayed or suspended. In some cases, the Group licenses the intellectual property of third parties to produce key components for its products. Any increases in royalties paid for such intellectual property may result in higher manufacturing costs, which could affect price-competitiveness. Moreover, if the Group is unable to obtain a license, it may have to suspend manufacturing of the relevant product.
12 Defects in Products and Services
The Yamaha Group controls the quality of its products based on corporate quality assurance and product quality rules and regula-tions. However, there is no guarantee that all products will be free of defects. The Group is insured against product liability claims, as well as damages resulting from defects in certain products, but there is no guarantee that this insurance will be sufficient to cover any potential payments for damages. If product liability issues arise or a major recall is carried out, insurance rates are likely to increase. In that case, the cost to change the design of a product could increase significantly, or the Group’s business reputation could be tarnished, which could cause sales to decline, and adversely affect the Group’s performance and financial position. Also, although the Group is very careful about safety and sani-tation at the retail shops, music schools, recreation, and other faci-lities that it operates, in the event of an accident, the stores, schools, or facilities may have to temporarily suspend operation, which could damage the Group’s reputation and lead to declining sales.
13 Legal Regulations
The Group’s business operations throughout the world are subject to the laws and regulations of the countries and regions in which they operate. These laws and regulations include those pertaining to foreign investment, restrictions on exports and imports that may affect national security, commerce, anti-trust issues, consumer pro-tection, tax systems, and environmental protection. In addition, the Group has an obligation to securely manage the personal information of its customers. The Yamaha Group takes every measure to implement compliance, but, if for some unexpected reason, it is unable to comply with laws and regulations, the Group’s activities could be restricted and costs could increase as a result.
50
Risk Factors

14 Environmental Regulations
With the environmental protection regulations that govern busi-ness activities becoming increasingly stringent, companies are being asked to implement voluntary environmental programs as one of their corporate social responsibilities. The Yamaha Group has implemented measures that exceed existing environmental standards for products, packaging materials, energy conservation, and industrial waste treatment. However, there is no guarantee that the Group can completely prevent restricted substances released due to accidents or other causes from exceeding environmental standards, or reduce the release of said substances. Moreover, in cases where soil pollution has occurred on land formerly occupied by industrial plants, substantial soil remediation costs may be incurred when the land is sold in the future, or the land may be impossible to sell. Restricted substances in the soil on land already sold to third parties may spread, resulting in pollution of the air or under-ground water, and may incur cleaning and remediation costs.
15 Information Leakage
The Group retains a wide range of important management- and business-related information as well as personal information on customers. To manage this information properly, the Group has prepared policies and rules and put into place systems for maintaining its security. However, in the event that this informa-tion accidentally leaks outside the Group, this could have a major impact on the Group’s business activities or lower public confi-dence in the Group.
16 Fluctuations in Foreign Currency Exchange Rates
As the Yamaha Group’s business activities, including manufactur-ing and sales, are global in scale, the transactions of Group companies that are denominated in foreign currencies are subject to fluctuating exchange rates. The Group uses forward currency hedge transactions to minimize the impact of foreign exchange rate fluctuations in the short term. However, the Group may not be able to achieve its initial business plan targets due to exchange rate fluctuations. The euro-yen exchange rate has an especially strong impact on profit and loss: a ¥1 change will result in a ¥0.45 billion change in profitability.
17 Earthquakes and Other Natural Disasters
In the event of earthquakes and other natural disasters, the produc-tion plants of the Yamaha Group may be damaged. Notably, the Company’s Head Office, domestic plants, and major subsidiaries are concentrated in Shizuoka Prefecture, located in the Tokai region of Japan, an area in which a major earthquake has been predicted for years. Moreover, the Group’s overseas manufacturing plants are concentrated in China, Indonesia, and Malaysia, coun-tries where the outbreak of unexpected natural disasters may arise. In the event of a natural disaster, the Yamaha Group’s facilities may suffer damage, and the Group may be required to suspend or post-pone operations, which could incur substantial restoration costs. In addition, disaster conditions at raw material and parts suppliers could affect manufacturing.
18 Cyber Attacks
The use of data network systems and its importance have been increasing in the Yamaha Group’s business activities. In the event that the functioning of the Group’s data network systems is dis-rupted due to computer virus infections, cyber attacks, and other threats, this could adversely affect the Group’s performance and financial position.
19 Items Related to Changes in Financial Position
a. Valuation of Investment SecuritiesThe companies of the Yamaha Group hold available-for-sale securities with market value (acquisition cost: ¥15.8 billion; consolidated balance sheet value: ¥129.5 billion, as of March 31, 2017). Since available-for-sale securities with market value are valued at the market price at the settlement date based on the mark-to-market valuation method, the recorded balance sheet value of these secu-rities may fluctuate depending on the price of the securities at the settlement date. This may, in turn, have an impact on the Company’s net assets. Further, when the market value of these securities falls markedly relative to their acquisition cost, the value of said securi-ties may be subject to impairment.b. Unrealized Losses on Land ValuationAs of March 31, 2017, the market value of the Group’s land, reval-ued in accordance with the Law Concerning Revaluation of Land, was ¥7.2 billion below the book value of said land after revaluation. In the event of the sale or disposal of said land, this unrealized loss may be recognized. c. Retirement Benefit Obligations and ExpensesThe Yamaha Group’s retirement benefit obligations and expenses are calculated based on its retirement benefit system, an estimated discount rate, and an expected rate of return on pension plan assets. In some cases, the retirement benefit system may change and the estimate of said obligations and expenses may differ from the actual results. As a result, retirement benefit obligations and expenses could increase.
Yamaha Corporation Annual Report 2017 51
Financial SectionGrowth FoundationManagement Strategy About Yamaha
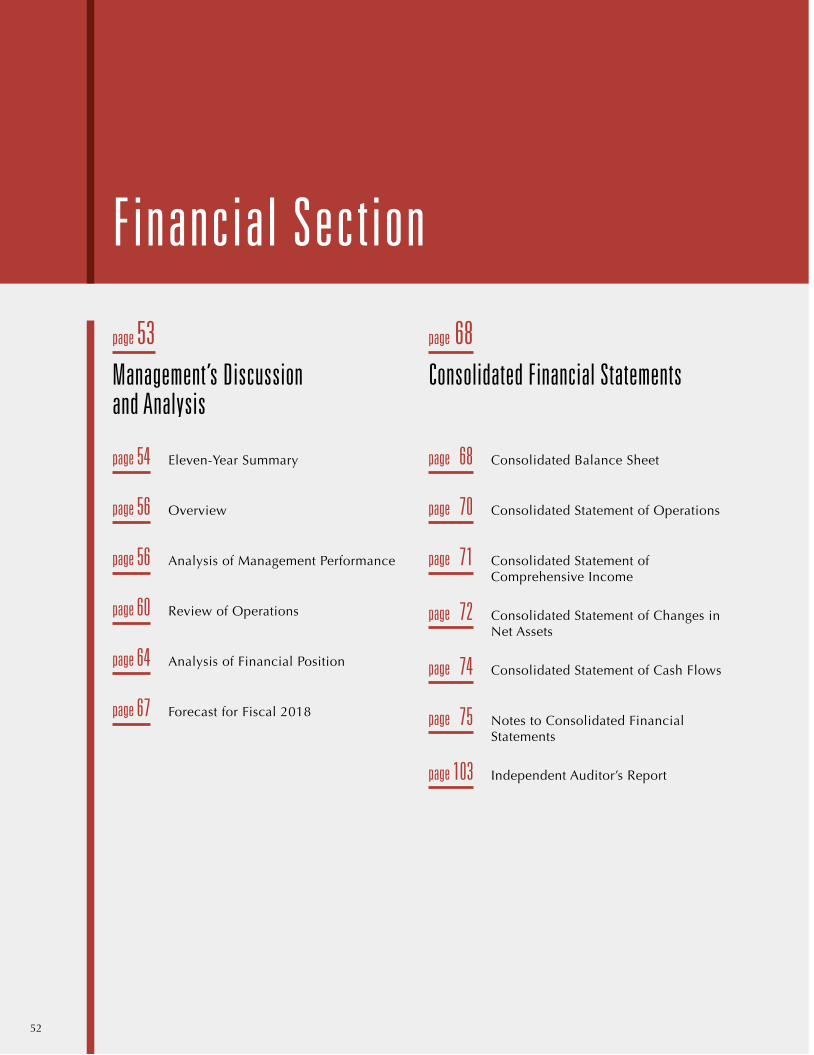
Financial Section
page 53
Management’s Discussion and Analysis
page 54 Eleven-Year Summary
page 56 Overview
page 56 Analysis of Management Performance
page 60 Review of Operations
page 64 Analysis of Financial Position
page 67 Forecast for Fiscal 2018
page 68
Consolidated Financial Statements
page 68 Consolidated Balance Sheet
page 70 Consolidated Statement of Operations
page 71 Consolidated Statement of Comprehensive Income
page 72 Consolidated Statement of Changes in Net Assets
page 74 Consolidated Statement of Cash Flows
page 75 Notes to Consolidated Financial Statements
page 103 Independent Auditor’s Report
52

Consolidated Statement of Operations SummaryMillions of yen
Consolidated Statement of Operations SummaryMillions of yen
Consolidated Balance Sheet SummaryMillions of yen
Consolidated Balance Sheet SummaryMillions of yen
Fiscal 2017 Summary
• Sales decreased year on year while earnings increased for the fifth consecutive year.• A record high was reached for net income attributable to owners of parent.• In the musical instruments segment, sales were down due to the impact of foreign exchange rates and the
transfer of music school management. However, actual sales increased and earnings rose as efforts to revise selling prices and lower manufacturing costs offset the impact of foreign exchange rates.
• While sales declined in the audio equipment segment due to the impact of foreign exchange rates, earnings rose due to the substantial growth of PA equipment and ICT devices.
• In the others segment, earnings increased due to a recovery in the electronic devices and golf businesses.
110,329
104,280
255,135
303,889
90,396
75,459
144,166
105,475
272,720
367,437
72,359
82,565
Total assets
¥ 469,745 million
Total assets
¥ 522,362 million
Current assets Property, plant and equipment Investments and other assets Current liabilities Noncurrent liabilities Net assets
Net incomeattributable to
owners of parent
Net income attributable tonon-controlling interests
Deferred income taxes
Current income taxes
Other income
Operating income
Selling, general andadministrative expenses
Cost of sales
Net sales
46,719
–156
+12,706
–8,728
–1,404
44,302
–121,493
–242,451
408,248
32,633
40,663
435,477Net sales
Operating income
Net income
Fiscal 2016
Fiscal 2017
Yamaha Corporation Annual Report 2017 53
Management’s Discussion and Analysis
Financial SectionGrowth FoundationManagement Strategy About Yamaha

Yamaha Corporation and consolidated subsidiaries Millions of yen %Millions of
U.S. dollars*1
Years ended March 31 2007 2008 2009 2010 2011 2012 2013 2014 2015 2016 2017 2016/2017 2017
For the year:
Net sales ¥550,361 ¥548,754 ¥459,284 ¥414,811 ¥373,866 ¥356,616 ¥366,941 ¥410,304 ¥432,177 ¥435,477 ¥408,248 –6.3 $3,638.90
Cost of sales 352,382 343,686 290,381 268,380 237,313 231,659 238,261 262,310 270,357 262,406 242,451 –7.6 2,161.07
Gross profit 197,980 205,066 168,902 146,431 136,553 124,957 128,680 147,994 161,820 173,070 165,796 –4.2 1,477.81
Selling, general and administrative expenses 170,295 172,220 155,057 139,602 123,387 116,846 119,465 121,999 131,684 132,407 121,493 –8.2 1,082.92
Operating income 27,685 32,845 13,845 6,828 13,165 8,110 9,215 25,994 30,135 40,663 44,302 +8.9 394.88
Income (loss) before income taxes and minority interests 33,101 62,510 (12,159) (201) 6,802 6,971 7,795 25,818 28,526 41,578 42,898 +3.2 382.37
Net income (loss)*2 27,866 39,558 (20,615) (4,921) 5,078 (29,381) 4,122 22,898 24,929 32,633 46,719 +43.2 416.43
Capital expenditures 25,152 24,394 22,581 14,480 10,439 11,337 13,844 10,799 13,846 11,220 17,542 +56.3 156.36
Depreciation expenses 19,956 20,289 17,912 14,139 12,814 11,973 11,613 12,759 12,597 12,681 11,145 –12.1 99.34
R&D expenses 24,220 24,865 23,218 21,736 22,416 22,819 22,149 22,561 25,439 24,793 24,415 –1.5 217.62
Cash flow from operating activities 39,732 37,225 (2,235) 39,870 22,646 10,880 7,755 33,213 31,729 42,399 39,142 –7.7 348.89
Cash flow from investing activities (22,427) 41,999 (25,999) (12,711) (9,740) (9,004) (12,617) (22,950) (11,700) 591 (9,663) –1735.0 (86.13)
Free cash flow 17,305 79,225 (28,234) 27,159 12,906 1,875 (4,862) 10,263 20,029 42,991 29,478 –31.4 262.75
At year-end:
Total assets ¥559,031 ¥540,347 ¥408,974 ¥402,152 ¥390,852 ¥366,610 ¥390,610 ¥438,932 ¥530,034 ¥469,745 ¥522,362 +11.2 $4,656.05
Total current assets 231,033 275,754 202,097 193,260 194,717 188,952 197,902 214,487 247,632 255,135 272,720 +6.9 2,430.88
Total current liabilities 136,656 120,174 90,050 75,182 74,836 72,829 71,550 73,145 80,976 75,459 82,565 +9.4 735.94
Interest-bearing liabilities 25,551 21,036 19,192 15,017 11,838 11,295 10,013 8,755 11,868 8,510 11,241 +32.1 100.20
Net assets*3 351,398 343,028 251,841 254,591 245,002 206,832 229,636 274,843 348,752 303,889 367,437 +20.9 3,275.13
Yen U.S.dollars*1
Per share:
Net income (loss) ¥ 135.19 ¥ 191.76 ¥ (103.73) ¥ (24.95) ¥ 25.90 ¥ (151.73) ¥ 21.79 ¥ 118.26 ¥ 128.75 ¥ 168.90 ¥ 249.17 $ 2.22
Net assets*3 1,680.91 1,646.44 1,262.42 1,276.35 1,250.06 1,052.01 1,171.67 1,403.12 1,787.42 1,601.55 1,948.01 17.36
Dividends*4 22.50 50.00 42.50 27.50 10.00 10.00 10.00 27.00 36.00 44.00 52.00 0.46
%
Key indicators:
Operating income ratio 5.0 6.0 3.0 1.6 3.5 2.3 2.5 6.3 7.0 9.3 10.9
ROE (Return on equity)*3 8.4 11.5 (7.0) (2.0) 2.1 (13.2) 1.9 9.2 8.1 10.1 14.0
ROA (Return on assets) 5.2 7.2 (4.3) (1.2) 1.3 (7.8) 1.1 5.5 5.1 6.5 9.4
Equity ratio*3 62.0 62.9 60.9 62.6 61.9 55.6 58.1 61.9 65.3 64.2 69.9
Debt to equity ratio (Times) 0.07 0.06 0.08 0.06 0.05 0.05 0.04 0.03 0.03 0.03 0.03
Interest coverage (Times) 47.83 34.56 26.74 16.88 40.38 31.84 40.64 130.19 130.51 129.04 165.40
Current ratio 169.1 229.5 224.4 257.1 260.2 259.4 276.6 293.2 305.8 338.1 330.3
Dividend payout ratio 16.6 26.1 — — 38.6 — 47.0 22.8 28.0 26.1 20.9
*1 U.S. dollar amounts are translated from yen at the rate of ¥112.19 = U.S.$1.00, the approximate rate prevailing on March 31, 2017.*2 From fiscal 2016 and onward, net income (loss) is presented as net income attributable to owners of parent on the consolidated financial statements.*3 Net assets, ROE (return on equity), and equity ratio were classified as shareholders’ equity, ROE (return on shareholders’ equity), and shareholders’ equity ratio, respectively, until fiscal 2006.*4 The dividends per share from fiscal 2008 to fiscal 2010 include a ¥20 special dividend.
54
Eleven-Year Summary

Yamaha Corporation and consolidated subsidiaries Millions of yen %Millions of
U.S. dollars*1
Years ended March 31 2007 2008 2009 2010 2011 2012 2013 2014 2015 2016 2017 2016/2017 2017
For the year:
Net sales ¥550,361 ¥548,754 ¥459,284 ¥414,811 ¥373,866 ¥356,616 ¥366,941 ¥410,304 ¥432,177 ¥435,477 ¥408,248 –6.3 $3,638.90
Cost of sales 352,382 343,686 290,381 268,380 237,313 231,659 238,261 262,310 270,357 262,406 242,451 –7.6 2,161.07
Gross profit 197,980 205,066 168,902 146,431 136,553 124,957 128,680 147,994 161,820 173,070 165,796 –4.2 1,477.81
Selling, general and administrative expenses 170,295 172,220 155,057 139,602 123,387 116,846 119,465 121,999 131,684 132,407 121,493 –8.2 1,082.92
Operating income 27,685 32,845 13,845 6,828 13,165 8,110 9,215 25,994 30,135 40,663 44,302 +8.9 394.88
Income (loss) before income taxes and minority interests 33,101 62,510 (12,159) (201) 6,802 6,971 7,795 25,818 28,526 41,578 42,898 +3.2 382.37
Net income (loss)*2 27,866 39,558 (20,615) (4,921) 5,078 (29,381) 4,122 22,898 24,929 32,633 46,719 +43.2 416.43
Capital expenditures 25,152 24,394 22,581 14,480 10,439 11,337 13,844 10,799 13,846 11,220 17,542 +56.3 156.36
Depreciation expenses 19,956 20,289 17,912 14,139 12,814 11,973 11,613 12,759 12,597 12,681 11,145 –12.1 99.34
R&D expenses 24,220 24,865 23,218 21,736 22,416 22,819 22,149 22,561 25,439 24,793 24,415 –1.5 217.62
Cash flow from operating activities 39,732 37,225 (2,235) 39,870 22,646 10,880 7,755 33,213 31,729 42,399 39,142 –7.7 348.89
Cash flow from investing activities (22,427) 41,999 (25,999) (12,711) (9,740) (9,004) (12,617) (22,950) (11,700) 591 (9,663) –1735.0 (86.13)
Free cash flow 17,305 79,225 (28,234) 27,159 12,906 1,875 (4,862) 10,263 20,029 42,991 29,478 –31.4 262.75
At year-end:
Total assets ¥559,031 ¥540,347 ¥408,974 ¥402,152 ¥390,852 ¥366,610 ¥390,610 ¥438,932 ¥530,034 ¥469,745 ¥522,362 +11.2 $4,656.05
Total current assets 231,033 275,754 202,097 193,260 194,717 188,952 197,902 214,487 247,632 255,135 272,720 +6.9 2,430.88
Total current liabilities 136,656 120,174 90,050 75,182 74,836 72,829 71,550 73,145 80,976 75,459 82,565 +9.4 735.94
Interest-bearing liabilities 25,551 21,036 19,192 15,017 11,838 11,295 10,013 8,755 11,868 8,510 11,241 +32.1 100.20
Net assets*3 351,398 343,028 251,841 254,591 245,002 206,832 229,636 274,843 348,752 303,889 367,437 +20.9 3,275.13
Yen U.S.dollars*1
Per share:
Net income (loss) ¥ 135.19 ¥ 191.76 ¥ (103.73) ¥ (24.95) ¥ 25.90 ¥ (151.73) ¥ 21.79 ¥ 118.26 ¥ 128.75 ¥ 168.90 ¥ 249.17 $ 2.22
Net assets*3 1,680.91 1,646.44 1,262.42 1,276.35 1,250.06 1,052.01 1,171.67 1,403.12 1,787.42 1,601.55 1,948.01 17.36
Dividends*4 22.50 50.00 42.50 27.50 10.00 10.00 10.00 27.00 36.00 44.00 52.00 0.46
%
Key indicators:
Operating income ratio 5.0 6.0 3.0 1.6 3.5 2.3 2.5 6.3 7.0 9.3 10.9
ROE (Return on equity)*3 8.4 11.5 (7.0) (2.0) 2.1 (13.2) 1.9 9.2 8.1 10.1 14.0
ROA (Return on assets) 5.2 7.2 (4.3) (1.2) 1.3 (7.8) 1.1 5.5 5.1 6.5 9.4
Equity ratio*3 62.0 62.9 60.9 62.6 61.9 55.6 58.1 61.9 65.3 64.2 69.9
Debt to equity ratio (Times) 0.07 0.06 0.08 0.06 0.05 0.05 0.04 0.03 0.03 0.03 0.03
Interest coverage (Times) 47.83 34.56 26.74 16.88 40.38 31.84 40.64 130.19 130.51 129.04 165.40
Current ratio 169.1 229.5 224.4 257.1 260.2 259.4 276.6 293.2 305.8 338.1 330.3
Dividend payout ratio 16.6 26.1 — — 38.6 — 47.0 22.8 28.0 26.1 20.9
*1 U.S. dollar amounts are translated from yen at the rate of ¥112.19 = U.S.$1.00, the approximate rate prevailing on March 31, 2017.*2 From fiscal 2016 and onward, net income (loss) is presented as net income attributable to owners of parent on the consolidated financial statements.*3 Net assets, ROE (return on equity), and equity ratio were classified as shareholders’ equity, ROE (return on shareholders’ equity), and shareholders’ equity ratio, respectively, until fiscal 2006.*4 The dividends per share from fiscal 2008 to fiscal 2010 include a ¥20 special dividend.
Yamaha Corporation Annual Report 2017 55
Financial SectionGrowth FoundationManagement Strategy About Yamaha
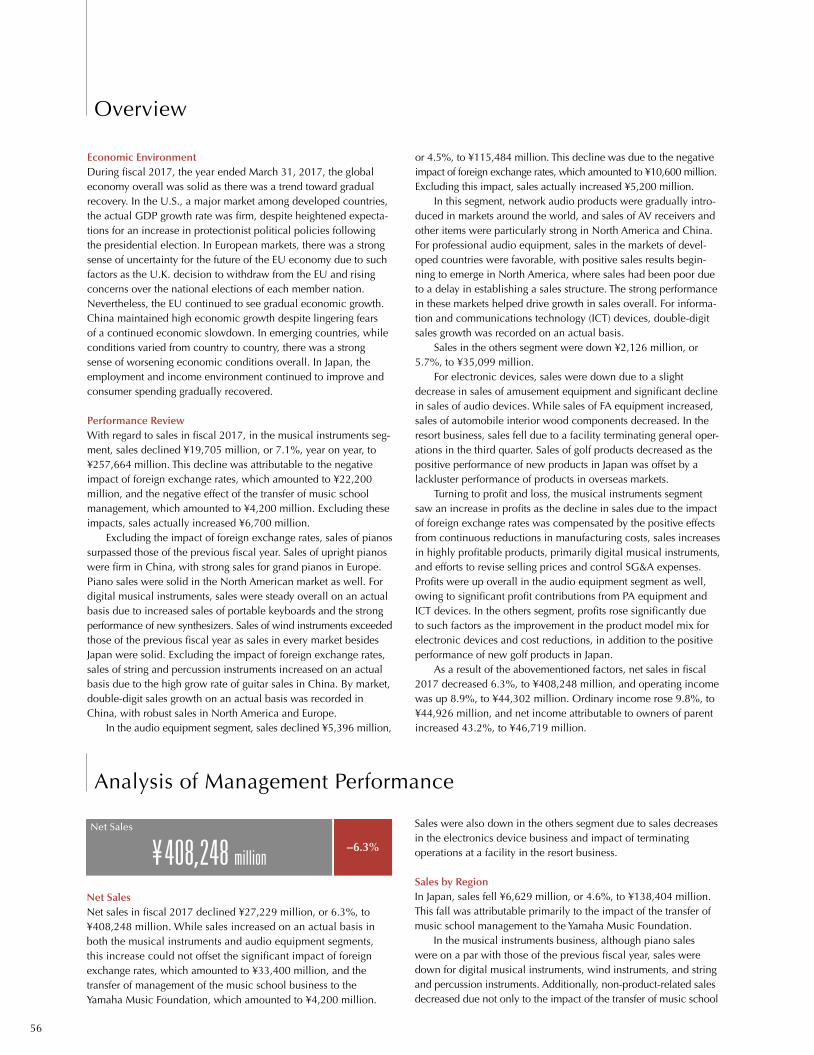
Economic EnvironmentDuring fiscal 2017, the year ended March 31, 2017, the global economy overall was solid as there was a trend toward gradual recovery. In the U.S., a major market among developed countries, the actual GDP growth rate was firm, despite heightened expecta-tions for an increase in protectionist political policies following the presidential election. In European markets, there was a strong sense of uncertainty for the future of the EU economy due to such factors as the U.K. decision to withdraw from the EU and rising concerns over the national elections of each member nation. Nevertheless, the EU continued to see gradual economic growth. China maintained high economic growth despite lingering fears of a continued economic slowdown. In emerging countries, while conditions varied from country to country, there was a strong sense of worsening economic conditions overall. In Japan, the employment and income environment continued to improve and consumer spending gradually recovered.
Performance ReviewWith regard to sales in fiscal 2017, in the musical instruments seg-ment, sales declined ¥19,705 million, or 7.1%, year on year, to ¥257,664 million. This decline was attributable to the negative impact of foreign exchange rates, which amounted to ¥22,200 million, and the negative effect of the transfer of music school management, which amounted to ¥4,200 million. Excluding these impacts, sales actually increased ¥6,700 million.
Excluding the impact of foreign exchange rates, sales of pianos surpassed those of the previous fiscal year. Sales of upright pianos were firm in China, with strong sales for grand pianos in Europe. Piano sales were solid in the North American market as well. For digital musical instruments, sales were steady overall on an actual basis due to increased sales of portable keyboards and the strong performance of new synthesizers. Sales of wind instruments exceeded those of the previous fiscal year as sales in every market besides Japan were solid. Excluding the impact of foreign exchange rates, sales of string and percussion instruments increased on an actual basis due to the high grow rate of guitar sales in China. By market, double-digit sales growth on an actual basis was recorded in China, with robust sales in North America and Europe.
In the audio equipment segment, sales declined ¥5,396 million,
Sales were also down in the others segment due to sales decreases in the electronics device business and impact of terminating operations at a facility in the resort business.
Sales by RegionIn Japan, sales fell ¥6,629 million, or 4.6%, to ¥138,404 million. This fall was attributable primarily to the impact of the transfer of music school management to the Yamaha Music Foundation.
In the musical instruments business, although piano sales were on a par with those of the previous fiscal year, sales were down for digital musical instruments, wind instruments, and string and percussion instruments. Additionally, non-product-related sales decreased due not only to the impact of the transfer of music school
–6.3%
Net Sales
¥ 408,248 million
Net SalesNet sales in fiscal 2017 declined ¥27,229 million, or 6.3%, to ¥408,248 million. While sales increased on an actual basis in both the musical instruments and audio equipment segments, this increase could not offset the significant impact of foreign exchange rates, which amounted to ¥33,400 million, and the transfer of management of the music school business to the Yamaha Music Foundation, which amounted to ¥4,200 million.
or 4.5%, to ¥115,484 million. This decline was due to the negative impact of foreign exchange rates, which amounted to ¥10,600 million. Excluding this impact, sales actually increased ¥5,200 million.
In this segment, network audio products were gradually intro-duced in markets around the world, and sales of AV receivers and other items were particularly strong in North America and China. For professional audio equipment, sales in the markets of devel-oped countries were favorable, with positive sales results begin-ning to emerge in North America, where sales had been poor due to a delay in establishing a sales structure. The strong performance in these markets helped drive growth in sales overall. For informa-tion and communications technology (ICT) devices, double-digit sales growth was recorded on an actual basis.
Sales in the others segment were down ¥2,126 million, or 5.7%, to ¥35,099 million.
For electronic devices, sales were down due to a slight decrease in sales of amusement equipment and significant decline in sales of audio devices. While sales of FA equipment increased, sales of automobile interior wood components decreased. In the resort business, sales fell due to a facility terminating general oper-ations in the third quarter. Sales of golf products decreased as the positive performance of new products in Japan was offset by a lackluster performance of products in overseas markets.
Turning to profit and loss, the musical instruments segment saw an increase in profits as the decline in sales due to the impact of foreign exchange rates was compensated by the positive effects from continuous reductions in manufacturing costs, sales increases in highly profitable products, primarily digital musical instruments, and efforts to revise selling prices and control SG&A expenses. Profits were up overall in the audio equipment segment as well, owing to significant profit contributions from PA equipment and ICT devices. In the others segment, profits rose significantly due to such factors as the improvement in the product model mix for electronic devices and cost reductions, in addition to the positive performance of new golf products in Japan.
As a result of the abovementioned factors, net sales in fiscal 2017 decreased 6.3%, to ¥408,248 million, and operating income was up 8.9%, to ¥44,302 million. Ordinary income rose 9.8%, to ¥44,926 million, and net income attributable to owners of parent increased 43.2%, to ¥46,719 million.
56
Overview
Analysis of Management Performance
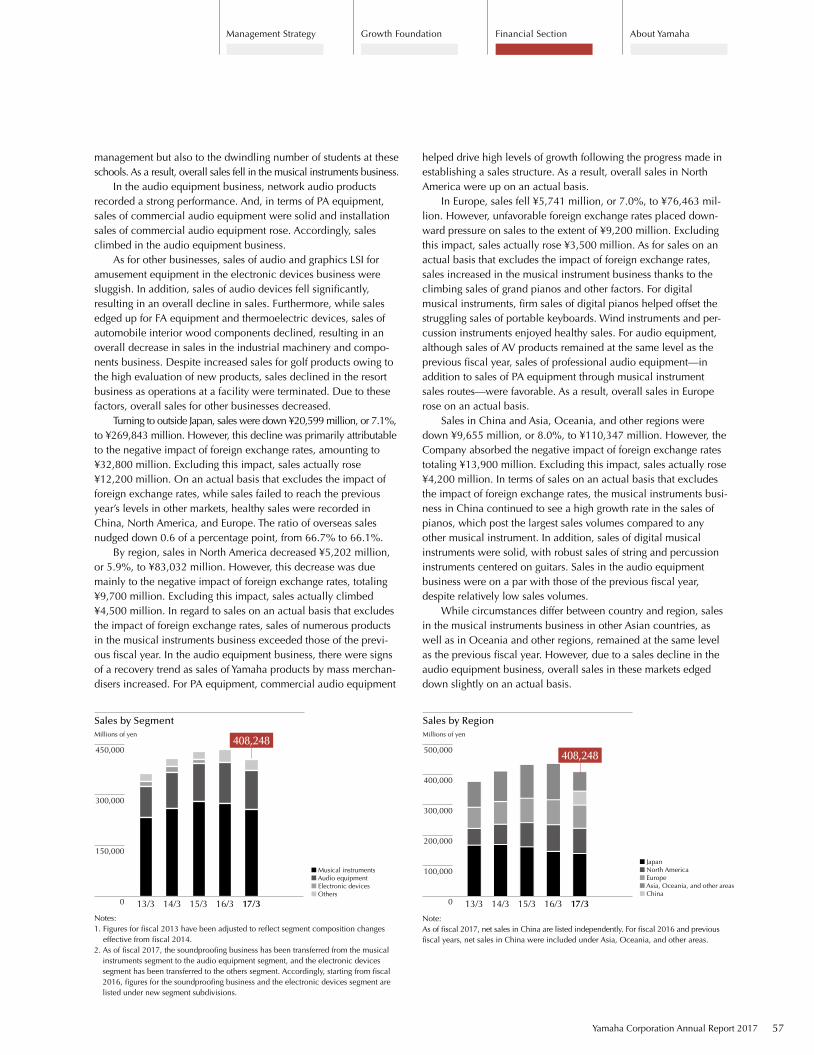
management but also to the dwindling number of students at these schools. As a result, overall sales fell in the musical instruments business.
In the audio equipment business, network audio products recorded a strong performance. And, in terms of PA equipment, sales of commercial audio equipment were solid and installation sales of commercial audio equipment rose. Accordingly, sales climbed in the audio equipment business.
As for other businesses, sales of audio and graphics LSI for amusement equipment in the electronic devices business were sluggish. In addition, sales of audio devices fell significantly, resulting in an overall decline in sales. Furthermore, while sales edged up for FA equipment and thermoelectric devices, sales of automobile interior wood components declined, resulting in an overall decrease in sales in the industrial machinery and compo-nents business. Despite increased sales for golf products owing to the high evaluation of new products, sales declined in the resort business as operations at a facility were terminated. Due to these factors, overall sales for other businesses decreased.
Turning to outside Japan, sales were down ¥20,599 million, or 7.1%, to ¥269,843 million. However, this decline was primarily attributable to the negative impact of foreign exchange rates, amounting to ¥32,800 million. Excluding this impact, sales actually rose ¥12,200 million. On an actual basis that excludes the impact of foreign exchange rates, while sales failed to reach the previous year’s levels in other markets, healthy sales were recorded in China, North America, and Europe. The ratio of overseas sales nudged down 0.6 of a percentage point, from 66.7% to 66.1%.
By region, sales in North America decreased ¥5,202 million, or 5.9%, to ¥83,032 million. However, this decrease was due mainly to the negative impact of foreign exchange rates, totaling ¥9,700 million. Excluding this impact, sales actually climbed ¥4,500 million. In regard to sales on an actual basis that excludes the impact of foreign exchange rates, sales of numerous products in the musical instruments business exceeded those of the previ-ous fiscal year. In the audio equipment business, there were signs of a recovery trend as sales of Yamaha products by mass merchan-disers increased. For PA equipment, commercial audio equipment
helped drive high levels of growth following the progress made in establishing a sales structure. As a result, overall sales in North America were up on an actual basis.
In Europe, sales fell ¥5,741 million, or 7.0%, to ¥76,463 mil-lion. However, unfavorable foreign exchange rates placed down-ward pressure on sales to the extent of ¥9,200 million. Excluding this impact, sales actually rose ¥3,500 million. As for sales on an actual basis that excludes the impact of foreign exchange rates, sales increased in the musical instrument business thanks to the climbing sales of grand pianos and other factors. For digital musical instruments, firm sales of digital pianos helped offset the struggling sales of portable keyboards. Wind instruments and per-cussion instruments enjoyed healthy sales. For audio equipment, although sales of AV products remained at the same level as the previous fiscal year, sales of professional audio equipment—in addition to sales of PA equipment through musical instrument sales routes—were favorable. As a result, overall sales in Europe rose on an actual basis.
Sales in China and Asia, Oceania, and other regions were down ¥9,655 million, or 8.0%, to ¥110,347 million. However, the Company absorbed the negative impact of foreign exchange rates totaling ¥13,900 million. Excluding this impact, sales actually rose ¥4,200 million. In terms of sales on an actual basis that excludes the impact of foreign exchange rates, the musical instruments busi-ness in China continued to see a high growth rate in the sales of pianos, which post the largest sales volumes compared to any other musical instrument. In addition, sales of digital musical instruments were solid, with robust sales of string and percussion instruments centered on guitars. Sales in the audio equipment business were on a par with those of the previous fiscal year, despite relatively low sales volumes.
While circumstances differ between country and region, sales in the musical instruments business in other Asian countries, as well as in Oceania and other regions, remained at the same level as the previous fiscal year. However, due to a sales decline in the audio equipment business, overall sales in these markets edged down slightly on an actual basis.
Sales by SegmentMillions of yen
0
150,000
300,000
450,000
17/316/315/314/313/3
Musical instruments Audio equipment Electronic devices Others
Notes:1. Figures for fiscal 2013 have been adjusted to reflect segment composition changes
effective from fiscal 2014.2. As of fiscal 2017, the soundproofing business has been transferred from the musical
instruments segment to the audio equipment segment, and the electronic devices segment has been transferred to the others segment. Accordingly, starting from fiscal 2016, figures for the soundproofing business and the electronic devices segment are listed under new segment subdivisions.
408,248
Note:As of fiscal 2017, net sales in China are listed independently. For fiscal 2016 and previous fiscal years, net sales in China were included under Asia, Oceania, and other areas.
Sales by RegionMillions of yen
17/316/315/314/313/30
100,000
200,000
300,000
400,000
500,000
Japan North America Europe Asia, Oceania, and other areas China
408,248
Financial SectionGrowth FoundationManagement Strategy About Yamaha
Yamaha Corporation Annual Report 2017 57

increased sales of commercial audio equipment, lower costs, reduced expenses, and other factors. In the others segment, operating income soared ¥1,277 million, or 290.8%, from ¥439 million to ¥1,716 million.
The primary reasons behind the increase in year-on-year earn-ings were such factors as lower costs (¥4,900 million), increased sales on an actual basis (¥4,500 million), reduced SG&A expenses (¥3,800 million), and revision of selling prices (¥3,500 million). These positive factors outweighed such negative factors as the adverse impact of foreign exchange rates (¥11,100 million) and an increase in manufacturing costs due to rising labor costs at over-seas production bases (¥2,000 million).
Non-Operating Income and ExpensesNon-operating income in fiscal 2017 fell ¥151 million, or 3.1%, from ¥4,876 million to ¥4,725 million, due to the absence of a tariff refund at a U.S.-based sales subsidiary that was recorded in the previous fiscal year. Of this amount, dividend income was up ¥730 million, or 30.7%, from ¥2,377 million to ¥3,108 million, reflecting a higher dividend from Yamaha Motor Co., Ltd.
Non-operating expenses were down ¥530 million, or 11.5%, from ¥4,632 million to ¥4,101 million. Of this amount, sales dis-counts decreased ¥293 million, or 10.1%, from ¥2,909 million to ¥2,616 million. Foreign exchange loss decreased ¥380 million, or 63.6%, from ¥598 million to ¥218 million.
Extraordinary Income and LossExtraordinary income in fiscal 2017 declined ¥4,641 million, from ¥8,979 million to ¥4,337 million, reflecting the sale of old stores, residential facilities, and idle land.
Extraordinary loss was down ¥1,943 million, from ¥8,309 mil-lion to ¥6,366 million. Of this amount, restructuring costs totaling ¥3,032 million were recorded due to the reorganization of the resort business and other factors. In addition, the Company also posted ¥1,499 million in amortization of goodwill. This represents the immediate amortization of goodwill following the processing of an impairment loss at a consolidated subsidiary. Specifically, this goodwill is related to Revolabs, Inc., a U.S. subsidiary of the Company, and its subsidiaries.
Income before Income TaxesIn fiscal 2017, income before income taxes rose ¥1,320 million,
Operating Income AnalysisBillions of yen
Operating IncomeMillions of yen
0
45,000
30,000
15,000
17/316/315/314/313/317/3
Improvement in manufacturing costs
Increase in sales and production
Increase in pro�tability of electronic devices
Increase in SG&A expenses
Increase in labor costs at overseas plants
Impact of exchange rates
16/3
44.3
+4.9
+4.5
+3.5
+3.8
–2.0
–11.1
40.7
Cost of Sales and Selling, General and Administrative ExpensesCost of sales decreased ¥19,955 million, or 7.6%, to ¥242,451 million. The cost of sales ratio improved 0.9 of a percentage point, to 59.4%.
Gross profit fell ¥7,273 million, or 4.2%, to ¥165,796 million. The gross profit ratio improved 0.9 of a percentage point, to 40.6%.
Selling, general and administrative (SG&A) expenses declined ¥10,913 million, or 8.2%, to ¥121,493 million. The ratio of SG&A expenses to net sales improved 0.6 of a percentage point, to 29.8%.
Major Items Included in Selling, General and Administrative Expenses
Millions of yen %
2016 2017 Change
Sales commissions ¥ 1,396 ¥ 1,157 –17.1Transport expenses 13,407 11,841 –11.7Advertising expenses and sales promotion expenses 19,183 17,558 –8.5Allowance for doubtful accounts 69 149 +115.9Provision for product warranties 974 (38) +103.9Retirement benefit expenses 2,921 3,752 +28.4Salaries and benefits 54,806 52,238 –4.7Rent 4,017 3,470 –6.9Depreciation and amortization 2,440 2,299 –5.8
Note: Figure shown in parentheses is a profit item.
+8.9%
Operating Income
¥ 44,302 million
Operating income in fiscal 2017 climbed ¥3,639 million, or 8.9%, to ¥44,302 million.
By segment, operating income in the musical instruments segment rose ¥451 million, or 1.4%, from ¥31,687 million to ¥32,138 million, reflecting the fact that lower costs, revision of selling prices, and reduced expenses offset a decline in sales in musical instrument businesses. In the audio equipment segment, operating income increased ¥1,910 million, or 22.4%, from ¥8,536 million to ¥10,447 million. This increase was attributable to the positive effects from the introduction of new AV products,
44,302
58
Analysis of Management Performance
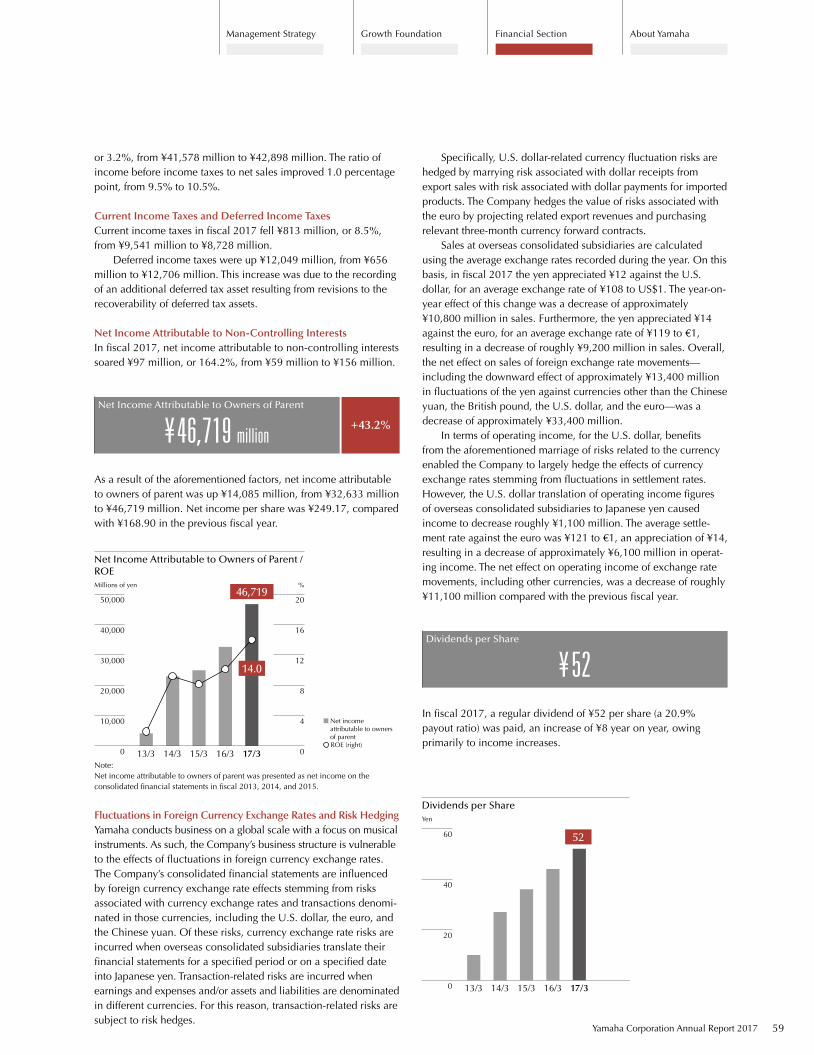
or 3.2%, from ¥41,578 million to ¥42,898 million. The ratio of income before income taxes to net sales improved 1.0 percentage point, from 9.5% to 10.5%.
Current Income Taxes and Deferred Income TaxesCurrent income taxes in fiscal 2017 fell ¥813 million, or 8.5%, from ¥9,541 million to ¥8,728 million.
Deferred income taxes were up ¥12,049 million, from ¥656 million to ¥12,706 million. This increase was due to the recording of an additional deferred tax asset resulting from revisions to the recoverability of deferred tax assets.
Net Income Attributable to Non-Controlling InterestsIn fiscal 2017, net income attributable to non-controlling interests soared ¥97 million, or 164.2%, from ¥59 million to ¥156 million.
+43.2%
Net Income Attributable to Owners of Parent
¥ 46,719 million
As a result of the aforementioned factors, net income attributable to owners of parent was up ¥14,085 million, from ¥32,633 million to ¥46,719 million. Net income per share was ¥249.17, compared with ¥168.90 in the previous fiscal year.
Net Income Attributable to Owners of Parent / ROEMillions of yen %
17/316/315/314/313/30
10,000
20,000
30,000
40,000
50,000
0
4
8
12
16
20
Net income attributable to owners of parent ROE (right)
Note: Net income attributable to owners of parent was presented as net income on the consolidated financial statements in fiscal 2013, 2014, and 2015.
Fluctuations in Foreign Currency Exchange Rates and Risk HedgingYamaha conducts business on a global scale with a focus on musical instruments. As such, the Company’s business structure is vulnerable to the effects of fluctuations in foreign currency exchange rates. The Company’s consolidated financial statements are influenced by foreign currency exchange rate effects stemming from risks associated with currency exchange rates and transactions denomi-nated in those currencies, including the U.S. dollar, the euro, and the Chinese yuan. Of these risks, currency exchange rate risks are incurred when overseas consolidated subsidiaries translate their financial statements for a specified period or on a specified date into Japanese yen. Transaction-related risks are incurred when earnings and expenses and/or assets and liabilities are denominated in different currencies. For this reason, transaction-related risks are subject to risk hedges.
Specifically, U.S. dollar-related currency fluctuation risks are hedged by marrying risk associated with dollar receipts from export sales with risk associated with dollar payments for imported products. The Company hedges the value of risks associated with the euro by projecting related export revenues and purchasing relevant three-month currency forward contracts.
Sales at overseas consolidated subsidiaries are calculated using the average exchange rates recorded during the year. On this basis, in fiscal 2017 the yen appreciated ¥12 against the U.S. dollar, for an average exchange rate of ¥108 to US$1. The year-on-year effect of this change was a decrease of approximately ¥10,800 million in sales. Furthermore, the yen appreciated ¥14 against the euro, for an average exchange rate of ¥119 to €1, resulting in a decrease of roughly ¥9,200 million in sales. Overall, the net effect on sales of foreign exchange rate movements—including the downward effect of approximately ¥13,400 million in fluctuations of the yen against currencies other than the Chinese yuan, the British pound, the U.S. dollar, and the euro—was a decrease of approximately ¥33,400 million.
In terms of operating income, for the U.S. dollar, benefits from the aforementioned marriage of risks related to the currency enabled the Company to largely hedge the effects of currency exchange rates stemming from fluctuations in settlement rates. However, the U.S. dollar translation of operating income figures of overseas consolidated subsidiaries to Japanese yen caused income to decrease roughly ¥1,100 million. The average settle-ment rate against the euro was ¥121 to €1, an appreciation of ¥14, resulting in a decrease of approximately ¥6,100 million in operat-ing income. The net effect on operating income of exchange rate movements, including other currencies, was a decrease of roughly ¥11,100 million compared with the previous fiscal year.
Dividends per Share
¥ 52In fiscal 2017, a regular dividend of ¥52 per share (a 20.9% payout ratio) was paid, an increase of ¥8 year on year, owing primarily to income increases.
46,719
14.0
Dividends per ShareYen
17/316/315/314/313/30
20
40
60 52
Financial SectionGrowth FoundationManagement Strategy About Yamaha
Yamaha Corporation Annual Report 2017 59

Music schools, etc.23.3%
String and percussion instruments 10.1%
Wind instruments 15.6%
Pianos 18.8%
Digital musical instruments 32.2%
–7.1%
Sales
¥ 257,664 million
Fiscal 2017 Performance OverviewSales in fiscal 2017 were down ¥19,705 million, or 7.1%, to ¥257,664 million. Operating income edged up ¥451 million, or 1.4%, from ¥31,687 million to ¥32,138 million.
Review by Major ProductsSales of pianos in China continued to be favorable as sales from piano bids helped offset the stagnant growth rate of personal con-sumption. Excluding the impact of foreign exchange rates, sales were solid in Europe on an actual basis. Piano sales in Japan were on a par with those of the previous fiscal year, with healthy sales in the U.S. market as well. As a result, overall piano sales increased year on year.
For digital musical instruments, sales of portable keyboards failed to reach the previous fiscal year’s level on an actual basis that excludes the impact of foreign exchange rates. This result reflects the shift in demand to digital pianos. Meanwhile, sales of mainstay digital pianos increased, and sales of synthesizers were also solid. As a result, overall sales for digital musical instruments were favorable. North America, Europe, and other markets helped drive sales of wind instruments, resulting in a year-on-year increase, despite a sales decrease in Japan. Sales of string and per-cussion instruments were strong overall, owing in part to a 140%
growth rate for guitar sales in China. Revenue from Yamaha’s music and English language schools decreased in the first quarter of the year under review as management of the music schools was transferred to the Yamaha Music Foundation from the second quar-ter of the previous fiscal year. Also, sales of school course materi-als, in addition to sales of the content business, were roughly the same as they were in the previous fiscal year.
Notes:1. As of fiscal 2014, the AV/IT segment changed its name to the audio equipment segment and the PA equipment business,
which was previously reported as part of the musical instruments segment, was included in the audio equipment segment. Accordingly, figures for fiscal 2013 have been adjusted to reflect these segment composition changes.
2. As of fiscal 2017, the soundproofing business has been transferred from the musical instruments segment to the audio equipment segment. Accordingly, figures for the soundproofing business in fiscal 2016 have been reclassified into the audio equipment segment.
SalesMillions of yen
Sales by Product Category%
0
100,000
200,000
300,000
17/316/315/314/313/3
Musical Instruments
Operating IncomeMillions of yen
0
40,000
30,000
20,000
10,000
17/316/315/314/313/3
+1.4%
Operating Income
¥ 32,138 million
32,138
257,664
60
Review of Operations

China
13.0 %
Review by Region
Sales by Region Billions of yenMarket Trends and Fiscal 2017 PerformancePercentage of Sales by Region
• Influenced by various factors, such as the status of international politics, U.S. economic policies, the economic state of China, falling resource prices, and the depreciation of local currencies, condi-tions in the markets of other regions vary by country. With that being said, signs of an overall recovery were seen in the musical instruments market.
• By product, on an actual basis that excludes the impact of foreign exchange rates, sales of digital musical instruments were strong, reflecting increased sales of digital pianos, while sales of wind instru-ments were also favorable. However, more time is necessary for a genuine performance recovery.
Other Areas
17.2 %
• In Europe, musical tastes and musical instrument use vary by country. While there was rising uncertainty about the future of the EU’s eco-nomic structure due to such factors as the U.K’s decision to withdraw from the EU, gradual economic recovery was seen.
• By country and region, in addition to the strong economic perfor-mance in Germany—a core European market—economic recovery continued in southern European countries. By product, not only were sales of pianos strong, digital pianos, wind instruments, and string and percussion instruments, primarily guitars, enjoyed robust sales, result-ing in favorable sales overall.
Europe
18.4 %
• China’s musical market is distinctive, with acoustic pianos accounting for more than half of the market. However, with sales of digital musi-cal instruments, wind instruments, and guitars showing high growth rates, the demand structure of the market is gradually becoming simi-lar to that of developed countries.
• Despite the worsening economic slowdown, sales of the Company’s musical instruments were solid. The percentage of participation in and acquisition of bids for pianos were up, underpinned by a strong demand for pianos in musical education for children. Digital pianos and guitars posted double-digit sales growth, resulting in double-digit growth in overall sales on an actual basis.
• The U.S. musical instruments market, showing no bias toward any particular instrument category, is clearly oriented toward hobbies and entertainment, where a wide range of musical instruments are used. Favorable market conditions continued amid higher consumer spending.
• By product category, nearly all product groups recorded year-on-year sales growth on an actual basis that excludes the impact of foreign exchange rates.
North America
20.4 %
• Overall demand for musical instruments in Japan has been declining steadily. An example of this trend is the drastic contraction of the market for acoustic pianos over the past three decades. The high piano ownership rate and the low birthrate are both responsible for this trend.
• Signs of gradual economic recovery were seen. However, while piano and string and percussion sales were on a par with the previous fiscal year, sales of digital musical instruments decreased as a result of declining sales of mainstay digital pianos, and wind instrument sales fell due to lackluster product sales.
0
40
80
120
17/316/315/314/313/3
0
25
50
75
17/316/315/314/313/3
0
20
40
60
17/316/315/314/313/3
0
10
20
30
40
17/316/315/314/313/3
0
20
40
60
17/316/315/314/313/3
Japan
31.0 %
Yamaha musical instruments and hardware products Others (Music school, etc.)
44.2
33.6
47.3
52.7
79.8
Financial SectionGrowth FoundationManagement Strategy About Yamaha
Yamaha Corporation Annual Report 2017 61

Fiscal 2017 Performance OverviewSales in fiscal 2017 decreased ¥5,396 million, or 4.5%, to ¥115,484 million.
For AV products, the Company actively pursued the launch of new network audio products, among other initiatives, resulting in an increase in sales on an actual basis. For PA equipment, sales grew significantly, primarily in Japan, Europe, and other developed countries, due in part to the high sales growth of commercial
audio equipment in North America, where the Company had delays in establishing a sales structure. Sales of analog mixers, amps, speakers, and other products that use the sales routes of musical instruments were solid. Moreover, solid sales were recorded for routers, which are primarily sold in the Japanese market.
Operating income climbed ¥1,910 million, or 22.4%, from ¥8,536 million to ¥10,447 million.
Sales Millions of yen
0
40,000
80,000
120,000
17/316/315/314/313/3
Operating IncomeMillions of yen
17/316/315/314/313/30
4,000
8,000
12,000
Audio Equipment
Notes:1. As of fiscal 2014, the AV/IT segment changed its name to the audio equipment segment and the PA equipment business,
which was previously reported as part of the musical instruments segment, was included in the audio equipment segment. Accordingly, figures for fiscal 2013 have been adjusted to reflect these segment composition changes.
2. As of fiscal 2017, the soundproofing business has been transferred from the musical instruments segment to the audio equipment segment. Accordingly, figures for the soundproofing business in fiscal 2016 have been reclassified into the audio equipment segment.
–22.4%
Operating Income
¥ 10,447 million–4.5%
Sales
¥ 115,484 million
10,447
115,484
62
Review of Operations

Sales in fiscal 2017 declined ¥2,126 million, or 5.7%, to ¥35,099 million.
For electronic devices, while sales of electronic devices used in automobiles and geomagnetic sen-sors rose, sales of LSI for amusement equipment, a mainstay product, and audio devices such as audio codecs fell, resulting in a year-on-year decrease in sales. Sales of automobile interior wood compo-nents were down, while sales of FA equipment and thermoelectric devices were up, resulting in an overall sales increase in the industrial machinery and components business.
Operating income soared ¥1,277 million, or 290.8%, from ¥439 million to ¥1,716 million. The primary factors behind this increase were improve-ments in the product model mix for electronic devices, reduced costs, and the strong performance of golf products in the domestic market.
Millions of yenMillions of U.S. dollars
2013/3 2014/3 2015/3 2016/3 2017/3 2017/3
SalesMusical Instruments ¥235,507 ¥262,310 ¥281,667 ¥277,370 ¥257,664 $2,296.68 Audio Equipment 92,571 105,485 112,839 120,881 115,484 1,029.36 Electronic Devices 15,038 18,828 13,435 — — —Others 23,823 23,679 24,235 37,225 35,099 312.85
Operating income (loss)Musical Instruments ¥ 6,451 ¥ 19,728 ¥ 25,064 ¥ 31,687 ¥ 32,138 $ 286.46 Audio Equipment 4,553 5,866 6,133 8,536 10,447 93.12 Electronic Devices (2,044) 770 (1,446) — — —Others 254 (370) 384 439 1,716 15.30
Capital expendituresMusical Instruments ¥ 8,928 ¥ 6,621 ¥ 9,534 ¥ 6,700 ¥ 11,172 $ 99.58Audio Equipment 2,467 2,788 2,840 3,102 4,002 35.67Electronic Devices 1,381 216 639 — — —Others 1,068 1,172 832 1,418 2,368 21.11
Depreciation expensesMusical Instruments ¥ 8,597 ¥ 8,519 ¥ 8,238 ¥ 8,390 ¥ 7,245 $ 64.58 Audio Equipment 1,592 2,647 2,857 3,075 2,920 26.03 Electronic Devices 669 761 706 — — —Others 754 830 795 1,215 978 8.72
R&D expensesMusical Instruments ¥ 8,088 ¥ 8,078 ¥ 9,580 ¥ 9,291 ¥ 8,728 $ 77.80Audio Equipment 9,219 10,011 11,025 11,461 11,447 102.03Electronic Devices 3,374 3,094 3,429 — — —Others 1,466 1,376 1,403 4,041 4,240 37.79
Notes:1. U.S. dollar amounts are translated from yen at the rate of ¥112.19 = U.S.$1.00, the approximate rate prevailing on March 31, 2017.
For more-detailed information, please refer to Financial Data 2017.2. As of fiscal 2014, the AV/IT segment changed its name to the audio equipment segment and the PA equipment business, which was previously reported as part of the musical
instruments segment, was included in the audio equipment segment. Accordingly, figures for fiscal 2013 have been adjusted to reflect these segment composition changes.3. As of fiscal 2017, the soundproofing business has been transferred from the musical instruments segment to the audio equipment segment, and the electronic devices segment has
been transferred to the others segment. Accordingly, starting from fiscal 2016, figures for the soundproofing business and the electronic devices segment are listed under new segment subdivisions.
SalesMillions of yen
Operating Income (Loss)Millions of yen
17/316/315/314/313/30
10,000
20,000
30,000
40,000
17/316/315/314/313/3–1,000
0
1,000
2,000
Others
+290.8%
Operating Income
¥ 1,716 million–5.7%
Sales
¥ 35,099 million
35,099 1,716
Key Business Indicators
Financial SectionGrowth FoundationManagement Strategy About Yamaha
Yamaha Corporation Annual Report 2017 63

Financing PolicyThe Yamaha Group obtains working capital to fund its business activities and finances its business expansion primarily from cash on hand, operating cash flows, and bank loans.
Yamaha’s basic financing policy is to procure stable, low-cost funding while preserving an appropriate amount of liquidity.
In fiscal 2017, the Company maintained a sufficient level of liquidity on hand, with cash and deposits totaling ¥105,859 million.
Group finance is carried out to promote efficient fund utiliza-tion for the entire Group.
Furthermore, the Company commissions long-term preferred debt rating assessments from credit rating agencies each year to facilitate smooth fund procurement in capital markets. The latest published ratings are shown below.
Credit Ratings
Rating agencyLong-term
preferred debt rating
Rating and Investment Information, Inc. (R&I) A (stable)
Japan Credit Rating Agency, Ltd. (JCR) A+ (stable)
As of March 31, 2017
+11.2%
Total Assets
¥ 522,362 million
Total assets as of March 31, 2017, amounted to ¥522,362 million, an increase of ¥52,617 million, or 11.2%, from the previous year-end figure of ¥469,745 million. Of this amount, total current assets came to ¥272,720 million, a rise of ¥17,585 million, or 6.9%, from ¥255,135 million at the end of the previous fiscal year. Additionally, fixed assets totaled ¥249,641 million, up ¥35,031 million, or 16.3%, from the previous year-end figure of ¥214,610 million.
Total Assets / ROAMillions of yen %
17/316/315/314/313/30
200,000
400,000
600,000
0
4
8
12
Total assets ROA (right)
Total Current AssetsTotal current assets totaled ¥272,720 million, up ¥17,585 million, or 6.9%. This increase was attributable mainly to an increase in cash and deposits, notes and accounts receivable—trade, and inventories.
Specifically, cash and deposits climbed ¥17,693 million, or 20.1%, to ¥105,859 million. Notes and accounts receivable—trade rose ¥1,969 million, or 4.0%, to ¥50,995 million. Inventories nudged up ¥1,261 million, or 1.4%, to ¥93,127 million. Deferred tax assets declined ¥223 million, or 2.5%, to ¥8,579 million. Other current assets fell ¥3,123 million, or 16.9%, to ¥15,397 million, reflecting a decrease in payments made to trust account for purchase of treasury stock. The ratio of total cur-rent assets to total current liabilities at the fiscal year-end was 330.3%, compared with 338.1% from a year earlier, indicating that the Company continued to sustain a high level of liquidity during fiscal 2017.
Total Property, Plant and EquipmentTotal fixed assets amounted to ¥249,641 million, up ¥35,031 mil-lion, or 16.3%, from ¥214,610 million at the previous fiscal year-end, due primarily to a rise in investment securities. Total property, plant and equipment as of March 31, 2017, stood at ¥105,475 million, an increase of ¥1,195 million, or 1.1%. Construction in progress was ¥7,287 million, soaring ¥5,742 million, or 371.7%, owing to the construction of a R&D building on the grounds of the Company’s headquarters. Intangible assets fell ¥2,364 million, or 42.5%, to ¥3,195 million. Of this amount, goodwill plummeted ¥2,395 million, or 97.5%, to ¥60 million, as a result of the imme-diate amortization of goodwill related to the U.S.-based subsidiary Revolabs, Inc.
Total Investments and Other AssetsInvestment securities as of March 31, 2017, amounted to ¥132,771 million, a year-on-year increase of ¥35,860 million, or 37.0%, owing primarily to a rise in the market value of securities held by the Company.
–6.6%
Total Liabilities
¥ 154,924 million
Total liabilities as of March 31, 2017, stood at ¥154,924 million, down ¥10,931 million, or 6.6%, from the previous year-end figure of ¥165,856 million.
Analysis of Financial Position
522,362
9.4
64

Total Current LiabilitiesTotal current liabilities came to ¥82,565 million, an increase of ¥7,105 million, or 9.4%. While short-term loans payable and accounts payable—other and accrued expenses rose, notes and accounts payable—trade as well as provision for product warran-ties declined. Specifically, short-term loans payable climbed ¥2,761 million, or 32.8%, to ¥11,170 million. Accounts payable—other and accrued expenses rose ¥6,738 million, or 18.1%, to ¥43,961 million. Meanwhile, notes and accounts payable—trade declined ¥1,524 million, or 7.9%, to ¥17,828 million, while pro-vision for product warranties fell ¥839 million, or 33.2%, to ¥1,687 million.
Total Noncurrent LiabilitiesTotal noncurrent liabilities as of March 31, 2017, totaled ¥72,359 million, a fall of ¥18,037 million, or 20.0%. Deferred tax liabili-ties, net defined benefit liabilities, and long-term deposits received all decreased. Specifically, deferred tax liabilities were down ¥2,588 million, or 10.5%, to ¥22,161 million. Net defined benefit liabilities fell ¥14,985 million, or 39.4%, to ¥23,039 million, fol-lowing pension plan revisions. Furthermore, long-term deposits received decreased ¥5,939 million, or 39.5%, to ¥9,102 million.
Net Interest-Bearing LiabilitiesAs of March 31, 2017, short- and long-term loans payable, which constitute interest-bearing liabilities, amounted to ¥11,241 mil-lion. Cash and deposits were ¥105,859 million, resulting in net cash and deposits, less short- and longer-term loans payable, of ¥94,617 million, a rise of ¥14,962 million compared with ¥79,655 million at the previous fiscal year-end.
Interest-Bearing Liabilities / Debt to Equity RatioMillions of yen Times
0
4,000
8,000
12,000
0
0.02
0.04
0.06
17/316/315/314/313/3
Interest-bearing liabilities Debt to equity ratio (right)
+20.9%
Total Net Assets
¥ 367,437 million
Total net assets as of March 31, 2017, came to ¥367,437 million, up ¥63,548 million, or 20.9%, from the previous fiscal year-end figure of ¥303,889 million. While there was an acquisition of trea-sury stock and a loss due to foreign currency translation adjust-ments, retained earnings increased due to a rise in net income attributable to owners of parent. Additionally, the valuation differ-ence on available-for-sale securities increased, and remeasure-ments of defined benefit plans improved, resulting in the increase in total net assets.
Specifically, treasury stock rose ¥2,785 million following a decision made at the Board of Directors’ meeting held on February 4, 2016, to acquire treasury stock. The negative balance of foreign currency translation adjustments expanded ¥4,706 million.
Retained earnings were up ¥37,598 million, or 17.6%, to ¥250,649 million, reflecting net income attributable to owners of parent of ¥46,719 million and dividend payments of ¥9,768 mil-lion. Valuation difference on available-for-sale securities rose ¥25,244 million, or 45.9%, to ¥80,282 million, due to an increase in the market value of securities held by the Company. The nega-tive balance of remeasurements of defined benefit plans shrunk ¥8,675 million, to ¥2,645 million, owing to revised pension plans. Non-controlling interests edged down ¥30 million, or 1.3%, to ¥2,314 million.
As a result of the above, the equity ratio climbed 5.7 points, from 64.2% to 69.9%, and return on equity (ROE) rose 3.9 points, from 10.1% to 14.0%. The impact of recording an additional deferred tax asset has been included in ROE for the consolidated fiscal year under review.
Total Net Assets / Equity RatioMillions of yen %
0
25.0
50.0
75.0
0
150,000
300,000
450,000
17/316/315/314/313/3
Total net assets Equity ratio (right)
11,241
367,4370.03
69.9
Financial SectionGrowth FoundationManagement Strategy About Yamaha
Yamaha Corporation Annual Report 2017 65

Cash FlowsNet cash provided by operating activities in fiscal 2017 was ¥39,142 million, compared with net cash of ¥42,399 million pro-vided in the previous fiscal year. This represented a ¥3,257 million decrease in cash provided.
Net cash used in investing activities was ¥9,663 million, in contrast to ¥591 million provided in the previous fiscal year. In addition to ¥13,276 million used to purchase property, plant and equipment, this result reflects a decline in proceeds from sales of property, plant and equipment.
Net cash used in financing activities was ¥12,588 million, compared with ¥30,349 million used in the previous fiscal year, representing a ¥17,760 million decrease in cash used year on year. This decrease was attributable to a significant reduction of expenditures to purchase treasury stock, which offset an increase in expenditures due to repayments for deposits received from membership.
As a result of the aforementioned factors, the fiscal 2017 year-end balance of cash and cash equivalents rose ¥15,651 million, to ¥100,669 million.
Free Cash FlowMillions of yen
–15,000
0
45,000
30,000
15,000
17/316/315/314/313/3
Capital Expenditures / Depreciation and AmortizationCapital expenditures for the Yamaha Group in the consolidated fiscal year under review amounted to ¥17,542 million, up ¥6,321 million, or 56.3%, from ¥11,220 million in the previous fiscal year. Capital expenditures in the musical instruments segment
stood at ¥11,172 million, an increase of ¥4,472 million, or 66.7%, from ¥6,700 million. In the audio equipment segment, capital expenditures were up ¥900 million, or 29.0%, from ¥3,102 million to ¥4,002 million. Capital expenditures in the others segment rose ¥949 million, or 66.9%, from ¥1,419 million to ¥2,368 million.
Depreciation and amortization came to ¥11,145 million, down ¥1,536 million, or 12.1%, from ¥12,681 million in fiscal 2016.
R&D ExpensesR&D expenses in fiscal 2017 edged down ¥378 million, or 1.5%, from ¥24,793 million to ¥24,415 million. The ratio of R&D expenses to net sales rose 0.3 of a percentage point, from 5.7% to 6.0%.
Most of the Company’s R&D spending was directed at product development, primarily in digital musical instruments, professional audio equipment, communications equipment, and semiconduc-tor businesses. Specifically, the spending supported elemental technology research and product development for hybrid products that meld acoustic and digital technologies, development efforts to raise the competitiveness of digital musical instruments, and the development of new commercial audio equipment to respond to the expansion of digital networks. Spending also supported prod-uct development aimed at expanding the category of AV products and new product development, including online karaoke equip-ment and routers. In the semiconductor business, spending was used to develop semiconductors used in automobiles and modules that combine various components, as well as to advance the development of new amusement equipment and geomagnetic sensors (electronic compasses) for smartphones.
R&D budgets also funded programs to research and develop basic sound- and music-related technologies (sound sources, voice synthesis, architectural acoustics, etc.). Such new devices as speakers, sensors, and interfaces were also researched, in addition to acoustic materials.
Capital Expenditures / Depreciation and AmortizationMillions of yen
R&D Expenses / R&D Expenses to Net SalesMillions of yen %
17/316/315/314/313/30
5,000
10,000
15,000
20,000
0
10,000
20,000
30,000
0
4
8
12
17/316/315/314/313/3
Capital expenditures Depreciation and amortization
R&D expenses R&D expenses to net sales (right)
17,542
24,415
11,145
6.0
29,478
66
Analysis of Financial Position

Performance forecastFiscal 2018 represents the middle year of the medium-term man-agement plan, NEXT STAGE 12.
Gradual economic recovery is expected to continue in North America. In Europe, although uncertainty remains about the future of the EU, signs of economic recovery have emerged and a solid performance is anticipated. While stagnation in the economic growth rate in China is expected to some extent, the Company is expect-ing to realize a stable performance due to steady growth in piano sales and genuine rise in popularity of other musical instruments, such as digital pianos and guitars. In other emerging countries, while conditions vary by country, the Company expects to realize a certain amount of overall sales growth based on the results it achieved throughout fiscal 2017 and in light of the establishment of a new organization that will manage the Asia Pacific region.
By business segment, in the musical instruments segment, the Company will continue its efforts to increase sales through the upgrade of sales networks in China and other emerging countries. Particularly in China, the Company will respond flexibly to the changing market, which is beginning to show steady sales growth for various products, including digital musical instruments, wind instruments, and guitars. Also, in such developed markets as North America, the Company aims to expand sales by taking a flexible approach to market changes while maximizing the impact of new product launches. Overall, in the musical instruments segment, the Company is expecting a slight increase in sales due to the impact of foreign exchange rates. Income is also expected to increase despite losses in certain areas.
In the audio equipment segment, for AV products, the Company aims to achieve sales growth by steadily promoting the launch of new network audio products. As for PA equipment, the Company will strengthen its ability to offer system solutions in the field of commercial audio equipment, centered on its mainstay digital mixers. In addition, the Company will make a full-scale entry into the commercial installed sound market. In the United States and ASEAN regions, the Company will promote the estab-lishment of a sales structure, which in turn will lead to a steady increase in the rate of growth. In the commercial router business, the Company will leverage its high reputation in the market and expand its domain for switches, access points, and other products. At the same time, the Company aims to increase sales of ICT devices as a whole by integrating microphone speakers for Web conferencing into the audio communication device business.
In the others segment, for the electronic devices business, the Company expects sales to be on a par with those of fiscal 2017. Amid such expectations, the Company will promote efforts to improve the product model mix and reduce costs. At the same time, the Company will contribute to the profit growth of client
companies through proposals for modules that combine the vari-ous technologies it possesses.
For golf products, although adverse conditions are expected to continue overseas, the Company aims to further boost its product recognition in Japan and expand sales by increasing its market share. In the automobile interior wood components business, with the aim of enhancing its manufacturing capabilities by reducing lead time, the Company will work to deliver a stable supply to customers. For FA equipment, the Company will set its sights on higher sales through the expansion of its customer base and initia-tives to bolster customer support by increasing the number of development staff. In the resort business, the Company aims to improve profitability through structural reforms and other mea-sures, despite an expected sales decrease due to the impact of facility transfers.
Exchange rate assumptions for fiscal 2018 are ¥110 per US$1, ¥120 per €1, and ¥16.2 per CNY¥1. Additionally, the Company expects to set a record high for operating income.
Capital Expenditures ForecastIn fiscal 2018, capital expenditures are expected to increase ¥28,400 million compared with fiscal 2017. In addition to regular investment in molds for the production of new products, invest-ment for facility upgrades and refurbishment, investment related to sales and marketing, investment to increase production capacity, R&D investment, and expenses related to plant rationalization, the Company plans to make investments to develop new facilities in the area surrounding its headquarters as well as to establish additional new production facilities in India and Indonesia. Depreciation and amortization expenses are expected to be on a par with the previous fiscal year as these expenses will not increase to the extent of capital expenditures following the Groupwide integration of a straight-line depreciation method.
Profit Distribution PolicyWith due consideration given to raising ROE, Yamaha adheres to a basic policy of actively providing returns to its shareholders while carrying out growth investments in areas such as R&D, sales, and capital expenditures, based on prospective levels of medium-term consolidated earnings. For shareholder returns, the Company adopts a policy of providing a continuous and stable dividend. However, giving consideration to the balance between returns and an appropriate amount of retained earnings for future growth investments, the Company will provide returns in a flexible and appropriate manner with the aim of improving capital efficiency. In addition, the Company has set a goal for a consolidated payout ratio of 30% or more. Furthermore, in fiscal 2018, the Company plans to pay a total dividend of ¥56.0 per share.
+4.6%
Net Sales
¥ 427,000 million–16.5%
Net Income Attributable to Owners of Parent
¥ 39,000 million
+9.5%
Operating Income
¥ 48,500 million
Financial SectionGrowth FoundationManagement Strategy About Yamaha
Yamaha Corporation Annual Report 2017 67
Forecast for Fiscal 2018

Yamaha Corporation and its consolidated subsidiaries Millions of yenThousands of
U.S. dollars (Note 5)
As of March 31, 2017 2017 2016 2017
AssetsCurrent assets:
Cash and deposits (Notes 21 and 23) ¥105,859 ¥ 88,166 $ 943,569 Notes and accounts receivable—trade (Note 23) 50,995 49,026 454,541Inventories (Note 10) 93,127 91,866 830,083Deferred tax assets (Note 27) 8,579 8,802 76,468Other 15,397 18,521 137,240Allowance for doubtful accounts (1,239) (1,247) (11,044)
Total current assets 272,720 255,135 2,430,876
Property, plant and equipment, net of accumulated depreciation (Notes 6 and 15):
Buildings and structures, net 31,034 33,728 276,620Machinery, vehicles, tools, furniture and fixtures, net 23,006 22,612 205,063Land (Note 9) 43,851 46,061 390,864Leased assets, net 294 333 2,621Construction in progress 7,287 1,544 64,952
Total property, plant and equipment, net of accumulated depreciation 105,475 104,280 940,146
Investments and other assets:Investment securities (Notes 7, 23 and 24) 132,771 96,911 1,183,448Long-term loans receivable 108 122 963Net defined benefit assets (Note 26) 254 6 2,264Deferred tax assets (Note 27) 2,261 2,123 20,153Lease and guarantee deposits 4,108 4,330 36,616Goodwill 60 2,456 535Other (Note 7) 4,726 4,483 42,125Allowance for doubtful accounts (126) (104) (1,123)
Total investments and other assets 144,166 110,329 1,285,016Total assets ¥522,362 ¥469,745 $4,656,048
See Notes to Consolidated Financial Statements.
68
Consolidated Balance Sheet
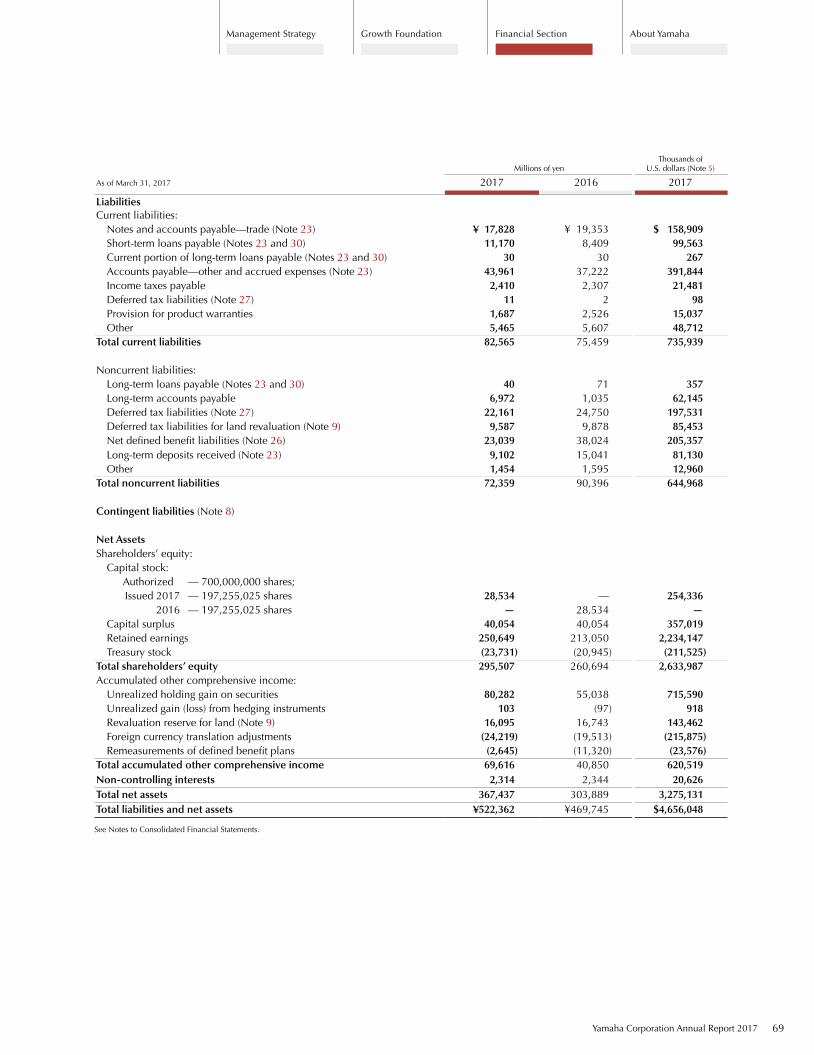
Millions of yenThousands of
U.S. dollars (Note 5)
As of March 31, 2017 2017 2016 2017
LiabilitiesCurrent liabilities:
Notes and accounts payable—trade (Note 23) ¥ 17,828 ¥ 19,353 $ 158,909 Short-term loans payable (Notes 23 and 30) 11,170 8,409 99,563Current portion of long-term loans payable (Notes 23 and 30) 30 30 267Accounts payable—other and accrued expenses (Note 23) 43,961 37,222 391,844Income taxes payable 2,410 2,307 21,481Deferred tax liabilities (Note 27) 11 2 98Provision for product warranties 1,687 2,526 15,037Other 5,465 5,607 48,712
Total current liabilities 82,565 75,459 735,939
Noncurrent liabilities:Long-term loans payable (Notes 23 and 30) 40 71 357Long-term accounts payable 6,972 1,035 62,145Deferred tax liabilities (Note 27) 22,161 24,750 197,531Deferred tax liabilities for land revaluation (Note 9) 9,587 9,878 85,453Net defined benefit liabilities (Note 26) 23,039 38,024 205,357Long-term deposits received (Note 23) 9,102 15,041 81,130Other 1,454 1,595 12,960
Total noncurrent liabilities 72,359 90,396 644,968
Contingent liabilities (Note 8)
Net AssetsShareholders’ equity:
Capital stock: Authorized — 700,000,000 shares; Issued 2017 — 197,255,025 shares 28,534 — 254,336 2016 — 197,255,025 shares — 28,534 —Capital surplus 40,054 40,054 357,019Retained earnings 250,649 213,050 2,234,147Treasury stock (23,731) (20,945) (211,525)
Total shareholders’ equity 295,507 260,694 2,633,987Accumulated other comprehensive income:
Unrealized holding gain on securities 80,282 55,038 715,590Unrealized gain (loss) from hedging instruments 103 (97) 918Revaluation reserve for land (Note 9) 16,095 16,743 143,462Foreign currency translation adjustments (24,219) (19,513) (215,875)Remeasurements of defined benefit plans (2,645) (11,320) (23,576)
Total accumulated other comprehensive income 69,616 40,850 620,519Non-controlling interests 2,314 2,344 20,626Total net assets 367,437 303,889 3,275,131Total liabilities and net assets ¥522,362 ¥469,745 $4,656,048
See Notes to Consolidated Financial Statements.
Yamaha Corporation Annual Report 2017 69
Financial SectionGrowth FoundationManagement Strategy About Yamaha

Yamaha Corporation and its consolidated subsidiaries Millions of yenThousands of
U.S. dollars (Note 5)
Year ended March 31, 2017 2017 2016 2017
Net sales ¥408,248 ¥435,477 $3,638,898Cost of sales (Notes 10, 11 and 13) 242,451 262,406 2,161,075 Gross profit 165,796 173,070 1,477,814 Selling, general and administrative expenses (Notes 12 and 13) 121,493 132,407 1,082,922 Operating income 44,302 40,663 394,884
Other income (expenses):Interest and dividend income 3,774 3,077 33,639 Tariff refund — 693 —Interest expenses (290) (338) (2,585)Sales discounts (2,616) (2,909) (23,318)Gain on sales or disposal of property, plant and equipment, net (Note 14) 3,544 8,296 31,589 Gain on sales of investment securities 259 3 2,309 Loss on impairment of fixed assets (Note 15) (630) (882) (5,615)Amortization of goodwill (Notes 4 and 16) (1,499) (6,759) (13,361)Business structural reform expenses (Note 15 and 17) (3,032) — (27,026)Loss due to transition to a defined contribution pension plan (892) — (7,951)Other, net (Note 18) (20) (265) (178)
(1,404) 914 (12,514)
Income before income taxes 42,898 41,578 382,369 Income taxes (Note 27):
Current 8,728 9,541 77,797 Deferred (12,706) (656) (113,254)
(3,978) 8,885 (35,458)
Net income for the period 46,876 32,693 417,827 Net income attributable to non-controlling interests 156 59 1,390 Net income attributable to owners of parent ¥ 46,719 ¥ 32,633 $ 416,427
See Notes to Consolidated Financial Statements.
70
Consolidated Statement of Operations
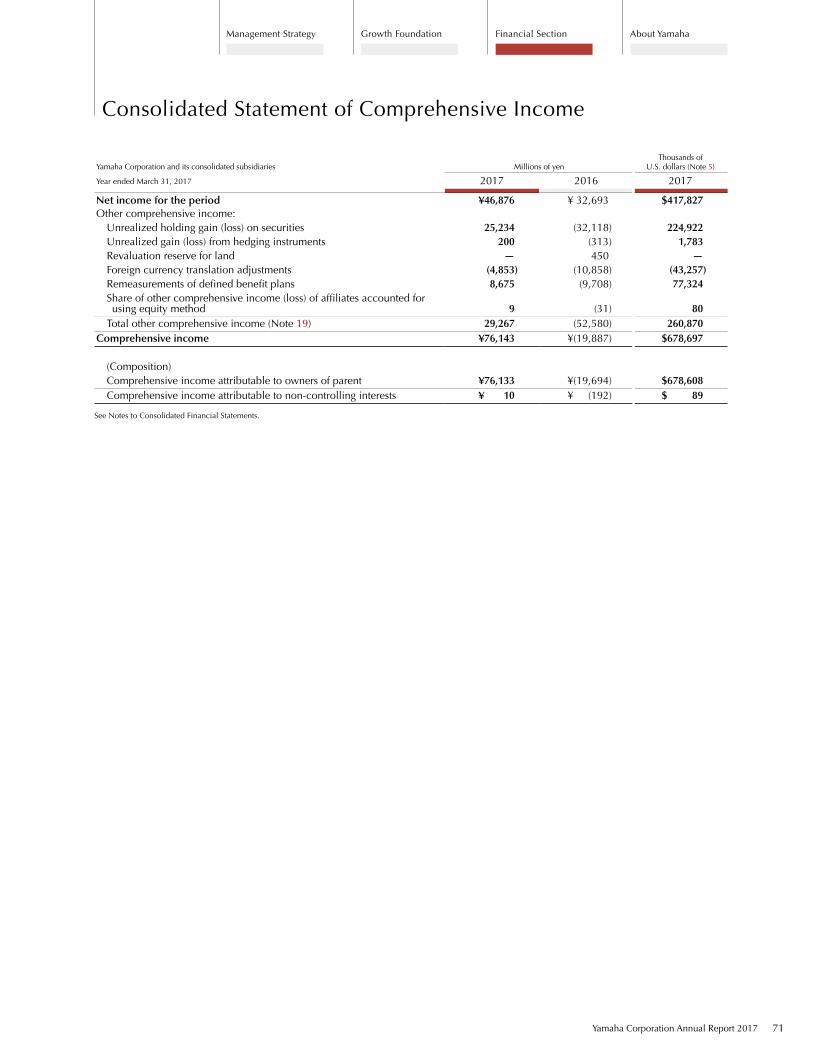
Yamaha Corporation and its consolidated subsidiaries Millions of yenThousands of
U.S. dollars (Note 5)
Year ended March 31, 2017 2017 2016 2017
Net income for the period ¥46,876 ¥ 32,693 $417,827Other comprehensive income:
Unrealized holding gain (loss) on securities 25,234 (32,118) 224,922Unrealized gain (loss) from hedging instruments 200 (313) 1,783Revaluation reserve for land — 450 —Foreign currency translation adjustments (4,853) (10,858) (43,257)Remeasurements of defined benefit plans 8,675 (9,708) 77,324Share of other comprehensive income (loss) of affiliates accounted for using equity method 9 (31) 80Total other comprehensive income (Note 19) 29,267 (52,580) 260,870
Comprehensive income ¥76,143 ¥(19,887) $678,697
(Composition)Comprehensive income attributable to owners of parent ¥76,133 ¥(19,694) $678,608Comprehensive income attributable to non-controlling interests ¥ 10 ¥ (192) $ 89
See Notes to Consolidated Financial Statements.
Yamaha Corporation Annual Report 2017 71
Consolidated Statement of Comprehensive Income
Financial SectionGrowth FoundationManagement Strategy About Yamaha

Millions of yen
Shareholders’ equity Accumulated other comprehensive income
Yamaha Corporation and its consolidated subsidiaries
Year ended March 31, 2017Capital stock
(Note 20) Capital surplus
Retained earnings (Note 20)
Treasury stock
(Note 20)
Total shareholders’
equity (Note 20)
Unrealized holding gain
(loss) on securities
Unrealized gain (loss)
from hedging instruments
Revaluation reserve for land
Foreign currency
translation adjustments
Remeasurements of defined
benefit plans
Total accumulated
other comprehensive
incomeNon-controlling
interests Total net
assets
Balance as of April 1, 2015 ¥28,534 ¥40,054 ¥186,436 ¥ (3,711) ¥251,314 ¥ 87,188 ¥ 215 ¥18,085 ¥ (9,106) ¥ (1,611) ¥ 94,771 ¥2,666 ¥348,752
C hanges of items during the period:
Dividends from surplus (Note 20) (7,841) (7,841) (7,841)
Net income attributable to owners of parent 32,633 32,633 32,633
Change in the scope of consolidation 29 29 29
Reversal of revaluation reserve for land 1,791 1,791 1,791
Purchase of treasury stock (17,234) (17,234) (17,234)
Net changes of items other than shareholders’ equity (32,150) (313) (1,341) (10,406) (9,708) (53,920) (321) (54,242)
T otal changes of items during the period — — 26,613 (17,234) 9,379 (32,150) (313) (1,341) (10,406) (9,708) (53,920) (321) (44,862)
Balance as of April 1, 2016 ¥28,534 ¥40,054 ¥213,050 ¥(20,945) ¥260,694 ¥ 55,038 ¥ (97) ¥16,743 ¥(19,513) ¥(11,320) ¥ 40,850 ¥2,344 ¥303,889
Changes of items during the period:
Dividends from surplus (Note 20) (9,768) (9,768) (9,768)
Net income attributable to owners of parent 46,719 46,719 46,719
Change in the scope of consolidation —
Reversal of revaluation reserve for land 648 648 648
Purchase of treasury stock (2,785) (2,785) (2,785)
N et changes of items other than shareholders’ equity 25,244 200 (648) (4,706) 8,675 28,765 (30) 28,735
T otal changes of items during the period — — 37,598 (2,785) 34,813 25,244 200 (648) (4,706) 8,675 28,765 (30) 63,548
B alance as of March 31, 2017 ¥28,534 ¥40,054 ¥250,649 ¥(23,731) ¥295,507 ¥ 80,282 ¥ 103 ¥16,095 ¥(24,219) ¥ (2,645) ¥ 69,616 ¥2,314 ¥367,437
72
Consolidated Statement of Changes in Net Assets

Thousands of U.S. dollars (Note 5)
Shareholders’ equity Accumulated other comprehensive income
Yamaha Corporation and its consolidated subsidiaries
Year ended March 31, 2017Capital stock
(Note 20) Capital surplus
Retained earnings (Note 20)
Treasury stock
(Note 20)
Total shareholders’
equity (Note 20)
Unrealized holding gain
(loss) on securities
Unrealized gain (loss)
from hedging instruments
Revaluation reserve for land
Foreign currency
translation adjustments
Remeasurements of defined
benefit plans
Total accumulated
other comprehensive
incomeNon-controlling
interests Total net
assets
Balance as of April 1, 2016 $254,336 $357,019 $1,899,011 $(186,692) $2,323,683 $490,578 $ (865) $149,238 $(173,928) $(100,900) $364,114 $20,893 $2,708,700
C hanges of items during the period:
Dividends from surplus (Note 20) (87,067) (87,067) (87,067)
Net income attributable to owners of parent 416,427 416,427 416,427
Change in the scope of consolidation —
Reversal of revaluation reserve for land 5,776 5,776 5,776
Purchase of treasury stock (24,824) (24,824) (24,824)
Net changes of items other than shareholders’ equity 225,011 1,783 (5,776) (41,947) 77,324 256,395 (267) 256,128
T otal changes of items during the period — — 335,128 (24,824) 310,304 225,011 1,783 (5,776) (41,947) 77,324 256,395 (267) 566,432
B alance as of March 31, 2017 $254,336 $357,019 $2,234,147 $(211,525) $2,633,987 $715,590 $ 918 $143,462 $(215,875) $ (23,576) $620,519 $20,626 $3,275,131
See Notes to Consolidated Financial Statements.
Yamaha Corporation Annual Report 2017 73
Financial SectionGrowth FoundationManagement Strategy About Yamaha

Yamaha Corporation and its consolidated subsidiaries Millions of yenThousands of
U.S. dollars (Note 5)
Year ended March 31, 2017 2017 2016 2017
Operating activities:Income before income taxes ¥ 42,898 ¥ 41,578 $ 382,369 Depreciation and amortization 11,145 12,681 99,340 Loss on impairment of fixed assets 630 882 5,615 Amortization of goodwill 2,307 9,553 20,563 Increase (decrease) in allowance for doubtful accounts 47 (91) 419 (Gain) on liquidation of subsidiaries and affiliates (229) — (2,041)Loss on valuation of investment securities 7 0 62 (Gain) on sales of investment securities (259) (3) (2,309)(Gain) on liquidation of investment securities — (13) —(Decrease) in net defined benefit liabilities (7,166) (3,172) (63,874)Interest and dividend income (3,774) (3,077) (33,639)Interest expenses 290 338 2,585 Foreign exchange (gains) losses (111) 286 (989)Equity in (gains) losses of affiliates (7) 6 (62)(Gain) on sales or disposal of property, plant and equipment, net (3,544) (8,296) (31,589)Business structural reform expenses 3,032 — 27,026 Decrease (increase) in notes and accounts receivable—trade (3,036) 9,947 (27,061)Decrease (increase) in inventories (3,387) (8,523) (30,190)Increase (decrease) in notes and accounts payable—trade (550) (1,921) (4,902)Increase in accounts payable due to transition to a defined contribution pension plan 7,241 — 64,542 Other, net (852) 273 (7,594)Subtotal 44,679 50,449 398,244 Interest and dividend income received 3,780 3,137 33,693 Interest expenses paid (230) (332) (2,050)Payment of business structural reform expenses (565) (1,543) (5,036)Income taxes paid (8,520) (9,311) (75,943)
Net cash provided by operating activities 39,142 42,399 348,890 Investing activities:
Net decrease (increase) in time deposits (2,094) (300) (18,665)Payments for purchase of property, plant and equipment (13,276) (11,432) (118,335)Proceeds from sales of property, plant and equipment 5,263 12,811 46,911 Payments for purchase of investment securities (191) (250) (1,702)Proceeds from sales and redemption of investment securities 318 41 2,834 Proceeds from liquidation of investment securities — 27 —Proceeds from liquidation of subsidiaries and affiliates 329 — 2,933 Other, net (12) (305) (107)
Net cash provided by (used in) investing activities (9,663) 591 (86,131)Financing activities:
Net increase (decrease) in short-term loans payable 2,765 (2,188) 24,646 Proceeds from long-term loans payable — 93 —Repayments of long-term loans payable (30) (111) (267)Proceeds from deposits received from membership 125 150 1,114 Repayments for deposits received from membership (5,582) (261) (49,755)Purchase of treasury stock (8) (17,234) (71)Payments made to trust account for purchase of treasury stock — (2,793) —Cash dividends paid (9,768) (7,841) (87,067)Cash dividends paid to non-controlling interests (40) (129) (357)Other, net (47) (31) (419)
Net cash used in financing activities (12,588) (30,349) (112,203)Effect of exchange rate change on cash and cash equivalents (1,238) (3,782) (11,035)Net increase in cash and cash equivalents 15,651 8,859 139,504 Cash and cash equivalents at the beginning of period 85,018 76,159 757,804 Increase in cash and cash equivalents due to newly consolidated subsidiaries — 858 —Decrease in cash and cash equivalents resulting from exclusion of subsidiaries from consolidation — (858) —Cash and cash equivalents at end of period (Note 21) ¥100,669 ¥ 85,018 $ 897,308
See Notes to Consolidated Financial Statements.
74
Consolidated Statement of Cash Flows

1 Summary of Significant Accounting Policies
(a) Basis of presentationYamaha Corporation (the Company) and its domestic subsidiaries maintain their accounting records and prepare their financial statements in accordance with accounting principles generally accepted in Japan, and its overseas subsidiaries maintain their books of account in conformity with those of their respective countries of domicile. However, in accordance with “Practical Solution on Unification of Accounting Policies Applied to Foreign Subsidiaries for Consolidated Financial Statements” (Practical Issues Task Force (PITF) No.18), the accompanying consolidated financial statements have been prepared by using the accounts of overseas consolidated subsidiaries prepared in accordance with either International Financial Reporting Standards (IFRS) or accounting principles generally accepted in the United States as adjusted for certain items. The Company and all consolidated subsidiaries are referred to herein as the “Yamaha Group.”
The consolidated financial statements are prepared on the basis of accounting principles generally accepted in Japan, which are different in certain respects as to the application and disclosure requirements of International Financial Reporting Standards, and are compiled from the consolidated financial statements prepared by the Company as required by the Financial Instruments and Exchange Law of Japan. Certain reclassifications have been made to present the accom-panying consolidated financial statements in a format that is familiar to readers outside Japan. As permitted, amounts of less than one million yen have been omitted. As a result, the totals shown in the accompany-ing consolidated financial statements (both in yen and U.S. dollars) do not necessarily agree with the sums of the individual amounts.
(b) Basis of consolidation and accounting for investments in unconsolidated subsidiaries and affiliates
The accompanying consolidated financial statements include the accounts of the parent company and all subsidiaries over which it exerts substantial control through majority ownership of voting stock and/or by other means. As of March 31, 2017, the numbers of consolidated subsidiaries and affiliates accounted for by the equity method were 66 and 2 (67 and 2 in 2016). From the fiscal year ended March 31, 2017, the Company has included one over-seas subsidiary in the scope of consolidation. The Company has also excluded two domestic subsidiaries from the scope of consol-idation. Following its establishment, PT. Yamaha Musical Products Asia has been included in the scope of consolidation. The Company has excluded Yamaha Music Electronics Japan Co., Ltd. from the scope of consolidation due to the absorption of the company by Yamaha Musical Products Japan Co., Ltd. The Company has also excluded Line 6 (Japan), Inc. from the scope of consolidation due to the completion of liquidation. Investments in affiliates (other than subsidiaries as defined above) whose decision-making and control over their operations are significantly affected in various ways by the Yamaha Group are accounted for by the equity method. Investments in two affiliates were accounted for by the equity method for the year ended March 31, 2017 (two in 2016). Investments in unconsolidated affiliates not accounted for by the equity method are carried at cost.
Ten overseas subsidiaries have a financial closing date as of December 31, which differs from the financial closing date of the Company; however, financial statements as of March 31 are pre-pared and reported by these overseas subsidiaries for consolida-tion purposes.
(c) SecuritiesSecurities owned by the Yamaha Group have been classified into two categories, held-to-maturity and available-for-sale, in accor-dance with the accounting standards for financial instruments. Under these standards, held-to-maturity debt securities are either amortized or accumulated to face value by the straight-line method. Marketable securities classified as available-for-sale secu-rities are carried at fair value with any changes in unrealized hold-ing gain or loss, net of the applicable income taxes, included directly in net assets. Nonmarketable securities classified as available-for-sale securities are carried at cost. If the market value of marketable securities classified as available-for-sale securities declines significantly, such securities are written down to their respective fair value, thus establishing a new cost basis. The amount of each write-down is charged to income as a loss on valuation of investment securities unless the fair value is deemed recoverable. The Company has established a policy for the recog-nition of loss on valuation of investment securities if the market value at the year-end has declined significantly and a recovery to fair value is not anticipated. Cost of securities sold is determined by the weighted-average method.
(d) InventoriesInventories of the Company and its domestic consolidated subsid-iaries are stated principally at the cost method (a method of reduc-ing book value when the profitability of the inventories declines), cost being determined by the periodic average method. Inventories of the Company’s overseas consolidated subsidiaries are stated principally at the lower of cost or market, cost being determined by the moving-average method.
(e) DepreciationDepreciation of property, plant and equipment (excluding leased assets) is calculated by the straight-line method, at rates based on the estimated useful lives of the respective assets.
Estimated useful lives:Buildings: 31–50 years (accompanying facilities: 15 years)Structures: 10–30 yearsMachinery and equipment: 4–12 yearsTools, furniture and fixtures: 5–6 years
Depreciation of leased assets under finance leases, other than those for which the ownership transfers to the lessee, is calculated by the straight-line method over the lease period with the residual value at zero.
(f) Allowance for doubtful accountsTo properly evaluate accounts receivable, the allowance for doubt-ful accounts is provided at an amount sufficient to cover possible
Yamaha Corporation Annual Report 2017 75
Financial SectionGrowth FoundationManagement Strategy About Yamaha
Notes to Consolidated Financial Statements

losses on the collection of receivables. The amount of the provision is based on the historical experience with write-offs for normal receivables and individual estimation of the collectability of receiv-ables due from specific companies in financial difficulties.
(g) Provision for product warrantiesProvision for product warranties is provided to cover the cost of customers’ claims relating to after-sales service and repairs. The amount of this provision is based on a percentage of the amount or volume of sales after considering the historical experience with repairs of products under warranty or individual estimation.
(h) Retirement benefitsIn calculating retirement benefit obligations, the benefit formula is primarily used as the method for allocating projected retirement benefits to periods of service up to March 31, 2017.
Prior service cost is amortized as incurred by the straight-line method over a period (10 years) that is shorter than the average remaining years of service of the employees participating in the plans.
Actuarial gain or loss is amortized in the following year in which the gain or loss is recognized, primarily by the straight-line method, over a period (10 years) that is shorter than the average remaining years of service of the employees participating in the plans.
(i) Construction contractsFor the construction work in progress, if the outcome of the con-struction activity during the course of the construction is deemed certain, the percentage of completion method is applied.
When the above condition is not met, the completed-contract method is applied.
The method for estimating the amount recognized by the “percentage-of-completion” method is based on the ratio of costs incurred to the estimated total cost.
(j) Criteria for presentation of finance leases (as lessor)Finance lease transactions where the Company or a consolidated subsidiary is the lessor of the leased assets, in which ownership is not transferred to the lessee, are recorded as lease investment assets that are included in the item “Other” account under “Current assets.” Sales and cost of sales related to these finance lease trans-actions are recognized at the time the lease fees are received.
(k) Foreign currency translationMonetary assets and liabilities of the Company and its domestic consolidated subsidiaries denominated in foreign currencies are translated at the exchange rates in effect at each balance sheet date. The resulting exchange gain or loss is recognized as other income or expense. Assets and liabilities of overseas consolidated subsidiaries are translated at the exchange rates in effect at each balance sheet date. The components of net assets excluding trans-lation adjustment and non-controlling interests are translated at their historical exchange rates. Revenue and expense accounts are translated at the average rates of exchange in effect during the year. Differences arising from translation are presented as translation
adjustments and non-controlling interests in the accompanying consolidated balance sheet.
(l) Derivative financial instrumentsThe Company has entered into various derivative transactions in order to manage certain risk arising from adverse fluctuations in foreign currency exchange rates. Derivative financial instruments are carried at fair value with changes in unrealized gain or loss charged or credited to operations, except for those which meet the criteria for deferral hedge accounting under which unrealized gain or loss is deferred as a component of net assets.(Hedge accounting)To manage the fluctuation of foreign exchange risk in normal export and import transactions, the Company and its consolidated subsidiaries arrange their forward foreign exchange contracts and currency options, within amounts necessary, in accordance with internal rules of each company.
Hedging instruments are forward foreign exchange contracts and purchased foreign currency put options. Hedged items consist of forecast transactions, and recognized receivables and payables denominated in foreign currencies. Forecast transactions denomi-nated in foreign currencies designated as hedged items are accounted for by the benchmark method.
Where hedge effectiveness is not reassessed given that the anticipated cash flows have been fixed by hedging activities and the risk of changes in cash flows is completely avoided, forward foreign exchange contracts related to receivables and payables denominated in foreign currencies are accounted for by the allo-cation method whereby translation differences are allocated into the hedged items. See Note 25.
(m) Amortization method and amortization period for goodwillAmortization of goodwill is carried out separately for each goodwill item over a reasonable amount of years using the straight-line method.
(n) Cash and cash equivalentsCash on hand and in banks and short-term investments with a maturity of three months or less when purchased can easily be converted to cash and are subject to little risk of change in value.
(o) Income taxesDeferred income taxes are recognized by the asset and liability method. Under this method, deferred tax assets and liabilities are determined based on the differences between financial reporting and the tax bases of the assets and liabilities and are measured using the enacted tax rates and laws which will be in effect when the differences are expected to reverse.
The Company and certain of its domestic subsidiaries have adopted the consolidated taxation system.
(p) Consumption taxNational and local consumption taxes are excluded from transac-tion amounts. Non-deductible national and local consumption taxes on assets are treated as expenses.
76
Notes to Consolidated Financial Statements

2 Changes in Accounting Principles
Regarding the methods for calculation of depreciation of property, plant and equipment, previously, the Company and its consolidated subsidiaries in Japan adopted the declining balance method, and overseas consolidated subsidiaries mainly applied the straight-line method for calculating depreciation. However, from the beginning of this fiscal year, the method for depreciation in the Company and its subsidiaries has been changed to the straight-line method.
Under the current medium-term management plan NEXT STAGE 12, which will cover the three-year period beginning from the current fiscal year, as a part of its key strategies, the Company has set the objectives of continuously reducing costs, including reorganization of production processes, and strengthening its global business platforms. In addition, along with the expansion of the sales and production overseas and the increasing number of overseas subsidiaries through M&A, the importance of overseas bases is increasing. Since standardization of accounting treatment
throughout the Group has risen in importance, on the occasion of preparing a medium-term management plan, the Company recon-sidered the methods for calculating depreciation of property, plant and equipment.
Taking into account the actual usage and capital investments in the past as well as the usage plans and capital investments in the future, since the outlook is for the property, plant and equip-ment to be used stably over long useful lives, the Company has decided that it will be reasonable for depreciation expenses to be spread evenly over the useful lives of these assets through the use of the straight-line method of depreciation.
As a result of this change, operating income, ordinary income, and income before income taxes for the fiscal year were ¥745 million ($6,641 thousand) higher than they would have been in the absence of this change. Please note that the effect of this change to the segment information is stated in the related section (Note 28).
3 Changes in the Method of Presentation
Consolidated balance sheets In the consolidated financial statements for the previous fiscal year, long-term accounts payable were included in the other item under noncurrent liabilities. However, since the amount of this item has become material, it has been presented as an independent item. To reflect this change in presentation, the consolidated financial statements for the previous fiscal year have been reclassified.
As a result, in the consolidated balance sheets for the previous fiscal year, the other item under noncurrent liabilities, which was reported as ¥2,631 million, has been restated as ¥1,035 million of long-term accounts payable and ¥1,595 million of the other item under noncurrent liabilities.
4 Additional Information
Presentation of deferred tax assets accompanying the application of “Revised Implementation Guidance on Recoverability of Deferred Tax Assets” The Company has applied “Revised Implementation Guidance on Recoverability of Deferred Tax Assets” (ASBJ Guidance No. 26, March 28, 2016) from the beginning of this fiscal year, and, based on the recent performance trends and other factors, the Company has revised the recoverability of deferred tax assets.
As a result, during fiscal 2017, deferred tax assets have been additionally recorded in the consolidated financial statements, with ¥12,706 million ($113,254 thousand) to be credited as deferred income taxes.
Realignment of resort business The Company has decided to realign its resort business and, regarding “Tsumagoi™” that the Yamaha Group manages, concluded a transfer agreement of its real estate and trademark “Tsumagoi™” with Hotel Management International Co., Ltd. (HMI) on February 28, 2017. The Yamaha Group fully closed its operations as of March 26, 2017, and on March 27, the assets
were transferred to HMI. Please note that, in connection with this corporate realign-
ment, the Company reported a gain on sales of noncurrent assets of ¥2,182 million ($19,449 thousand) and business structural reform expenses of ¥2,652 million ($23,638 thousand). The impact on the consolidated financial statements for fiscal 2017 was a reduction in income before income taxes of ¥470 million ($4,189 thousand).
Extraordinary losses due to impairment loss on stock of consoli-dated subsidiary and immediate amortization of goodwill The Company reported extraordinary losses in fiscal 2017 because of the impairment loss on stock of a consolidated subsidiary held by the Company (in the non-consolidated closing) and the immediate amortization of goodwill (in the consolidated closing).
(1) Impairment loss of stock of consolidated subsidiary (in the non-consolidated closing)
The Company reported ¥2,319 million ($20,670 thousand) of extraordinary losses due to loss on valuation of stocks of subsidiar-ies and affiliates, namely, Revolabs, Inc., a company that became a
Yamaha Corporation Annual Report 2017 77
Financial SectionGrowth FoundationManagement Strategy About Yamaha

wholly owned subsidiary in March 2014, together with its subsid-iaries. This course of action was taken because performance results and results expected from drawing on the technology, know-how, sales network, etc. of these subsidiaries continued to diverge from initial plans. For this reason, the Company has reported an impair-ment loss on stocks of Revolabs and its subsidiaries.
Please note that the extraordinary losses shown in the non-consolidated closing have been eliminated in consolidation; there-fore, the impact of this extraordinary loss in the consolidated closing is equal to those shown in section 2.
(2) Immediate amortization of goodwill (in the consolidated closing) Accompanying the impairment loss in the non-consolidated clos-ing noted in the previous item, in its consolidated closing, the Company reported extraordinary losses on the immediate amorti-zation of goodwill of ¥1,499 million ($13,361 thousand) related to Revolabs, Inc., and its subsidiaries.
Revisions in the pension plans Yamaha Corporation and certain of its subsidiaries revised their pen-sion plans as of April 1, 2017, and made the transition of a portion of such plans from defined benefit to defined contribution plans. Accompanying this, Yamaha has applied “Accounting Treatment of Pension Plan Transitions” (Corporate Accounting Application Guidelines No. 1). For more details, see note 26.
5 U.S. Dollar Amounts
Solely for the convenience of the reader, the accompanying consolidated financial statements for the year ended March 31, 2017 have been presented in U.S. dollars by translating all yen amounts at ¥112.19 = U.S.$1.00, the exchange rate prevailing on March 31, 2017. This translation should not be construed as a representation that yen have been, could have been, or could in the future be converted into U.S. dollars at the above or any other rate.
6 Accumulated Depreciation
Accumulated depreciation of property, plant and equipment at March 31, 2017 and 2016 amounted to ¥182,053 million ($1,622,720 thousand) and ¥189,438 million, respectively.
7 Investment Securities
Investment securities at March 31, 2017 and 2016 were as follows:
Millions of yenThousands of
U.S. dollars (Note 5)
2017 2016 2017
Investment securities in unconsolidated subsidiaries and affiliates ¥918 ¥1,009 $8,183Investments in capital in unconsolidated subsidiaries and affiliates 31 32 276
8 Contingent Liabilities
Contingent liabilities at March 31, 2017 and 2016 were as follows:
Millions of yenThousands of
U.S. dollars (Note 5)
2017 2016 2017
Export bills discounted with banks ¥— ¥27 $—
78
Notes to Consolidated Financial Statements

9 Land Revaluation
For the year ended March 31, 2017, the Company has carried over the revaluation of their landholdings at the date of revaluation in accordance with the “Law Concerning the Revaluation of Land” (Law No.34 published on March 31, 1998). The date of revaluation was March 31, 2002.
For the years ended March 31, 2017 and 2016, the Company determined the value of its land based on the respective value regis-tered in the land tax list or the supplementary land tax list as specified in No.10 or No.11 of Article 341 of the Local Tax Law governed by Item 3 of Article 2 of the Enforcement Order for the “Law Concerning the Revaluation of Land” (Cabinet Order No.119 published on March 31, 1998).
The excess of the revalued carrying amount of such land over its market value at March 31, 2017 and 2016 is summarized as follows:
Millions of yenThousands of
U.S. dollars (Note 5)
2017 2016 2017
Excess of revalued carrying amount of land over market value ¥(7,271) ¥(7,331) $(64,810)
10 Inventories
Inventories at March 31, 2017 and 2016 were as follows:
Millions of yenThousands of
U.S. dollars (Note 5)
2017 2016 2017
Merchandise and finished goods ¥66,149 ¥63,232 $589,616Work in process 12,687 12,825 113,085Raw materials and supplies 14,290 15,808 127,373Total ¥93,127 ¥91,866 $830,083
Write-downs of inventories for the years ended March 31, 2017 and 2016 were recognized in the following account:
Millions of yenThousands of
U.S. dollars (Note 5)
2017 2016 2017
Cost of sales ¥(107) ¥(1,080) $(954)
Note: Figure in parentheses is a profit item.
11 Provision for Loss on Construction Contracts
Provision for loss on construction contracts was included in the following account for the years ended March 31, 2017 and 2016:
Millions of yenThousands of
U.S. dollars (Note 5)
2017 2016 2017
Cost of sales ¥(149) ¥165 $(1,328)
Note: Figure in parentheses is a profit item.
Financial SectionGrowth FoundationManagement Strategy About Yamaha
Yamaha Corporation Annual Report 2017 79

12 Selling, General and Administrative Expenses
Principal items of selling, general and administrative expenses for the years ended March 31, 2017 and 2016 were as follows:
Millions of yenThousands of
U.S. dollars (Note 5)
2017 2016 2017
Sales commissions ¥ 1,157 ¥ 1,396 $ 10,313Transport expenses 11,841 13,407 105,544Advertising expenses and sales promotion expenses 17,558 19,183 156,502Allowance for doubtful accounts 149 69 1,328Provision for product warranties (38) 974 (339)Retirement benefit expenses 3,752 2,921 33,443Salaries and benefits 52,238 54,806 465,621Rent 3,740 4,017 33,336Depreciation and amortization 2,299 2,440 20,492
Note: Figure in parentheses is a profit item.
13 R&D Expenses
R&D expenses, included in selling, general and administrative expenses and cost of sales for the years ended March 31, 2017 and 2016, amounted to ¥24,415 million ($217,622 thousand) and ¥24,793 million, respectively.
14 Sales or Disposal of Property, Plant and Equipment
For the year ended March 31, 2017Gain on sales of property, plant and equipment principally resulted from sales of noncurrent assets of ¥2,182 million ($19,449 thou-sand) related to realignment of the resort business. Loss on disposal of property, plant and equipment principally resulted from disposal of buildings and structures, and land.
For the year ended March 31, 2016Gain on sales of property, plant and equipment totaled ¥7,931 million, resulted principally from sales of the land and building of the former Shinsaibashi building, as well as the land of the former Kyushu building. Loss on disposal of property, plant and equipment princi-pally resulted from disposal of land, machinery and equipment, and buildings and structures.
15 Loss on Impairment of Fixed Assets
The following table summarizes loss on impairment of fixed assets for the years ended March 31, 2017 and 2016.
Millions of yenThousands of
U.S. dollars (Note 5)
Group of fixed assets Location Impaired assets 2017 2017
Idle assets, etc. Kakegawa City, Shizuoka, and elsewhere
Buildings and structures ¥1,039 $ 9,261Machinery, vehicles, tools, furniture and fixtures 123 1,096Land 1,437 12,809Construction in progress 34 303Total ¥2,634 $23,478
80
Notes to Consolidated Financial Statements

Of the aforementioned amount, impairment loss of ¥2,004 million ($17,863 thousand) related to realignment of the resort business is included in the business structural reform expenses.
Millions of yen
Group of fixed assets Location Impaired assets 2016
Idle assets, etc. Hamamatsu City, Shizuoka, and elsewhere
Buildings and structures ¥ 85Machinery, vehicles, tools, furniture and fixtures 0Land 796Total ¥882
Method for Grouping of Assets Within its segment classification, the Yamaha Group forms the smallest asset units that generate cash flow together.
Background Leading to the Recognition of Impairment Losses Impairment losses were recognized on idle assets that will not be used in the future, assets that are expected to become idle assets, and assets that the Company expects to dispose of.
Calculation of the Recovery Value The recovery value of idle assets, etc., is estimated from the net sales value; indicators include value estimates prepared by real estate appraisers, the assessed value for the tangible fixed assets tax, and other sources.
16 Amortization of Goodwill
For the year ended March 31, 2017An immediate amortization of goodwill was recognized based on Item 32 of the “Practical Guideline Related to Capital Consolidation Procedures in Consolidated Financial Statements” (Final Revision on November 28, 2014, the Accounting Practice Committee Report No.7 issued by the Japanese Institute of Certified Public Accountants). See note 4.
For the year ended March 31, 2016An immediate amortization of goodwill was recognized based on Item 32 of the “Practical Guideline Related to Capital Consolidation Procedures in Consolidated Financial Statements” (Final Revision on November 28, 2014, the Accounting Practice Committee Report No.7 issued by the Japanese Institute of Certified Public Accountants).
17 Business Structural Reform Expenses
For the year ended March 31, 2017In addition to losses of ¥2,652 million ($23,638 thousand) (including ¥2,004 million ($17,863 thousand) of impairment loss on fixed assets) incurred in connection with the realignment of the resort business, the Company incurred losses of ¥380 million ($3,387 thousand) due to extra retirement allowance in connection with reductions in personnel at overseas manufacturing and development operations.
For the year ended March 31, 2016None
Financial SectionGrowth FoundationManagement Strategy About Yamaha
Yamaha Corporation Annual Report 2017 81

18 Other Income (Expenses)
The components of “Other, net” in “Other income (expenses)” for the years ended March 31, 2017 and 2016 were as follows:
Millions of yenThousands of
U.S. dollars (Note 5)
2017 2016 2017
Foreign exchange losses ¥(218) ¥(598) $(1,943)Gain on liquidation of subsidiaries and affiliates 229 — 2,041Gain on liquidation of investment securities — 13 — Loss on valuation of investment securities (6) (0) (53)Others (25) 320 (223)Other, net ¥ (20) ¥(265) $ (178)
19 Information on Consolidated Statement of Comprehensive Income
Reclassification adjustments and tax effects related to each component of other comprehensive income for the years ended March 31, 2017 and 2016 were as follows:
Millions of yenThousands of
U.S. dollars (Note 5)
2017 2016 2017
Other comprehensive incomeUnrealized holding gain (loss) on securities
Amount arising during the year ¥ 36,108 ¥(48,053) $321,847 R eclassification adjustments for gains and losses recognized in the
Statement of Operations (244) — (2,175) Tax effect (10,630) 15,934 (94,750)
Total 25,234 (32,118) 224,922 Unrealized gain (loss) from hedging instruments
Amount arising during the year 287 (457) 2,558 Tax effect (87) 144 (775)
Total 200 (313) 1,783 Revaluation reserve for land
Tax effect — 450 —Foreign currency translation adjustments
Amount arising during the year (4,853) (10,858) (43,257)Remeasurements of defined benefit plans
Amount arising during the year 4,322 (10,428) 38,524 Reclassification adjustments for gains and losses recognized in the Statement of Operations 3,502 741 31,215 Amount before tax effect adjustment 7,824 (9,686) 69,739 Tax effect 850 (22) 7,576 Total 8,675 (9,708) 77,324
S hare of other comprehensive income (loss) of affiliates accounted for using equity methodAmount arising during the year 9 (31) 80
Total ¥ 29,267 ¥(52,580) $260,870
82
Notes to Consolidated Financial Statements
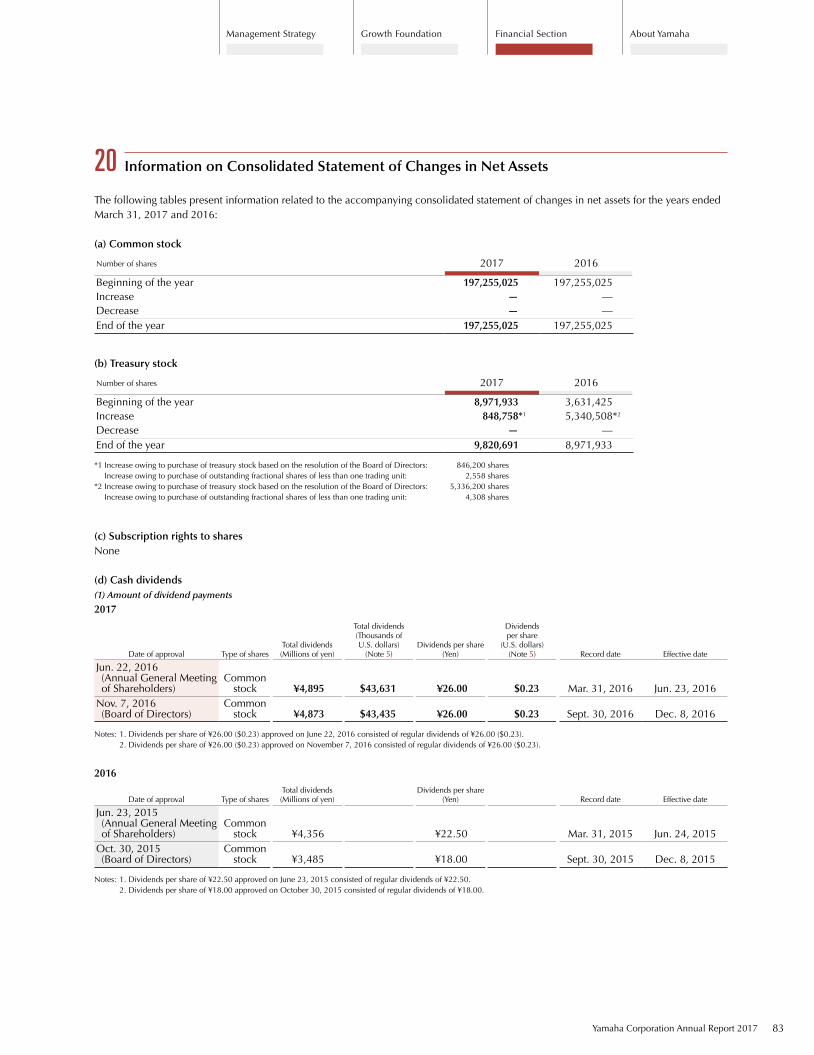
20 Information on Consolidated Statement of Changes in Net Assets
The following tables present information related to the accompanying consolidated statement of changes in net assets for the years ended March 31, 2017 and 2016:
(a) Common stock
Number of shares 2017 2016
Beginning of the year 197,255,025 197,255,025Increase — —Decrease — —End of the year 197,255,025 197,255,025
(b) Treasury stock
Number of shares 2017 2016
Beginning of the year 8,971,933 3,631,425Increase 848,758*1 5,340,508*2
Decrease — —End of the year 9,820,691 8,971,933
*1 Increase owing to purchase of treasury stock based on the resolution of the Board of Directors: 846,200 shares Increase owing to purchase of outstanding fractional shares of less than one trading unit: 2,558 shares
*2 Increase owing to purchase of treasury stock based on the resolution of the Board of Directors: 5,336,200 shares Increase owing to purchase of outstanding fractional shares of less than one trading unit: 4,308 shares
(c) Subscription rights to sharesNone
(d) Cash dividends(1) Amount of dividend payments
2017
Date of approval Type of sharesTotal dividends (Millions of yen)
Total dividends (Thousands of U.S. dollars)
(Note 5)Dividends per share
(Yen)
Dividends per share
(U.S. dollars) (Note 5) Record date Effective date
Jun. 22, 2016 (Annual General Meeting of Shareholders)
Common stock ¥4,895 $43,631 ¥26.00 $0.23 Mar. 31, 2016 Jun. 23, 2016
Nov. 7, 2016 (Board of Directors)
Common stock ¥4,873 $43,435 ¥26.00 $0.23 Sept. 30, 2016 Dec. 8, 2016
Notes: 1. Dividends per share of ¥26.00 ($0.23) approved on June 22, 2016 consisted of regular dividends of ¥26.00 ($0.23). 2. Dividends per share of ¥26.00 ($0.23) approved on November 7, 2016 consisted of regular dividends of ¥26.00 ($0.23).
2016
Date of approval Type of sharesTotal dividends (Millions of yen)
Dividends per share (Yen) Record date Effective date
Jun. 23, 2015 (Annual General Meeting of Shareholders)
Common stock ¥4,356 ¥22.50 Mar. 31, 2015 Jun. 24, 2015
Oct. 30, 2015 (Board of Directors)
Common stock ¥3,485 ¥18.00 Sept. 30, 2015 Dec. 8, 2015
Notes: 1. Dividends per share of ¥22.50 approved on June 23, 2015 consisted of regular dividends of ¥22.50. 2. Dividends per share of ¥18.00 approved on October 30, 2015 consisted of regular dividends of ¥18.00.
Financial SectionGrowth FoundationManagement Strategy About Yamaha
Yamaha Corporation Annual Report 2017 83
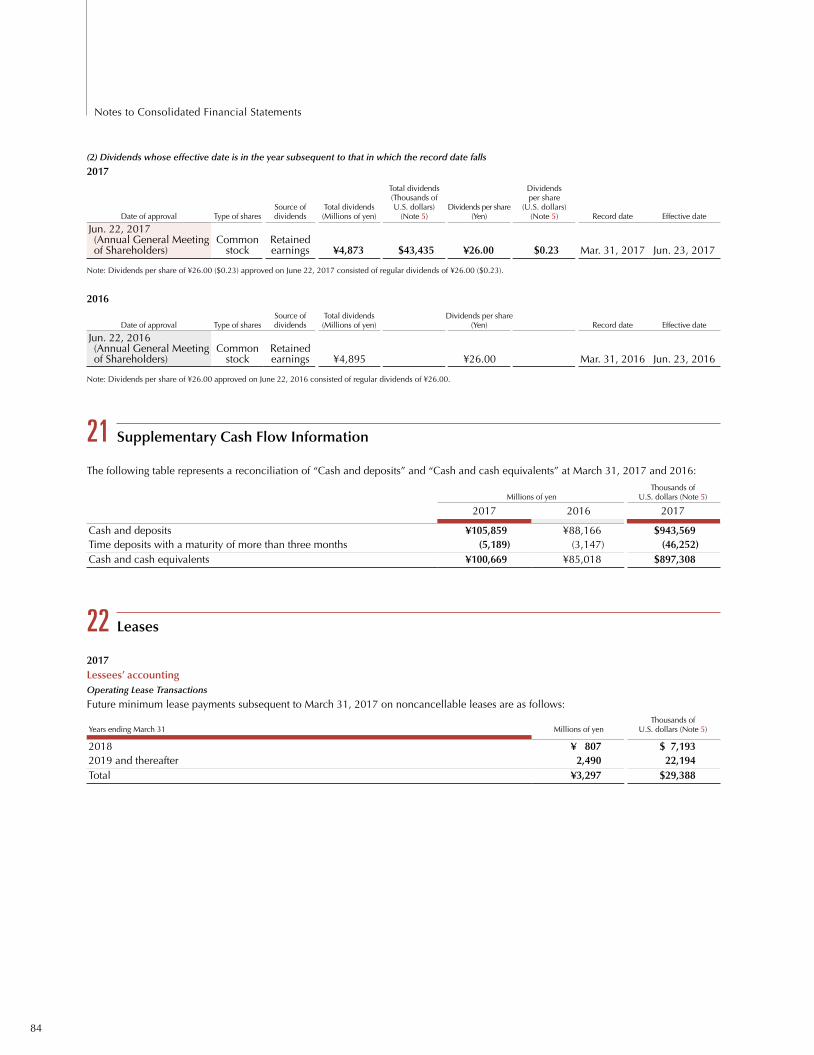
(2) Dividends whose effective date is in the year subsequent to that in which the record date falls
2017
Date of approval Type of sharesSource of dividends
Total dividends (Millions of yen)
Total dividends (Thousands of U.S. dollars)
(Note 5)Dividends per share
(Yen)
Dividends per share
(U.S. dollars) (Note 5) Record date Effective date
Jun. 22, 2017 (Annual General Meeting of Shareholders)
Common stock
Retained earnings ¥4,873 $43,435 ¥26.00 $0.23 Mar. 31, 2017 Jun. 23, 2017
Note: Dividends per share of ¥26.00 ($0.23) approved on June 22, 2017 consisted of regular dividends of ¥26.00 ($0.23).
2016
Date of approval Type of sharesSource of dividends
Total dividends (Millions of yen)
Dividends per share (Yen) Record date Effective date
Jun. 22, 2016 (Annual General Meeting of Shareholders)
Common stock
Retained earnings ¥4,895 ¥26.00 Mar. 31, 2016 Jun. 23, 2016
Note: Dividends per share of ¥26.00 approved on June 22, 2016 consisted of regular dividends of ¥26.00.
21 Supplementary Cash Flow Information
The following table represents a reconciliation of “Cash and deposits” and “Cash and cash equivalents” at March 31, 2017 and 2016:
Millions of yenThousands of
U.S. dollars (Note 5)
2017 2016 2017
Cash and deposits ¥105,859 ¥88,166 $943,569Time deposits with a maturity of more than three months (5,189) (3,147) (46,252)Cash and cash equivalents ¥100,669 ¥85,018 $897,308
22 Leases
2017Lessees’ accountingOperating Lease Transactions
Future minimum lease payments subsequent to March 31, 2017 on noncancellable leases are as follows:
Years ending March 31 Millions of yenThousands of
U.S. dollars (Note 5)
2018 ¥ 807 $ 7,1932019 and thereafter 2,490 22,194Total ¥3,297 $29,388
84
Notes to Consolidated Financial Statements

Finance Lease Transactions in which Ownership is not transferred to the Lessee Commencing on or before March 31, 2008
(a) Amounts related to leased assets corresponding to the acquisition cost, accumulated depreciation and net book value at the end of the year
Millions of yen Thousands of U.S. dollars (Note 5)
As of March 31, 2017 Acquisition costsAccumulated depreciation Net book value Acquisition costs
Accumulated depreciation Net book value
Buildings and structures ¥799 ¥453 ¥345 $7,122 $4,038 $3,075Other — — — — — —Total ¥799 ¥453 ¥345 $7,122 $4,038 $3,075
Amounts corresponding to the acquisition costs include interest expense since the balance of future minimum lease payments accounts for only a small percentage of property, plant and equipment as of the balance sheet date.
(b) Amounts corresponding to the future minimum lease payments subsequent to March 31, 2017
Years ending March 31 Millions of yenThousands of
U.S. dollars (Note 5)
2018 ¥ 47 $ 4192019 and thereafter 298 2,656Total ¥345 $3,075
Amounts corresponding to the future minimum lease payments include interest expense since the balance of future minimum lease payments accounts for only a small percentage of property, plant and equipment as of the balance sheet date.
(c) Amounts corresponding to the lease payments and depreciation
Year ended March 31, 2017 Millions of yenThousands of
U.S. dollars (Note 5)
Lease payments ¥47 $419Depreciation 47 419
(d) Method of calculating the amount of the depreciation of leased assetsDepreciation of leased assets is calculated by the straight-line method over the lease period with their residual value at zero.
Lessors’ accountingOperating Lease Transactions
Future minimum lease amounts receivable subsequent to March 31, 2017 on noncancellable leases are as follows:
Years ending March 31 Millions of yenThousands of
U.S. dollars (Note 5)
2018 ¥470 $4,1892019 and thereafter 445 3,966Total ¥915 $8,156
Financial SectionGrowth FoundationManagement Strategy About Yamaha
Yamaha Corporation Annual Report 2017 85

2016Lessees’ accountingOperating Lease Transactions
Future minimum lease payments subsequent to March 31, 2016 on noncancellable leases are as follows:Years ended / ending March 31 Millions of yen
2017 ¥ 8492018 and thereafter 2,797Total ¥3,646
Finance Lease Transactions in which Ownership is not transferred to the Lessee Commencing on or before March 31, 2008
(a) Amounts related to leased assets corresponding to the acquisition cost, accumulated depreciation and net book value at the end of the year
Millions of yen
As of March 31, 2016 Acquisition costsAccumulated depreciation Net book value
Buildings and structures ¥799 ¥406 ¥392Other — — —Total ¥799 ¥406 ¥392
Amounts corresponding to the acquisition costs include interest expense since the balance of future minimum lease payments accounts for only a small percentage of property, plant and equipment as of the balance sheet date.
(b) Amounts corresponding to the future minimum lease payments subsequent to March 31, 2016Years ended / ending March 31 Millions of yen
2017 ¥ 472018 and thereafter 345Total ¥392
Amounts corresponding to the future minimum lease payments include interest expense since the balance of future minimum lease payments accounts for only a small percentage of property, plant and equipment as of the balance sheet date.
(c) Amounts corresponding to the lease payments and depreciationYear ended March 31, 2016 Millions of yen
Lease payments ¥47Depreciation 47
(d) Method of calculating the amount of the depreciation of leased assetsDepreciation of leased assets is calculated by the straight-line method over the lease period with their residual value at zero.
Lessors’ accountingOperating Lease Transactions
Future minimum lease amounts receivable subsequent to March 31, 2016 on noncancellable leases are as follows:Years ended / ending March 31 Millions of yen
2017 ¥ 5022018 and thereafter 586Total ¥1,088
86
Notes to Consolidated Financial Statements
23 Financial Instruments
(a) Overview(1) Policy for financial instruments
The Yamaha Group, in principle, limits its cash management to deposits for which principals are guaranteed and interest rates are fixed. In addition, the Yamaha Group raises funds mainly through bank borrowings. Further, Yamaha and its owned domestic subsid-iaries practice group finance. The Yamaha Group uses derivatives for the purpose of reducing risk, and limits derivative transactions to actual exposure. The Yamaha Group does not enter into deriva-tive transactions for speculative purposes.
(2) Types of financial instruments and related risk
Trade notes and accounts receivable are exposed to the credit risk of its customers. In addition, the Yamaha Group is exposed to foreign currency exchange risk arising from receivables denomi-nated in foreign currencies.
Short-term investment securities and investment securities are exposed to market risk. Those securities are composed of mainly the stock of Yamaha Motor Co., Ltd., a former affiliated company which shares the Yamaha brand in common, and shares of common stock of other companies with which it has business relationships. Trade notes and accounts payable, other accounts payable, and accrued expenses have payment due dates within one year. In addition, trade accounts payable that are denomi-nated in foreign currencies are exposed to foreign currency exchange risk. Short-term loans payable are raised mainly in con-nection with business activities, and long-term loans payable are taken out principally for the purpose of making capital invest-ments. The repayment dates of long-term loans payable extend up to two years and four months from March 31, 2017, and up to three years and four months from March 31, 2016, respectively. Long-term deposits received are membership deposits received from customers in the Yamaha Group’s resort business. The Yamaha Group is exposed to liquidity risk from its trade notes and accounts payable, other accounts payable, accrued expenses, short-term loans payable, long-term loans payable, and long-term deposits received.
Regarding derivatives, the Yamaha Group enters into foreign exchange forward contracts with netting arrangements and currency options (foreign currency put options) to reduce foreign currency exchange risk arising from the receivables and payables denominated in foreign currencies in normal export and import transactions.
Foreign exchange forward contracts are exposed to foreign currency exchange risk. For currency options, since the Yamaha Group only uses purchased foreign currency put options, the risk of loss is limited to the option premium.
Derivative transactions are accounted for by hedge account-ing. The method of hedge accounting, hedging instruments and hedged items, hedging policy, and the assessment of the effective-ness of hedging activities are described in Note 1(l) Derivative financial instruments (Hedge accounting).
(b) Risk management for financial instrumentsThe Yamaha Group has established a Group financial risk manage-ment policy, and the Company and its consolidated subsidiaries have prepared rules based on this policy for the following risk:
(1) Credit risk (the risk that customers may default)
The Yamaha Group has prepared policy for managing its credit exposure and trade receivables. In accordance with the rules, the Yamaha Group monitors the credit exposure limits of each customer and organizes all trade receivables by customer, and confirms the outstanding balances by customers regularly. For receivables that become past due, rules require taking steps to understand the causes and preparing a schedule for the recovery of this exposure.
To minimize the credit risk of the counterparty in derivative transactions, the Yamaha Group enters into transactions only with financial institutions that have a sound credit profile.
(2) Market risk (the risks arising from fluctuations in exchange rates,
interest rates, and other indicators)
For trade receivables denominated in foreign currencies, the Yamaha Group minimizes the foreign exchange risk arising from the receivable by entering into forward foreign exchange contracts and arranging for currency options, after netting by the payables denominated in foreign currencies, within the limits of actual transactions. Also, the trade accounts payable denominated in foreign currencies are maintained within the amount of accounts receivable denominated in foreign currencies at all times.
For short-term investment securities and investment securities, the Yamaha Group periodically reviews the market value and the financial position of the issuer with which the Yamaha Group has a business relationship.
In conducting derivative transactions, based on the policy stated in (1) above, the Company and its consolidated subsidiaries hold discussions, establish internal rules for the management of derivatives, and then conduct and manage such transactions in accordance with the rules.
Derivative transactions of the Company and its subsidiaries are concentrated in each accounting and finance department of these companies. Internal rules set forth the roles of each accounting and finance department, reports to be submitted to top management, communications to be sent to related departments, and maximum upper limit on position.
Monthly reports including the outstanding balance of deriva-tive transactions and quantitative information such as market trends of foreign exchange rate are submitted to top management.
Financial SectionGrowth FoundationManagement Strategy About Yamaha
Yamaha Corporation Annual Report 2017 87

(3) Liquidity risk (the risk that the Group may not be able to meet its
obligations on the scheduled dates)
The Yamaha Group manages liquidity risk based on the cash flow plans of the Company and its consolidated subsidiaries and through the practice of group finance at the Company and its wholly owned subsidiaries in Japan.
(4) Supplementary explanation of the estimated fair value of financial
instruments
The estimated fair value of financial instruments is their quoted market price if available. When there is no quoted market price available, fair value is reasonably estimated. Since various assump-tions and factors are reflected in estimating the fair value, different assumptions and factors could result in different fair value.
In addition, the notional amounts of derivatives in Note 25 are not indicative of the actual market risk involved in derivative transactions.
(c) Estimated fair value of financial instrumentsCarrying value on the consolidated balance sheet as of March 31, 2017 and 2016, and difference between carrying value and estimated fair value, are shown in the following table. The following table does not include financial instruments for which it is extremely difficult to determine the fair value. See Note (ii) below:
Millions of yen Thousands of U.S. dollars (Note 5)As of March 31, 2017 Carrying value*1 Estimated fair value*1 Difference Carrying value*1 Estimated fair value*1 Difference
Cash and deposits ¥105,859 ¥105,859 ¥ — $ 943,569 $ 943,569 $ —Notes and accounts receivable—trade 50,995 50,995 — 454,541 454,541 —Investment securities
Subsidiaries and affiliates securities 723 414 (308) 6,444 3,690 (2,745)Available-for-sale securities 129,536 129,536 — 1,154,613 1,154,613 —
Notes and accounts payable—trade (17,828) (17,828) — (158,909) (158,909) —Accounts payable— other and accrued expenses (43,961) (43,961) — (391,844) (391,844) —Derivatives*2 148 148 — 1,319 1,319 —
Millions of yenAs of March 31, 2016 Carrying value*1 Estimated fair value*1 Difference
Cash and deposits ¥ 88,166 ¥ 88,166 ¥ —Notes and accounts receivable—trade 49,026 49,026 —Investment securities
Subsidiaries and affiliates securities 714 340 (373)Available-for-sale securities 93,690 93,690 —
Notes and accounts payable—trade (19,353) (19,353) —Accounts payable— other and accrued expenses (37,222) (37,222) —Derivatives*2 (139) (139) —
*1 Figures in parentheses are liability items.*2 The value of assets and liabilities arising from derivatives is shown at net value, with net liability position shown in parentheses.
Notes:(i) Methods for computing the estimated fair value of financial instruments, securities and derivative transactions
Cash and deposits and notes and accounts receivable—tradeSince these items are settled in a short period of time, the carrying value approximates fair value.
Investment securitiesThe fair value of stocks is based on quoted market prices. The fair value of debt securities is based on either the quoted market price
or prices provided by the financial institutions making markets in these securities.Information on securities classified by holding purpose is contained in Note 24.
Notes and accounts payable—trade and accounts payable—other and accrued expensesSince these items are settled in a short period of time, the carrying value approximates fair value.
Derivative TransactionsSee Note 25.
88
Notes to Consolidated Financial Statements
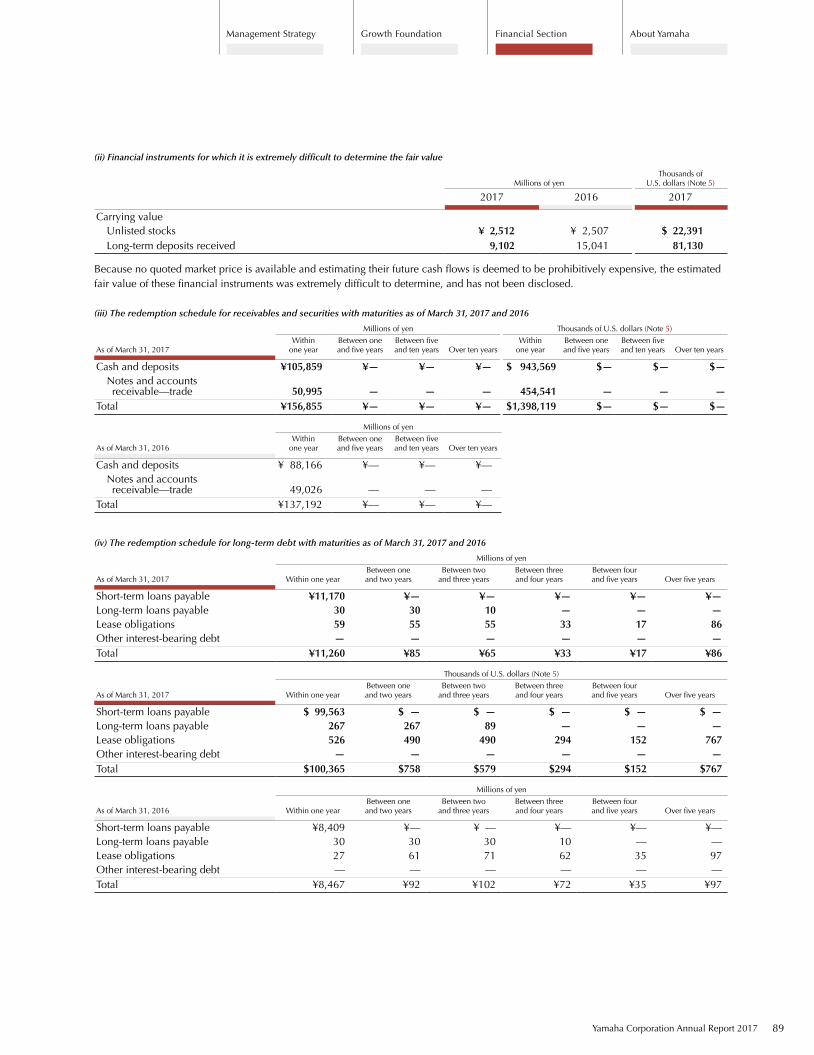
(ii) Financial instruments for which it is extremely difficult to determine the fair value
Millions of yenThousands of
U.S. dollars (Note 5)
2017 2016 2017
Carrying valueUnlisted stocks ¥ 2,512 ¥ 2,507 $ 22,391Long-term deposits received 9,102 15,041 81,130
Because no quoted market price is available and estimating their future cash flows is deemed to be prohibitively expensive, the estimated fair value of these financial instruments was extremely difficult to determine, and has not been disclosed.
(iii) The redemption schedule for receivables and securities with maturities as of March 31, 2017 and 2016
Millions of yen Thousands of U.S. dollars (Note 5)
As of March 31, 2017Within
one yearBetween one and five years
Between five and ten years Over ten years
Within one year
Between one and five years
Between five and ten years Over ten years
Cash and deposits ¥105,859 ¥— ¥— ¥— $ 943,569 $— $— $—Notes and accounts receivable—trade 50,995 — — — 454,541 — — —
Total ¥156,855 ¥— ¥— ¥— $1,398,119 $— $— $—
Millions of yen
As of March 31, 2016Within
one yearBetween one and five years
Between five and ten years Over ten years
Cash and deposits ¥ 88,166 ¥— ¥— ¥—Notes and accounts receivable—trade 49,026 — — —
Total ¥137,192 ¥— ¥— ¥—
(iv) The redemption schedule for long-term debt with maturities as of March 31, 2017 and 2016
Millions of yen
As of March 31, 2017 Within one yearBetween one and two years
Between two and three years
Between three and four years
Between four and five years Over five years
Short-term loans payable ¥11,170 ¥— ¥— ¥— ¥— ¥—Long-term loans payable 30 30 10 — — —Lease obligations 59 55 55 33 17 86Other interest-bearing debt — — — — — —Total ¥11,260 ¥85 ¥65 ¥33 ¥17 ¥86
Thousands of U.S. dollars (Note 5)
As of March 31, 2017 Within one yearBetween one and two years
Between two and three years
Between three and four years
Between four and five years Over five years
Short-term loans payable $ 99,563 $ — $ — $ — $ — $ —Long-term loans payable 267 267 89 — — —Lease obligations 526 490 490 294 152 767Other interest-bearing debt — — — — — —Total $100,365 $758 $579 $294 $152 $767
Millions of yen
As of March 31, 2016 Within one yearBetween one and two years
Between two and three years
Between three and four years
Between four and five years Over five years
Short-term loans payable ¥8,409 ¥ — ¥ — ¥ — ¥ — ¥ —Long-term loans payable 30 30 30 10 — —Lease obligations 27 61 71 62 35 97Other interest-bearing debt — — — — — —Total ¥8,467 ¥92 ¥102 ¥72 ¥35 ¥97
Yamaha Corporation Annual Report 2017 89
Financial SectionGrowth FoundationManagement Strategy About Yamaha

24 Securities
(a) Available-for-sale securities with fair market valueMillions of yen Thousands of U.S. dollars (Note 5)
As of March 31, 2017 Carrying value Acquisition costsUnrealized gain (loss) Carrying value Acquisition costs
Unrealized gain (loss)
Securities whose carrying value exceeds their acquisition costs:
Stock ¥129,536 ¥15,892 ¥113,644 $1,154,613 $141,653 $1,012,960Other — — — — — —
Subtotal 129,536 15,892 113,644 1,154,613 141,653 1,012,960Securities whose carrying value does not exceed their acquisition costs:
Stock ¥ — ¥ — ¥ — $ — $ — $ —Other — — — — — —
Subtotal — — — — — —Total ¥129,536 ¥15,892 ¥113,644 $1,154,613 $141,653 $1,012,960
Millions of yen
As of March 31, 2016 Carrying value Acquisition costsUnrealized gain
(loss)
Securities whose carrying value exceeds their acquisition costs:
Stock ¥90,859 ¥12,873 ¥77,985Other — — —
Subtotal 90,859 12,873 77,985Securities whose carrying value does not exceed their acquisition costs:
Stock 2,831 3,036 (205)Other — — —
Subtotal 2,831 3,036 (205)Total ¥93,690 ¥15,910 ¥77,780
(b) Available-for-sale securities sold during the years ended March 31, 2017 and 2016
Millions of yenThousands of
U.S. dollars (Note 5)
2017 2016 2017
Sales of available-for-sale securities ¥291 ¥3 $2,594Gain on sales 259 3 2,309Loss on sales — — —
90
Notes to Consolidated Financial Statements

25 Derivatives and Hedging Activities
As of March 31, 2017 and 2016, there were no derivative transactions outstanding for which hedge accounting has not been applied. The notional amounts, the estimated fair value of notional amount, and the estimated fair value of derivative instruments outstanding as of March 31, 2017 and 2016, for which hedge accounting has been applied are summarized as follows:
Millions of yenNotional amount
Estimated fair value of notional amount
Estimated fair value of derivative instruments As of March 31, 2017 Hedged items Total Over one year Calculation of fair value
Foreign exchange forward contracts accounted for by benchmark method:
Prices provided by financial institution
Sell: Accounts receivableAustralian dollars ¥ — ¥— ¥ — ¥ —Canadian dollars — — — —Euros 13,473 — 13,324 148
Foreign exchange forward contracts accounted for by allocation method: Market prices
Sell: Accounts receivableAustralian dollars — — —Canadian dollars — — —Euros 815 — —
Total ¥14,288 ¥— ¥ —* ¥ —*
* The estimated fair value is included in the fair value of accounts receivable, since the foreign exchange forward contracts are accounted for as part of accounts receivable under the allocation method in hedge accounting.
Thousands of U.S. dollars (Note 5)Notional amount
Estimated fair value of notional amount
Estimated fair value of derivative instruments As of March 31, 2017 Hedged items Total Over one year Calculation of fair value
Foreign exchange forward contracts accounted for by benchmark method:
Prices provided by financial institution
Sell: Accounts receivableAustralian dollars $ — $— $ — $ —Canadian dollars — — — —Euros 120,091 — 118,763 1,319
Foreign exchange forward contracts accounted for by allocation method: Market prices
Sell: Accounts receivableAustralian dollars — — —Canadian dollars — — —Euros 7,264 — —
Total $127,355 $— $ —* $ —*
* The estimated fair value is included in the fair value of accounts receivable, since the foreign exchange forward contracts are accounted for as part of accounts receivable under the allocation method in hedge accounting.
Millions of yenNotional amount
Estimated fair valueAs of March 31, 2016 Hedged items Total Over one year Calculation of fair value
Foreign exchange forward contracts accounted for by benchmark method:
Prices provided by financial institution*2
Sell: Accounts receivableAustralian dollars ¥ 541 ¥— ¥ 563Canadian dollars 691 — 716Euros 12,495 — 12,588
Foreign exchange forward contracts accounted for by allocation method: Market prices
Sell: Accounts receivableAustralian dollars 217 — —Canadian dollars 257 — —Euros 2,362 — —
Total ¥16,566 ¥— ¥ —*1
*1 The estimated fair value is included in the fair value of accounts receivable, since the foreign exchange forward contracts are accounted for as part of accounts receivable under the allocation method in hedge accounting.
*2 The estimated fair value is the fair value of the notional amount, and the net value in payable of assets and liabilities arising from derivatives was ¥139 million.
Financial SectionGrowth FoundationManagement Strategy About Yamaha
Yamaha Corporation Annual Report 2017 91

26 Retirement Benefits
(a) Outline of the Company’s retirement benefit systemTo provide employee retirement benefits, the Company and its consolidated subsidiaries have funded and unfunded defined benefit pension plans and defined contribution pension plans. The defined benefit pension plan (funded and unfunded plans) pays a lump-sum or an annual pension based on the employee compensation point system.
In certain cases, the Company pays employees who are retiring, etc., additional retirement benefits that are not considered to be retirement benefit obligations as calculated under actuarial methods based on retirement benefit accounting principles.
Certain consolidated subsidiaries that have defined benefit pension plans calculate net defined benefit liabilities and retirement benefit expenses using the simplified method.
Revisions in the pension plans Yamaha Corporation and certain of its subsidiaries revised their pension plans as of April 1, 2017, and made the transition of a portion of such plans from defined benefit to defined contribution plans.
Accompanying this, Yamaha has applied “Accounting Treatment of Pension Plan Transitions” (Corporate Accounting Application Guidelines No.1). As a consequence, the Company recognized an extraordinary loss due to transition to a defined contribution pension plan amounting to ¥892 million ($7,951 thousand).
Please note that, as a result of this transition, the amount transferred to defined contribution plans was ¥7,241 million ($64,542 thou-sand), and this amount was included in accounts payable—other and accrued expenses, and in long-term accounts payable.
(b) Defined benefit pension plans(1) Changes in the retirement benefit obligations for the years ended March 31, 2017 and 2016 (excluding plans that apply the simplified method)
Millions of yenThousands of
U.S. dollars (Note 5)
2017 2016 2017
Retirement benefit obligations at the beginning of year ¥120,551 ¥116,528 $1,074,525Service cost 4,665 4,446 41,581 Interest cost 544 1,188 4,849 Actuarial gain or loss (1,123) 7,656 (10,010)Retirement benefits paid (8,571) (8,969) (76,397)Prior service cost (2,343) — (20,884)Decrease due to transition to a defined contribution pension plan (6,869) — (61,226)Other 66 (299) 588 Retirement benefit obligations at end of year ¥106,920 ¥120,551 $953,026
(2) Changes in the plan assets for the years ended March 31, 2017 and 2016 (excluding plans that apply the simplified method)
Millions of yenThousands of
U.S. dollars (Note 5)
2017 2016 2017
Plan assets at the beginning of year ¥83,994 ¥86,450 $748,676Expected return on plan assets 1,659 1,712 14,787 Actuarial gain or loss 837 (2,825) 7,461 Contribution by the Yamaha Group 5,579 5,660 49,728 Retirement benefits paid (6,550) (6,910) (58,383)Other 42 (93) 374 Plan assets at end of year ¥85,563 ¥83,994 $762,662
92
Notes to Consolidated Financial Statements

(3) Changes in net defined benefit liabilities for plans that apply the simplified method for the years ended March 31, 2017 and 2016
Millions of yenThousands of
U.S. dollars (Note 5)
2017 2016 2017
Net defined benefit liabilities at the beginning of year ¥1,461 ¥1,560 $13,023Retirement benefit expenses 237 219 2,112 Retirement benefits paid (213) (233) (1,899)Contribution to plan (29) (28) (258)Other (27) (56) (241)Net defined benefit liabilities at end of year ¥1,428 ¥1,461 $12,728
(4) Reconciliation between the funded status of the plans (retirement benefit obligations and plan assets) and the amounts recognized in the
consolidated balance sheet (net defined benefit liabilities and net defined benefit assets) as of March 31, 2017 and 2016
Millions of yenThousands of
U.S. dollars (Note 5)
2017 2016 2017
Retirement benefit obligations of funded plans ¥ 89,328 ¥102,797 $ 796,221Plan assets (86,235) (84,657) (768,651)
3,092 18,139 27,560Retirement benefit obligations of unfunded plans 19,692 19,878 175,524Net assets and liabilities recorded in the consolidated balance sheet 22,784 38,017 203,084 Net defined benefit liabilities 23,039 38,024 205,357 Net defined benefit assets (254) (6) (2,264)Net assets and liabilities recorded in the consolidated balance sheet ¥ 22,784 ¥ 38,017 $ 203,084
Note: Including plans that apply the simplified method
(5) Components of retirement benefit expenses
Millions of yenThousands of
U.S. dollars (Note 5)
2017 2016 2017
Service cost ¥ 4,665 ¥ 4,446 $ 41,581Interest cost 544 1,188 4,849 Expected return on plan assets (1,659) (1,712) (14,787)Amortization of actuarial gain or loss 3,385 1,154 30,172 Amortization of prior service cost (475) (414) (4,234)Retirement benefit expenses calculated by simplified method 237 219 2,112 Other 82 2 731 Retirement benefit expenses for defined benefit pension plans 6,781 4,884 60,442Loss due to transition to a defined contribution pension plan ¥ 892 ¥ — $ 7,951
Note: In the year ended March 31, 2017, other than the amount described above, the Company posted an extraordinary loss (business structural reform expenses) of ¥260 million ($2,317 thousand) on premium severance pay and other contribution items in connection with the realignment of resort business.
(6) Remeasurements of defined benefit plans
Components of remeasurements of defined benefit plans (before taxes)
Millions of yenThousands of
U.S. dollars (Note 5)
2017 2016 2017
Prior service cost ¥1,844 ¥ (412) $16,436Actuarial gain or loss 5,980 (9,274) 53,302Total ¥7,824 ¥(9,686) $69,739
Financial SectionGrowth FoundationManagement Strategy About Yamaha
Yamaha Corporation Annual Report 2017 93

(7) Accumulated adjustments of defined benefit plans
Components of remeasurements of accumulated defined benefit plans (before taxes)
Millions of yenThousands of
U.S. dollars (Note 5)
2017 2016 2017
Unrecognized prior service cost ¥(2,284) ¥ (439) $(20,358)Unrecognized actuarial gain or loss 5,960 11,940 53,124Total ¥ 3,676 ¥11,500 $ 32,766
(8) Items for plan assets
(i) Components of plan assets
Ratio of primary components of total plan assets
2017 2016
Life insurance company general accounts 58% 58%Stocks 20% 19%Bonds 19% 19%Cash and deposits 1% 2%Other 2% 2%Total 100% 100%
(ii) Determining expected long-term rate of return
In determining the long-term rate of return of plan assets, the Company considers the current and projected asset allocations, as well as the current and expected long-term investment returns from the various assets that constitute the plan assets.
(9) Items related to the basis of actuarial calculation
Items that form the primary basis for actuarial calculations as of March 31, 2017 and 2016
2017 2016
Discount rate 0.5% 0.3%Expected long-term rate of return 2.0% 2.0%
(c) Defined contribution pension plansRequired contributions to defined contribution pension plans of consolidated subsidiaries totaled ¥664 million ($5,919 thousand) and ¥723 million in the years ended March 31, 2017 and 2016, respectively.
In addition, aside from the above required contributions, the Company also posted ¥134 million ($1,194 thousand) and ¥58 million of additional retirement benefit expenses in the years ended March 31, 2017 and 2016, respectively.
94
Notes to Consolidated Financial Statements

27 Income Taxes
Income taxes in Japan applicable to the Company and its domestic consolidated subsidiaries comprised corporation tax, inhabitants’ taxes, and enterprise tax which, in the aggregate, resulted in effective statutory tax rates of approximately 30.2% and 32.1% for the years ended March 31, 2017 and 2016, respectively. Income taxes of the overseas consolidated subsidiaries are, in general, based on the tax rates applicable in their respective countries of incorporation.
The major components of deferred tax assets and liabilities as of March 31, 2017 and 2016 are summarized as follows:
Millions of yenThousands of
U.S. dollars (Note 5)
2017 2016 2017
Deferred tax assets:Write-downs of inventories ¥ 1,769 ¥ 1,727 $ 15,768 Unrealized gain on inventories and property, plant and equipment 1,847 2,041 16,463 Allowance for doubtful accounts 319 306 2,843 Depreciation 7,214 7,372 64,302 Loss on impairment of fixed assets 3,616 6,780 32,231 Loss on valuation of investment securities 2,011 2,006 17,925 Accrued employees’ bonuses 2,362 2,383 21,054 Provision for product warranties 310 546 2,763 Long-term accounts payable 2,186 — 19,485 Net defined benefit liabilities 6,568 11,178 58,544 Tax loss carryforwards 5,835 7,232 52,010 Other 5,275 5,067 47,018
Gross deferred tax assets 39,320 46,642 350,477 Valuation allowance (13,282) (33,976) (118,388)Total deferred tax assets ¥ 26,037 ¥ 12,666 $ 232,080
Deferred tax liabilities:Reserve for deferred gain on property, plant and equipment ¥ (820) ¥ (750) $ (7,309)Reserve for special account for acquisition of replacement property (2,204) (2,204) (19,645)Reserve for special depreciation (4) (5) (36)Unrealized holding gain on securities (33,485) (22,855) (298,467)Other (853) (676) (7,603)
Total deferred tax liabilities (37,369) (26,493) (333,087)Net deferred tax liabilities ¥(11,331) ¥(13,827) $(100,998)
A reconciliation between the effective statutory tax rate and the effective tax rate for the years ended March 31, 2017 and 2016 is as follows:
2017 2016
Effective statutory tax rate 30.2% 32.1%Adjustments:
Differences in tax rates of overseas consolidated subsidiaries (1.7) (2.7)Non-temporary differences not deductible for tax purposes (0.7) (0.5)Per capita inhabitants’ taxes 0.4 0.5Allowances for changes in valuation (39.2) (15.9)Amortization of goodwill 1.6 7.4Other 0.1 0.5
Effective tax rate after adjustments for tax-effect accounting (9.3)% 21.4%
Financial SectionGrowth FoundationManagement Strategy About Yamaha
Yamaha Corporation Annual Report 2017 95
28 Segment Information
For the years ended March 31, 2017 and 2016
(a) Summary of reporting segmentsBusiness segments are composed of business units that provide separate financial information, and are regularly reviewed by the Board of Directors of the Company for the purpose of business performance evaluation and management resource allocation decisions.
The Company’s business segments, based on its economic features and similarity of products and services, comprise its two principal reporting segments, which are musical instruments and audio equipment. Other businesses have been grouped together in the “Others” segment.
The musical instruments business segment includes the manu-facture and sales of pianos; digital musical instruments; wind, string, and percussion instruments; and other music-related activities. The audio equipment business segment includes the manufacture and sales of audio products, professional audio equipment, infor-mation and telecommunications equipment and certain other products. The “Others” segment includes electronic devices busi-ness, automobile interior wood components, factory automation (FA) equipment, golf products, recreation, and certain other lines of business.
Change in business segments From the beginning of this fiscal year, the reporting segment classi-fication and presentation have been changed.
Accompanying the decrease in size of the electronic devices business, it has been excluded from the reporting segment and included in the others segment. Sales of this business to external customers in the previous fiscal year amounted to ¥13,068 million and segment income was ¥107 million.
Also, as a result of the review of the classification of busi-nesses, the soundproof product business has been moved from the musical instruments segment to the audio equipment segment from the beginning of this fiscal year. The impact of this change was not material.
Please note that segment information of the previous fiscal year has been prepared and presented after the change in business segments.
(b) Method for calculating the sales, income (loss), assets, liabilities, and other items for reporting segments
The accounting treatment for reporting segments is carried out through principles and procedures that are the same as those used for preparing the consolidated financial statements.
Figures for income in reporting segments are on an operating income basis.
Intersegment sales and transfers are based on prevailing market prices.
Changes in the depreciation method for calculation of property, plant and equipment Regarding the methods for calculation of depreciation of property, plant and equipment, previously, the Company and its consoli-dated subsidiaries in Japan adopted the declining balance method, and overseas consolidated subsidiaries mainly applied the straight-line method for calculating depreciation. However, from the beginning of this fiscal year, the method for depreciation in the Company and its subsidiaries has been changed to the straight-line method.
As a result of this change, segment income of musical instru-ments, audio equipment, and others was ¥532 million ($4,742 thousand), ¥164 million ($1,462 thousand), and ¥49 million ($437 thousand) higher than they would have been in the absence of this change, respectively.
96
Notes to Consolidated Financial Statements
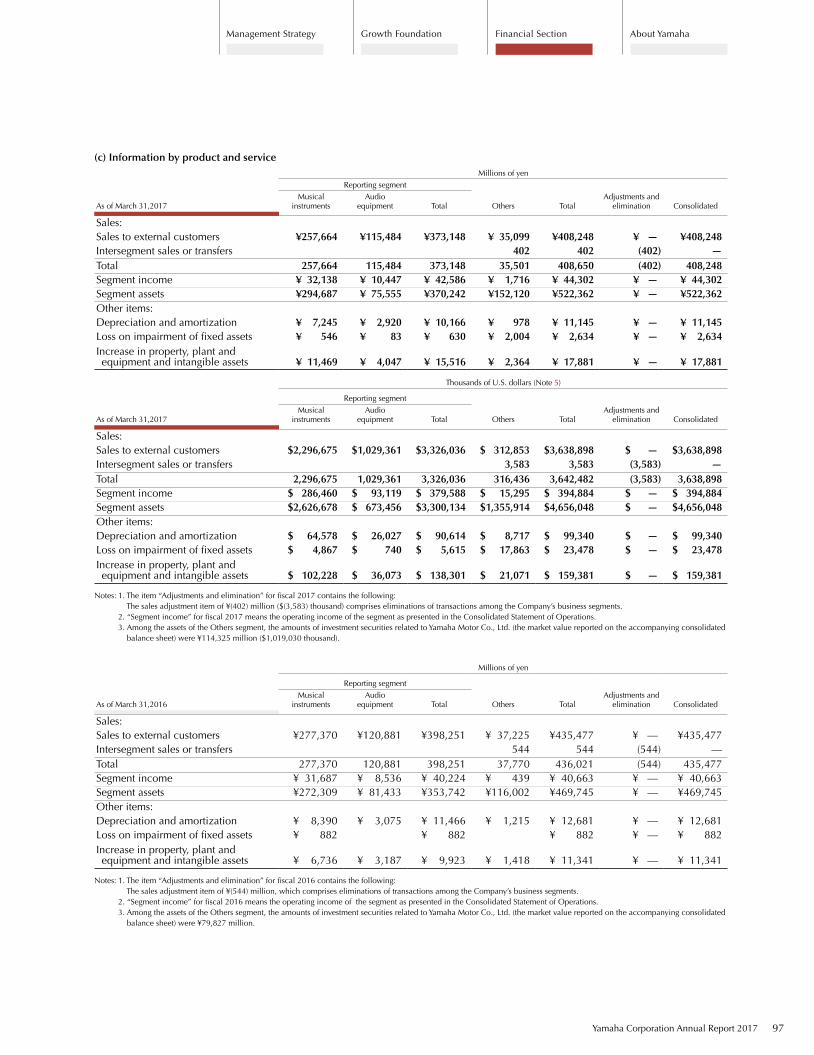
(c) Information by product and serviceMillions of yen
Reporting segment
As of March 31,2017Musical
instrumentsAudio
equipment Total Others TotalAdjustments and
elimination Consolidated
Sales:Sales to external customers ¥257,664 ¥115,484 ¥373,148 ¥ 35,099 ¥408,248 ¥ — ¥408,248 Intersegment sales or transfers 402 402 (402) —Total 257,664 115,484 373,148 35,501 408,650 (402) 408,248Segment income ¥ 32,138 ¥ 10,447 ¥ 42,586 ¥ 1,716 ¥ 44,302 ¥ — ¥ 44,302 Segment assets ¥294,687 ¥ 75,555 ¥370,242 ¥152,120 ¥522,362 ¥ — ¥522,362 Other items:Depreciation and amortization ¥ 7,245 ¥ 2,920 ¥ 10,166 ¥ 978 ¥ 11,145 ¥ — ¥ 11,145 Loss on impairment of fixed assets ¥ 546 ¥ 83 ¥ 630 ¥ 2,004 ¥ 2,634 ¥ — ¥ 2,634 Increase in property, plant and equipment and intangible assets ¥ 11,469 ¥ 4,047 ¥ 15,516 ¥ 2,364 ¥ 17,881 ¥ — ¥ 17,881
Thousands of U.S. dollars (Note 5)
Reporting segment
As of March 31,2017Musical
instrumentsAudio
equipment Total Others TotalAdjustments and
elimination Consolidated
Sales:Sales to external customers $2,296,675 $1,029,361 $3,326,036 $ 312,853 $3,638,898 $ — $3,638,898 Intersegment sales or transfers 3,583 3,583 (3,583) —Total 2,296,675 1,029,361 3,326,036 316,436 3,642,482 (3,583) 3,638,898Segment income $ 286,460 $ 93,119 $ 379,588 $ 15,295 $ 394,884 $ — $ 394,884 Segment assets $2,626,678 $ 673,456 $3,300,134 $1,355,914 $4,656,048 $ — $4,656,048 Other items:Depreciation and amortization $ 64,578 $ 26,027 $ 90,614 $ 8,717 $ 99,340 $ — $ 99,340 Loss on impairment of fixed assets $ 4,867 $ 740 $ 5,615 $ 17,863 $ 23,478 $ — $ 23,478 Increase in property, plant and equipment and intangible assets $ 102,228 $ 36,073 $ 138,301 $ 21,071 $ 159,381 $ — $ 159,381
Notes: 1. The item “Adjustments and elimination” for fiscal 2017 contains the following: The sales adjustment item of ¥(402) million ($(3,583) thousand) comprises eliminations of transactions among the Company’s business segments.
2. “Segment income” for fiscal 2017 means the operating income of the segment as presented in the Consolidated Statement of Operations. 3. Among the assets of the Others segment, the amounts of investment securities related to Yamaha Motor Co., Ltd. (the market value reported on the accompanying consolidated
balance sheet) were ¥114,325 million ($1,019,030 thousand).
Millions of yen
Reporting segment
As of March 31,2016Musical
instrumentsAudio
equipment Total Others TotalAdjustments and
elimination Consolidated
Sales:Sales to external customers ¥277,370 ¥120,881 ¥398,251 ¥ 37,225 ¥435,477 ¥ — ¥435,477 Intersegment sales or transfers 544 544 (544) —Total 277,370 120,881 398,251 37,770 436,021 (544) 435,477Segment income ¥ 31,687 ¥ 8,536 ¥ 40,224 ¥ 439 ¥ 40,663 ¥ — ¥ 40,663 Segment assets ¥272,309 ¥ 81,433 ¥353,742 ¥116,002 ¥469,745 ¥ — ¥469,745 Other items:Depreciation and amortization ¥ 8,390 ¥ 3,075 ¥ 11,466 ¥ 1,215 ¥ 12,681 ¥ — ¥ 12,681 Loss on impairment of fixed assets ¥ 882 ¥ 882 ¥ 882 ¥ — ¥ 882 Increase in property, plant and equipment and intangible assets ¥ 6,736 ¥ 3,187 ¥ 9,923 ¥ 1,418 ¥ 11,341 ¥ — ¥ 11,341
Notes: 1. The item “Adjustments and elimination” for fiscal 2016 contains the following: The sales adjustment item of ¥(544) million, which comprises eliminations of transactions among the Company’s business segments.
2. “Segment income” for fiscal 2016 means the operating income of the segment as presented in the Consolidated Statement of Operations. 3. Among the assets of the Others segment, the amounts of investment securities related to Yamaha Motor Co., Ltd. (the market value reported on the accompanying consolidated
balance sheet) were ¥79,827 million.
Financial SectionGrowth FoundationManagement Strategy About Yamaha
Yamaha Corporation Annual Report 2017 97
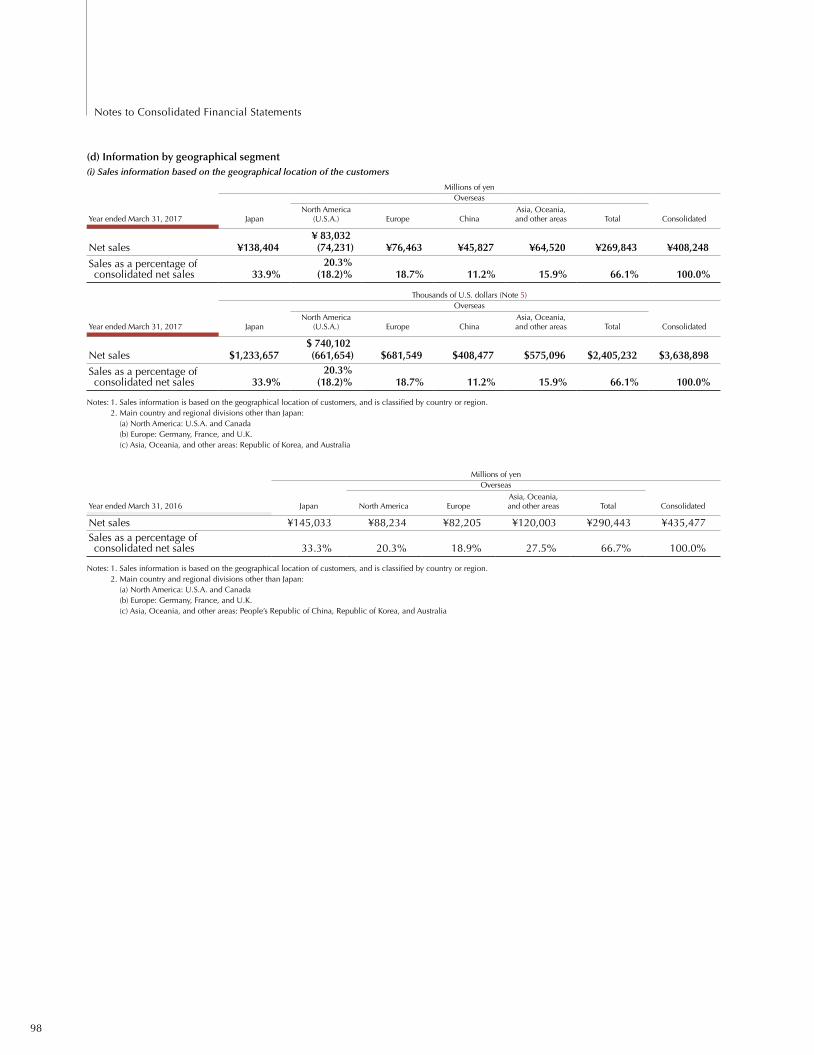
(d) Information by geographical segment(i) Sales information based on the geographical location of the customers
Millions of yenOverseas
Year ended March 31, 2017 JapanNorth America
(U.S.A.) Europe ChinaAsia, Oceania, and other areas Total Consolidated
Net sales ¥138,404¥ 83,032(74,231) ¥76,463 ¥45,827 ¥64,520 ¥269,843 ¥408,248
Sales as a percentage of consolidated net sales 33.9%
20.3%(18.2)% 18.7% 11.2% 15.9% 66.1% 100.0%
Thousands of U.S. dollars (Note 5)Overseas
Year ended March 31, 2017 JapanNorth America
(U.S.A.) Europe ChinaAsia, Oceania, and other areas Total Consolidated
Net sales $1,233,657 $ 740,102 (661,654) $681,549 $408,477 $575,096 $2,405,232 $3,638,898
Sales as a percentage of consolidated net sales 33.9%
20.3%(18.2)% 18.7% 11.2% 15.9% 66.1% 100.0%
Notes: 1. Sales information is based on the geographical location of customers, and is classified by country or region. 2. Main country and regional divisions other than Japan:
(a) North America: U.S.A. and Canada (b) Europe: Germany, France, and U.K. (c) Asia, Oceania, and other areas: Republic of Korea, and Australia
Millions of yenOverseas
Year ended March 31, 2016 Japan North America EuropeAsia, Oceania, and other areas Total Consolidated
Net sales ¥145,033 ¥88,234 ¥82,205 ¥120,003 ¥290,443 ¥435,477Sales as a percentage of consolidated net sales 33.3% 20.3% 18.9% 27.5% 66.7% 100.0%
Notes: 1. Sales information is based on the geographical location of customers, and is classified by country or region. 2. Main country and regional divisions other than Japan:
(a) North America: U.S.A. and Canada (b) Europe: Germany, France, and U.K. (c) Asia, Oceania, and other areas: People’s Republic of China, Republic of Korea, and Australia
98
Notes to Consolidated Financial Statements
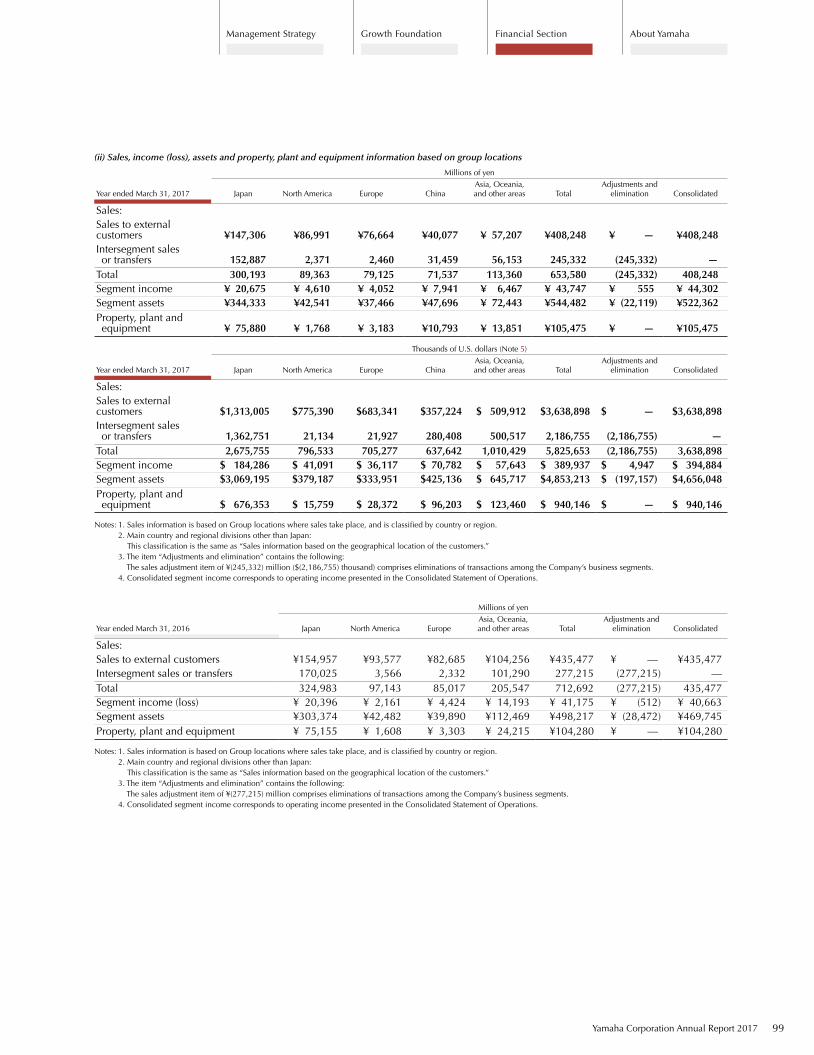
(ii) Sales, income (loss), assets and property, plant and equipment information based on group locations
Millions of yen
Year ended March 31, 2017 Japan North America Europe ChinaAsia, Oceania, and other areas Total
Adjustments and elimination Consolidated
Sales:Sales to external customers ¥147,306 ¥86,991 ¥76,664 ¥40,077 ¥ 57,207 ¥408,248 ¥ — ¥408,248 Intersegment sales or transfers 152,887 2,371 2,460 31,459 56,153 245,332 (245,332) —Total 300,193 89,363 79,125 71,537 113,360 653,580 (245,332) 408,248Segment income ¥ 20,675 ¥ 4,610 ¥ 4,052 ¥ 7,941 ¥ 6,467 ¥ 43,747 ¥ 555 ¥ 44,302 Segment assets ¥344,333 ¥42,541 ¥37,466 ¥47,696 ¥ 72,443 ¥544,482 ¥ (22,119) ¥522,362 Property, plant and equipment ¥ 75,880 ¥ 1,768 ¥ 3,183 ¥10,793 ¥ 13,851 ¥105,475 ¥ — ¥105,475
Thousands of U.S. dollars (Note 5)
Year ended March 31, 2017 Japan North America Europe ChinaAsia, Oceania, and other areas Total
Adjustments and elimination Consolidated
Sales:Sales to external customers $1,313,005 $775,390 $683,341 $357,224 $ 509,912 $3,638,898 $ — $3,638,898 Intersegment sales or transfers 1,362,751 21,134 21,927 280,408 500,517 2,186,755 (2,186,755) —Total 2,675,755 796,533 705,277 637,642 1,010,429 5,825,653 (2,186,755) 3,638,898Segment income $ 184,286 $ 41,091 $ 36,117 $ 70,782 $ 57,643 $ 389,937 $ 4,947 $ 394,884 Segment assets $3,069,195 $379,187 $333,951 $425,136 $ 645,717 $4,853,213 $ (197,157) $4,656,048 Property, plant and equipment $ 676,353 $ 15,759 $ 28,372 $ 96,203 $ 123,460 $ 940,146 $ — $ 940,146
Notes: 1. Sales information is based on Group locations where sales take place, and is classified by country or region. 2. Main country and regional divisions other than Japan:
This classification is the same as “Sales information based on the geographical location of the customers.” 3. The item “Adjustments and elimination” contains the following:
The sales adjustment item of ¥(245,332) million ($(2,186,755) thousand) comprises eliminations of transactions among the Company’s business segments. 4. Consolidated segment income corresponds to operating income presented in the Consolidated Statement of Operations.
Millions of yen
Year ended March 31, 2016 Japan North America EuropeAsia, Oceania, and other areas Total
Adjustments and elimination Consolidated
Sales:Sales to external customers ¥154,957 ¥93,577 ¥82,685 ¥104,256 ¥435,477 ¥ — ¥435,477Intersegment sales or transfers 170,025 3,566 2,332 101,290 277,215 (277,215) —Total 324,983 97,143 85,017 205,547 712,692 (277,215) 435,477Segment income (loss) ¥ 20,396 ¥ 2,161 ¥ 4,424 ¥ 14,193 ¥ 41,175 ¥ (512) ¥ 40,663Segment assets ¥303,374 ¥42,482 ¥39,890 ¥112,469 ¥498,217 ¥ (28,472) ¥469,745Property, plant and equipment ¥ 75,155 ¥ 1,608 ¥ 3,303 ¥ 24,215 ¥104,280 ¥ — ¥104,280
Notes: 1. Sales information is based on Group locations where sales take place, and is classified by country or region. 2. Main country and regional divisions other than Japan:
This classification is the same as “Sales information based on the geographical location of the customers.” 3. The item “Adjustments and elimination” contains the following:
The sales adjustment item of ¥(277,215) million comprises eliminations of transactions among the Company’s business segments. 4. Consolidated segment income corresponds to operating income presented in the Consolidated Statement of Operations.
Financial SectionGrowth FoundationManagement Strategy About Yamaha
Yamaha Corporation Annual Report 2017 99

(e) Information related to the amount of amortization of goodwill and the unamortized amount of goodwill by reporting segmentFor the year ended March 31, 2017
Millions of yenMusical instruments Audio equipment Others Total
Amounts amortized in the year ended ¥57 ¥2,249 ¥— ¥2,307Balance as of March 31, 2017 ¥57 ¥ 3 ¥— ¥ 60
Thousands of U.S. dollars (Note 5)Musical instruments Audio equipment Others Total
Amounts amortized in the year ended $508 $20,046 $— $20,563Balance as of March 31, 2017 $508 $ 27 $— $ 535
For the year ended March 31, 2016
Millions of yenMusical instruments Audio equipment Others Total
Amounts amortized in the year ended ¥5,651 ¥3,901 ¥— ¥9,553Balance as of March 31, 2016 ¥ 113 ¥2,342 ¥— ¥2,456
(f) Information on gain on negative goodwill by reporting segmentNone
100
Notes to Consolidated Financial Statements

29 Amounts per Share
Millions of yenThousands of
U.S. dollars (Note 5)
Years ended March 31 2017 2016 2017
Net income per share:Basic ¥249.17 ¥168.90 $2.22
Millions of yenThousands of
U.S. dollars (Note 5)
As of March 31 2017 2016 2017
Net assets per share ¥1,948.01 ¥1,601.55 $17.36
Basic net income per share is computed based on the net income and the weighted-average number of shares of common stock outstanding during each year. Diluted net income per share for the years ended March 31, 2017 and 2016 has not been presented because there were no potentially dilutive securities at March 31, 2017 and 2016.
Net assets per share are based on the number of shares of common stock outstanding at each balance sheet date.
The basic net income per share is calculated as follows:
Millions of yenThousands of
U.S. dollars (Note 5)
Years ended March 31 2017 2016 2017
Basic net income per share:Net income attributable to owners of parent ¥46,719 ¥32,633 $416,427Amounts not attributable to shareholders of common stock — — —Net income attributable to shareholders of common stock 46,719 32,633 416,427Weighted-average number of shares outstanding (shares) 187,500,903 193,210,820 —
Financial SectionGrowth FoundationManagement Strategy About Yamaha
Yamaha Corporation Annual Report 2017 101

30 Short-Term Loans Payable and Long-Term Debt
Short-term and long-term loans payable, lease obligations, and guarantee deposits as of March 31, 2017 and 2016 were as follows:
Millions of yenThousands of
U.S. dollars (Note 5)
2017 2016 2017
Short-term loans payable ¥11,170 ¥8,409 $ 99,563Current portion of long-term loans payable 30 30 267Current portion of lease obligations 59 27 526Long-term loans payable 40 71 357Lease obligations 248 328 2,211Guarantee deposits 39 48 348Total ¥11,589 ¥8,915 $103,298
The annual weighted-average interest rates applicable to above short-term loans payable and long-term debt at March 31, 2017 were as follows:
2017
Short-term loans payable 1.5%Current portion of long-term loans payable 1.8%Long-term loans payable 1.8%Guarantee deposits 1.3%
Note: The average interest rate shown above is the weighted average of the interest rates on loans calculated by using the balance of such obligations outstanding at the end of the year. For lease obligations, no average interest rate is shown because the amounts in the consolidated balance sheet include the amounts corresponding to interest paid from total lease payments.
31 Related Party Transactions
None
32 Subsequent Events
None
102
Notes to Consolidated Financial Statements

Independent Auditor’s Report
Yamaha Corporation Annual Report 2017 103
Financial SectionGrowth FoundationManagement Strategy About Yamaha
page 105 Investor Information
page 106 Our History
page 108 Yamaha Product History
page 110 Our Business
page 114 Main Networks
page 116 Stock Information
page 117 Website Guide
About Yamaha
104

Head Office 10-1, Nakazawa-cho, Naka-ku, Hamamatsu, Shizuoka 430-8650, Japan
Date of Establishment October 12, 1897
Stated Capital ¥28,534 million
Number of Employees (Consolidated) 20,175 (Excludes average number of temporary employees: 7,938)
Number of Consolidated Subsidiaries 66
Account Settlement Date March 31
Dividends Year-end: To the shareholders of record on March 31 Interim: To the shareholders of record on September 30
Number of Shares of Common Stock Authorized: 700,000,000 Issued: 197,255,025 (includes treasury stock of 8,971,933)
Stock Exchange Listing Tokyo First Section, Code No. 7951
Administrator of Shareholders’ Registry The Sumitomo Mitsui Trust Bank, Limited Stock Transfer Agency Department 3-15-33, Sakae, Naka-ku, Nagoya, Aichi 460-8685, Japan
Depositary for American Depositary Receipt Deutsche Bank Trust Company Americas DR Exchange: OTC Ticker Symbol: YAMCY Ratio: 1 share of common stock = 1 ADR U.S. Securities Code: 9846271099 Type: Level 1 with sponsor bank
Public Notices Shall be issued electronically at http://jp.yamaha.com/ (only in Japanese), except when an accident or other unavoidable occurrence prevents this, in which case they shall be released in the Nihon Keizai Shimbun business daily released in Tokyo.
Ordinary General Shareholders’ Meeting June
Accounting Auditor Ernst & Young ShinNihon LLC
Number of Shareholders 23,118
Shareholding ratio (%)
The Master Trust Bank of Japan, Ltd. (trust a/c) 12.22
Japan Trustee Services Bank, Ltd. (trust a/c) 8.69
Yamaha Motor Co., Ltd. 5.51
Mitsui Sumitomo Insurance Co., Ltd. 4.27
The Shizuoka Bank, Ltd. 4.23
Sumitomo Life Insurance Company 3.89
Mizuho Bank, Ltd. 3.86
Nippon Life Insurance Company 2.67
Trust & Custody Services Bank, Ltd. (securities investment trust a/c) 1.87
State Street Bank and Trust Company 505223 1.46
Note: The shareholding ratio is calculated by excluding treasury stock amounting to 9,820,691 shares from total outstanding shares.
Number of shareholders
Number of shares (Thousands of shares)
Individuals 22,218 25,586
Financial institutions 70 104,693
Japanese corporations 231 12,386
Foreign investors 543 48,079
Securities companies 56 6,509
Note: The figure for individuals includes treasury stock.
IR Contact Corporate Planning Division TEL: +81 3 5488 6602 https://www.yamaha.com/en/
Shareholder Composition
Main Shareholders
Shareholder Composition (Number of shares)
Japanese corporations
6.3%
Individuals
13.0%
Foreign investors
24.4%
Securities companies
3.3%
Financial institutions
53.1%
Yamaha Corporation Annual Report 2017 105
Financial SectionGrowth FoundationManagement Strategy About Yamaha
Investor Information (As of March 31, 2017)

1 Inheriting the spirit of Yamaha
The Guiding Principles of Yamaha set out the Company’s expectations for how each employee should act. Today, the original spirit of Yamaha still remains, embodied in the values upheld by its employees, such as kindness and sincerity, perseverance, continuous improvement, and a commitment to contribute to society.
2 Working to expand the population of music players
Yamaha decided its mission was not only to sell musical instruments but also to bring the joy of playing music to as many people as possible. Accordingly, Yamaha took initiatives to expand the population of music players.
3 Developing businesses born from a passion for creating sound
By drawing on accumulated technologies and sensitivities associated with the playing of musical instruments, the Company developed the Yamaha HiFi player. Its manufacture led to the production of various other prod-ucts, including pre-main amplifiers and speakers.
1887 • Company founder Torakusu Yamaha repairs elementary school’s reed organ and successfully builds his first reed organ
1889 • Establishes Yamaha Fukin Seizoujo (currently Yamaha Corporation)
1890 • Establishes organ factory at its headquarters
1897 • Establishes Nippon Gakki Co., Ltd. (currently Yamaha Corporation)
1900 • Begins production of upright pianos
1939 • Creates Guiding Principles of Yamaha
1
1949 • Lists on Tokyo Stock Exchange
1954 • Establishes Yamaha Music School and holds pilot classes
2 • Produces its first audio product (HiFi player)
3 •Begins production of motorcycles
1955 • Establishes Yamaha Motor Co., Ltd. (splits off motorcycle division)
1958 • Begins production of sports equipment (fiber-reinforced plastics [FRP] archery products)
• Establishes first overseas subsidiary, Yamaha de México S.A. in Mexico
41959 • Begins production of electronic organs
(Electone™)
1960 • Establishes subsidiary in United States, Yamaha International Corporation (currently Yamaha Corporation of America)
1962 •Begins recreation business
1940 to 1980s
Our History
Before the 1930s
The Yamaha Group is steadily expanding its business operations guided by its corporate philosophy which continues to be upheld to this day. Drawing upon the accumulated unique Yamaha qualities that Yamaha has cultivated in its 130-year history, Yamaha will continue to create products and services that contribute to the development of musical culture and the enrichment of society. In this way, Yamaha will continue on its path for growth.
106
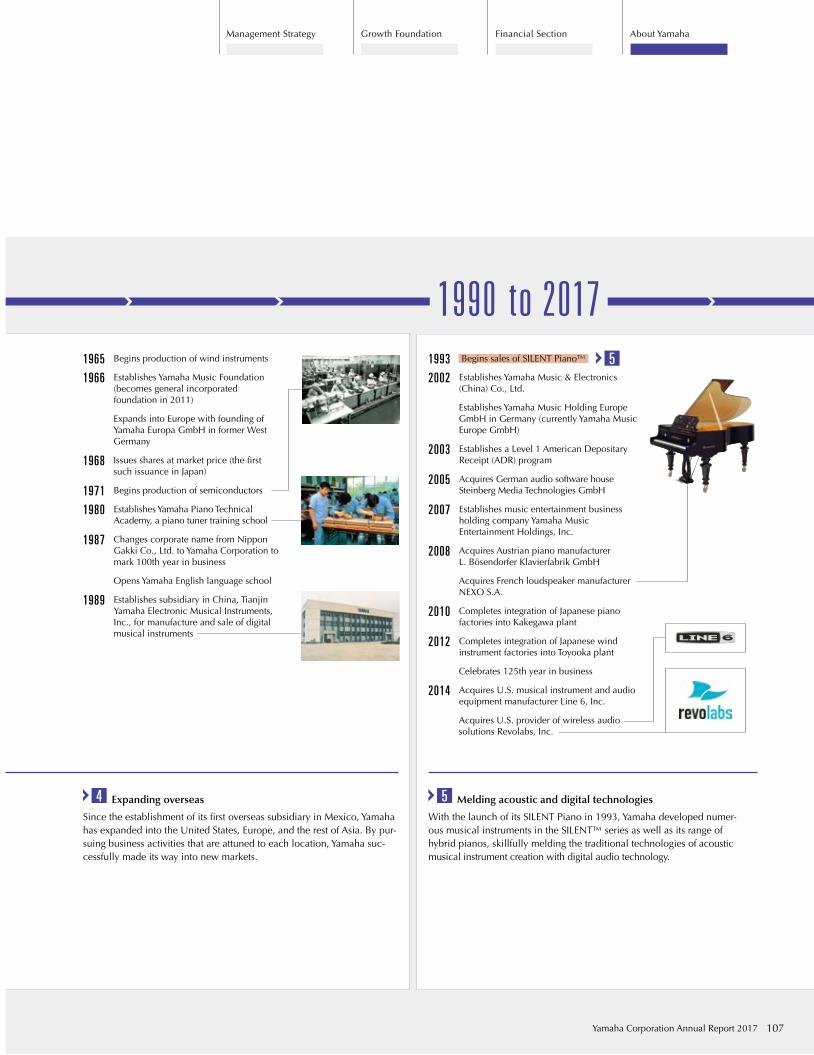
4 Expanding overseas
Since the establishment of its first overseas subsidiary in Mexico, Yamaha has expanded into the United States, Europe, and the rest of Asia. By pur-suing business activities that are attuned to each location, Yamaha suc-cessfully made its way into new markets.
5 Melding acoustic and digital technologies
With the launch of its SILENT Piano in 1993, Yamaha developed numer-ous musical instruments in the SILENT™ series as well as its range of hybrid pianos, skillfully melding the traditional technologies of acoustic musical instrument creation with digital audio technology.
1965 •Begins production of wind instruments
1966 • Establishes Yamaha Music Foundation (becomes general incorporated foundation in 2011)
• Expands into Europe with founding of Yamaha Europa GmbH in former West Germany
1968 • Issues shares at market price (the first such issuance in Japan)
1971 • Begins production of semiconductors
1980 • Establishes Yamaha Piano Technical Academy, a piano tuner training school
1987 • Changes corporate name from Nippon Gakki Co., Ltd. to Yamaha Corporation to mark 100th year in business
•Opens Yamaha English language school
1989 • Establishes subsidiary in China, Tianjin Yamaha Electronic Musical Instruments, Inc., for manufacture and sale of digital musical instruments
1993 • Begins sales of SILENT Piano™
2002 • Establishes Yamaha Music & Electronics (China) Co., Ltd.
• Establishes Yamaha Music Holding Europe GmbH in Germany (currently Yamaha Music Europe GmbH)
2003 • Establishes a Level 1 American Depositary Receipt (ADR) program
2005 • Acquires German audio software house Steinberg Media Technologies GmbH
2007 • Establishes music entertainment business holding company Yamaha Music Entertainment Holdings, Inc.
2008 • Acquires Austrian piano manufacturer L. Bösendorfer Klavierfabrik GmbH
• Acquires French loudspeaker manufacturer NEXO S.A.
2010 • Completes integration of Japanese piano factories into Kakegawa plant
2012 • Completes integration of Japanese wind instrument factories into Toyooka plant
• Celebrates 125th year in business
2014 • Acquires U.S. musical instrument and audio equipment manufacturer Line 6, Inc.
• Acquires U.S. provider of wireless audio solutions Revolabs, Inc.
1990 to 2017 5
Yamaha Corporation Annual Report 2017 107
Financial SectionGrowth FoundationManagement Strategy About Yamaha

1887 1900 1950 1960 1970 1980 1990 2000 2010
Pianos
1887 OrgansWoodworking
skills Wood
processing
1900 Upright pianos1902 Grand pianosArtificial seasoning of wood
Acoustic technology
1947 Began manufacturing piano frames
Metal molding
1967 CF series concert grand pianos 1982 Disklavier player pianoPlayer piano technology
1991 CF S concert grand piano1993 SILENT PianoSilencing technology
1995 SILENT Disklavier player piano1995 GranTouch hybrid pianoHybrid technology
2010 CFX concert grand piano
2014 TransAcoustic Piano
Wind instruments and educational musical instruments
Coating/Chemical technology Coating 1914 Harmonicas 1965 TrumpetsBrass processing
1967 Saxophones, etc.
1973 Pianica 1990 Xeno brass instrument series1995 SILENT BRASS system
(pickup mute)Silencing technology
2014 Biomass-derived recorder
2017 Venova
String instruments
1941 Acoustic guitarsWood processing
Coating
1966 Electric guitars 1983 Electric acoustic guitars 1997 SILENT Violin 2000 Braviol acoustic violin2001 SILENT Guitar2008 L36ARE and L26ARE acoustic guitarsWood modification technology
2011 THR guitar amplifier
VCM technology2016 YEV series electric violin2016 TransAcoustic Guitar
Percussion instruments
1915 Xylophones 1966 DrumsAir-seal system
1986 PMC1 electronic drums 1996 SILENT Session Drums 2010 DTX900 series electronic drums
Textured cellular silicon drum pad
Digital musical instruments
Sound synthesis technology
Electronics technology
1959 D-1 Electone electronic organAnalog modeling
1974 CSY-1 synthesizer1975 GX-1 Electone electronic organPolyphonic synthesis
Digital technology
1980 Portable keyboards1983 DX7 digital synthesizerFM synthesis
1983 Clavinova digital piano1987 WX7 wind MIDI controller
1993 VL series virtual acoustic synthesizers
Physical modeling synthesis
PCM synthesis
2001 MOTIF music production synthesizer2002 EZ-EG EZ guitar (self-teaching guitar)2004 STAGEA Electone electronic organ2006 H01 MODUS digital piano2008 TENORI-ON digital musical instrument2009 AvantGrand hybrid piano2009 CP1 stage pianoVACM synthesis
2015 reface mobile mini keyboard
2016 Montage synthesizer Motion Control synthesis engine
PA equipment
1969 VA-120 vocal amplifier system 1974 PM-1000 mixing consoleAnalog mixers
1985 SPX90 digital multi-effects processor 1994 ProMix 01 digital mixing console
Digital mixers
2000 AW4416 digital audio workstationAudio workstations
2001 PM1D digital audio mixing system2008 POCKETRAK CX pocket recorder
2012 CL Series digital mixing console Centralogic VCM technology
2014 Rivage digital mixing system
AV products
1922 High-quality hand- cranked phonographs
Coating
Wood processing
1954 HiFi players
HiFi audio
Speaker technology
1967 NS speaker
Divided diaphragm flat-panel speaker
1974 B-1 power amplifierPower-FET
1974 NS-1000M speaker with a beryllium diaphragm
Speaker with a beryllium diaphragm1975 Headphones
1982 CD-1 CD player1986 DSP-1 digital sound field processorDSP
1988 AST-1 speaker incorporated Yamaha Active Servo Technology (YST)
YST
1995 Theater sound system
Theater surround2004 YSP-1 Digital Sound ProjectorSound beam control speaker
2006 NX-A01 SR-Bass SpeakerSR-Bass
2010 AVENTAGE AV receiver
CINEMA DSP HD3
2010 Earphones2011 Interior audio2015 MusicCast wireless music system2016 NS-5000 speaker
Semiconductors
1972 Sound generator LSIs for the Electone electronic organ
LSI for musical instruments
1983 FM synthesizer LSIs1983 Graphics controller LSIsLSI for PC/video games
1999 Sound generator LSIs for mobile phones
LSI for mobile phones
2002 LSIs for digital amplifiers LSI for digital amplifiers
2005 Magnetic sensorGMR technology
IT equipment
Integrated circuit technologyInformation processing technology
Signal processing technology
Computers
1983 MSX personal computers
1993 CD recorders (~2003)1993 Online karaoke equipmentOnline karaoke equipment
1995 Remote routersRouters
2006 Audio conference systemAudio conference
Psychoacoustic technology
2011 VSP-1 speech privacy systemSound masking
2011 Thin light flexible speakerElectrostatic speakers
2011 Smart L2 switches2012 INFOSOUND acoustic data
communications technologyAcoustic communications technology
2013 Wireless LAN access points2014 Unified communications
microphone & speaker system
Music entertainment business and others
1921 Import and sales of overseas-made musical instruments and music scores
Architectural acoustics
1974 Computer-generated architectural acoustic simulation
1986 SRS (Sound Room System) music room for home use
1989 AVITECS soundproof roomSoundproof room
2000 Mobile phone ringtone distribution service
2000 Digital sheet music distribution serviceDTM
2003 VOCALOID singing synthesis softwareSinging synthesis technology
2009 BODiBEAT interactive music player
2010 TCH Acoustic conditioning panelSound field control
2010 iVOCALOID (VOCALOID for iPhone and iPad)
Others
1961 Iron-aluminum alloy/copper- titanium alloy
1962 Iron-nickel alloy (permalloy) (~2007)Permalloy
1984 Industrial robotsRobots
1989 Automobile interior wood componentsAutomobile interior wood components
1991 Thin-film magnetic heads (~2000)Thin-film deposition
1997 Magnesium cases (~2010)Magnesium molding
Schools, events
1954 Began Yamaha Music School activities
Music schools
1965 Opened the first overseas Yamaha Music School in the U.S.
1967 First Light Music Contest held in Japan (~1971)
1969 First Composition Contest held (Later renamed the Popular Song Contest) (~1986)
Musical events
1972 Sponsored the first Junior Original Concert (JOC)
1986 Began Popular Music School1987 Began English language schoolsEnglish language schools
1987 First Teens’ Music Festival (~2006)Musical events
2003 Musical instrument rental serviceMusical instrument rental service
2005 Opened Yamaha Music School in China
2006 Started online music lessons serviceOnline lessons
2007 First Music Revolution contest heldMusical events
Lifestyle-related products
1903 Fine wooden furnitureWood processing
Coating Materials development
1964 FRP bathtubsFRP molding
1975 Unit furniture (~2005)1976 System kitchens1977 New artificial marble countertops Artificial marble
1982 System bathrooms 2002 System kitchens with artificial marble sinks
Marble sinks
Lifestyle-related products business trans-ferred in 2010
Sports equipment
1959 FRP archery products (~2002)FRP (Fiber Reinforced Plastics) molding
1961 FRP skis (~1997)FRP molding
1973 Tennis rackets (~1997) 1982 Golf clubs1986 Acuras series carbon composite
golf clubCarbon composite
2002 inpres golf club2005 inpresX golf club
2014 RMX golf club
Resorts
1964 Toba Hotel International opened (Business transferred in 2007)
1967 Nemunosato opened (Business transferred in 2007)
Musical events and leisure
1974 Tsumagoi opened1976 Katsuragi Golf Club opened1978 Katsuragi Kitanomaru opened1979 Haimurubushi opened (Business
transferred in 2007)Musical events and leisure
1991 Kiroro opened (Business transferred in 2007)
Yamaha Motor Co., Ltd.
1921 Wooden aircraft propellers1931 Metallic aircraft propellersMetal technology Metal processing
1954 Motorcycle prototype developed (Later spun off from the Company as Yamaha Motor Co., Ltd.)
Engines
1960 FRP powerboatsFRP molding
1974 FRP poolsFRP molding
Wood processing
Music
Mechatronics technology
Yamaha Product History
108
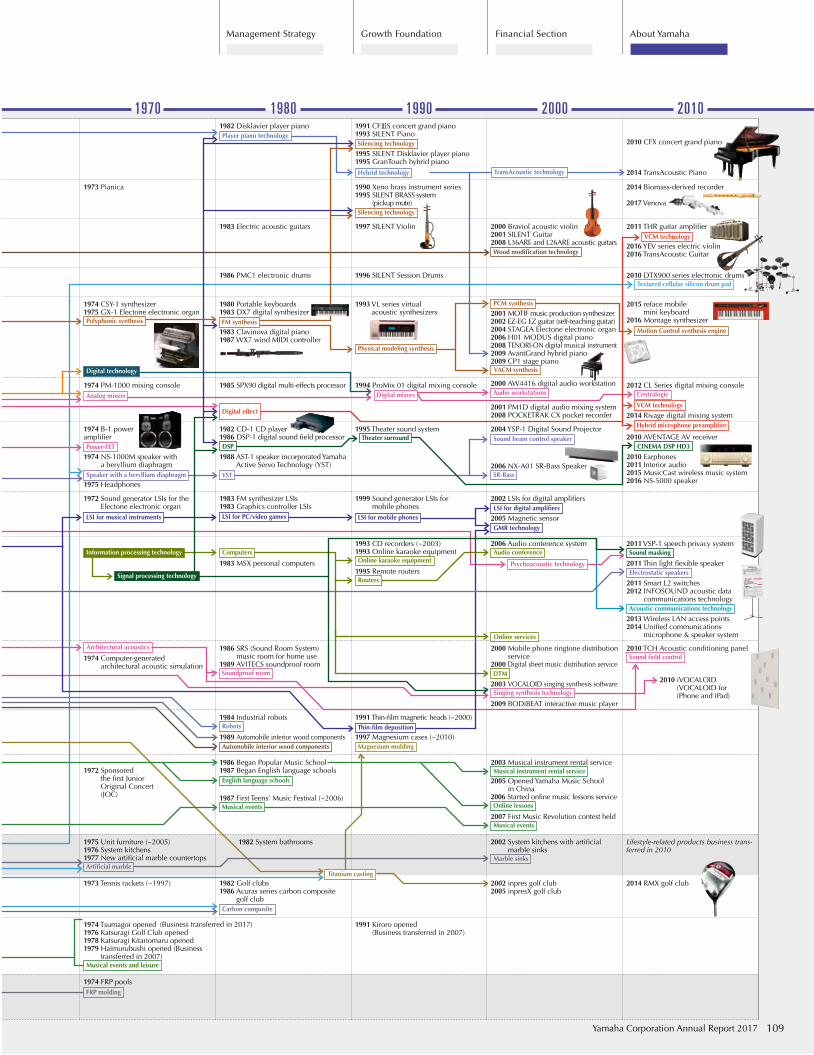
1887 1900 1950 1960 1970 1980 1990 2000 2010
Pianos
1887 OrgansWoodworking
skills Wood
processing
1900 Upright pianos1902 Grand pianosArtificial seasoning of wood
Acoustic technology
1947 Began manufacturing piano frames
Metal molding
1967 CF series concert grand pianos 1982 Disklavier player pianoPlayer piano technology
1991 CF S concert grand piano1993 SILENT PianoSilencing technology
1995 SILENT Disklavier player piano1995 GranTouch hybrid pianoHybrid technology
2010 CFX concert grand piano
2014 TransAcoustic Piano
Wind instruments and educational musical instruments
Coating/Chemical technology Coating 1914 Harmonicas 1965 TrumpetsBrass processing
1967 Saxophones, etc.
1973 Pianica 1990 Xeno brass instrument series1995 SILENT BRASS system
(pickup mute)Silencing technology
2014 Biomass-derived recorder
2017 Venova
String instruments
1941 Acoustic guitarsWood processing
Coating
1966 Electric guitars 1983 Electric acoustic guitars 1997 SILENT Violin 2000 Braviol acoustic violin2001 SILENT Guitar2008 L36ARE and L26ARE acoustic guitarsWood modification technology
2011 THR guitar amplifier
VCM technology2016 YEV series electric violin2016 TransAcoustic Guitar
Percussion instruments
1915 Xylophones 1966 DrumsAir-seal system
1986 PMC1 electronic drums 1996 SILENT Session Drums 2010 DTX900 series electronic drums
Textured cellular silicon drum pad
Digital musical instruments
Sound synthesis technology
Electronics technology
1959 D-1 Electone electronic organAnalog modeling
1974 CSY-1 synthesizer1975 GX-1 Electone electronic organPolyphonic synthesis
Digital technology
1980 Portable keyboards1983 DX7 digital synthesizerFM synthesis
1983 Clavinova digital piano1987 WX7 wind MIDI controller
1993 VL series virtual acoustic synthesizers
Physical modeling synthesis
PCM synthesis
2001 MOTIF music production synthesizer2002 EZ-EG EZ guitar (self-teaching guitar)2004 STAGEA Electone electronic organ2006 H01 MODUS digital piano2008 TENORI-ON digital musical instrument2009 AvantGrand hybrid piano2009 CP1 stage pianoVACM synthesis
2015 reface mobile mini keyboard
2016 Montage synthesizer Motion Control synthesis engine
PA equipment
1969 VA-120 vocal amplifier system 1974 PM-1000 mixing consoleAnalog mixers
1985 SPX90 digital multi-effects processor 1994 ProMix 01 digital mixing console
Digital mixers
2000 AW4416 digital audio workstationAudio workstations
2001 PM1D digital audio mixing system2008 POCKETRAK CX pocket recorder
2012 CL Series digital mixing console Centralogic VCM technology
2014 Rivage digital mixing system
AV products
1922 High-quality hand- cranked phonographs
Coating
Wood processing
1954 HiFi players
HiFi audio
Speaker technology
1967 NS speaker
Divided diaphragm flat-panel speaker
1974 B-1 power amplifierPower-FET
1974 NS-1000M speaker with a beryllium diaphragm
Speaker with a beryllium diaphragm1975 Headphones
1982 CD-1 CD player1986 DSP-1 digital sound field processorDSP
1988 AST-1 speaker incorporated Yamaha Active Servo Technology (YST)
YST
1995 Theater sound system
Theater surround2004 YSP-1 Digital Sound ProjectorSound beam control speaker
2006 NX-A01 SR-Bass SpeakerSR-Bass
2010 AVENTAGE AV receiver
CINEMA DSP HD3
2010 Earphones2011 Interior audio2015 MusicCast wireless music system2016 NS-5000 speaker
Semiconductors
1972 Sound generator LSIs for the Electone electronic organ
LSI for musical instruments
1983 FM synthesizer LSIs1983 Graphics controller LSIsLSI for PC/video games
1999 Sound generator LSIs for mobile phones
LSI for mobile phones
2002 LSIs for digital amplifiers LSI for digital amplifiers
2005 Magnetic sensorGMR technology
IT equipment
Integrated circuit technologyInformation processing technology
Signal processing technology
Computers
1983 MSX personal computers
1993 CD recorders (~2003)1993 Online karaoke equipmentOnline karaoke equipment
1995 Remote routersRouters
2006 Audio conference systemAudio conference
Psychoacoustic technology
2011 VSP-1 speech privacy systemSound masking
2011 Thin light flexible speakerElectrostatic speakers
2011 Smart L2 switches2012 INFOSOUND acoustic data
communications technologyAcoustic communications technology
2013 Wireless LAN access points2014 Unified communications
microphone & speaker system
Music entertainment business and others
1921 Import and sales of overseas-made musical instruments and music scores
Architectural acoustics
1974 Computer-generated architectural acoustic simulation
1986 SRS (Sound Room System) music room for home use
1989 AVITECS soundproof roomSoundproof room
2000 Mobile phone ringtone distribution service
2000 Digital sheet music distribution serviceDTM
2003 VOCALOID singing synthesis softwareSinging synthesis technology
2009 BODiBEAT interactive music player
2010 TCH Acoustic conditioning panelSound field control
2010 iVOCALOID (VOCALOID for iPhone and iPad)
Others
1961 Iron-aluminum alloy/copper- titanium alloy
1962 Iron-nickel alloy (permalloy) (~2007)Permalloy
1984 Industrial robotsRobots
1989 Automobile interior wood componentsAutomobile interior wood components
1991 Thin-film magnetic heads (~2000)Thin-film deposition
1997 Magnesium cases (~2010)Magnesium molding
Schools, events
1954 Began Yamaha Music School activities
Music schools
1965 Opened the first overseas Yamaha Music School in the U.S.
1967 First Light Music Contest held in Japan (~1971)
1969 First Composition Contest held (Later renamed the Popular Song Contest) (~1986)
Musical events
1972 Sponsored the first Junior Original Concert (JOC)
1986 Began Popular Music School1987 Began English language schoolsEnglish language schools
1987 First Teens’ Music Festival (~2006)Musical events
2003 Musical instrument rental serviceMusical instrument rental service
2005 Opened Yamaha Music School in China
2006 Started online music lessons serviceOnline lessons
2007 First Music Revolution contest heldMusical events
Lifestyle-related products
1903 Fine wooden furnitureWood processing
Coating Materials development
1964 FRP bathtubsFRP molding
1975 Unit furniture (~2005)1976 System kitchens1977 New artificial marble countertops Artificial marble
1982 System bathrooms 2002 System kitchens with artificial marble sinks
Marble sinks
Lifestyle-related products business trans-ferred in 2010
Sports equipment
1959 FRP archery products (~2002)FRP (Fiber Reinforced Plastics) molding
1961 FRP skis (~1997)FRP molding
1973 Tennis rackets (~1997) 1982 Golf clubs1986 Acuras series carbon composite
golf clubCarbon composite
2002 inpres golf club2005 inpresX golf club
2014 RMX golf club
Resorts
1964 Toba Hotel International opened (Business transferred in 2007)
1967 Nemunosato opened (Business transferred in 2007)
Musical events and leisure
1974 Tsumagoi opened1976 Katsuragi Golf Club opened1978 Katsuragi Kitanomaru opened1979 Haimurubushi opened (Business
transferred in 2007)Musical events and leisure
1991 Kiroro opened (Business transferred in 2007)
Yamaha Motor Co., Ltd.
1921 Wooden aircraft propellers1931 Metallic aircraft propellersMetal technology Metal processing
1954 Motorcycle prototype developed (Later spun off from the Company as Yamaha Motor Co., Ltd.)
Engines
1960 FRP powerboatsFRP molding
1974 FRP poolsFRP molding
Titanium casting
Digital effect
Online services
Hybrid microphone preamplifier
TransAcoustic technology
(Business transferred in 2017)
Yamaha Corporation Annual Report 2017 109
Financial SectionGrowth FoundationManagement Strategy About Yamaha
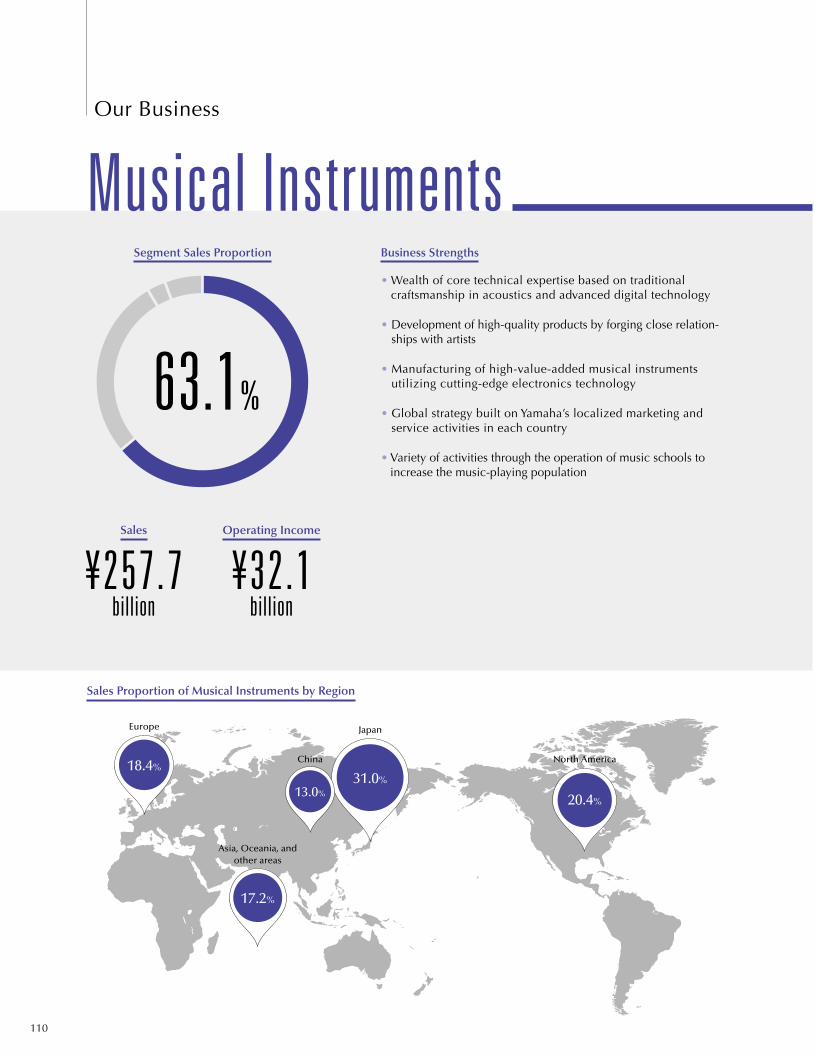
Musical InstrumentsOur Business
Sales Proportion of Musical Instruments by Region
¥257.7 billion
Sales
Segment Sales Proportion
¥32.1billion
Operating Income
• Wealth of core technical expertise based on traditional craftsmanship in acoustics and advanced digital technology
• Development of high-quality products by forging close relation-ships with artists
• Manufacturing of high-value-added musical instruments utilizing cutting-edge electronics technology
• Global strategy built on Yamaha’s localized marketing and service activities in each country
• Variety of activities through the operation of music schools to increase the music-playing population
Business Strengths
63.1%
Japan
North AmericaChina
Asia, Oceania, and other areas
Europe
31.0%
20.4%
18.4%
17.2%
13.0%
110

Grand pianos
Saxophones Music schools
Acoustic guitars
Acoustic drumsPortable keyboards
Digital pianos
Trumpets
Electric violins
Sales Proportion by Product Category
Pianos
Digital musical instruments (digital pianos, Electone™, portable keyboards, synthesizers, etc.)
Wind instruments (trumpets, flutes, saxophones, etc.)
String instruments (guitars, violins, etc.)
Percussion instruments (drums, timpani, marimbas, etc.)
Educational musical instruments (recorders, Pianica™, etc.)
Music schools, English language schools
Music entertainment business
Piano tuning
Major Products & Services
Pianos
18.8%
Digital musical instruments
32.2%
Wind instruments
15.6%
Music schools, etc.
23.3%
String and percussion instruments
10.1%
Yamaha Corporation Annual Report 2017 111
Financial SectionGrowth FoundationManagement Strategy About Yamaha

Audio Equipment
Audio products (AV receivers, speaker systems, front surround speakers, desktop audio systems, etc.)
PA equipment (mixers, power amplifiers, etc.)
Commercial online karaoke equipment
Enterprise network equipment (routers, switches, wireless LAN access points)
Telecommunications peripheral devices
Soundproof rooms (AVITECS™)
Major Products & Services
• High-quality sound technology in AV components and HiFi audio products
• Audio network technology such as MusicCast™ in a wide variety of home audio products
• Provision of system solutions using digital network technology for professional audio equipment
• Internet VPN and backup solutions for the enterprise by VPN router and visualization solutions for small and medium-scale LAN by the switch and AP
• Signal processing technology for high-quality sound and wide coverage of microphone speakers for Unified Communication market
Business Strengths
Wireless streaming speakersDigital mixing consolesDigital sound projectors
Unified Communication speakerphones
AV receivers
Line-array speakers
Commercial installed sound speakers
Integrated audio production system
Network switches
Segment Sales Proportion
¥115.5 billion
Sales
¥10.4billion
Operating Income
28.3%
112
Our Business

OthersSegment Sales Proportion
Provides solutions for realizing a more comfortable and conve-nient society centered on audio technologies, elemental and material technologies, and machine control technologies
Note: As of Fiscal 2017, the electronic devices segment has been abolished. However, the Company still maintains the electronic devices business, which is now included in the others segment.
Business Overview
Industrial Machinery / Components -Electronic devices -Automobile interior wood components -Factory automation (FA) equipment
Golf products and others
Speakers for high resolution personal computers
Modules for in-vehicle, hands-free telephone calls
Peltier modules
Graphic controller for amusement equipment
Major Products & Services
FA equipment
Golf products
¥35.1 billion
Sales
¥1.7billion
Operating Income
8.6%
Automobile interior wood components
Yamaha Corporation Annual Report 2017 113
Financial SectionGrowth FoundationManagement Strategy About Yamaha
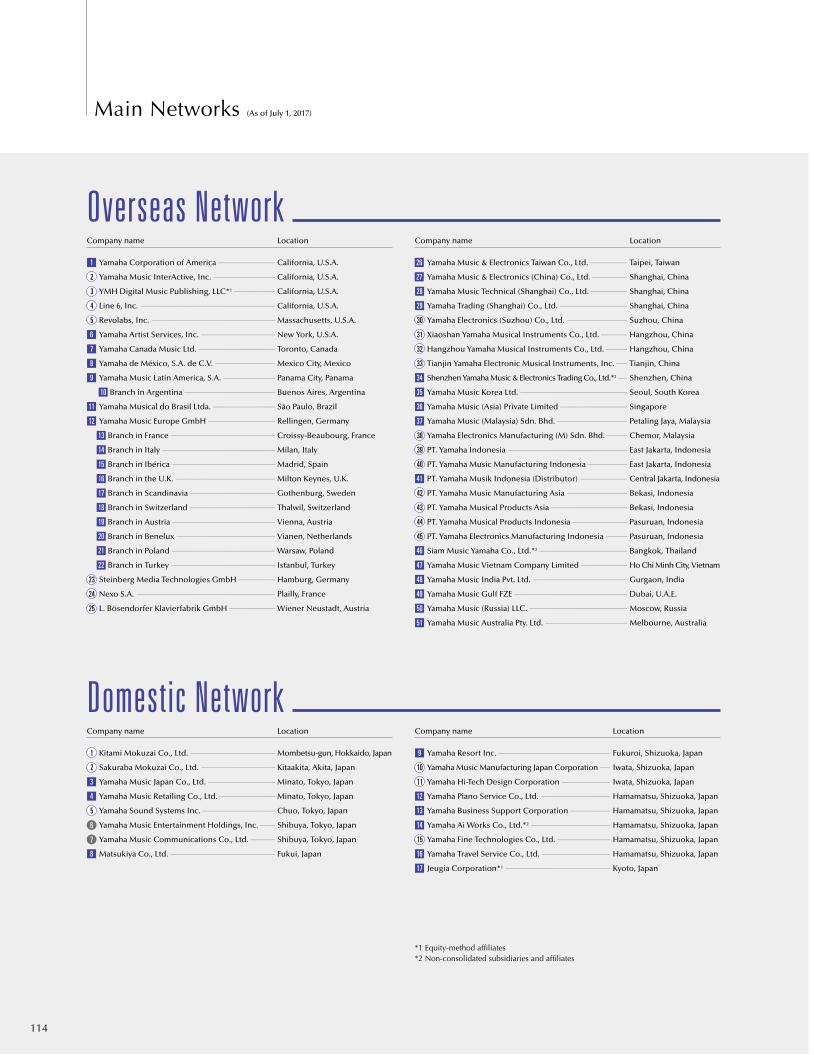
Overseas Network
Main Networks (As of July 1, 2017)
Domestic Network
Company name Location
1 Yamaha Corporation of America ......................................................... California, U.S.A.
2 Yamaha Music InterActive, Inc. .............................................................. California, U.S.A.
3 YMH Digital Music Publishing, LLC*1 ......................................... California, U.S.A.
4 Line 6, Inc. ....................................................................................................................................... California, U.S.A.
5 Revolabs, Inc. ............................................................................................................................ Massachusetts, U.S.A.
6 Yamaha Artist Services, Inc. .......................................................................... New York, U.S.A.
7 Yamaha Canada Music Ltd. ............................................................................. Toronto, Canada
8 Yamaha de México, S.A. de C.V. ............................................................ Mexico City, Mexico
9 Yamaha Music Latin America, S.A. .................................................... Panama City, Panama
10 Branch in Argentina ........................................................................................... Buenos Aires, Argentina
11 Yamaha Musical do Brasil Ltda. .............................................................. São Paulo, Brazil
12 Yamaha Music Europe GmbH ................................................................... Rellingen, Germany
13 Branch in France ......................................................................................................... Croissy-Beaubourg, France
14 Branch in Italy ................................................................................................................. Milan, Italy
15 Branch in Ibérica ....................................................................................................... Madrid, Spain
16 Branch in the U.K. .................................................................................................... Milton Keynes, U.K.
17 Branch in Scandinavia ..................................................................................... Gothenburg, Sweden
18 Branch in Switzerland ...................................................................................... Thalwil, Switzerland
19 Branch in Austria ....................................................................................................... Vienna, Austria
20 Branch in Benelux ................................................................................................... Vianen, Netherlands
21 Branch in Poland ........................................................................................................ Warsaw, Poland
22 Branch in Turkey ........................................................................................................ Istanbul, Turkey
23 Steinberg Media Technologies GmbH ..................................... Hamburg, Germany
24 Nexo S.A. ........................................................................................................................................... Plailly, France
25 L. Bösendorfer Klavierfabrik GmbH .............................................. Wiener Neustadt, Austria
Company name Location
26 Yamaha Music & Electronics Taiwan Co., Ltd. ..................................... Taipei, Taiwan
27 Yamaha Music & Electronics (China) Co., Ltd. ................................... Shanghai, China
28 Yamaha Music Technical (Shanghai) Co., Ltd. .................................... Shanghai, China
29 Yamaha Trading (Shanghai) Co., Ltd. ................................................................... Shanghai, China
30 Yamaha Electronics (Suzhou) Co., Ltd. ............................................................ Suzhou, China
31 Xiaoshan Yamaha Musical Instruments Co., Ltd. .......................... Hangzhou, China
32 Hangzhou Yamaha Musical Instruments Co., Ltd. ..................... Hangzhou, China
33 Tianjin Yamaha Electronic Musical Instruments, Inc. ........... Tianjin, China
34 Shenzhen Yamaha Music & Electronics Trading Co., Ltd.*2 ......... Shenzhen, China
35 Yamaha Music Korea Ltd. ........................................................................................................... Seoul, South Korea
36 Yamaha Music (Asia) Private Limited ................................................................... Singapore
37 Yamaha Music (Malaysia) Sdn. Bhd. ...................................................................... Petaling Jaya, Malaysia
38 Yamaha Electronics Manufacturing (M) Sdn. Bhd. .................... Chemor, Malaysia
39 PT. Yamaha Indonesia ....................................................................................................................... East Jakarta, Indonesia
40 PT. Yamaha Music Manufacturing Indonesia ....................................... East Jakarta, Indonesia
41 PT. Yamaha Musik Indonesia (Distributor) ............................................... Central Jakarta, Indonesia
42 PT. Yamaha Music Manufacturing Asia ............................................................ Bekasi, Indonesia
43 PT. Yamaha Musical Products Asia ............................................................................ Bekasi, Indonesia
44 PT. Yamaha Musical Products Indonesia ....................................................... Pasuruan, Indonesia
45 PT. Yamaha Electronics Manufacturing Indonesia ..................... Pasuruan, Indonesia
46 Siam Music Yamaha Co., Ltd.*2 ........................................................................................ Bangkok, Thailand
47 Yamaha Music Vietnam Company Limited .............................................. Ho Chi Minh City, Vietnam
48 Yamaha Music India Pvt. Ltd. .............................................................................................. Gurgaon, India
49 Yamaha Music Gulf FZE ................................................................................................................. Dubai, U.A.E.
50 Yamaha Music (Russia) LLC. .................................................................................................. Moscow, Russia
51 Yamaha Music Australia Pty. Ltd. .................................................................................. Melbourne, Australia
Company name Location
1 Kitami Mokuzai Co., Ltd. ..................................................................................... Mombetsu-gun, Hokkaido, Japan
2 Sakuraba Mokuzai Co., Ltd. .......................................................................... Kitaakita, Akita, Japan
3 Yamaha Music Japan Co., Ltd. ................................................................... Minato, Tokyo, Japan
4 Yamaha Music Retailing Co., Ltd. ........................................................ Minato, Tokyo, Japan
5 Yamaha Sound Systems Inc. ......................................................................... Chuo, Tokyo, Japan
6 Yamaha Music Entertainment Holdings, Inc. ............... Shibuya, Tokyo, Japan
7 Yamaha Music Communications Co., Ltd. ........................ Shibuya, Tokyo, Japan
8 Matsukiya Co., Ltd. ......................................................................................................... Fukui, Japan
Company name Location
9 Yamaha Resort Inc. ................................................................................................................ Fukuroi, Shizuoka, Japan
10 Yamaha Music Manufacturing Japan Corporation .......... Iwata, Shizuoka, Japan
11 Yamaha Hi-Tech Design Corporation ................................................ Iwata, Shizuoka, Japan
12 Yamaha Piano Service Co., Ltd. ..................................................................... Hamamatsu, Shizuoka, Japan
13 Yamaha Business Support Corporation ........................................ Hamamatsu, Shizuoka, Japan
14 Yamaha Ai Works Co., Ltd.*2 ............................................................................... Hamamatsu, Shizuoka, Japan
15 Yamaha Fine Technologies Co., Ltd. ..................................................... Hamamatsu, Shizuoka, Japan
16 Yamaha Travel Service Co., Ltd. .................................................................... Hamamatsu, Shizuoka, Japan
17 Jeugia Corporation*1 ......................................................................................................... Kyoto, Japan
*1 Equity-method affiliates*2 Non-consolidated subsidiaries and affiliates
114
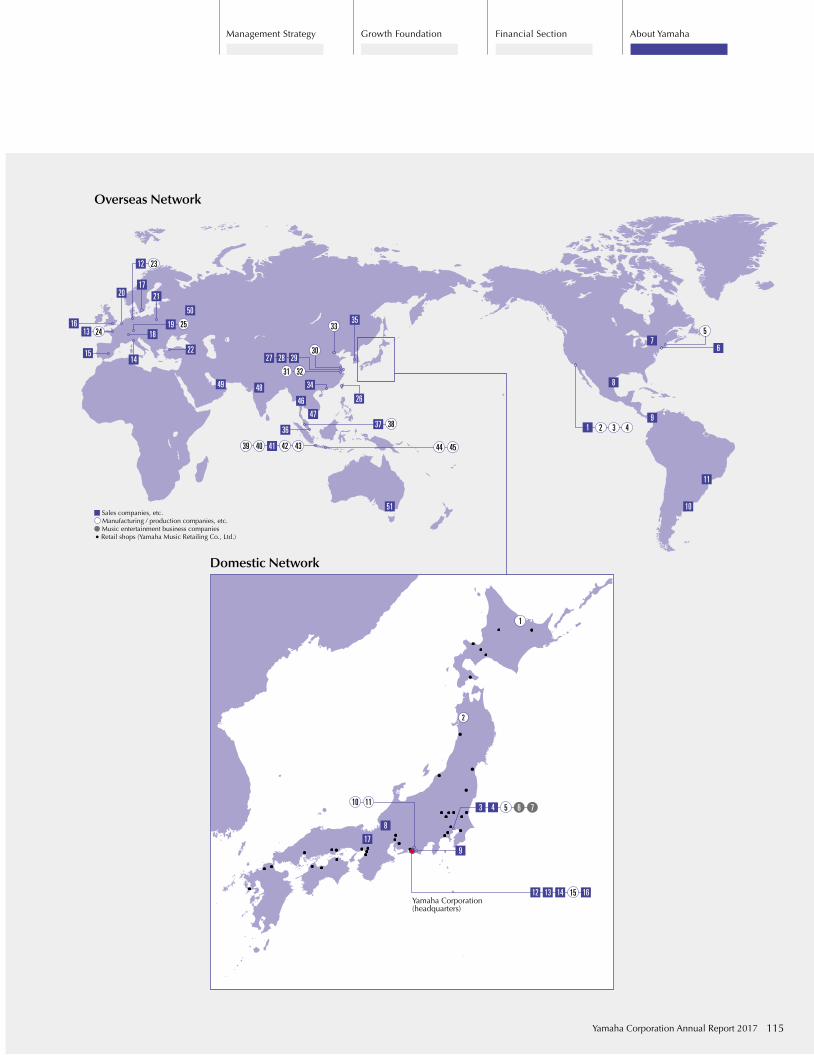
8
179
1110
1
2
16
20
14
2117
2215
13 24
13 14 1615
49
46
47
48
10
11
9
8
76
5
36
34
35
27 28 29
26
37 38
30
33
3231
4441 42 434039 45
18
Overseas Network
Domestic Network
50
Sales companies, etc. Manufacturing / production companies, etc. Music entertainment business companies
• Retail shops (Yamaha Music Retailing Co., Ltd.)
Yamaha Corporation(headquarters)
4 73 5 6
12 23
1 2 3 4
51
19 25
12
Yamaha Corporation Annual Report 2017 115
Financial SectionGrowth FoundationManagement Strategy About Yamaha
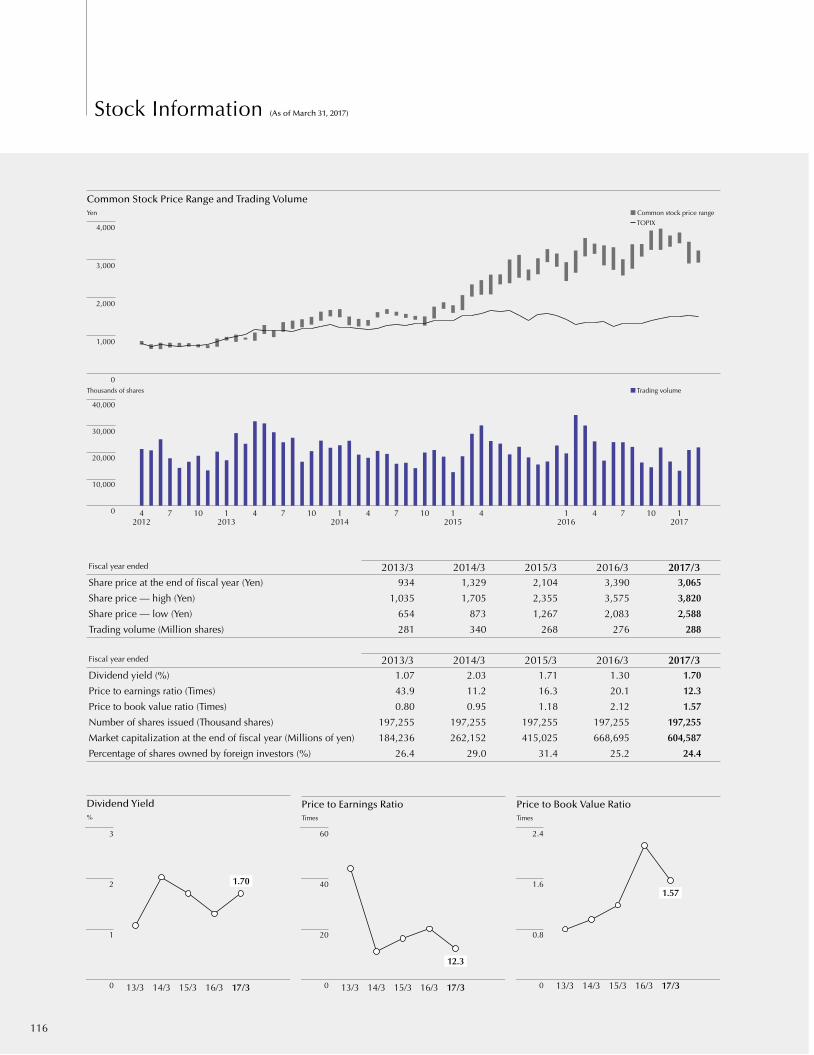
Stock Information (As of March 31, 2017)
0
10,000
20,000
30,000
40,000
0
1,000
2,000
3,000
4,000
12017
107412016
412015
107412014
107412013
10742012
Price to Earnings RatioTimes
Dividend Yield%
Common Stock Price Range and Trading VolumeYen Common stock price range
TOPIX
Thousands of shares Trading volume
Price to Book Value RatioTimes
17/316/315/314/313/30
1
2
3
0
0.8
1.6
2.4
17/316/315/314/313/30
20
40
60
17/316/315/314/313/3
Fiscal year ended 2013/3 2014/3 2015/3 2016/3 2017/3Share price at the end of fiscal year (Yen) 934 1,329 2,104 3,390 3,065
Share price — high (Yen) 1,035 1,705 2,355 3,575 3,820
Share price — low (Yen) 654 873 1,267 2,083 2,588
Trading volume (Million shares) 281 340 268 276 288
Fiscal year ended 2013/3 2014/3 2015/3 2016/3 2017/3Dividend yield (%) 1.07 2.03 1.71 1.30 1.70
Price to earnings ratio (Times) 43.9 11.2 16.3 20.1 12.3
Price to book value ratio (Times) 0.80 0.95 1.18 2.12 1.57
Number of shares issued (Thousand shares) 197,255 197,255 197,255 197,255 197,255
Market capitalization at the end of fiscal year (Millions of yen) 184,236 262,152 415,025 668,695 604,587
Percentage of shares owned by foreign investors (%) 26.4 29.0 31.4 25.2 24.4
1.70
12.3
1.57
116
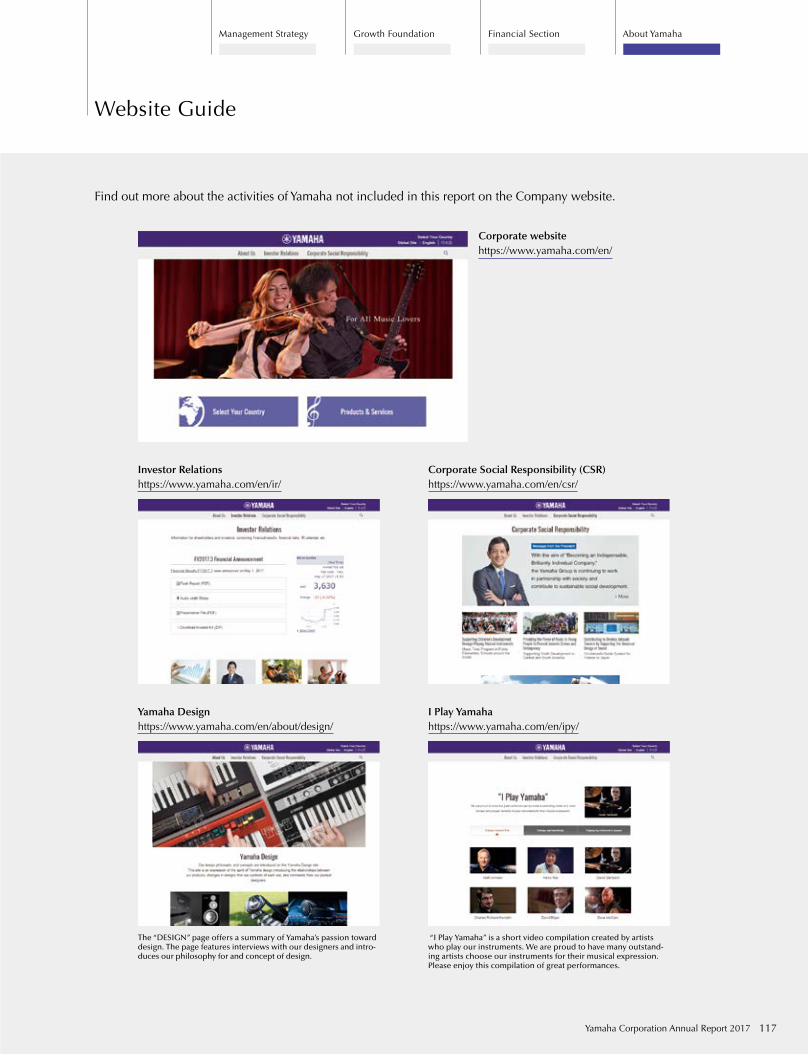
Corporate websitehttps://www.yamaha.com/en/
Investor Relationshttps://www.yamaha.com/en/ir/
Corporate Social Responsibility (CSR)https://www.yamaha.com/en/csr/
Yamaha Designhttps://www.yamaha.com/en/about/design/
The “DESIGN” page offers a summary of Yamaha’s passion toward design. The page features interviews with our designers and intro-duces our philosophy for and concept of design.
“I Play Yamaha” is a short video compilation created by artists who play our instruments. We are proud to have many outstand-ing artists choose our instruments for their musical expression. Please enjoy this compilation of great performances.
I Play Yamahahttps://www.yamaha.com/en/ipy/
Find out more about the activities of Yamaha not included in this report on the Company website.
117Yamaha Corporation Annual Report 2017
Financial SectionGrowth FoundationManagement Strategy About Yamaha
Website Guide
Yamah
a Co
rpo
ration
An
nu
al Rep
ort 2017
|社名ロゴ|欧文|標準形|横組|モノクロ|ポジ|
Corporate Planning Divisionhttps://www.yamaha.com/en/
Printed in Japan on FSC®-approved paper using vegetable oil ink and waterless printing processes.
2017/8 – CM172


