
Social Security Administration | April 2016
Annual Performance Report FY 2016 Social Security Administration

Social Security Administration | Annual Performance Report FY 2016 Page | 2
Table of Contents Acting Commissioner’s Message ............................................................................................... 4
Our Mission ................................................................................................................................ 5
Our Programs ............................................................................................................................ 5
Our Organization ........................................................................................................................ 6
Agency Performance.................................................................................................................. 7
FY 2016 Performance Measures and Results ............................................................................ 8
Strategic Goal 1: Deliver Innovative, Quality Services .............................................................. 9
Strategic Objective 1.1: Develop and Increase the Use of Self-Service Options .................... 9
Strategic Objective 1.2: Enhance the Customer Experience by Completing Customers’ Business at the First Point of Contact ..................................................................................... 9
Strategic Objective 1.3: Partner with Other Agencies and Organizations to Improve Customers’ Experience and Align with the Administration’s One-Government Approach ......11
Strategic Objective 1.4: Evaluate Our Physical Footprint to Incorporate Improved Service Options .....................................................................................................................11
Strategic Goal 2: Strengthen the Integrity of Our Programs .....................................................12
Strategic Objective 2.1: Transform the Way We Record Earnings to Enhance Data Accuracy ...............................................................................................................................12
Strategic Objective 2.2: Protect the Public’s Data and Provide Secure Online Services ......12
Strategic Objective 2.3: Increase Payment Accuracy ..........................................................13
Strategic Goal 3: Serve the Public through a Stronger, More Responsive Disability Program .15
Strategic Objective 3.1: Improve the Quality, Consistency, and Timeliness of Our Disability Decisions ..............................................................................................................................15
Strategic Objective 3.2: Maximize Efficiencies throughout the Disability Program ...............18
Strategic Objective 3.3: Enhance Employment Support Programs and Create New Opportunities for Returning Beneficiaries to Work .................................................................19
Strategic Goal 4: Build a Model Workforce to Deliver Quality Service .....................................20
Strategic Objective 4.1: Attract and Acquire a Talented and Diverse Workforce that Reflects the Public We Serve ..............................................................................................................20
Strategic Objective 4.2: Strengthen the Competency, Agility, and Performance of Our Workforce to Align with the Needs of the Public ....................................................................20
Strategic Objective 4.3: Foster an Inclusive Culture that Promotes Employee Well-Being, Innovation, and Engagement.................................................................................................21

Social Security Administration | Annual Performance Report FY 2016 Page | 3
Strategic Objective 4.4: Enhance Planning and Alignment of Human Resources to Address Current and Future Public Service Needs .............................................................................21
Strategic Goal 5: Ensure Reliable, Secure, and Efficient Information Technology Services .....22
Strategic Objective 5.1: Maintain System Performance and the Continuity of Information Technology Services .............................................................................................................22
Strategic Objective 5.2: Enhance and Execute Plans to Modernize Our Systems ...............22
Strategic Objective 5.3: Incorporate Innovative Advances in Service Delivery .....................23
Strategic Objective 5.4: Continuously Strengthen Our Cyber Security Program ..................23
Discontinued Performance Measure Results ............................................................................25

Social Security Administration | Annual Performance Report FY 2016 Page | 4
Acting Commissioner’s Message Following in the footsteps of past Commissioners, I am honored to serve as the Acting Commissioner of Social Security. For the past eight decades, Social Security’s programs have touched the lives of nearly all Americans and have been here for the people who need and count on them. We know that delivering timely, quality services has a meaningful impact on the people we serve. Few government agencies touch the lives of as many people as we do. The Social Security Administration pays monthly benefits to approximately 70 million individuals.
We issue Social Security cards and numbers at birth, record earnings when individuals enter the workforce, provide benefit estimates as workers begin thinking about leaving the workforce, and provide a safety
net in the unfortunate event of blindness, disability or death. The people we serve are our top priority, and we will continue to remain mission-focused and mission-driven.
I am pleased to issue the Annual Performance Report Fiscal Year 2016, which reflects how we are serving the public. We could not have accomplished our performance goals without the dedication of our employees, and I thank them for their continued commitment and service.
Based on internal evaluations, I affirm that the performance data in this report is complete, reliable, and accurate.
Nancy A. Berryhill
Acting Commissioner

Social Security Administration | Annual Performance Report FY 2016 Page | 5
Our Mission Deliver Social Security services that meet the changing needs of the public.
Our Programs Few government agencies touch the lives of as many people as we do. We administer the Old-Age, Survivors, and Disability Insurance program and the Supplemental Security Income program. These programs provide vital support to some of the most vulnerable members of our society, including people with disabilities, surviving family members, retirees, and the blind and disabled with limited income and resources. In fiscal year 2017 (FY), we expect to pay nearly a trillion dollars to a monthly average of approximately 70 million people.
Old-Age, Survivors, and Disability Insurance Program We administer the Old-Age, Survivors, and Disability Insurance program, commonly referred to as “Social Security.” Individuals earn coverage for Social Security retirement, survivors, and disability protection and benefits by working and paying Social Security taxes on their earnings.
Social Security pays monthly benefits to approximately 62 million individuals, consisting of 42 million retired workers and 3 million of their spouses and children; 9 million workers with disabilities and 2 million dependents; and 6 million surviving widows and widowers, children, and other dependents of deceased workers. During FY 2017, we expect to pay more than $940 billion to Social Security beneficiaries.
Supplemental Security Income Program
We also administer the Supplemental Security Income (SSI) program, which provides monthly payments to individuals with limited income and resources who are aged, blind, or disabled. Adults and children under age 18 can receive payments based on disability or blindness. General tax revenues fund the SSI program.
We make SSI payments to approximately 1 million aged recipients, 1 million blind or disabled children, and 6 million blind or disabled adults. In FY 2017, we expect to pay nearly $55 billion in Federal benefits to a monthly average of approximately 8 million SSI recipients.

Social Security Administration | Annual Performance Report FY 2016 Page | 6
Our Organization Approximately 62,000 federal employees and 16,000 state employees serve the public from a network of offices across the country.
Individuals receive in-person service at our field offices and Social Security card centers. Our teleservice centers handle calls to our National 800 Number. Our processing centers handle Social Security retirement, survivors, and disability payments, and support other services like our National 800 Number. State agencies handle disability determinations at the first two levels of our claims and appeals process. Administrative law judges in our hearing offices and administrative appeals judges in our Appeals Council decide appealed cases.

Social Security Administration | Annual Performance Report FY 2016 Page | 7
Agency Performance This Annual Performance Report addresses the goals and objectives in our Agency Strategic Plan for Fiscal Years 2014 – 2018 and our four Agency Priority Goals (APG) as required by the Government Performance and Results Modernization Act of 2010. We evaluate our progress on our strategic objectives and APGs by the following performance measures and targets.
Agency Priority Goals for FY 2016 – FY 2017 FY 2016 - FY 2017
Agency Priority Goals Goal Leader/
Deputy Goal Leader
Improve customer service and convenience by increasing online
transactions.
Goal Leader: Deputy Commissioner, Office of Operations
Deputy Goal Leader: Deputy Commissioner, Office of Systems
Increase customer satisfaction with our services.
Goal Leader: Deputy Commissioner, Office of Operations
Deputy Goal Leader: Deputy Commissioner, Office of Budget,
Finance, Quality, and Management
Improve the integrity of the Supplemental Security Income
program by ensuring that 95 percent of our payments are free of
overpayment.
Goal Leader: Deputy Commissioner, Office of Retirement and Disability
Policy
Deputy Goal Leader: Assistant Deputy Commissioner, Office of
Operations
Improve customer service by reducing the wait time for a hearing
decision.
Goal Leader: Assistant Deputy Commissioner, Office of Disability
Adjudication and Review
Deputy Goal Leader: Deputy Commissioner, Office of Operations

Social Security Administration | Annual Performance Report FY 2016 Page | 8
FY 2016 Performance Measures and Results We generally base our performance data on an operating month, which ends on the last Friday of the calendar month. Most fiscal years (FY) are 52 weeks long; however, some FYs, as in FY 2016, include 53 weeks. Therefore, our FY 2016 results cover 53 weeks, and we provide 52-week data, when available, for comparison purposes.
We set 33 FY 2016 performance measures, of which we met 23, do not have data for 2, and are developing the baseline data for 1. Note: In the charts that follow, we reference Agency Priority Goals by “APG” and budgeted workload measures by “BWM.”
Met, 23
Not Met, 7
Data Unavailable,
2No Target Set, 1
FY 2016 Performance Measure Results

Social Security Administration | Annual Performance Report FY 2016 Page | 9
Strategic Goal 1: Deliver Innovative, Quality Services
Strategic Objective 1.1: Develop and Increase the Use of Self-Service Options
1.1a APG: Improve customer service and convenience by increasing online transactions by 25 million each year
Fiscal Year 2011 2012 2013 2014 2015 2016
Performance 16 million 21.8 million 46.3 million 70.8 million 87 million 121.9 million
Target 112 million transactions
Target Met Met
FY 2016 52-week performance: 119.6 million
Strategic Objective 1.2: Enhance the Customer Experience by Completing Customers’ Business at the First Point of Contact
1.2a APG: Increase customer satisfaction with our services
Fiscal Year 2011 2012 2013 2014 2015 2016
Performance 81 satisfaction rating with
online services
81% satisfaction for
office and telephone services
82 satisfaction rating with
online services
81% satisfaction for
office and telephone services
82 satisfaction rating with
online services
80% satisfaction for
office and telephone services
83 satisfaction rating with
online services
Data is not available for office and telephone services
84 satisfaction rating with
online services
79% satisfaction for
office and telephone services
84.9 satisfaction rating with
online services
80% satisfaction for
office and telephone services
Target 84.5 satisfaction rating with
online services

Social Security Administration | Annual Performance Report FY 2016 Page | 10
Fiscal Year 2011 2012 2013 2014 2015 2016
80% satisfaction for
office and telephone services
Target Met Met
1.2b BWM: Complete the budgeted number of retirement, survivors, and Medicare claims
Fiscal Year 2011 2012 2013 2014 2015 2016
Performance 4,877,955 5,001,092 5,006,855 5,023,533 5,327,221 5,602,312
Target 4,590,000 4,918,000 5,269,000 (4,952,591
rec’d)
5,131,000 (4,990,259
rec’d)
5,247,000 5,586,000
Target Met Met Met Met1 Met Met Met
FY 2016 52-week performance: 5,501,779
1.2c BWM: Achieve the target speed in answering National 800 Number calls
Fiscal Year 2011 2012 2013 2014 2015 2016
Performance 180 seconds
(3 minutes)
294 seconds
(4 minutes, 54 seconds)
617 seconds
(10 minutes, 17 seconds)
1,323 seconds
(22 minutes, 3 seconds)
617 seconds
(10 minutes, 17 seconds)
817 seconds
(13 minutes, 37 seconds)
Target 267 seconds
(4 minutes, 27 seconds)
285 seconds
(4 minutes, 45 seconds)
535 seconds
(8 minutes, 55 seconds)
1,020 seconds
(17 minutes)
700 seconds
(11 minutes, 40 seconds)
945 seconds
(15 minutes, 45 seconds)
Target Met Met Not Met Not Met Not Met Met Met
1 If our receipts are lower than our target, as was the case in FY 2013 and FY 2014, we consider this measure met.

Social Security Administration | Annual Performance Report FY 2016 Page | 11
1.2d BWM: Achieve the target busy rate for National 800 Number calls
Fiscal Year 2011 2012 2013 2014 2015 2016
Performance 3% 5% 11.9% 13.5% 7.5% 8.9%
Target 6% 6% 16% 14% 8% 9.5%
Target Met Met Met Met Met Met Met
Strategic Objective 1.3: Partner with Other Agencies and Organizations to Improve Customers’ Experience and Align with the Administration’s One-Government Approach
1.3a: Minimize the average response time to deliver medical evidence to the VA for wounded warriors and veterans
Fiscal Year 2011 2012 2013 2014 2015 2016
Performance 7.3 calendar days
5.6 calendar days
7.2 calendar days
5.9 calendar days
4.2 business days
3 business days
Target Deliver medical evidence to the
VA within an average of
5 calendar days
Deliver medical evidence to the
VA within an average of 5 business
days
Deliver medical evidence to the
VA within an average of 5 business
days
Target Met Not Met Met Met
Strategic Objective 1.4: Evaluate Our Physical Footprint to Incorporate Improved Service Options
1.4a: Assess field and hearing office lease expirations and increase colocation of our components to reduce our physical footprint
Fiscal Year 2016
Performance Colocated 5 hearing office permanent remote sites with field offices
Target Colocate at least 4 hearing office permanent remote sites with field offices
Target Met Met
Social Security Administration | Annual Performance Report FY 2016 Page | 12
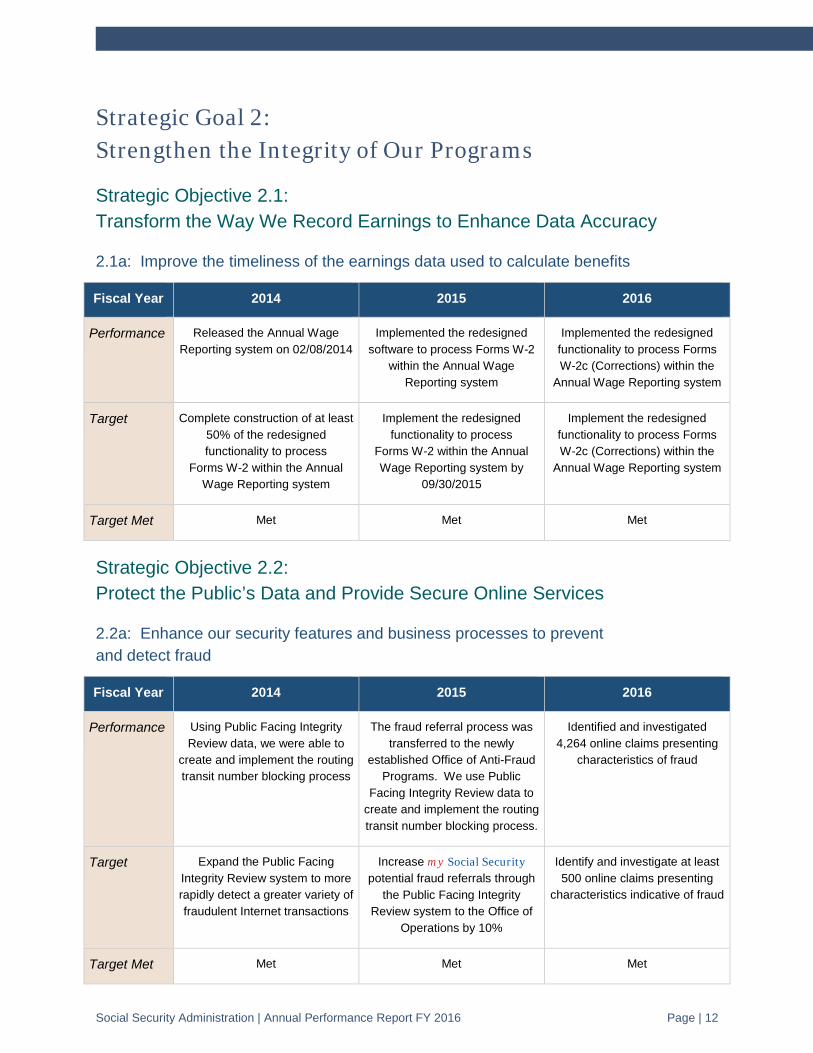
Strategic Goal 2: Strengthen the Integrity of Our Programs
Strategic Objective 2.1: Transform the Way We Record Earnings to Enhance Data Accuracy
2.1a: Improve the timeliness of the earnings data used to calculate benefits
Fiscal Year 2014 2015 2016
Performance Released the Annual Wage Reporting system on 02/08/2014
Implemented the redesigned software to process Forms W-2
within the Annual Wage Reporting system
Implemented the redesigned functionality to process Forms W-2c (Corrections) within the
Annual Wage Reporting system
Target Complete construction of at least 50% of the redesigned functionality to process
Forms W-2 within the Annual Wage Reporting system
Implement the redesigned functionality to process
Forms W-2 within the Annual Wage Reporting system by
09/30/2015
Implement the redesigned functionality to process Forms W-2c (Corrections) within the
Annual Wage Reporting system
Target Met Met Met Met
Strategic Objective 2.2: Protect the Public’s Data and Provide Secure Online Services
2.2a: Enhance our security features and business processes to prevent and detect fraud
Fiscal Year 2014 2015 2016
Performance Using Public Facing Integrity Review data, we were able to
create and implement the routing transit number blocking process
The fraud referral process was transferred to the newly
established Office of Anti-Fraud Programs. We use Public
Facing Integrity Review data to create and implement the routing transit number blocking process.
Identified and investigated 4,264 online claims presenting
characteristics of fraud
Target Expand the Public Facing Integrity Review system to more rapidly detect a greater variety of fraudulent Internet transactions
Increase my Social Security potential fraud referrals through
the Public Facing Integrity Review system to the Office of
Operations by 10%
Identify and investigate at least 500 online claims presenting
characteristics indicative of fraud
Target Met Met Met Met

Social Security Administration | Annual Performance Report FY 2016 Page | 13
Strategic Objective 2.3: Increase Payment Accuracy
2.3a: Maintain a high accuracy rate of payments made through the Old-Age, Survivors, and Disability Insurance program to minimize improper payments
Fiscal Year 2011 2012 2013 2014 2015 2016
Performance 99.7% (O/P)
99.9% (U/P)
99.8% (O/P)
99.9% (U/P)
99.8% (O/P)
99.9% (U/P)
99.5% (O/P)
99.9% (U/P)
99.6% (O/P)
99.9% (U/P)
Data not available until
July 2017
Target 99.8% (O/P)
99.8% (U/P)
99.8% (O/P)
99.8% (U/P)
99.8% (O/P)
99.8% (U/P)
99.8% (O/P)
99.8% (U/P)
99.8% (O/P)
99.8% (U/P)
Target Met Not Met (O/P)
Met (U/P)
Met (O/P)
Met (U/P)
Met (O/P)
Met (U/P)
Not Met (O/P)
Met (U/P)
TBD
2.3b APG: Improve the integrity of the Supplemental Security Income program by ensuring that 95 percent of our payments are free of overpayment
Fiscal Year 2011 2012 2013 2014 2015 2016
Performance 92.7% accuracy rate
93.7% accuracy rate
92.4% accuracy rate
93% accuracy rate
93.9% accuracy rate
Data not available until
July 2017
Target 93.3% accuracy rate
95% accuracy rate
95% accuracy rate
95% accuracy rate
95% accuracy rate
95% accuracy rate
Target Met Not Met Not Met Not Met Not Met Not Met TBD
2.3c BWM: Complete the budgeted number of full medical continuing disability reviews
Fiscal Year 2011 2012 2013 2014 2015 2016
Performance 345,495 443,233 428,568 525,875 799,013 853,754
Target 435,000 422,000 510,000 790,000 850,000
Target Met Met Met Met Met Met

Social Security Administration | Annual Performance Report FY 2016 Page | 14
2.3d BWM: Complete the budgeted number of Supplemental Security Income non-medical redeterminations
Fiscal Year 2011 2012 2013 2014 2015 2016
Performance 2,456,830 2,624,170 2,634,183 2,627,518 2,266,993 2,530,446
Target 2,422,000 2,622,000 2,622,000 2,622,000 2,255,000 2,522,000
Target Met Met Met Met Met Met Met
FY 2016 52-week performance: 2,504,652

Social Security Administration | Annual Performance Report FY 2016 Page | 15
Strategic Goal 3: Serve the Public through a Stronger, More Responsive Disability Program
Strategic Objective 3.1: Improve the Quality, Consistency, and Timeliness of Our Disability Decisions
3.1a: Ensure the quality of our decisions by achieving the disability determination services decisional accuracy rate for initial disability decisions
Fiscal Year 2011 2012 2013 2014 2015 2016
Performance 98% decisional accuracy
98% decisional accuracy
98% decisional accuracy
98% decisional accuracy
98% decisional accuracy
98% decisional accuracy
Target 97% decisional accuracy
97% decisional accuracy
97% decisional accuracy
97% decisional accuracy
97% decisional accuracy
97% decisional accuracy
Target Met Met Met Met Met Met Met
3.1b: Increase our ability to provide timely decisions by reducing the percentage of pending Appeals Council requests for review 365 days or older
Fiscal Year 2012 2013 2014 2015 2016
Performance 88% 91.1% 84% 82% 83%
Target 80% of cases pending less
than 365 days
81% of cases pending less
than 365 days
79% of cases pending less
than 365 days
80% of cases pending less
than 365 days
81% of cases pending less
than 365 days
Target Met Met Met Met Met Met
FY 2016 52-week performance: 82% of cases pending less than 365 days

Social Security Administration | Annual Performance Report FY 2016 Page | 16
3.1c APG: Improve customer service by reducing the wait time for a hearing decision
Fiscal Year 2016
Performance 98%
Target Decide 99% of the cases that begin the fiscal year at 430 days old or older
Target Met Not Met
FY 2016 52-week performance: 97%
3.1d BWM: Complete the budgeted number of initial disability claims
Fiscal Year 2011 2012 2013 2014 2015 2016
Performance 3,390,936 3,206,869 2,987,883 2,861,895 2,759,432 2,688,977
Target 3,273,000 3,173,000 2,962,000 2,947,000 2,767,000 2,695,000 (2,637,755
rec’d)
Target Met Met Met Met Not Met Not Met Met2
3.1e BWM: Complete the budgeted number of disability reconsideration claims
Fiscal Year 2011 2012 2013 2014 2015 2016
Performance 828,010 808,521 803,194 757,198 723,485 666,948
Target 787,000 787,000 778,000 739,000 702,000 (647,910 rec’d)
Target Met Met Met Not Met Not Met Met3
2 We based our FY 2016 performance on actual receipts. Since actual receipts were lower than the FY 2016 target, we consider this measure met. 3 We based our FY 2016 performance on actual receipts. Since actual receipts were lower than the FY 2016 target, we consider this measure met.

Social Security Administration | Annual Performance Report FY 2016 Page | 17
3.1f BWM: Complete the budgeted number of hearing requests
Fiscal Year 2011 2012 2013 2014 2015 2016
Performance 795,424 820,484 793,580 680,963 663,129 652,241
Target 815,000 875,000 793,000 735,000 727,000 703,000
Target Met Not Met Not Met Met Not Met Not Met Not Met
FY 2016 52-week performance: 637,472
3.1g BWM: Average processing time for initial disability claims
Fiscal Year 2011 2012 2013 2014 2015 2016
Performance 109 days 102 days 107 days 110 days 114 days 110 days
Target 118 days 111 days 109 days 109 days 109 days 113 days
Target Met Met Met Met Not Met Not Met Met
3.1h BWM: Average processing time for reconsiderations
Fiscal Year 2014 2015 2016
Performance 108 days 113 days 103 days4
Target
Target Met
4 We began tracking actual data in September 2013 in order to establish a baseline.

Social Security Administration | Annual Performance Report FY 2016 Page | 18
3.1i BWM: Average processing time for hearing decisions
Fiscal Year 2011 2012 2013 2014 2015 2016
Performance 360 days 353 days 396 days (September
only)
422 days 480 days 545 days
Target 373 days 321 days 389 days (September
only)
415 days 470 days 540 days
Target Met Met Not Met Not Met Not Met Not Met Not Met
FY 2016 52-week performance: 543 days
Strategic Objective 3.2: Maximize Efficiencies throughout the Disability Program
3.2a: Improve the disability determination process by increasing the percentage of initial disability claims using electronically transmitted health records and medical evidence (Health IT)
Fiscal Year 2014 2015 2016
Performance 3% (84,779 initial claims)
6.1% (167,626 initial claims)
9.6% (257,743 initial claims)
Target 2.5% of processed initial disability claims with Health IT
medical evidence (75,000 initial claims)
6% of processed initial disability claims with Health IT medical
evidence (164,820 initial claims)
8% of processed initial disability claims with electronically
transmitted health records and medical evidence (Health IT)
(222,000 initial claims)
Target Met Met Met Met

Social Security Administration | Annual Performance Report FY 2016 Page | 19
Strategic Objective 3.3: Enhance Employment Support Programs and Create New Opportunities for Returning Beneficiaries to Work
3.3a: Increase the number of beneficiaries returning to work by achieving the target number of Social Security Disability Insurance and Supplemental Security Income disability beneficiaries with Tickets assigned and in use, who work above the trial work level
Fiscal Year 2015 2016
Performance 58,341 beneficiaries 62,831 beneficiaries
Target 50,000 beneficiaries 55,000 beneficiaries
Target Met Met Met

Social Security Administration | Annual Performance Report FY 2016 Page | 20
Strategic Goal 4: Build a Model Workforce to Deliver Quality Service
Strategic Objective 4.1: Attract and Acquire a Talented and Diverse Workforce that Reflects the Public We Serve
4.1a: Continue to serve as a model agency for employment of individuals with targeted disabilities
Fiscal Year 2011 2012 2013 2014 2015 2016
Performance 1.9% 1.9% 1.9% 2% 2% 2%
Target 2% 2% 2% 2% 2%
Target Met Not Met Not Met Met Met Met
Strategic Objective 4.2: Strengthen the Competency, Agility, and Performance of Our Workforce to Align with the Needs of the Public
4.2a: Enhance workforce knowledge, skills, and abilities to achieve organizational goals by increasing employee satisfaction with training and development
Fiscal Year 2011 2012 2013 2014 2015 2016
Performance 62% 59% 55% 57% 59% 57%
Target 60% employee satisfaction
rating
61% employee satisfaction
rating
Target Met Not Met Not Met

Social Security Administration | Annual Performance Report FY 2016 Page | 21
Strategic Objective 4.3: Foster an Inclusive Culture that Promotes Employee Well-Being, Innovation, and Engagement
4.3a: Become one of the Top 5 Best Places to Work among large agencies in the Federal Government
Fiscal Year 2011 2012 2013 2014 2015 2016
Performance Top 10 Ranking Top 10 Ranking Top 10 Ranking Top 10 Ranking Top 10 Ranking Ranked 9th
Target Achieve a Top 10 Ranking
Achieve a Top 10 Ranking
Achieve a Top 5 Ranking
Target Met Met Met Not Met
4.3b: Increase employee engagement as measured by the employee engagement index score
Fiscal Year 2011 2012 2013 2014 2015 2016
Performance 72% 69% 67% 66% 68% 67%
Target 69%
Target Met Not Met
Strategic Objective 4.4: Enhance Planning and Alignment of Human Resources to Address Current and Future Public Service Needs
4.4a: Expand use of data to support workforce planning, program evaluation, and decision-making
Fiscal Year 2014 2015 2016
Performance 77% 83% 54%
Target Achieve 75% of the human capital metrics
Achieve 75% of the human capital metrics
Achieve 78% of the human capital metrics
Target Met Met Met Not Met

Social Security Administration | Annual Performance Report FY 2016 Page | 22
Strategic Goal 5: Ensure Reliable, Secure, and Efficient Information Technology Services
Strategic Objective 5.1: Maintain System Performance and the Continuity of Information Technology Services
5.1a: Provide uninterrupted access to our systems during scheduled times of operation
Fiscal Year 2011 2012 2013 2014 2015 2016
Performance 99.89% 99.9% 99.96% 99.97% 99.96% 99.91%
Target 99.5% availability
99.5% availability
99.5% availability
99.5% availability
99.5% availability
Target Met Met Met Met Met Met
Strategic Objective 5.2: Enhance and Execute Plans to Modernize Our Systems
5.2a: Improve customer service by using information technology to provide new online service to users of my Social Security
Fiscal Year 2016
Performance On November 28, 2015, SSA implemented the Internet Social Security Number Replacement Card (iSSNRC) service behind the
my Social Security portal. This new service authenticates users against SSA records, verifies user Driver License and Identification cards against state records, and verifies user addresses against credit reporting agency data. After passing authentication and verification, the card requests are
sent to our new in-line fraud review process where they must pass a series of fraud checks before the cards are issued.
Target Implement new anti-fraud and authentication capabilities to enable customers to obtain replacement Social Security cards securely through the
my Social Security portal
Target Met Met

Social Security Administration | Annual Performance Report FY 2016 Page | 23
Strategic Objective 5.3: Incorporate Innovative Advances in Service Delivery
5.3a: Enhance our IT infrastructure by incorporating innovative advances in service delivery
Fiscal Year 2014 2015 2016
Performance Bandwidth-on-Demand capabilities are operational at
over 75% of agency sites
Reduced our open systems infrastructure size to
1,000 servers
Released iSSNRC in November 2015 and released a new service to check the status of an application or appeal in
March 2016
Target Implement Bandwidth-on-Demand, which will provide the
ability to increase telecommunications capacity to
quickly meet the changing service needs of our offices and
clients
Reduce open systems infrastructure size from
1,500 servers to 1,000 servers by September 2015
Deploy new applications with a modern look and feel, accessible
from the web or on mobile devices
Target Met Met Met Met
Strategic Objective 5.4: Continuously Strengthen Our Cyber Security Program
5.4a: Provide secure and effective services to the public by improving cyber security performance
Fiscal Year 2013 2014 2015 2016
Performance Homeland Security Presidential Directive 12 Compliance – result 85%
Information Security Continuous Monitoring –
result 96%
Trusted Internet Connections
Consolidation – result 100%
Trusted Internet Connections 2.0
Capabilities – result 96%
Homeland Security Presidential Directive 12 Compliance – result 87%
Information Security Continuous Monitoring –
result 98%
Trusted Internet Connections
Consolidation –result 100%
Trusted Internet Connections 2.0
Capabilities – result 94%
Hardware Asset Management –
result 100%
Software Asset Management –
result 100%
Vulnerability and Weakness Management
– result 100%
Unprivileged Network Users – result 86%
Privileged Network Users – result 99%
Achieved an average of 100% for the following Cyber Security Cross-Agency Priority Goals:
Hardware Asset Management –
result 100%
Software Asset Management –
result 100%
Vulnerability and Weakness Management
– result 100%

Social Security Administration | Annual Performance Report FY 2016 Page | 24
Fiscal Year 2013 2014 2015 2016
Anti-Phishing Defense – result 100%
Malware Defense – result 100%
Blended Defense – result 100%
Anti-Phishing Defense – result 100%
Malware Defense – result 100%
Blended Defense – result 100%
Target No data
Meet the performance requirements of the
Department of Homeland Security’s Federal Network Security Compliance and
Assurance program and the Cyber Security
Cross-Agency Priority Goals
Meet the performance requirements of the
Department of Homeland Security’s Federal Network Security Compliance and
Assurance program and the Cyber Security
Cross-Agency Priority Goals
Achieve an average of 97% for the following Cyber Security Cross-Agency Priority Goals: anti-phishing defense;
malware defense; blended defense (anti-phishing and malware defense measures);
hardware asset management; software
asset management; and vulnerability and
weakness management
Target Met No data
Met Met Met

Social Security Administration | Annual Performance Report FY 2016 Page | 25
Discontinued Performance Measure Results
2.3a APG: Reduce the percentage of improper payments made under the SSI program
Fiscal Year 2011 2012 2013 2014 2015
Performance 9.1% 8.1% 9.3% 8.5% 7.6%
Target No data No data No data No data
No more than 6.2% of all payments made under the SSI program are improper payments i.e., overpayment and underpayments)
Target Met No data No data No data No data
Not Met

Social Security Administration | April 2017 | Produced at U.S. taxpayer expense
SocialSecurity.gov
Follow the Social Security Administration on our social network
![U.S. Small Business Administration FY 2018-2022 …. SMALL BUSINESS ADMINISTRATION FY 2018-2022 STRATEGIC PLAN October 30, 2017 [Page Left Blank] Table of Contents Message from the](https://cdn.vdocuments.site/doc/165x107/5b0e10677f8b9a2f788ead82/us-small-business-administration-fy-2018-2022-small-business-administration.jpg)


