
NASA-CR-191267
m
ABSOLUTE ABSORPTION CROSS SECTIONS OF OZONE AT
AND ig K AVELENGTH REGION 18S-240nm
# Grant NAGW-1788
Final Reportm
For _he period 1 June 1989 through 31 May 1992
=
Principal Investigator
ffi K. Yoshino. ----±i ............. . - -]
- Co-lnvestlgators
. W_arkinson
............--_.-E. Freeman
_/_____ S_ptember 1992
NatiQnal Aeronautics and Space Administration
Greenbel_ Maryland 20771
As. trp_aI Observatory-- , MA 02138
._J_ - =- =:__ _z_ _-.
Th_ Smithsonian Astrophysical Observatoryis a member of the
_--_2-7-_ ............... Har__ard-Smithsonlan Center for Astrophysics
=
-- "The NASA Technical Officer for this grant is Dr. Igor J. Ebersi:ein,__Code 616, Goddard S_ace Flight Center, Greenbelt, Maryland 20771• ............... -
1
- ......-- ..........:-_ (NASA-CR-191267) ABSOLUTE
.... _...... ABSORPTION CROSS SECTIONS OF OZONE
AT 300 K, 226 K AND 195 K IN THE
WAVELENGTH REGION 185-240 nm Fina|
Report, I Jun. i989 - 3I May I992
(Smithsonian Astrophysic,_]
Observatory) 24 p G_/45
L
N93-I 32/4
Uncl _s
0131689
https://ntrs.nasa.gov/search.jsp?R=19930004086 2019-02-03T18:01:06+00:00Z


Abstract
i
//
//
/
An account is given of progress during the period 10/1/89-5/31/92 of
work on absorption cross section measurements of ozone at 300 K, 228 K and
196 K in the wavelength region 185-240 nm. In this wavelength region, the
penetration of solar radiation into the Earth's atmosphere is controlled by
02 and 0 3 . The transmitted radiation is available to dissociate trace
species such as halocarbons and nitrous oxide. We have recently measured
absolute absorption cross sections of 03 in the wavelength region 240-350
nm [Freeman et al., 1985; Yoshino et at., 1988]. We apply these proven
techniques to the determination of the absorption cross section of 03 at
300 K, 228 K and 195 K throughout the wavelength region 185-240 nm. A
paper titled "Absolute Absorption Cross Section Measurements of Ozone in
the Wavelength Region 185-254 nm and the Temperature Dependence" has been
submitted for publication in the Journal of Geophysical Research.
1. FINAL REPORT FOR THE PERIOD 1/10/89-5/31/92
1.1. The absolute absorption cross section of ozone
The absolute absorption cross section of ozone at fixed wavelengths in
the region 184-245 nm have been measured at 295, 228 and 195 K. The fixed
wavelengths have been selected from atomic lines of Hg I, Cu I and Cu II.
The mercury lamp with thermal control and a special Cu hollow cathode lamp
provide suitable atomic line sources. The absorption cross section of
ozone in the wavelength region 185-250 nm varies from l.lSx10 -17 to 3x10 -19
cm 2. The optical depths measured were restricted to the range In(I0/I )
0.3-2.0 to ensure good accuracy. With this restriction, the whole set of
_cross section measurements can be performed with pressures of 03 in the
range 0.1-11 Torr.

Page 2
ThE-vac-u-um system must be completely free from any contaminants which
............ might destroy ozone. After the vacuum system is ba_ed, ozone is stored for
days to "clean up" the vacuum system. Ozone is prepared from pure oxygen
(Airco grade 4.5 passed through a liquid nitrogen trap) at 78 K in a Tesla
discharge, collected as liquid ozone at 78 K, and purified of residual
oxygen from the oxygen/ozone mixture at 78 K.
Experimental conditions are summarized in Table 1 where the number of
measurements (n), the electric current in hollow cathode lamp (I), and
counting time (T) are listed. The absolute absorption cross sections of
ozone have been measured at 12 wavelengths throughout the region 184--245
nm at 295, 228 and 195 K. The results are listed in Table 2, where values
from Molina and Molina are presented in 6th and 7th column and they are
slightly higher than our present values. Absolute cross section
measurements at five mercury wavelengths (253.6-334.1 nm) from seven
independent workers (see Table 2 of Yoshino 9__ al., 1988) are scattered
within 2.5_ of the averaged values but the values by Mollna and Mollna
(1986) were slightly higher than other measurements.
1.2. The cross sections of ozone in %he wavelength region 180-245 nm
Continuous cross sections of ozone were measured in the wavelength
region 180--245 nm with a hydrogen continuum as background source. A
mercury lamp was also placed behind the hydrogen lamp and provided two Hg
lines at 184.9 and 253.7 nm. These two Hg lines were used for wavelength
calibration. The column density of ozone is expeGted to vary during the
scanning of the entire wavelength region because the vuv radiation destroys
ozone molecules. However the scan over an extended wavelength region is
used to provide only continuous relative cross sections.

Page 3
Table I. Experimental conditions for %he absolute cross section
measurements of ozone a% fixed wavelengths
295K
A
nm
Llne I
mA
T
Sec
Pressure
Torr
184.94918
197.99565200.03459204.4458
212.36503
216.5775
222.6391230.3826235.5735240.40687
244.2378249.2898
11
12
12
12
I0
12
12
15
II
13
6
ii
Hg I
Cu II
Cu II
Cu II
Cu II
Cu I
Cu I
Cu II
Cu I
Cu I
Cu I
Cu I
33
35
353O
2730
32
31
32
30
2O
0.60
2.50
0.80
0.60
0.70
0.25
0.40
2.0
1.5
1.5
0.40
0.12
50x50
100xl00
100xl00
100x100
100xl00
100xl00
50x50
100x100100x100
lOOxlO050x50lOOxlO0
1.50-8.28
2.21-11.15
1.71-10.26
1.29-i0.28
1.15-8.38
0.76-5.16
0.38-2.30
0.23-1.31
0.14-0.91
0.14-0.99
0.15-0.57
0.10-0.65
228K
A
nm
n Line I
mA
T
Sec
PressureTorr
184 94918197 99565200 03459
204 4458212 36503216 5775
222 6391230 3826235 5735240 40687
244 2378249 2898
12
I0
12
9
II
9
13
16
12
II
9
I0
Hg ICu II
Cu II
Cu II
Cu II
Cu I
Cu I
Cu II
Cu I
Cu I
Cu I
Cu I
33
35
35
30
27
30
32
31
32
30
20
0 602 50
0 800 600 70
0 250 402 01 5
1 50.400.12
50x50
I00×I00
lOOxlO0
lOOxlO0
lOOxlO0
lOOxlO0
50x50lOOxlO0100x100lOOxlO0
50x50100x100
1 00-7.04
1 55-7.99
2 14-10.27
1 75-10.02
1 12-4 97
0 67-3 84
0 27-1 88
0 16-1 02
0 15-0 72
0 11-0 75
0 12-0 47
0. I0-0 48

Page 4
195K
A n Line I T Slit
nm mA Sec pm
Pressure
Tort
184.94918 ii Hg I 0.60 50x50
197.99565 12 Cu II 33 2.50 100xl00
200.03459 12 Cu II 35 0.80 100xl00
204.4458 12 Cu II 35 0.60 100x100
212.36503 12 Cu II 30 0.70 100xl00
216.5775 12 Cu I 27 0.25 100x100
222.6391 9 CU I 30 0.40 50x50
230.3826 17 Cu II 32 2.0 I00×I00
235.5735 11 Cu I 31 1.5 100xl00
240.40687 13 Cu I 32 1.5 100x100
244.2378 9 Cu I 30 0.40 50×50
249.2898 11 Cu I 20 0.12 100×100
0.95-6.24
1.55-7.78
1.45-9 97
1.30-9 15
0.98-4 68
0.72-2 43
0.27-1 86
0.13-0 89
0.12-0 66
0.11-0 43
0.11-0 47
0.I0-0 35
Table 2. Absorption cross sections of ozone, in unit of 10-Xcm 2
A, nm x Present* Molina & Molina
2§_K 228K 195K 298K 226K
184.9
185.0 6.54
197.9
198.0 3.35
200.0 3.15
204.4
204.5 3.47
212.3
216.5 1.22
222 5 2.31
222 6
230 3
230 5 4.66
235 5 6.45
240 4
240.5 8.40
244.0 9.72
244.2
244.5 9.75
249.2
249.5 1.112
19 6.2117] 6.23[6] 6.2116]19 6.44
19 3.32[4] 3.32[6] 3.28[7]19 3.33
19 3.1213] 3.04[4] 3.0311] 3.15
19 3.3115] 3.34[5] 3.35[3]19 3.49
19 7.3112] 7.30[3] 7.34[3]
18 1.18[I] 1.1811] 1.1912] 1.24
18 2.33
18 2.26[3] 2.33[4] 2.28[2]
18 4.38[2] 4.43[3] 4.42[6]18 4.68
18 6.1719] 6.18151 6.22[7] 6.48
18 7.98[8] 8.00[5] 8.02[6]18 8.42
18 9.75
18 9.42[6] 9.46[8] 9.5116]
18 9.78
17 1.0712] 1.07[i] 1.07[i]
17 1.121
*The numbers in the brackets are %he estimated error of I¢
in the last digit.

Page 5
The relative values are then normalized to the absolute cross sections that
have been measured accurately at 12 wavelengths (Sec. 1.1). The cross
sections of 03 obtained and calibrated are presented in Fig. I of the
attached preprint where open circles represent the absolute cross sections
from measurements at atomic lines.
Temperature dependence of the cross sections of ozone are negligible.
The absolute cross sections in Table 2 show that temperature variations of
cross sections are within the experimental error and therefore we recommend
to neglect temperature effects on the cross sections of ozone below 254 nm.
2. PUBLICATIONS
2.1 Paper Published and in Press
Absolute Absorption Cross Section Measurements of Ozone in the Wavelength
Region 185-254 nm and the Temperature Dependence, K. Yoshino, J.R.
Esmond, D.E. Freeman and W.H. Parkinson, J. Geophys. Res. submitted
for publication.
2.2 Presentations during the period 10/1/89 - 5/31/92
High Resolution Spectroscopy and Stratrospheric Ozone Problems, Seminar at
Institute of Atomic and Holecuiar Science, Academia Sinica, Taiwan, K.
Yoshino, October 1990.
The Atmospheric Transmittance in UV and VUV Region, Seminar at National
Institute for Environmental Studies, Tsukuba, Japan, K. Yoshino,
November 1990.
The Atmospheric Transmittance in the vuv region, Seminar at The University
of Tokyo, College of Arts and Science, K. Yoshino, November, 1991.

Absolute Absorption Cross Section Measurements of Ozone in the
Wavelength Region 185-254 nm and the Temperature Dependence
K. Yoshino, J.R. Esmond, D.E. Freeman and W.H. Parkinson
Harvard-Smithsonian Center for Astrophysics
60 Garden Street, Cambridge, HA 02138, U.S.A.
Proofs to be mailed to: Dr. K. Yoshino
Harvard-Smithsonian Center for Astrophysics
60 Garden street, MS-50, Cambridge, MA 02138
Proposed Running Head: 03 cross sections in the 185-254 nm
Pages: i0 (text, references and figure captions)
Figures: 2
Tables: 3

Abstract
Laboratory measurements of the relative absorption cross sections of ozone at
the temperatures 195, 228 and 295 K have been made throughout the wavelength
region 185--254 nm. The absolute absorption cross sections at the same
temperatures have been measured at several discrete wavelengths in the region
185-250 nm. The absolute cross sections of ozone have been used to put
relative cross sections on a firm absolute basis throughout the region 185--
255 nm. These recalibrated cross sections are available as numerical
compilations on magnetic tape from the National Space Science Data Center,
NASA/Goddard Space Flight Center, Greenbelt, MD 20771, U.S.A.

Page 2
1. INTRODUCTION
In the wavelength region 185-240 nm, the penetration of solar radiation
into the Earth's atmosphere is controlled by 02 and 03, and the transmitted
radiation is available to dissociate trace species. The Herzberg continuum
absorption of 0_ has its photodissociation threshold at 242.2 nm, and its
maximum cross section of only _7x10 -24 cm 2 occurs near 202 nm; below 202 nm
the absorption cross section of 02 increases rapidly with the onset of the
predissociafed Schumann-Runge bands. Coincidentally, the absorption minimum,
_3xlO -19 cm 2, of 03 occurs also near 202 nm, and the absorption by 03
increases towards shorter and longer wavelengths. The ratio of the cross
sections, a(03)/_(02), approximately doubles for each 5 nm increase in
wavelength between 205 and 240 nm, being about 5x10⁴ at 205 nm and 8x10⁶ at
240 nm. In the region 200-240 nm, both 02 and 03 play a joint critical role
in atmospheric absorption, whereas 03 becomes the principal absorber at
240-350 nm and 02 at 100-200 nm.
The recommended cross sections of the World Meteorological Organization
[WMO, 1986] were based on Tanaka 9__ el. [1953 I for the region 175-200 nm, and
on Inn and Tanaka [1953] for the region 200-240 nm. In WMO [1986], it is
stated that the results of Inn and Tanaka [1953 I are supported by DeMore and
Raper [1964] and by Griggs [1968]. In fact, near the minimum in the cross
section at _202 nm, the results of Inn and Tanaka are _30_ higher than those
of Griggs; the results of DeMore and Raper are, on the average,
systematically _2_ higher than those of Inn and Tanaka. The only cross
section measurements below 240 nm published in the last twenty years are those
of Molina and Molina [1986], and they give results at room temperature and at
226 K, an atmospherically significant temperature.
Page 3
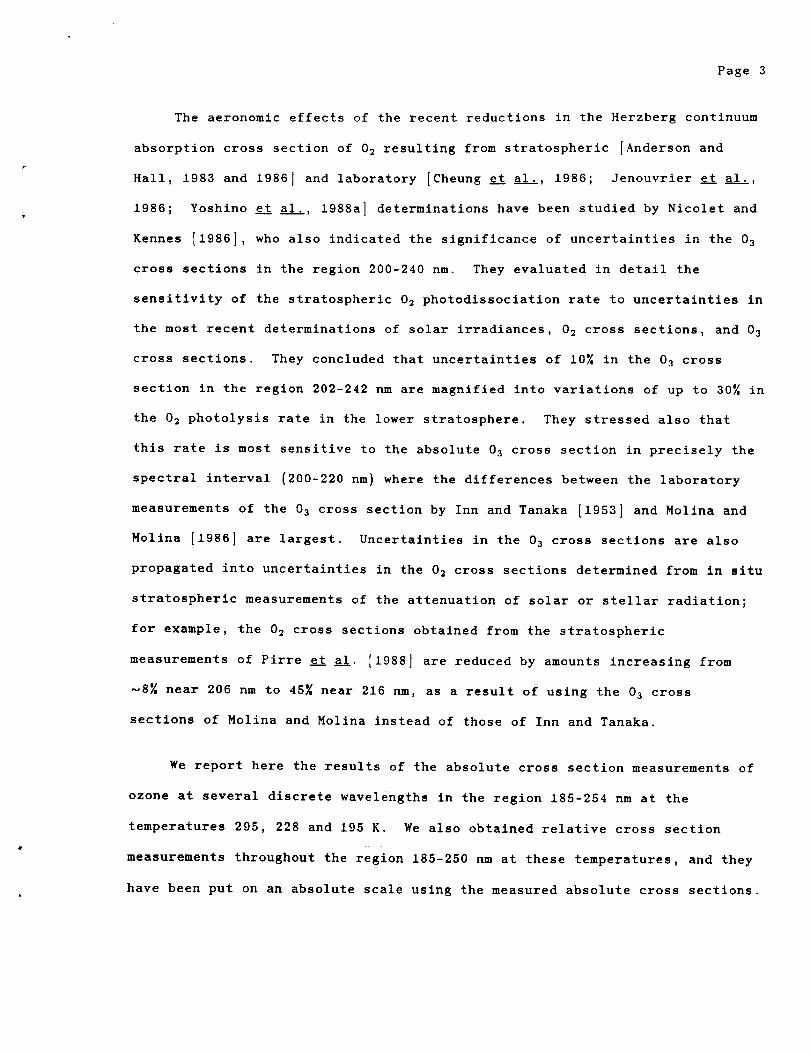
The aeronomic effects of the recent reductions in the Herzberg continuum
absorption cross section of 02 resulting from stratospheric [Anderson and
Hall, i983 and i986] and laboratory [Cheung et al., i986; Jenouvrier et al.,
i986; Yoshino et al., i988a] determinations have been studied by Nicolet and
Kennes [i986], who also indicated the significance of uncertainties in the 03
cross sections in the region 200-240 nm. They evaluated in detail the
sensitivity of the stratospheric 02 photodissociation rate to uncertainties in
the most recent determinations of solar irradiances, 02 cross sections, and 03
cross sections. They concluded that uncertainties of 10% in the 03 cross
section in the region 202-242 nm are magnified into variations of up to 30% in
the 02 photolysis rate in the lower stratosphere. They stressed also that
this rate is most sensitive to the absolute 03 cross section in precisely the
spectral interval (200-220 nm} where the differences between the laboratory
measurements of the 03 cross section by Inn and Tanaka [1953] and Molina and
Molina [1986] are largest. Uncertainties in the 03 cross sections are also
propagated into uncertainties in the 02 cross sections determined from in situ
stratospheric measurements of the attenuation of solar or stellar radiation;
for example, the 02 cross sections obtained from the stratospheric
measurements of Pirre et al. [1988] are reduced by amounts increasing from
_8% near 206 nm to 45% near 216 rim, as a result of using the 03 cross
sections of Molina and Molina instead of those of Inn and Tanaka.
We report here the results of the absolute cross section measurements of
ozone at several discrete wavelengths in the region 185-254 nm at the
temperatures 295, 228 and 195 K. We also obtained relative cross section
measurements throughout the region 185-250 nm at these temperatures, and they
have been put on an absolute scale using the measured absolute cross sections.

Page 4
2. EXPERIMENTAL PROCEDURE
The general experimental arrangement has already been described in a
previous paper [Yoshino e_! al., 1988b]. Ozone is prepared from pure oxygen
(Airco grade 4.5 passed through a liquid nitrogen trap) at 78 K in a Tesla
discharge, by collecting liquid ozone at 78 K. It is purified by pumping off
residual oxygen from the oxygen/ozone mixture at 78 K. The absorption cell is
directly connected to the exit slit assembly of a 0.3 m Czerny-Turner vacuum
monochromator equipped with a 1600 line mm -I grating. The instrumental width
(FWHM) is 0.195 nm with entrance and exit slits widths of 0.i0 mm. A Spacom
integrated detector [Yoshino e% al., 1980] with a EMR 541F photomultiplier is
mounted at the other end of the absorption cell without further optical
elements. The entire ozone column, with optical path length 10 cm, is cooled
to 228 or 195 K by immersing the cell in stirred methanol which is cooled by a
cold finger and controlled thermally within ±0.5 K. The hollow cathode or
mercury lamps directly connected to the spectrometer are used as background
line sources for the absolute cross section measurements at the selected
wavelengths. In the scan mode, the background continuum is provided by a
hydrogen discharge lamp, and a mercury lamp located behind the hydrogen lamp
is used for wavelength calibration.
2.1 The measurements at fixed wavelengths.
The absolute absorption cross section of ozone at fixed wavelengths in
the region 184-250 nm have been measured at 295 K, 228 K and 195 K. The 12
fixed wavelengths have been selected from atomic lines of Hg I, Cu I and Cu
II. That the selected lines are free from any other lines within the
resolution of the 0.3 m Czerny-Turner vacuum monochromator has been confirmed
by high resolution spectra from our 6.65-m spectrograph. The mercury lamp
with thermal control and a special Cu hollow cathode lamp provide suitable
Page 5
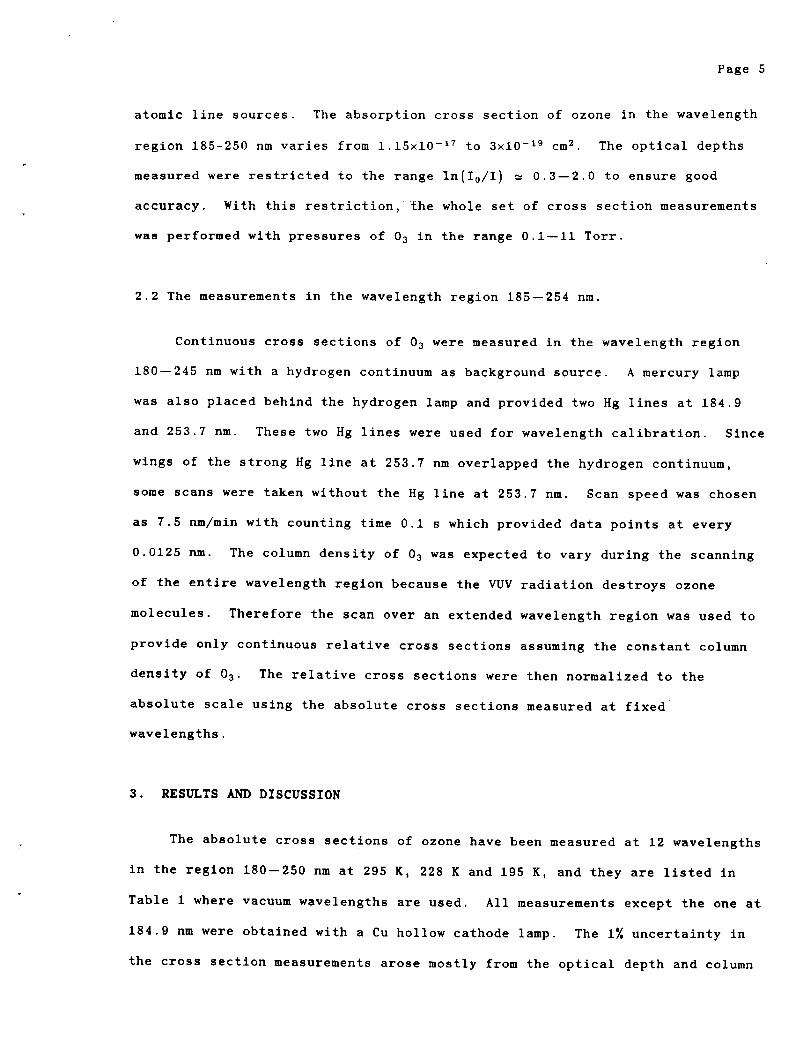
atomic line sources. The absorption cross section of ozone in the wavelength
region 185-250 nm varies from 1.15x10 -17 to 3x10 -19 cm 2. The optical depths
measured were res±ricted to the range In(I0/I ) _ 0.3--2.0 to ensure good
accuracy. With this restriction, the whole set of cross section measurements
was performed with pressures of 03 in the range 0.i--Ii Torr.
2.2 The measurements in the wavelength region 185--254 nm.
Continuous cross sections of 03 were measured in the wavelength region
180--245 nm with a hydrogen continuum as background source. A mercury lamp
was also placed behind the hydrogen lamp and provided two Hg lines at 184.9
and 253.7 nm. These ±wo Hg lines were used for wavelength calibration. Since
wings of the strong Hg line at 253.7 nm overlapped the hydrogen continuum,
some scans were taken without the Hg line at 253.7 nm. Scan speed was chosen
as 7.5 nm/min with counting time 0.1 s which provided data points at every
0.0125 nm. The column density of 03 was expected to vary during the scanning
of the entire wavelength region because the VUV radiation destroys ozone
molecules. Therefore the scan over an extended wavelength region was used to
provide only continuous relative cross sections assuming the constant column
density of 03 . The relative cross sections were then normalized to the
absolute scale using the absolute cross sections measured at fixed
wavelengths.
3. RESULTS AND DISCUSSION
The absolute cross sections of ozone have been measured at 12 wavelengths
in the region 180--250 nm at 295 K, 228 K and 195 K, and they are listed in
Table 1 where vacuum wavelengths are used. All measurements except the one at
184.9 nm were obtained with a Cu hollow cathode lamp. The I_ uncertainty in
the cross section measurements arose mostly from the optical depth and column

Page 6
density measurements. Another possible source of error is the purity of ozone
which we assumed to be I00_ pure to obtain the column density. If ozone is
not pure, our measured cross sections will be lower limits as discussed in the
previous paper [Yoshino e_!tal____.,1988b].
The cross sections of 03 obtained in the scan mode at temperatures 295 K,
228 K, and 195 K are presented in Fig. 1 where open circles represent the
absolute cross sections from measurements at atomic lines mentioned above.
The cross sections at 195 K were extended toward longer wavelength with the
previous high resolution data [Freeman et al., 1984; Yoshino e_!t al., 1988b],
which is recalibrated by the present absolute cross sections between 240 and
254 nm. Some weak structures around 250 nm are shown in the high resolution
scan at 195 K, but these might be distorted in the low resolution scans at 228
K and 295 K. Analogous cross section data in numerical form are available for
every 0.013 nm ( 2-4 cm -1) by request. Cross sections for every 0.5 nm are
given in Table 2 where cross sections of Molina and Molina [1986] are also
presented for comparison. Our cross sections at room temperature are 2_5
smaller than those of Mollna and Molina [1986 I .
In atmospheric modeling, usage of the averaged cross sections over 500
cm-* range has been standard, [WMO, 1986] and Table 3 presents such averaged
cross sections of 03 in 185-254 nm range along with those of Molina and Molina
[1986] and WMO [1986]. Molina noticed that the largest discrepancy of 10_
between WMO values and theirs occurs around 210 nm. WMO values are based on
the results of Inn and Tanaka [1953; 1959] and their results agree with the
later measurements by Griggs [1968]. Considering the relatively large
experimental uncertainty of the old works, Molina and Molina concluded this
was reasonable agreement. Averaged cross sections at 295 K in Table 3 are
plotted in Fig. 2 against spectral interval (see Table 7-4 in WM0). WMO
values represented by small dots are lower around the spectral interval 20 as

Page 7
mentioned by Molina and Molina, but also they are high around the spectral
interval 12. Our values, represented by a solid line, agree reasonably with
those of Molina and Molina (broken line), but are slightly lower around the
spectral interval 30. WM0 values might show a slight shift due to the
wavelength calibration around 200 nm region. Our values around 235 nm are
lower than others but agree well in other wavelength regions.
The temperature dependences of the cross sections of ozone are
negligible. The absolute cross sections in Table I show that temperature
variations of cross sections are within the experimental error. Molecular
absorption at the shorter wavelengths depends mostly on the transitions from
the lowest ground vibrational levels. Therefore, temperature effects can be
expected only from the variations of rotational populations with temperature,
and they make very minor contributions to the total cross section. Below 254
nm, we recommend neglect of temperature effects on the cross sections of ozone
within present experimental accuracy.
The new measurements of cross sections ozone below 250 nm are slightly
lower than the those of Molina and Molina [1988]. As discussed in previous
work [Yoshino et al., 1988b], the cross sections of Molina and Mollna are
always higher than any other results. Differences are within a few percent
and would not be significant in atmospheric applications.
ACKNOWLEDGMENTS
This work reported was supported by the NASA Upper Atmospheric Research
Program under Grant No. NAGW-1788 %o the Smithsonlan Astrophysical
Observatory.

Page 8
References:
Anderson, G.P. and L.A. Hall, Attenuation of Solar Irradiation in the
Stratosphere: Spectrometer Results Between 191 and 207 nm, J. Geophys.
Res. 8g, 6801-6806, 1983.
Anderson, G.P. and L.A. Hall, Stratospheric Determination of 02 Cross Sections
and Photodissociation Rate Coefficients: 191-215 nm, J. Geophys. Res. 91,
14509-14514 1986.
Cheung, A.S.-C., K. Yoshino, W.H. Parkinson, S.L. Cuberman, and D.E. Freeman,
Absorption Cross Section Measurements of 02 in the Wavelength Region
195-241 nm of the Herzberg Continuum, Planet. Space Sci. 34, 1007-1021,
1986.
DeMore, W.B. and 0. Raper, Hartley Band Extinction Coefficients of Ozone in
the Gas Phase and in Liquid Nitrogen, Carbon Monoxide, and Argon, J.
Phys. Chem. 68, 412-414, 1964.
Freeman, D.E., K. Yoshlno, J.R. Esmond, and W.H. Parkinson, High Resolution
Absorption Cross Section Measurements of Ozone at 195 K in the Wavelength
Region 240-350 nm, Planet. Space Sci. 32, 239-248, 1984.
Griggs, M., Absorption Coefficients of Ozone in the Ultraviolet and Visible
Regions, J. Chem. Phys. 49, 857-859, 1968.
Inn, E.C. and Y. Tanaka, Absorption Coefficients of Ozone in the Ultraviolet
and Visible Regions, J. Opt. Soc. Am. 43, 870-873, 1953.
Inn, E.C. and Y. Tanaka, Ozone Absorption Coefficients in the Visible and
Ultraviolet Regions, Ozone Chemistry and Technology, Advances in
Chemistry Series 21, 263-268, American chemical Society, Washington,
D.C., 1959.
Jenouvrier, A., B. Coquart, and M.F. Merienne, Long Pathlength Measurements of
Oxygen Absorption Cross Sections in the Wavelength Region 205-240 nm, J.
Quant. Spectros. Radiat. Transfer 36, 349-354, 1986.
Molina, L.T. and M.J. Molina, Absolute Cross Sections of Ozone in the 185 to
350 nm Wavelength Range, J. Geophys. Res. 91, 14,501-14,507, 1986.
Nicolet, M. and R. Kennes, Aeronomic Problems of the Molecular Oxygen
Photodissociation. I. The 02 Herzberg Continuum, Planet. Space Sci. 36,
1043-1059, 1986.
Pirre, M., P. Rigaud, and D. Huguenin, In-Situ Measurements of the Absorption
Cross-Sections of 02 in the Herzberg Continuum: The Results of Two
Different Experiments, Ann. Geophysicae 6, 535-540, 1988.
Tanaka, Y, E.C. Inn, and K. Watanabe, Absorption Coefficients of Gases in the
Vacuum Ultraviolet. Part IV. Ozone, J. chem. Phys. 21, 1651-1653, 1953.
World Meteorological Organization, Atmospheric Ozone 1985, Global Ozone
Research and Monitoring Project, Report No. 16, 1986.

Page 9
Yoshino, K., D.E. Freeman, and W.H. Parkinson, Photoelectric Scanning (6.65 m)
Spectrometer for VUV Cross-Section Measurements, Appl. Opt. 19, 86-71,
1980.
Yoshino, K., A.S.-C. Cheung, J.R. Esmond, W.H. Parkinson, D.E. Freeman, S.L.
Guberman, A. Jenouvrier, B. Coquart, and M.F. Merienne, Improved
Absorption Cross Sections of Oxygen in the Wavelength Region 205-240 nm
of the Herzberg Continuum, Planet. Space Sci. 38, 1469-1475, 1988a.
Yoshino, K., D.E. Freeman, J.R. Esmond, and W.H. Parkinson, Absolute
Absorption Cross-Sectlon Measurements of Ozone in the Wavelength Region
238-335 nm and the Temperature Dependence, Planet. Space Sci. 36,
395-398, 1988b.

Page i0
Figure Captions
Fig. 1. The cross sections of 03 in the wavenumber range 39,000--54,000
cm -I Open circles are the absolute cross sections measured with Cu-
and Hg-line sources. Cross sections at 195 K are extended to longer
wavelengths using the previous values obtained with high resolution
[Yoshino et al., 1988b].
Fig. 2. The averaged cross sections on the 500 cm -I grid are plotted against
the spectral interval (see Table 3 or Table 7-4 of WH0, 1986). Solid
line refers to the present values, broken line to Molina and Molina
[1986], and small dots to WMO [1986].
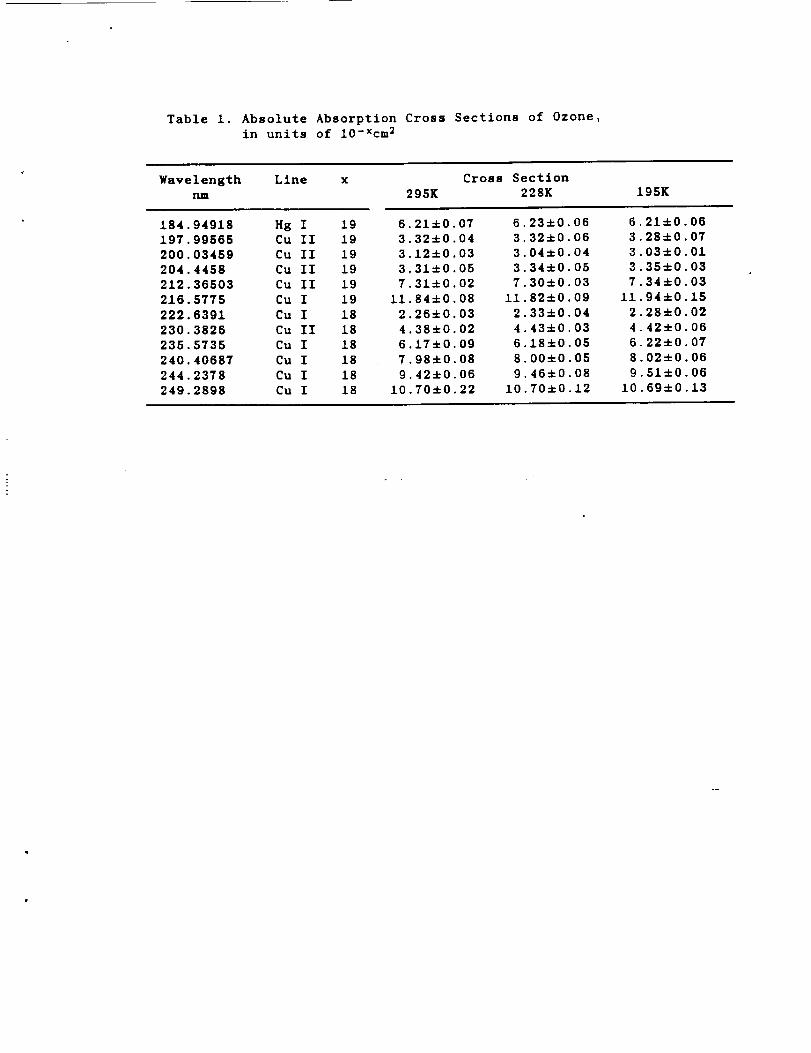
Table 1. Absolute Absorption Cross Sections of Ozone,
in units of 10-Xcm 2
Wavelength Line x Cross Section
nm 295K 228K
£84,94918
£97 99565
200 03459
204 4458
212 36503
216 5775
222 6391
230.3826
235.5735
240.40687
244.2378
249.2898
Hg I 19 6.21±0.07 6.23±0.06 6.
Cu II 19 3.32±0,04 3.32±0.06 3.
Cu II 19 3.12±0.03 3.04±0.04 3.
Cu II 19 3.31±0.05 3.34_0.05 3.
Cu II 19 7.31±0.02 7.30±0.03 T.
Cu I 19 11.84_0.08 11.82±0.09 ii.
Cu I 18 2.26±0.03 2.33±0.04 2.
Cu II 18 4.38±0.02 4.43±0.03 4.
Cu I 18 6.17±0.09 6.18±0.05 6.
Cu I 18 7.98±0.08 8.00±0.05 8.
Cu I 18 9.42±0.06 9.46±0.08 9.
Cu I 18 10.70±0.22 10.70±0.12 10.
195K
21+0.06
28±0.07
03±0.01
35±0.03
34±0.03
94±0.15
28±0.02
42±0.06
22±0.07
02±0.06
51±0.06
69±0.13
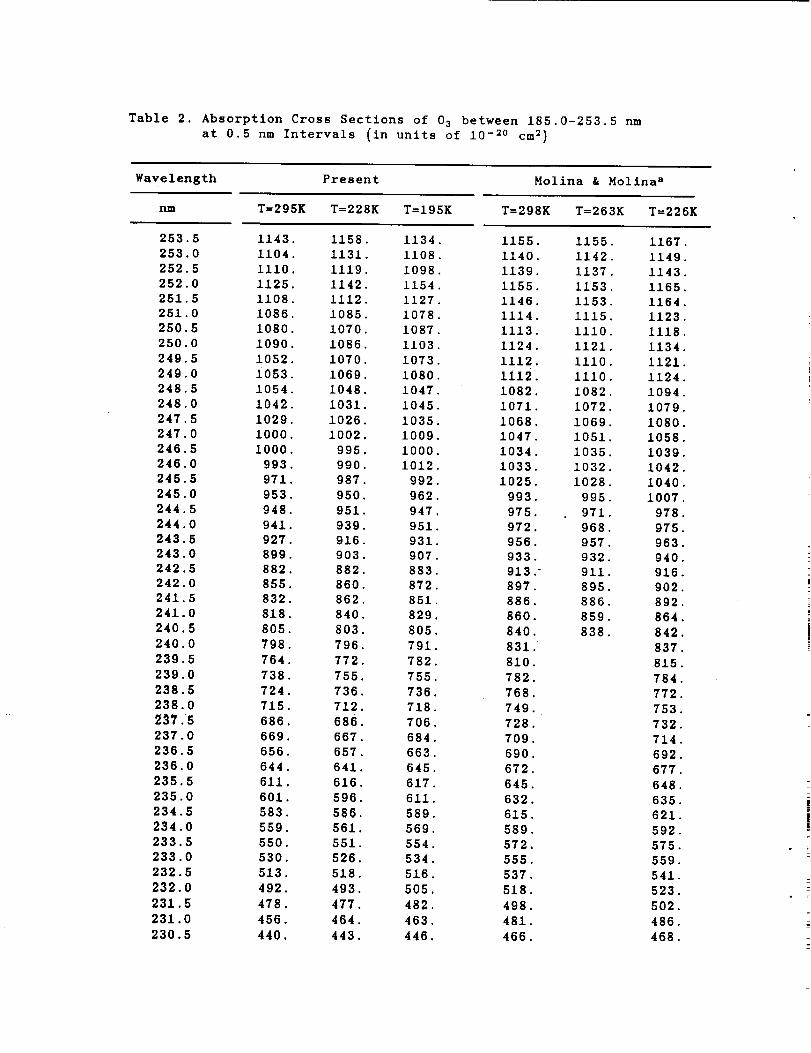
Table 2. Absorption Cross Sections of 03 between 185.0-253.5 nm
at 0.5 nm Intervals (in units of 10 -20 cm 2)
Wavelength Present Molina & Hollna a
rum T=295K T=228K T=195K T=298K T=263K T=226K
253.5
253.0
252.5
252,0
251.5
251.0
250.5
250.0
249.5
249.0
248.5
248.0
247.5
247.0
246.5
246.0
245.5
245.0
244.5
244.0
243.5
243.0
242.5
242.0
241.5
241.0
240.5
240.0
239.5
239.0
238.5
238.0
237.5
237.0
236.5
236.0
235.5
235.0
234.5
234.0
233.5
233.0
232.5
232.0
231.5
231.0
230.5
1143.
1104
1110
1125
1108
1086
1080
1090
1052
1053
1054
1042
1029.
1000.
1000.
993.
971
953
948
941
927
899
882
855
832
818
805
798
764
738.
724.
715.
686
669
656
644
611
601
583
559
550
530
513.
492.
478.
456.
440.
1158
1131
1119
1142
1112
1085
1070
1086.
1070.
1069.
1048.
1031.
1026.
1002.
995
990
987
950
951
939
916
903
882
860
862
840
803
796.
772.
755.
736
712
686
667
657
641
616
596
586
561.
551.
526
518
493
477
464
443
1134.
1108.
1098.
1154.
1127
1078
1087
1103
1073
1080
1047
1045
1035
1009
1000
1012
992
962
947
951.
931.
907.
883.872,
851.
829
805
791
782
755
736
718
706
684
663
645.
617.
611.
589.
569.
554.
534.
516.
505.
482.
463.
446.
1155
1140
1139
1155
1146
1114
1113
1124
1112
1112.
1082.
1071.
1068.
1047
1034
1033
1025
993
975
972
956
933
913
897
886
860
840
831
810
782.
768.
749.
728
709
690
672
645
632
615
589
572
555
537.
518.
498.
481.
466.
1155
1142
1137
1153
1153
1115
Iii0
1121
1110
1110
1082.
1072.
1069.
1051.
1035.
1032.
1028
995
971
968
957
932
911
895
886
859
838
1167
1149
1143
1165
1164
1123
1118
1134.
1121.
1124.
1094
1079
1080
1058
1039
1042
1040
1007
978
975
963
940
916
902
892
864
842
837
815.
784
772
753
732
714
692
677
648
635
621
592
575.
559.
541.
523.
502.
486.
468.

230 0229 5229 0
228 5
228 0
227 5
227 0
226 5
226 0
225 5
225 0
224 5
224 0
223 5
223 0
222 5
222 0
221 5
221 0
220 5
220 0
219 5
219 0
218 5
218 0
217 5
217 0
216 5
216 0
215 5
215 0
214 5
214 0
213 5
213 0
212 5
212 0
211 5
211.0
210.5
210.0
209.5
209.0
208 5
208 0
207 5
207 0
206 5
206 0
205 5
205 0
204.5
204.0
203.5
203.0
423.
414.
397.
381.
366.
357.
340.
330.
312.
298.6
288.3
276.3
261.8
247.8
236 0
222 9
210 5
201 6
190 2
180 3
174 4
163 4
155 1
145 7
139 8
131 7
124 8
117 3
110 5
106 0
98 6
93 4
87 6
83.9
78.4
73.9
69.7
66.0
63.2
59.5
55.7
53.4
50.9
48.3
46.0
43.7
41.4
39.6
37.3
36.0
34.7
33.5
32.9
32.7
31.6
426
411
396
379
365
349
334
330
314
305.
292.0
277.0
265.8
258.3
244.7
231.6
219.0
208.4
194.7
184.3
173.6
164.7
155.3
146.8
137.2
130.3
122.0
116.3
109.4
102.1
96.4
91.5
86.1
81.6
77.4
74.5
69.0
65.3
62.3
58.8
55.2
52.1
49.3
46.5
44.8
43.1
41.8
39.1
37.7
36.0
35.3
33.8
32.8
31.6
31.8
428
414
402
385
368
353
338
326
310
296.1
285.4
273.3
261.9
250.5
236.7
224.6
214.6
206.7
193.4
185.8
175.9
167.0
157.1
148.3
141.5
132.5
125.4
118.2
111.2
105.3
99.2
93.6
87.6
83.2
79.5
74.7
69.0
65.2
62.1
58.0
55.5
52.4
49.4
47.4
44.3
42.5
40.6
38.7
37.1
35 9
34 1
33 4
32 2
31 4
30 9
448
432
414
398
383
367
351
337.
323.
308.
294.3
280.9
268.4
254.8
242.9
231.2
22O. 0
209.0
198,2
188 8
178 5
169 4
160 1
152 0
143 9
136 2
128 7
121 5
114 6
108 1
102 3
96 4
91 0
85 7
81 0
76 4
71 9
68 0
64.0
60.6
57.2
54.1
51.2
48.8
46.4
44.2
42.0
40.1
38.6
37.1
35.9
34.7
33.7
33.2
32.5
451.
435.
416.
401.
386.
370.
354.
338.
324.
310.
296.3
282.8
268.8
257.2
244 3
232 6
221 7
210 3
200 0
190 0
179 9
171 8
163 8
154 8
146 4
138 7
131 4
124 1
116 9
110 4
104 1
98 3
92 6
87.5
82 6
78 0
73 1
69 0
69 0
61 7
58 1
54 9
54 9
49 4
46 8
44 5
42 4
40 7
38.9
37.4
36.2
34.9
34.0
33.3
32.6

202 5
202 0201 5201 0
200 5200 0199 5
199 0198 5
198 0197 5197 0
196 5196 0195 5
195 0194 5194 0
193 5
193 0
192 5
192 0
191 5
191 0
190 5
190 0
189 5
189 0
188 5
188 0
187 5
187 0
186.5
186.0
185.5185.0
30.9
29.9
30.2
31.3
30.5
31.5
31.0
30.6
31.4
33.2
32.3
34.1
34.4
37.1
36.0
36.8
39.7
39.541.0
42.6
43.0
44.3
45.9
47.8
47.450.1
51.552.954.9
55.955.8
58.059.260.5
61.362.0
30 9
30 5
30 1
30 4
30 1
30 3
30 8
31 9
32 5
33 4
34 4
34 8
35 9
36 0
37 1
38 7
39 9
41 0
42 5
43 2
44 6
46 1
46 7
47 9
48 8
49 3
50 9
52 9
53 3
54 9
56 6
58 3
59 9
60 3
60 2
61 6
30 6
30 629 3929 37
29 5130 2
30 431 832 1
32 533 6
33 535.136 136 9
37 939 040 2
41 243 644 145 3
46 347 949 150 4
5O 652 153 0
54 156 056.4
57.959.160.6
62.3
32.131.8
31.631.231 5
31 531 8
32 132 833 5
34 435.035.6
36 737 738 640 1
40 742 1
43 444 946 1
47 448 849 951 153 254 2
56 156 6
59 059 461 3
61 963 865 4
31.8
31.6
31.5
31.3
31.6
31 5
31 5
32 1
32 5
33 3
34 0
34.6
35.536 437 2
38 339 84O 9
42 243 1
44 646 047 148 449 9
51 652 654 656 1
56 659 1
59 361 762 663.2
64.4
aHollna and Holina [1986].
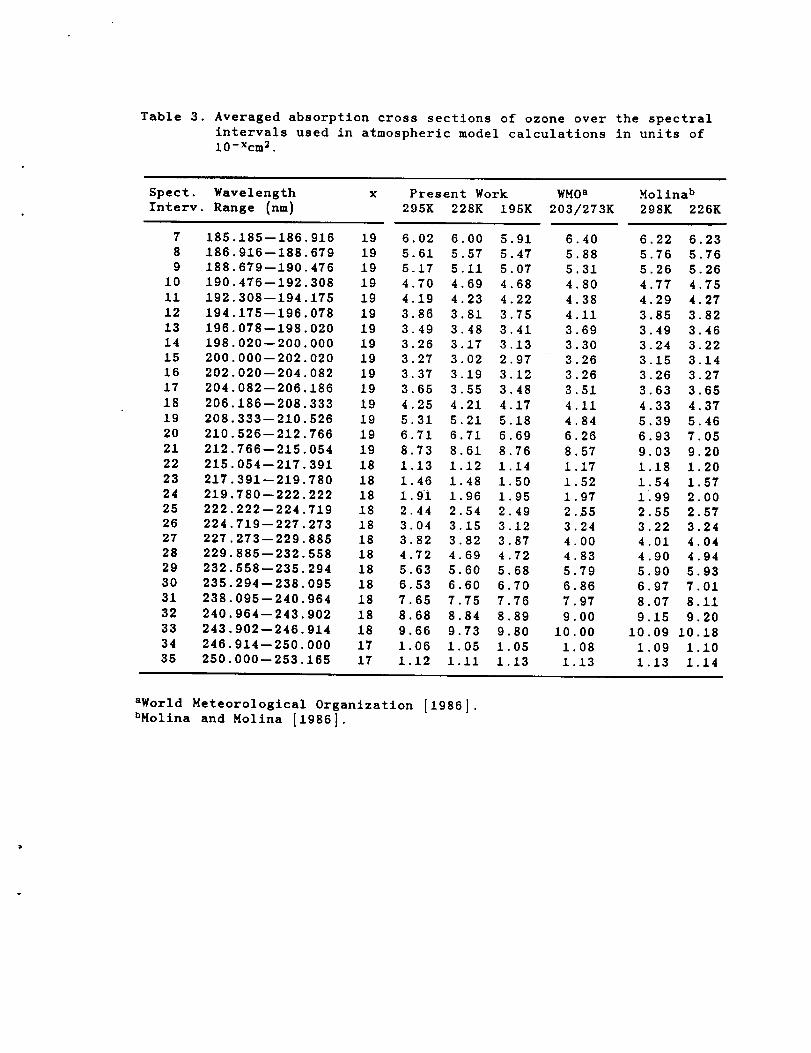
Table 3, the spectral
in units of
Averaged absorption cross sections of ozone over
intervals used in atmospheric model calculations10-Xcm 2.
Spect. Wavelength x Present Work WHOaInterv. Range (nm) 295K 228K 195K 203/273K
7
8
9
10
11
12
13
14
15
16
17
18
19
20
21
22
23
24
25
26
27
28
29
30
31
32
33
34
35
186.185--186.916186.916--188.679
188.679--190.476190.476--192.308
192.308--194.175
194 176--196.078196 078--198.020198 020-- 200.000
200 000--202.020
202 020--204.082
204 082-- 206.186
206 186--208.333
208.333--210.626
210.526--212.766
212.766--215.054
215.054--217.391
217.391--219.780
219,780--222.222
222.222--224.719
224.719--227.273
227.273-- 229.885
229.885--232.558
232.558--236.294
235.294--238.095
238.095--240.964
240.964-- 243.902
243.902--246.914
246.914--250.000
250.000--253.165
19 6,02 6.00
19 5,61 5.57
19 5.17 5.11
19 4.70 4.69
19 4.19 4.23
19 3.86 3.81
19 3,49 3.48
19 3.26 3.17
19 3.27 3.02
19 3.37 3.19
19 3.65 3.55
19 4.25 4.21
19 5.31 5.21
19 6.71 6.71
19 8.73 8.61
18 1.13 1.12
18 1,46 1.48
18 1.91 1.96
18 2.44 2.54
18 3.04 3.1518 3.82 3.82
18 4.72 4.69
18 5,63 5.60
18 6.53 6.60
18 7.65 7.7518 8.68 8.84
18 9.66 9.7317 1.06 1.0517 1.12 1.11
5 91
5 47
5 07
4 68
4 22
3 75
3 41
3 13
2 97
3 12
3,48
4.17
5.18
6.69
8.76
1.14
1.50
1.952.49
3.12
3.87
4.72
5.68
6 70
7 76
8 89
9 80
1 05
1 13
6.40
5.88
5.31
4.80
4.38
4.11
3.69
3 30
3 26
3 26
3 51
4 11
4 84
6 26
8 57
1.17
1.52
1.97
2 553 244 O04 83
5 796 86
7 979.00
I0.00
1.08
1.13
Molina b
298K 226K
6.22 6.23
5.76 5.76
5.26 5 26
4.77 4 75
4.29 4 27
3.85 3 82
3.49 3 46
3.24 3 22
3.15 3 14
3.26 3 27
3.63 3.65
4.33 4.37
5.39 5.46
6.93 7.05
9.03 9.20
1.18 1 20
1.54 1 57
1 99 2 00
2 55 2 57
3 22 3 244 01 4 044 90 4.945 90 5.936 97 7.01
8 07 8.11
9.15 9.2010.09 10.18
1.09 1.101.13 1.14
aWorld Heteorologtcal Organization [1986].bHoltna and Holtna [1986].

-17-
-18-
0
-17-
-18
-17
-18'
-I_35000
240 220 200 180
Wavenumber
nm
I
600OO

_ • °
CDm
_ CDC_
p_
C_
Ioo
f
C_
l
Ol)oq


