Download - analysis quarterly 14.3&4 - Energy
analysis review
quarterly
vto anl
energetics
ornl nrel snl
ta engineering sra/sentech
jake ward amgad elgowainy, steve plotkin, aymeric rousseau, tom stephens, anant vyas, michael wang, joann zhou alicia birky, salil deshpande stacy davis, zhenhong lin, changzheng liu aaron brooker, mark singer becky levinson, dawn manley jim moore, charles taylor russ campbell, jonathan ford, karen sikes 23 feb 2015
14.3&4 3 & 4 Q 2 0 1 4
>
1

topics
energy markets automotive markets technologies studies environmental studies consumer & opinion surveys policy studies
outline
1
qar
2

energy markets
petroleum demand > FOTW: The transportation petroleum “gap” has nearly disappeared. > FOTW: Net imports of petroleum fell to only 33% of U.S. consumption in 2013. > FOTW: World petroleum consumption rises despite declines from U.S. and Europe.
petroleum markets > ORNL: Lower oil prices and higher GDP growth translate to possible lower oil dependence. > FOTW: Non-OPEC countries supply nearly two-thirds of U.S. petroleum imports. > ORNL: OPEC’s market power, though “fuzzy”, is indeed correlated to oil price. > EIA: Recent growth in US oil production is concentrated in Texas and North Dakota. > EIA: Crude oil prices fall sharply in Q4 2014. > FOTW: Retail gasoline prices in 2014 experienced the largest decline since 2008. > EIA: 20-year trend in oil prices shows that even today’s “low” prices are still relatively high > UC-Davis: Breakevens for U.S. shale oil, gas are sensitive to world-market price changes. > EIA: U.S. oil production to increase despite expected near-term reduction in rig count.
natural gas markets > EIA: Shale gas provides largest share of gas production (even exceeding conventional wells). > CBO/EIA: U.S. natural gas production to expand through 2040 (and support net exports).
1
3
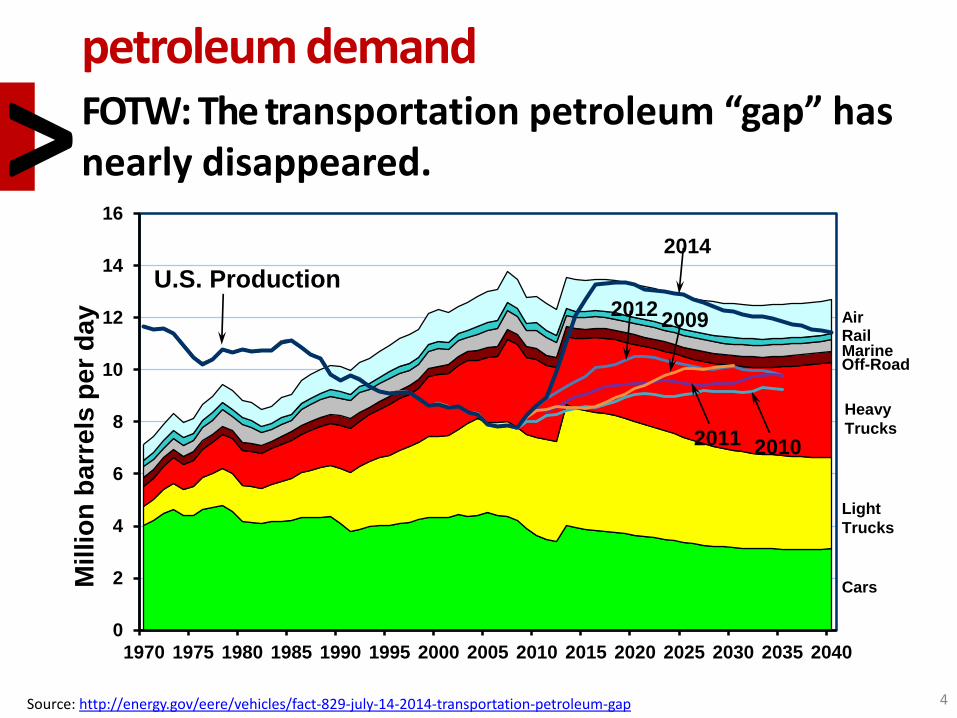
petroleum demand FOTW: The transportation petroleum “gap” has nearly disappeared. >
Source: http://energy.gov/eere/vehicles/fact-829-july-14-2014-transportation-petroleum-gap 4
0
2
4
6
8
10
12
14
16
1970 1975 1980 1985 1990 1995 2000 2005 2010 2015 2020 2025 2030 2035 2040
Millio
n b
arr
els
per
day
Marine Rail
Cars
Air
Light
Trucks
Heavy
Trucks
U.S. Production
Off-Road
2012
2011
2009
2010
2014
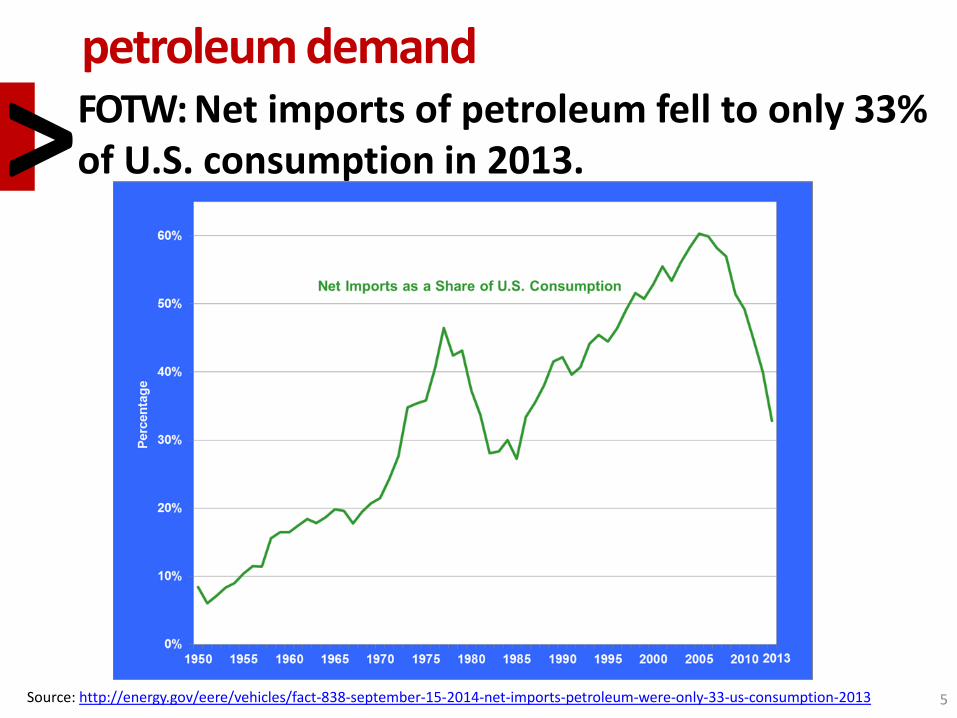
petroleum demand FOTW: Net imports of petroleum fell to only 33% of U.S. consumption in 2013. >
Source: http://energy.gov/eere/vehicles/fact-838-september-15-2014-net-imports-petroleum-were-only-33-us-consumption-2013 5

petroleum demand FOTW: World petroleum consumption continues to rise despite declines from U.S. and Europe >
Source: http://energy.gov/eere/vehicles/fact-839-september-22-2014-world-petroleum-consumption-continues-rise-despite-declines 6
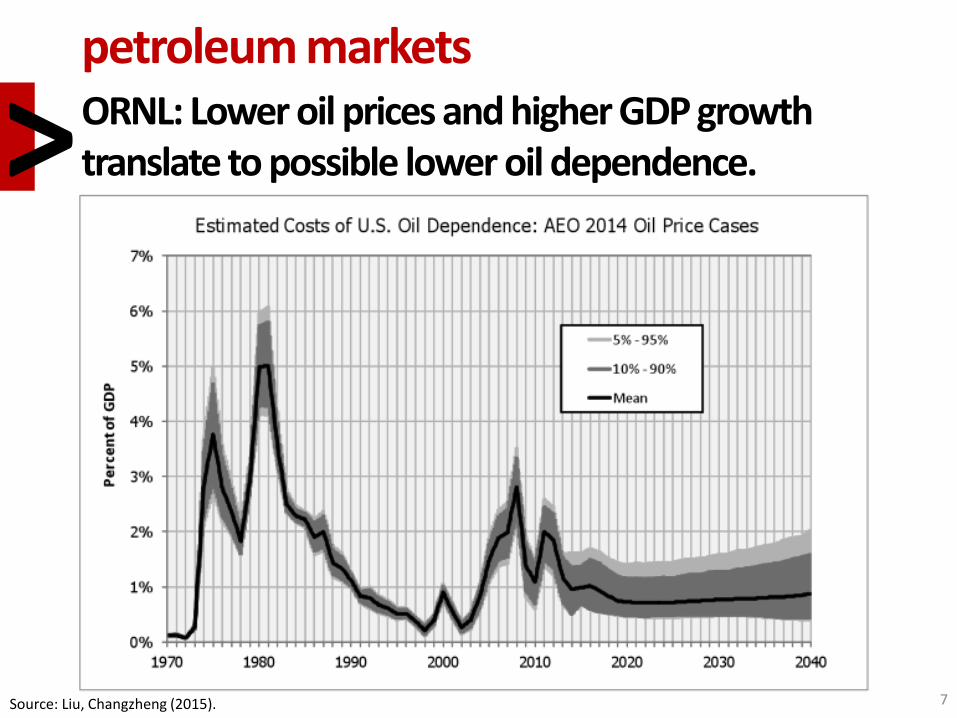
petroleum markets ORNL: Lower oil prices and higher GDP growth translate to possible lower oil dependence. >
7 Source: Liu, Changzheng (2015).
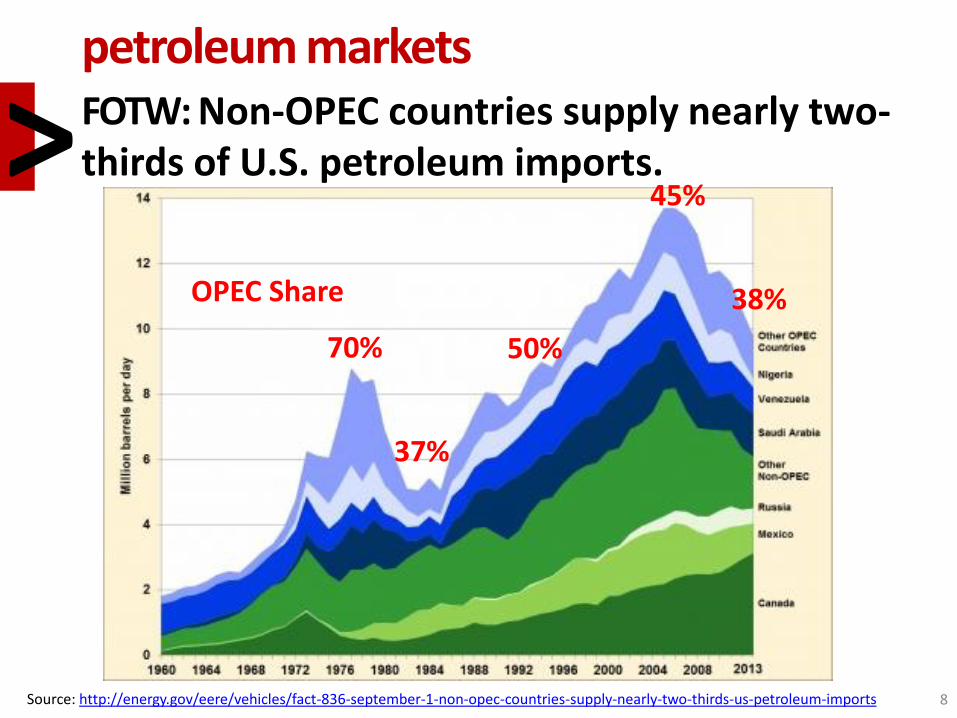
petroleum markets FOTW: Non-OPEC countries supply nearly two-thirds of U.S. petroleum imports. >
8 Source: http://energy.gov/eere/vehicles/fact-836-september-1-non-opec-countries-supply-nearly-two-thirds-us-petroleum-imports
45%
38%
70% 50%
37%
OPEC Share

petroleum markets ORNL: OPEC’s market power, though “fuzzy”, is indeed correlated to oil price. >
9 Source: Liu, Changzheng (2015).
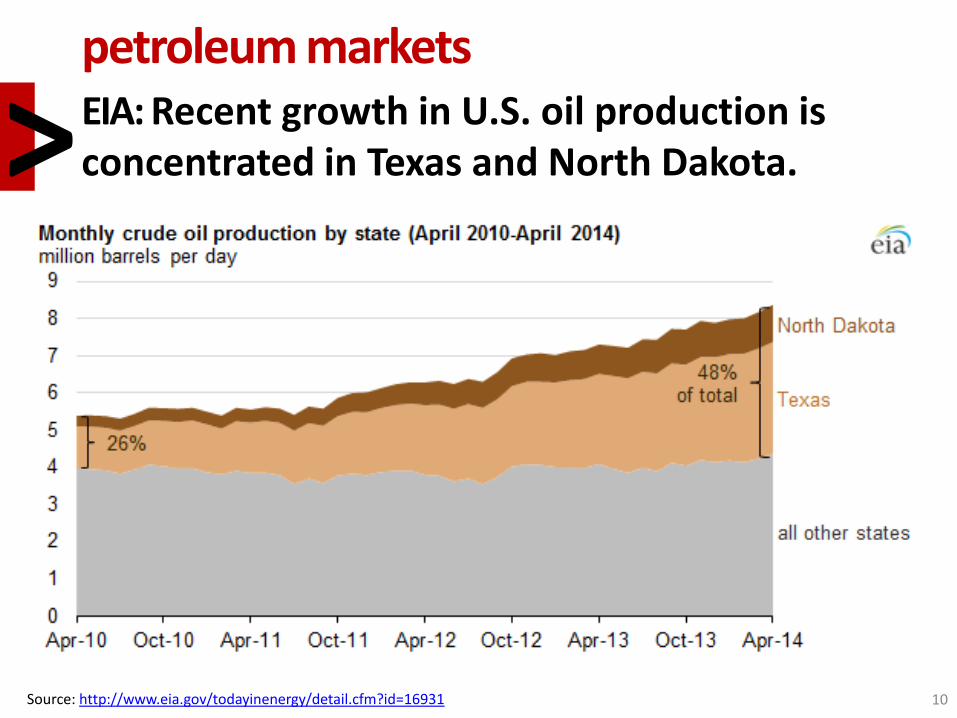
petroleum markets EIA: Recent growth in U.S. oil production is concentrated in Texas and North Dakota. >
10 Source: http://www.eia.gov/todayinenergy/detail.cfm?id=16931

petroleum markets EIA: Crude oil prices fall sharply in Q4 2014. >
11 Source: http://www.eia.gov/todayinenergy/detail.cfm?id=19451

petroleum markets FOTW: Retail gasoline prices in 2014 experienced the largest decline since 2008. >
12 Source: http://energy.gov/eere/vehicles/fact-858-february-2-2015-retail-gasoline-prices-2014-experienced-largest-decline-2008
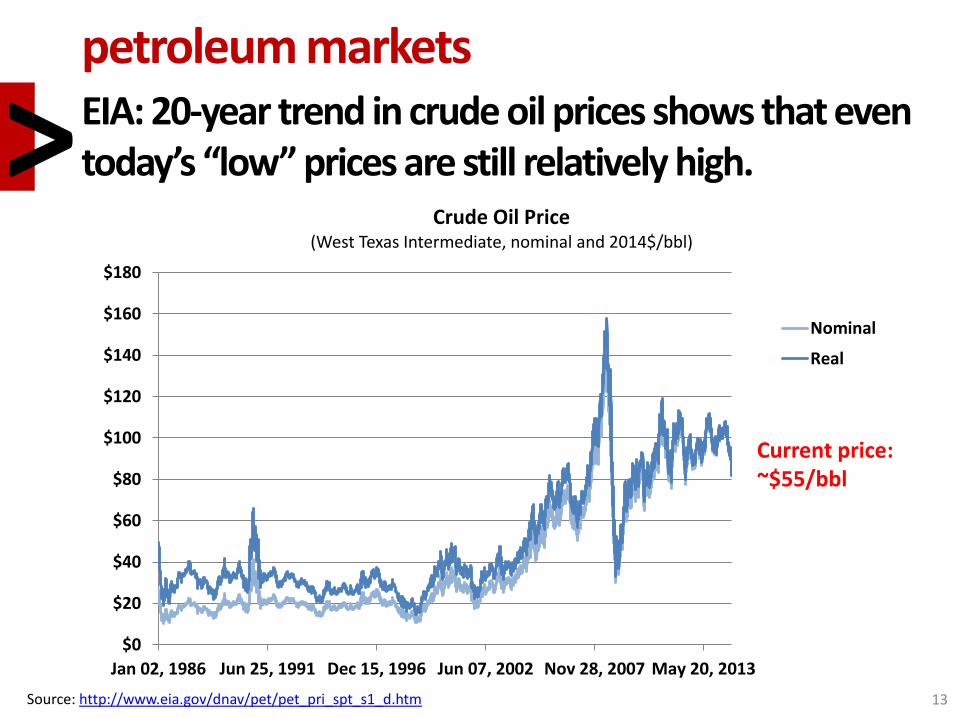
petroleum markets EIA: 20-year trend in crude oil prices shows that even today’s “low” prices are still relatively high. >
13 Source: http://www.eia.gov/dnav/pet/pet_pri_spt_s1_d.htm
$0
$20
$40
$60
$80
$100
$120
$140
$160
$180
Jan 02, 1986 Jun 25, 1991 Dec 15, 1996 Jun 07, 2002 Nov 28, 2007 May 20, 2013
Crude Oil Price (West Texas Intermediate, nominal and 2014$/bbl)
Nominal
Real
Current price: ~$55/bbl

petroleum markets UC-Davis: Breakevens for U.S. shale oil and gas are sensitive to recent world-market price changes. >
14 Source: UC-Davis NextSTEPS/Citi Research
Field Breakeven OPEX
Marcellus (gas)
$2.50 $1.00
Barnett (gas) $3.80 $1.80
Haynesville (gas)
$3.60 $1.80
Eagle Ford (oil)
$37 $7-$8
Permian (oil) $49 $10-$12
Bakken (oil) $37 $7-$8
Mississippian $43 $7-$8 Johan SverdrupRumailaJubilee Area
Bina Bawi
ZubairChina Domestic Gas
Campos ExpWest Qurna 1Tempa RossaPNG LNG T3
Gbaran Ubie Ph2Cepu Exp
NgamiaPerla
GoM TiebacksMajnoon
NE Tupi
Itaipu
FrancoWhales Park
CariocaLulaSapinhoa
SkrugardIara
PNG LNG T1-2Hadrian
Yamal Gas
JupiterBig Foot
Trebs TitovSandridge JV
ADMA
Mozambique LNGUganda Bl.1,2,3
Clair Ph 2 AbsheronVankorBl. 15/06 East
North Alexandria HubTiber
West Qurna 2Kaskida
CLOVGhana GasLaggan/Tormore Zaedyus
Block 32
STL Bakken
Colombia OilChina Domestic Oil
Tanzania LNGWheatstone LNG
Yamal LNGOXY Bakken APLNG
PSVM
Ichthys LNG
China Domestic Oil Junin 5Prelude LNGBl. 31 SE Gorgon LNGJack-St Malo
DominoSTL Eagle Ford Browse LNG
Tengiz ExpBolia-ChotaKearlOPL245
Aparo-NsikoSunrise Ph 1 Usan
West Canada LNGRDS Unc Gas STL Marcellus
Filanovsky
Block 61 OmanBG Haynesville
QCLNGSurmont Ph 2
Fort HillsMacKay RiverDover
Abadi FLNGTerre de Grace Kashagan Ph 1
Arrow LNGCarmon Creek Joslyn
GLNG
0
10
20
30
40
50
60
70
80
90
100
0 5 10 15 20 25 30 35 40
2020e Production, Mboe/d
Bre
ak
ev
en
, $
/bb
l
LNG cost
pressures
Pricing-discounts
pushing
unconventionals higher
up the curve
(2Q writedowns)
Low-cost conventional
giants (Brazil & Norway)
remain robust.
Heavy oil
expectations
being scaled
back
Disappointing pace in Iraq
sees industry accept
political risk of Kurdistan Bakken
Marcellus
Eagle Ford
Oil Price, July 2014
…Oil Price, February 2015
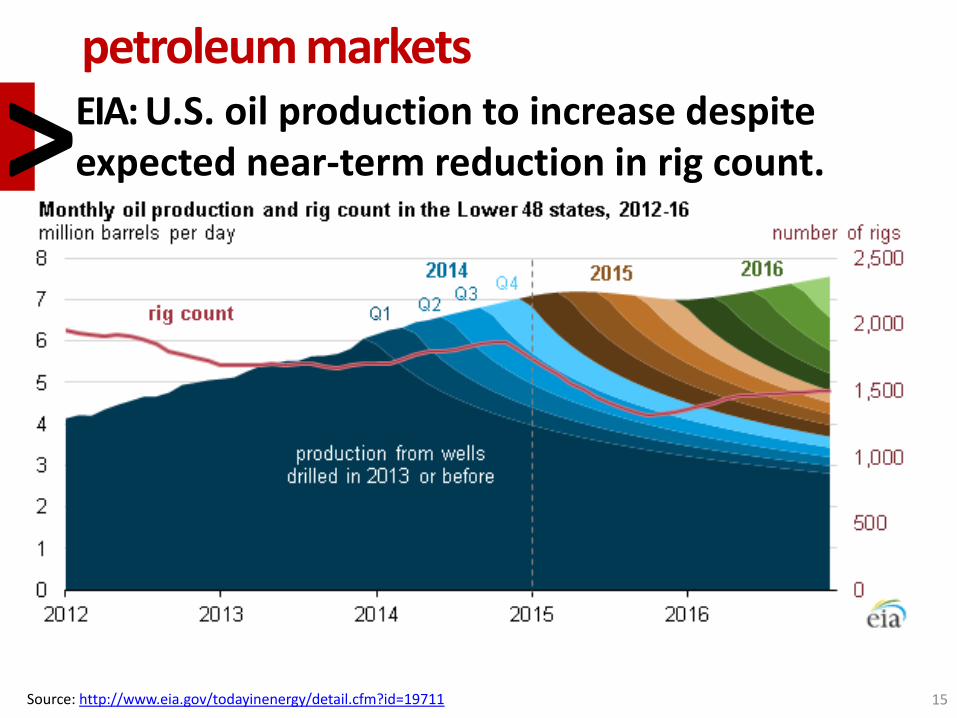
petroleum markets EIA: U.S. oil production to increase despite expected near-term reduction in rig count. >
15 Source: http://www.eia.gov/todayinenergy/detail.cfm?id=19711
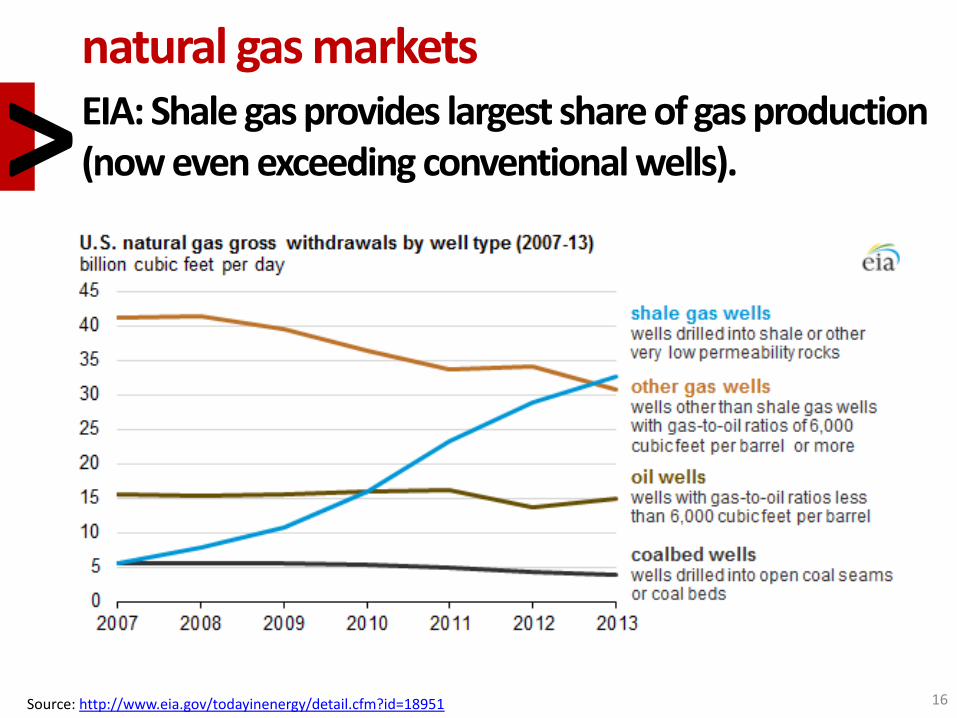
natural gas markets EIA: Shale gas provides largest share of gas production (now even exceeding conventional wells). >
16 Source: http://www.eia.gov/todayinenergy/detail.cfm?id=18951

natural gas markets CBO/EIA: U.S. natural gas production to expand through 2040 (and support net exports). >
17 Source: http://www.dot.gov/sites/dot.gov/files/docs/Draft_Beyond_Traffic_Framework.pdf

topics
energy markets automotive markets technologies studies environmental studies consumers/opinion surveys policy studies
outline
2
qar
18

automotive markets
vehicle sales > ANL: LDV sales reached record high in May 2014, suggesting the market has
rebounded. > FOTW: ANL: Cumulative PEV sales continue to outpace HEV sales in first 50
months since market intro. > ANL: PEVs comprise more model availability; volume leaders remain the same. > ANL: NEV (xEV+FCV) share of car production in China reaches 0.35% in 2014. > ANL: PEV sales in Europe up >50% from 2013, with 58,582 units sold. > EPIA: EV sales trends mirror those of gas prices.
vehicle trends > FOTW: Vehicles and vehicle travel trends have changed (for the long-term?)
since 2008. > FOTW: Motorization in China is accelerating, but not (yet?) as fast as in early
20th Century U.S. > FOTW: About two-thirds of transportation energy use is gasoline for light
vehicles.
transportation trends > DOT: 2010 freight flows by highway, railroad, and waterway.
2
19
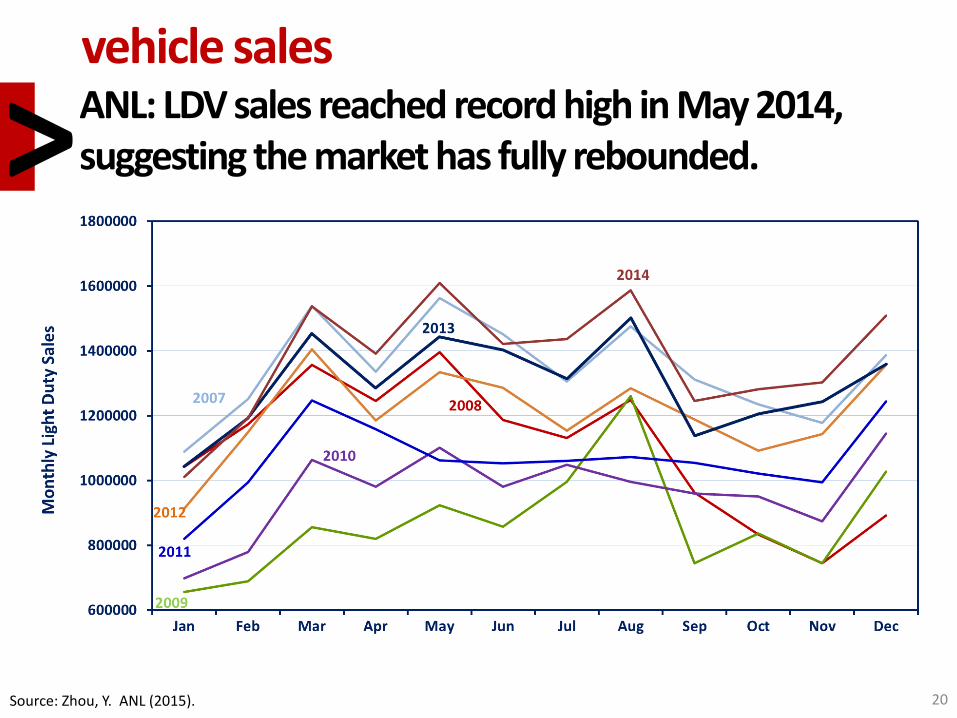
vehicle sales ANL: LDV sales reached record high in May 2014, suggesting the market has fully rebounded. >
20 Source: Zhou, Y. ANL (2015).
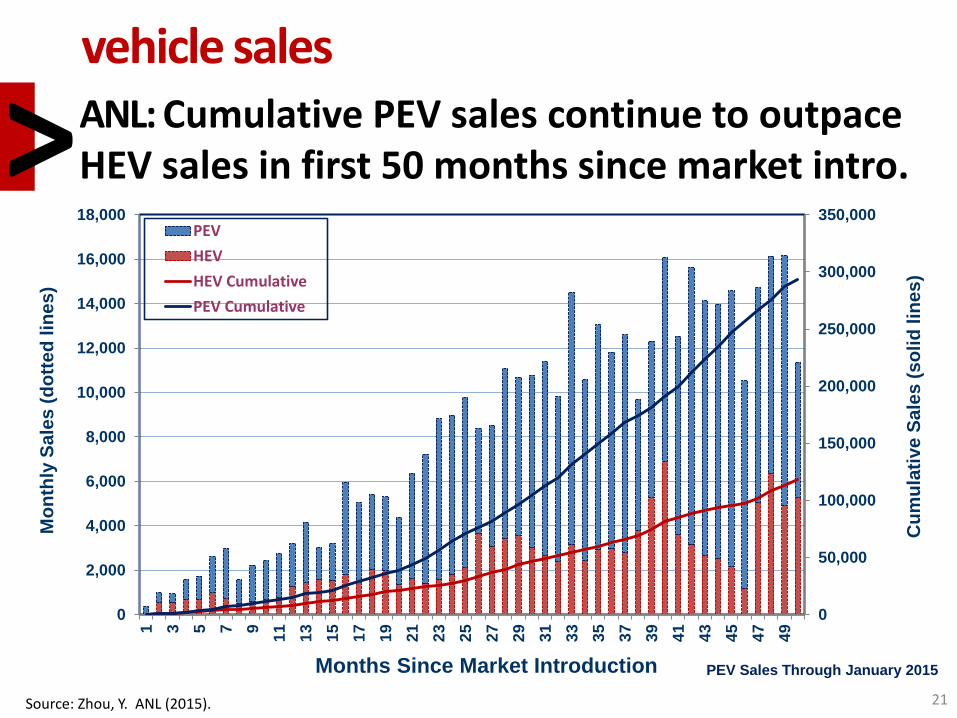
vehicle sales ANL: Cumulative PEV sales continue to outpace HEV sales in first 50 months since market intro. >
21
0
50,000
100,000
150,000
200,000
250,000
300,000
350,000
0
2,000
4,000
6,000
8,000
10,000
12,000
14,000
16,000
18,000
1 3 5 7 9
11
13
15
17
19
21
23
25
27
29
31
33
35
37
39
41
43
45
47
49
Cu
mu
lati
ve
Sa
les
(s
oli
d lin
es
)
Mo
nth
ly S
ale
s (
do
tte
d lin
es
)
Months Since Market Introduction
PEV
HEV
HEV Cumulative
PEV Cumulative
PEV Sales Through January 2015
Source: Zhou, Y. ANL (2015).
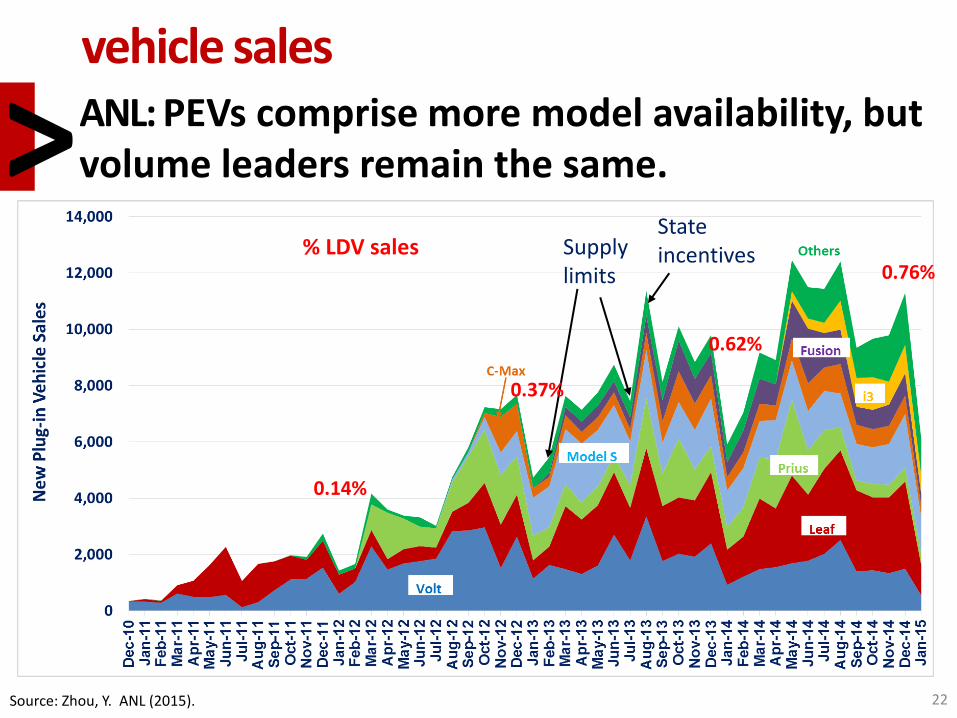
vehicle sales ANL: PEVs comprise more model availability, but volume leaders remain the same. >
22 Source: Zhou, Y. ANL (2015).
4 EV and 2 PHEV Models were introduced in 2014, making the total model availability reached 22 (BME Active E discontinued in 2012)
Supply limits
State incentives
0.76% % LDV sales
0.62%
0.37%
0.14%
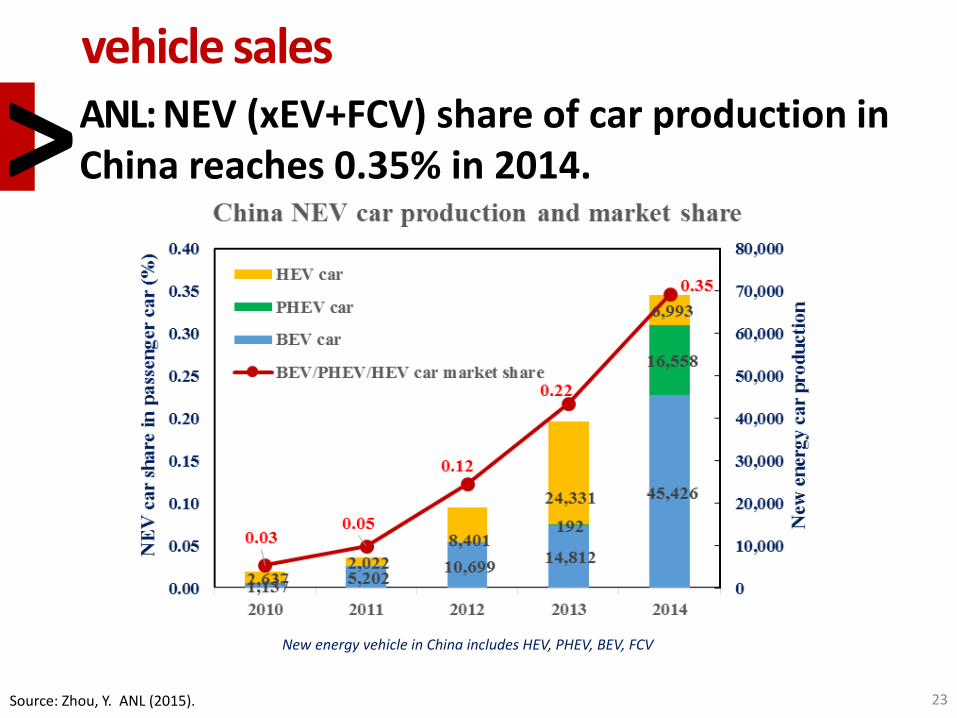
vehicle sales ANL: NEV (xEV+FCV) share of car production in China reaches 0.35% in 2014. >
23 Source: Zhou, Y. ANL (2015).
New energy vehicle in China includes HEV, PHEV, BEV, FCV
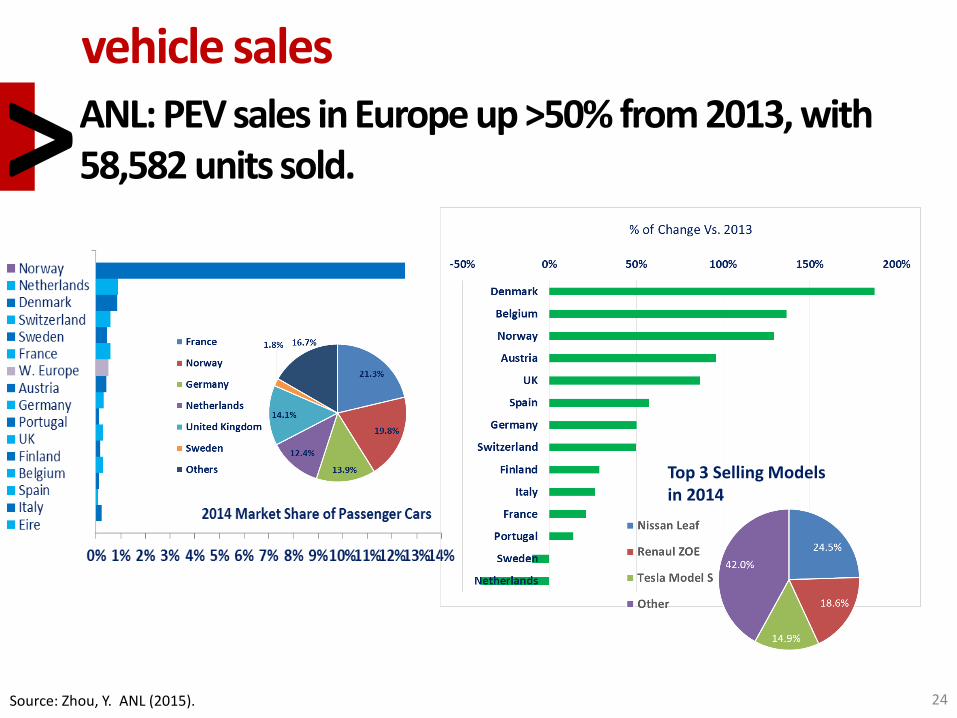
vehicle sales ANL: PEV sales in Europe up >50% from 2013, with 58,582 units sold. >
24 Source: Zhou, Y. ANL (2015).
Top 3 Selling Models in 2014
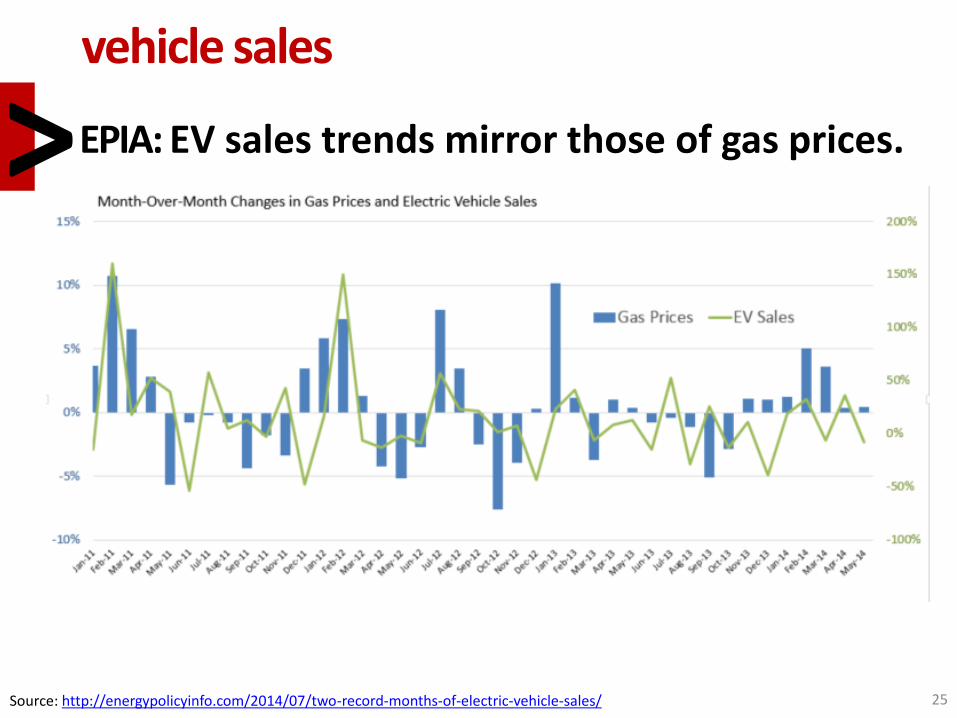
vehicle sales
EPIA: EV sales trends mirror those of gas prices. >
25 Source: http://energypolicyinfo.com/2014/07/two-record-months-of-electric-vehicle-sales/

vehicle trends
FOTW: Vehicles and vehicle travel trends have changed (for the long-term?) since 2008. >
Source: http://energy.gov/eere/vehicles/fact-842-october-13-2014-vehicles-and-vehicle-travel-trends-have-changed-2008 26

vehicle trends
FOTW: Motorization in China is accelerating, but not (yet?) as fast as in early 20th Century U.S. >
Source: http://energy.gov/eere/vehicles/fact-841-october-6-2014-vehicles-thousand-people-us-vs-other-world-regions 27
Motorization rate in China grew in 10 years (2002-2012) the same amount U.S. motorization grew in only 7 years, one century earlier (1912-1920). (Though, different market size should be considered.)
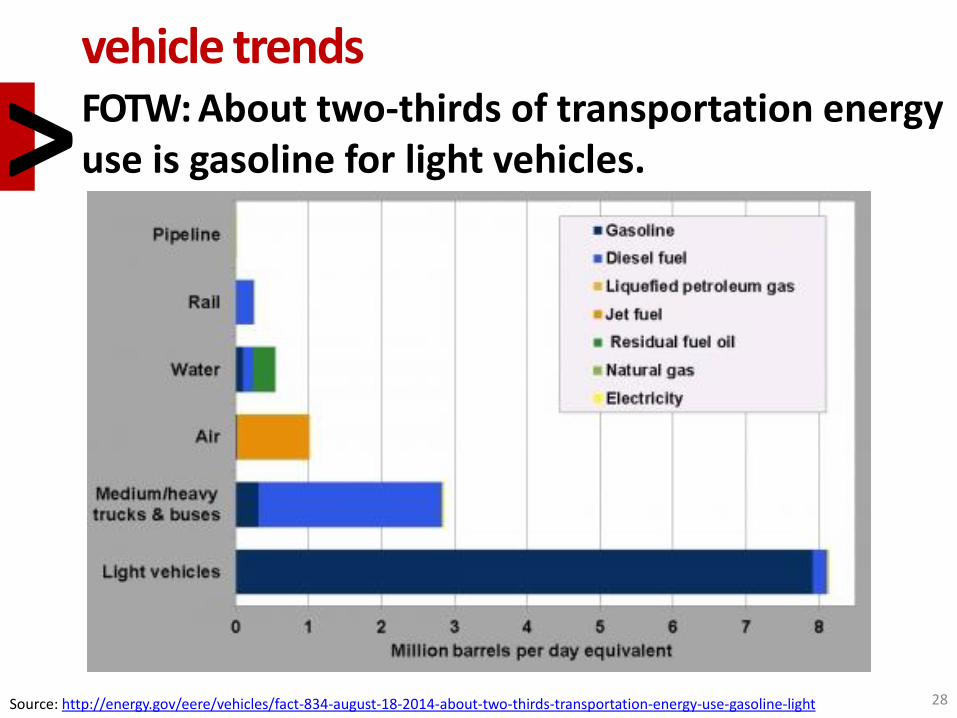
vehicle trends FOTW: About two-thirds of transportation energy use is gasoline for light vehicles. >
Source: http://energy.gov/eere/vehicles/fact-834-august-18-2014-about-two-thirds-transportation-energy-use-gasoline-light 28
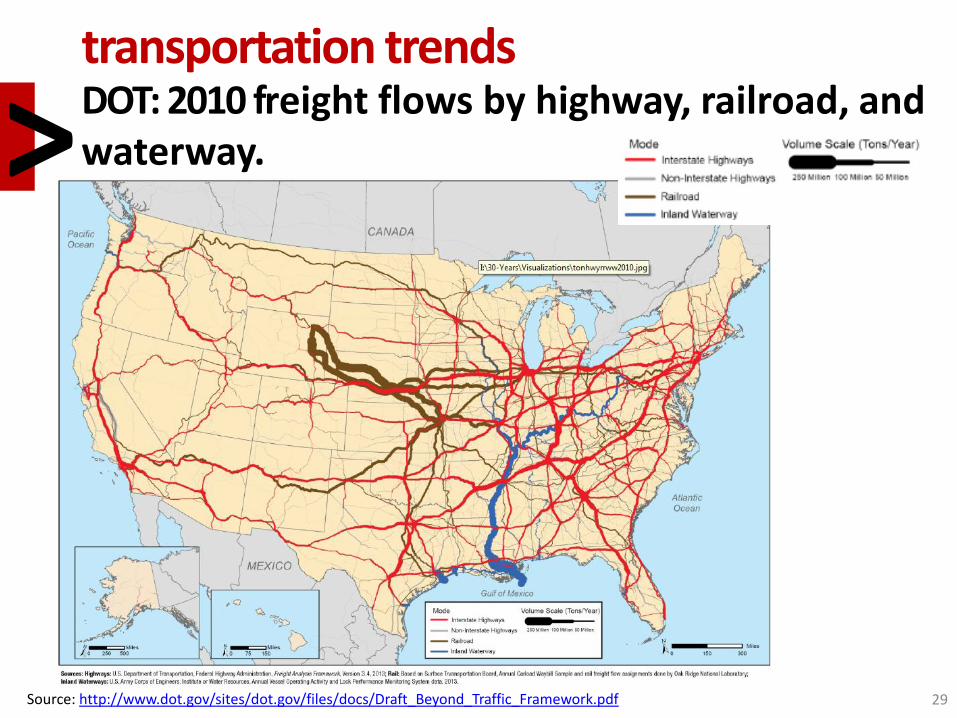
transportation trends DOT: 2010 freight flows by highway, railroad, and waterway. >
29 Source: http://www.dot.gov/sites/dot.gov/files/docs/Draft_Beyond_Traffic_Framework.pdf

topics
energy markets automotive markets technologies studies environmental studies consumers/opinion surveys policy studies
outline
3 qar
30

technologies studies
vehicle technology > EPA: Advanced technology and alternative fuel vehicle models increased
through MY 2014. > EPA: Stop/start technology is in ~5% of all new light vehicles produced.
ev infrastructure > FOTW/AFDC: EVSE network providers can differ greatly geographically.
ev range > FOTW: Driving ranges for all-electric vehicles in MY2014 vary (from 62 to 265
miles). > ORNL/FleetCarma: EV efficiency (and, therefore, range) uncertainty a potential
concern?
3
31

vehicle technology EPA: Advanced technology and alternative fuel vehicle models increased through MY 2014. >
32 Source: http://epa.gov/otaq/fetrends.htm

vehicle technology EPA/FOTW: Stop/start technology is in ~5% of all new light vehicles produced. >
33 Source: http://energy.gov/eere/vehicles/fact-853-december-29-2014-stopstart-technology-nearly-5-all-new-light-vehicles
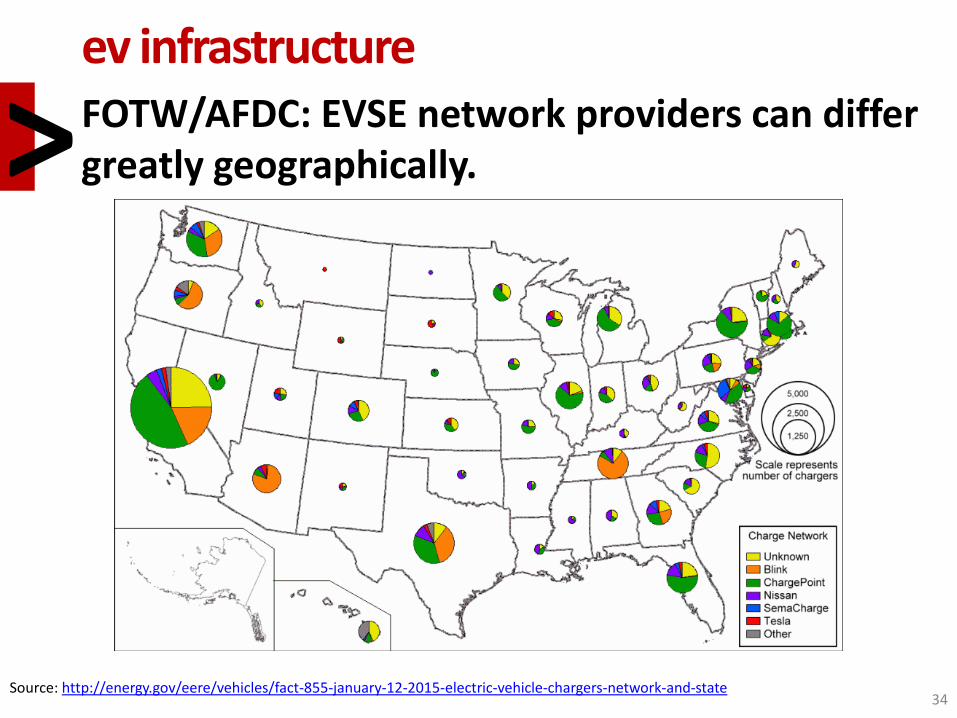
ev infrastructure FOTW/AFDC: EVSE network providers can differ greatly geographically. >
34 Source: http://energy.gov/eere/vehicles/fact-855-january-12-2015-electric-vehicle-chargers-network-and-state

ev range FOTW: Driving ranges for all-electric vehicles in MY2014 vary (from 62 to 265 miles). >
35 Source: http://energy.gov/eere/vehicles/fact-854-january-5-2015-driving-ranges-all-electric-vehicles-model-year-2014-vary-62

ev range ORNL/FleetCarma: EV efficiency (and, therefore, range) uncertainty a potential concern? >
36 Source: http://www.fleetcarma.com/Real-World/Gas-Mileage-MPG/Nissan-Leaf/2013
Source: FleetCarma.com 9,351 Trips by 2013 Nissan Leaf

topics
energy markets automotive markets technologies studies environmental studies consumers/opinion surveys policy studies
outline
4 qar
37

environmental studies
grid emissions > EIA: Lower electricity-related CO2 emissions reflect lower carbon
intensity and electricity use. > FOTW: World renewable electricity consumption is growing (especially
in China).
fuel economy trends > EPA: Average vehicle CO2 emissions rate and fuel economy achieved
record levels in MY2013. > EPA: More models meet fuel economy thresholds in MY2014. > EPA: <5% of MY2014 vehicles meet MY 2025 CO2 targets (and all are
advanced powertrain).
4
38
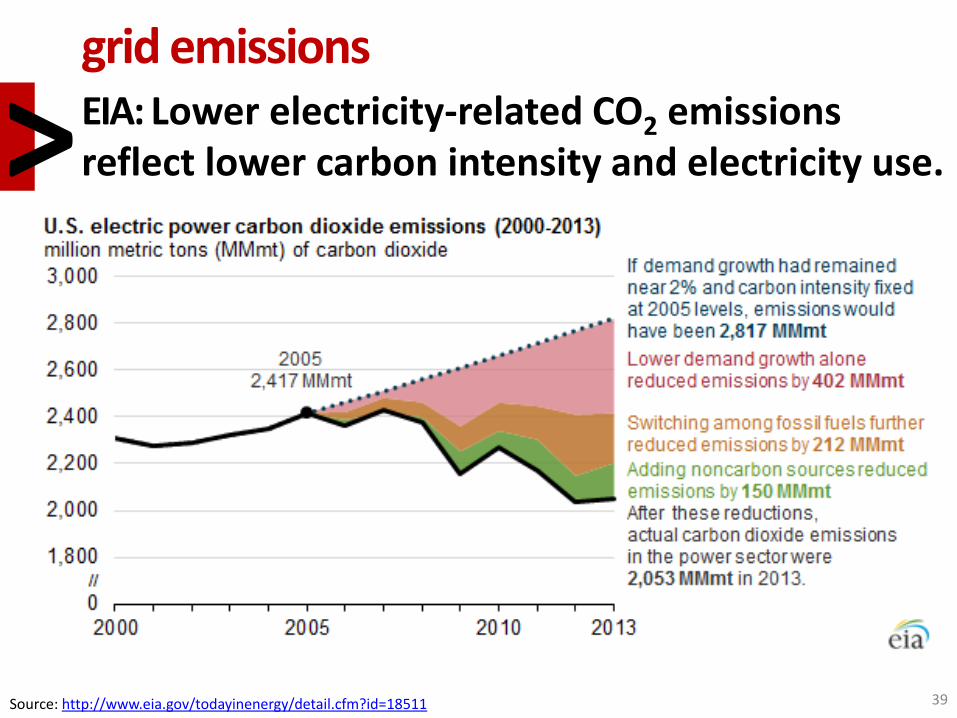
grid emissions EIA: Lower electricity-related CO2 emissions reflect lower carbon intensity and electricity use. >
Source: http://www.eia.gov/todayinenergy/detail.cfm?id=18511
39

grid emissions FOTW: World renewable electricity consumption is growing (especially in China). >
Source: http://energy.gov/eere/vehicles/fact-840-september-29-2014-world-renewable-electricity-consumption-growing
40
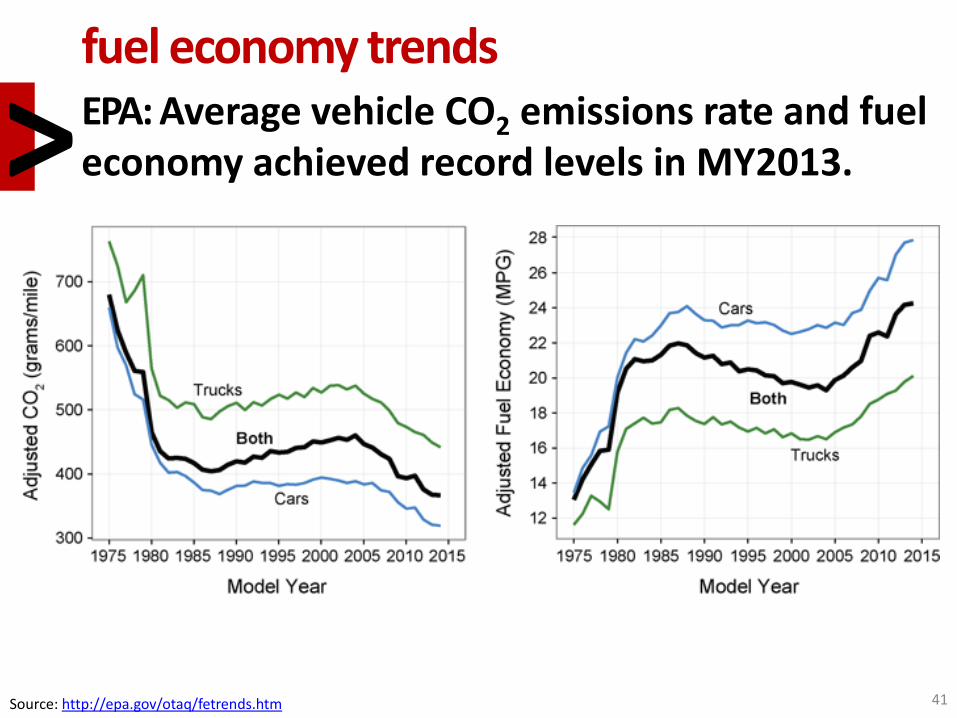
fuel economy trends EPA: Average vehicle CO2 emissions rate and fuel economy achieved record levels in MY2013. >
Source: http://epa.gov/otaq/fetrends.htm
41
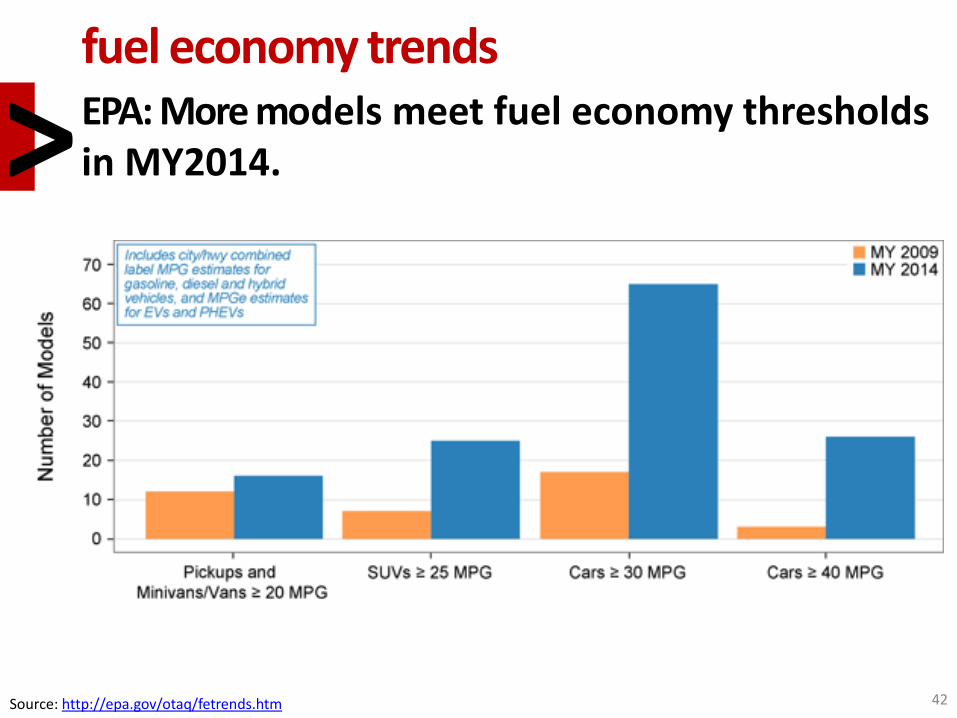
fuel economy trends EPA: More models meet fuel economy thresholds in MY2014. >
Source: http://epa.gov/otaq/fetrends.htm
42
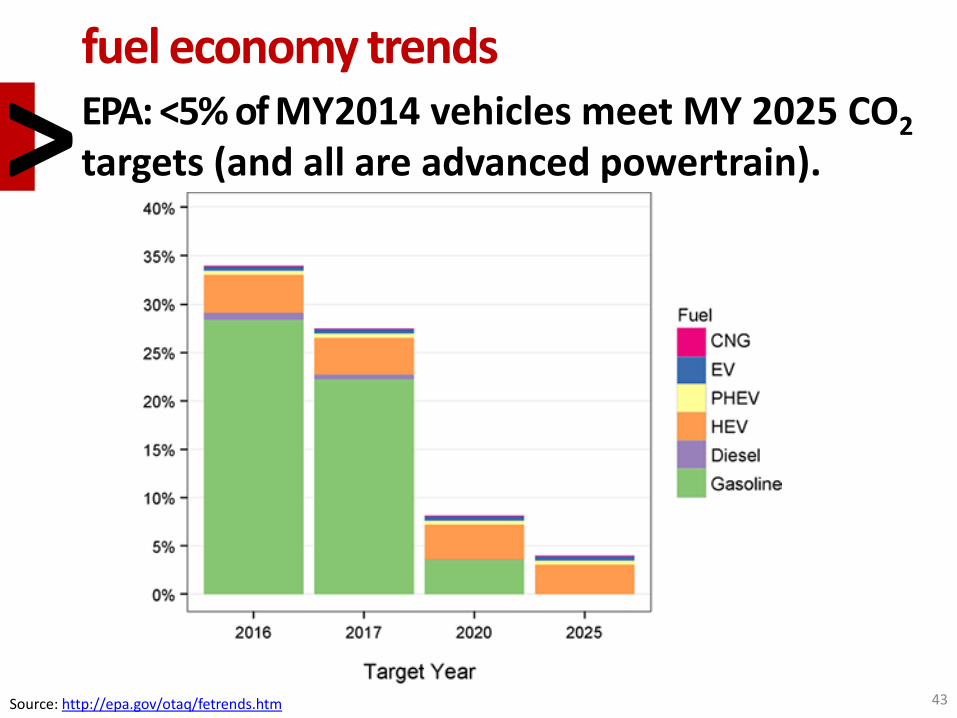
fuel economy trends EPA: <5% of MY2014 vehicles meet MY 2025 CO2 targets (and all are advanced powertrain). >
Source: http://epa.gov/otaq/fetrends.htm
43

topics
energy markets automotive markets technologies studies environmental studies consumers/opinion surveys policy studies
outline 5 qar
44
consumer & opinion surveys workplace charging > FOTW: Number of partner workplaces offering EV charging more than
tripled since 2011.
consumer opinion > FOTW: Plug-in and hybrid cars receive high owner satisfaction scores
(Consumer Reports). > FOTW: Relative importance of fuel economy decreases (but still 2nd-
ranked) > UMTRI: Public opinion about self-driving vehicles differs by country. > UT Energy Poll: survey indicates renewable, efficiency, and EV technology
subsidies favored. > CSE: Primary motivations for PEV purchase differ by advanced vehicle
architecture.
5
45
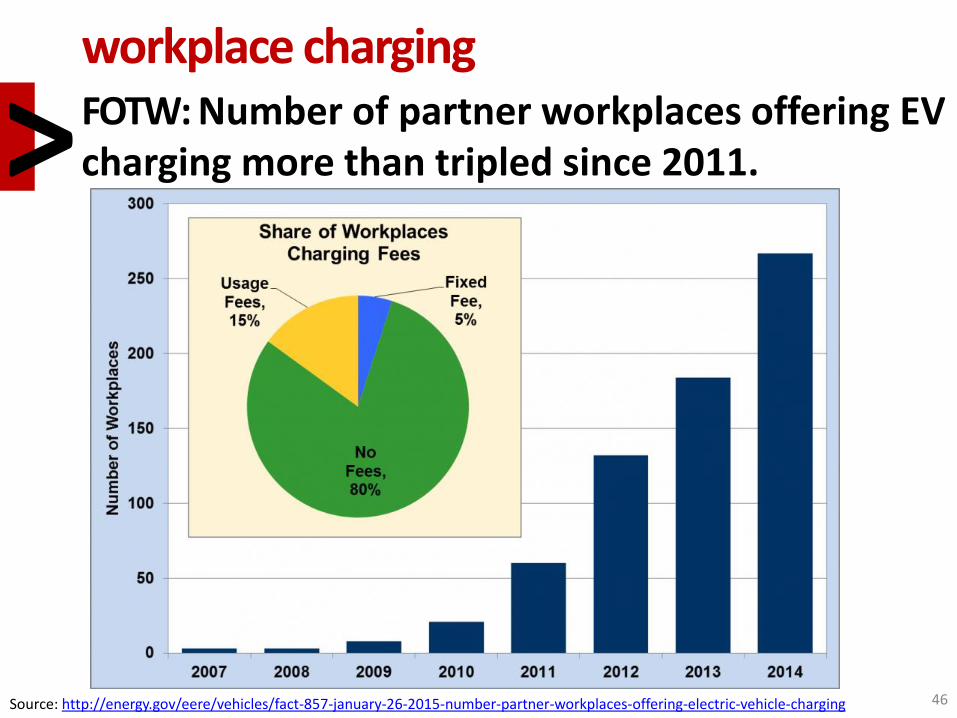
workplace charging FOTW: Number of partner workplaces offering EV charging more than tripled since 2011. >
Source: http://energy.gov/eere/vehicles/fact-857-january-26-2015-number-partner-workplaces-offering-electric-vehicle-charging 46
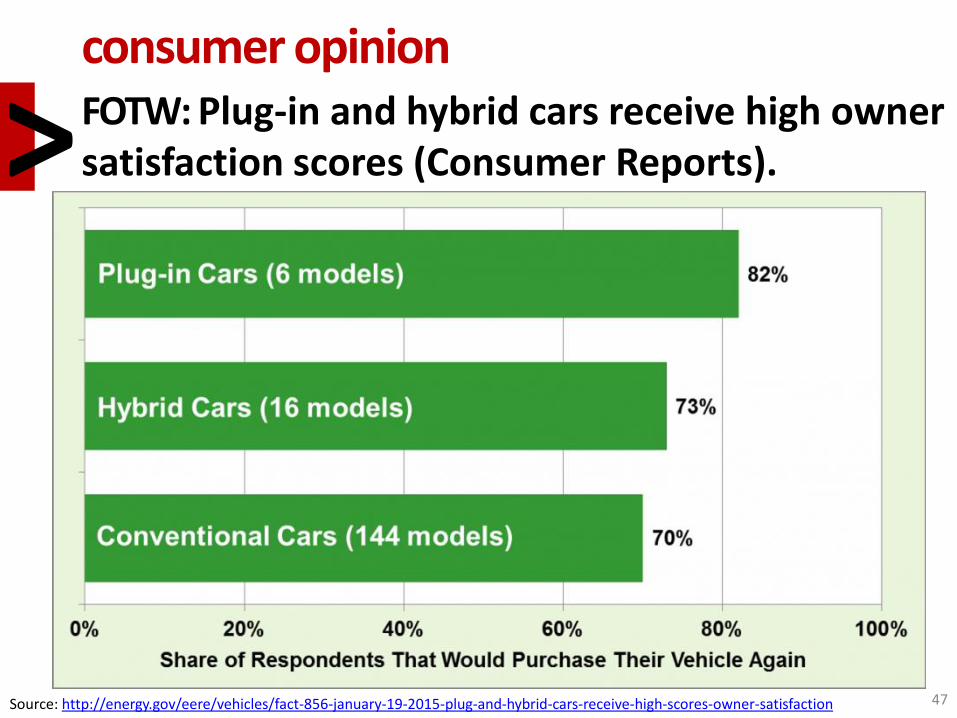
consumer opinion FOTW: Plug-in and hybrid cars receive high owner satisfaction scores (Consumer Reports). >
Source: http://energy.gov/eere/vehicles/fact-856-january-19-2015-plug-and-hybrid-cars-receive-high-scores-owner-satisfaction 47
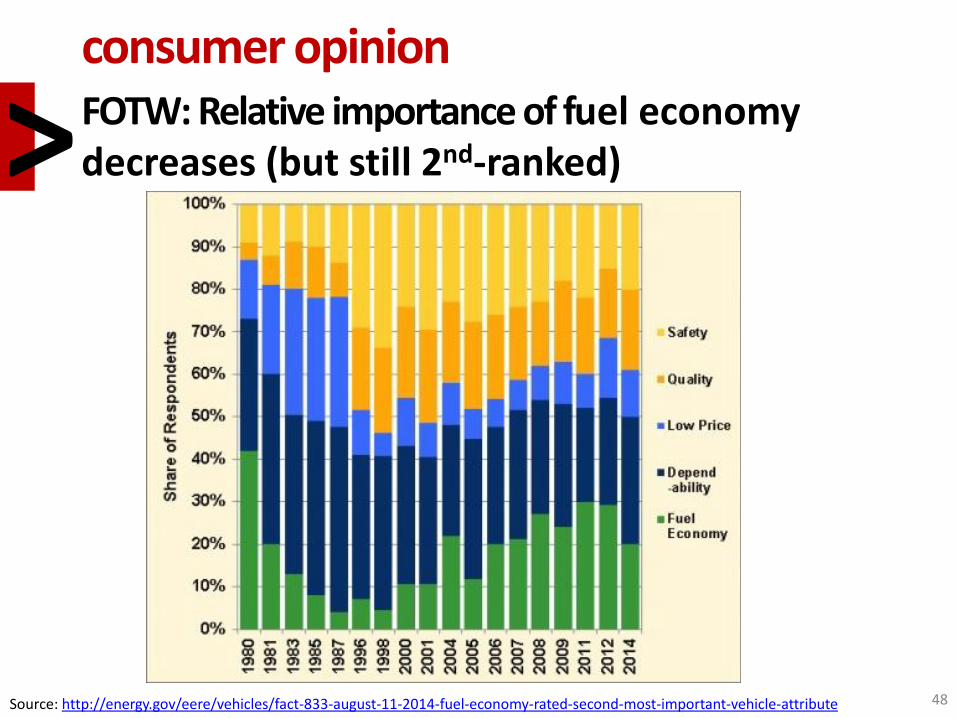
consumer opinion FOTW: Relative importance of fuel economy decreases (but still 2nd-ranked) >
Source: http://energy.gov/eere/vehicles/fact-833-august-11-2014-fuel-economy-rated-second-most-important-vehicle-attribute 48

consumer opinion UMTRI: Public opinion about self-driving vehicles differs by country. >
Source: Michael Sivak and Brandon Schoettle (UMTRI), http://deepblue.lib.umich.edu/bitstream/handle/2027.42/109433/103139.pdf 49
0
10
20
30
40
50
60
China India Japan U.S. U.K. Australia
Very positive
Somewhat positive
Neutral
Somewhat negative
Very negative
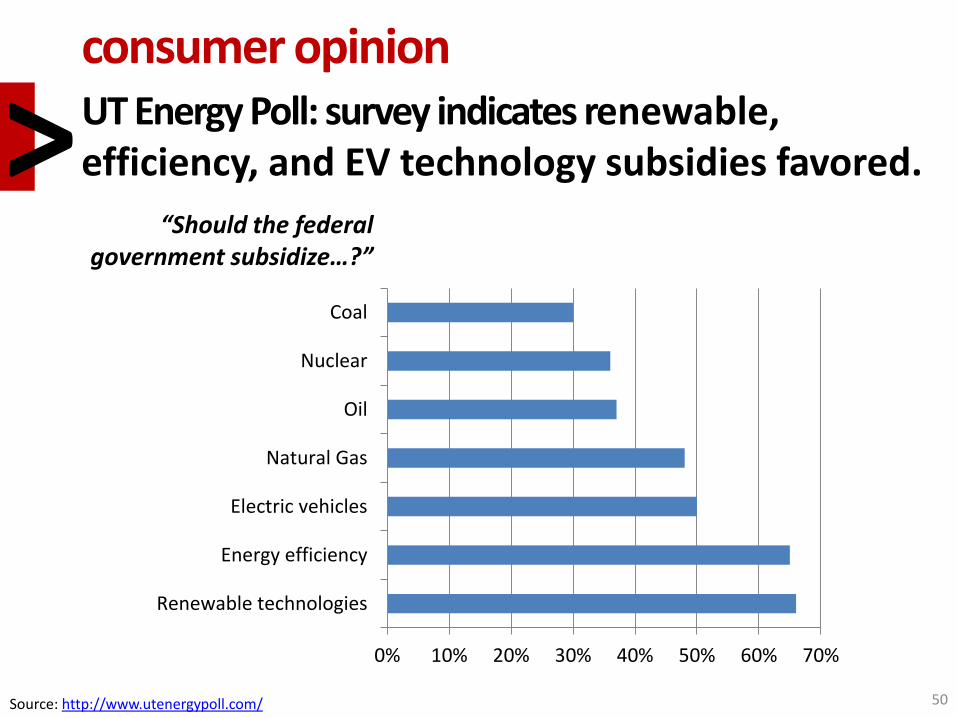
consumer opinion UT Energy Poll: survey indicates renewable, efficiency, and EV technology subsidies favored. >
Source: http://www.utenergypoll.com/ 50
0% 10% 20% 30% 40% 50% 60% 70%
Renewable technologies
Energy efficiency
Electric vehicles
Natural Gas
Oil
Nuclear
Coal
“Should the federal government subsidize…?”
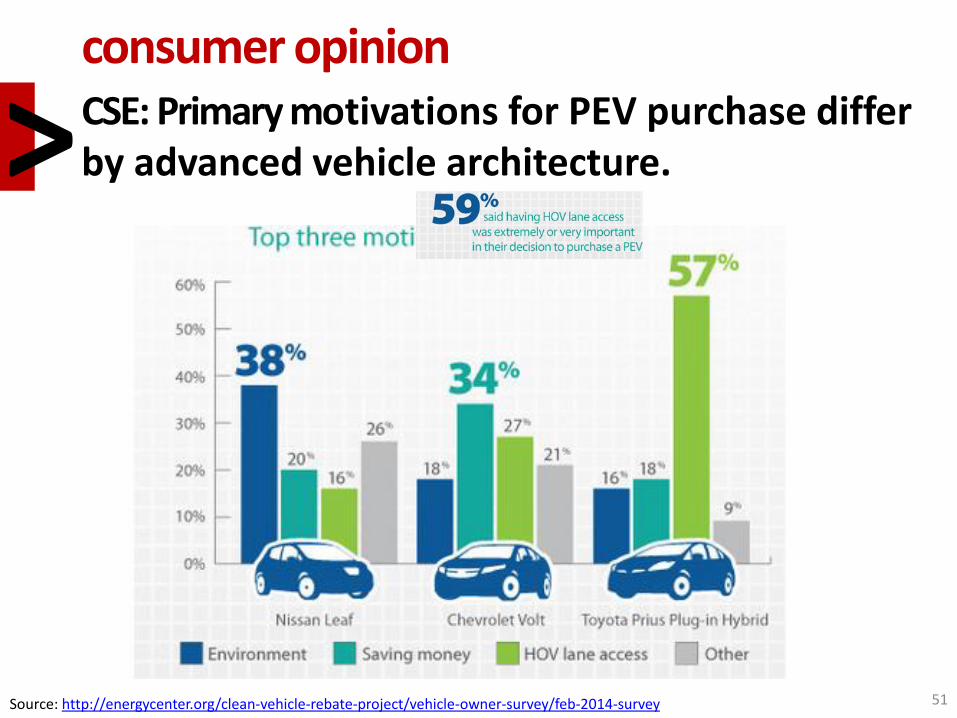
consumer opinion CSE: Primary motivations for PEV purchase differ by advanced vehicle architecture. >
Source: http://energycenter.org/clean-vehicle-rebate-project/vehicle-owner-survey/feb-2014-survey 51

topics
energy markets automotive markets technologies studies environmental studies consumers/opinion surveys policy studies
outline 6 qar
52

policy studies ev incentives > ICCT: Fully monetized state PEV incentives are not directly correlated to state PEV
sales. > NREL: a $1,000 increase in incentive corresponds to a 3% increase in per capita
BEV registrations.
evse rollout > ANL: Charging infrastructure and PEV market shares differ greatly by state.
6
53

ev incentives ICCT: Fully monetized state PEV incentives are not directly correlated to state PEV sales. >
Source: http://www.theicct.org/evaluation-state-level-us-electric-vehicle-incentives 54
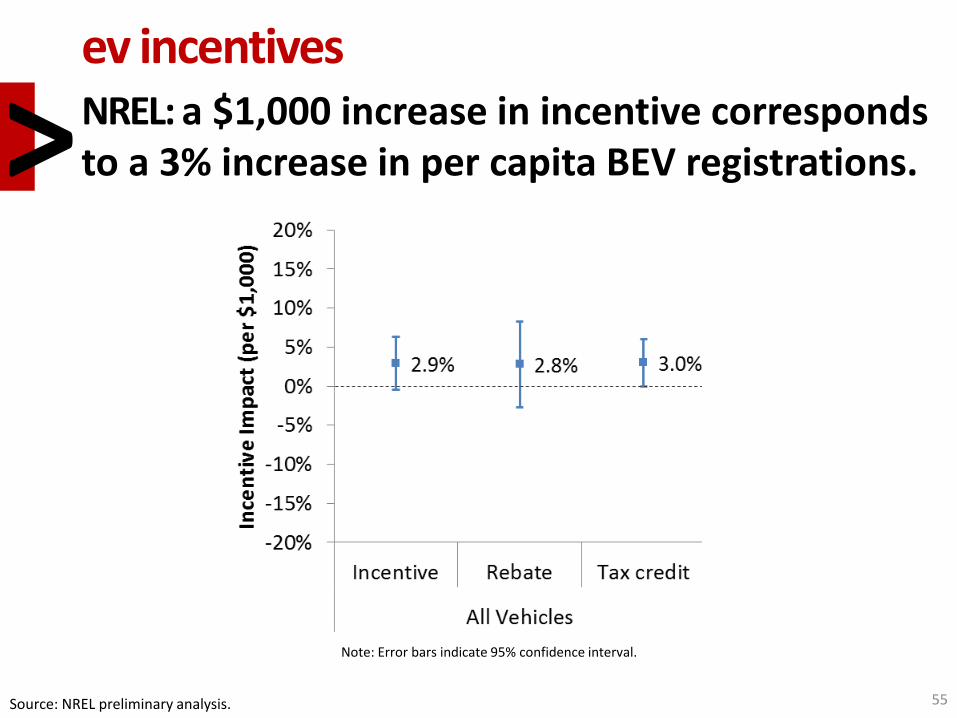
ev incentives NREL: a $1,000 increase in incentive corresponds to a 3% increase in per capita BEV registrations. >
Source: NREL preliminary analysis. 55
Note: Error bars indicate 95% confidence interval.

evse rollout ANL: Charging infrastructure and PEV market shares differ greatly by state.
>
Source: ANL preliminary analysis. 56

energy
automotive
tech/enviro
opinion/policy
summary qar
>
14.3&4 3 & 4 Q 2 0 1 4
57
market projections estimate a decrease in relatively high-priced tight oil but an overall increase in U.S. domestic production.
the LDV market has more than fully rebounded after the 2008 economic crash.
advanced vehicle/grid technologies continue to grow and offer benefits.
heterogeneity in consumer opinions and motivations complicates policy and technology considerations.
summary observations


