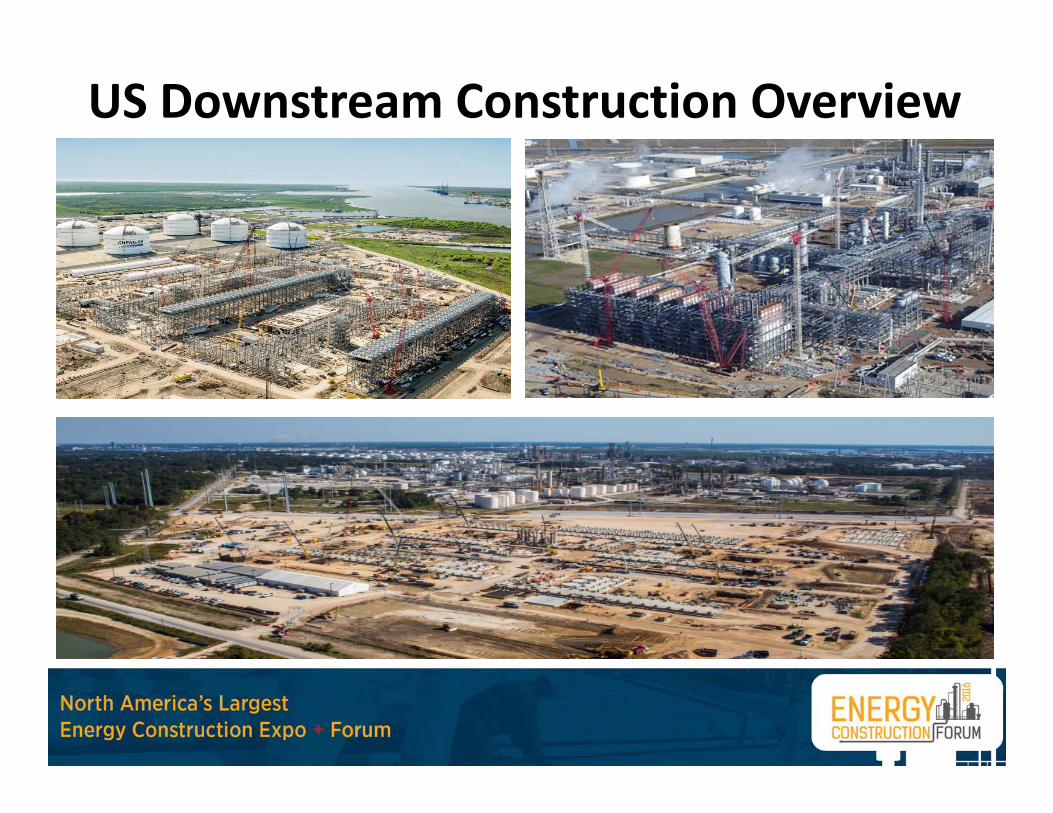
US Downstream Construction Overview

Mr. Toad’s wild ride

Global oil demand vs. refinery capacity builds (2014‐2020)
90 92 94 96 98 100 102 104
2015
2016
2017
2018
2019
2020
Global Refining Capacity
Global Oil Demand
• Detailed and up‐to‐date information for active construction projects in the refining, gas processing, LNG and petrochemical industries across the globe
www.constructionboxscore.com

$230 B
$343 B
$77 B$89 B
$230 B
$141 B
$478 B
Total announced downstream project investments by region, 2015‐2030

Total active projects breakdown
27%
6%
10%17%
40%Planning
Study
FEED
Engineering
Under Construction

Total new project announcements by region, February 2013‐present.
0
20
40
60
80
100
120
140
160
180
Africa Asia‐Pacific Canada Europe* Latin America Middle East US
2013
2014
2015
*Europe includes Eastern Europe, Russia and the CIS

Total new project announcements by region and sector, 2015
0
5
10
15
20
25
30
35
40
45
50
Africa Asia‐Pacific Canada Europe Latin America Middle East US
Refining
Petrochemical
Gas Processing/LNG

7%, 6%, 5%
20%, 24%, 31%, 36%
8%, 9%, 5%
6%, 4%, 8%
16%, 16%, 7%
14%, 12%, 12%
25%, 22%, 26%
Market share analysis of new projects, 2013‐2015
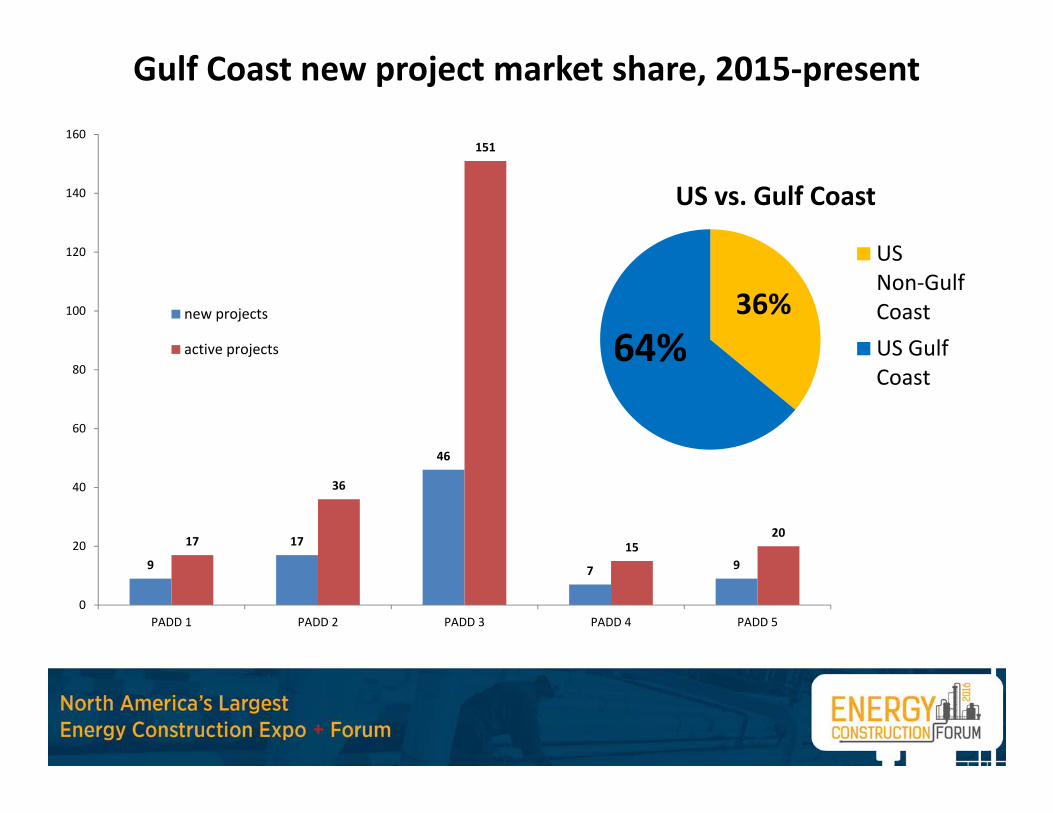
Gulf Coast new project market share, 2015‐present
US vs. Gulf Coast
USNon‐GulfCoastUS GulfCoast
64%36%
9
17
46
7 9
17
36
151
1520
0
20
40
60
80
100
120
140
160
PADD 1 PADD 2 PADD 3 PADD 4 PADD 5
new projects
active projects

USGC market breakdown
Gulf Coast Market Share Breakout
AlabamaFloridaLouisianaMississippiTexas
62%33%
4%
USGC Sector Breakdown
Refining
GasProcessing/LNG
Petrochemical
46%41%
13%
• 95% of active USGC projects are located in Texas and Louisiana• Nearly 90% of USGC active projects are in the gas processing/LNG or petrochemical
industries

New project announcements along the Gulf Coast, 2012
Gas Processing/LNG ProjectsPetrochemical ProjectsRefining Projects

New project announcements along the Gulf Coast, 2013
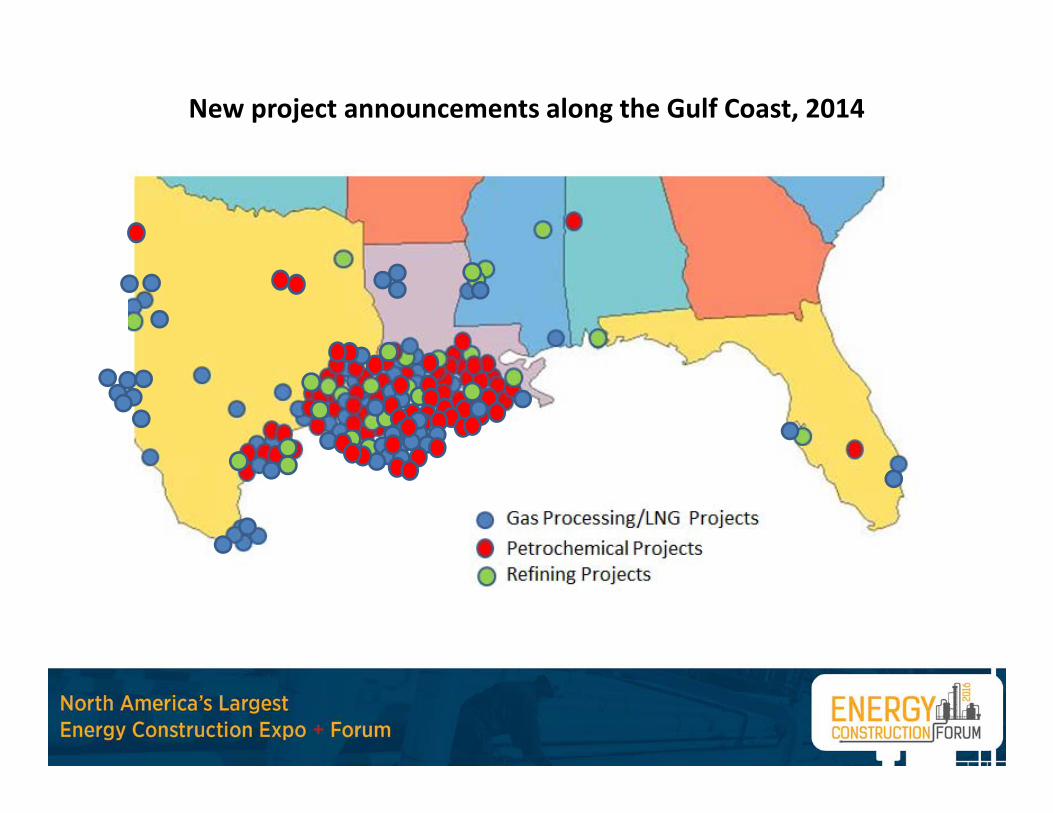
New project announcements along the Gulf Coast, 2014
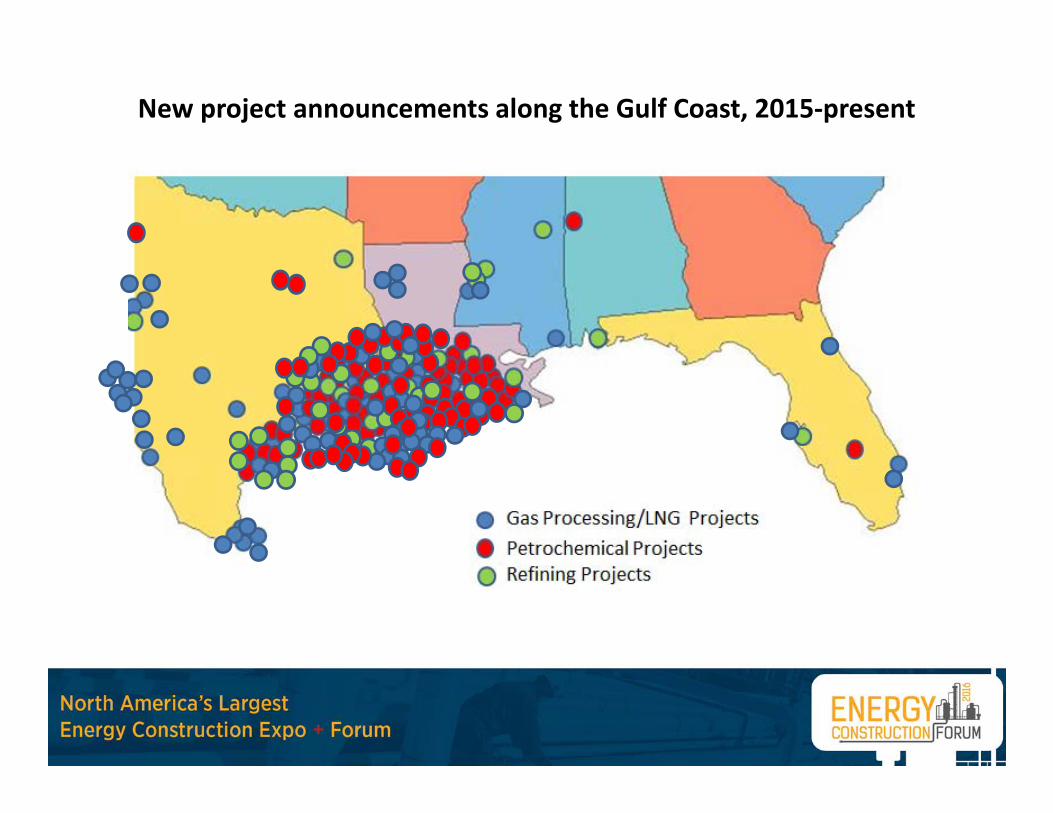
New project announcements along the Gulf Coast, 2015‐present
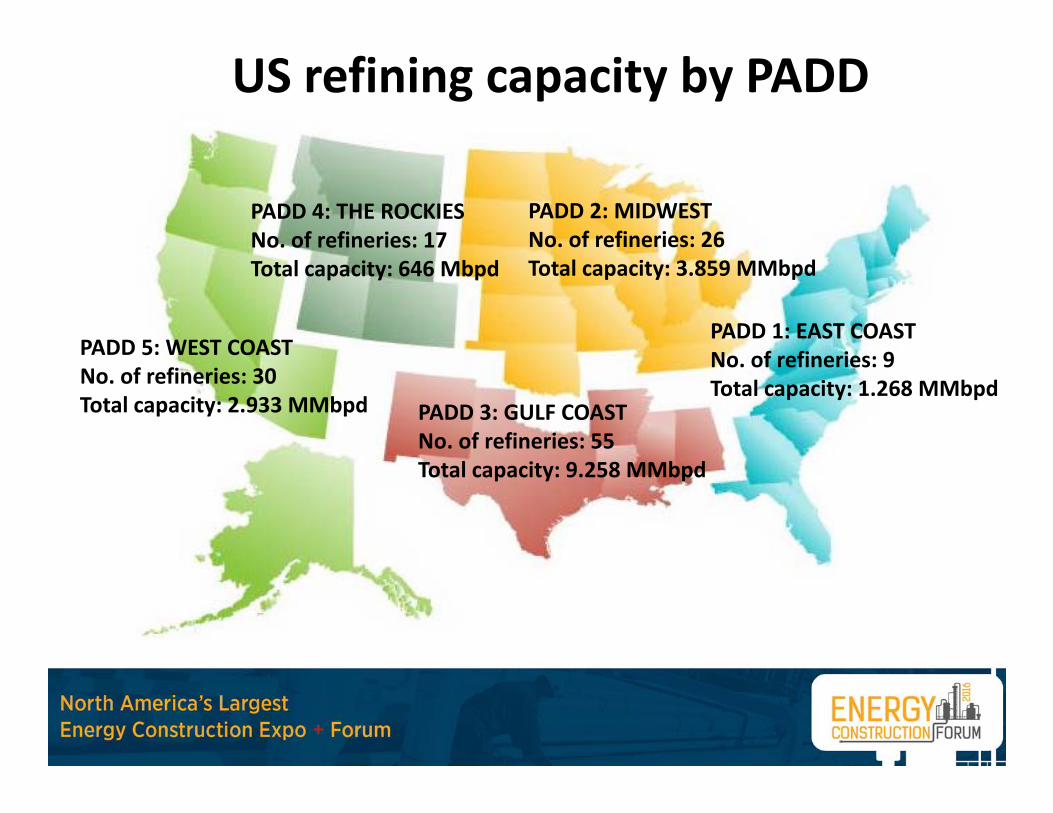
US refining capacity by PADD
PADD 3: GULF COASTNo. of refineries: 55Total capacity: 9.258 MMbpd
PADD 5: WEST COASTNo. of refineries: 30Total capacity: 2.933 MMbpd
PADD 4: THE ROCKIESNo. of refineries: 17Total capacity: 646 Mbpd
PADD 2: MIDWESTNo. of refineries: 26Total capacity: 3.859 MMbpd
PADD 1: EAST COASTNo. of refineries: 9Total capacity: 1.268 MMbpd

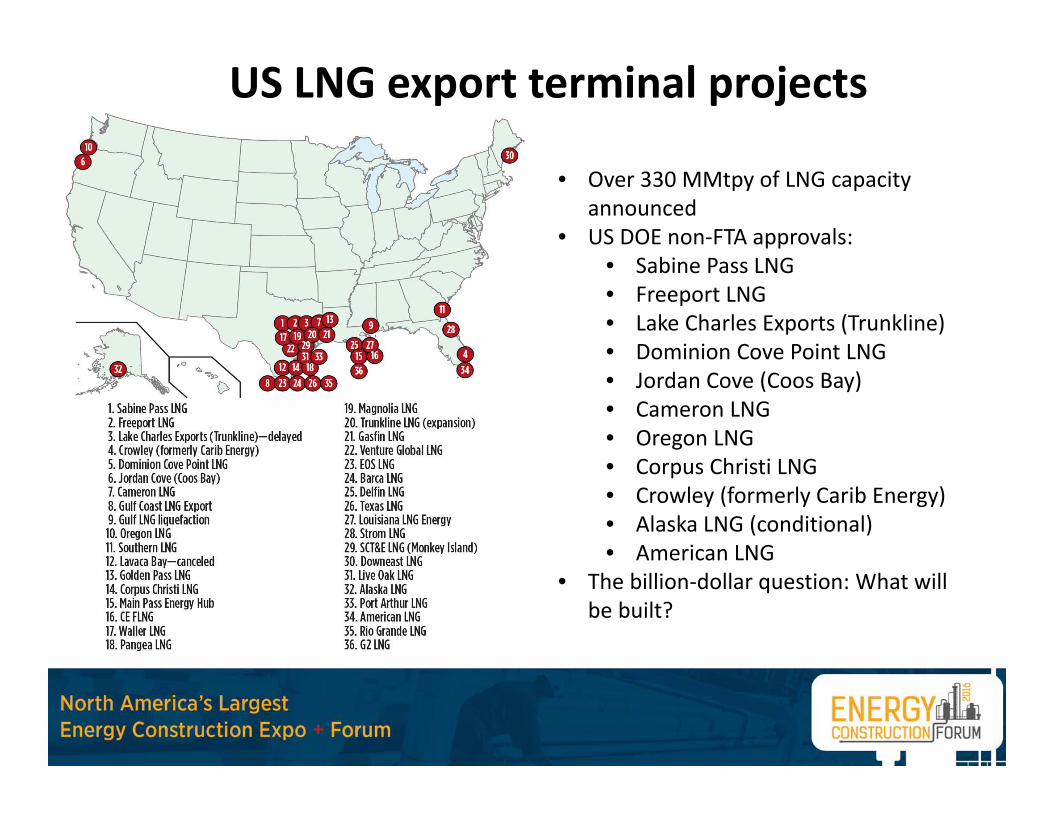
• Over 330 MMtpy of LNG capacity announced
• US DOE non‐FTA approvals:• Sabine Pass LNG• Freeport LNG• Lake Charles Exports (Trunkline)• Dominion Cove Point LNG• Jordan Cove (Coos Bay)• Cameron LNG• Oregon LNG• Corpus Christi LNG• Crowley (formerly Carib Energy)• Alaska LNG (conditional)• American LNG
• The billion‐dollar question: What will be built?
US LNG export terminal projects
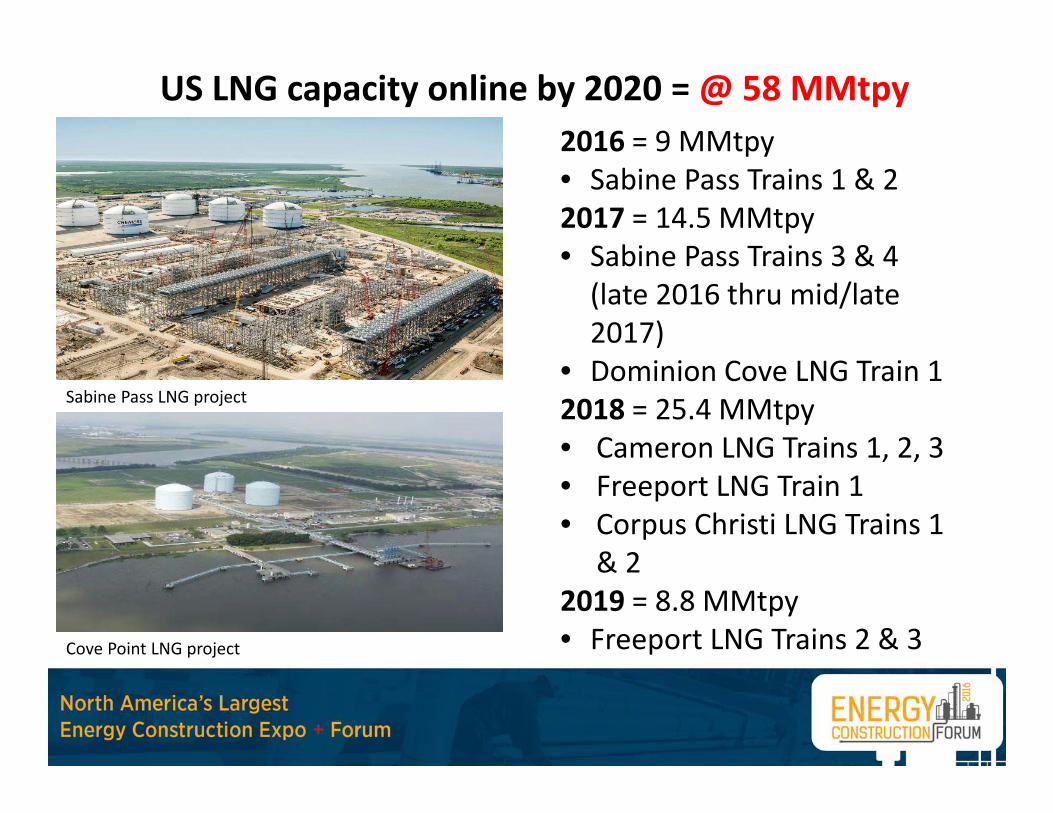
US LNG capacity online by 2020 = @ 58 MMtpy2016 = 9 MMtpy• Sabine Pass Trains 1 & 22017 = 14.5 MMtpy• Sabine Pass Trains 3 & 4 (late 2016 thru mid/late 2017)
• Dominion Cove LNG Train 12018 = 25.4 MMtpy • Cameron LNG Trains 1, 2, 3• Freeport LNG Train 1• Corpus Christi LNG Trains 1
& 22019 = 8.8 MMtpy• Freeport LNG Trains 2 & 3
Sabine Pass LNG project
Cove Point LNG project

US petrochemicals
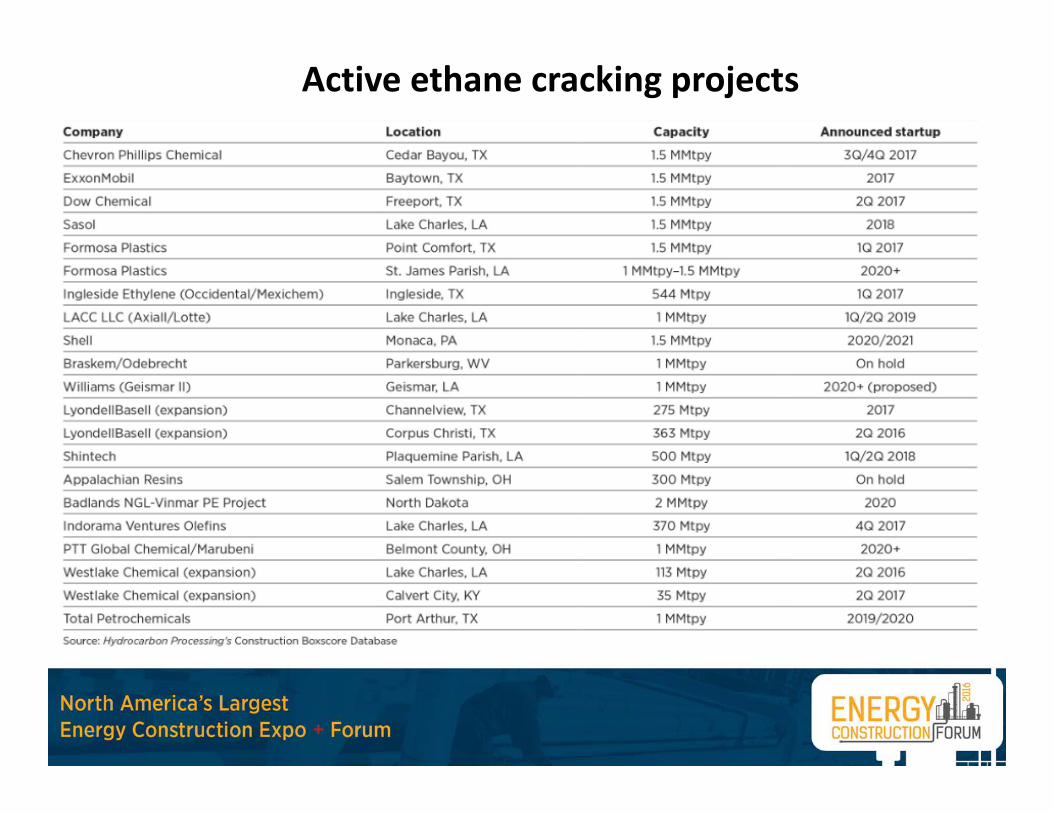
Active ethane cracking projects

Active US methanol projectsCompany Location Capacity Cost, US $ MM Announced start‐up
Methanex – Geismar I Geismar, LA 1 MMtpy 550 Completed 2015
Methanex – Geismar II Geismar, LA 1 MMtpy 550 Completed 2016
OCI (Natgasoline) Beaumont, TX 1.75 MMtpy 1,000 4Q 2016
Valero Norco, LA 1.6 MMtpy 700 2018 (delayed)
NWIW – Port of Kalama Port of Kalama, WA 3.65 MMtpy 1,800 4Q 2019
NWIW – Port of St. Helens Port of St. Helens, OR 3.65 MMtpy 1,800 2021
NWIW – Tacoma Tacoma, WA 7.3 MMtpy 3,400 2021 – Phase 1 (on hold)
South Louisiana Methanol St. James Parish, LA 1.825 MMtpy 1,300 2Q 2017 (delayed)
Celanese/Mitsui Clear Lake, TX 1.3 MMtpy 800 Completed 4Q 2015
Celanese Bishop, TX 1.3 MMtpy 700‐800 2018
CCI Braithwaite, LA 1.825 MMtpy 1,200 2019
Yuhuang Chemical (Plant 1) St. James Parish, LA 1.7 MMtpy 1,000 2018
Yuhuang Chemical (Plant 2) St. James Parish, LA 1.3 MMtpy 1,000 2020
Conell Group‐Chemical Inv. Corp. JV
Shoal Point, TX 7.2 MMtpy 4,500 2020+

PDH • Ethane cracking produces less propylene
as opposed to naphtha cracking• Over 2 MMtpy of new PDH capacity is
under construction or being evaluated • Total investment = +$5 B should projects
be completed• Projects include:Company Capacity Location
Flint Hills 600 Mtpy Texas – completed 2010
Dow Chemical 750 Mtpy Texas – completed 4Q 2015
Enterprise 750 Mtpy Texas
Formosa Plastics 725 Mtpy Texas
Ascend PerformanceMaterials
1 MMtpy Texas – searching for partners
Sunoco Logistics 650 Mtpy Pennsylvania –evaluating
REXtac 450 Mtpy Who knows?
Aerial view of Dow’s Oyster Creek PDH unit

Ammonia‐Urea plant capacity build‐out
• Over $16 B in new ammonia‐urea plant capacity
• Down from $20 B (CHS & EuroChem)
• 2016 – year of the fertilizer build‐out
• Total capacity could top 12 MMtpy by 2020 should all projects be built
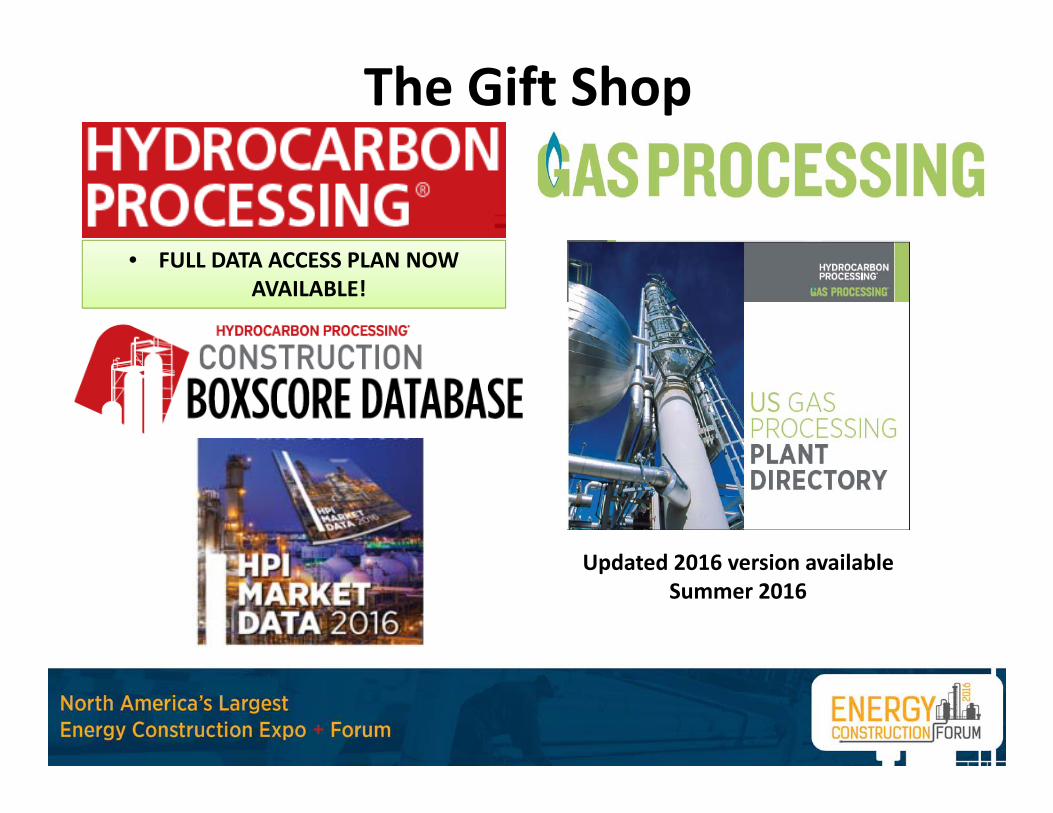
The Gift Shop
Updated 2016 version available Summer 2016
• FULL DATA ACCESS PLAN NOW AVAILABLE!
Contact:
Lee NicholsEditor/Associate PublisherHydrocarbon Processing
Gas Processing Data Division713‐520‐4484

Thank you for attending the 2nd annual ENERGY CONSTRUCTION FORUM


