Acme Intellects International Journal of Research in Management, Social Sciences & Technology ISSN 2320 – 2939 (Print) 2320-2793 (Online) Let your Research be Global search– An Ultimate search of Truth- Reforms through Research Vol- 14 No. 14 Apr 2016
”Aano bhadraa krathavo yanthu vishwathaha”-"Let the noble thoughts come to all from all directions". Page No.1 Acme Intellects Research Center- A wing of Help to Help Charitable Trust®
An empirical study on gender difference in the Investment pattern of retail
Investors by R. Suyam Praba [a]
Abstract
This study aims to understand the impact of gender difference on Investment decision
making and also to determine their most preferred investment avenue. The overall purpose of
this research is to gain knowledge about key factors that influence investment behavior and the
impact of these key factors on the investment decision-making among men and women. In this
study a detailed analysis is made on the investment objective, preference, and the pattern among
men and women.
Keywords: Gender, Investment pattern, Risk profile, Financial information source, Investment
decision making, Preference, Financial dependency, Encouraging factor of Investment,
Borrowing habit
[a] R. Suyam Praba,
Ph.D Research Scholar,
Bharathiar School of Management and Entrepreneur Development,
Bharathiar University, Coimbatore, Tamil Nadu, India.
Email ID: [email protected]
Contact Number: +91 9994371430
1. Introduction:
Financial planning is an essential and inevitable in this modern era where both men and
women are employed, educated and are aware of their financial goals. There are various
investment avenues available in the market in the form of physical assets and financial assets.
They are deposits, gold, insurance, bonds, debentures, land, building, post office savings
account, provident fund, pension plans, national saving certificate, mutual funds, shares and
commodity trading. These avenues give yield and returns, which are competitive enough and are
highly required for the present economic scenario for the survival in the inflated world. The risk-
return factor is one of the important characteristics in selecting an appropriate investment
avenue.
Acme Intellects International Journal of Research in Management, Social Sciences & Technology ISSN 2320 – 2939 (Print) 2320-2793 (Online) Let your Research be Global search– An Ultimate search of Truth- Reforms through Research Vol- 14 No. 14 Apr 2016
”Aano bhadraa krathavo yanthu vishwathaha”-"Let the noble thoughts come to all from all directions". Page No.2 Acme Intellects Research Center- A wing of Help to Help Charitable Trust®
2. Research Objectives:
1) To gain knowledge about key factors that influence investment behavior and impact
investment decision-making processes among men and women.
2) The study examines impact of gender differences on the attitudes towards different types
of savings and investment alternatives.
3) To prepare a comprehensive profile of savings and investment behaviour among men and
women in the context of income, expenditure and consumption patterns.
4) To obtain the risk profile of the men and women relate to their savings and investment
behaviour.
5)
3. Research Methodology
The study presents the investment perceptions between men and women. Keeping this in
mind, schedule was created among the salaried class individual who work in a Bank, NBFC,
Insurance, Mutual Fund, IT, ITES, and in Education institution. The detailed information about
household earnings, savings and investment profile, income-expenditure, financial and non-
financial asset holdings, and aspirations and decisions in investment depending on their
perceptions of various saving and investment options were obtained using a structured
questionnaire. This research has adopted descriptive research design using interview method.
The sampling techniques used for the study is Non-Probabilistic Convenience sampling method.
Since the exact population of salaried class Investors is not known exactly, the selection is left to
the researcher who is to select the sample. The study is based on the responses of 405 individuals
who are salaried income group in Coimbatore city. The data were collected through structured
questionnaire from November 2012 to April 2013. Information was collected on various aspects
of respondents’ investment behaviors, attitudes, and beliefs.
Acme Intellects International Journal of Research in Management, Social Sciences & Technology ISSN 2320 – 2939 (Print) 2320-2793 (Online) Let your Research be Global search– An Ultimate search of Truth- Reforms through Research Vol- 14 No. 14 Apr 2016
”Aano bhadraa krathavo yanthu vishwathaha”-"Let the noble thoughts come to all from all directions". Page No.3 Acme Intellects Research Center- A wing of Help to Help Charitable Trust®
4. Analysis and Interpretation
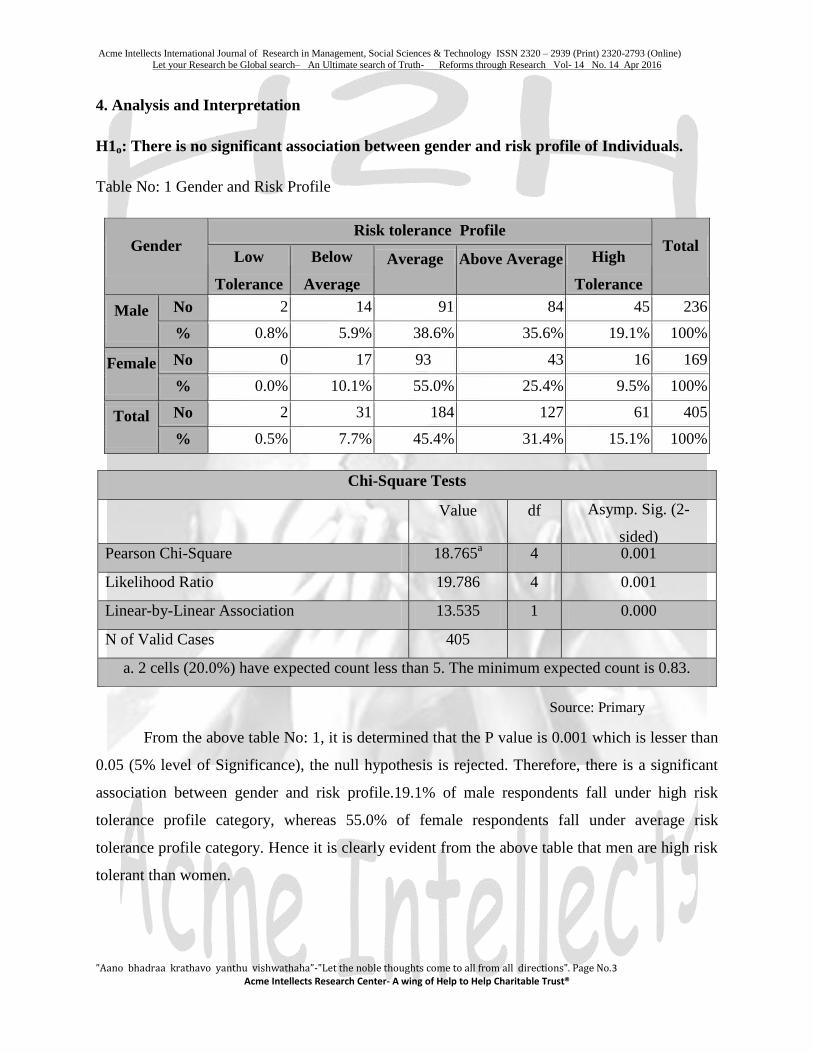
H1o: There is no significant association between gender and risk profile of Individuals.
Table No: 1 Gender and Risk Profile
Gender Risk tolerance Profile
Total Low
Tolerance
Below
Average
Average Above Average High
Tolerance
Male No 2 14 91 84 45 236
% 0.8% 5.9% 38.6% 35.6% 19.1% 100%
Female No 0 17 93 43 16 169
% 0.0% 10.1% 55.0% 25.4% 9.5% 100%
Total No 2 31 184 127 61 405
% 0.5% 7.7% 45.4% 31.4% 15.1% 100%
From the above table No: 1, it is determined that the P value is 0.001 which is lesser than
0.05 (5% level of Significance), the null hypothesis is rejected. Therefore, there is a significant
association between gender and risk profile.19.1% of male respondents fall under high risk
tolerance profile category, whereas 55.0% of female respondents fall under average risk
tolerance profile category. Hence it is clearly evident from the above table that men are high risk
tolerant than women.
Chi-Square Tests
Value df Asymp. Sig. (2-
sided) Pearson Chi-Square 18.765
a 4 0.001
Likelihood Ratio 19.786 4 0.001
Linear-by-Linear Association 13.535 1 0.000
N of Valid Cases 405
a. 2 cells (20.0%) have expected count less than 5. The minimum expected count is 0.83.
Source: Primary
Acme Intellects International Journal of Research in Management, Social Sciences & Technology ISSN 2320 – 2939 (Print) 2320-2793 (Online) Let your Research be Global search– An Ultimate search of Truth- Reforms through Research Vol- 14 No. 14 Apr 2016
”Aano bhadraa krathavo yanthu vishwathaha”-"Let the noble thoughts come to all from all directions". Page No.4 Acme Intellects Research Center- A wing of Help to Help Charitable Trust®
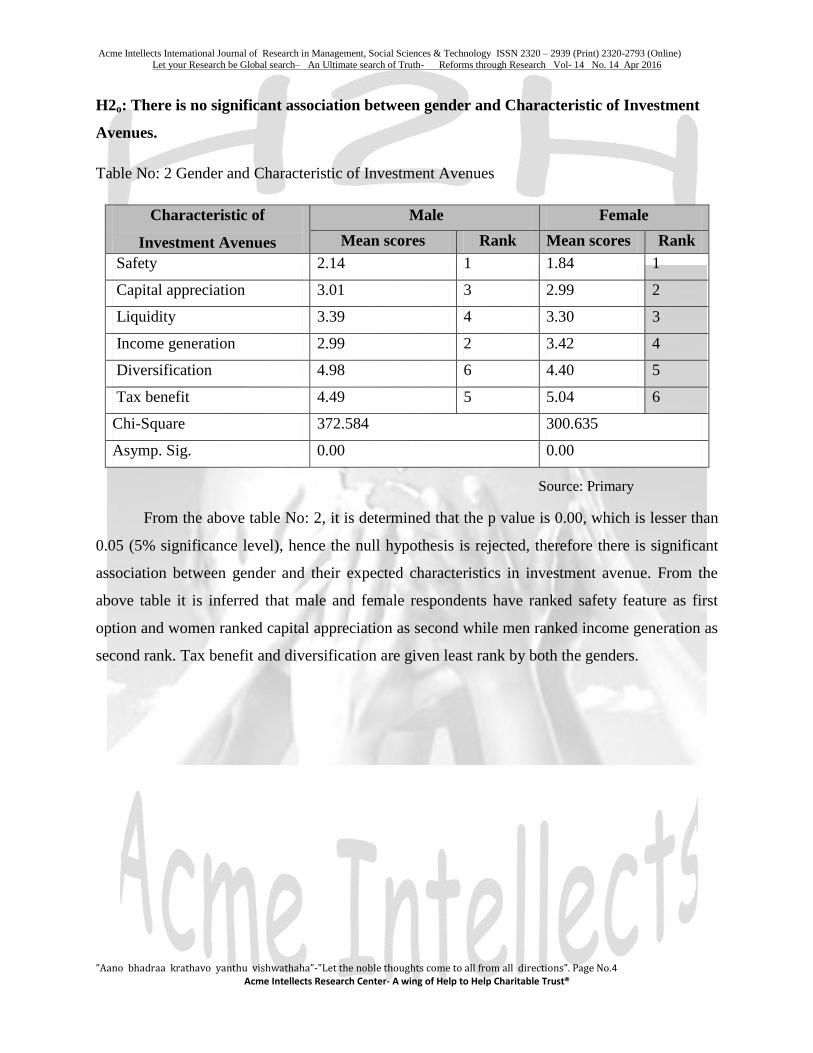
H2o: There is no significant association between gender and Characteristic of Investment
Avenues.
Table No: 2 Gender and Characteristic of Investment Avenues
Characteristic of
Investment Avenues
Male Female
Mean scores Rank Mean scores Rank
Safety 2.14 1 1.84 1
Capital appreciation 3.01 3 2.99 2
Liquidity 3.39 4 3.30 3
Income generation 2.99 2 3.42 4
Diversification 4.98 6 4.40 5
Tax benefit 4.49 5 5.04 6
Chi-Square 372.584 300.635
Asymp. Sig. 0.00 0.00
From the above table No: 2, it is determined that the p value is 0.00, which is lesser than
0.05 (5% significance level), hence the null hypothesis is rejected, therefore there is significant
association between gender and their expected characteristics in investment avenue. From the
above table it is inferred that male and female respondents have ranked safety feature as first
option and women ranked capital appreciation as second while men ranked income generation as
second rank. Tax benefit and diversification are given least rank by both the genders.
Source: Primary
Acme Intellects International Journal of Research in Management, Social Sciences & Technology ISSN 2320 – 2939 (Print) 2320-2793 (Online) Let your Research be Global search– An Ultimate search of Truth- Reforms through Research Vol- 14 No. 14 Apr 2016
”Aano bhadraa krathavo yanthu vishwathaha”-"Let the noble thoughts come to all from all directions". Page No.5 Acme Intellects Research Center- A wing of Help to Help Charitable Trust®
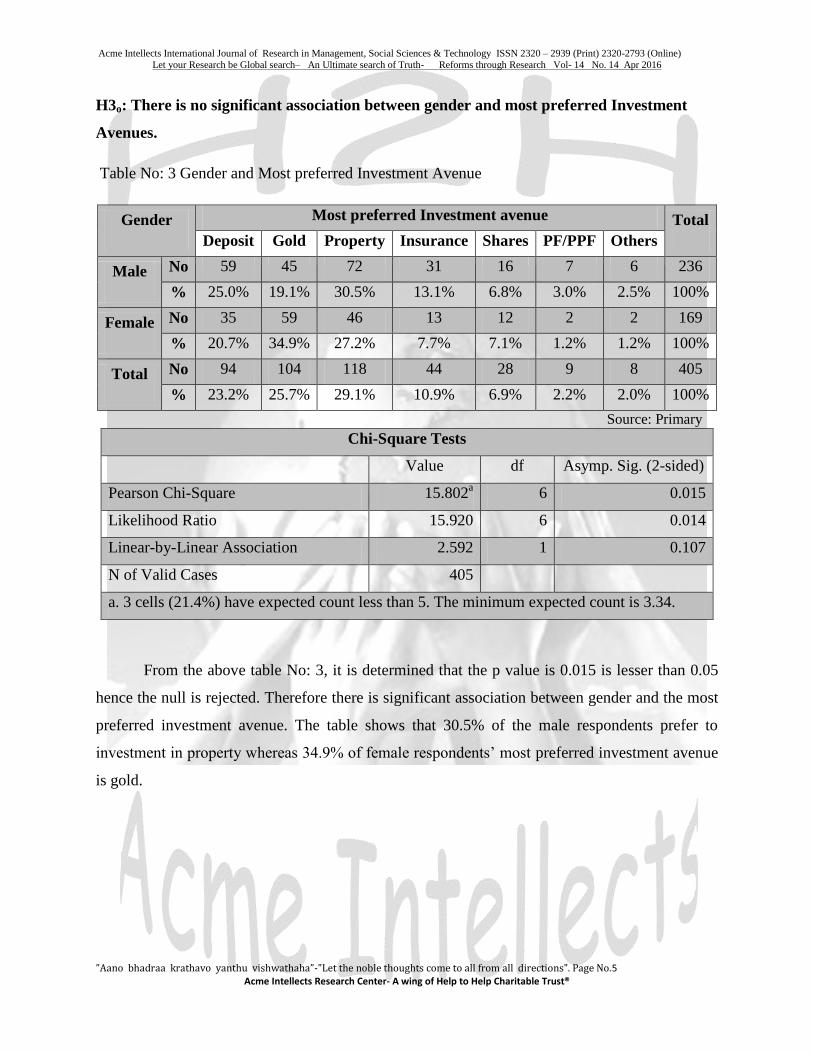
H3o: There is no significant association between gender and most preferred Investment
Avenues.
Table No: 3 Gender and Most preferred Investment Avenue
Gender Most preferred Investment avenue Total
Deposit Gold Property Insurance Shares
/MF
PF/PPF
/NSC
Others
Male No 59 45 72 31 16 7 6 236
% 25.0% 19.1% 30.5% 13.1% 6.8% 3.0% 2.5% 100%
Female No 35 59 46 13 12 2 2 169
% 20.7% 34.9% 27.2% 7.7% 7.1% 1.2% 1.2% 100%
Total No 94 104 118 44 28 9 8 405
% 23.2% 25.7% 29.1% 10.9% 6.9% 2.2% 2.0% 100%
From the above table No: 3, it is determined that the p value is 0.015 is lesser than 0.05
hence the null is rejected. Therefore there is significant association between gender and the most
preferred investment avenue. The table shows that 30.5% of the male respondents prefer to
investment in property whereas 34.9% of female respondents’ most preferred investment avenue
is gold.
Chi-Square Tests
Value df Asymp. Sig. (2-sided)
Pearson Chi-Square 15.802a 6 0.015
Likelihood Ratio 15.920 6 0.014
Linear-by-Linear Association 2.592 1 0.107
N of Valid Cases 405
a. 3 cells (21.4%) have expected count less than 5. The minimum expected count is 3.34.
Source: Primary
Acme Intellects International Journal of Research in Management, Social Sciences & Technology ISSN 2320 – 2939 (Print) 2320-2793 (Online) Let your Research be Global search– An Ultimate search of Truth- Reforms through Research Vol- 14 No. 14 Apr 2016
”Aano bhadraa krathavo yanthu vishwathaha”-"Let the noble thoughts come to all from all directions". Page No.6 Acme Intellects Research Center- A wing of Help to Help Charitable Trust®
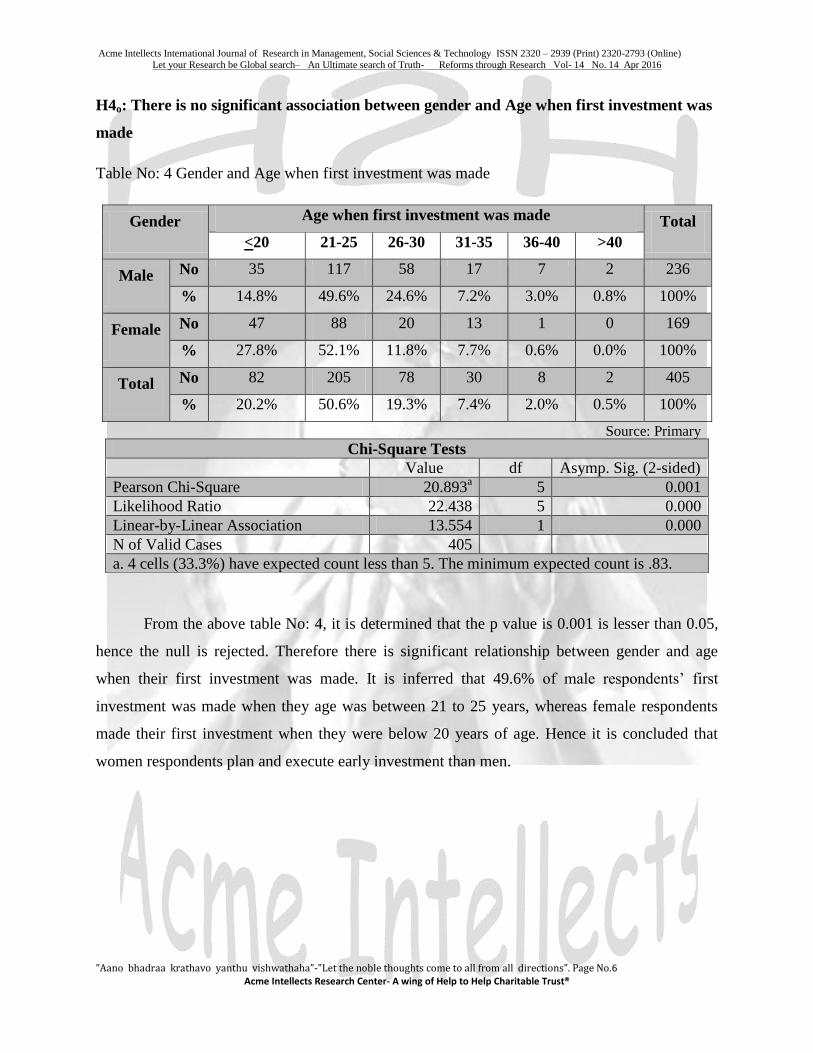
H4o: There is no significant association between gender and Age when first investment was
made
Table No: 4 Gender and Age when first investment was made
Gender Age when first investment was made Total
<20 21-25 26-30 31-35 36-40 >40
Male No 35 117 58 17 7 2 236
% 14.8% 49.6% 24.6% 7.2% 3.0% 0.8% 100%
Female No 47 88 20 13 1 0 169
% 27.8% 52.1% 11.8% 7.7% 0.6% 0.0% 100%
Total No 82 205 78 30 8 2 405
% 20.2% 50.6% 19.3% 7.4% 2.0% 0.5% 100%
From the above table No: 4, it is determined that the p value is 0.001 is lesser than 0.05,
hence the null is rejected. Therefore there is significant relationship between gender and age
when their first investment was made. It is inferred that 49.6% of male respondents’ first
investment was made when they age was between 21 to 25 years, whereas female respondents
made their first investment when they were below 20 years of age. Hence it is concluded that
women respondents plan and execute early investment than men.
Chi-Square Tests
Value df Asymp. Sig. (2-sided)
Pearson Chi-Square 20.893a 5 0.001
Likelihood Ratio 22.438 5 0.000
Linear-by-Linear Association 13.554 1 0.000
N of Valid Cases 405
a. 4 cells (33.3%) have expected count less than 5. The minimum expected count is .83.
Source: Primary
Acme Intellects International Journal of Research in Management, Social Sciences & Technology ISSN 2320 – 2939 (Print) 2320-2793 (Online) Let your Research be Global search– An Ultimate search of Truth- Reforms through Research Vol- 14 No. 14 Apr 2016
”Aano bhadraa krathavo yanthu vishwathaha”-"Let the noble thoughts come to all from all directions". Page No.7 Acme Intellects Research Center- A wing of Help to Help Charitable Trust®
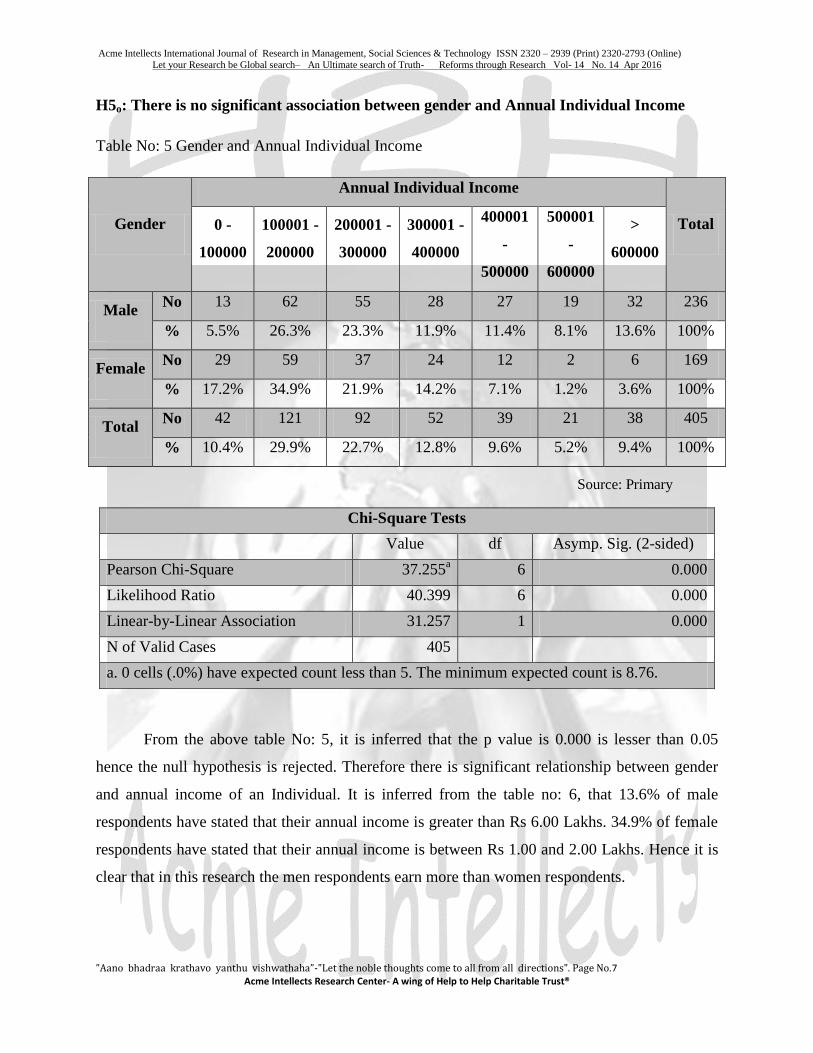
H5o: There is no significant association between gender and Annual Individual Income
Table No: 5 Gender and Annual Individual Income
Gender
Annual Individual Income
Total 0 -
100000
100001 -
200000
200001 -
300000
300001 -
400000
400001
-
500000
500001
-
600000
>
600000
Male No 13 62 55 28 27 19 32 236
% 5.5% 26.3% 23.3% 11.9% 11.4% 8.1% 13.6% 100%
Female No 29 59 37 24 12 2 6 169
% 17.2% 34.9% 21.9% 14.2% 7.1% 1.2% 3.6% 100%
Total No 42 121 92 52 39 21 38 405
% 10.4% 29.9% 22.7% 12.8% 9.6% 5.2% 9.4% 100%
Chi-Square Tests
Value df Asymp. Sig. (2-sided)
Pearson Chi-Square 37.255a 6 0.000
Likelihood Ratio 40.399 6 0.000
Linear-by-Linear Association 31.257 1 0.000
N of Valid Cases 405
a. 0 cells (.0%) have expected count less than 5. The minimum expected count is 8.76.
From the above table No: 5, it is inferred that the p value is 0.000 is lesser than 0.05
hence the null hypothesis is rejected. Therefore there is significant relationship between gender
and annual income of an Individual. It is inferred from the table no: 6, that 13.6% of male
respondents have stated that their annual income is greater than Rs 6.00 Lakhs. 34.9% of female
respondents have stated that their annual income is between Rs 1.00 and 2.00 Lakhs. Hence it is
clear that in this research the men respondents earn more than women respondents.
Source: Primary
Acme Intellects International Journal of Research in Management, Social Sciences & Technology ISSN 2320 – 2939 (Print) 2320-2793 (Online) Let your Research be Global search– An Ultimate search of Truth- Reforms through Research Vol- 14 No. 14 Apr 2016
”Aano bhadraa krathavo yanthu vishwathaha”-"Let the noble thoughts come to all from all directions". Page No.8 Acme Intellects Research Center- A wing of Help to Help Charitable Trust®
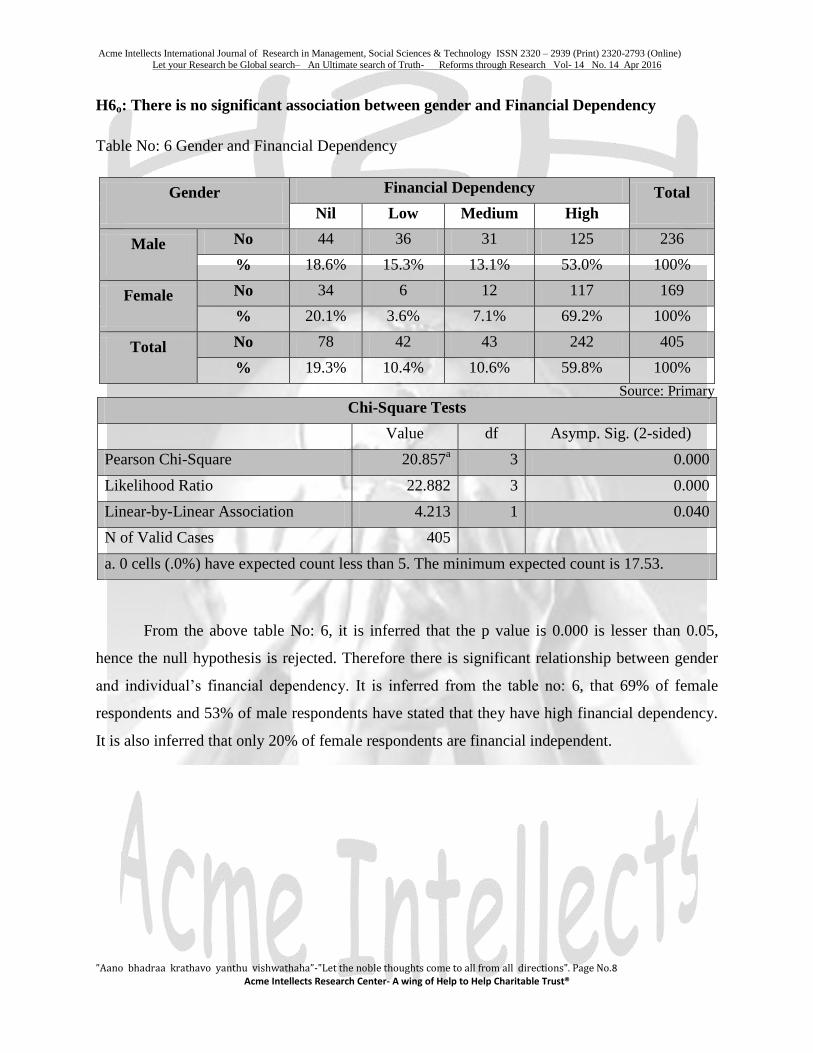
H6o: There is no significant association between gender and Financial Dependency
Table No: 6 Gender and Financial Dependency
Gender Financial Dependency Total
Nil Low Medium High
Male No 44 36 31 125 236
% 18.6% 15.3% 13.1% 53.0% 100%
Female No 34 6 12 117 169
% 20.1% 3.6% 7.1% 69.2% 100%
Total No 78 42 43 242 405
% 19.3% 10.4% 10.6% 59.8% 100%
From the above table No: 6, it is inferred that the p value is 0.000 is lesser than 0.05,
hence the null hypothesis is rejected. Therefore there is significant relationship between gender
and individual’s financial dependency. It is inferred from the table no: 6, that 69% of female
respondents and 53% of male respondents have stated that they have high financial dependency.
It is also inferred that only 20% of female respondents are financial independent.
Chi-Square Tests
Value df Asymp. Sig. (2-sided)
Pearson Chi-Square 20.857a 3 0.000
Likelihood Ratio 22.882 3 0.000
Linear-by-Linear Association 4.213 1 0.040
N of Valid Cases 405
a. 0 cells (.0%) have expected count less than 5. The minimum expected count is 17.53.
Source: Primary
Acme Intellects International Journal of Research in Management, Social Sciences & Technology ISSN 2320 – 2939 (Print) 2320-2793 (Online) Let your Research be Global search– An Ultimate search of Truth- Reforms through Research Vol- 14 No. 14 Apr 2016
”Aano bhadraa krathavo yanthu vishwathaha”-"Let the noble thoughts come to all from all directions". Page No.9 Acme Intellects Research Center- A wing of Help to Help Charitable Trust®
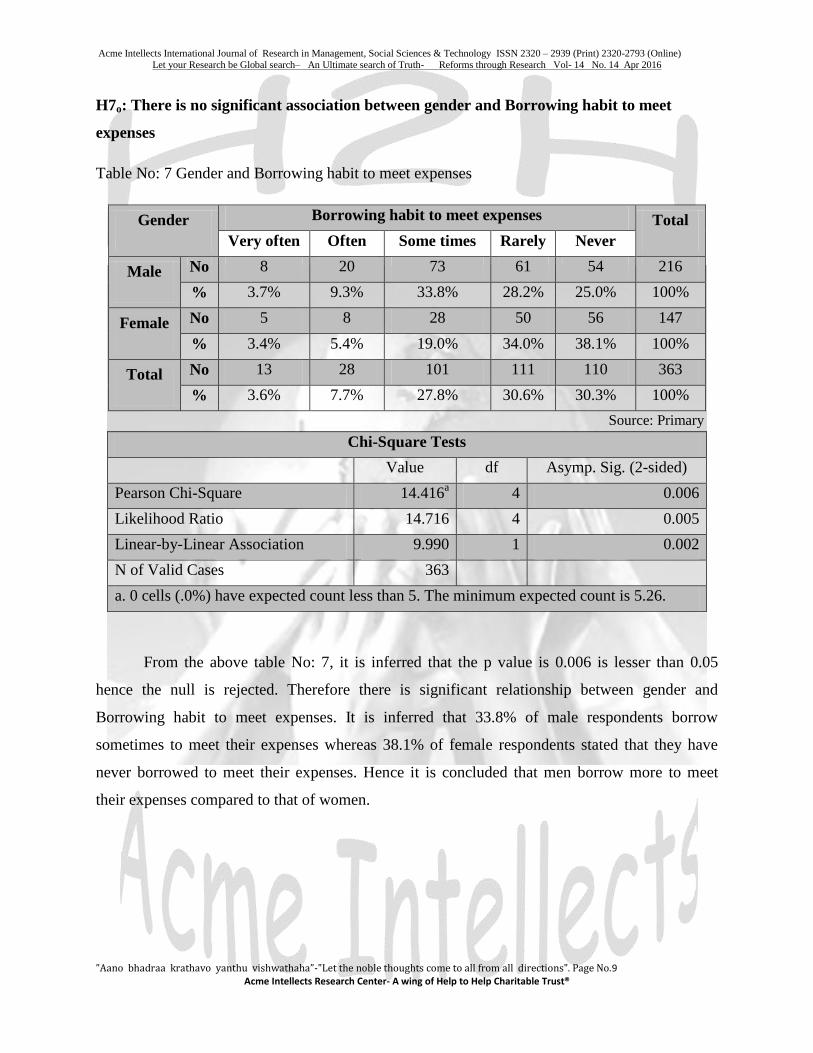
H7o: There is no significant association between gender and Borrowing habit to meet
expenses
Table No: 7 Gender and Borrowing habit to meet expenses
Gender Borrowing habit to meet expenses Total
Very often Often Some times Rarely Never
Male No 8 20 73 61 54 216
% 3.7% 9.3% 33.8% 28.2% 25.0% 100%
Female No 5 8 28 50 56 147
% 3.4% 5.4% 19.0% 34.0% 38.1% 100%
Total No 13 28 101 111 110 363
% 3.6% 7.7% 27.8% 30.6% 30.3% 100%
From the above table No: 7, it is inferred that the p value is 0.006 is lesser than 0.05
hence the null is rejected. Therefore there is significant relationship between gender and
Borrowing habit to meet expenses. It is inferred that 33.8% of male respondents borrow
sometimes to meet their expenses whereas 38.1% of female respondents stated that they have
never borrowed to meet their expenses. Hence it is concluded that men borrow more to meet
their expenses compared to that of women.
Chi-Square Tests
Value df Asymp. Sig. (2-sided)
Pearson Chi-Square 14.416a 4 0.006
Likelihood Ratio 14.716 4 0.005
Linear-by-Linear Association 9.990 1 0.002
N of Valid Cases 363
a. 0 cells (.0%) have expected count less than 5. The minimum expected count is 5.26.
Source: Primary
Acme Intellects International Journal of Research in Management, Social Sciences & Technology ISSN 2320 – 2939 (Print) 2320-2793 (Online) Let your Research be Global search– An Ultimate search of Truth- Reforms through Research Vol- 14 No. 14 Apr 2016
”Aano bhadraa krathavo yanthu vishwathaha”-"Let the noble thoughts come to all from all directions". Page No.10 Acme Intellects Research Center- A wing of Help to Help Charitable Trust®
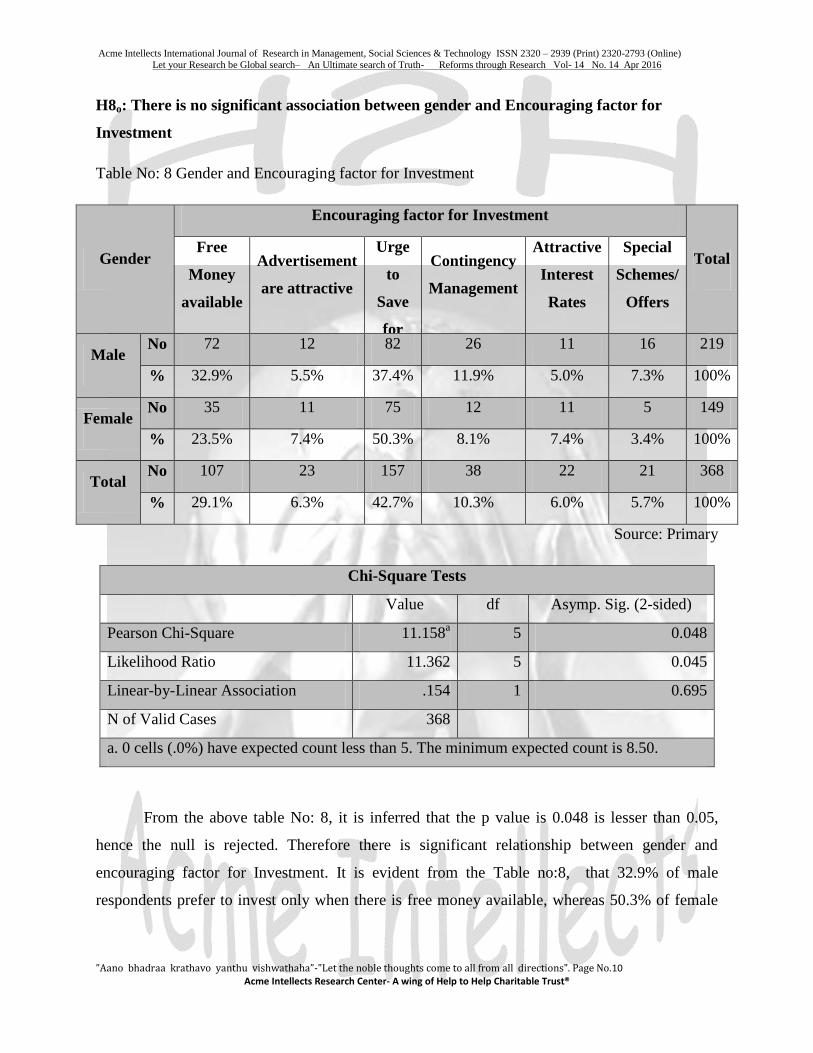
H8o: There is no significant association between gender and Encouraging factor for
Investment
Table No: 8 Gender and Encouraging factor for Investment
Gender
Encouraging factor for Investment
Total Free
Money
available
Advertisement
are attractive
Urge
to
Save
for
future
Contingency
Management
Attractive
Interest
Rates
Special
Schemes/
Offers
Male No 72 12 82 26 11 16 219
% 32.9% 5.5% 37.4% 11.9% 5.0% 7.3% 100%
Female No 35 11 75 12 11 5 149
% 23.5% 7.4% 50.3% 8.1% 7.4% 3.4% 100%
Total No 107 23 157 38 22 21 368
% 29.1% 6.3% 42.7% 10.3% 6.0% 5.7% 100%
Source: Primary
Chi-Square Tests
Value df Asymp. Sig. (2-sided)
Pearson Chi-Square 11.158a 5 0.048
Likelihood Ratio 11.362 5 0.045
Linear-by-Linear Association .154 1 0.695
N of Valid Cases 368
a. 0 cells (.0%) have expected count less than 5. The minimum expected count is 8.50.
From the above table No: 8, it is inferred that the p value is 0.048 is lesser than 0.05,
hence the null is rejected. Therefore there is significant relationship between gender and
encouraging factor for Investment. It is evident from the Table no:8, that 32.9% of male
respondents prefer to invest only when there is free money available, whereas 50.3% of female
Acme Intellects International Journal of Research in Management, Social Sciences & Technology ISSN 2320 – 2939 (Print) 2320-2793 (Online) Let your Research be Global search– An Ultimate search of Truth- Reforms through Research Vol- 14 No. 14 Apr 2016
”Aano bhadraa krathavo yanthu vishwathaha”-"Let the noble thoughts come to all from all directions". Page No.11 Acme Intellects Research Center- A wing of Help to Help Charitable Trust®
respondents have the urge to save for future is the major encouraging factor behind their
Investment.
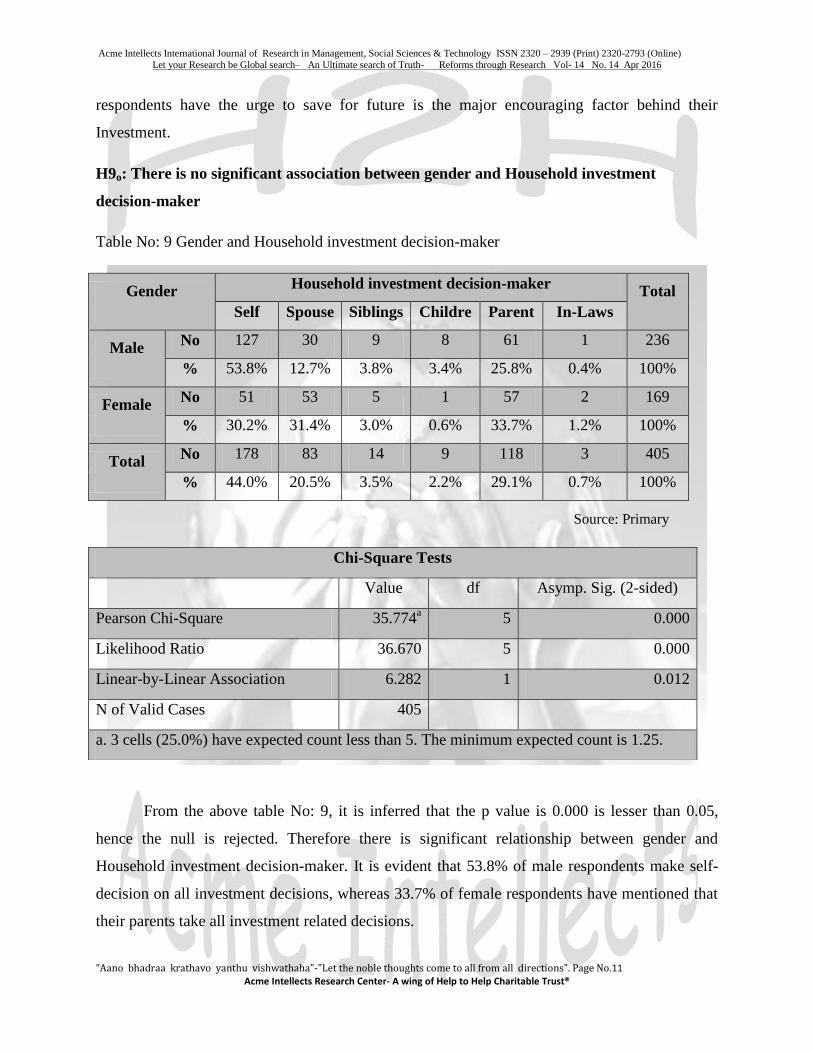
H9o: There is no significant association between gender and Household investment
decision-maker
Table No: 9 Gender and Household investment decision-maker
Gender Household investment decision-maker
Total
Self Spouse Siblings Childre
n
Parent
s
In-Laws
Male No 127 30 9 8 61 1 236
% 53.8% 12.7% 3.8% 3.4% 25.8% 0.4% 100%
Female No 51 53 5 1 57 2 169
% 30.2% 31.4% 3.0% 0.6% 33.7% 1.2% 100%
Total No 178 83 14 9 118 3 405
% 44.0% 20.5% 3.5% 2.2% 29.1% 0.7% 100%
From the above table No: 9, it is inferred that the p value is 0.000 is lesser than 0.05,
hence the null is rejected. Therefore there is significant relationship between gender and
Household investment decision-maker. It is evident that 53.8% of male respondents make self-
decision on all investment decisions, whereas 33.7% of female respondents have mentioned that
their parents take all investment related decisions.
Chi-Square Tests
Value df Asymp. Sig. (2-sided)
Pearson Chi-Square 35.774a 5 0.000
Likelihood Ratio 36.670 5 0.000
Linear-by-Linear Association 6.282 1 0.012
N of Valid Cases 405
a. 3 cells (25.0%) have expected count less than 5. The minimum expected count is 1.25.
Source: Primary
Acme Intellects International Journal of Research in Management, Social Sciences & Technology ISSN 2320 – 2939 (Print) 2320-2793 (Online) Let your Research be Global search– An Ultimate search of Truth- Reforms through Research Vol- 14 No. 14 Apr 2016
”Aano bhadraa krathavo yanthu vishwathaha”-"Let the noble thoughts come to all from all directions". Page No.12 Acme Intellects Research Center- A wing of Help to Help Charitable Trust®
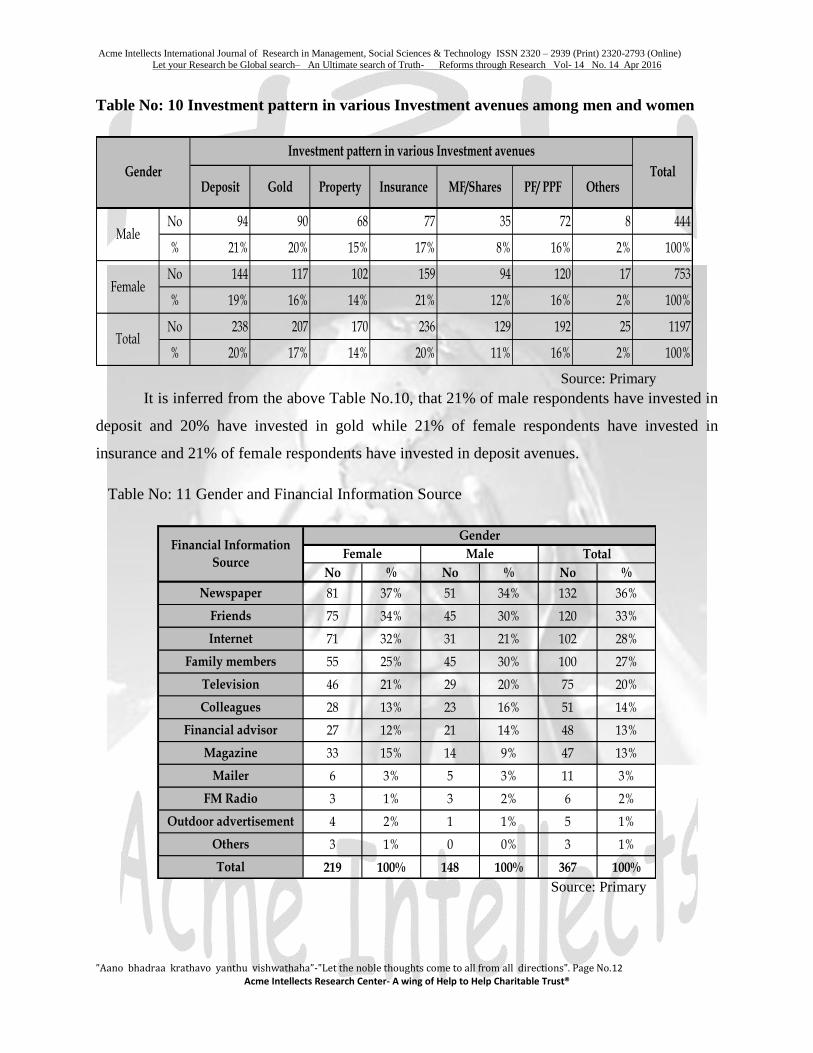
Table No: 10 Investment pattern in various Investment avenues among men and women
Deposit Gold Property Insurance MF/Shares PF/ PPF Others
No 94 90 68 77 35 72 8 444
% 21% 20% 15% 17% 8% 16% 2% 100%
No 144 117 102 159 94 120 17 753
% 19% 16% 14% 21% 12% 16% 2% 100%
No 238 207 170 236 129 192 25 1197
% 20% 17% 14% 20% 11% 16% 2% 100%
Female
Total
Gender
Investment pattern in various Investment avenues
Total
Male
It is inferred from the above Table No.10, that 21% of male respondents have invested in
deposit and 20% have invested in gold while 21% of female respondents have invested in
insurance and 21% of female respondents have invested in deposit avenues.
Table No: 11 Gender and Financial Information Source
No % No % No %
81 37% 51 34% 132 36%
75 34% 45 30% 120 33%
71 32% 31 21% 102 28%
55 25% 45 30% 100 27%
46 21% 29 20% 75 20%
28 13% 23 16% 51 14%
27 12% 21 14% 48 13%
33 15% 14 9% 47 13%
6 3% 5 3% 11 3%
3 1% 3 2% 6 2%
4 2% 1 1% 5 1%
3 1% 0 0% 3 1%
219 100% 148 100% 367 100%
Outdoor advertisement
Others
Total
GenderFinancial Information
Source
Television
Colleagues
Financial advisor
Magazine
Mailer
FM Radio
Newspaper
Friends
Internet
Family members
Female Male Total
Source: Primary
Source: Primary
Acme Intellects International Journal of Research in Management, Social Sciences & Technology ISSN 2320 – 2939 (Print) 2320-2793 (Online) Let your Research be Global search– An Ultimate search of Truth- Reforms through Research Vol- 14 No. 14 Apr 2016
”Aano bhadraa krathavo yanthu vishwathaha”-"Let the noble thoughts come to all from all directions". Page No.13 Acme Intellects Research Center- A wing of Help to Help Charitable Trust®
From the above Table No.11, it is inferred that 37% of female respondents gather
financial information from newspaper and 34% from their friends, while 34% of male
respondents gather financial information from newspaper and 30% from their family members
and friends each.
5. Findings:
Gender differences are significant with the willingness to take risk between men and
women. It is concluded that male investors have high tolerance in their risk profile (19.1%),
whereas the female investors are not above average in their risk profile (65%). Men (33.8%)
borrow sometimes to meet their expenses, while women (38.1%) have never borrowed to meet
their expenses. When studied on their annual income, it is evident that men earn more when
compared to women. Women (69.2%) are highly financially dependent than men. Newspaper is
the first financial information source for men and women, but the study reveals that women use
internet and read magazine more when compared to men. Men (53.8%) take self-decision on
investment in their family while women (33.7%) reveal their parents take investment decisions in
their family. Men (32.9%) have stated that they invest only when free money is available; while
women (50.3%) have stated that it the urge to save for future encourages them to invest. Both
men and women have ranked safety feature as first characteristics of any Investment avenue, and
men ranked income generation as second and women ranked capital appreciation as second
characteristics of Investment Avenue. Men (30.5%) prefer to invest in property and women
(34.9%) prefer to invest in gold, but when probed on their actual investment pattern, the study
reveals that men (21%) have invested in deposit while women (21%) have invested in insurance.
6. Limitations of the Study
1) Sample size of the study is 405 salaried educated Investors in Coimbatore city. The
sample size may not adequately represent the national market.
2) This study has not been conducted for a longer time horizon covering market ups and
downs. The state of market has a significant influence on the buying patterns and
preferences of Investors. The study was conducted during a particular period of time and
hence it will not be applicable for all periods.
3) The study being based on a survey of Investors, it includes all limitations inherent in the
questionnaire form of research.
Acme Intellects International Journal of Research in Management, Social Sciences & Technology ISSN 2320 – 2939 (Print) 2320-2793 (Online) Let your Research be Global search– An Ultimate search of Truth- Reforms through Research Vol- 14 No. 14 Apr 2016
”Aano bhadraa krathavo yanthu vishwathaha”-"Let the noble thoughts come to all from all directions". Page No.14 Acme Intellects Research Center- A wing of Help to Help Charitable Trust®
7. Conclusion
From this research, it is evident that there is wide difference in risk attitude, preference,
selection, pre-evaluation, financial information source, reference group, financial motive,
financial planning, income level, borrowing habit, and investment decision making of both men
and women. This study includes working class respondents, who are educated and employed in
service sector. It is inferred from the study that women even though educated, and employed, but
still they are financial dependent on others. They have average risk attitude and still unable to
take self decision on Investment, either the investment decisions are done by their parents or by
their spouse. Hence women have to be equipped with more financial information and they have
to be given financial freedom to make their investment choice. Indian women’s preference to
gold is not unusual and men prefer to invest in property – physical asset. Considering the risk
appetitive of women investment avenue education has to impart by financial institutions and
NGOs by announcing special schemes to encourage their investment behavior.
8. Future Work
The influence of marriage on gender is to be probed. A comparative study on married
men and women and unmarried men and women can be done. There is a need to conduct further
research on the relation between married women and selection of Investment Avenue. The
factors influencing their investment decisions post marriage can be studied in detailed. Similar
Investment study can be repeated among non-earning women and self-employed men and
women to understand their investment pattern.
Acme Intellects International Journal of Research in Management, Social Sciences & Technology ISSN 2320 – 2939 (Print) 2320-2793 (Online) Let your Research be Global search– An Ultimate search of Truth- Reforms through Research Vol- 14 No. 14 Apr 2016
”Aano bhadraa krathavo yanthu vishwathaha”-"Let the noble thoughts come to all from all directions". Page No.15 Acme Intellects Research Center- A wing of Help to Help Charitable Trust®
9. References
1) Jianakoplos, Nancy A., and Alexandra Bernasek. 1998. Are women more risk averse? Economic
Inquiry 36:620-630.
2) Loibl, Cäzilia, and Tahira K. Hira. 2006. A workplace and gender-related perspective on
financial planning information sources and knowledge outcomes. Financial Services Review 15
(1):21-42.
3) Lalit Mohan Kathuria and Kanika Singhania (2012),” Investment Decision Making: A Gender-
Based Study of Private Sector Bank Employees”, The IUP Journal of Behavioral Finance, Vol.
IX, No. 56 1, 2012.
4) Mittal M and Vyas R K (2007), “Demographics and Investment Choice Among Indian Investors”,
The IUP Journal of Behavioral Finance, Vol. 4, No. 4, pp. 51-65.
5) Roszkowski M J and Grable J (2005), “Gender Stereotypes in Advisors’ Clinical Judgments of
Financial Risk Tolerance: Objects in the Mirror are Closer than they Appear”, Journal of
Behavioral Finance, Vol. 6, No. 4, pp. 181-191.
6) Singh J and Chander S (2006), “Investors’ Preference for Investment in Mutual Funds: An
Empirical Evidence”, The IUP Journal of Behavioral Finance, Vol. 3, No. 1, pp. 55-70.
7) Tahira Hira, Cäzilia Loibl, (2006) “Gender Differences in Investment Behavior” Milestone 3
Report.


