Download - An Analysis of Kirlian Electrophotography
Rochester Institute of TechnologyRIT Scholar Works
Theses Thesis/Dissertation Collections
1977
An Analysis of Kirlian ElectrophotographyRobert Suba
Follow this and additional works at: http://scholarworks.rit.edu/theses
This Senior Project is brought to you for free and open access by the Thesis/Dissertation Collections at RIT Scholar Works. It has been accepted forinclusion in Theses by an authorized administrator of RIT Scholar Works. For more information, please contact [email protected].
Recommended CitationSuba, Robert, "An Analysis of Kirlian Electrophotography" (1977). Thesis. Rochester Institute of Technology. Accessed from
An Analysis of Ifirlian Electrophotography
by
Robert S. Suba
A thesis submitted in partial fulfillment of the
requirements for the degree of Bachelor of Science in the
Sohool of Photographic Science and Instrumentation in the College
of Graphic Arts and Photography of the Rochester Institute of Technology
May, 1977
Thesis Advisor: a-Lr,, y. .'. ;--. a. ._<,*
Z Vr, G. w. Schumann
ACKNOWLEDGEMENTS
The author wishes to thank the Central Intelligence Agency
for the money they gratefully provided for the purchase of
film and other required materials. Thanks must also be extend-
ed to Professer William A. Tiller of the physics department at
Stanford University, who generously provided the author with
the ^G^sgcjry technical information via letters and telephone
conversations, and to Mr. Nile Root of the biomedical photography
department at RIT, who agreed to serve as thesis advisor and
provided the apparatus needed for the entire school year.

,C$^TZ^ 2^?
TABLE OF CONTENTS
Page
List of Tables a
List of .Figures b
Abstract c
Introduction and Objectives i
Theory vi
Experimental ix
Results xii
Uisscussion xvii
Conclusions .xxii
List of References xxiv?

a-
LIST OF TABLES
PageTable one-ANOVA Data and Raw Data xi:V
Table two- ANOVA Table xiv
Table three- " Mxw
Table four Tests for Functional Relationships xvi
Table five- Revised ANCVA Table xvi

-b-
LIST OF FIGURES
Par
Figure one- Position of the Object in a Kirlian i 'i
Device
Figure two- Kirlian Device Block Flow Diagram iii
Figure three- " " Output Waveform iv
Figure four- Object-Electrode Arrangement iv
Figure five- EJeotron Supply Function for a Metal vii
Figure six-- External Electrode Setup ix
Figure seven- Microdensitometer Scan of the image of xvii
one line in the grid pattern
Figure Eight- Perpendicular Field Component vs. Dis- >:vi v
tance for Linear Charge of width 40 uM
Figure nine- Effect of Increasing voltage and pulse rep- xxv
Atition rate

-c-
ABSTRACT
The objective of this research effort was to investigate the
process of Kirlian electrophotography with respect to the phys
ical processes which occur during the exposure, and the electric
al parameters of the exposing device. This project was not intended
to discuss what possible parapsychological phenomina are revealed
by Kirlian electrophotography, or it's possible applications , Tne
following is a list of conclusions v/hich were drawn from the exp
erimentation.
1 )The Kirlian image is a result of a complex process known as
field emission of conducting objects under an applied high voltage
A. 'ZiiAQy -:.',,:.:. c field. Furthermore, it is the belief cf theauthor-
that this is the only process which contributes to the formation
of the photographic image. The process of field emission is mainly
a function of the local{microscoplq)aelectric field strength,
2)Field emission will occur only with materials with sufficient
free electrons which can he liberated from the object's surface.
Metals, and living systems such as human and plant tissue are the
only materials known which meet this criterion. Semiconductors were
not tried.
3) For the apparatus used, the only electrical parameters which make
a signifigaht contribution to the subjective quality of images of
living systems when compared to experimental error are the appliedvoltage
and the pulse envelope repetition rate. Furthermore, there appears to

-d-
exist a linear relationship between the pulse envelope rep^ti'-ion
rate and this quality factor. The relationship between voltage and
quality is much more complex, and has an optimum value ofapproxi-
matly 22 Kilovolts peak-to-peak.

INTRODUCTION AND OBJECTIVES
In recent years, much interest has been devoted towards the
bject of Kirlian photography (which will be referrred to as K Ir
an electrophotography throughout this paper). It has been cited
parapsychologists as a means of viewing the dynamics ofbioioa-
10 Ial systems, by some doctors as a means of predicting disease, and
r its 7 many critics as nothing but an indicator of an object^
3alt content! Obviously, not all of these hypotheses can he correct-
e-rhaps none of them are. What is needed is an analyticalinvesti-
ation to scientifically determine what Kirlian electrophotography
s and what it can really do. It is the main objective of this re
search effort to answer the former question as thoroughly as possible
m the framework of the research course, using the tools of p nysics,
statistics, and piiotographic science.
A Brief History of Kirlian Electrophotography
The invention of Kirlian electrophotography is attributed to Dr.
Semyon Kirlian and his wife Valentia, who began their work in the
I
fifties.. His method, which he calls "Photography by High Frequency
Currents",was unknown to anyone in the U.S. untill the middle six
ties when Dr. Kirlian published his first paper in the U.S. on the
subject.-^In this essay, he described a way of transforming the non-

electrical properties of an object into electrical ones and re
cording these properties on photographic film.^bv placing the ob
ject in what is essentially a parellel-plate capacitor and apply
ing a High freqency, high voltage AC <,! &G o a tatic field. Portions
of Kirlian1 s original drawings are shown below.
Fig. 1 -position of the object
in a kirlian device.
1) single electrode(object as
ground)
2)dual electrode
3)multiple array
(Source: S.D. Klrl 1 an ,Pho tograohvand Visual Observations by Meansof Hi.ajh Frequency Currents.Journal of Applisr"
anr Scientific Photography, June IQ6I)
<Pgmo OdK/iadm
06heKm
Most ofKirlian'
s subjects were living organisms and tissue, what
he was obtaining on the film were images of the topographical con
figuration of the object.Kirlian stated that these images were the
result of the controlled transferof charges from the subject to the
I
film by the applied electric field.He believes that the dielectric
structure (spatial distribution of resistivities) accounted for the
1,10
varying densities in the images of living systems.
An associate of the Kirlians, V. Adamenko, sees the photographs
as a demonstration of "cold $&&$&&& of electrons". His idea lacks
the proper theoretical background,hut his hypothesis closely cor
relates with the work of American physicists. Another noted researcher

3
in Russia', V. M. Inyushin, introduced the term "Bioplasmabody"
,
which supposedly described a previously unknown fourth state of
matter which he said Kirlian electrophotography was able to pho
tograph. His theory has since been abandoned.
In the late sixties, Americans became actively involved in Kir
lian research, mainly because of of ail the published Russian ^lit
erature.Leading parapsychologists such as Dr. Thelma Moss state
that their experiments have shown Kirlian electrophotography to
be a method of monitoring the biodynamics of living systems,par-
IC
ticularly humans. These dynamics manifest themselves as changes
in the discharge patterns of parts of the body over a period of
time.Fingerprints are popular subjects because of their ease of
use.Changes in emotional state and pathological changes are said
4to change the images in a predictable manner.One current use of
Kirlian Systems is the location of Acupuncture points and meridians.
For the most part, the research is in too early a state to draw
many definite conclusions.
The Kirlian Apparatus and It* ;; Operation
A block diagram of a typicalKirlian Device is shown below:
ENVELOPE GEN.
1
1
11
PULSE
GEN. m.
HIGH
.VOLT.
TRANS.
EXP,
TIME
1
> '
ENV.OCDC AT .
Ktrt M̂
OUTPUT
ELECTRODE)
Fig. 2- Kirlian
Device Block Flow
Diagram

4
The output of these devices is a train of pulse envelopes. A
sketch of the waveform (idealized) with typical values is shown
below,
HO KHZ
Fig. 3 Kirlian
Device Output
Waveform
(Courtesy, W.A. Tiller)
Exposure time is simply the on time of the device. In practice,
the pulses are approximated by damped sine waves (ringing networks)
because the cost of devices with these output waveforms are less
prdhitoitive. The apparatus used in this project was of this R-C
network type.The object to be exposed is placed in an electrode
arrangement like the one in figure four.
TOP ELECTRODE Fig. 4
OBJECTObject-Electrode
=V BOTTOM ELECTRODE Arrangement
TO <
DEVICE
With living tissue such as finger pads as the object, the body acts
as a ground.

5
When the device is switched on, one immediately notices the
Iblue;.77 glow and ozone gas associated with corona discharge.
Therefore, it is obvious that this air discharge must he making
a contribution to the formation of the image. Russian literature
has told us that the image is also a result of the direct trans
fer of electrons from the object to the film under the applied
1,3
field. This process is not so intuitively obvious An AC field
must he used, because American research at Stanford University
with DC pulses yielded unusable images and presented a shock haz
2
ard. AC fields have a relatively low average power.
As research has progressed, many questions have arisen con
cerning the Kirlian process. They are:
1 )How are Kirlian images formed, i.e, what mechanisms or pro
cesses are at work during the electrophotographic exposure which
creates a photographic image? The question of air discharge or di
rect electron exposure and their relative contributions comes up
here.
2) What types of materials will yield a Kirlian image? And, what
properties of these materials account for their responses to the
Kirlian system?
3) What characteristics of the exposing waveform have a signify
igant effect on the output (Images) of a Kirlian device? And, what
possible functional relationships exist between these signif igant
electrical parameters and the image quality?Finally, are there any
signifigant interactions between these parameters?

These questions form the objectives of this research effort.
They will be answered in the fullest and most analytical ways
possible within the limitations of this course.
THEORY
The work a;a of Prof. William A. Tiller(Physics, Stanford U9}ver:ity )
forms the basis of this section, and forms the groundwork of most
of the experimental work. The important a concept in this devel-
opment is the term"field emission of conductors". The model
assumes 1 ) one-hand electron distribution using Fermi-Diriac
statistics, 2) a smooth planar surface where irregularities of
atomic dimensions can be neglected, 3)a classical image force,
and 4) a uniform distribution of the electron work function ^.
The model is carried out for a metal whose properties are far
better known than living tissue.
Within the metal, the signifigant quantity is the electron
supply function N(T,fc) where, at a given temperature in degrees
Kelvin, it measures the relative number of electrons whose kin
etic energy normal to the surface is e . At higher temperatures
N(T,6) requires a thermal tail v/hich lifts more electrons into
higher energy levels where emission is more readily acheived.In
figure five the electron supply function is sketched for a metal.

7
Fig. 5- Electron Supply
Function for a metal
^ - T=3000 K
Q] - T=1000
- Is 0"
Region1-pure field emission
Region2- mixed emission
Region 3" thermal emission
(Courtesy, A, A. Tiller)
Ntt) RELATIVE UNITS
2The form of the electron supply function is as follows:
N(Tf)* ln( 1+e/KT
) 0)
Electrons impinging upon this barrier from inside the metal
have a certain probability of penetrating and appearing outside the
2
metal. This probability is given by the transmission coefficient D:
D(E,6,0) -exvd-^^O1(0^)^2f(y)/E)
(2)
where E is the electric field strength in volts/cm, $ is in eV, and
f(y) is a dimenslonless function which takes care of the image
force.Now, multiplying the number of availible electrons at a given
energy by the transmission coefficient and integrating over all
p
energies yields the emission current J, given by:
j(electrons/cm~sec)= /cN(T,6)D(E,,0)d (5)
where C incorporates Boltzman's and Planck's constants, and the mass
of the electron.r

8
AtT=0
one obtains only field emission and equation (3) can be
2integrated to yield:
J =
1.?1(T6
exp(-6.83*1O703/2
f(y))/E (4)
=(const)E2exp(const/E)
Mr. Tiller has made the assumption throughout his model that
2the electric field is uniform. However, it is the local field E
that is the important quantity in equation (4) rather than the
macroscopic field so that, for changes in the surface configur
ation of the object, the local field may vary,and therefore the
emission current(and field emission)will also vary.Field emission
as used in this context refers to the photons emitted as electrons
are accelerated across many mean free paths and collide with air
molecules.
From this combined theory, It can be inferred that: 1) insulators
will not produce a Kirlian image, because of the absence of free
electrons ,and more ^importantly 2)the image resulting from the
exposure of a conductor is a function mainly of it's topographical
configuration, due to point effects of field emission.Therefore, (3)
a perfectly smooth conductor should yield a uniform, but weak
(low/density) image.Another important inference that can be drawn
is (4) that Kirlian images are the result of field emission alone,
with no contribution from direct electron transfer.
Experiments will be designed and run to attempt to verify these
previous statements, and a statistically-designed experiment will
be run to determine the signifigant electrical factors and inter
actions of the exposing waveform.
EXPERIMENTAL
The first task involved in any experiment involving Kirlian . -
lectrophotography is the building (or buying) of a Kirlian device.
The device used in this experiment was the Edmund Scientific Co.
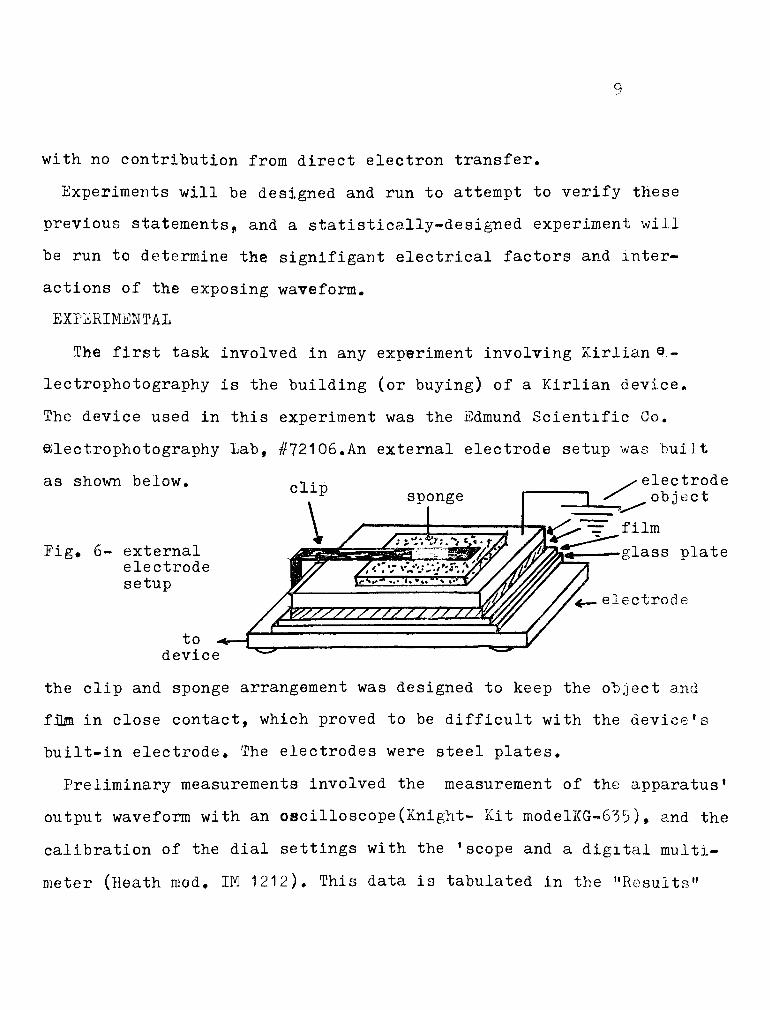
electrophotography Lab, #721 06.An external electrode setup was built
as shown below. electrode
object
^^-"-EF^film
glass plateFig, 6- external
electrode
setup
electrode
/Ayyyyyyyy/;//gZZ%^ //'
t o
device
the clip and sponge arrangement was designed to keep the object and
film in close contact, which proved to be difficult with the device's
built-in electrode. The electrodes were steel plates.
Preliminary measurements involved the measurement of the apparatus'
output waveform with an oscilloscope (Knight- Kit modelKG-635) , and the
calibration of the dial settings with the 'scope and a digital multi
meter (Heath mod. IM 1212). This data is tabulated in the "Results"

10
section of this report. Appropriate series resistors v/ere used in
order to measure the high voltage with divider networks. The film
used throughout the experimentation was Kodak Commercial film, type
6127. Development, was with HC-110, dil. B, five minutes at 68 degrees.
Agitation was RIT tray rock. After making some practice exposures
for familiarization, the following exposures were made:
1 )A 1/4"lexan sheet-lexan is known, among it's many other prop
erties, to be an excellent insulator?
2)The same lexan sheet was etched with a series of grooves and
re-exposed, at the same instttumehtsettings.
3)A 1/8"steel plate whichwas highly polished so it's surface would
be as free from, surface irregularities as possible-
4)This same steel plate was etched with a grid pattern and re-
exposed.
5) Some metals of varying surface configurations-
6.)Oner '.of the objects:used;, in (5>) , this time with higly conductive
liquids between the object and the film. This will eliminate the
effesti of ifJafcltU emission), ands stnhance any direct electron transfer i
7) Images of human finger, pads like .the type used so frequently in
3current research. .
These ob^-ects were all chosen,t answer, the questions pf the objec
tives section as v/ell as possible in the. time permitting. The exposure
data for ail the images is tabulated in the. results.
Few the -last-
part of the^exferimentatlon, the determination of stat
istically signifigant electrical parameters and interactions, an ANOVA
IIexperiment is appropriate, The factors to be considered ars the output
voltage, the pulse envelope r?p.&t;Iti rate (hereafter to be referred
* lexan is a registered trademark of the General Electric Co.

as '(pulse -reptl=tlo rat) and exposure time. A larger(more factors)
AKOVA could have been run if one of the more complex Kirlian devices
was used, but these were the only parameters which could be varied.
There v/ere three levels for each factor. The experiment was fixed,
fully, crossed, with no replicates. The choice of a response variable
is a task which requires special thought. Since most of the work in
Kirlian.electrophotography is with living systems, they should be
used in this experiment. Since it is extremely difficult to obtain
z
repeatable images with finger pads (and the generation of3"
=27
such images would prove to be an uncomfortable task) , another popular
subject, freshly cut leaves meet use;^, Their images proved to be ext
remely repeatable .Our actual response variable was a subjective qual
ity determination along the criteria used by previous Kirlian re
searchers by a sample of observers of these leaf images produced
3by the device. The 27 images resulting from all treatment combinations
were contact printed on Agfa-Gevaert Brovira paper, grade 2, developed
in D-72 for 3minutes at 68 degrees, and arranged in random order in
a booklet. A set of instructions appeared at the beginning of the book
let and asked the observer to rate the overall quality of each of
the following Kirlian photographs by placing them into one of the
following categories: 1) excellent, 2)good, 3)fair, 1) not acceptable,

12
or O)poor. The given criteria on which the observers based their
judgements was: 1 ) overall clarity and contrast, 2)ability to dis
tinguish small details, and 3) amount of the detail in the image.
The sample taken was 21 persons. The number v/hich went into the ANOVA
I?table for each treatment combination was the mean category, waicn
equals
4i ViMean Category^ Ai;.B
(5)
where N= no. of observers
k= no. of categories
j-= category no,
B=j
i= stimulus no.
A. ,= value in cell ij10
After the ANOVA table was completed, the standard F-tests v/ere
run in order to determine signif igant factors and interactions.
Of these, the sums of squares v/ere partitioned to determine any
functional relationships betv/een these factors and the response
variable, and possible optimum values.
RESULTS
A. Apparatus Data-Edmund Scientific Co. Electrophotography Lab A72106
1 ) Output Aaveform
Voltage Pulse Rep. Rate
setting V(Kvolts P-P) marked actual
1 ?y 100 Hz 137 Iiz
210 ! n
2 "
320 ,5
"
,7
"
430 .4
"

Exposure Data-"Picture number"
corresponds to the number marked
on each negative.
Picture number subject exposure
1
2
3
4
5
6
7
8
q
i"lexan sheet-smooth V30 KV, PRR*10 Hz, T-=2 sec,
i"lexan sheet-w/ grooves
" " "
1/8"steel plate-smooth
" "T=5 sec.
1/8"steel plate-w/grid
steel metal punch
-printing
aluminum print tongs
-printing
metal screen
wrench-printing
wrench-printing w/
salt solution@125F
10 finger pad 1
ANOVA Data
Factor Levels
Voltage-1"
-2
.3
PRR -1
10 KV P-P
20"
30
1 Hz
-2
-3
50"
100"
Time ,
n
11
-2
-3
1 sec
3"
6
T=8 sec.
T=5 sec.
T=10 sec,
V=10KV PRR=20Hz T=2 sec,
Sample treatment combination
kVyVoltage PRR Time
30 KV 50 Hz 1 sec.

ANOVA Data- Raw Data (yab2e 1)
Photo No. Category
0 1 2 3 4
221 0 5 13 3 0
231 0 0 3 14 4
123 0 4 13 4 0
131 9 12 0 0 0
222 0 0 0 6 15
322 0 0 0 14 7
112 18 3 0 0 0
221 0 0 3 15 3
311 2 12 7 0 0
332 0 0 0 13 8
212 9 8 4 0 0
11120 1 0 0 0
312 0 , 6 15 0 0
12212 9 0 0 0
1137 14 0 0 0
32112 9 0 0 0
2330 8 9 4 0-
3330 2 11 8 0;
2320 0 0 6 15
1320 11 9 1 0
1330 17 4 0 0
2130 4 10 7 0.
3230 0 13 8 0
3130 0 0 14 7
2115 16 0 0 0
2230 0 3 12 6
3310 0 6 11 4,
14
Mean Category
2.00
3.70
2.10
0.60
3.90
3.50
0.15
3.15
1.30
3.55
0.80
0.05
1 ,80
0.45
0.70
0,45
2.40
2.40
3.90
2.10
1.25
2.25
2.50
3.50
0,80
3.30
3.05

ANOVA. '1 'abies
V l-t-Qe^eX- a- -a \
cj
<
r
I 0 . 05 0,80i
1 .30 2.15
1 1 . oo<0 0 . 1 5 0.80 1 ,
80'
2.75
0 0.7 a 2,25 3. 1 5 6 . 1 0
0
. C v 3 - ' 5 0,45 5,60
'-'1.35( . 4 3 3- A> 3.50
7.85
0 2 . 1 0 a. "0 2.50 7.90
ft
T"
a: 0.6C 3.70 3.05 7.35
22. 3d4 2 . 1 0 3 . 90 3.55 4.55
U 1.25 2.40 2.40 6.05 |
\
9.4 24.20 21.7
Table 2
Table 3
Source
Voltage A,r->. 95
Pulse Rep,
Rate B410.35
.1
Time (.'
k1 ,86
d , f . M . S .
calcF. , , (a=.0S)table
v
6.98 12.25 4,45 ***
5.18 9.09 **#
0,93 1.63 N . 0 .
<A*B>lj3 . 98 4 '] . 00 1.75 3.84 N,S,
(B'C)ik 5 .0C< 4 1,25 2.19
iiN . S ,
vl
\1k1.78 '7 0.4 5 0.79
iiN , ;-. .
Aijk4.53 8 0,57
TOTALi-.Cj

table 4-
Tests for Functional Relationships
1)
Vol tage Leve 1 Total Coefl ic ient s Products
1-10 KV 9.4 \ + 1 9,4 -9.4
2-- 20 KV 24.2 0 -2 0 -48.4
3-30 Kv 21.7
divisor
+ 1
18
+ 1
54
21.7 21.7
31.1 -36.1
Linear Sum of squares= (31 . 1 ) = 53.73
18
2)
PRR Level
Quadratic
Total T. ..
S. s.
Coeff
B
.(-?6-U s 24 1354
- d'Xr,\X
Products
1-1 Hz 11 -1 + 1 -11 1 1
2-50 Hz 21,35 0 -2 0 -42.7
3-100 Hz 22.95
divisor
+ 1
18
+ 1
54
229522.9'
11,95-8.7'
Table 5-
Revised ANOVA Table
Linear S. S. =(1 1.95) 7.93
18 Z
Quad. S. S. (-8.75) 1 .4
54
Source
Voltage:
Linear
S. S.
53.73
d. f.
1
M.S.
53.73
E ,
calc
94.26
tablev
5.32 ***
Quadratic 24.13 1 24.13 42.33ii ***
Pulse Rate:
Linear7.97 1 7.97 13.90 11 ** -r
Quadratic 1.40 1 1-40 2.50 "N . S
Error 4.53 8 .57
Total 12
(=.05)
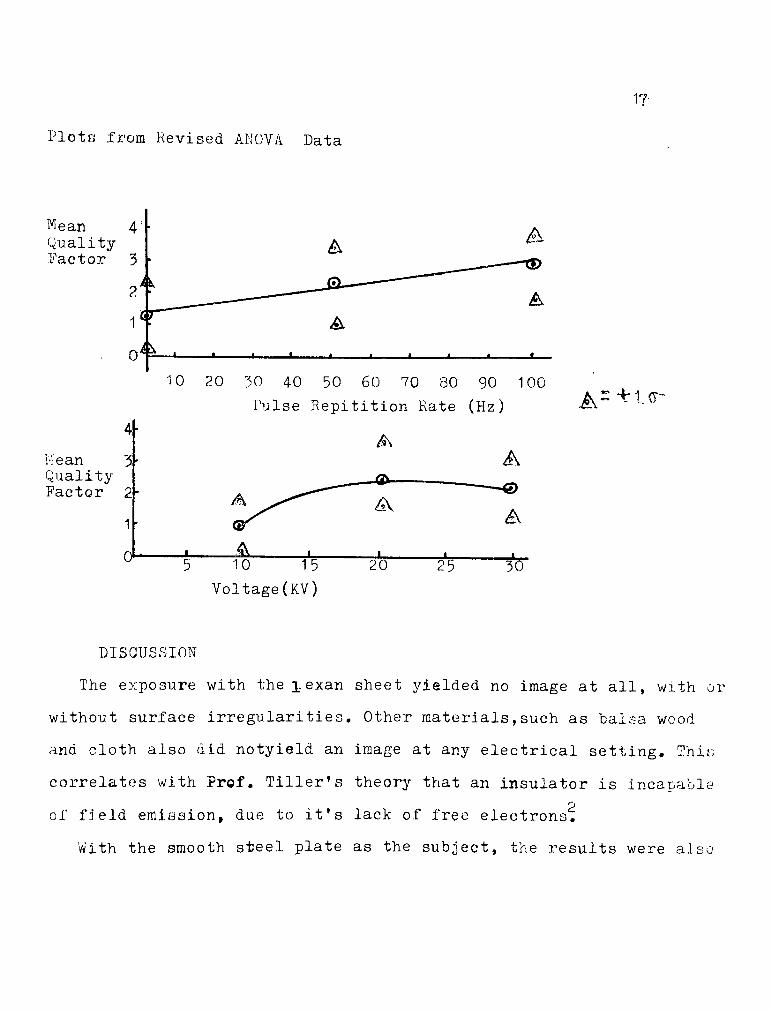
Plots from Revised ANOVA Data
17
Mean
QualityFactor
4
Mean 3-
QualityFactor 2h
1
0
10 20 30 40 50 60 70 80 90 100
Pulse Repitition Rate (Hz)
A.5 10 15
Voltage(KV)
20 30
A=*1-<r-
DISCUSSION
The exposure with the jexan sheet yielded no image at all, with or
without surface irregularities. Other materials, such as balsa wood
and cloth also did notyield an image at any electrical setting. This
correlates with Prof. Tiller's theory that an insulator is incapable
of field emission, due to it's lack of free electrons.
With the smooth steel plate as the subject, the results were also

18
as expected. A uniform, minimal density resulted (max. density= 0,4).
This is a consequence of the liberation of free electrons under the
applied field, but also an air gap so small that little field emission
could occur.When a grid pattern was etched into the plate,however, some
interesting effects were observed. A clear image of the grid resulted
so, at first look it appeared that a higher- than-background density
occurs wherever a line has been etched.However a closer look reveals
more intriguing phenomena than greater field emission with greater air
gap.Refer to the smoothed Microdensitometer trace below.
-4v200 uM fe
line cross
section
Micro-
Density(reJ.ative)
Fig. 7 Micro-D scan
of image of one
line in grid pattern
(Micro- ia used-
Joyce- Ir-ebl)
round
X.
It would appear that the greatest density occurs at the edges of the
line, The explanation for this effect is called the"point effecr of field
emission,r. When the lines were etched into the metal, ridges or "points"
were built up along the edges of the line, such as the ones illustrated
in the cross-section drawing of figure seven. The perpendicular electric
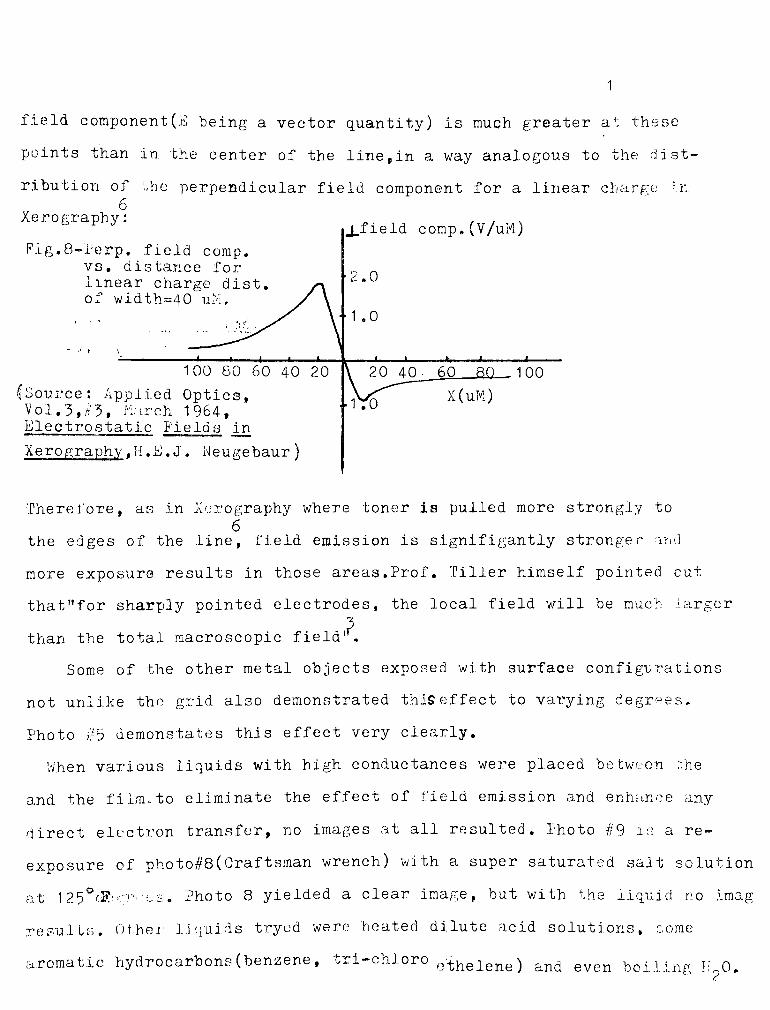
field component (E being a vector quantity) is much greater at these
points than in the center of the line, in a way analogous to the dist
ribution of the perpendicular field component for a linear charge In/-
o
Xerography:
Pig.8-Perp. field cornp.
vs. distance for
linear charge dist.
of v/idth=40 uM,
J 1 I L.
100 80 60 40 20
?.Source: Applied Optics,Vol. 3, /? 3, March 1964,Electrostatic Fields in
Xerography , H .E.J. Neugebaur)
j_Pield comp.(V/uM)
170
20 40 ._60 80 . 1 00
X(uM)
Therefore, as in Xerography where toner is pulled more strongly to
6
the edges of the line, field emission is signifigantly stronger and
more exposure results in those areas.Prof. Tiller himself pointed cut
that "for sharply pointed electrodes, the local field will be much Larger
than the total macroscopic field".
Some of the other metal objects exposed with surface configurations
not unlike the grid also demonstrated this effect to varying degrees.
Photo ;? 5 demonstates this effect very clearly.
When various liquids with high conductances were placed between Lhe
and the film. to eliminate the effect of field emission and enhance any
direct electron transfer, no images at all resulted. Photo #9 is a re-
exposure of photo#8(Craftsman wrench) with a super saturated salt solution
at 12 5eR:o-->a.s. Photo 8 yielded a clear image, but with the liquid no imag
results. Other Liquids tryed were heated dilute acid solutions, come
aromatic hydrocarbons(benzene,tri-chloro
othelene ) and even boiling ^q.

None of these combinations yielded even a trace of an irnage.lt becomes
clear that Prof, Tiller's theory of pure field emission is sound-. Farther
work on this topic might include the making of exposures in a vacuum.
Although more tedious, this would also effectively negate the effect
of field emission.
The finger pad images were made mainly to test their feasibility
for use in the next part of the experiment. V/ith this particular appar
atus used, the voltage and pulse rep rate had to be turned up to extremely
uncomfortable levels in order to obtain detailed images. At lower settings,
only the corona with no fingerprint detail appeared.lt was then determined
that some other living system had to be used as the subject, for the ANOVA.
Cleanliness appears to be very important in the making of these images.
perspiration and photographic chemicals, which contain conductive salts,
will alter the conductances in the fipgerand therefore the resulting image.
Obviously, the conductances of the human skin are sufficiently high so
that enough free electrons are avaiible for field emission. This ar^ees
with with other research done on the conductances of livingthings."
Tn
fact, RG+E publishes material warning children against playing in trees
near power lines because, in their words, the high currents from these
lines can"actually travel through tree branches". Pressure is another
important factor in the making of the finger pad images. Pressing down
hard on. the film during exposure causeda complete loss of fingerprint;
detail.

22
The corona, or"aura"as it has been sometimes called, is a phenomenon
which needs some clarification. It is one of the main tools the para-
psychologists have used in relating the Kirlian image to the biological
10
condition of the organ.! sm. This corona.,: which appears as a halo effect
7around the object is due to the &kin o.ffect of AC fields. In.; this con
text,"skin"
refers to the surface of the object, not living tissue.
V,hen an AC field is applied to a conducting object, it is well known
that the value of the field inside that, object is zero. The field,
therefore travels along the surface of the object, seeking the path
of least resistance. This is represented by the film itself into v/hich
the instantaneous current leaps, '.ha-. 7,7 causing an air discharge, a
field emission to the film. The photons emrnited by this process give
rise to the corona pattern on the film.
The ANOVA experiment on. the effect of the electrical parameters of
the device proved to be a very interesting one. The sensitivity of the
system to small electrical changes was remarkable. For example, the dif
ference in quality beween the images made at 30KV,50 Hz, 6 seconds, and
30KV,50 Hz, 3 seconds was three mean categories. The resulting image juaiity
from any given combination was almost unpredictable.
The ANOVA table shows that the factors Voltage and pulse repetition rate
are statistically rignifigant when compared to experimental error. Exp
osure time and all interactions were insignifigant.Apparently the only

22
factors for this device which which have a signifigant effect on
the quality of biological images when compared to the effect asso
ciated with random factors are the output voltage and the pulse envelope
repetition rate. The results of this experiment could be applied to any
ringing network-type Kirlian device with similar fixed factors.
The partitioning of the sums of squares similarly produced interes
ting r'a-ults. There appears to exist a linear relationship betv/een the
orr-mX^o ,r.qp^tivti07i Te&e and the quality of the resulting images, while
the relationship betweejji quality and voltage is more complex than a simple
linear or quadratic one. There appears to be an optimum voltage after
which increases in voltage cause a reduction in the subjective quality.
A possible optimum value also exists for the pials& tftepet-tUAtyi rate,;-but the
device's range of control did not extend far enough to determine that
value .
Future work in this area might include performing a similar exper
iment with a more complex device which would provide more varibies for
the ANOVA. Among these would be pulse envelope frequency , and pulse dur
ation.
CONCLUSIONS
The overall conclusion from this experimentation and data reduction
to be drawn is that the processes involved in Kiriian electrophotography
are governed by some well-known and understood PhyAiQislprinciples, not
unknown forces. It is inevitable that the author did not posess the
means or time to discover everything that is to be known on the subject,
but here are the answers to the questions which these experiments v/ere

23'
designed to answer. They should be taken in the context of the project's
limitations.
1 )The Kirlian image is the result of a complex process known as fie. a
emission of conducting objects under an applied 0 -a
^':. ',-.. .x o field.
The amount of field emission is a function, of the local electric field
strength, which in turn is a function of many variables, including
surface configuration of the object +tempurature. Insulators will not give
rise to a Kirlian image because of the lack of free electrons in. their
conduction bands to contribute to field emission. Living tissues, however,
do have sufficient free electrons do give rise to the field emission
process.Furthermore, field emission appears to be the only process by
which these images are formed-no direct transfer of elctrons which
contribute to the formation of an image occurs,
2)For the apparatus used, the applied voltage and the pulse envelope
repetition rate make a signifigant contribution to the quality of tne
images obtained when compared with experimental error. The exposure
time and all interactions are statistically insignif igant.This is true
for images of living systems and these results do not necessarily cor
relate to those obtained with metals. Furthermore, there appears to
exist a linear ielationship between the pulse repeti.tion.mate this sub
jective quality. The relation between quality and voltage is more
complex, and appears to have an optimum value (approx, 22 KV P-P).

LIST OF REFERENCES
I)Kirllan, S.D. and Kirlian, V. Photography and Visual Observations
by Means of Hia;h Frequency Currents. Journal of Aoplied and Scientific
Photography , 1961, 6:397-403
2) Prof, W.A. Tiller, Stanford University, Personal Communication
5) Proceedings from the Second Western Hemisphere Conference on Kirlian
Photography and Aeupunc ture . 1974 . Anchor Books, Garden City, N.J.
A) Johnson, K, The Living Aura . Hawthorne Books Inc, Nev York, N.Y. 1375
5)0arbun,y, El Optical Physics, Acedemic Press, New York, N.Y, I965
6)ii.E.J. Neugebauer, Electrostatic Fields in Xerography .Applied Optics,Mtrch 196A
7) A.I. Moore 'n.6. Electrostatics and Its Applications, Wiley-Intorscience,
i;ew York, N.Y. 1972
0) A.R. Von Hippie, Dielectric Materials and Their Applications , Massachusetts
Institute of Technology", 1954
9 ) C . A . Krau s ,The Properties of Electrically Conduc_tlnp; Systems , Ch om i c al
Catalog Co. Inc. New York, N.Y. 1922
10) S. Krippner, Parapsychology in the USSR. Saturday Review, March 18, 1972
II) A. Rickmers, and H. Todd , Statistics, Mc Graw Hill,I967
12) SPSi Handbook of Photgraphic Science and Engineering, Wiley Intarscience,1974

2L5
.^"V*%
nm d
!**- ~77-~*^.
10 KV 20 KV 30 KV
FIG. 9 Effect of Increasing Voltage, Other Factors Held Constant
-
.
-
rfff-TP
B7< m-^
*"*'fi LV** '*
tn
Lgli^^^Sa
f\ .
'' Ti~7."V"
y
.
-
I Hz 50 Hz
kftiBMMMIk
100 Hz
Effect of Increasing Pulse Repetition Rate, Other Factors Held Constant


