Download - Ambit Auto Thematic 3June2011

8/6/2019 Ambit Auto Thematic 3June2011
http://slidepdf.com/reader/full/ambit-auto-thematic-3june2011 1/27
June 3, 2011
Automobiles
THEMATIC
Ambit Capital and / or its affiliates do and seek to do business including investment banking with companies covered in its research reports. As a result, investors should be aware that Ambit
Capital may have a conflict of interest that could affect the objectivity of this report. Investors should consider this report as only a s ingle factor in making their investment decision.
Please refer to disclaimer section on the last page for further important disclaimer.
Analyst contacts
Vijay ChughTel: +91 22 3043 3054 [email protected]
Ashvin Shetty
Tel.: + +91 22 3043 [email protected]
Recommendation summary
New Old % Change
Ashok Leyland (mcap US$1,543mn)
Stance BUY BUY
TP (1 year) (Rs) 65 75 -13%
Upside 25%
EPS FY12E (Rs) 4.9 5.2 -6%
EPS FY13E (Rs) 5.7 6.1 -8%
Bajaj Auto (mcap US$8,797mn)
Stance BUY BUY
TP (1 year) (Rs) 1,540 1,750 -12%
Upside 13%
EPS FY12E (Rs) 97.5 107.7 -9%
EPS FY13E (Rs) 113.8 125.2 -9%
Hero Honda (mcap US$8,292mn)
Stance SELL HOLD
TP (1 year) (Rs) 1,790 1,625 10%
Downside 4%
EPS FY12E (Rs) 107.6 109.4 -2%
EPS FY13E (Rs) 127.6 128.7 -1%
Maruti Suzuki (mcap US$7,899mn)
Stance SELL BUY
TP (1 year) (Rs) 1,250 1,600 -22%
Upside 2%
EPS FY12E (Rs) 86.5 94.6 -9%
EPS FY13E (Rs) 96.5 108.9 -11%
Tata Motors (mcap US$13,795mn)
Stance BUY BUY
TP (1 year) (Rs) 1,475 1,600 -8%
Upside 41%
EPS FY12E (Rs) 159.3 168.8 -6%
EPS FY13E (Rs) 184.4 191.4 -4%
Source: Ambit Capital research
Course Correction Ahead
After witnessing strong demand growth in FY10 and FY11 (25-40%CAGR over FY09-11), we expect auto demand to see a moderation inFY12 (10-15%) as all components of the cost of ownership (viz. capitalcost, fuel prices and interest rates) have seen significant increasesover the last 6-8 months. We also expect this moderation to impact thepricing power and thereby the margins of auto companies. Asindicated in our email dated May 4, 2011, we have cut our volume,margin and net earnings estimates for our auto coverage universe forFY12 and FY13. While we downgrade Maruti and Hero Honda to SELL,
we continue to highlight Tata Motors and Bajaj Auto as our preferred
BUYs in the auto sector. Volume growth to moderate: With interest rates having increased 150-200bps in the last six months accompanied by increases in fuel prices by 20-25% and vehicle prices by 5-10%, we believe the cost of ownership hascrossed the threshold where it will likely impact the demand for automobiles.Further, our detailed analysis of previous cycles and discussions with key industry participants also corroborate this view with the impact beingparticularly negative in urban markets with replacement and upgradationdemand impacted to the extent of 20-30%. Consequently, on account of thetriple whammy of higher interest rates, increased fuel prices and costlier
vehicles, we are revising our volume growth assumptions to be in line withlong term averages (10-15%) as opposed to our earlier estimates of higher-
than-long term averages (15-20%).Negative impact on margins: With input costs continuing to be high, weexpect margins to be impacted on account of reduced pricing power in theface of moderating demand. There are also indications that the autocompanies may increase the level of discounts or schemes to support volumegrowth. We expect this to impact EBITDA margins to the tune of 50bps.Further, we expect EBITDA margins for our coverage universe to besignificantly lower (in the range of 100-320 bps) compared to the averagemargins seen over FY05-11.
Investment implications: Going forward, given the ongoing moderation inthe volume growth, we expect sluggish stock price performance over the short
term. On a balanced consideration of likely earnings expectations and current valuations, we downgrade Maruti Suzuki and Hero Honda to SELL (fromour earlier stance of BUY and HOLD respectively) but continue to highlightTata Motors and Bajaj Auto as our top BUYs.
For Maruti Suzuki, we believe the challenges surrounding volumes andearnings (growth of only 9% over FY11-13E) are still not fully factored in thecurrent valuation (14.2x FY12 earnings). Similarly for Hero Honda, webelieve the recent share price run-up and premium valuations (22% premiumto Bajaj Auto) ignore the concerns surrounding competition, margins andtransition, post separation from Honda Motors.
On the other hand, we continue to favour Bajaj Auto due to its diversifiedproduct and geographical profile as well as better margin structure versuspeers (close to 20% compared to Hero Honda’s margins of 11-12%). We likeTata Motors for its JLR business (strong volume outlook of close to 15-20%for FY12) and attractive valuations (trading at nearly 40% discount to thesector).
8/6/2019 Ambit Auto Thematic 3June2011
http://slidepdf.com/reader/full/ambit-auto-thematic-3june2011 2/27
Automobiles
Ambit Capital Pvt Ltd 2
Volume growth to moderate …
Marginal demand under pressure
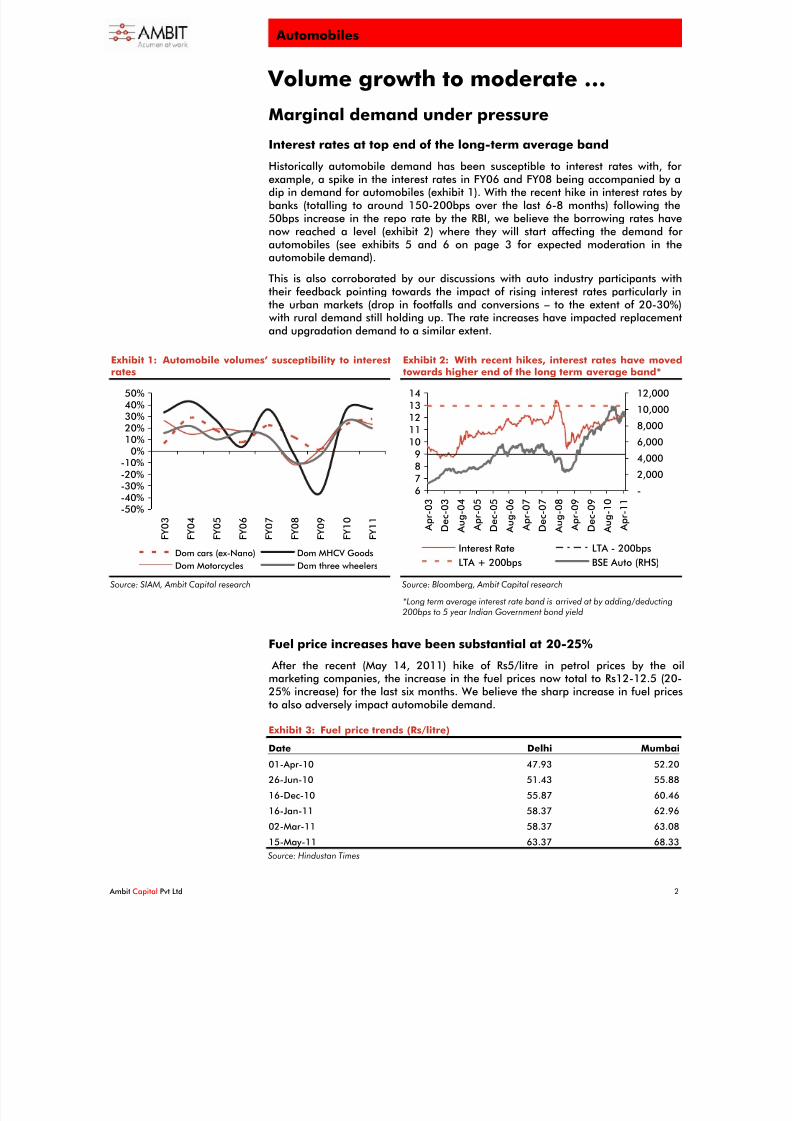
Interest rates at top end of the long-term average band
Historically automobile demand has been susceptible to interest rates with, for example, a spike in the interest rates in FY06 and FY08 being accompanied by adip in demand for automobiles (exhibit 1). With the recent hike in interest rates by banks (totalling to around 150-200bps over the last 6-8 months) following the50bps increase in the repo rate by the RBI, we believe the borrowing rates havenow reached a level (exhibit 2) where they will start affecting the demand for automobiles (see exhibits 5 and 6 on page 3 for expected moderation in theautomobile demand).
This is also corroborated by our discussions with auto industry participants withtheir feedback pointing towards the impact of rising interest rates particularly inthe urban markets (drop in footfalls and conversions – to the extent of 20-30%)
with rural demand still holding up. The rate increases have impacted replacementand upgradation demand to a similar extent.
Exhibit 1: Automobile volumes’ susceptibility to interestrates
-50%-40%-30%
-20%-10%
0%10%20%30%40%50%
F Y 0 3
F Y 0 4
F Y 0 5
F Y 0 6
F Y 0 7
F Y 0 8
F Y 0 9
F Y 1 0
F Y 1 1
Dom cars (ex-Nano) Dom MHCV Goods
Dom Motorcycles Dom three wheelers
Source: SIAM, Ambit Capital research
Exhibit 2: With recent hikes, interest rates have movedtowards higher end of the long term average band*
6
7
8
9
10
11
12
13
14
A p r - 0 3
D e c - 0 3
A u g - 0 4
A p r - 0 5
D e c - 0 5
A u g - 0 6
A p r - 0 7
D e c - 0 7
A u g - 0 8
A p r - 0 9
D e c - 0 9
A u g - 1 0
A p r - 1 1
-
2,000
4,000
6,000
8,000
10,000
12,000
Interest Rate LTA - 200bps
LTA + 200bps BSE Auto (RHS)
Source: Bloomberg, Ambit Capital research
*Long term average interest rate band is arrived at by adding/deducting 200bps to 5 year Indian Government bond yield
Fuel price increases have been substantial at 20-25% After the recent (May 14, 2011) hike of Rs5/litre in petrol prices by the oilmarketing companies, the increase in the fuel prices now total to Rs12-12.5 (20-25% increase) for the last six months. We believe the sharp increase in fuel pricesto also adversely impact automobile demand.
Exhibit 3: Fuel price trends (Rs/litre)
Date Delhi Mumbai
01-Apr-10 47.93 52.20
26-Jun-10 51.43 55.88
16-Dec-10 55.87 60.46
16-Jan-11 58.37 62.96
02-Mar-11 58.37 63.08
15-May-11 63.37 68.33
Source: Hindustan Times

8/6/2019 Ambit Auto Thematic 3June2011
http://slidepdf.com/reader/full/ambit-auto-thematic-3june2011 3/27
Automobiles
Ambit Capital Pvt Ltd 3
Vehicle prices are also up by 5-10%
The healthy demand seen in FY11 enabled auto companies to take price increases(exhibit 4) to compensate for the steep increase in input costs. However, this has,at the same time, resulted in vehicles becoming costlier by around 5-10% over thepast year, raising the cost of ownership significantly.
Exhibit 4: Recent pricing actions of some companies
Manufacturer Announcementdate
Price action
Tata Motors Oct-10Increase in the prices of all of its commercial vehicles (inthe range of Rs1,500 to Rs30,000) and some passenger
vehicles.
Oct-10 Increase in the prices of Tata Nano by about Rs9,000.
Jan-11Increase in the prices of all of its commercial vehicles (inthe range of Rs1,500 to Rs30,000) and some passenger
vehicles.
Mar-11Increase in the prices of passenger vehicles ranging fromRs7,000 to Rs29,000.
Maruti Suzuki Jan-11 Hike in prices by upto Rs 8,000.
Apr-11 Hike in prices by upto Rs 9,000.
Source: Companies, Press articles
Consequently, on account of the triple whammy of an increase in interest rates,hike in fuel prices and costlier vehicles, we have revised our FY11-13 domestic
volume CAGR expectations for motorcycles to 15%, cars to 13%, three wheelers to15% and MHCV Goods to 11% (compared to previous estimates of 17%, 15%, 16%and 15% respectively). We expect the MHCV Goods and passenger car segmentsto be impacted the most compared to two-wheelers.
Exhibit 5: Volume growth trends across domestic motorcycles and cars
FY01-06 FY06-11 FY01-11 FY09-11 FY11-13E Volume growth trends
Old New
Motorcycles – domestic 22% 25% 16% 24% 17% 15%Cars - domestic (ex Nano) 9% 17% 13% 25% 15% 13%
Source: SIAM, Ambit Capital research
Exhibit 6: Volume growth trends across commercial vehicles segments
FY11-13E Volume growth trends
FY03-07
FY07-11
FY03-11
FY09-11 Old New
MHCV Goods – domestic 26% 3% 14% 36% 15% 11%
MHCV Passenger – domestic 9% 13% 11% 17% 12% 10%
LCV Goods – domestic 31% 17% 24% 35% 15% 15%
LCV Passenger – domestic 8% 12% 10% 18% 11% 11%
3W – domestic 9% 17% 13% 25% 16% 15%
Source: SIAM, Ambit Capital research
Whilst we expect market leaders in the respective segments (Maruti, Tata Motors,Hero Honda, Bajaj Auto) to be particularly prone to competition, specific strategiesadopted by them such as the introduction of new models and variants should helparrest the market share loss. Consequently, we expect the domestic market lossesof Maruti Suzuki, Bajaj Auto and Tata Motors to be restricted to around 10-50bpsover FY11-13E (exhibit 7) and as a result, largely track the industry growth rates.Only in the case of Hero Honda, we expect a higher domestic market share loss of around 100bps over FY11-13E on account of company-specific transitionchallenges after the separation from Honda (with the latter likely to adopt a
focused pursuit of Hero Honda’s stronghold on the economy and executivemotorcycle segments).

8/6/2019 Ambit Auto Thematic 3June2011
http://slidepdf.com/reader/full/ambit-auto-thematic-3june2011 4/27
Automobiles
Ambit Capital Pvt Ltd 4
Exhibit 7: Changes in market shares across different time periods
FY03-07 FY07-11 FY03-11 FY09-11 FY11-13E
Motorcycle – domestic
Bajaj Auto 7.7% -4.9% 2.8% 5.0% -0.1%
Hero Honda 3.5% 6.6% 10.1% -5.2% -1.0%
Honda Motors 2.5% 4.7% 7.2% 1.0% 0.7%
TVS Motors -5.8% -5.9% -11.7% -0.8% 0.0%
Others -7.9% -0.5% -8.4% 0.0% 0.4%
Cars – domestic (ex Nano)
Maruti Suzuki 0.2% -0.7% -0.4% -1.8% -0.4%
Hyundai Motors -1.0% 0.6% -0.4% -1.3% -1.8%
Tata Motors (ex Nano) 2.0% -6.7% -4.7% -3.2% -1.2%
Others -1.2% 6.8% 5.6% 6.3% 3.4%
Three wheeler – domestic
Bajaj Auto -21.5% -5.3% -26.7% 0.8% 0.0%
Piaggio Vehicles Pvt Ltd 19.2% 2.9% 22.0% -2.8% -1.5%
TVS Motor 4.3% 4.3% 3.0% 0.4%
Mahindra & Mahindra 4.0% 3.4% 7.4% -1.0% 0.3%
Others -1.7% -5.3% -7.0% 0.0% 0.8%
MHCV Goods – domestic
Tata Motors -2.8% -1.8% -4.6% -4.0% -0.5%
Ashok Leyland 2.0% -4.1% -2.1% 1.9% 0.0%
Eicher Motors 0.5% 3.1% 3.7% 2.0% 0.0%
Others 0.3% 2.8% 3.1% 0.1% 0.5%
LCV Goods – domestic
Tata Motors 21.0% -9.7% 11.3% -3.2% -0.5%
M&M (inc Navistar) -9.1% 9.0% -0.2% 5.4% 0.2%Others -11.9% 0.7% -11.2% -2.1% 0.3%
Source: SIAM, Ambit Capital research
8/6/2019 Ambit Auto Thematic 3June2011
http://slidepdf.com/reader/full/ambit-auto-thematic-3june2011 5/27
Automobiles
Ambit Capital Pvt Ltd 5
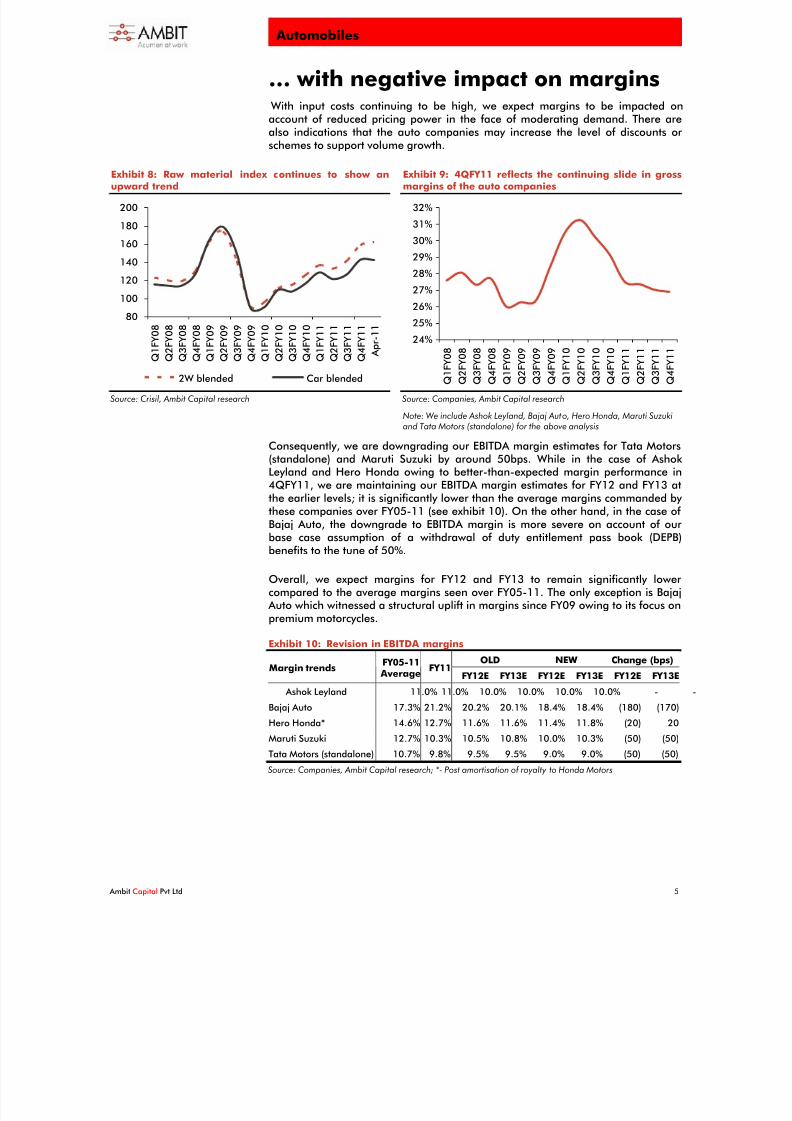
… with negative impact on margins With input costs continuing to be high, we expect margins to be impacted onaccount of reduced pricing power in the face of moderating demand. There arealso indications that the auto companies may increase the level of discounts or schemes to support volume growth.
Exhibit 8: Raw material index continues to show anupward trend
80
100
120
140
160
180
200
Q 1 F Y 0 8
Q 2 F Y 0 8
Q 3 F Y 0 8
Q 4 F Y 0 8
Q 1 F Y 0 9
Q 2 F Y 0 9
Q 3 F Y 0 9
Q 4 F Y 0 9
Q 1 F Y 1 0
Q 2 F Y 1 0
Q 3 F Y 1 0
Q 4 F Y 1 0
Q 1 F Y 1 1
Q 2 F Y 1 1
Q 3 F Y 1 1
Q 4 F Y 1 1
A p r - 1 1
2W blended Car blended
Source: Crisil, Ambit Capital research
Exhibit 9: 4QFY11 reflects the continuing slide in grossmargins of the auto companies
24%25%
26%
27%
28%
29%
30%
31%
32%
Q 1 F Y 0 8
Q 2 F Y 0 8
Q 3 F Y 0 8
Q 4 F Y 0 8
Q 1 F Y 0 9
Q 2 F Y 0 9
Q 3 F Y 0 9
Q 4 F Y 0 9
Q 1 F Y 1 0
Q 2 F Y 1 0
Q 3 F Y 1 0
Q 4 F Y 1 0
Q 1 F Y 1 1
Q 2 F Y 1 1
Q 3 F Y 1 1
Q 4 F Y 1 1
Source: Companies, Ambit Capital research
Note: We include Ashok Leyland, Bajaj Auto, Hero Honda, Maruti Suzukiand Tata Motors (standalone) for the above analysis
Consequently, we are downgrading our EBITDA margin estimates for Tata Motors(standalone) and Maruti Suzuki by around 50bps. While in the case of Ashok Leyland and Hero Honda owing to better-than-expected margin performance in
4QFY11, we are maintaining our EBITDA margin estimates for FY12 and FY13 atthe earlier levels; it is significantly lower than the average margins commanded by these companies over FY05-11 (see exhibit 10). On the other hand, in the case of Bajaj Auto, the downgrade to EBITDA margin is more severe on account of our base case assumption of a withdrawal of duty entitlement pass book (DEPB)benefits to the tune of 50%.
Overall, we expect margins for FY12 and FY13 to remain significantly lower compared to the average margins seen over FY05-11. The only exception is Bajaj
Auto which witnessed a structural uplift in margins since FY09 owing to its focus onpremium motorcycles.
Exhibit 10: Revision in EBITDA marginsOLD NEW Change (bps)
Margin trendsFY05-11
AverageFY11
FY12E FY13E FY12E FY13E FY12E FY13E
Ashok Leyland 11.0% 11.0% 10.0% 10.0% 10.0% 10.0% - -
Bajaj Auto 17.3% 21.2% 20.2% 20.1% 18.4% 18.4% (180) (170)
Hero Honda* 14.6% 12.7% 11.6% 11.6% 11.4% 11.8% (20) 20
Maruti Suzuki 12.7% 10.3% 10.5% 10.8% 10.0% 10.3% (50) (50)
Tata Motors (standalone) 10.7% 9.8% 9.5% 9.5% 9.0% 9.0% (50) (50)
Source: Companies, Ambit Capital research; *- Post amortisation of royalty to Honda Motors
8/6/2019 Ambit Auto Thematic 3June2011
http://slidepdf.com/reader/full/ambit-auto-thematic-3june2011 6/27
Automobiles
Ambit Capital Pvt Ltd 6
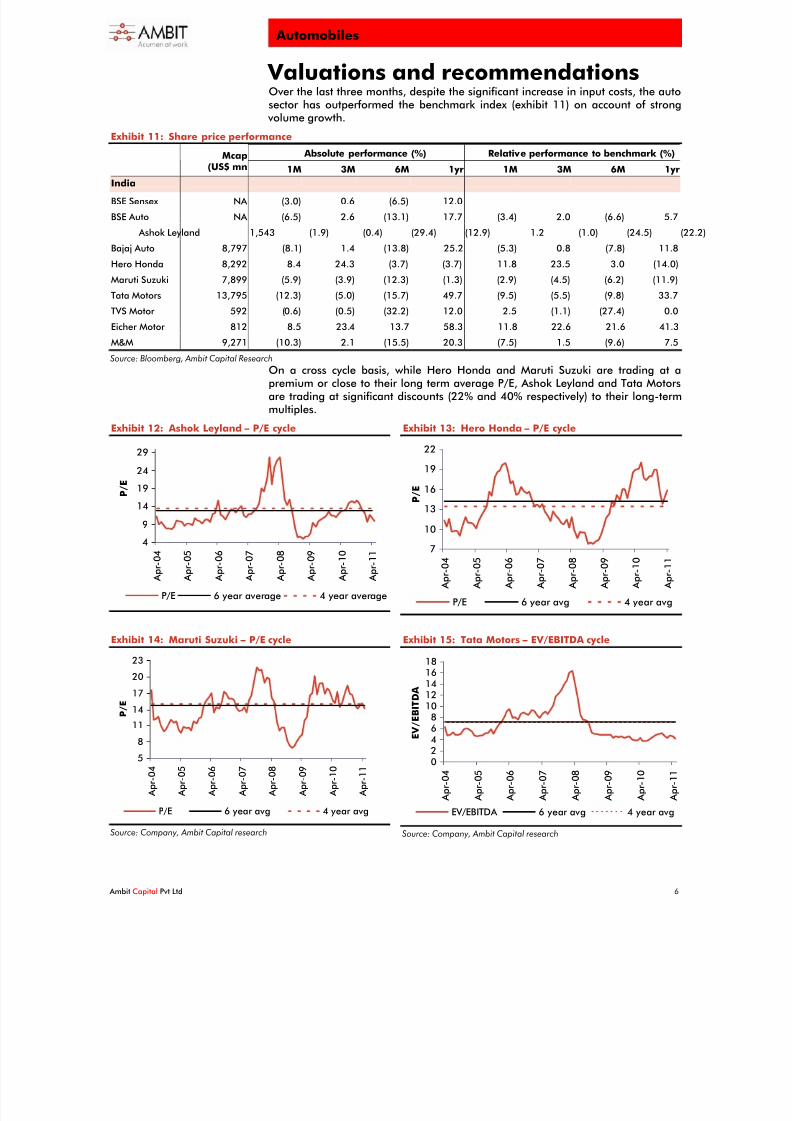
Valuations and recommendationsOver the last three months, despite the significant increase in input costs, the autosector has outperformed the benchmark index (exhibit 11) on account of strong
volume growth.
Exhibit 11: Share price performance
Absolute performance (%) Relative performance to benchmark (%)Mcap(US$ mn 1M 3M 6M 1yr 1M 3M 6M 1yr
India
BSE Sensex NA (3.0) 0.6 (6.5) 12.0
BSE Auto NA (6.5) 2.6 (13.1) 17.7 (3.4) 2.0 (6.6) 5.7
Ashok Leyland 1,543 (1.9) (0.4) (29.4) (12.9) 1.2 (1.0) (24.5) (22.2)
Bajaj Auto 8,797 (8.1) 1.4 (13.8) 25.2 (5.3) 0.8 (7.8) 11.8
Hero Honda 8,292 8.4 24.3 (3.7) (3.7) 11.8 23.5 3.0 (14.0)
Maruti Suzuki 7,899 (5.9) (3.9) (12.3) (1.3) (2.9) (4.5) (6.2) (11.9)
Tata Motors 13,795 (12.3) (5.0) (15.7) 49.7 (9.5) (5.5) (9.8) 33.7
TVS Motor 592 (0.6) (0.5) (32.2) 12.0 2.5 (1.1) (27.4) 0.0
Eicher Motor 812 8.5 23.4 13.7 58.3 11.8 22.6 21.6 41.3
M&M 9,271 (10.3) 2.1 (15.5) 20.3 (7.5) 1.5 (9.6) 7.5
Source: Bloomberg, Ambit Capital Research
On a cross cycle basis, while Hero Honda and Maruti Suzuki are trading at apremium or close to their long term average P/E, Ashok Leyland and Tata Motorsare trading at significant discounts (22% and 40% respectively) to their long-termmultiples.
Exhibit 12: Ashok Leyland – P/E cycle
4
9
14
19
24
29
A p r - 0 4
A p r - 0 5
A p r - 0 6
A p r - 0 7
A p r - 0 8
A p r - 0 9
A p r - 1 0
A p r - 1 1
P / E
P/E 6 year average 4 year average
Exhibit 13: Hero Honda – P/E cycle
7
10
13
16
19
22
A p r - 0 4
A p r - 0 5
A p r - 0 6
A p r - 0 7
A p r - 0 8
A p r - 0 9
A p r - 1 0
A p r - 1 1
P / E
P/E 6 year avg 4 year avg
Exhibit 14: Maruti Suzuki – P/E cycle
5
8
11
14
17
20
23
A p r - 0 4
A p r - 0 5
A p r - 0 6
A p r - 0 7
A p r - 0 8
A p r - 0 9
A p r - 1 0
A p r - 1 1
P / E
P/E 6 year avg 4 year avg
Source: Company, Ambit Capital research
Exhibit 15: Tata Motors – EV/EBITDA cycle
02468
1012141618
A p r - 0 4
A p r - 0 5
A p r - 0 6
A p r - 0 7
A p r - 0 8
A p r - 0 9
A p r - 1 0
A p r - 1 1
E V / E B I T D A
EV/EBITDA 6 year avg 4 year avg
Source: Company, Ambit Capital research

8/6/2019 Ambit Auto Thematic 3June2011
http://slidepdf.com/reader/full/ambit-auto-thematic-3june2011 7/27
Automobiles
Ambit Capital Pvt Ltd 7
On a relative P/E valuation, Bajaj Auto, Tata Motors and Ashok Leyland appear inexpensive compared to Hero Honda and Maruti Suzuki after adjusting for expected growth (PEG). While global auto companies are trading at a premium toIndian auto companies, it seems somewhat justified by their higher earningsexpectations compared to Indian peers.
Exhibit 16: Comparative valuation
P/E EV/EBITDA Company MCAP(US $mn) FY10 FY11 FY12 FY13 FY10 FY11 FY12 FY13
Sales growth(%) (FY11-13)
EPS growth (%)(FY11-13)
EBITDA growth(%) (FY11-13)
India
Ashok Leyland 1,543 16.4 11.0 10.6 9.2 12.2 7.7 7.3 6.5 14% 9% 9%
Bajaj Auto 8,797 21.2 15.1 14.0 12.0 13.8 10.5 9.9 8.6 18% 12% 10%
Hero Honda * 8,292 16.7 18.6 17.4 14.6 11.9 13.3 12.3 10.4 17% 13% 13%
Maruti Suzuki 7,899 14.0 15.1 14.2 12.8 7.6 8.1 7.3 6.2 15% 9% 14%
Tata Motors(as reported)
13,795 21.1 7.5 6.6 5.7 9.6 4.6 4.1 3.6 16% 15% 13%
Tata Motors(proforma) **
13,795 21.1 9.5 9.0 7.2 NA 5.2 4.9 4.2 16% 15% 11%
Average 18.4 12.8 12.0 10.3 11.0 8.2 7.7 6.6 16% 12% 12%
GLOBAL - Cars
Toyota 142,743 86.7 21.2 15.9 11.3 17.5 14.6 13.4 10.5 5% 37% 18%
Hyundai 51,655 24.4 13.4 11.7 10.9 14.2 10.4 9.5 9.0 5% 11% 7%
Ford 55,454 NM 7.0 8.0 7.6 37.1 11.0 9.5 8.4 9% -4% 14%
Volkswagen 79,229 48.9 11.1 9.0 7.9 11.7 7.5 6.7 6.2 7% 19% 10%
Renault 16,500 NM 7.3 5.7 4.2 16.0 7.9 8.2 7.4 4% 32% 3%
BMW 55,755 234.9 13.5 10.5 9.1 16.2 8.4 7.7 7.3 7% 22% 8%
Daimler 73,668 NM 10.6 9.1 7.8 31.9 8.8 7.9 7.1 8% 17% 12%
Average 98.7 12.0 10.0 8.4 20.6 9.8 9.0 8.0 6% 19% 10%
GLOBAL - CVs
Navistar 4,728 29.1 21.3 12.0 8.8 12.6 10.6 8.2 6.6 15% 56% 27%
Volvo 37,985 NM 19.4 13.3 10.2 NM 10.1 8.1 6.8 14% 38% 22%
SCANIA 19,275 134.3 13.6 12.1 11.1 27.8 8.9 8.3 7.7 11% 10% 7%
PACCAR 18,072 258.9 39.7 20.5 14.0 39.5 20.7 13.1 9.5 30% 68% 47%
MAN 20,131 60.9 21.0 15.5 13.4 20.4 10.5 8.4 7.7 9% 25% 17%
Average 120.8 23.0 14.7 11.5 25.1 12.2 9.2 7.7 16% 39% 24%
Source: Bloomberg, Ambit Capital research (Ambit Capital estimates for Indian companies, Bloomberg estimates for global companies)*EBITDA taken post amortisation of royalty to Honda Motors**Proforma figures are arrived at by adjusting EBITDA/PAT for normalised R&D charge (by expensing 70% of R & D costs instead of current 20%).
Recommendations
Going forward, given the ongoing moderation in volume growth, we expectsluggish stock price performance over the short term. On a balanced considerationof likely earnings expectations and current valuations, we downgrade MarutiSuzuki and Hero Honda to SELL (earlier stance of BUY and HOLD respectively);
we continue to highlight Tata Motors and Bajaj Auto as our top BUYs.
DOWNGRADE to SELL
Maruti Suzuki (MSIL IN, mcap US$7,899 mn, SELL, TP Rs1,260, 2% upside):
The headwinds of rising interest rates, more expensive fuel prices and costlier vehicle prices are likely to impact volume growth and put further pressure on
Maruti’s already fragile margins. We downgrade Maruti Suzuki to SELL with a22% cut in valuation. With current valuation at 14.2x our revised FY12 earnings, we believe the challenges surrounding volumes and earnings are still not fully factored in the current stock price. For more details please refer to page 20.

8/6/2019 Ambit Auto Thematic 3June2011
http://slidepdf.com/reader/full/ambit-auto-thematic-3june2011 8/27
Automobiles
Ambit Capital Pvt Ltd 8
Hero Honda (HH IN, mcap US$8,292 mn, SELL, TP Rs1,790, 4% downside):
While competitive challenges continue to be high, commodity costs and transitionchallenges (necessitating increased spends on marketing, business developmentand R&D) will continue to weigh down on the earnings. We believe the recentshare price run-up and premium valuations (22% premium to Bajaj Auto) ignorecompetition, margin and transition concerns. We downgrade the stock to SELL(from HOLD). For more details please refer to page 15.
TOP BUYs
Bajaj Auto (BJAUT IN, mcap US$8,797mn, BUY, TP Rs1,540, 13% upside): Atthe current market price, the stock is trading at 8.6x and 12.0x our revised FY13EBITDA and earnings respectively. We believe the moderation in volume growthexpectations and potential impact of withdrawal of the duty entitlement pass book (DEPB) benefits have been more than factored in the current stock price. Bajaj Autoremains one of our preferred picks in the Auto sector based on its diversifiedproducts and geographical profile as well as better margin structure versus peers.For more details please refer to page 11.
Tata Motors (TTMT IN, mcap US$13.8bn, BUY, TP Rs1,475, 41% upside):
While 4QFY11 results were disappointing on the margin front, the volume outlook at JLR continues to be healthy particularly on account of strong demand fromemerging markets (the company expects nearly 50% growth in JLR’s China
volumes for FY12) and expected launch of Range Rover Evoque in September 2011. Even after revising downwards our EBITDA and net earnings estimates, weexpect the company to record EBITDA and net earnings CAGR of 13% and 15%respectively for FY11-13E. Tata Motors trades currently at 5.7x FY13 earnings
which is at a discount of 50% to its Indian automobile peers despite having nearly similar EBITDA and net earnings growth expectations over FY11-13E (exhibit 16 onpage 7).Even after proforma adjusting Tata Motors’ net earnings for normalisedR&D expenses (arriving at EBITDA and net earnings after charging 70% of productdevelopment expenses to P&L instead of current levels of 20%), it trades at 7.2x
FY13 earnings implying a discount of 40% to its Indian automobile peers. Wecontinue to highlight Tata Motors as one of our preferred picks in the auto sector.For more details please refer to page 13.
Exhibit 17: Recommendation summary
Market cap(USD mn)
Stance CMP(Rs)
Target price(Rs/share)
Upside/(downside)
Ashok Leyland 1,543 BUY 52 65 25%
Bajaj Auto 8,797 BUY 1,368 1,540 13%
Hero Honda 8,292 SELL 1,869 1,790 -4%
Maruti Suzuki 7,899 SELL 1,230 1,250 2%
Tata Motors 13,795 BUY 1,046 1,475 41%
Source: Ambit Capital research; Bloomberg
8/6/2019 Ambit Auto Thematic 3June2011
http://slidepdf.com/reader/full/ambit-auto-thematic-3june2011 9/27
Automobiles
Ambit Capital Pvt Ltd 9
Ashok Leyland(AL IN, mcap US$1,543mn, BUY, TP Rs65, 25% upside)
Why are we revising our estimates?
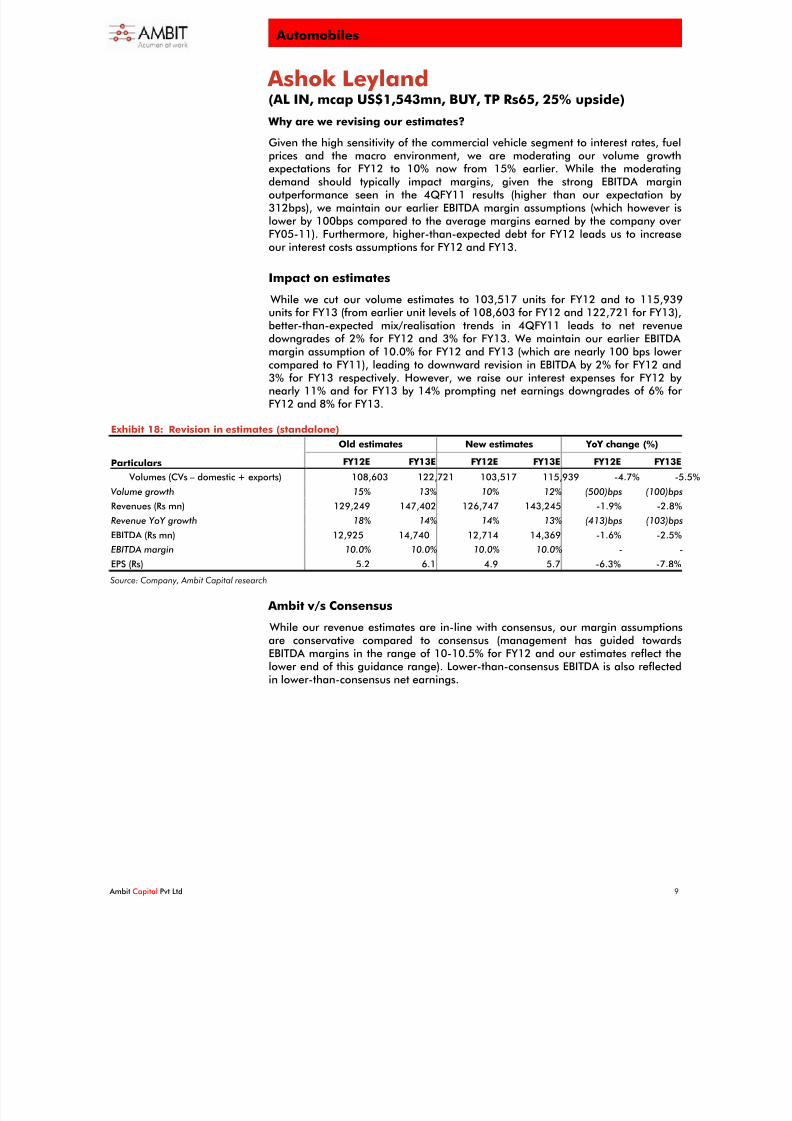
Given the high sensitivity of the commercial vehicle segment to interest rates, fuelprices and the macro environment, we are moderating our volume growthexpectations for FY12 to 10% now from 15% earlier. While the moderatingdemand should typically impact margins, given the strong EBITDA marginoutperformance seen in the 4QFY11 results (higher than our expectation by 312bps), we maintain our earlier EBITDA margin assumptions (which however islower by 100bps compared to the average margins earned by the company over FY05-11). Furthermore, higher-than-expected debt for FY12 leads us to increaseour interest costs assumptions for FY12 and FY13.
Impact on estimates
While we cut our volume estimates to 103,517 units for FY12 and to 115,939units for FY13 (from earlier unit levels of 108,603 for FY12 and 122,721 for FY13),
better-than-expected mix/realisation trends in 4QFY11 leads to net revenuedowngrades of 2% for FY12 and 3% for FY13. We maintain our earlier EBITDA margin assumption of 10.0% for FY12 and FY13 (which are nearly 100 bps lower compared to FY11), leading to downward revision in EBITDA by 2% for FY12 and3% for FY13 respectively. However, we raise our interest expenses for FY12 by nearly 11% and for FY13 by 14% prompting net earnings downgrades of 6% for FY12 and 8% for FY13.
Exhibit 18: Revision in estimates (standalone)
Old estimates New estimates YoY change (%)
Particulars FY12E FY13E FY12E FY13E FY12E FY13E
Volumes (CVs – domestic + exports) 108,603 122,721 103,517 115,939 -4.7% -5.5%
Volume growth 15% 13% 10% 12% (500)bps (100)bps
Revenues (Rs mn) 129,249 147,402 126,747 143,245 -1.9% -2.8%
Revenue YoY growth 18% 14% 14% 13% (413)bps (103)bps
EBITDA (Rs mn) 12,925 14,740 12,714 14,369 -1.6% -2.5%
EBITDA margin 10.0% 10.0% 10.0% 10.0% - -
EPS (Rs) 5.2 6.1 4.9 5.7 -6.3% -7.8%
Source: Company, Ambit Capital research
Ambit v/s Consensus
While our revenue estimates are in-line with consensus, our margin assumptionsare conservative compared to consensus (management has guided towardsEBITDA margins in the range of 10-10.5% for FY12 and our estimates reflect thelower end of this guidance range). Lower-than-consensus EBITDA is also reflectedin lower-than-consensus net earnings.

8/6/2019 Ambit Auto Thematic 3June2011
http://slidepdf.com/reader/full/ambit-auto-thematic-3june2011 10/27
Automobiles
Ambit Capital Pvt Ltd 10
Exhibit 19: Ambit v/s consensus for Ashok Leyland (standalone)
Consensus Ambit Divergence
Revenue (Rs mn)
FY12E 126,030 126,747 1%
FY13E 141,258 143,245 1%
EBITDA (Rs mn)
FY12E 13,246 12,714 -4%FY13E 15,161 14,369 -5%
EPS (adjusted) (Rs)
FY12E 5.2 4.9 -6%
FY13E 6.1 5.7 -8%
Source: Bloomberg, Ambit Capital research
Valuation and recommendation:
At the current market price, the stock is trading at 6.5x and 9.2x our revised FY13EBITDA and earnings respectively. Our revised earnings imply a CAGR of 9% over FY11-13E. We value the standalone business at 10x FY13 earnings (a discount of
20% to the long term average multiple) and other strategic investments at 1x book value to arrive at our revised target price of Rs65 (compared to our earlier targetprice of Rs75) implying 25% upside. Despite downgrading our estimates, webelieve the recent share price underperformance (30% decline in the last six months) has made the stock reasonably attractive. We maintain BUY on thestock.
8/6/2019 Ambit Auto Thematic 3June2011
http://slidepdf.com/reader/full/ambit-auto-thematic-3june2011 11/27
Automobiles
Ambit Capital Pvt Ltd 11
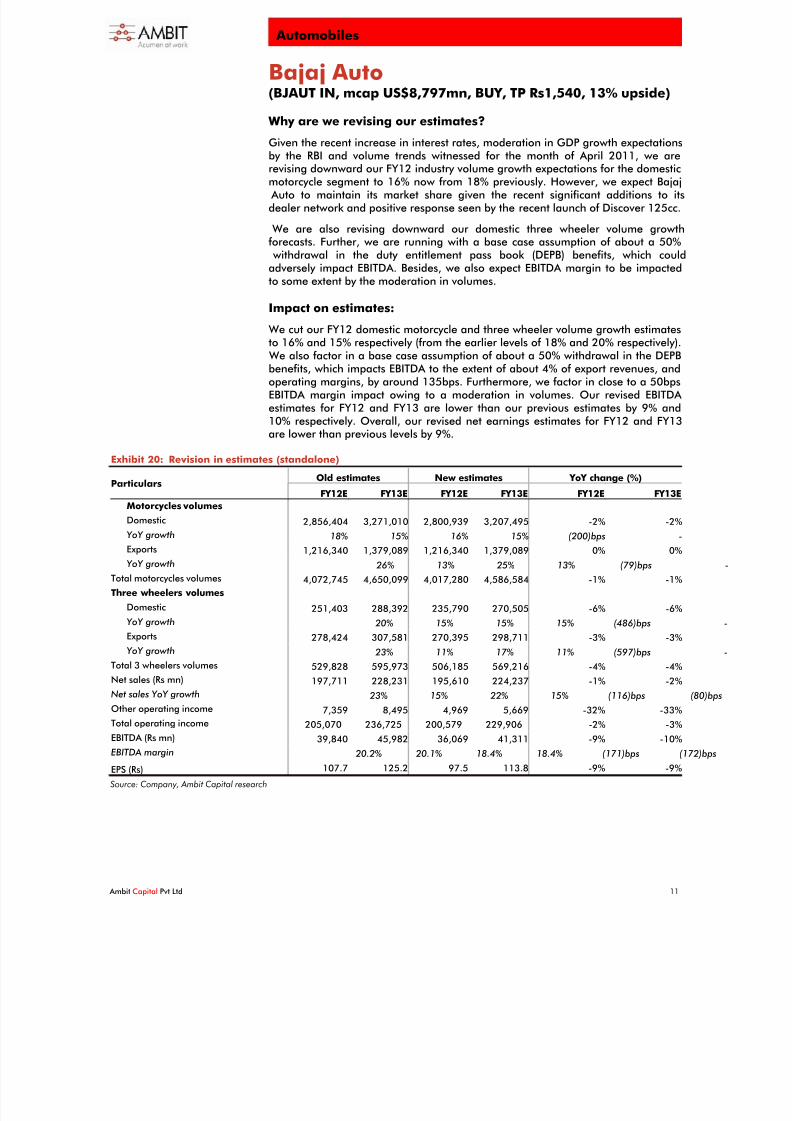
Bajaj Auto(BJAUT IN, mcap US$8,797mn, BUY, TP Rs1,540, 13% upside)
Why are we revising our estimates?
Given the recent increase in interest rates, moderation in GDP growth expectationsby the RBI and volume trends witnessed for the month of April 2011, we arerevising downward our FY12 industry volume growth expectations for the domesticmotorcycle segment to 16% now from 18% previously. However, we expect Bajaj
Auto to maintain its market share given the recent significant additions to itsdealer network and positive response seen by the recent launch of Discover 125cc.
We are also revising downward our domestic three wheeler volume growthforecasts. Further, we are running with a base case assumption of about a 50%
withdrawal in the duty entitlement pass book (DEPB) benefits, which couldadversely impact EBITDA. Besides, we also expect EBITDA margin to be impactedto some extent by the moderation in volumes.
Impact on estimates:
We cut our FY12 domestic motorcycle and three wheeler volume growth estimatesto 16% and 15% respectively (from the earlier levels of 18% and 20% respectively).
We also factor in a base case assumption of about a 50% withdrawal in the DEPBbenefits, which impacts EBITDA to the extent of about 4% of export revenues, andoperating margins, by around 135bps. Furthermore, we factor in close to a 50bpsEBITDA margin impact owing to a moderation in volumes. Our revised EBITDA estimates for FY12 and FY13 are lower than our previous estimates by 9% and10% respectively. Overall, our revised net earnings estimates for FY12 and FY13are lower than previous levels by 9%.
Exhibit 20: Revision in estimates (standalone)
Old estimates New estimates YoY change (%)
Particulars FY12E FY13E FY12E FY13E FY12E FY13E
Motorcycles volumes
Domestic 2,856,404 3,271,010 2,800,939 3,207,495 -2% -2%
YoY growth 18% 15% 16% 15% (200)bps -
Exports 1,216,340 1,379,089 1,216,340 1,379,089 0% 0%
YoY growth 26% 13% 25% 13% (79)bps
Total motorcycles volumes 4,072,745 4,650,099 4,017,280 4,586,584 -1% -1%
Three wheelers volumes
Domestic 251,403 288,392 235,790 270,505 -6% -6%
YoY growth 20% 15% 15% 15% (486)bps
Exports 278,424 307,581 270,395 298,711 -3% -3%
YoY growth 23% 11% 17% 11% (597)bps
Total 3 wheelers volumes 529,828 595,973 506,185 569,216 -4% -4%
Net sales (Rs mn) 197,711 228,231 195,610 224,237 -1% -2%
Net sales YoY growth 23% 15% 22% 15% (116)bps (80)bps
Other operating income 7,359 8,495 4,969 5,669 -32% -33%
Total operating income 205,070 236,725 200,579 229,906 -2% -3%
EBITDA (Rs mn) 39,840 45,982 36,069 41,311 -9% -10%
EBITDA margin 20.2% 20.1% 18.4% 18.4% (171)bps (172)bps
EPS (Rs) 107.7 125.2 97.5 113.8 -9% -9%
Source: Company, Ambit Capital research
8/6/2019 Ambit Auto Thematic 3June2011
http://slidepdf.com/reader/full/ambit-auto-thematic-3june2011 12/27
Automobiles
Ambit Capital Pvt Ltd 12
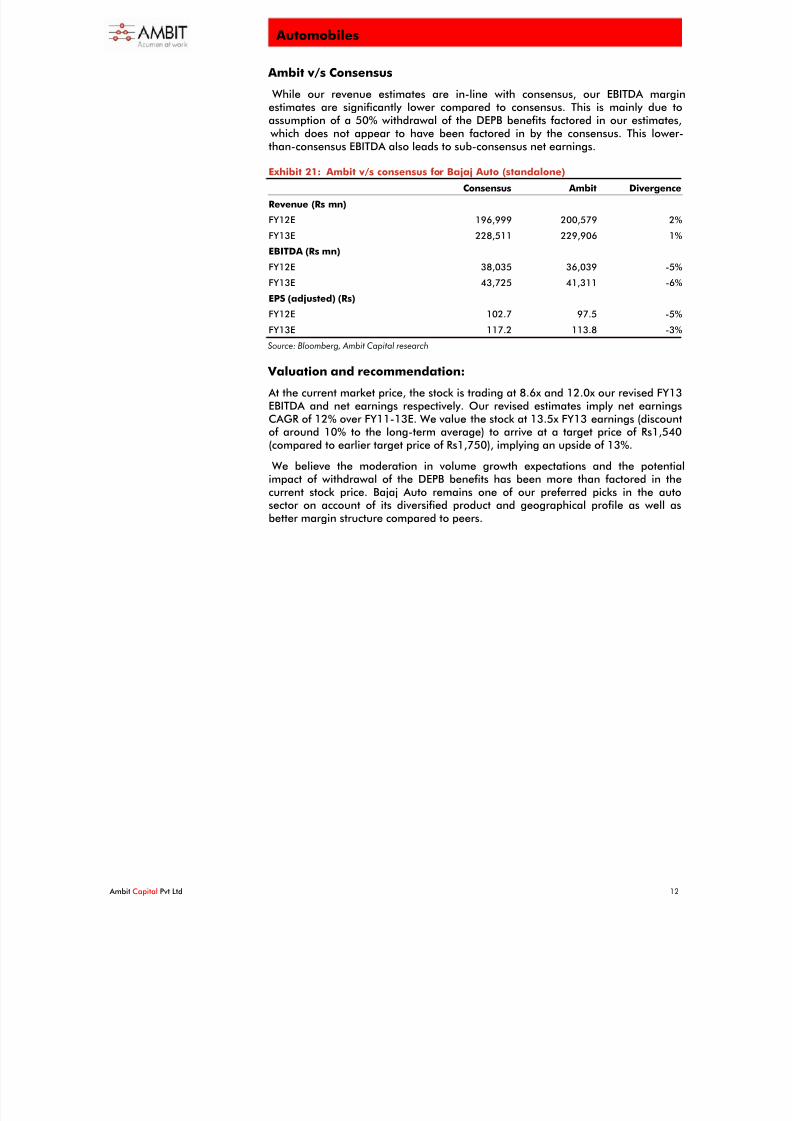
Ambit v/s Consensus
While our revenue estimates are in-line with consensus, our EBITDA marginestimates are significantly lower compared to consensus. This is mainly due toassumption of a 50% withdrawal of the DEPB benefits factored in our estimates,
which does not appear to have been factored in by the consensus. This lower-than-consensus EBITDA also leads to sub-consensus net earnings.
Exhibit 21: Ambit v/s consensus for Bajaj Auto (standalone)
Consensus Ambit Divergence
Revenue (Rs mn)
FY12E 196,999 200,579 2%
FY13E 228,511 229,906 1%
EBITDA (Rs mn)
FY12E 38,035 36,039 -5%
FY13E 43,725 41,311 -6%
EPS (adjusted) (Rs)
FY12E 102.7 97.5 -5%
FY13E 117.2 113.8 -3%
Source: Bloomberg, Ambit Capital research
Valuation and recommendation:
At the current market price, the stock is trading at 8.6x and 12.0x our revised FY13EBITDA and net earnings respectively. Our revised estimates imply net earningsCAGR of 12% over FY11-13E. We value the stock at 13.5x FY13 earnings (discountof around 10% to the long-term average) to arrive at a target price of Rs1,540(compared to earlier target price of Rs1,750), implying an upside of 13%.
We believe the moderation in volume growth expectations and the potentialimpact of withdrawal of the DEPB benefits has been more than factored in thecurrent stock price. Bajaj Auto remains one of our preferred picks in the autosector on account of its diversified product and geographical profile as well asbetter margin structure compared to peers.
8/6/2019 Ambit Auto Thematic 3June2011
http://slidepdf.com/reader/full/ambit-auto-thematic-3june2011 13/27
Automobiles
Ambit Capital Pvt Ltd 13
Tata Motors(TTMT IN, mcap US$13.8bn, BUY, TP Rs1,475, 41% upside)
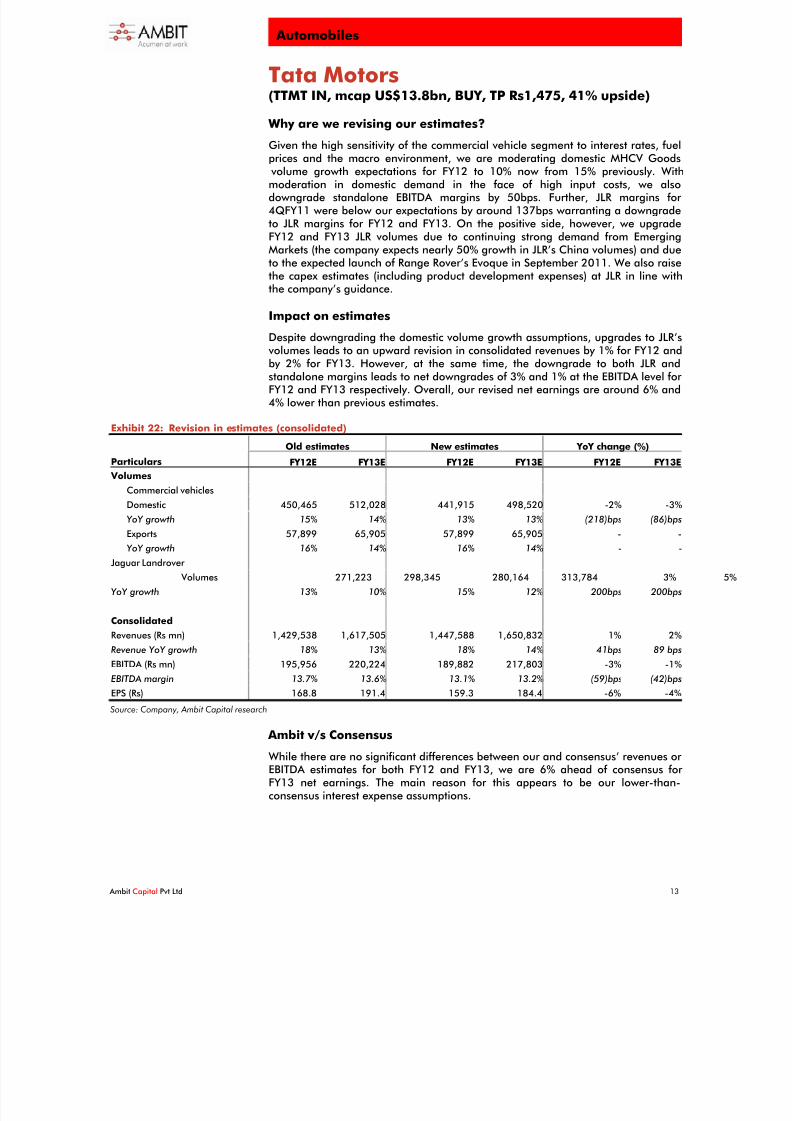
Why are we revising our estimates?
Given the high sensitivity of the commercial vehicle segment to interest rates, fuel
prices and the macro environment, we are moderating domestic MHCV Goods volume growth expectations for FY12 to 10% now from 15% previously. Withmoderation in domestic demand in the face of high input costs, we alsodowngrade standalone EBITDA margins by 50bps. Further, JLR margins for 4QFY11 were below our expectations by around 137bps warranting a downgradeto JLR margins for FY12 and FY13. On the positive side, however, we upgradeFY12 and FY13 JLR volumes due to continuing strong demand from EmergingMarkets (the company expects nearly 50% growth in JLR’s China volumes) and dueto the expected launch of Range Rover’s Evoque in September 2011. We also raisethe capex estimates (including product development expenses) at JLR in line withthe company’s guidance.
Impact on estimates
Despite downgrading the domestic volume growth assumptions, upgrades to JLR’s volumes leads to an upward revision in consolidated revenues by 1% for FY12 andby 2% for FY13. However, at the same time, the downgrade to both JLR andstandalone margins leads to net downgrades of 3% and 1% at the EBITDA level for FY12 and FY13 respectively. Overall, our revised net earnings are around 6% and4% lower than previous estimates.
Exhibit 22: Revision in estimates (consolidated)
Old estimates New estimates YoY change (%)
Particulars FY12E FY13E FY12E FY13E FY12E FY13E
Volumes
Commercial vehicles
Domestic 450,465 512,028 441,915 498,520 -2% -3%
YoY growth 15% 14% 13% 13% (218)bps (86)bps
Exports 57,899 65,905 57,899 65,905 - -
YoY growth 16% 14% 16% 14% - -
Jaguar Landrover
Volumes 271,223 298,345 280,164 313,784 3%
YoY growth 13% 10% 15% 12% 200bps 200bps
Consolidated
Revenues (Rs mn) 1,429,538 1,617,505 1,447,588 1,650,832 1% 2%
Revenue YoY growth 18% 13% 18% 14% 41bps 89 bps
EBITDA (Rs mn) 195,956 220,224 189,882 217,803 -3% -1%
EBITDA margin 13.7% 13.6% 13.1% 13.2% (59)bps (42)bps
EPS (Rs) 168.8 191.4 159.3 184.4 -6% -4%
Source: Company, Ambit Capital research
Ambit v/s Consensus
While there are no significant differences between our and consensus’ revenues or EBITDA estimates for both FY12 and FY13, we are 6% ahead of consensus for FY13 net earnings. The main reason for this appears to be our lower-than-consensus interest expense assumptions.

8/6/2019 Ambit Auto Thematic 3June2011
http://slidepdf.com/reader/full/ambit-auto-thematic-3june2011 14/27
Automobiles
Ambit Capital Pvt Ltd 14
Exhibit 23: Ambit v/s consensus for Tata Motors (consolidated)
Consensus Ambit Divergence
Revenue (Rs mn)
FY12E 1,424,420 1,454,074 2%
FY13E 1,610,716 1,657,527 3%
EBITDA (Rs mn)
FY12E 192,728 189,882 -1%FY13E 216,613 217,803 1%
EPS (adjusted) (Rs)
FY12E 156.6 159.3 2%
FY13E 174.1 184.4 6%
Source: Bloomberg, Ambit Capital research
Valuation and recommendation
Even after revising our estimates downwards, we expect the company to recordEBITDA and net earnings CAGR of 13% and 15% respectively for FY11-13E. TataMotors currently trades at 5.7x FY13 earnings, which is at a discount of 50% to
that of Indian automobile peers having nearly similar net earnings growthexpectations over FY11-13E (exhibit 16 on page 7). Even after proforma adjustingTata Motors’ net earnings for normalised R&D expenses (arriving at normalisedEBITDA and net earnings after charging 70% of product development expenses toP&L instead of current levels of 20%), the stock trades at 7.2x FY13 earningsimplying a discount of 40% to its Indian automobile peers.
We prefer to value the company on an SOTP basis. For the domestic business,our target FY13 EV/EBIDTA multiple of 6x is at a discount to the average multipleof 7x commanded by the company over FY04-11. For domestic business, we arriveat a fair value of Rs360 (compared to the previous fair value of Rs486).
For the JLR operations we arrive at a target FY13 EV/EBITDA of 6x, which is at a
discount of 30% to global car companies. This multiple of 6x is also consistent with what we have been using in our earlier valuation estimates. Our current estimatesfactor in 20% of the product development expenses being charged to the profitand loss statement (the rest being capitalised). We have therefore proformaadjusted EBITDA to account for the normalised product development expensecharge to P&L by deducting 70% (in line with average of BMW, Daimler and Audi)of product development expenses from EBITDA for the purpose of valuing JLR. For JLR, we arrive at a fair value of Rs980 (compared to the previous fair value of Rs980).
Within the other key subsidiaries, we value each of the companies at averagemultiples accorded to similar sized peers in the respective industry and recenttransaction multiples arriving at a fair value of Rs135 (compared to the previous
fair value of Rs134).
Overall, we arrive at an SOTP-based 12-month target price of Rs1,475(compared to earlier target price of Rs1,600), implying 41% upside.
8/6/2019 Ambit Auto Thematic 3June2011
http://slidepdf.com/reader/full/ambit-auto-thematic-3june2011 15/27
Automobiles June 3, 2011
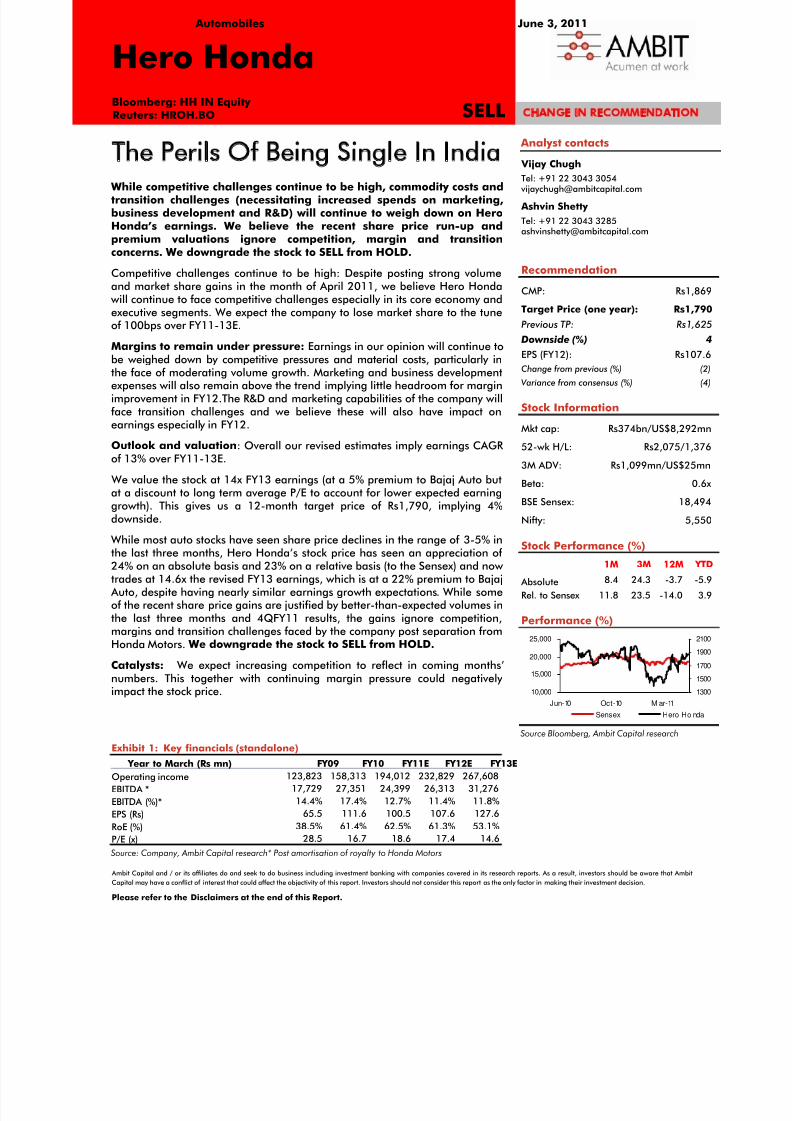
Hero HondaBloomberg: HH IN Equity Reuters: HROH.BO CHANGE IN RECOMMENDATION
Ambit Capital and / or its affiliates do and seek to do business including investment banking with companies covered in its research reports. As a result, investors should be aware that Ambit
Capital may have a conflict of interest that could affect the objectivity of this report. Investors should not consider this report as the only factor in making their investment decision.
Please refer to the Disclaimers at the end of this Report.
SELL
Exhibit 1: Key financials (standalone)
Year to March (Rs mn) FY09 FY10 FY11E FY12E FY13E
Operating income 123,823 158,313 194,012 232,829 267,608
EBITDA * 17,729 27,351 24,399 26,313 31,276
EBITDA (%)* 14.4% 17.4% 12.7% 11.4% 11.8%
EPS (Rs) 65.5 111.6 100.5 107.6 127.6
RoE (%) 38.5% 61.4% 62.5% 61.3% 53.1%
P/E (x) 28.5 16.7 18.6 17.4 14.6
Source: Company, Ambit Capital research* Post amortisation of royalty to Honda Motors
Analyst contacts
Vijay ChughTel: +91 22 3043 3054
Ashvin Shetty
Tel: +91 22 3043 [email protected]
Recommendation
CMP: Rs1,869
Target Price (one year): Rs1,790
Previous TP: Rs1,625Downside (%) 4
EPS (FY12): Rs107.6
Change from previous (%) (2)
Variance from consensus (%) (4)
Stock Information
Mkt cap: Rs374bn/US$8,292mn
52-wk H/L: Rs2,075/1,376
3M ADV: Rs1,099mn/US$25mn
Beta: 0.6x BSE Sensex: 18,494
Nifty: 5,550
Stock Performance (%)
1M 3M 12M YTD
Absolute 8.4 24.3 -3.7 -5.9
Rel. to Sensex 11.8 23.5 -14.0 3.9
Performance (%)
10,000
15,000
20,000
25,000
Jun-10 Oct-10 M ar-11
1300
1500
1700
1900
2100
Sensex Hero Ho nda
Source Bloomberg, Ambit Capital research
The Perils Of Being Single In India While competitive challenges continue to be high, commodity costs andtransition challenges (necessitating increased spends on marketing,business development and R&D) will continue to weigh down on HeroHonda’s earnings. We believe the recent share price run-up andpremium valuations ignore competition, margin and transitionconcerns. We downgrade the stock to SELL from HOLD.
Competitive challenges continue to be high: Despite posting strong volumeand market share gains in the month of April 2011, we believe Hero Honda will continue to face competitive challenges especially in its core economy andexecutive segments. We expect the company to lose market share to the tune
of 100bps over FY11-13E.
Margins to remain under pressure: Earnings in our opinion will continue tobe weighed down by competitive pressures and material costs, particularly inthe face of moderating volume growth. Marketing and business developmentexpenses will also remain above the trend implying little headroom for marginimprovement in FY12.The R&D and marketing capabilities of the company willface transition challenges and we believe these will also have impact onearnings especially in FY12.
Outlook and valuation: Overall our revised estimates imply earnings CAGR of 13% over FY11-13E.
We value the stock at 14x FY13 earnings (at a 5% premium to Bajaj Auto butat a discount to long term average P/E to account for lower expected earninggrowth). This gives us a 12-month target price of Rs1,790, implying 4%downside.
While most auto stocks have seen share price declines in the range of 3-5% inthe last three months, Hero Honda’s stock price has seen an appreciation of 24% on an absolute basis and 23% on a relative basis (to the Sensex) and now trades at 14.6x the revised FY13 earnings, which is at a 22% premium to Bajaj Auto, despite having nearly similar earnings growth expectations. While someof the recent share price gains are justified by better-than-expected volumes inthe last three months and 4QFY11 results, the gains ignore competition,margins and transition challenges faced by the company post separation from
Honda Motors. We downgrade the stock to SELL from HOLD.Catalysts: We expect increasing competition to reflect in coming months’numbers. This together with continuing margin pressure could negatively impact the stock price.

8/6/2019 Ambit Auto Thematic 3June2011
http://slidepdf.com/reader/full/ambit-auto-thematic-3june2011 16/27
Hero Honda
Ambit Capital Pvt Ltd 16
Exhibit 2: Key assumptions & estimates
Standalone FY11 FY12E FY13E Remarks
Volumes 5,402,444 6,218,721 7,096,242
YoY growth 17.4% 15.1% 14.1%
We expect demand for motorcycles to moderate. Further owingto strong competitive intensity, we expect the company to losemarket share to the tune of 100bps over FY12 and FY13
Net sales (Rs mn) 192,450 230,955 265,484
YoY Growth 20.0% 15.0%
Revenue grows much faster than volume growth for FY12 onaccount of favourable mix (as evident in 4QFY11 results)
EBITDA* (Rs mn) 24,399 26,313 31,276
EBITDA margin * 12.7% 11.4% 11.8%
We expect EBITDA margin to remain under pressure on accountof moderation in volumes, high input costs and transitionchallenges faced by the company
Adjusted PAT (Rs mn) 20,077 21,497 25,482
Adj PAT margin 10.4% 9.3% 9.6%
Fully diluted EPS (Rs) 100.5 107.6 127.6
Earnings for FY12 to remain under pressure on account of moderating volumes and margin headwinds
Wk cap days (ex cash) –closing
(76) (73) (72)
Work cap days (ex cash) –average
(75) (68) (68) We do not expect any significant change in working capital days
Capex (Rs mn) (4,216) (9,000) (6,000)
FCF (Rs mn) 18,356 21,124 28,681
Source: Company, Ambit Capital research; * Post amortisation of royalty to Honda Motors
Exhibit 3: Change in estimates
New estimates Old estimates Change (%, bps)Standalone
FY12E FY13E FY12E FY13E FY12E FY13EComments
Net sales (Rs mn) 230,955 265,484 225,464 262,128 2% 1%
EBITDA (Rs mn) * 26,313 31,276 26,160 30,414 1% 3%
EBITDA margin * 11.4% 11.8% 11.6% 11.6% (21)bps 18bps
PBT (Rs mn) 26,814 31,785 27,145 31,933 -1% 0%
PAT (Rs mn) 21,497 25,482 21,852 25,706 -2% -1%
EPS (Rs) 107.6 127.6 109.4 128.7 -2% -1%
Despite downgrading the volume estimates,there are net upgrades to revenues owingto favourable mix. EBITDA margin thoughmaintained at earlier levels owing to better than expected margins in 4QFY11, isexpected to remain much lower comparedto what the company has achieved in thepast.
Source: Ambit Capital research, * Post amortisation of royalty to Honda Motors
Exhibit 4: Ambit v/s consensus (standalone)
(Rs m) Ambit Consensus % divg. Reasons for divergence
Revenues
FY12E 230,955 223,458 3%
FY13E 265,484 253,324 5%
Our revenue estimates are aboveconsensus largely on account of higher realisation assumed in our estimates
EBIT
FY12E 23,712 24,160 -2%
FY13E 28,134 28,070 0%
Despite higher than consensus revenues,lower than consensus margins keepsabsolute EBITDA in line with consensus
EPS (Rs)
FY12E 107.6 112.4 -4%
FY13E 127.6 127.0 0%
Our net earnings estimates are largely
in line with consensus
Source: Bloomberg, Ambit Capital research

8/6/2019 Ambit Auto Thematic 3June2011
http://slidepdf.com/reader/full/ambit-auto-thematic-3june2011 17/27
Hero Honda
Ambit Capital Pvt Ltd 17
Valuation and RecommendationRelative valuation
On relative valuation, Hero Honda currently trades at a premium of 22% to Bajaj Auto on FY13 P/E despite having nearly similar earnings expectations.
Exhibit 5: Comparative valuation for our coverage universe
P/E EV/EBITDA Company
MCAP(US $mn) FY10 FY11 FY12 FY13 FY10 FY11 FY12 FY13
Sales growth(%) (FY11-13)
EPS growth (%)(FY11-13)
EBITDA growth(%) (FY11-13)
India
Ashok Leyland 1,543 16.4 11.0 10.6 9.2 12.2 7.7 7.3 6.5 14% 9% 9%
Bajaj Auto 8,797 21.2 15.1 14.0 12.0 13.8 10.5 9.9 8.6 18% 12% 10%
Hero Honda * 8,292 16.7 18.6 17.4 14.6 11.9 13.3 12.3 10.4 17% 13% 13%
Maruti Suzuki 7,899 14.0 15.1 14.2 12.8 7.6 8.1 7.3 6.2 15% 9% 14%
Tata Motors 13,795 21.1 7.5 6.6 5.7 9.6 4.6 4.1 3.6 16% 15% 13%
Average (ex-Hero Honda)
18.2 12.2 11.4 9.9 10.8 7.7 7.2 6.2 16% 11% 12%
Source: Bloomberg, Ambit Capital research (Ambit Capital estimates)*EBITDA taken post amortisation of royalty to Honda Motors
Cross cycle valuation
On a cross cycle basis, the recent run-up in share prices has resulted in HeroHonda trading at 18% premium to its long-term average one-year forward P/E.
Exhibit 6: Hero Honda – EV/EBITDA cycle
4
7
10
13
16
A p r - 0 4
A p r - 0 5
A p r - 0 6
A p r - 0 7
A p r - 0 8
A p r - 0 9
A p r - 1 0
A p r - 1 1
E V / E B I T D A
EV/EBITDA 6 year avg 4 year avg
Source: Company, Ambit Capital research
Exhibit 7: Hero Honda – P/E cycle
7
10
13
16
19
22
A p r - 0 4
A p r - 0 5
A p r - 0 6
A p r - 0 7
A p r - 0 8
A p r - 0 9
A p r - 1 0
A p r - 1 1
P
/ E
P/E 6 year avg 4 year avg
Source: Company, Ambit Capital research
RecommendationOverall our revised estimates imply earnings CAGR of 13% over FY11-13E. We value the stock at 14x FY13 earnings (at a 5% premium to Bajaj Auto but at adiscount to long term average P/E to account for lower expected earning growth).This gives us a valuation of Rs1,790, implying 4% downside. While most autostocks have seen share price declines in the range of 3-5% in the last threemonths, Hero Honda’s stock price has seen an appreciation of 24% on an absolutebasis and 23% on a relative basis (to the Sensex) and now trades at 14.6x therevised FY13 earnings, which is at a 22% premium to Bajaj Auto, despite havingnearly similar earnings expectations. While some of the recent share price gainsare justified by better-than-expected volumes in the last three months and 4QFY11results, the gains ignore competition, margins and transition challenges faced by
the company post separation from Honda Motors. We downgrade the stock toSELL from HOLD.
8/6/2019 Ambit Auto Thematic 3June2011
http://slidepdf.com/reader/full/ambit-auto-thematic-3june2011 18/27
Hero Honda
Ambit Capital Pvt Ltd 18
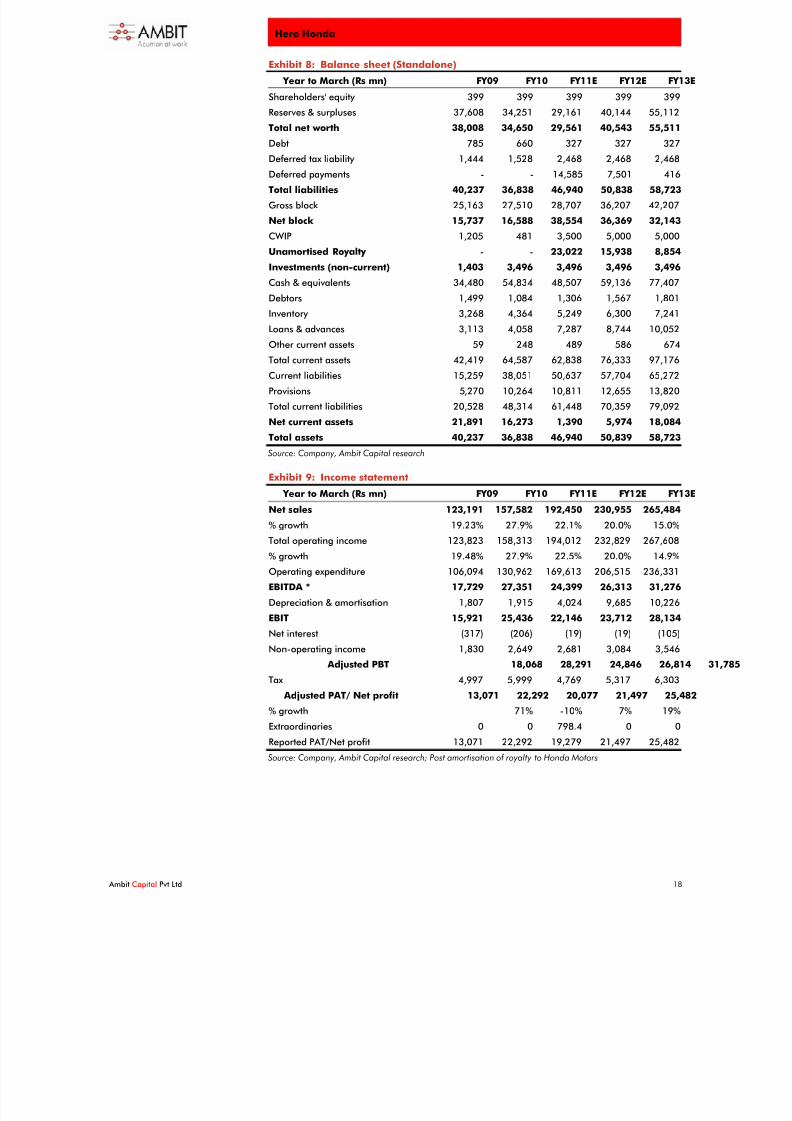
Exhibit 8: Balance sheet (Standalone)
Year to March (Rs mn) FY09 FY10 FY11E FY12E FY13E
Shareholders' equity 399 399 399 399 399
Reserves & surpluses 37,608 34,251 29,161 40,144 55,112
Total net worth 38,008 34,650 29,561 40,543 55,511
Debt 785 660 327 327 327
Deferred tax liability 1,444 1,528 2,468 2,468 2,468Deferred payments - - 14,585 7,501 416
Total liabilities 40,237 36,838 46,940 50,838 58,723
Gross block 25,163 27,510 28,707 36,207 42,207
Net block 15,737 16,588 38,554 36,369 32,143
CWIP 1,205 481 3,500 5,000 5,000
Unamortised Royalty - - 23,022 15,938 8,854
Investments (non-current) 1,403 3,496 3,496 3,496 3,496
Cash & equivalents 34,480 54,834 48,507 59,136 77,407
Debtors 1,499 1,084 1,306 1,567 1,801
Inventory 3,268 4,364 5,249 6,300 7,241
Loans & advances 3,113 4,058 7,287 8,744 10,052
Other current assets 59 248 489 586 674
Total current assets 42,419 64,587 62,838 76,333 97,176
Current liabilities 15,259 38,051 50,637 57,704 65,272
Provisions 5,270 10,264 10,811 12,655 13,820
Total current liabilities 20,528 48,314 61,448 70,359 79,092
Net current assets 21,891 16,273 1,390 5,974 18,084
Total assets 40,237 36,838 46,940 50,839 58,723
Source: Company, Ambit Capital research
Exhibit 9: Income statement
Year to March (Rs mn) FY09 FY10 FY11E FY12E FY13E
Net sales 123,191 157,582 192,450 230,955 265,484
% growth 19.23% 27.9% 22.1% 20.0% 15.0%
Total operating income 123,823 158,313 194,012 232,829 267,608
% growth 19.48% 27.9% 22.5% 20.0% 14.9%
Operating expenditure 106,094 130,962 169,613 206,515 236,331
EBITDA * 17,729 27,351 24,399 26,313 31,276
Depreciation & amortisation 1,807 1,915 4,024 9,685 10,226
EBIT 15,921 25,436 22,146 23,712 28,134
Net interest (317) (206) (19) (19) (105)
Non-operating income 1,830 2,649 2,681 3,084 3,546
Adjusted PBT 18,068 28,291 24,846 26,814 31,
Tax 4,997 5,999 4,769 5,317 6,303
Adjusted PAT/ Net profit 13,071 22,292 20,077 21,497 25,482
% growth 71% -10% 7% 19%
Extraordinaries 0 0 798.4 0 0
Reported PAT/Net profit 13,071 22,292 19,279 21,497 25,482
Source: Company, Ambit Capital research; Post amortisation of royalty to Honda Motors

8/6/2019 Ambit Auto Thematic 3June2011
http://slidepdf.com/reader/full/ambit-auto-thematic-3june2011 19/27
Hero Honda
Ambit Capital Pvt Ltd 19
Exhibit 10: Cash flow statement (standalone)
Year to March (Rs mn) FY09 FY10 FY11E FY12E FY13E
PBT 17,815 28,317 24,048 26,814 31,785
Depreciation & amortisation 1,807 1,915 4,024 9,685 10,226
Others (2,000) (2,440) (3,143) (7,103) (7,189)
Tax (5,016) (5,751) (3,828) (5,317) (6,303)
(Incr) / decr in net workingcapital
985 4,846 1,473 6,045 6,161
Cash flow from operations 13,590 26,887 22,572 30,124 34,681
Capex (3,135) (2,101) (4,216) (9,000) (6,000)
(Incr) / decr in investments (6,692) (3,633) - - -
Other income (expenditure) 1,215 458 - - -
Cash flow from investments (8,612) (5,276) (4,216) (9,000) (6,000)
Net borrowings (535) (125) (333) - -
Interest paid (25) (21) 19 19 105
Dividend paid (4,439) (20,948) (24,533) (10,514) (10,514)
Cash flow from financing (4,999) (21,093) (24,848) (10,496) (10,409)
Net change in cash (21) 518 (6,492) 10,628 18,272
Closing cash & cash equivalents 34,480 54,834 48,507 59,136 77,407
Free cash flow 10,455 24,787 18,356 21,124 28,681
Source: Company, Ambit Capital research
Exhibit 11: Ratio analysis
Year to March (%) FY09 FY10 FY11E FY12E FY13E
EBITDA margin* (%) 14.4% 17.4% 12.7% 11.4% 11.8%
EBIT margin (%) 12.9% 16.1% 11.5% 10.3% 10.6%
Net profit margin (%) 10.6% 14.1% 10.4% 9.3% 9.6%
Net debt: equity (x) (0.9) (1.6) (1.6) (1.5) (1.4)
RoE (%) 38.5% 61.4% 62.5% 61.3% 53.1%
Source: Company, Ambit Capital research; * Post amortisation of royalty to Honda Motors
Exhibit 12: Valuation parameters
Year to March (Rs mn) FY09 FY10 FY11E FY12E FY13E
EPS (Rs) 65.5 111.6 100.5 107.6 127.6
Diluted EPS (Rs) 65.5 111.6 100.5 107.6 127.6
Book value per share (Rs) 190.3 173.5 148.0 203.0 278.0
Dividend per share (Rs) 20.0 110.0 105.0 45.0 45.0
P/E (x) 28.5 16.7 18.6 17.4 14.6
P/BV (x) 9.8 10.8 12.6 9.2 6.7
EV/EBITDA (x) 18.3 11.9 13.3 12.3 10.4
EV/EBIT (x) 20.4 12.8 14.7 13.7 11.6
Source: Company, Ambit Capital research
8/6/2019 Ambit Auto Thematic 3June2011
http://slidepdf.com/reader/full/ambit-auto-thematic-3june2011 20/27
Automobiles June 3, 2011
Maruti SuzukiBloomberg: MSIL IN EQUITY Reuters: MRTI.BO CHANGE IN RECCOMENDATION
Ambit Capital and / or its affiliates do and seek to do business including investment banking with companies covered in its research reports. As a result, investors should be aware that Ambit
Capital may have a conflict of interest that could affect the objectivity of this report. Investors should not consider this report as the only factor in making their investment decision.
Please refer to the Disclaimers at the end of this Report.
SELL
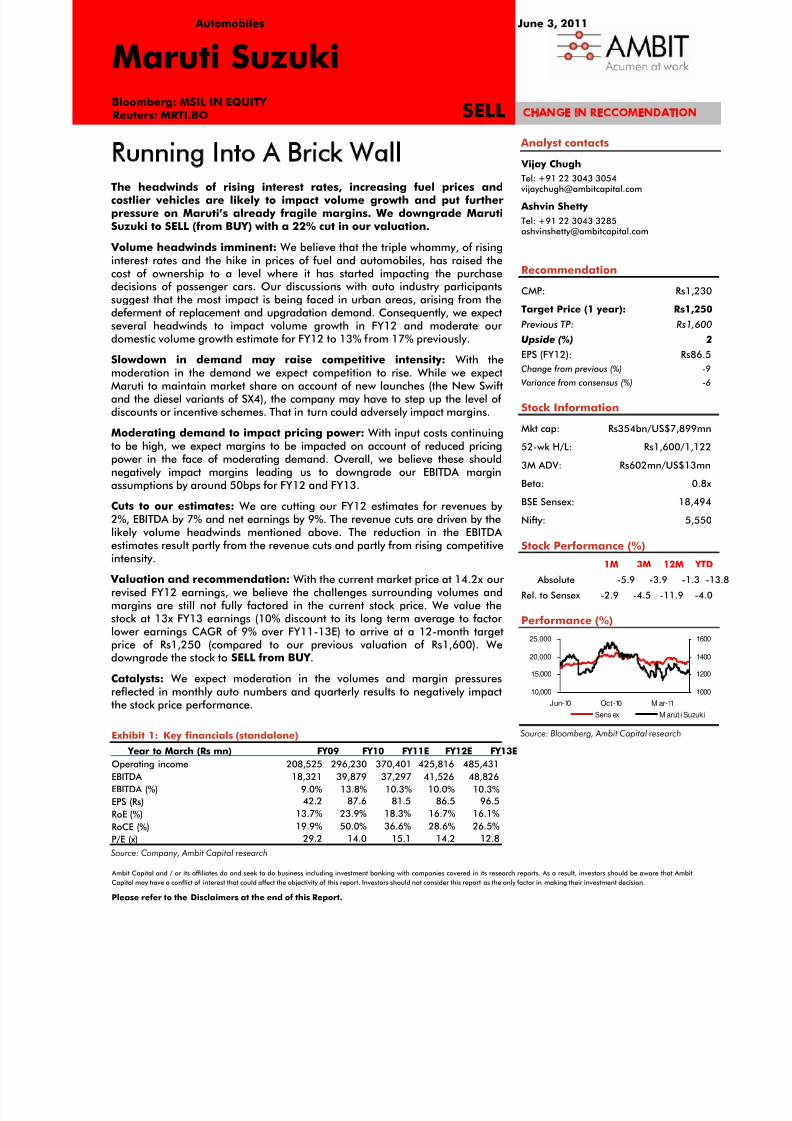
Exhibit 1: Key financials (standalone)
Year to March (Rs mn) FY09 FY10 FY11E FY12E FY13E
Operating income 208,525 296,230 370,401 425,816 485,431
EBITDA 18,321 39,879 37,297 41,526 48,826
EBITDA (%) 9.0% 13.8% 10.3% 10.0% 10.3%
EPS (Rs) 42.2 87.6 81.5 86.5 96.5
RoE (%) 13.7% 23.9% 18.3% 16.7% 16.1%
RoCE (%) 19.9% 50.0% 36.6% 28.6% 26.5%
P/E (x) 29.2 14.0 15.1 14.2 12.8
Source: Company, Ambit Capital research
Analyst contacts
Vijay ChughTel: +91 22 3043 3054
Ashvin Shetty
Tel: +91 22 3043 [email protected]
Recommendation
CMP: Rs1,230
Target Price (1 year): Rs1,250
Previous TP: Rs1,600Upside (%) 2
EPS (FY12): Rs86.5
Change from previous (%) -9
Variance from consensus (%) -6
Stock Information
Mkt cap: Rs354bn/US$7,899mn
52-wk H/L: Rs1,600/1,122
3M ADV: Rs602mn/US$13mn
Beta: 0.8x BSE Sensex: 18,494
Nifty: 5,550
Stock Performance (%)
1M 3M 12M YTD
Absolute -5.9 -3.9 -1.3 -13
Rel. to Sensex -2.9 -4.5 -11.9 -4.0
Performance (%)
10,000
15,000
20,000
25,000
Jun-10 Oct-10 M ar-11
1000
1200
1400
1600
Sens ex M arut i Suzuki
Source: Bloomberg, Ambit Capital research
Running Into A Brick WallThe headwinds of rising interest rates, increasing fuel prices andcostlier vehicles are likely to impact volume growth and put furtherpressure on Maruti’s already fragile margins. We downgrade MarutiSuzuki to SELL (from BUY) with a 22% cut in our valuation.
Volume headwinds imminent: We believe that the triple whammy, of risinginterest rates and the hike in prices of fuel and automobiles, has raised thecost of ownership to a level where it has started impacting the purchasedecisions of passenger cars. Our discussions with auto industry participantssuggest that the most impact is being faced in urban areas, arising from thedeferment of replacement and upgradation demand. Consequently, we expect
several headwinds to impact volume growth in FY12 and moderate our domestic volume growth estimate for FY12 to 13% from 17% previously.
Slowdown in demand may raise competitive intensity: With themoderation in the demand we expect competition to rise. While we expectMaruti to maintain market share on account of new launches (the New Swiftand the diesel variants of SX4), the company may have to step up the level of discounts or incentive schemes. That in turn could adversely impact margins.
Moderating demand to impact pricing power: With input costs continuingto be high, we expect margins to be impacted on account of reduced pricingpower in the face of moderating demand. Overall, we believe these shouldnegatively impact margins leading us to downgrade our EBITDA margin
assumptions by around 50bps for FY12 and FY13.
Cuts to our estimates: We are cutting our FY12 estimates for revenues by 2%, EBITDA by 7% and net earnings by 9%. The revenue cuts are driven by thelikely volume headwinds mentioned above. The reduction in the EBITDA estimates result partly from the revenue cuts and partly from rising competitiveintensity.
Valuation and recommendation: With the current market price at 14.2x our revised FY12 earnings, we believe the challenges surrounding volumes andmargins are still not fully factored in the current stock price. We value thestock at 13x FY13 earnings (10% discount to its long term average to factor lower earnings CAGR of 9% over FY11-13E) to arrive at a 12-month target
price of Rs1,250 (compared to our previous valuation of Rs1,600). Wedowngrade the stock to SELL from BUY .
Catalysts: We expect moderation in the volumes and margin pressuresreflected in monthly auto numbers and quarterly results to negatively impactthe stock price performance.

8/6/2019 Ambit Auto Thematic 3June2011
http://slidepdf.com/reader/full/ambit-auto-thematic-3june2011 21/27
Maruti Suzuki
Ambit Capital Pvt Ltd 21
Exhibit 2: Key assumptions & estimates (standalone)
Standalone FY11 FY12E FY13E
Volumes (nos)
Domestic 1,132,739 1,279,995 1,447,334
YoY growth 30% 13% 13%
Given the challenges arising from increasing interest rates, hikein fuel prices and increase in vehicle prices, we expect demandto moderate significantly in FY12
Exports 138,266 142,917 157,380
YoY growth -6% 3% 10%
Exports to remain subdued in FY12 before recovering somewhatin FY13, helped to some extent by the lower base
Total 1,271,005 1,422,912 1,604,714
Net sales (Rs mn) 361,282 416,429 475,179
YoY growth 25% 15% 14%
Revenue growth to be helped to some extent by better thanexpected mix (as visible in 4QFY11 results)
EBITDA (Rs mn) 37,297 41,526 48,826
EBITDA margin 10.3% 10.0% 10.3%
We expect moderation in demand to impact the ability of automobile companies to pass on the rise in input costs andthereby keep the margin under pressure.
Adjusted PAT (Rs mn) 23,540 25,010 27,879
Adj PAT margin 6.5% 6.0% 5.9%
Fully diluted EPS (Rs) 81.5 86.5 96.5
Earnings for FY12 to remain muted on account of moderating volumes and margin headwinds
Wk cap days (ex cash) –closing
(2) (2) (2)
Work cap days (ex cash) –average
(1) (2) (2) We do not expect any significant change in working capital days
Capex (Rs mn) 25,592 40,000 25,000Capex for FY12 to remain high on account of expansion projectsundertaken by the company
FCF (Rs mn) 11,334 (2,800) 18,708
Net debt/(cash) (Rs mn) (53,565) (47,510) (62,982)High capex in FY12 to impact FCF and net debt
Source: Company, Ambit Capital research
Exhibit 3: Change in estimates (standalone)
New estimates Old estimates Change (%, bps)Standalone
FY12E FY13E FY12E FY13E FY12E FY13EComments
Net sales (Rs mn) 416,429 475,179 423,851 485,223 -1.8% -2.1%Net downgrades to revenues largely flowingfrom moderation in volumes
EBITDA (Rs mn) 41,526 48,826 44,409 52,225 -6.5% -6.5%
EBITDA margin 10.0% 10.3% 10.5% 10.8% (51)bps (49)bps
We downgrade margins by around 50bps
on account of moderation in volumes whichmay impact the pricing power of thecompany
PBT (Rs mn) 34,736 39,267 38,487 44,308 -9.7% -11.4%
PAT (Rs mn) 25,010 27,879 27,326 31,459 -8.5% -11.4%
EPS (Rs) 86.5 96.5 94.6 108.9 -8.5% -11.4%
Lower EBITDA together with increase indepreciation expenses leads to significantdowngrades at PBT, PAT and EPS levels.
Source: Ambit Capital research
8/6/2019 Ambit Auto Thematic 3June2011
http://slidepdf.com/reader/full/ambit-auto-thematic-3june2011 22/27
Maruti Suzuki
Ambit Capital Pvt Ltd 22
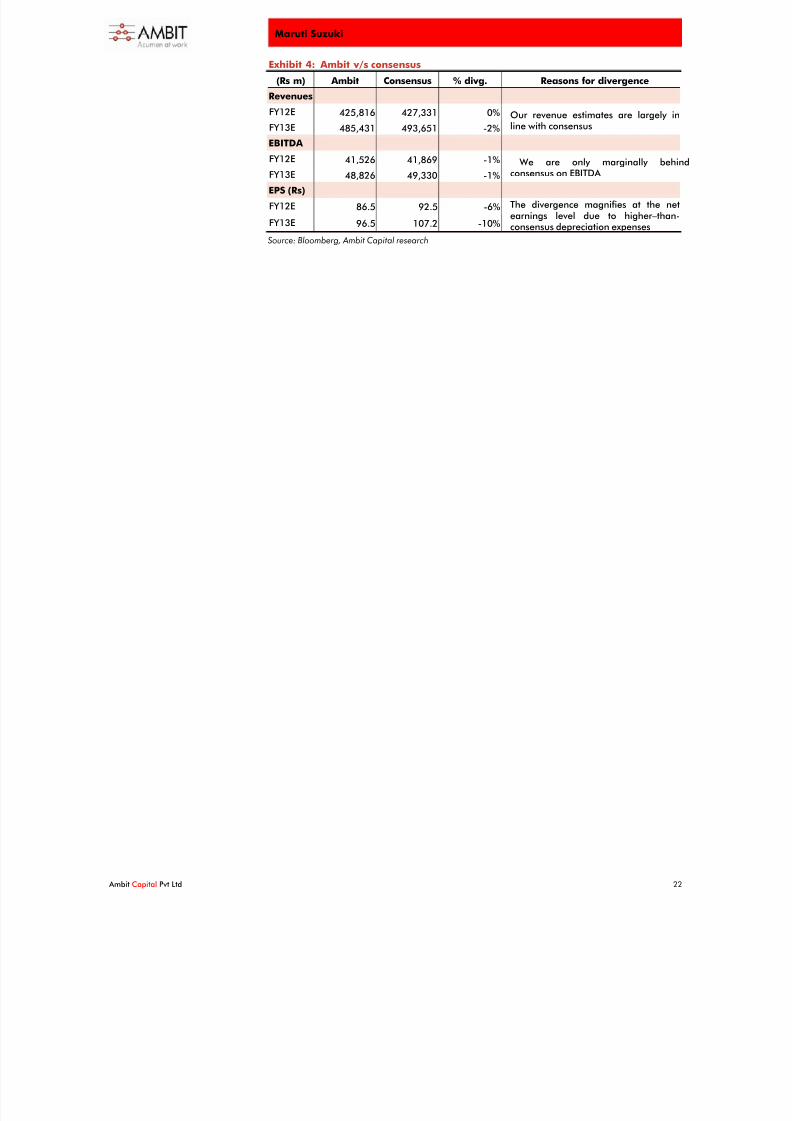
Exhibit 4: Ambit v/s consensus
(Rs m) Ambit Consensus % divg. Reasons for divergence
Revenues
FY12E 425,816 427,331 0%
FY13E 485,431 493,651 -2%
Our revenue estimates are largely inline with consensus
EBITDA
FY12E 41,526 41,869 -1%FY13E 48,826 49,330 -1%
We are only marginally behindconsensus on EBITDA
EPS (Rs)
FY12E 86.5 92.5 -6%
FY13E 96.5 107.2 -10%
The divergence magnifies at the netearnings level due to higher–than-consensus depreciation expenses
Source: Bloomberg, Ambit Capital research

8/6/2019 Ambit Auto Thematic 3June2011
http://slidepdf.com/reader/full/ambit-auto-thematic-3june2011 23/27
Maruti Suzuki
Ambit Capital Pvt Ltd 23
Valuation and RecommendationRelative valuation
On relative valuation, Maruti Suzuki currently trades at a premium of 23% to thesector on FY13 P/E despite having lower-than-average earnings expectations versus the sector.
Exhibit 5: Comparative valuation for our coverage universe
P/E EV/EBITDA Company
MCAP(US $mn) FY10 FY11 FY12 FY13 FY10 FY11 FY12 FY13
Sales growth(%) (FY11-13)
EPS growth (%)(FY11-13)
EBITDA growth(%) (FY11-13)
India
Ashok Leyland 1,543 16.4 11.0 10.6 9.2 12.2 7.7 7.3 6.5 14% 9% 9%
Bajaj Auto 8,797 21.2 15.1 14.0 12.0 13.8 10.5 9.9 8.6 18% 12% 10%
Hero Honda * 8,292 16.7 18.6 17.4 14.6 11.9 13.3 12.3 10.4 17% 13% 13%
Maruti Suzuki 7,899 14.0 15.1 14.2 12.8 7.6 8.1 7.3 6.2 15% 9% 14%
Tata Motors 13,795 21.1 7.5 6.6 5.7 9.6 4.6 4.1 3.6 16% 15% 13%
Average (ex-
Maruti)
18.9 13.0 12.1 10.4 11.9 9.0 8.4 7.3 16% 12% 11%
Source: Bloomberg, Ambit Capital research, (Ambit Capital estimates)*EBITDA taken post amortisation of royalty to Honda Motors
Cross cycle valuation
On a cross cycle basis, while Maruti Suzuki is trading at 4% discount to its long-term average one-year forward P/E, we believe this discount does not factor in thenear term challenges to the earnings growth.
Exhibit 6: Maruti Suzuki – EV/EBITDA cycle
2
5
8
11
14
A p r - 0 4
A p r - 0 5
A p r - 0 6
A p r - 0 7
A p r - 0 8
A p r - 0 9
A p r - 1 0
A p r - 1 1
E V / E B I T D A
EV/EBITDA 6 year avg 4 year avg
Source: Company, Ambit Capital research
Exhibit 7: Maruti Suzuki – P/E cycle
5
8
11
14
17
20
23
A p r - 0 4
A p r - 0 5
A p r - 0 6
A p r - 0 7
A p r - 0 8
A p r - 0 9
A p r - 1 0
A p r - 1 1
P / E
P/E 6 year avg 4 year avg
Source: Company, Ambit Capital research
Recommendation
We cut our FY12 estimates for revenues by 2%, for EBITDA by 7% and for netearnings by 9%. With the current market price at 14.2x our revised FY12 earnings, we believe the challenges attendant with volumes and margins are still not fully factored in the current stock price. We value the stock at 13x FY13 earnings (10%discount to the long-term average to factor lower earnings CAGR of 9% over FY11-13E) to arrive at a 12-month target price of Rs1,250 (compared to the earlier target price of Rs1,600). We downgrade the stock to SELL from HOLD.
8/6/2019 Ambit Auto Thematic 3June2011
http://slidepdf.com/reader/full/ambit-auto-thematic-3june2011 24/27
Maruti Suzuki
Ambit Capital Pvt Ltd 24
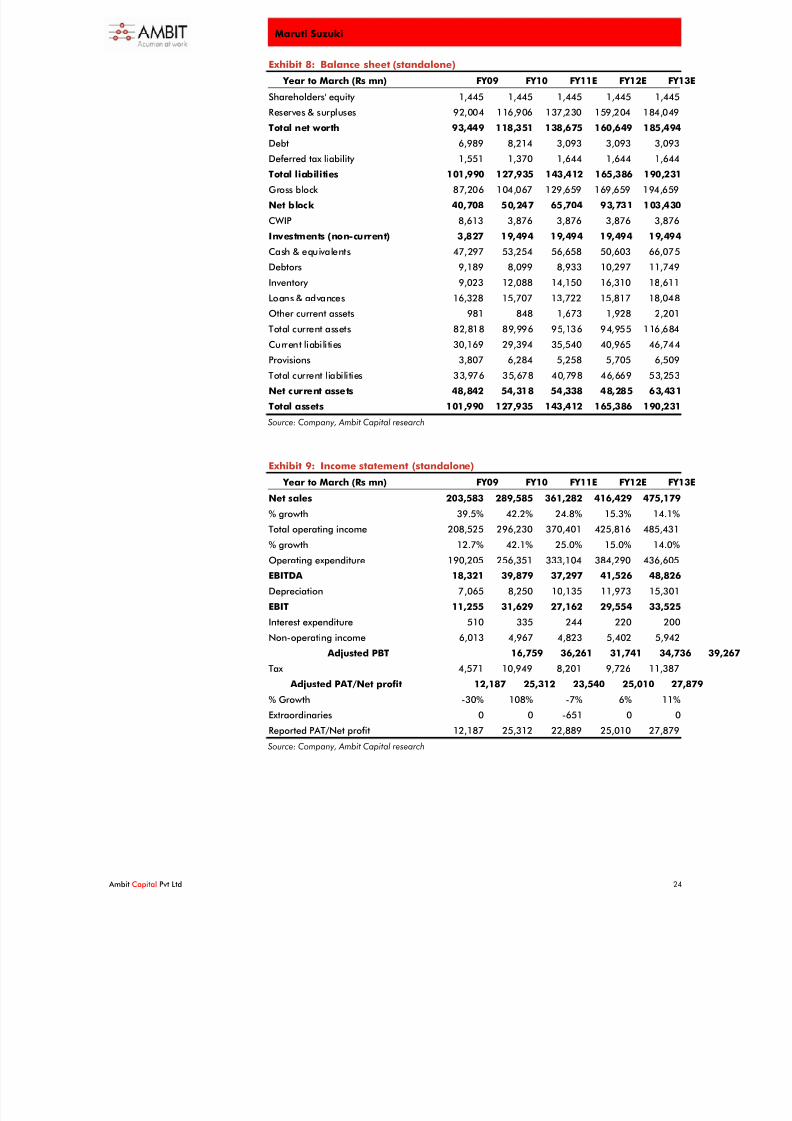
Exhibit 8: Balance sheet (standalone)
Year to March (Rs mn) FY09 FY10 FY11E FY12E FY13E
Shareholders' equity 1,445 1,445 1,445 1,445 1,445
Reserves & surpluses 92,004 116,906 137,230 159,204 184,049
Total net worth 93,449 118,351 138,675 160,649 185,494
Debt 6,989 8,214 3,093 3,093 3,093
Deferred tax liability 1,551 1,370 1,644 1,644 1,644Total liabilities 101,990 127,935 143,412 165,386 190,231
Gross block 87,206 104,067 129,659 169,659 194,659
Net block 40,708 50,247 65,704 93,731 103,430
CWIP 8,613 3,876 3,876 3,876 3,876
Investments (non-current) 3,827 19,494 19,494 19,494 19,494
Cash & equivalents 47,297 53,254 56,658 50,603 66,075
Debtors 9,189 8,099 8,933 10,297 11,749
Inventory 9,023 12,088 14,150 16,310 18,611
Loans & advances 16,328 15,707 13,722 15,817 18,048
Other current assets 981 848 1,673 1,928 2,201
Total current assets 82,818 89,996 95,136 94,955 116,684
Current liabilities 30,169 29,394 35,540 40,965 46,744
Provisions 3,807 6,284 5,258 5,705 6,509
Total current liabilities 33,976 35,678 40,798 46,669 53,253
Net current assets 48,842 54,318 54,338 48,285 63,431
Total assets 101,990 127,935 143,412 165,386 190,231
Source: Company, Ambit Capital research
Exhibit 9: Income statement (standalone)
Year to March (Rs mn) FY09 FY10 FY11E FY12E FY13ENet sales 203,583 289,585 361,282 416,429 475,179
% growth 39.5% 42.2% 24.8% 15.3% 14.1%
Total operating income 208,525 296,230 370,401 425,816 485,431
% growth 12.7% 42.1% 25.0% 15.0% 14.0%
Operating expenditure 190,205 256,351 333,104 384,290 436,605
EBITDA 18,321 39,879 37,297 41,526 48,826
Depreciation 7,065 8,250 10,135 11,973 15,301
EBIT 11,255 31,629 27,162 29,554 33,525
Interest expenditure 510 335 244 220 200
Non-operating income 6,013 4,967 4,823 5,402 5,942
Adjusted PBT 16,759 36,261 31,741 34,736 39,
Tax 4,571 10,949 8,201 9,726 11,387
Adjusted PAT/Net profit 12,187 25,312 23,540 25,010 27,879
% Growth -30% 108% -7% 6% 11%
Extraordinaries 0 0 -651 0 0
Reported PAT/Net profit 12,187 25,312 22,889 25,010 27,879
Source: Company, Ambit Capital research

8/6/2019 Ambit Auto Thematic 3June2011
http://slidepdf.com/reader/full/ambit-auto-thematic-3june2011 25/27
Maruti Suzuki
Ambit Capital Pvt Ltd 25
Exhibit 10: Cash flow statement (standalone)
Year to March (Rs mn) FY09 FY10 FY11E FY12E FY13E
PBT 16,758 35,925 31,090 34,736 39,267
Depreciation 7,065 8,250 10,135 11,973 15,301
Others (6,367) (4,905) 244 220 200
Tax (4,524) (10,279) (7,927) (9,726) (11,387)
(Incr) / decr in net workingcapital
(999) (117) 3,384 (2) 327
Cash flow from operations 11,933 28,874 36,926 37,200 43,708
Capex (16,136) (13,149) (25,592) (40,000) (25,000)
(Incr) / decr in investments 22,181 (38,787) - - -
Other income (expenditure) 3,469 4,103 - - -
Cash flow from investments 9,514 (47,833) (25,592) (40,000) (25,000)
Net borrowings (3,339) 1,881 (5,121) - -
Interest paid (579) (319) (244) (220) (200)
Dividend paid (1,444) (1,011) (2,529) (3,035) (3,035)
Cash flow from financing (5,362) 551 (7,895) (3,255) (3,235)
Net change in cash 16,085 (18,408) 3,439 (6,055) 15,472
Closing cash & cash equivalents 47,297 53,254 56,658 50,603 66,075
Free cash flow (4,203) 15,725 11,334 (2,800) 18,708
Source: Company, Ambit Capital research
Exhibit 11: Ratio analysis
Year to March (%) FY09 FY10 FY11E FY12E FY13E
EBITDA margin (%) 9.0% 13.8% 10.3% 10.0% 10.3%
EBIT margin (%) 5.5% 10.9% 7.5% 7.1% 7.1%
Net profit margin (%) 6.0% 8.7% 6.5% 6.0% 5.9%
Net debt: equity (x) (0.4) (0.4) (0.4) (0.3) (0.3)
RoCE (%) 19.9% 50.0% 36.6% 28.6% 26.5%
RoIC (%) 14.4% 34.9% 27.1% 20.6% 18.8%
RoE (%) 13.7% 23.9% 18.3% 16.7% 16.1%
Source: Company, Ambit Capital research
Exhibit 12: Valuation parameters
Year to March (Rs mn) FY09 FY10 FY11E FY12E FY13E
EPS (Rs)42.2 87.6 81.5 86.5 96.5
Diluted EPS (Rs) 42.2 87.6 81.5 86.5 96.5
Book value per share (Rs) 323.4 409.5 479.8 555.9 641.8
Dividend per share (Rs) 1.8 3.0 7.5 9.0 9.0
P/E (x) 29.2 14.0 15.1 14.2 12.8
P/BV (x) 3.8 3.0 2.6 2.2 1.9
EV/EBITDA (x) 16.5 7.6 8.1 7.3 6.2
EV/EBIT (x) 26.8 9.5 11.1 10.2 9.0
Source: Company, Ambit Capital research
8/6/2019 Ambit Auto Thematic 3June2011
http://slidepdf.com/reader/full/ambit-auto-thematic-3june2011 26/27
Maruti Suzuki
Ambit Capital Pvt Ltd 26
Institutional Equities Team
Saurabh Mukherjea,CFA
Managing Director - Institutional Equities – (022) 30433174 [email protected]
Research
Analysts Industry Sectors Desk-Phone E-mail
Aadesh Mehta Banking / NBFCs (022) 30433239 [email protected]
Amit K. Ahire Telecom / Media & Entertainment (022) 30433202 [email protected]
Ankur Rudra, CFA IT/Education Services (022) 30433211 [email protected]
Ashish Shroff Technical Analysis (022) 30433209/3221 [email protected]
Ashvin Shetty Consumer/Automobile (022) 30433285 [email protected]
Bhargav Buddhadev Power/Capital Goods (022) 30433252 [email protected]
Chandrani De, CFA Metals & Mining (022) 30433210 [email protected]
Chhavi Agarwal Construction, Infrastructure (022) 30433203 [email protected]
Gaurav Mehta Derivatives Research (022) 30433255 [email protected]
Hardik Shah Technology (022) 30433291 [email protected]
Krishnan ASV Banking (022) 30433205 [email protected]
Nitin Bhasin Construction, Infrastructure, Cement (022) 30433241 [email protected]
Pankaj Agarwal, CFA NBFCs (022) 30433206 [email protected]
Parita Ashar Metals & Mining / Media / Telecom (022) 30433223 [email protected]
Puneet Bambha Power/Capital Goods (022) 30433259 [email protected]
Ritika Mankar Economy (022) 30433175 [email protected]
Ritu Modi Cement (022) 30433292 [email protected]
Shariq Merchant Consumer (022) 30433246 [email protected]
Subhashini Gurumurthy IT/Education Services (022) 30433264 [email protected]
Vijay ChughConsumer (incl FMCG, Retail,
Automobiles)(022) 30433054 [email protected]
Sales
Name Regions Desk-Phone E-mail
Deepak Sawhney India / Asia (022) 30433295 [email protected]
Dharmen Shah India / Asia (022) 30433289 [email protected]
Dipti Mehta India / Europe (022) 30433053 [email protected]
Pramod Gubbi, CFA India / Asia (022) 30433228 [email protected]
Sarojini Ramachandran UK / US +44 (0) 20 7614 8374 [email protected]

8/6/2019 Ambit Auto Thematic 3June2011
http://slidepdf.com/reader/full/ambit-auto-thematic-3june2011 27/27
Maruti Suzuki
Explanation of Investment Rating
Investment Rating Expected return(over 12-month period from date of initial rating)
Buy >15%
Hold 5% to 15%
Sell <5%
Disclaimer This report or any portion hereof may not be reprinted, sold or redistributed without the written consent ot Ambit Capital. AMBIT Capital Research is disseminated and available primarily
electronically, and, in some cases, in printed form.
Additional information on recommended securities is available on request.
DISCLAIMER 1. AMBIT Capital Private Limited (“AMBIT Capital”) and its affiliates are a full service, integrated investment banking, investment advisory and brokerage group. AMBIT
Capital is a Stock Broker, Portfolio Manager and Depository Participant registered with Securities and Exchange Board of India Limited (SEBI) and is regulated by SEBI
2. The recommendations, opinions and views contained in this Research Report reflect the views of the research analyst named on the Research Report and are basedupon publicly available information and rates of taxation at the time of publication, which are subject to change from time to time without any prior notice.
3. AMBIT Capital makes best endeavours to ensure that the research analyst(s) use current, reliable, comprehensive information and obtain such information fromsources which the analyst(s) believes to be reliable. However, such information has not been independently verified by AMBIT Capital and/or the analyst(s) and norepresentation or warranty, express or implied, is made as to the accuracy or completeness of any information obtained from third parties. The information or opinions are provided as at the date of this Research Report and are subject to change without notice.
4. If you are dissatisfied with the contents of this complimentary Research Report or with the terms of this Disclaimer, your sole and exclusive remedy is to stop usingthis Research Report and AMBIT Capital shall not be responsible and/ or liable in any manner.
5. If this Research Report is received by any client of AMBIT Capital or its affiliate, the relationship of AMBIT Capital/its affiliate with such client will continue to begoverned by the terms and conditions in place between AMBIT Capital/ such affiliate and the client.
6. This Research Report is issued for information only and should not be construed as an investment advice to any recipient to acquire, subscribe, purchase, sell,dispose of, retain any securities. Recipients should consider this Research Report as only a single factor in making any investment decisions. This Research Report isnot an offer to sell or the solicitation of an offer to purchase or subscribe for any investment or as an official endorsement of any investment.
7. If 'Buy', 'Sell', or 'Hold' recommendation is made in this Research Report such recommendation or view or opinion expressed on investments in this Research Report isnot intended to constitute investment advice and should not be intended or treated as a substitute for necessary review or validation or any professional advice. The
views expressed in this Research Report are those of the research analyst which are subject to change and do not represent to be an authority on the subject. AMBITCapital may or may not subscribe to any and/ or all the views expressed herein.
8. AMBIT Capital makes no guarantee, representation or warranty, express or implied; and accepts no responsibility or liability as to the accuracy or completeness or currentess of the information in this Research Report. AMBIT Capital or its affiliates do not accept any liability whatsoever for any direct or consequential loss
howsoever arising, directly or indirectly, from any use of this Research Report.9. Past performance is not necessarily a guide to evaluate future performance.10. AMBIT Capital and/or its affiliates (as principal or on behalf of its/their clients) and their respective officers directors and employees may hold positions in any
securities mentioned in this Research Report (or in any related investment) and may from time to time add to or dispose of any such securities (or investment). Suchpositions in securities may be contrary to or inconsistent with this Research Report.
11. This Research Report should be read and relied upon at the sole discretion and risk of the recipient.12. The value of any investment made at your discretion based on this Research Report or income therefrom may be affected by changes in economic, financial and/ or
political factors and may go down as well as up and you may not get back the full or the expected amount invested. Some securities and/ or investments involvesubstantial risk and are not suitable for all investors.
13. This Research Report is being supplied to you solely for your information and may not be reproduced, redistributed or passed on, directly or indirectly, to any other person or published, copied in whole or in part, for any purpose. Neither this Research Report nor any copy of it may be taken or transmitted or distributed, directly or indirectly within India or into any other country including United States (to US Persons), Canada or Japan or to any resident thereof. The distribution of thisResearch Report in other jurisdictions may be strictly restricted and/ or prohibited by law or contract, and persons into whose possession this Research Report comesshould inform themselves about such restriction and/ or prohibition, and observe any such restric tions and/ or prohibition.
14. Neither AMBIT Capital nor its affiliates or their respective directors, employees, agents or representatives, shall be responsible or liable in any manner, directly or indirectly, for views or opinions expressed in this Report or the contents or any errors or discrepancies herein or for any decisions or actions taken in reliance on theReport or inability to use or access our service or this Research Report or for any loss or damages whether direct or indirect, incidental, special or consequentialincluding without limitation loss of revenue or profits that may arise from or in connection with the use of or reliance on this Research Report or inability to use or access our service or this Research Report.
Conflict of Interests15. In the normal course of AMBIT Capital’s business circumstances may arise that could result in the interests of AMBIT Capital conflicting with the interests of clients or
one client’s interests conflicting with the interest of another client. AMBIT Capital makes best efforts to ensure that conflicts are identified and managed and thatclients’ interests are protected. AMBIT Capital has policies and procedures in place to control the flow and use of non-public, price sensitive information andemployees’ personal account trading. Where appropriate and reasonably achievable, AMBIT Capital segregates the activities of staff working in areas where conflictsof interest may arise. However, clients/potential clients of AMBIT Capital should be aware of these possible conflicts of interests and should make informed decisionsin relation to AMBIT Capital’s services.
16. AMBIT Capital and/or its affiliates may from time to time have investment banking, investment advisory and other business relationships with companies covered inthis Research Report and may receive compensation for the same. Research analysts provide important inputs into AMBIT Capital’s investment banking and other business selection processes.
17. AMBIT Capital and/or its affiliates may seek investment banking or other businesses from the companies covered in this Research Report and research analystsinvolved in preparing this Research Report may participate in the solicitation of such business.
18. In addition to the foregoing, the companies covered in this Research Report may be clients of AMBIT Capital where AMBIT Capital may be required, inter alia, toprepare and publish research reports covering such companies and AMBIT Capital may receive compensation from such companies in relation to such services.However, the views reflected in this Research Report are objective views, independent of AMBIT Capital’s relationship with such company.
19. In addition, AMBIT Capital may also act as a market maker or risk arbitrator or liquidity provider or may have assumed an underwriting commitment in the securitiesof companies covered in this Research Report (or in related investments) and may also be represented in the supervisory board or on any other committee of thosecompanies.
© Copyright 2006 AMBIT Capital Private Limited. All rights reserved. Ambit Capital Pvt. Ltd. Ambit House, 3rd Floor 449, Senapati Bapat Marg, Lower Parel, Mumbai 400 013, India.
Ph 91 22 3043 3000


