2017Annual results
Simon AzoulayChairman and Chief Executive Officer
Bruno BenolielDeputy Chief Executive Officer
Paris, February 21st, 2018

DISCLAIMER
“This presentation may contain “forward-looking” statements that arebased on trends or targets. Such information should not be consideredas a forecast of the Company’s future results or as any other sort ofperformance indicator. By its very nature, this information is subject torisk and uncertainty and factors that may be outside of the Company’scontrol in certain cases. A more detailed description of these risks anduncertainties is provided in the Company’s Registration document,available on its website at (www.alten.com). “

BUSINESS AND HIGHLIGHTS IN
2017

February 21st 2018 l 2017 Annual results
FOOTPRINT IN OVER 20 COUNTRIES
ALTEN, LEADER IN ENGINEERING & TECHNOLOGY CONSULTING (ETC)
+13.0%
Revenue €1,975.4M 46.3%€ 914.4 million: +10.1%
53.7%€ 1,061.1 million: +15,6%
24,700 ENGINEERS (88% OF TOTAL HEADCOUNT)
9.8% OF REVENUE
GEARING: - 3,2%
28,000 employees
Oper. Profit on Activity €194,2M
FRANCE:
INTERNATIONAL:
+7.4%

February 21st 2018 l 2017 Annual results
24,700 ENGINEERS IN OVER 20 COUNTRIESO/W 59% WORKING OUTSIDE FRANCE
December2015
December2016
June2017
December2017
Variation 12 months
FRANCE 8,900 9,550 9,950 10,200 650 6.8%
EUROPE(excl. France) 7,130 8,195 9,220 10,130 1,935 23.6%
AFRICA & MIDDLE-EAST
220 450 480 450 0 0%
ASIAINDIA/CHINA
1,300 2,155 2,500 2,660 505 23.4%
USACANADA
450 950 1,050 1 260 310 32.6%
TOTAL 18,000 21,300 23,200 24,700 3,400 16.0%
5

February 21st 2018 l 2017 Annual results
Well-balanced sector-based distribution
6
Energy11.4%
Rail/Naval2.7%
Defence & Security4.4%
Aerospace15.6%
BFI*6.8%
*Banking Finance Insurance
Telecoms7.7%
23.7% 2016
24.8%23.7% 2016
24.8%14.8% 2016
14.3%14.8% 2016
14.3%
22.4% 2016
22.7%22.4% 2016
22.7%18.6% 2016
18.2% 18.6% 2016
18.2%
20.5% 2016
20.0%20.5% 2016
20.0%
Medias6.6%
Automotive22.1%
Retail & Services & Public sector11.4%
Other Industries4.7%
Life Sciences6.6%
€1,975M

February 21st 2018 l 2017 Annual results7
ALTEN Covering the whole product life‐cycle
ConsultingBI/AnalyticsOrganization PMO
TestCertification
PrototypingSettingTesting
Customer SupportTraining
Engineering Roll out
MonitoringQuality assurance
R&D externalisationDesign and Conception
Industrial Process & Manufacturing Engineering
Core‐Business
IT Applications & Network IT & Network Integration

February 21st 2018 l 2017 Annual results
ALTEN’S POSITIONNING
8
LEVEL POSITION GROSSMARGIN
LEVEL 4 IP / Investments / high « Capex » / Risk Sharing Random & long term
LEVEL 3Workpackages(globalisation, work units or fixed‐priceprojects) Services of
value‐addedengineers
25%
To
35%LEVEL 2 Technological Consulting & Time & Material
LEVEL 1 Interim & Staffing ≈ 15%

February 21st 2018 l 2017 Annual results
OUR MARKETS
Sustained investments with manufacturers & equipment manufacturers in the fields of propulsion, autonomous & connected vehicles, emissions, and electric vehicles.Changes in value chain contributors, introduction of new market players, economicpressures: this sector is undergoing major changes.22.1%
In France: “Grand Paris” Plan. Exports: dynamic markets. Opportunities enhanced by the merge process of Alstom and Siemens.
Growth of submarine and large ship markets (Naval Group‐STX).
Digital transformation (Customer service, Big data, Virtual reality, Industry 4.0, etc.) Increased speed and transformation of the industrial tool, predictive maintenance, clean and economical engines, new development programmes (Falcon/FX/A320 NeoPlus, etc.): this sector is changing, consolidating and remains a promising market.The sectors of launchers (Ariane 6) and communication satellites are in sustainedgrowth.
2.7%
15.6%
AUTOMOTIVE
AEROSPACE/SPACE
9
RAIL/NAVAL
4.4%
DEFENCE & SECURITYGovernment investments resume.Various projects linked to Cyber Security.Favourable outlook for the next few years.

February 21st 2018 l 2017 Annual results
OUR MARKETS
11.4%
18.2%
ENERGY Business seems to have stabilised in the Oil&Gas sector since the end of 2017. The upstream market, i.e. geosciences, seismic studies, exploratory drilling programmes, etc. should resume growth (provided bbl > US$ 60).No new major projects in the nuclear sector: ongoing restructuration (Advanced & Areva). Security and MOC in nuclear power stations are stable.
The main challenges of this sector are Cyber security, digital transformation, regulatory projects, evolution of Information systems in Cloud computing, etc.
BFI/SERVICES/PUBLIC SECTOR
Investments in network infrastructures resume with the development of high speed and fiber optic networks.
7.7%
TELECOMS
10
6.6%
LIFE SCIENCES
Strong growth in the pharmaceuticals and medical equipment sectors.

February 21st 2018 l 2017 Annual results
EXTERNAL GROWTH
ALTEN completed six acquisitions outside France in 2017:
Two acquisitions in Germany and Switzerland(revenue: €20M ‐ 170 additional consultants)
Four acquisitions in the United States(revenue: €32M ‐ 205 additional consultants)
Various projects of external growth initiated in 2017 should becompleted in H1 2018.
11

February 21st 2018 l 2017 Annual results
SHAREHOLDER BASE AT FEBRUARY 13TH, 2018
% shareholding
FCPE Alten0.57%
Founder15.07%
Public82.98%
Treasury stock1.38%
Euronext ParisSegment A
FR 0000071946Eligible for Deferred
Settlement Service(SRD)
% of voting rights
Founder 26.15%
FCP ALTEN 0.50%
Public 73.35%
• Capitalization (at 02/13/18): €2,585M
• Number of shares (at 02/13/18): 33,828.497
• Capitalization (at 02/13/18): €2,585M
• Number of shares (at 02/13/18): 33,828.497
12

2017 Annual results
The annual financial statements have been subject to an audit review. This audit review will be issued once allpublication procedures for the financial report have been finalized.

February, 21st 2018 l 2017 Annual results
ACCELERATED INTERNATIONAL GROWTH
30.9%
69.1%
73.0%
48.4%
52.5%
27.0%
53.7%
20102000 2005 2015 2016
916.6
436.2
1,748.3
2017
1,975.4
1,540.9
INT
FR
M
46.3%47.5%193.1
51.6%
93.5%
2.5%
February 21st 2018 l 2017 Annual results
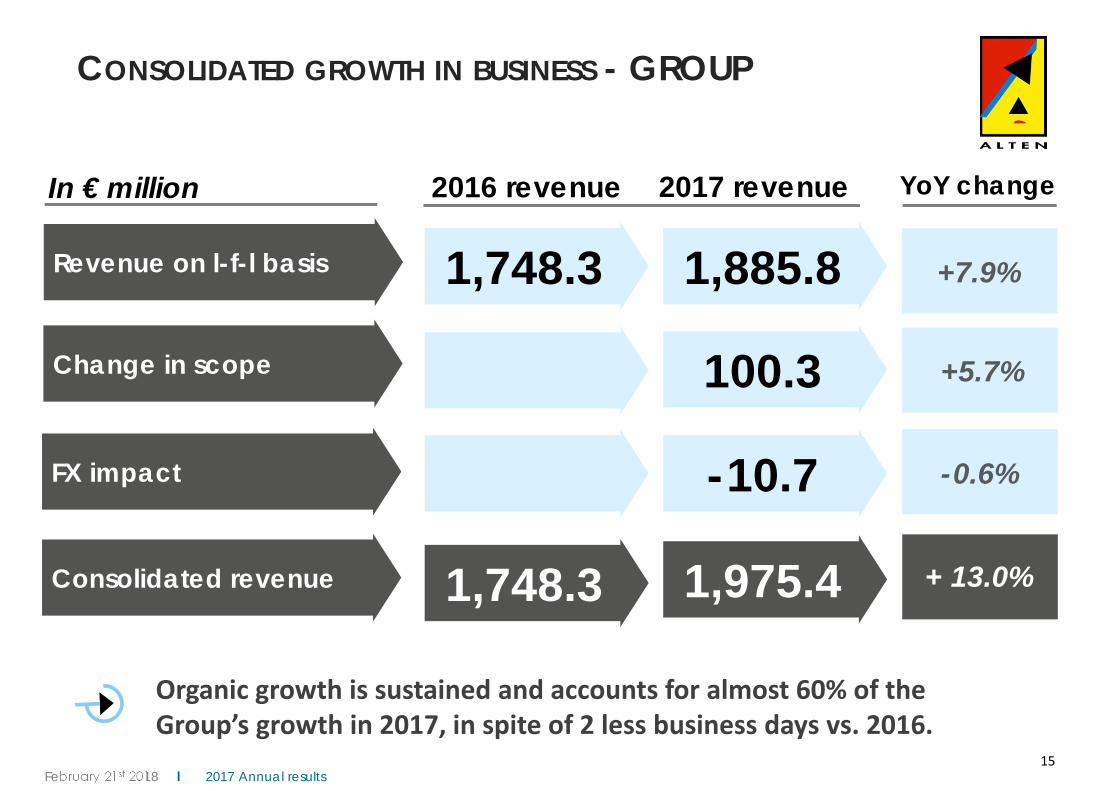
CONSOLIDATED GROWTH IN BUSINESS - GROUP
+ 13.0%
+7.9%
Organic growth is sustained and accounts for almost 60% of the Group’s growth in 2017, in spite of 2 less business days vs. 2016.
-0.6%
In € million 2016 revenue 2017 revenue YoY change
1,748.3 1,885.8
100.3
-10.7
1,748.3 1,975.4
Revenue on l-f-l basis
Change in scope
FX impact
Consolidated revenue
+5.7%
15

February 21st 2018 l 2017 Annual results
GROWTH IN FRENCH BUSINESS
+10.1%
+7.1%
In € million 2016 revenue 2017 revenue YoY change
830.1 889.1
25.3
830.1 914.4
Revenue on l-f-l basis
Change in scope
France - TOTAL
+3.0%
16
France has returned to a sustained organic growth in 2017.

February 21st 2018 l 2017 Annual results
GROWTH IN INTERNATIONAL BUSINESS
+15.6%
+8.5%
Organic growth in international business remains strong.External growth accounts for almost 50% of total growth.
-1.1%
In € million 2016 revenue 2017 revenue YoY change
918.2 996.7
75.1
-10.7
918.2 1,061.1
Revenue on l-f-l basis
Change in scope
FX impact
International - TOTAL
+8.2%
17

February 21st 2018 l 2017 Annual results
CONSOLIDATED REVENUE BY REGION(€ MILLION)
18
YTD Var.
Country 2016 % 2017 % Var. of which organic. excl forex
France 830.1 47.5% 914.4 46.3% 10.2% 7.1%
International 918.2 52.5% 1,061.1 53.7% 15.6% 8.5%
North America 162.9 9.3% 217.4 11.0% 33.4% 16.3%
Germany 177.2 10.1% 206.5 10.5% 16.5% 1.6%
Scandinavia 136.0 7.8% 156.3 7.9% 15.0% 16.7%
Spain 82.9 4.7% 92.2 4.7% 11.2% 11.2%
United‐Kingdom 93.2 5.3% 79.0 4.0% ‐15.2% ‐12.0%
Italy 74.1 4.2% 76.2 3.9% 2.8% 2.8%
Belgium 61.6 3.5% 64.9 3.3% 5.4% 5.4%
Netherlands 53.8 3.1% 58.8 3.0% 9.3% 9.3%
Asia‐Pacific 25.8 1.5% 40.0 2.0% 54.8% 46.0%
Others 50.7 2.9% 69.7 3.5% 37.6% 11.6%
TOTAL 1,748.3 100% 1,975.4 100.0% 13.0% 7.9%

February 21st 2018 l 2017 Annual results
CONDENSED INCOME STATEMENT
The operating margin ‐ penalised by a negative calendar effect (‐2 business days), is nevertheless satisfactory and has increased in H2 2017.
In € million H1 2016
H2 2016 YTD H1
2017H2
2017YTD 2017
YoY change 2016/2017 %
Revenue 870.5 877.8 1 748.3 983.7 991.7 1 975.4 + 13.0%
Operating profit on ActivityAs % of revenue
88.510.2%
92.410.5%
180.910.35%
92.69.4%
101.610.2%
194.29.8%
+ 7.4%
Share-based payments - -9.0 -9.0 -10.0 -2.8 -12.8
Non-recurring profit/(loss) & impairment
-1.6 -12.9 -14.5 0.5 -5.3 -4.8
Operating profitAs % of revenue
86.9 10.0 %
70.5 8.0 %
157.49.0%
82.18.3%
93.59.4%
176.68.9% + 12.2%
Financial income / (loss) -2.6 2.5 -0.1 18.3 -2.1 16.2
Income tax expenseEMCs and minority interests
-25.82.4
-24.12.6
-49.95.0
-28.51.4
-21.73.0
-50.24.4
Net earnings, Group shareAs % of revenue
60.97.0 %
51.5 5.9%
112.46.4%
73.37.5%
72.77.3%
147.07.4%
+30.7%
19

February 21st 2018 l 2017 Annual results
CONDENSED INCOME STATEMENT BY REGION
In € million 2016France
2016International
2016Full-year 2017
France2017
International2017
Full-year
Revenue 830.1 918.2 1,748.3 914.4 1,061.1 1,975.4Operating profit on ActivityAs % of revenue
92.911.2%
88.09.6%
180.910.3%
99.510.9%
94.88.9.%
194.29.8%
Share-based payments -8.2 -0.8 -9.0 -10.7 -2.1 -12.8
Non-recurring profit/(loss) & impairment
-11.5 -3.0 -14.5 0.4 -5.2 -4.8
Operating profitAs % of revenue
72.48.7%
85.09.3%
157.49.0%
89.29.8%
87.58.2%
176.68.9%
Financial income / (loss) 3.9 -4.0 -0.1 15.6 0.6 16.2
Income tax expenseEMCs and minority interests
-25.55.0
-24.4-0.1
-49.95.0
-25.85.5
-24.4-1.1
-50.24.4
Net earnings, Group shareAs % of revenue
55.96.7%
56.56.2%
112.46.4%
84.59.2%
62.65.9%
147.07.4%
20

February 21st 2018 l 2017 Annual results
A healthy balance sheet; gearing of ‐3.2%
CONDENSED BALANCE SHEET
N-C LIABILITIES: 45.6
ACTIFS COURANTS :
779.4
o/w customer receivables: 647.3
CURRENT ASSETS:
681.7o/w customer receivables:
579.2
Dec. 2016 Dec. 2017Dec. 2017 Dec. 2016
ASSETS (€ million) Equity & LIABILITIES (€ million)
NON-CURRENT ASSETS:
554.9
o/w goodwill : 436.7
NON-CURRENT ASSETS:
552.3
o/w goodwill : 411.2
Net cash position: 84.0 Net cash position: 95.0
CURRENT LIABILITIES:
455.9
CURRENT LIABILITIES:
489.2
N-C LIABILITIES: 53.0
SHAREHOLDERS’ EQUITY:
739.1
o/w Group share: 738.7
SHAREHOLDERS’ EQUITY:
834.2
o/w Group share: 832.6
Current financial liabilities: 81.0 Current financial liabilities: 49.3
21

February 21st 2018 l 2017 Annual results
-33.2
Net cash 31/12/2016
Net cash 31/12/2017
Otherfinancing flows
Cash flow fromoperating activities
Tax paidChange in WCR
Financial investments
Dividends
CHANGE IN NET CASH POSITION IN 2017 (€ MILLION)
Capex
Free cash flow: +77.9
17.4
17.4
4.6
22
204.2
-60.5
-52.3
27.2
-13.4-19.6
-2.5

February 21st 2018 l 2017 Annual results
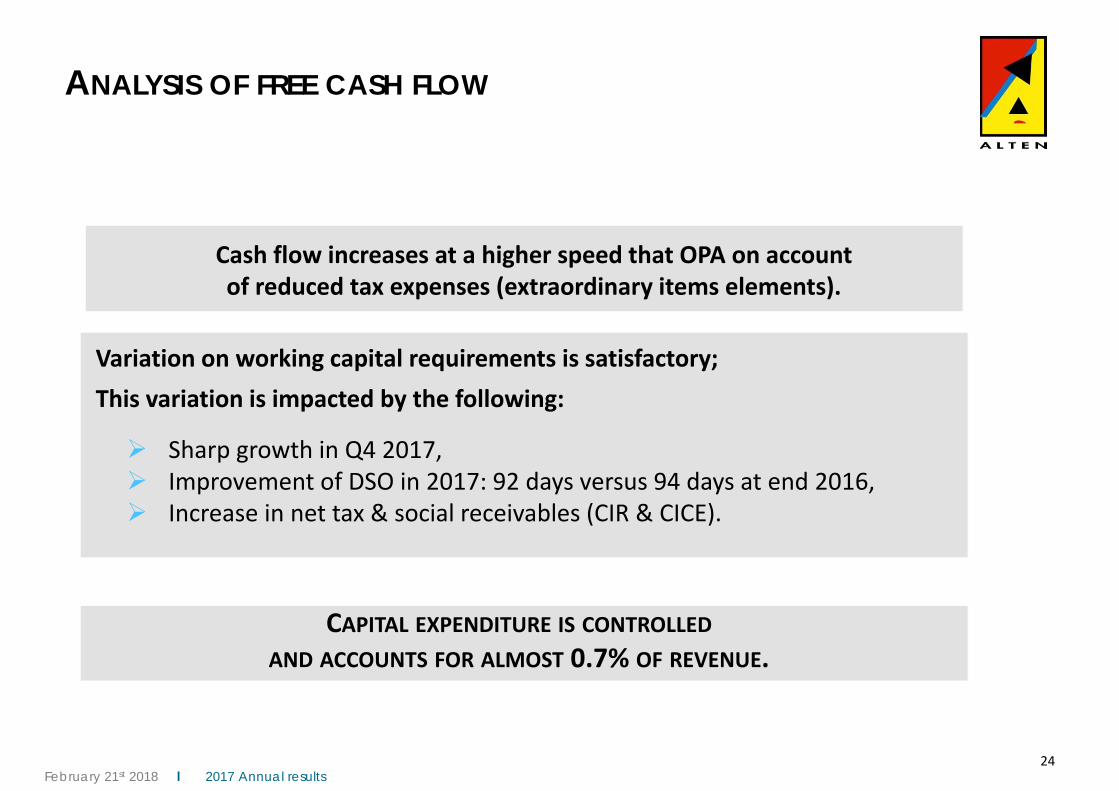
ANALYSIS OF FREE CASH FLOW
CASH FLOW *AS % OF REVENUE
Tax paid
Change in WCR
Cash from operationsAS % OF REVENUE
FREE CASH FLOW
AS % OF REVENUE
CAPEX
185.710.6%
(52.3)(20.9)
112.46.4%
(1.2)
111.2
204.2
(52.3)
(60.5)
4.6%
(13.4)
20162016 20172017
10.3%
94.4
(24.5)
(46.3)
23.62.4%
(5.0)
18.6
9.6%
H1H1109.8
(27.8)
(14.2)
6.8%
11.1%
H2H2
6.4% 3.9%1.9% 6.0%
+10.0%
changeYoY
change
-18.7%
-30.0%
* Gross operating cash flow** includes a disinvestment of €12,6M
23
67.7 91.3
(8.4)
59.3 77.9
**
February 21st 2018 l 2017 Annual results
ANALYSIS OF FREE CASH FLOW
24
Cash flow increases at a higher speed that OPA on accountof reduced tax expenses (extraordinary items elements).
CAPITAL EXPENDITURE IS CONTROLLEDAND ACCOUNTS FOR ALMOST 0.7% OF REVENUE.
Variation on working capital requirements is satisfactory;This variation is impacted by the following:
Sharp growth in Q4 2017, Improvement of DSO in 2017: 92 days versus 94 days at end 2016, Increase in net tax & social receivables (CIR & CICE).

February 21st 2018 l 2017 Annual results
Free cash flow has improved: restated for the funding of organic growth as well as the increase of net tax & social receivables, cash flow would have reached 7% of revenue, i.e. its normative level (6.5% ‐ 7%) with an OPA of 10%.
After it self‐financed its organic growth, external growth and dividendpayments, ALTEN holds a net cash position of €27M.
SUMMARY
The organic growth of the Group accelerated throughout 2017, both in France and on an international level, more particulary in Q4.
The operating margin on activity, although penalised by a negative calendareffect, has remained satisfactory.
It has increased in H2 to reach 10.2% of total revenue.
25

Growth strategy

February 21st 2018 l 2017 Annual results
THREE-YEAR DEVELOPMENT STRATEGY
27
Remain focused on high added value engineering skills: ALTEN Core business 80% in Studies – Design ‐ Engineering Specialized subsidiaries 20% Consulting, training, Customer service …
Confirm ALTEN as the essential player of our clients’ transformation programmes (Big data/industry 4.0/digital transformation etc.)
Our Challenges for 2018 ‐ 2020:
Strengthen our positions in Eastern Europe, North America, and China thanks to organic and external growth in order to reach more than 2,000 engineers per geographical area.
Follow onand complete the workpackage transformation in Germany; achievecritical mass of 4,000 engineers and restore operating margin (≥ 10%).

February, 21st 2018 l 2017 Annual results
3,000
Acquisitions +4 000
1989 – 20001989 – 2000 2001 – 20152001 – 2015 2016 – 20192016 – 2019
3 growth vectors: - Recruitement- Project control- Targeted acquisitions
3 growth vectors: - Recruitement- Project control- Targeted acquisitions
TOTAL 3,000TOTAL 3,000 TOTAL 18,000TOTAL 18,000 TOTAL > 28,000VS 25,000 (target at end‐2016)
TOTAL > 28,000VS 25,000 (target at end‐2016)
3,000
14,000 18,000
>24,000
Acquisitions > 4 000
+ 11,000Organic
> 6,000Organic+
+
33% external growth 35% external growth
BUSINESS GROWTH PLAN

February, 21st 2018 l 2017 Annual results
CONCLUSION
ALTEN Group is optimistic about the implementation of its three‐yeardevelopment strategy in all regions on account of:
Its technical skills to fulfill the challenges of clients; Its HR policies and its business plan; The professional maturity of its Technical Department and its workpackage
offer; Its delivery centers (offshore and nearshore); Its financial structure and its plans for external growth.
ALTEN will succeed in:
Maintaining an EBIT of around 10% despite wage pressures; Reach 60% of revenue outside France with more than 28,000
engineers at end 2019.
APPENDICES

February 21st 2018 l 2017 Annual results
BALANCE SHEET – ASSETS (IN THOUSANDS OF EUROS)
31
ITEM Dec. 2016 Dec. 2017
Goodwills 411 200 436 740Intangible assets 11 816 10 970Tangible assets 23 107 24 631Investments in associates 12 716 19 136Non-current financial assets 80 122 50 454Deferred tax assets 13 368 12 930
NON CURRENT ASSETS 552 329 554 860
Trade receivables 579 164 647 287Other current assets 43 680 50 514Current tax assets 58 809 81 686Cash and cash equivalents 94 986 83 966
CURRENT ASSETS 776 638 863 453
TOTAL ASSETS 1 328 967 1 418 313
Audit in progress

February 21st 2018 l 2017 Annual results
BALANCE SHEET - LIABILITIES (IN THOUSANDS OF EUROS)
Audit in progress 32
ITEM Dec.2016 Dec. 2017Capital 34 240 34 383Premiums 46 749 54 375Consolidated reserves 545 353 596 796Consolidated earnings 112 405 147 025
SHAREHOLDERS' EQUITY 738 747 832 580
MINORITY INTERESTS 374 1 653
Employee benefits 21 622 23 081Provisions 2 098 1 866Non-current financial liability 9 766 8 063Other non-current liabilities 18 418 12 537Deferred tax liabilities 1 091 83
NON CURRENT LIABILITIES 52 995 45 631
Provisions 11 263 9 572Current financial liabilities 80 971 49 283Trade payables 67 844 63 662Other current liabilities 372 451 409 241Current tax liabilities 4 322 6 694
CURRENT LIABILITIES 536 851 538 451
TOTAL LIABILITIES 1 328 967 1 418 313

February 21st 2018 l 2017 Annual results
INCOME STATEMENT (IN THOUSANDS OF EUROS)
33Audit in progress
ITEM 2016 2017NET REVENUE 1 748 306 1 975 427
Purchase consumed -164 940 -183 603Payroll expenses -1 214 756 -1 417 105External charges -159 029 -154 681Taxes other than on income -9 516 -10 578Depreciation and amortization -11 788 -13 031Other operating income and expenses -7 347 -2 190
OPERATING PROFIT ON ACTIVITY 180 930 194 240
Share based payments -9 004 -12 848
OPERATING PROFIT ON ACTIVITY BEFORE EXCEPTIONALS 171 925 181 392
Non recurrent profit -14 536 -3 456Capital loss on asset disposal 0 0Goodwill impairment test 0 -1 323
OPERATING PROFIT 157 389 176 613
Net borrowing costs -1 366 -847Other financial income and expenses 1 268 17 014
FINANCIAL INCOME -98 16 167
Share of earning of equity affiliates 5 310 5 735Income tax expense -49 854 -50 196
NET OVERALL EARNINGS 112 746 148 320
PROFIT ATTRIBUTABLE TO MINORITY INTERESTS -342 -1 295
PROFIT ATTRIBUTABLE TO THE GROUP 112 405 147 025

February 21st 2018 l 2017 Annual results
CASH FLOW STATEMENT (IN THOUSANDS OF EUROS)
34Audit in progress
ITEM 2016 2017CASH FLOW 185 660 204 186
Consolidated net earnings 112 746 148 320Earnings from associates -5 310 -5 735Depreciation, provisions and other calculated expenses 18 723 18 331Share-based payments 9 004 12 848Income tax expense 49 854 50 196Capital gains or losses from disposal 40 -21 141Net borrowings costs 1 366 847Financial cost on update and provisions -763 521
Tax paid -52 309 -52 331Change in working capital requirements -20 946 -60 521
NET CASH FLOW GENERATED BY ACTIVITY 112 405 91 335
Acquisition / Disposal on fixed assets 500 10 924Impact of change in scope of consolidation and earn-outs paid -86 611 -43 305
NET CASH FLOW ON INVESTMENTS -86 111 -32 380
Net financial interest paid -945 -321Dividends paid to shareholders -33 224 -33 233Capital increase 503 239Buy back of shares 201 -632Repayment of long-term financial debt -11 546 -1 607Change in current financial liabilities 22 577 -31 575
NET CASH FLOW FROM FINANCING OPERATIONS -22 433 -67 128
CHANGE IN CASH RELATED TO FOREIGN EXHANGE POSITION -794 -2 847
CHANGE IN CASH POSITION 3 068 -11 020
Cash on hand 94 986 83 966Bank loans -2 133 -10 919Overdrafts -88 275 -45 826
NET CASH POSITION 4 578 27 221

ALTEN2017 Annual results
Contact [email protected]
www.alten.fr/investisseurs
T : +33 (0)1.46.08.71.79
40 av. André Morizet92513 Boulogne-Billancourt Cedex


