Download - Aliakbar Mohammadyari

7/17/2019 Aliakbar Mohammadyari
http://slidepdf.com/reader/full/aliakbar-mohammadyari 1/8
Aliakbar Mohammadyari
Ch.5 Data and Process Modeling
Q. Describe data and process modeling concepts and tools
During the data and process modeling, a systems analyst develops
graphical models to show how the system transforms data into
useful information. Overall, these tools and modeling concepts
serve to make data and processes easier to visualize and
understand via diagrams (DFD), tables (Decision table), and charts
(decision trees). Data and process modeling involves three main
tools data !ow diagrams, a data dictionary, and process
descriptions. "ystems analysts use many graphical techni#ues to
describe an information system. $ data !ow diagram (DFD) uses
various symbols to show how the system transforms input data into
useful information.
Q. Explain the diferences between Gane and Sarson and
Yordon s!mbols. Pro"ide examples o# s!mbols that
represent processes$ data %ows$ data stores$ and entities.
Diference is the slight shape diferences between the symbols like
the rounding o the process symbol.
1

7/17/2019 Aliakbar Mohammadyari
http://slidepdf.com/reader/full/aliakbar-mohammadyari 2/8
Aliakbar Mohammadyari
Process %eceives input data and produces output that has a
di&erent content, form, or both
Data Flow $ path for data to move from one part of the
information system to another.Data Store 'sed in a DFD to represent a situation in which the
system must retain data.
External Entity $ person, department, outside organization, or
other information system that provides data to the system or
receives output from the system
Q. &hat is the diference between a context diagram and
diagram '( &hich s!mbol is not sed in a context diagram(
$ contet diagram describes a single big process whereas diagram
describes the small processes that are linked to a big single
process. *.g. if +% is a big process then its sub processes will be
number of sta& in each department, hiring process for each
department, payroll for each sta& member, benets for sta&
member, etc., that can also be further eploded into processes.
Data store symbols are not used in contet diagrams.
Q. )ow wold !o explode D*Ds(
DFD-s can be eploded by assigning one process as parent and
other as child processes. would eplode DFDs /oing down a level
and including more symbols and structures. *ploding Diagram 0
would reveal 0.0, 0.1, etc.
Q. Describe a data dictionar! and list the t!pes o#
in#ormation it contains.
2he data dictionary is a central storehouse of information about the
system3s data. t is used to collect, document and organize facts
2
7/17/2019 Aliakbar Mohammadyari
http://slidepdf.com/reader/full/aliakbar-mohammadyari 3/8
Aliakbar Mohammadyari
about the system. t is used to set up how data will be stored in
databases and what will be transferred from department to
department. $ll data elements, data !ows, data stores, processes,
entities, and records are documented in the data dictionary.
Q. )ow wold !o le"el D*Ds(
4ost general, lowest numbers and more specic5 higher numbers.
Q. )ow wold !o balance D*Ds(
*nsuring there are an e#ual amount of arrows going into and out of
every process as there was before.
Q. &hat is the prpose o# decision tables( )ow do !o
create them(
A decision table is a structured table o the combination o all the
conditions and outcomes that analysts can ace during a process. It
helps an analyst in keeping in consideration all the possible situation
that can occur during a process.
A decision table can be created by ollowing the ollowing steps:
1.Name the table by its process: Name o the process serves as a
heading and will come at the top.
.!nter the condition: "he conditions must be entered as one
condition per line and should come under the main process heading.
#.!nter the combination: a condition might have many
combinations. !nter all the combinations or each condition.
$.Accept or re%ect: &lace an ' in ront o each condition under each
rule (a rule is a numbered possibility in a column) to show the action
as re%ected or accepted.
3
7/17/2019 Aliakbar Mohammadyari
http://slidepdf.com/reader/full/aliakbar-mohammadyari 4/8
Aliakbar Mohammadyari
Q. &h! wold a manager pre#er a decision tree instead o# adecision table(
6ecause a decision tree is easier to visualize and includes more
detail.
Q. &hat is strctred English(
"tructured *nglish is a subset of "tandard *nglish that describes
logical processes clearly and accurately. 7ou must conform to the
following rules
0. 'se only three building blocks of se#uence, selection, and
iteration.
1. 'se indentation for readability,
8. 'se a limited vocabulary, including standard terms used in the
data dictionary and specic words that describe the processing
rules.
Case Stdies
.
4

7/17/2019 Aliakbar Mohammadyari
http://slidepdf.com/reader/full/aliakbar-mohammadyari 5/8
Aliakbar Mohammadyari
• +itchen Gadgets
• *itchen +adgets sells a line o high,-uality kitchen utensils andgadgets. hen customers place orders on the company/s ebsite or through electronic data interchange (!DI)0 the systemchecks to see i the items are in stock0 issues a status message
to the customer0 and generates a shipping order to thewarehouse0 which lls the order. hen the order is shipped0 thecustomer is billed. "he system also produces various reports.
•
● ,as-s
• ist #or elements sed in D*Ds$ draw the s!mbols$ andexplain how the! are sed.
• 2he four elements are eternal entity (the original source ofdata or the receiver of information), process (a series of steps
that manipulate data), data store (place to keep data for lateruse), and data !ow (describes the data and the informationelements passing between eternal entities, processes, anddata stores).
● Draw a context diagram #or the order s!stem.
5
7/17/2019 Aliakbar Mohammadyari
http://slidepdf.com/reader/full/aliakbar-mohammadyari 6/8
Aliakbar Mohammadyari
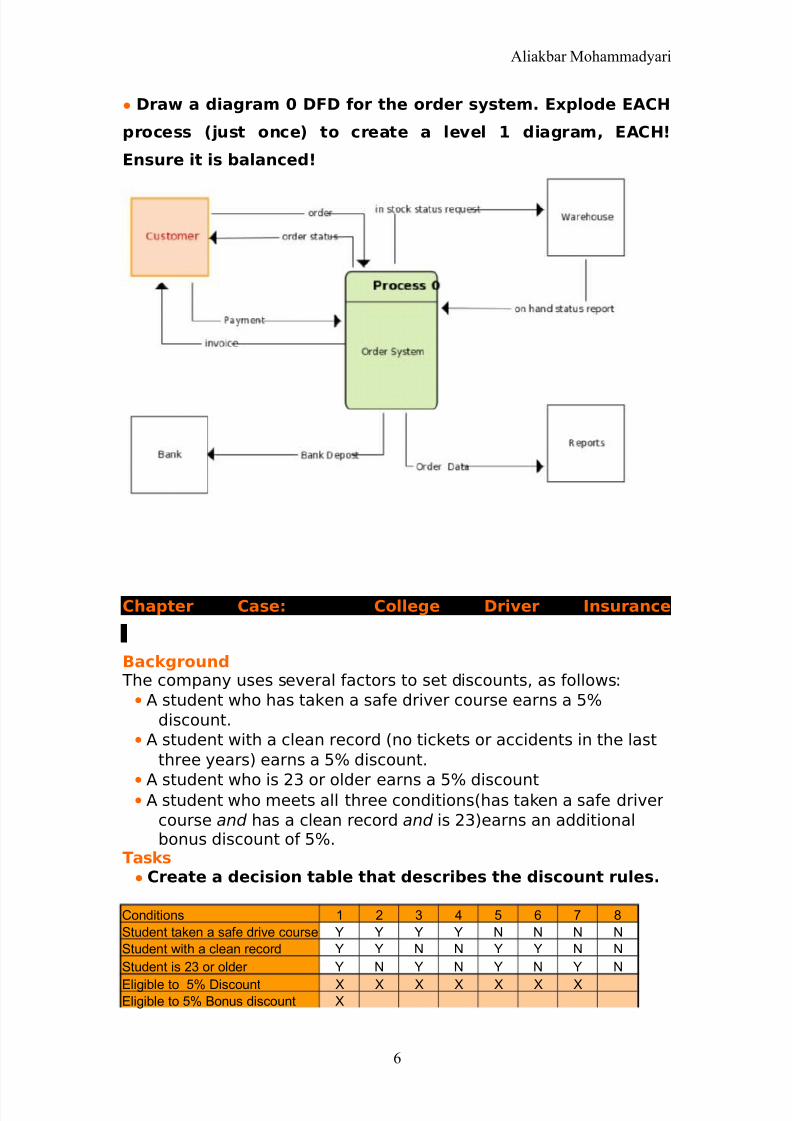
● Draw a diagram ' D*D #or the order s!stem. Explode E/C)
process 01st once2 to create a le"el 3 diagram$ E/C)4
Ensre it is balanced4
Chapter Case College Dri"er 6nsrance
.
7ac-grond "he company uses several actors to set discounts0 as ollows:
• A student who has taken a sae driver course earns a 23
discount.
• A student with a clean record (no tickets or accidents in the last
three years) earns a 23 discount.
•
A student who is # or older earns a 23 discount• A student who meets all three conditions(has taken a sae driver
course and has a clean record and is #)earns an additionalbonus discount o 23.
,as-s● Create a decision table that describes the discont rles.
Conditions 1 2 3 4 5 6 7 8
Student taken a safe drive course Y Y Y Y N N N N
Student with a clean record Y Y N N Y Y N N
Student is 23 or older Y N Y N Y N Y N
Elii!le to 5" #iscount $ $ $ $ $ $ $Elii!le to 5" %onus discount $
6

7/17/2019 Aliakbar Mohammadyari
http://slidepdf.com/reader/full/aliakbar-mohammadyari 7/8
Aliakbar Mohammadyari
&nelii!e to discount $
● Simpli#! the table !o 1st created. Describe the reslts.
Conditions 1 2 3 4 5 6
Student taken a safe drive course Y Y Y N N NStudent with a clean record Y Y N Y N N
Student is 23 or older Y N ' ' Y N
Elii!le to 5" #iscount $ $ $ $ $
Elii!le to 5" %onus discount $
&nelii!e to discount $
● Draw a simpli8ed decision tree that shows the discontrles.
Q. &hat are the pros and cons o# sing a decision table"erss a decision tree(
9hether to use a decision table or a decision tree often is a matterof personal preference. $ decision table might be a better way tohandle comple combination of conditions. On the other hand, a
decision tree is an e&ective way to describe a relatively.
7

7/17/2019 Aliakbar Mohammadyari
http://slidepdf.com/reader/full/aliakbar-mohammadyari 8/8
Aliakbar Mohammadyari
9e#erences
1, 4ystems Analysis and Design , 5th edition0 Alan Dennis
, 4ystems Analysis and Design 6ethods0 7efrey hitten0 8onnie
9entley
8


