Albedo Enhancement of Marine Clouds to Counteract Global Warming:
Impacts on the Hydrological Cycle
G. Bala1*, Ken Caldeira2, Rama Nemani3, Long Cao2, George Ban-Weiss2, and Ho-Jeong
Shin2
1Divecha Center for Climate Change, Indian Institute of Science, Bangalore – 560 012, India
*Center for Atmospheric and Oceanic Sciences, Indian Institute of Science, Bangalore – 560
012, India
2Department of Global Ecology, Carnegie Institution, 260 Panama Street, Stanford, CA
94305, USA
3NASA Ames Research Center, Moffett Field, CA 94035, USA
(Revised for Climate Dynamics 26 May 2010)
Abstract
Recent studies have shown that changes in solar radiation affect the hydrological
cycle more strongly than equivalent CO2 changes for the same change in global mean surface
temperature. Thus, Solar Radiation Management (SRM) "geoengineering" proposals to
completely offset global mean temperature increases by reducing the amount of absorbed
sunlight might be expected to slow the global water cycle and reduce runoff over land.
However, proposed countering of global warming by increasing the albedo of marine clouds
would reduce surface solar radiation only over the oceans. Here, for an idealized scenario, we
analyze the response of temperature and the hydrological cycle to increased reflection by
clouds over the ocean using an atmospheric general circulation model coupled to a mixed
layer ocean model. When cloud droplets are reduced in size over all oceans uniformly to
offset the temperature increase from a doubling of atmospheric CO2, the global-mean
precipitation and evaporation decreases by about 1.3% but runoff over land increases by
7.5% primarily due to increases over tropical land. In the model, more reflective marine
clouds cool the atmospheric column over ocean. The result is a sinking motion over oceans
and upward motion over land. We attribute the increased runoff over land to this increased
upward motion over land when marine clouds are made more reflective. Our results suggest
that, in contrast to other proposals to increase planetary albedo, offsetting mean global
warming by reducing marine cloud droplet size does not necessarily lead to a drying, on
average, of the continents. However, we note that the changes in precipitation, evaporation
and P-E are dominated by small but significant areas, and given the highly idealized nature of
this study, a more thorough and broader assessment would be required for proposals of
altering marine cloud properties on a large scale.
1. Introduction
Enhancing the albedo of marine stratocumulus clouds via increasing cloud
condensation nuclei (CCN) has been proposed as a “Solar Radiation Management (SRM)”
geoengineering scheme to counteract global warming (Bower et al. 2006; Latham 1990;
Latham 2002; Latham et al. 2008). It has been suggested that CCN can be increased by
spraying a fine seawater mist into the remote marine atmospheric boundary layer (Latham
1990). More CCN will increase the number of cloud droplets while reducing the droplet size
and hence increase the total droplet surface area of the clouds and cloud albedo (Twomey
1977). This scheme differs from other SRM schemes (Angel 2006; Bala 2009; Crutzen 2006;
Early 1989; NAS 1992 1992; Seifritz 1989; Teller et al. 1997) in that the reduction in solar
radiation is applied nearly exclusively over the oceans rather than nearly uniformly over both
land and oceans.
In a recent study (Bala et al. 2008), it was shown that the ratio of changes in rainfall to
changes in temperature is greater when caused by variations in solar radiation than when they
are caused by variations in CO2 levels. This occurs, in part, because changes in solar radiation
directly affect the amount of energy at the surface available to drive evaporation.
Furthermore, absorbed solar radiation tends to heat the atmosphere from below, decreasing
vertical stability, and promoting precipitation. In contrast, CO2 absorption of longwave
radiation reaches a maximum in the upper troposphere, where it cannot directly drive
evaporation, and can contribute to increased vertical stability and suppress precipitation.
Therefore, changes in rainfall are more sensitive to variations in solar radiation than to
equivalent changes in CO2 levels (Andrews et al. 2009; Bala et al. 2009). Because of this
differing hydrological sensitivity to solar and CO2 forcing it has been suggested that
insolation reductions sufficient to offset the entirety of global-scale temperature increases
would lead to a decrease in global mean precipitation and decrease in runoff over land (Bala
et al. 2008; Trenberth and Dai 2007).
Past climate modelling studies of SRM schemes (Govindasamy and Caldeira 2000;
Govindasamy et al. 2003; Govindasamy et al. 2002; Lunt et al. 2008; Matthews and Caldeira
2007; Rasch et al. 2008; Robock et al. 2008; Tilmes et al. 2009) have represented
geoengineering approaches that do not fundamentally distinguish between land and ocean,
such as placing reflecting materials at the L1 Lagrange point between the sun and earth (the
point where the gravitational forces of earth and sun cancel each other), and injecting
sulphate aerosols into the stratosphere.
Persistent marine stratus clouds off the west coasts of the continents such as South
America, North America and Africa would be likely targets for a cloud seeding program to
modify climate. Recent climate modelling of such selective seeding (Jones et al. 2009) has
shown that 35% of the radiative forcing due to current levels of greenhouse gases could be
offset by stratocumulus modification. Transient coupled model simulations in the same study
suggest that geoengineering of the three aforementioned stratocumulus areas could delay the
simulated global warming by about 25 years. These simulations also indicate that, while
some areas experience increases in precipitation and net primary productivity, sharp
decreases are simulated in South America, with particularly detrimental impacts on the
Amazon rain forest. This study concludes that while some areas benefit from geoengineering,
there are significant areas where the response could be detrimental with implications for the
practical applicability of such a scheme.
Reflecting more sunlight from clouds over the ocean can affect precipitation in at
least two important ways: (1) Less sunlight would reach the ocean surface, and hence less
energy would be available to evaporate seawater. Therefore, the water vapour content over
oceans and its advection to land would tend to decline. (2) Since the oceans would be cooled
relative to the continents, there would be a tendency to favor flows of moist air from ocean to
land, increasing precipitation on land. Thus, it is not obvious if the slowdown of the global
hydrological cycle (Bala et al. 2008), especially as seen on land will occur for SRM schemes
that increase the albedo of marine clouds. In this study, we attempt to estimate the effect of
these two mechanisms using a general circulation model that has explicit representation of
cloud microphysics and its effects on the radiative budget of the planet.
The main goal of this study is to improve our understanding of the basic mechanisms
by which decreasing droplet size in marine clouds affects the climate system. We address this
issue by performing idealized simulations in which cloud droplet size is reduced for all
clouds above all oceans around the globe. We focus on conceptual understanding of the
fundamental properties of the climate system when negative solar forcing is applied over the
ocean areas alone to counter global warming. In particular, we seek to understand changes in
land hydrology. The climate model description is given in section 2 and the simulations are
discussed in section 3. Results are presented in section 4 and section 5 has concluding
discussions.
2. The Model
The atmosphere model used here, CAM3.5 (Collins et al. 2006), has a horizontal
resolution of 1.9° latitude by 2.5° longitude and 26 layers in the vertical dimension. We use
the Finite Volume (FV) dynamical core configuration for atmospheric transport. To allow for
interactions between the atmosphere and ocean, the model is coupled to a simple slab-
ocean/thermodynamic sea-ice model. For the standard configuration of the model, the
effective cloud droplet size over land and ocean is 8 and 14 μm, respectively. The droplet
size over sea ice is the same as over the ocean surface. For the slab ocean, the mixed layer
depths were prescribed to climatological values, and the ocean heat transport was prescribed
as derived from the net energy flux over the ocean surface in a climatological simulation
performed with prescribed sea surface temperature. The atmosphere model is coupled with a
land surface model, CLM3.5 (Oleson et al. 2008), which represents the land surface by
sixteen different plant functional types (PFT) and simulates a number of biophysical
processes for each PFT, such as stomatal physiology and photosynthesis, interactions of
energy and water fluxes with vegetation canopy and soil, and the surface hydrology.
3. Simulations
We perform three 70-year simulations using the coupled CAM3.5/CLM3.5 model: (1)
a control “1xCO2” simulation with an atmospheric CO2 concentration of 400 ppm meant to
approximately represent the present-day atmospheric CO2 concentration; (2) a “2xCO2”
simulation in which CO2 concentration is doubled to 800 ppm; (3) a geoengineering
simulation “2xCO2+CCN” in which CO2 concentration is doubled to 800 ppm and the
effective radius of the cloud droplets over the ocean is reduced from 14 μm to11.5 μm. No
changes were made to the effective droplet size for ice clouds. For the 2xCO2+CCN
experiment, we alter the effective radius of cloud liquid water droplets over ocean areas in the
microphysics package of the model since the shortwave optical properties of clouds depend
on the effective radius of the cloud droplets.
Besides the climate change caused by longwave radiative effects of CO2, there is
possible impacts of the physiological effect of CO2 on plant stomatal conductance called ‘the
CO2 physiological forcing' which can result in land surface climate change. For example,
there are many studies that discuss the possible impacts of CO2 physiological forcing on land
surface warming and runoff (Betts et al. 2007; Boucher et al. 2009; Cao et al. 2009;
Doutriaux-Boucher et al. 2009; Gedney et al. 2006). To restrict our investigation to radiative
effects, we have turned off the CO2 physiological effect by prescribing the same CO2
concentration (400 ppmv) to the land model in all our experiments.
The choice of 11.5 μm for 2xCO2+CCN is based on results from a series of
simulations in which the droplet radius for marine clouds was reduced to 12, 11.5, 11, and 10
µm. The case with 11.5 µm, designated 2xCO2+CCN, has the least departure in global mean
surface temperature from the control case (Table 1): this is the simulation analyzed in this
paper. There is a residual warming of 0.4 K over land, and the mean-ocean surface
temperature decreases by 0.1 K in this case (Table 1). We found that the experiment with 12
µm, designated 2xCO2+CCN12, had the least departure in global-mean precipitation relative
to the control case but it had a global-mean warming of 0.6 K (Table 1). The global-mean
temperature change is nearly mitigated in 2xCO2+CCN but global-mean precipitation is
decreased relative to the control. In the 2xCO2+CCN12 case, precipitation change is nearly
mitigated but global-mean temperature is increased relative to the control. This is in
agreement with our earlier finding that an alternation in solar forcing might offset
temperature changes or hydrological changes from equivalent greenhouse gas changes, but
could not perfectly cancel both at once (Bala et al. 2008). Changes in 2xCO2+CCN12,
relative to 1xCO2, differ from the corresponding changes in 2xCO2+CCN for other variables
as well and mostly scale with the global-mean surface temperature change of 0.6 K in the
2xCO2+CCN12.
We find no statistically significant trend in model results after 30 years of simulated
time, and therefore we have used the last 40 years (out of 70 years) of each simulation for
equilibrium climate change analysis. The last 40 years of global- and annual-mean surface
temperature of the control simulation have a standard deviation of 0.2 K and a drift of only -
5.8 x 10⁻⁶ K per year.
4. Results
Here, we adopt the following approach in discussing our results. First, in each of
following sub section, we briefly describe changes resulting from a doubling of atmospheric
CO2 content (i.e., results for 2xCO2 minus results for 1xCO2). Next, we describe changes
resulting from a decrease of cloud droplet size over the oceans (i.e., 2xCO2+CCN minus
2xCO2). Lastly, we examine the net effect of increased CO2 with smaller marine cloud
droplets (i.e., 2xCO2+CCN minus 1xCO2).
4.1 Radiative forcing
First, it is useful to compare the radiative forcing from doubling of CO2 to that due to
the reduction in marine cloud droplet size over the oceans. Hence, we repeated the three
experiments (1xCO2, 2xCO2 and 2xCO2+CCN) discussed in the previous section but with
prescribed climatological sea surface temperatures (SST) for 40-year periods in order to make
an estimate of the “adjusted” radiative forcing using Hansen’s “fixed-SST method” (Hansen
et al. 2005). In this method, the radiative forcing is estimated as the change in the net
radiative fluxes at the top of the atmosphere after the stratosphere, troposphere and land
surface are allowed to adjust. Adjusted radiative forcing can be also estimated from the slab-
ocean simulations by performing a regression of changes in the top of the atmosphere net
radiative flux with surface temperature change (Gregory et al. 2004). We use Hansen’s
method here because the spatial pattern of forcing is directly available in this method while
an ensemble of simulations is needed to obtain a reliable estimate of the forcing using the
regression method. A comparison of these methods is available in the literature (Bala et al.
2009; Gregory and Webb 2008; Hansen et al. 2005).
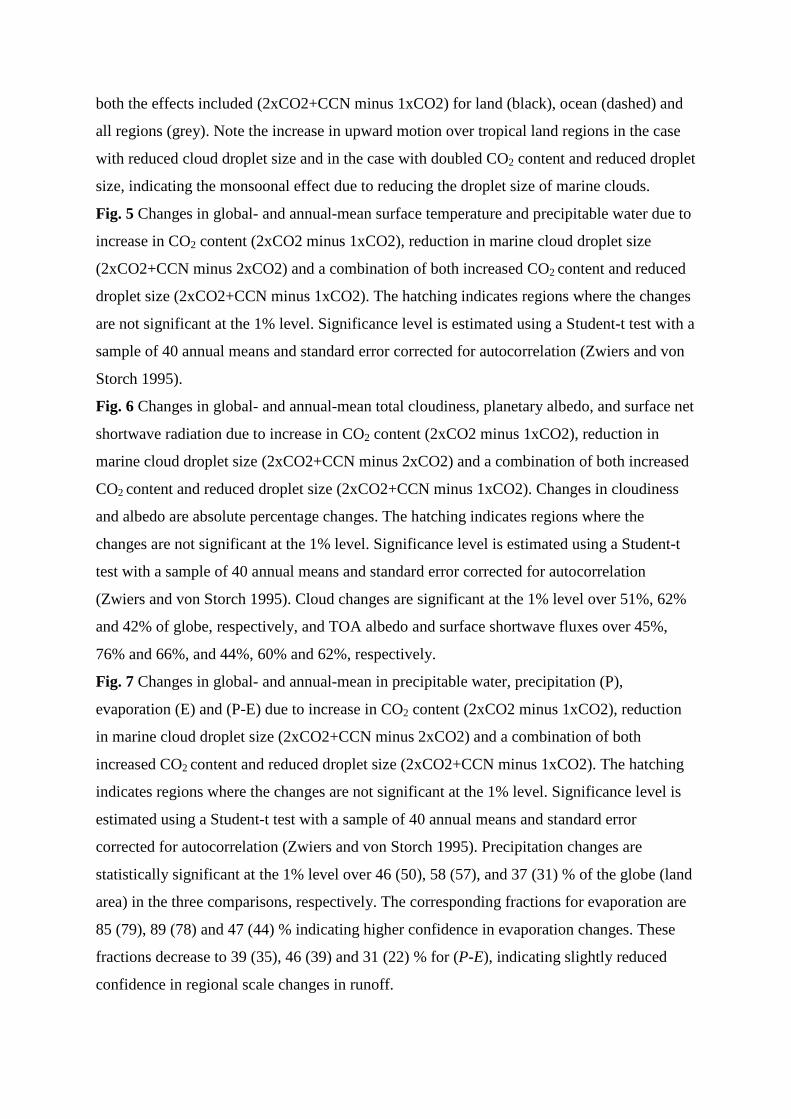
The radiative forcing is spatially nearly uniform when CO2 is doubled and is
statistically significant at the 1 % level around the globe (Fig. 1, top panel). The global, land,
and ocean mean forcings are 3.56 ±0.04, 3.42±0.08, and 3.62±0.04 Wm-2, respectively (Table
2). The climate sensitivity in this case is 1.46 Wm-2/K. The forcing is mostly confined to the
oceans when marine cloud droplet size is decreased (Fig.1, middle panel); in this case, the
global, land, and ocean mean values are -3.20±0.04, -0.89±0.07, and -4.16±0.04 Wm-2,
respectively. There is radiative forcing over land in this case even though forcing was applied
only over the oceans because both the troposphere and land surface have been allowed to
adjust. The spatial pattern (Fig. 1) shows that the forcing is large and significant over the
oceans but small and mostly not significant over land. The climate sensitivity in this case is
1.34 Wm-2/K which is only about 10 % lower than in the case when CO2 is doubled. This
suggests that climate sensitivity is roughly constant and the radiative forcing concept is
capable of predicting the global mean temperature change, at least for the two types of
forcings studied here (Forster et al. 2000; Hansen et al. 1997; Hansen et al. 2005)
When the forcings are combined, there is residual positive forcing over land and
negative forcing over the oceans (Fig.1, bottom panel) because the forcings due to doubling
of CO2 and the reduction of marine cloud droplet size sum up to produce the combined
forcing. The global, land, and ocean mean forcings simulated in the combined case is
0.35±0.04, 2.52±0.08 and -0.54±0.04 Wm-2, respectively (Table 2) while a summation of
forcings from doubling CO2 and reduction of marine cloud droplet size would give
0.36±0.06, 2.53±0.10, -0.54±0.06 Wm-2, respectively. The large non-zero land mean forcing
in the combined case mainly arises from the non uniform (ocean versus land) application of
forcing in 2xCO2+CCN. The spatial pattern of forcing (Fig. 1) shows that the forcing over
oceans in this case is small and not significant over most places at the 1% significance level.
4.2 Global mean changes
Results for a doubling of atmospheric CO2 are typical of other climate models (IPCC
2007). For a doubling of atmospheric CO2 from 400 ppm to 800 ppm, the model yields a
global mean warming of 2.44±0.03 K, with a 2.90±0.04 K warming over land and 2.26±0.03
K over ocean (Table 1). The ratio of land to sea warming is 1.28, which is comparable to the
results obtained in an intercomparision of IPCC AR4 models which, for a doubling of CO2,
showed a range of 1.18-1.58 for slab-ocean equilibrium simulations (Sutton et al. 2007). The
enhanced warming over land is not simply a transient effect: it is also present in equilibrium
conditions (Andrews et al. 2009; Sutton et al. 2007). Previous studies have attributed the
land/sea contrast in warming to differing lapse rates over land and oceans, the nonlinear
increase of water vapor with temperature (Joshi et al. 2008), and a reduction in boundary
layer relative humidity over land triggered by the CO2-physiological effect and associated
cloud feedbacks (Doutriaux-Boucher et al. 2009). The turning-off of the CO2-physiological
effect in our experiments is a possible cause for the lower ratio of land/sea warming contrast
in this study; Table S1 suggests that low-level relative humidity over land actually increases
when climate warms in this model.
Primarily because of increases in absolute humidity with warmer temperatures, global
precipitation increases 5.03±0.08% (5.84±0.30% over land and 4.75±0.12% over ocean).
There is a decrease in mean large scale upward motion over tropical land regions: however,
increases in precipitation over land could be due to increases in atmospheric water vapor
content over land (Table 1). In steady state, runoff from land to ocean is equal to the net
atmospheric water vapour transport from ocean to land and is also equal to precipitation
minus evaporation over land. Runoff from land to ocean increases by 5.8±0.9% relative to
1xCO2. The global-mean precipitation increases 2.0 % per degree global-mean warming.
Decreasing the size of droplets in marine clouds from 14 to 11.5 µm causes the
modeled 2xCO2+CCN climate to cool by 2.39±0.03 K, with a 2.53±0.04 K cooling over land
and 2.33±0.03 K cooling over ocean relative to 2xCO2 (Table 1). A previous idealized
modelling study (Forster et al. 2000) found a similar result: larger response over land than
over the oceans even though radiative forcing is applied only over the oceans. However, the
ratio of land to sea temperature change is reduced in this case to 1.09 largely because the
droplet size is reduced only for marine clouds (i.e. the negative radiative forcing is applied
only over the oceans). It may be counterintuitive that reflecting more sunlight over the ocean
cools the land more than the ocean, but this occurs, as stated earlier, because of differing
lapse rates over oceans and land and the nonlinear dependence of water vapor on temperature
(Joshi and Gregory 2008; Joshi et al. 2008); on average, the atmosphere over the ocean has a
moist adiabatic lapse rate in the vertical but over the land has a lapse rate that is between a
dry and moist adiabatic lapse rates. Because of these differing lapse rates, we notice a larger
temperature response in upper levels over the oceans than over land (Fig. 2); the lapse rate
change is larger for the atmosphere over oceans.
Decreasing droplet size also causes the global precipitation to decrease by 6.01±0.07
% which is a 2.6% decrease in precipitation per degree cooling. In this model, global-mean
precipitation changes are about 30% more sensitive to solar forcing than to an equivalent CO2
forcing (Andrews et al. 2009; Bala et al. 2009; Bala et al. 2008).
In the 2xCO2+CCN simulation, relative to the 2xCO2 case, albedo of clouds is
enhanced only over ocean areas. The resulting spatial contrast in radiative forcing (Fig. 1)
leads to a “monsoonal” circulation with descending motion over the oceans and ascending
motion over land (Table 1 and Fig. 3 and 4). Because we increase cloud albedo over the
ocean, the vertically integrated air mass over the ocean cools more than the air mass over
land. The resulting density change causes an increase in net transport of air from land to
ocean at pressures less than about 400 mb and an increase in net transport of air from ocean
to land below this level, with an increase in net upward flow of air over land at around 400
mb and an increase in net downward flow of air over the oceans at this pressure level (Fig. 3).
This monsoonal flow tends to increase water vapor transport from ocean to land. Further
discussion of this monsoonal circulation is provided in the section 4.4. Land surface
temperatures cool more than ocean surface temperatures (even when forced by changing sea
surface temperatures) despite the vertically integrated air mass over ocean cooling more than
the vertically integrated air mass over land. This behaviour occurs because moist oceanic
adiabats steepen more than drier land adiabats in response to cooling (Joshi et al. 2008).
Evaporation over land decreases (Table 1), but the magnitude of the reduction in
precipitation over land is smaller due to the strengthened monsoonal circulation and hence
there is more runoff. Precipitation decreases by 7.29±0.08 % over oceans and by only
2.19±0.23 % over land (Table 1). These contrasts in precipitation responses are associated
with the mean sinking motion over the oceans and rising motion over land (Table 1 and Fig. 3
and 4); we attribute the smaller decrease in precipitation over land to the upward air motion
over land. The precipitation decrease on land is only 0.9% per degree cooling. Evaporation
over ocean decreases by 6.41±0.06 and by 4.05±0.19% over land because of a cooler climate:
the larger decrease over oceans is the result of enhancing the cloud albedo only over the
oceans (Fig.1). Runoff over land does not decrease (as would be the case if cloud seeding was
the exact opposite of doubling CO2) but instead increases by 1.6%. This increase in runoff
over land with smaller marine cloud droplets indicates that implementation of the Latham
(1990) proposal might tend to lead to a moistening, on average, of soils.
For the combined effects of increased CO2 content and decreased marine cloud
droplet size (i.e., the 2xCO2+CCN simulation relative to the 1xCO2 simulation), there is a
residual warming of 0.37±0.03 K over land and a decrease in mean-ocean surface
temperature of 0.07±0.03 K relative to the 1xCO2 case (Table 1).The global-mean
precipitation is decreased by 1.28±0.08%, which is consistent with conclusions based on
studies involving globally reduced absorption of sunlight (Bala et al. 2008): for a specified
amount of temperature change or radiative forcing, one should expect to see a greater impact
on the hydrological cycle from changes in sunlight than for changes in atmospheric CO2
content (Andrews et al. 2009; Bala et al. 2008). This difference is a fundamental property of
the climate system. The precipitation decrease in the 2xCO2+CCN (relative to 1xCO2) is
mainly over the oceans (-2.89±0.11%): over land, mean precipitation increases by
3.52±0.33%. These contrasts in precipitation responses are associated with the mean sinking
motion over the oceans and rising motion over land (Table 1 and Fig. 3 and 4). The increase
in land precipitation is in contrast to decreases observed for geoengineering simulations with
a uniform reduction in sunlight over both land and oceans (Bala et al. 2008).
Overall runoff from land, equivalent in steady state to precipitation minus
evaporation, increases over land by 7.52±0.87% (Table 1), which implies that increasing
albedo of marine clouds may produce an increase in runoff over land. A corresponding
decrease in precipitation minus evaporation is observed over ocean areas where changes in
evaporation exceed changes in precipitation. In summary, we find that enhancing the albedo
of marine clouds decreases evaporation more than precipitation over the ocean and increases
precipitation more than evaporation over the land. This increase in runoff over land is
attributed to enhanced upward motion over land and should be contrasted with previous
modelling studies in which decreases in solar insolation resulted in a decrease in runoff (Bala
et al. 2008).
Changes in net shortwave fluxes at the surface are less than 1 Wm-2 when atmospheric
CO2 content is doubled (Table S1). However, a decrease in the size of droplets in marine
clouds from 14 to 11.5 µm (2xCO2+CCN minus 2xCO2) leads to a decrease in surface net
shortwave fluxes by 3.67±0.07 Wm-2 over the ocean area, and by 2.71±0.05 Wm-2 in the
global-mean. Changes in cloud fraction are not the primary cause for these large changes in
shortwave fluxes (Table S1): cloud fraction changes are less than 1 % and the magnitude of
changes is very similar to that in the 2xCO2 case, which does not show large changes in
shortwave fluxes. It is the change in cloud albedo via the decreased cloud droplet radius that
leads to a large drop in the shortwave fluxes.
In the case where atmospheric CO2 content is increased and marine cloud droplet size
is decreased (i.e., 2xCO2+CCN minus 1xCO2 simulation), changes in the top of the
atmosphere (TOA) net shortwave fluxes are similar and are almost identical to changes in
shortwave cloud forcing (Table S1): changes in the global-mean TOA shortwave fluxes are
nearly exclusively the result of changes in cloudy regions; TOA shortwave fluxes in clear-sky
regions are nearly unchanged. The decreases in TOA net shortwave fluxes of 3.44±0.05 and
4.39±0.08 Wm-2 for the global and ocean averages are associated with planetary albedo
increases of 1.02±0.02 and 1. 29±0.03 %, respectively (Table S1). A smaller increase in TOA
albedo (0.35±0.03) is associated with increased cloudiness over land (Table S1), probably due
to increased water vapour transport from ocean areas to land. The large decrease in TOA
longwave fluxes of 3.4 Wm-2 in the 2xCO2+CCN case relative to the 1xCO2 case is
necessary for net TOA energy balance and is approximately indicative of the longwave
radiative forcing in the 2xCO2 case (Table S1, and 2); 2xCO2+CCN, to a good
approximation, is a case with two radiative forcings (increased longwave fluxes into the
climate system due to doubled CO2 and reduced shortwave fluxes due to albedo enhancement
of clouds) balancing each other with no temperature change relative to the control case.
4.3 Spatial pattern of changes
Surface temperature change for a doubling of atmospheric CO2 is significant at the
1% level over all grid points over the globe (Fig. 5). The changes are larger over land and
high-latitude regions, in agreement with the published literature (IPCC 2007). Cooling of
similar magnitude at the same significance level is simulated when the cloud droplet size is
reduced (2xCO2+CCN minus 2xCO2). Precipitable water changes are significant at the 1 %
level for every vertical grid column in the model in both cases. We found that the water
vapour changes approximately follow the Clausius-Clayperon relationship (~7% change per
degree change in temperature) (Allen and Ingram 2002; Held and Soden 2006); the pattern of
precipitable water changes follows the temperature change pattern. Although significant over
51% and 54% of the globe, changes in temperature and precipitable water are much smaller
in the case with both increased CO2 content and reduced droplet size (2xCO2+CCN minus
1xCO2), suggesting substantial mitigation of CO2-induced climate change in terms of
temperature and atmospheric water vapor content.
For the doubled CO2 case, vertically integrated total cloud fraction increases in the
polar region and in the tropics, and decreases in mid latitudes and subtropics (Fig. 6). Similar
patterns with comparable magnitude but opposite sign are simulated for the case with reduced
cloud droplet size suggesting that cloud changes in the later case result mainly from climate
changes rather than as a direct cause of the decrease in cloud droplet size. TOA albedo, an
indicator for the magnitude of reflected sunlight from the atmospheric column shows a large
decrease in the polar region in the 2xCO2 case because of decreased sea ice cover (Table 1).
Cloud fraction increases in this region (Fig. 6) and hence it is unlikely to be the cause for
albedo decrease. TOA albedo increases in tropical regions where the cloudiness has
increased. Because the albedo of marine clouds are enhanced when droplet size is reduced,
magnitudes of the TOA albedo changes are much larger when marine cloud droplet size is
reduced (2xCO2+CCN minus 2xCO2) than when atmospheric CO2 is doubled; the increase is
as high as 5% in the eastern tropical pacific when marine cloud droplet size is reduced. The
correlation between changes in TOA albedo and surface net shortwave fluxes for the doubled
CO2 case and the case with reduced droplet size are 0.95 and 0.92, respectively.
The spatial pattern of hydrological changes is shown in Fig. 7. When atmospheric
CO2 content is doubled, precipitation increases in the tropics and high latitudes, and
decreases in the subtropics; in the zonal mean, wet places get wetter and dry regions get drier
(Held and Soden 2006). Evaporation changes do not mirror changes in precipitation (Held
and Soden 2006) and increases in evaporation occur almost everywhere when atmospheric
CO2 is doubled . For the case with reduced droplet size for marine clouds (2xCO2+CCN
minus 2xCO2), the pattern of precipitation and evaporation changes is similar to the doubled
CO2 case but with opposite sign; this indicates that reducing marine cloud droplet size may
tend to cause wet regions to become drier and dry regions to become wetter. As a result of
reducing cloud droplet size, evaporation decreases almost everywhere.
The pattern of precipitation minus evaporation changes resembles the changes in
precipitation (Held and Soden 2006) in both the doubled CO2 case and the case with reduced
droplet size. Runoff increases over most of the land areas in the doubled CO2 case and
decreases in the case with reduced droplet size. However, note that mean runoff over land
increases in the later case (Table 1) largely because of the large runoff increases in the
tropics. Zonal-mean vertical velocity shows increases in upward motion over tropical land
(Fig. 4) in association with the increase in runoff. There is some suggestion of regional
negative P-E when marine cloud droplet size is reduced: significant drying over Southern
Europe and southern Amazonia is simulated. When both the effects are combined
(2xCO2+CCN minus 1xCO2), there is decline in P and E over ocean and increase over land
(Table 1), and (P-E) over tropical land areas is increased. It should be noted the changes in
precipitation, evaporation and P-E are dominated by small but significant areas (Fig. 7). This
is especially true for P-E over land with significance at 1% level obtained for only 35, 39 and
22 % of the land area for doubling of CO2, reduction in marine cloud droplet size and for the
combined effects, respectively.
Except for changes in surface temperature and precipitable water, changes for total
clouds, TOA albedo, net surface solar fluxes precipitation, evaporation and precipitation
minus evaporation are large (Figs. 5, 6 and 7) for the combined effects of increased CO2
content and decreased marine cloud droplet size (i.e., the 2xCO2+CCN simulation relative to
the 1xCO2 simulation). This suggests that the residual regional changes are small only for
surface temperature and water vapor; large regional changes in hydrology (precipitation,
evaporation and runoff) are simulated. It should be noted that both precipitation and runoff
show increases over land, particularly over India, Central America, Amazon and Sahel, in
association with increased upward motion over tropical land (Fig. 4), suggesting that
continents might not, on a mean basis, dry as a consequence of offsetting global warming by
reducing marine cloud droplet size.
The zonal-mean changes in annual-mean surface temperature illustrate that most of
the change in this field resulting from an increase in CO2 are offset in the model by a decrease
in marine cloud droplet size (Fig. 8): relative to 1xCO2, changes in the 2xCO2+CCN case are
much smaller than that in the 2xCO2 case. However, large residual changes can be seen for
the hydrological variables such as precipitation, evaporation and runoff for the combined
effects of increased atmospheric CO2 content and decreased marine cloud droplet size
(2xCO2+CCN minus 1xCO2). Of particular interest here is the large increase in precipitation
over tropical and southern hemisphere subtropical land areas in association with increased
upward motion over land (Fig. 3 and 4) while precipitation decreases over tropical oceans in
this case. Evaporation also increases over these land regions but the magnitude of increases
is smaller than precipitation. Hence, the runoff over land increases in the case with doubled
CO2 content and reduced marine cloud droplet size, and P-E decreases over oceans. Runoff
increase over land and P-E (or freshwater flux) decrease over ocean occur simultaneously to
close the land-sea water cycle.
4.4 Discussion on the vertical motion
When the marine cloud droplet radius is reduced, there is a reduction in solar radiative
forcing over the oceans. After equilibrium climate change, we find that the net surface energy
flux is nearly zero over both land and oceans (Table S1). This is expected because the climate
system is in equilibrium, and hence land and ocean surfaces should have zero net surface
flux. However, the top of atmosphere (TOA) net energy flux increases by 3.54 Wm-2 over
land and decreases by 1.60 Wm-2 over oceans when the marine cloud droplet radius is
reduced (2xCO2+CCN minus 2xCO2). This is primarily driven by applying a negative
forcing only over oceans and is enhanced by climate feedbacks. This implies that there is a
tendency for warming the atmospheric column over land and cooling over oceans. For
equilibrium climate change, these temperature tendencies should be countered by sensible
and latent heat transports from land to oceans and an associated secondary circulation that
provides a net adiabatic cooling through upward motion over land and adiabatic warming
through subsidence over oceans.
The upward motion can be diagnosed from the first law of thermodynamics (Holton
1992) which is given by
QzTwTV
tT
dHH +Γ+∂∂
−∇−=∂∂ )(.
------------- (1)
where the first term on the right represents the horizontal advection of temperature, w is the
vertical velocity, VH is the horizontal wind velocity, Γd is the dry adiabatic lapse rate, (∂T/∂z)
is the environmental lapse rate, and Q is the diabatic heating rate. For equilibrium conditions,
the left side of (1) vanishes. An upper bound on the vertical motion can be obtained by
applying (1) to a column of atmosphere averaged over land or oceans and omitting the
horizontal advection:
QzTw d =Γ+∂∂ )( -------------------------------- (2)
Let us estimate the average vertical velocity over land when the marine cloud droplet
radius is reduced (2xCO2+CCN minus 2xCO2). For illustrative purposes, we use ∂T/∂z = -
7.5x10⁻³ Km-1 over land, and Γd ~ 1.0x10⁻⁴ Km-1 (Holton 1992). We have used an
environmental lapse rate over land that is between a dry and moist adiabat. The change in
diabatic heating rate in the atmosphere is the change in net TOA energy flux since the change
in surface net flux is nearly zero: Q = 3.5 Wm-2/(Mair*Cpair) where Mair(~104 kgm-2) is the
mass of air above a square meter and Cpair (~1000 Jkg-1K-1) is the specific heat capacity of
air. Substitution of the numerical values yields Q ~ 3.5x10⁻⁷ Ks-1or ~3.5x10⁻² Kday-1, and w ~
14 mday-1 or ω ~ -1.4 mb day-1 in pressure coordinates where ω is the pressure velocity. This
value agrees well with the value shown in Table 1 and Fig. 3 for the mid troposphere. When
we apply (2) to the air column above ocean, we find that the magnitude of ω is about half of
that over land and the sign is opposite. This is expected because land covers about 30% of the
earth while oceans cover 70%, and the global mean of ω should be zero for mass
conservation.
Application of (2) to the 2xCO2 minus 1xCO2 case similarly yields values of ω that
approximately explain values listed in Table 1. A summation of results for 2xCO2+CCN
minus 2xCO2 and 2xCO2 minus 1xCO2 nearly explains changes observed in the
2xCO2+CCN minus 1xCO2 case which has residual upward motion over land and downward
motion over oceans (Table 1 and Fig. 3 and 4). We attribute the increased runoff over land to
this residual upward motion over the tropical land (Fig. 4). A schematic diagram that
illustrates the mass flux direction and horizontal heat fluxes in all the cases is shown in Fig.
9.
In the basic state (1xCO2), the TOA net flux over land is -16.6W m-2 and the ocean
has an excess of about 7 Wm-2. The net deficit over land is equal to about 2.5 peta Watts
(PW) which is close to the observed value of 2.2±0.1 PW (Fasullo and Trenberth 2008a) and
the CMIP3 multi-model ensemble mean of 2.76 PW (Shin et al. 2006) . This would suggest,
based on the above analysis, that there is large upward motion over ocean and sinking motion
over land. However, we find that the mean vertical motion over land and oceans are nearly
zero (Table 1) but there is a large horizontal temperature difference (~ 8 K) between oceans
and land (Table 1). In this case, horizontal heat transport between land and oceans balance
the heat deficit over land and excess over the oceans (Fasullo and Trenberth 2008b; Lambert
and Chiang 2007) with the associated averaged vertical motions over land and oceans in the
secondary circulation being nearly zero.
5. Discussion
In this study, we have performed simulations using an atmospheric general circulation
model (NCAR CAM3.5) coupled to a "slab" ocean model to investigate the potential for
mitigation of climate change by altering the radius of marine cloud droplets. In these
simulations the magnitude of the decrease in cloud droplet size was chosen to approximately
offset the global mean warming from a doubling of atmospheric CO2 content. Relative to the
1xCO2 control climate, the 2xCO2 climate with smaller cloud droplets (2xCO2+CCN)
resulted in global land-mean precipitation increases of 3.52±0.33 and runoff (precipitation
minus evaporation) increases of 7.52±0.87. These results contrast with those from a previous
study (Bala et al. 2008) which showed reduction in both precipitation and runoff over land for
geoengineering schemes that deflect solar radiation above the tropopause without regard to
the land/ocean distinction. The increase in runoff over land in this study occurs because the
reduction of the droplet size of clouds and hence the enhancement of albedo is applied to
clouds over only the ocean areas. This differential enhancement of cloud albedo leads to a
monsoonal circulation with rising motion over land (Table 1 and Fig. 3, 4 and 9), and sinking
motion over ocean with associated statistically significant increases in precipitation over land.
Reduction of the radius of marine cloud droplets from 14 μm to 11.5 μm
(2xCO2+CCN minus 2xCO2) leads to a cooling of the ocean surface by 2.39±0.03 K and
2.53±0.04 K of the land surface; land surface temperatures decrease more than the ocean
surface temperatures despite the fact that clouds are directly altered only over the ocean. This
occurs because of differing lapse rates over oceans and land (Joshi and Gregory 2008; Joshi
et al. 2008); on average, the atmosphere over the oceans has a moist adiabatic lapse rate but
over land it has a lapse rate that is between a moist and dry lapse rates. Because of these
differing lapse rates, temperature changes in the upper level are larger over the oceans than
over land (Fig. 2); the atmospheric lapse rate change is larger for the atmosphere over oceans.
Understanding temperature and hydrological changes over land surface requires a detailed
investigation of climate responses on different time scales (Andrews et al. 2009; Bala et al.
2009). Such an investigation of the land surface hydrology will be the subject of a future
paper.
While the surface warming and hydrological changes discussed in this study are
caused by short and longwave radiative effects, they can be also caused by the possible
impacts of the physiological effect of CO2 on plant stomatal conductance called ‘the CO2
physiological forcing' (Betts et al. 2007; Boucher et al. 2009; Cao et al. 2009; Gedney et al.
2006). We note that these effects cannot be offset by a solar radiation management scheme.
In order to isolate the radiative effects, we turned off the CO2 physiological effect in this
study.
The water budget over land is the result of a delicate balance between precipitation
and surface evaporation. In this model, we have shown that the decrease in precipitation over
land is smaller than the decrease in evaporation when the radius of marine cloud droplets is
decreased, resulting in increased runoff over land. We have attributed this to an increased
upward motion over land leading to less reduction in precipitation (see the discussion in the
previous section). However, a large spread exists in climate models' precipitation responses
to global warming (IPCC 2007). Therefore, it is critical to demonstrate if this result is robust
across climate models. Are there any fundamental constraints on the transport of heat and
water between land and oceans for increasing CO2 and increased marine cloud albedo?
Further theoretical and modelling studies on climate change and multi-model
intercomparisons are required to address these questions.
In the real world, increased CCN could lead to smaller droplets which do not rain out
as often because they do not reach “precipitable” raindrop sizes as quickly. Thus, not only
does the decreased cloud droplet size lead to increased albedo, it also increases the lifetime of
clouds. The increased lifetime could further increase the cloud-albedo and, therefore, the
cloud life time effect could amplify the effect from the increase in cloud albedo. In our
simulations, this effect of decreased cloud droplet size on cloud microphysics is not
represented and, hence, the reduction in cloud droplet size need not be as large in real-world
applications as in this study.
In the real world, it is probably impossible to seed clouds over all ocean areas, let
alone uniform reduction in cloud droplet size. This approach would most likely, if at all, be
deployed only for the persistent marine stratocumulus clouds off the west coasts of the
continents such as South America, North America, Africa and Australia (Bower et al. 2006;
Latham 1990; Latham 2002; Latham et al. 2008). However, our aim here is not to predict
consequences of particular possible deployments of this approach but rather to understand
fundamental climate consequences of alteration of marine cloud albedo. Real-world cloud
seeding schemes could affect the regional land water budgets, and thus much more detailed
analysis would be required before large-scale deployment of such approaches could be
seriously considered (Jones et al. 2009).
Caution should be exercised in interpreting our results because we have used a single
atmospheric general circulation model coupled to a mixed layer ocean model. Transient
responses and feedbacks from deep-ocean and dynamic sea-ice are not simulated in this
study. Our simulations also lack many feedbacks associated with ocean and land biospheres.
Other models could yield quantitatively different results. Nonetheless, we believe that the
basic qualitative results obtained here are robust and we recommend further studies on multi-
model intercomparisons to ensure this.
This study shows that enhancing the albedo of marine clouds could lead to increased
runoff over land. Obviously, our model is much simpler than the real world, and in the real
world, reducing marine cloud droplet size could have unforeseen consequences not
anticipated by our model. There are enormous difficulties in untangling relationships among
the aerosol, clouds and precipitation (Stevens and Feingold 2009). In the SRM scheme of
seeding marine clouds that is considered in this study, the warming is mitigated in the
troposphere but the cooling in the stratosphere is not mitigated indicating that the
stratospheric climate change from increasing CO2 is not mitigated (Fig. 10). This result is
similar to conclusions from other studies that investigated the effects of reduced solar
radiation above the tropopause without regard to land-sea contrasts to mitigate CO2-induced
climate change (Govindasamy and Caldeira 2000; Govindasamy et al. 2003). Clearly, SRM
schemes, including the albedo-enhancement of marine clouds, will leave the ocean
acidification problem unsolved (Mathews et al. 2009). If we commit to any SRM scheme, in
the absence of active removal of greenhouse gases from the atmosphere, we may be
committing to that scheme for multiple centuries (Bengtsson 2006). It may be difficult to
develop and maintain over centuries an international consensus to engage in a large-scale
geoengineering project (Schneider 2001). Failure of a stabilization scheme could be
catastrophic (Matthews and Caldeira 2007). Therefore, a careful integrated assessment is
required before committing to any geoengineering scheme.
In summary, prior studies have suggested that offsetting global warming by reflecting
sunlight to space would result in a drying of the continents. In contrast, our study indicates
that reflecting sunlight to space by reducing cloud droplet size over the oceans could lead, on
average, to a moistening of the continents.
Acknowledgement
We thank Prof. J. Srinivasan of Divecha Center for Climate Change, Indian Institute
of Science for suggestions which helped to improve this manuscript.
References Allen, MR and Ingram, WJ (2002) Constraints on future changes in climate and the hydrologic cycle.
Nature 419(6903): 224-232. Andrews, T, Forster, PM and Gregory, JM (2009) A surface energy perspective on climate change.
Journal of Climate 22: 2557-2570. Angel, R (2006) Feasibility of cooling the Earth with a cloud of small spacecraft near the inner
Lagrange point (L1). Proceedings of the National Academy of Sciences of the United States of America 103(46): 17184-17189.
Bala, G (2009) Problems with geoengineering schemes to combat climate change. Current Science 96(1): 41-48.
Bala, G, Caldeira, K and Nemani, R (2009) Fast versus slow response in climate change: implications for the global hydrological cycle. Climate Dynamics DOI 10.1007/s00382-009-0583-y.
Bala, G, Duffy, PB and Taylor, KE (2008) Impact of geoengineering schemes on the global hydrological cycle. Proceedings of the National Academy of Sciences of the United States of America 105(22): 7664-7669.
Bengtsson, L (2006) Geo-engineering to confine climate change: Is it at all feasible? Climatic Change 77(3-4): 229-234.
Betts, RA et al. (2007) Projected increase in continental runoff due to plant responses to increasing carbon dioxide. Nature 448(7157): 1037-U5.
Boucher, O, Jones, A and Betts, RA (2009) Climate response to the physiological impact of carbon dioxide on plants in the Met Office Unified Model HadCM3. Climate Dynamics 32(2-3): 237-249.
Bower, K, Choularton, T, Latham, J, Sahraei, J and Salter, S (2006) Computational assessment of a proposed technique for global warming mitigation via albedo-enhancement of marine stratocumulus clouds. Atmospheric Research 82(1-2): 328-336.
Cao, L, Bala, G, Caldeira, K, Nemani, R and Ban-Weiss, G (2009) Climate response to physiological forcing of carbon dioxide simulated by the coupled Community Atmosphere Model (CAM3.1) and Community Land Model (CLM3.0). Geophysical Research Letters (in press).
Collins, WD et al. (2006) The formulation and atmospheric simulation of the Community Atmosphere Model version 3 (CAM3). Journal of Climate 19(11): 2144-2161.
Crutzen, PJ (2006) Albedo enhancement by stratospheric sulfur injections: A contribution to resolve a policy dilemma? Climatic Change 77(3-4): 211-219.
Doutriaux-Boucher, M, Webb, MJ, Gregory, JM and Boucher, O (2009) Carbon dioxide induced stomatal closure increases radiative forcing via a rapid reduction in low cloud. Geophysical Research Letters 36.
Early, JT (1989) The space based solar shield to offset greenhouse effect. J. Brit. Interplanet. Soc 42: 567-569.
Fasullo, JT and Trenberth, KE (2008a) The annual cycle of the energy budget. Part I: Global mean and land-ocean exchanges. Journal of Climate 21(10): 2297-2312.
Fasullo, JT and Trenberth, KE (2008b) The annual cycle of the energy budget. Part II: Meridional structures and poleward transports. Journal of Climate 21(10): 2313-2325.
Forster, PM, Blackburn, M, Glover, R and Shine, KP (2000) An examination of climate sensitivity for idealised climate change experiments in an intermediate general circulation model. Climate Dynamics 16(10-11): 833-849.
Gedney, N et al. (2006) Detection of a direct carbon dioxide effect in continental river runoff records. Nature 439(7078): 835-838.
Govindasamy, B and Caldeira, K (2000) Geoengineering Earth's radiation balance to mitigate CO2-induced climate change. Geophysical Research Letters 27(14): 2141-2144.
Govindasamy, B, Caldeira, K and Duffy, PB (2003) Geoengineering Earth's radiation balance to mitigate climate change from a quadrupling of CO2. Global and Planetary Change 37(1-2): 157-168.
Govindasamy, B, Thompson, S, Duffy, PB, Caldeira, K and Delire, C (2002) Impact of geoengineering schemes on the terrestrial biosphere. Geophysical Research Letters 29(22): 2061, doi:10.1029/2002GL015911.
Gregory, J and Webb, M (2008) Tropospheric adjustment induces a cloud component in CO2 forcing. Journal of Climate 21(1): 58-71.
Gregory, JM et al. (2004) A new method for diagnosing radiative forcing and climate sensitivity. Geophysical Research Letters 31(3): L03205, doi:10.1029/2003GL018747.
Hansen, J, Sato, M and Ruedy, R (1997) Radiative forcing and climate response. Journal of Geophysical Research-Atmospheres 102(D6): 6831-6864.
Hansen, J et al. (2005) Efficacy of climate forcings. Journal of Geophysical Research-Atmospheres 110(D18): D18104, doi:10.1029/2005JD005776.
Held, IM and Soden, BJ (2006) Robust responses of the hydrological cycle to global warming. Journal of Climate 19(21): 5686-5699.
Holton, J (1992) An introduction to dynamics meteorology. 5. Academic Press, New York, USA, 511 pp.
IPCC (2007) Climate Change 2007: The physical science basis. Contribution of Working Group I to the Fourth Assessment Report of the Intergovernmental Panel on Climate Change. Cambridge University Press, Cambridge, UK and New York, NY, USA.
Jones, A, Haywood, J and Boucher, O (2009) Climate impacts of geoengineering marine stratocumulus clouds. Journal of Geophysical Research-Atmospheres 114: D10106, doi:10.1029/2008JD011450.
Joshi, M and Gregory, J (2008) Dependence of the land-sea contrast in surface climate response on the nature of the forcing. Geophysical Research Letters 35(24).
Joshi, MM, Gregory, JM, Webb, MJ, Sexton, DMH and Johns, TC (2008) Mechanisms for the land/sea warming contrast exhibited by simulations of climate change. Climate Dynamics 30(5): 455-465.
Lambert, FH and Chiang, JCH (2007) Control of land-ocean temperature contrast by ocean heat uptake. Geophysical Research Letters 34(13).
Latham, J (1990) Control of Global Warming. Nature 347(6291): 339-340. Latham, J (2002) Amelioration of global warming by controlled enhancement of the albedo and
longevity of low-level maritime clouds. Atmospheric Science Letters doi:10.1006/Asle.2002.0048.
Latham, J et al. (2008) Global temperature stabilization via controlled albedo enhancement of low-level maritime clouds. Philosophical Transactions of the Royal Society a-Mathematical Physical and Engineering Sciences 366(1882): 3969-3987.
Lunt, DJ, Ridgwell, A, Valdes, PJ and Seale, A (2008) "Sunshade World": A fully coupled GCM evaluation of the climatic impacts of geoengineering. Geophysical Research Letters 35(12): L12710, doi:10.1029/2008GL033674.
Mathews, D, Cao, L and Caldeira, K (2009) Sensitivity of ocean acidification to geoengineered climate stabilization. Geophysical Research Letters 36: L10706, doi:10.1029/2009GL037488.
Matthews, HD and Caldeira, K (2007) Transient climate-carbon simulations of planetary geoengineering. Proceedings of the National Academy of Sciences of the United States of America 104(24): 9949-9954.
NAS 1992 (1992) Policy implications of greenhouse warming: Mitigation, Adaptation and the Science Base. National Academy of Sciences. National Academy Press, Washington D.C, Chap. 28 (Geoengineering), pp. 433-464.
Oleson, KW et al. (2008) Improvements to the Community Land Model and their impact on the hydrological cycle. Journal of Geophysical Research-Biogeosciences 113(G1): -.
Rasch, PJ, Crutzen, PJ and Coleman, DB (2008) Exploring the geoengineering of climate using stratospheric sulfate aerosols: The role of particle size. Geophysical Research Letters 35(2): L02809, doi:10.1029/2007GL032179.
Robock, A, Oman, L and Stenchikov, GL (2008) Regional climate responses to geoengineering with tropical and Arctic SO2 injections. Journal of Geophysical Research 113: D16101, doi:10.1029/2008JD010050.
Schneider, SH (2001) Earth systems engineering and management. Nature 409(6818): 417-+. Seifritz, W (1989) Mirrors to Halt Global Warming. Nature 340(6235): 603-603. Shin, HJ, Chung, IU, Kim, HJ and Kim, JW (2006) Global energy cycle between land and ocean in the
simulated 20th century climate systems. Geophysical Research Letters 33(14). Stevens, B and Feingold, G (2009) Untangling aerosol effects on clouds and precipitation in a
buffered system. Nature 461: 607-613. Sutton, RT, Dong, BW and Gregory, JM (2007) Land/sea warming ratio in response to climate change:
IPCC AR4 model results and comparison with observations. Geophysical Research Letters 34(2): L02701, doi:10.1029/2006GL028164.
Teller, E, L. Wood and Hyde, R (1997) Global warming and ice ages: I. Prospects for physics based modulation of global change, UCRL-231636 / UCRL JC 128715, Lawrence Livermore National Laboratory, Livermore, CA, USA.
Tilmes, S, Garcia, RR, Kinnison, DE, Gettelman, A and Rasch, P (2009) Impact of geoengineered aerosols on the troposphere and stratosphere. Geophysical Research Letters 114(D12305,
doi:10.1029/2008JD011420). Trenberth, KE and Dai, A (2007) Effects of Mount Pinatubo volcanic eruption on the hydrological
cycle as an analog of geoengineering. Geophysical Research Letters 34(15): L15702, doi:10.1029/2007GL030524.
Twomey, S (1977) Influence of Pollution on Shortwave Albedo of Clouds. Journal of the Atmospheric Sciences 34(7): 1149-1152.
Zwiers, F and von Storch, H (1995) Taking serial correlation into account in tests of the mean. Journal of Climate 8: 336-351.
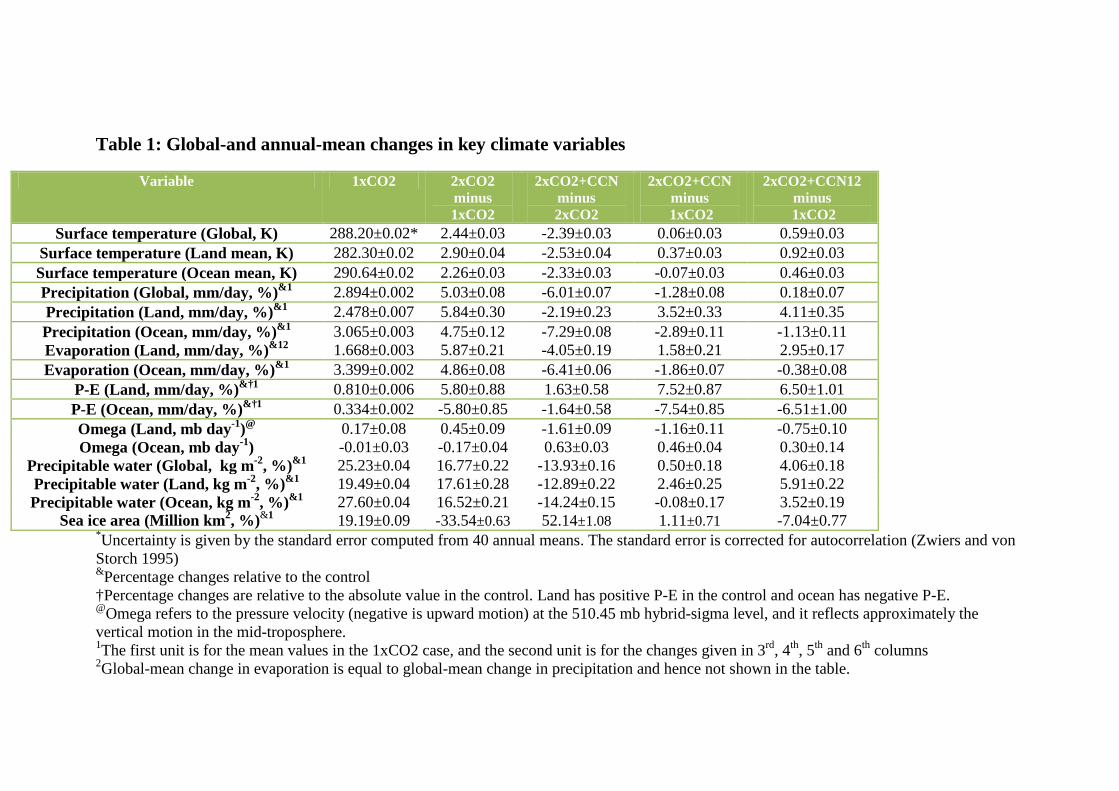
Table 1: Global-and annual-mean changes in key climate variables
Variable 1xCO2 2xCO2 minus 1xCO2
2xCO2+CCN minus 2xCO2
2xCO2+CCN minus
1xCO2
2xCO2+CCN12 minus
1xCO2 Surface temperature (Global, K) 288.20±0.02* 2.44±0.03 -2.39±0.03 0.06±0.03 0.59±0.03
Surface temperature (Land mean, K) 282.30±0.02 2.90±0.04 -2.53±0.04 0.37±0.03 0.92±0.03 Surface temperature (Ocean mean, K) 290.64±0.02 2.26±0.03 -2.33±0.03 -0.07±0.03 0.46±0.03 Precipitation (Global, mm/day, %)&1 2.894±0.002 5.03±0.08 -6.01±0.07 -1.28±0.08 0.18±0.07 Precipitation (Land, mm/day, %)&1 2.478±0.007 5.84±0.30 -2.19±0.23 3.52±0.33 4.11±0.35 Precipitation (Ocean, mm/day, %)&1 3.065±0.003 4.75±0.12 -7.29±0.08 -2.89±0.11 -1.13±0.11 Evaporation (Land, mm/day, %)&12 1.668±0.003 5.87±0.21 -4.05±0.19 1.58±0.21 2.95±0.17 Evaporation (Ocean, mm/day, %)&1 3.399±0.002 4.86±0.08 -6.41±0.06 -1.86±0.07 -0.38±0.08
P-E (Land, mm/day, %)&†1 0.810±0.006 5.80±0.88 1.63±0.58 7.52±0.87 6.50±1.01 P-E (Ocean, mm/day, %)&†1 0.334±0.002 -5.80±0.85 -1.64±0.58 -7.54±0.85 -6.51±1.00 Omega (Land, mb day-1)@ 0.17±0.08 0.45±0.09 -1.61±0.09 -1.16±0.11 -0.75±0.10 Omega (Ocean, mb day-1) -0.01±0.03 -0.17±0.04 0.63±0.03 0.46±0.04 0.30±0.14
Precipitable water (Global, kg m-2, %)&1 25.23±0.04 16.77±0.22 -13.93±0.16 0.50±0.18 4.06±0.18 Precipitable water (Land, kg m-2, %)&1 19.49±0.04 17.61±0.28 -12.89±0.22 2.46±0.25 5.91±0.22 Precipitable water (Ocean, kg m-2, %)&1 27.60±0.04 16.52±0.21 -14.24±0.15 -0.08±0.17 3.52±0.19
Sea ice area (Million km2, %)&1 19.19±0.09 -33.54±0.63 52.14±1.08 1.11±0.71 -7.04±0.77 *Uncertainty is given by the standard error computed from 40 annual means. The standard error is corrected for autocorrelation (Zwiers and von Storch 1995) &Percentage changes relative to the control †Percentage changes are relative to the absolute value in the control. Land has positive P-E in the control and ocean has negative P-E. @Omega refers to the pressure velocity (negative is upward motion) at the 510.45 mb hybrid-sigma level, and it reflects approximately the vertical motion in the mid-troposphere. 1The first unit is for the mean values in the 1xCO2 case, and the second unit is for the changes given in 3rd, 4th, 5th and 6th columns 2Global-mean change in evaporation is equal to global-mean change in precipitation and hence not shown in the table.
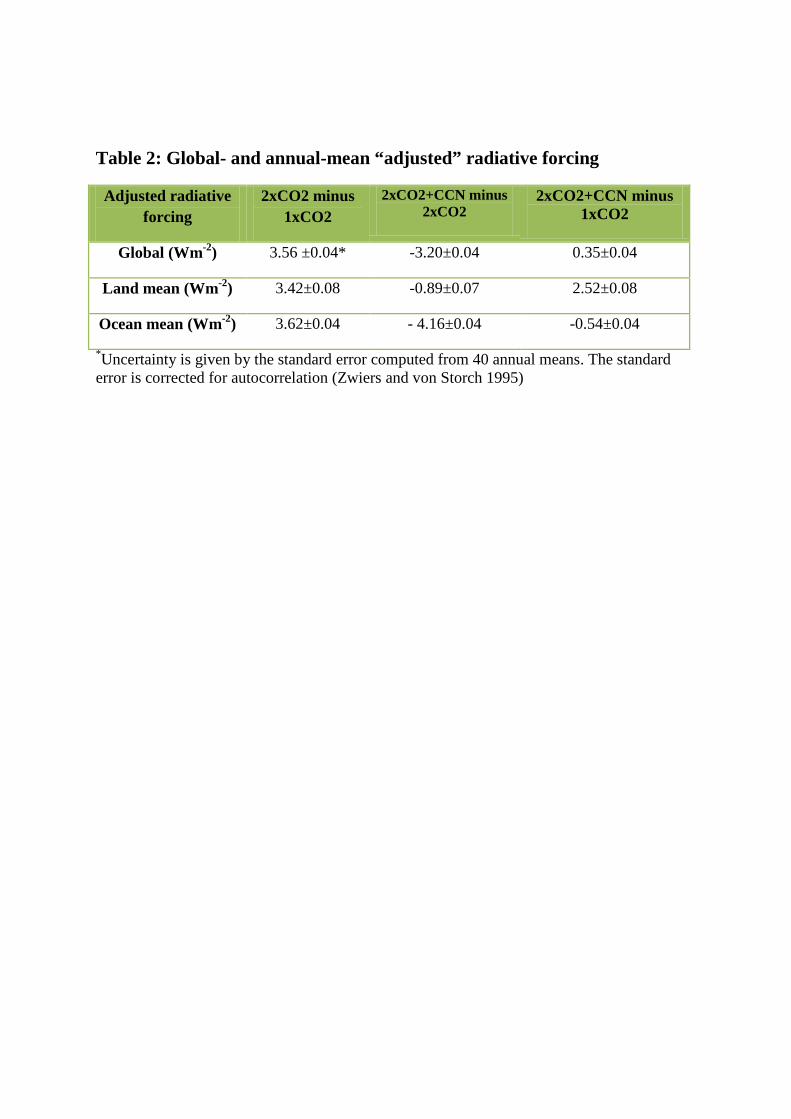
Table 2: Global- and annual-mean “adjusted” radiative forcing
Adjusted radiative forcing
2xCO2 minus 1xCO2
2xCO2+CCN minus 2xCO2
2xCO2+CCN minus 1xCO2
Global (Wm-2) 3.56 ±0.04* -3.20±0.04 0.35±0.04
Land mean (Wm-2) 3.42±0.08 -0.89±0.07 2.52±0.08
Ocean mean (Wm-2) 3.62±0.04 - 4.16±0.04 -0.54±0.04
*Uncertainty is given by the standard error computed from 40 annual means. The standard error is corrected for autocorrelation (Zwiers and von Storch 1995)
Figure Captions Fig.1 Radiative forcing calculated using the “fixed SST-method” (Hansen et al. 2005) for
doubled atmospheric CO2 content (2xCO2 minus 1xCO2), reduced marine cloud droplet size
(2xCO2+CCN minus 2xCO2) and the case with both the effects included (2xCO2+CCN
minus 1xCO2). The hatching indicates regions where the changes are not significant at the
1% level. Significance level is estimated using a Student-t test with a sample of 40 annual
means and standard error corrected for autocorrelation (Zwiers and von Storch 1995).
Fig. 2 Vertical profile of the changes in land-mean, and ocean-mean temperatures. Changes
are shown for the case with doubled atmospheric CO2 content (2xCO2 minus 1xCO2),
reduced marine cloud droplet size (2xCO2+CCN minus 2xCO2) and the case with both the
effects included (2xCO2+CCN minus 1xCO2). The vertical coordinate is the model’s sigma
coordinate and no vertical interpolation to pressure coordinate is performed because several
land grid points are below the topography for levels below 700 mb. We find that the lapse
rate changes are larger for the temperature profiles over the oceans than over land because air
parcels follow the moist adiabats over the oceans and nearly follow the dry adiabats over land
(Joshi et al. 2008).
Fig. 3 Vertical profile of the changes in global-mean (no marker), land-mean (cross), and
ocean-mean (circle) pressure velocity (omega). Negative values in omega changes represent
increases in upward motion and vice versa. Changes are shown for the case with doubled
atmospheric CO2 content (2xCO2 minus 1xCO2), reduced marine cloud droplet size
(2xCO2+CCN minus 2xCO2) and the case with both the effects included (2xCO2+CCN
minus 1xCO2). The data is vertically interpolated to the pressure levels because omega is
equivalent to mass flux and interpretation in terms of mass conservation is made easier in the
pressure coordinate system. When CO2 concentration is increased, there is a slight upward
motion over ocean and downward motion over land. When marine cloud droplet size is
reduced, large increases in the upward motion over land and downward motion over ocean
are induced.
Fig. 4 Changes in zonal- and annual-mean omega (pressure velocity) at the hybrid sigma
level of 508.45. This level approximately corresponds to the 500 mb pressure surface.
Negative values in omega changes represent increases in upward motion and vice versa.
Changes are shown for the case with doubled atmospheric CO2 content (2xCO2 minus
1xCO2), reduced marine cloud droplet size (2xCO2+CCN minus 2xCO2) and the case with
both the effects included (2xCO2+CCN minus 1xCO2) for land (black), ocean (dashed) and
all regions (grey). Note the increase in upward motion over tropical land regions in the case
with reduced cloud droplet size and in the case with doubled CO2 content and reduced droplet
size, indicating the monsoonal effect due to reducing the droplet size of marine clouds.
Fig. 5 Changes in global- and annual-mean surface temperature and precipitable water due to
increase in CO2 content (2xCO2 minus 1xCO2), reduction in marine cloud droplet size
(2xCO2+CCN minus 2xCO2) and a combination of both increased CO2 content and reduced
droplet size (2xCO2+CCN minus 1xCO2). The hatching indicates regions where the changes
are not significant at the 1% level. Significance level is estimated using a Student-t test with a
sample of 40 annual means and standard error corrected for autocorrelation (Zwiers and von
Storch 1995).
Fig. 6 Changes in global- and annual-mean total cloudiness, planetary albedo, and surface net
shortwave radiation due to increase in CO2 content (2xCO2 minus 1xCO2), reduction in
marine cloud droplet size (2xCO2+CCN minus 2xCO2) and a combination of both increased
CO2 content and reduced droplet size (2xCO2+CCN minus 1xCO2). Changes in cloudiness
and albedo are absolute percentage changes. The hatching indicates regions where the
changes are not significant at the 1% level. Significance level is estimated using a Student-t
test with a sample of 40 annual means and standard error corrected for autocorrelation
(Zwiers and von Storch 1995). Cloud changes are significant at the 1% level over 51%, 62%
and 42% of globe, respectively, and TOA albedo and surface shortwave fluxes over 45%,
76% and 66%, and 44%, 60% and 62%, respectively.
Fig. 7 Changes in global- and annual-mean in precipitable water, precipitation (P),
evaporation (E) and (P-E) due to increase in CO2 content (2xCO2 minus 1xCO2), reduction
in marine cloud droplet size (2xCO2+CCN minus 2xCO2) and a combination of both
increased CO2 content and reduced droplet size (2xCO2+CCN minus 1xCO2). The hatching
indicates regions where the changes are not significant at the 1% level. Significance level is
estimated using a Student-t test with a sample of 40 annual means and standard error
corrected for autocorrelation (Zwiers and von Storch 1995). Precipitation changes are
statistically significant at the 1% level over 46 (50), 58 (57), and 37 (31) % of the globe (land
area) in the three comparisons, respectively. The corresponding fractions for evaporation are
85 (79), 89 (78) and 47 (44) % indicating higher confidence in evaporation changes. These
fractions decrease to 39 (35), 46 (39) and 31 (22) % for (P-E), indicating slightly reduced
confidence in regional scale changes in runoff.
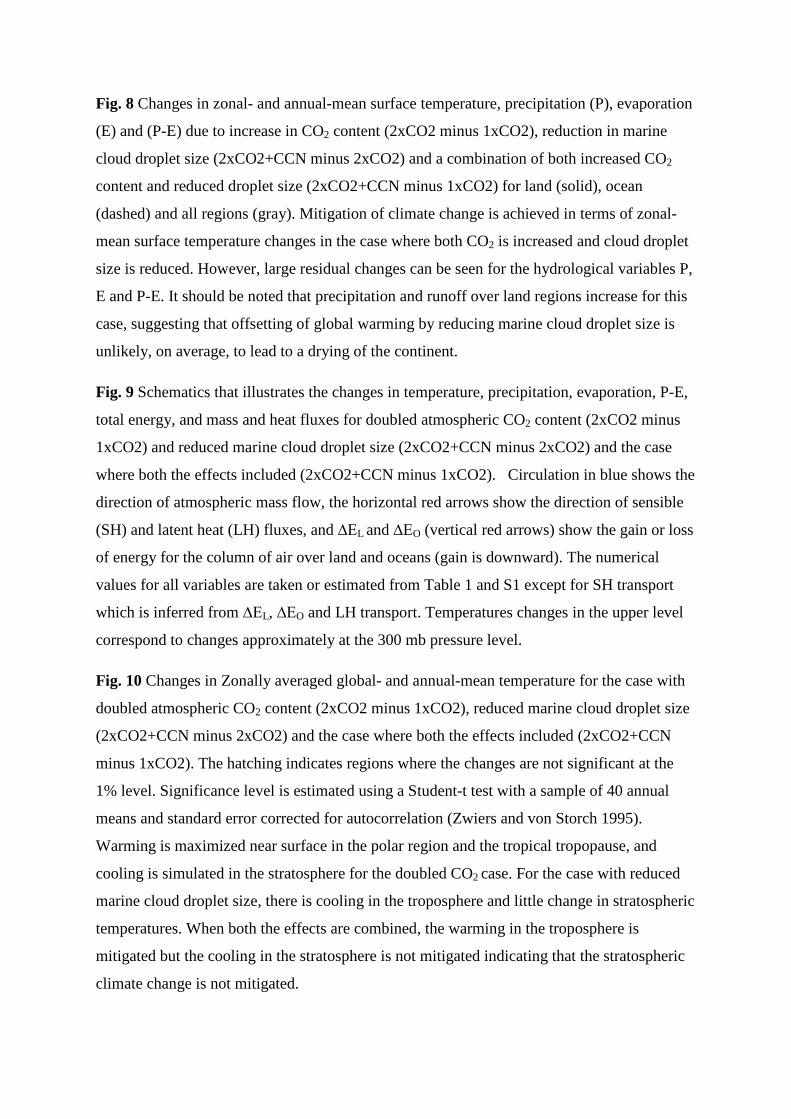
Fig. 8 Changes in zonal- and annual-mean surface temperature, precipitation (P), evaporation
(E) and (P-E) due to increase in CO2 content (2xCO2 minus 1xCO2), reduction in marine
cloud droplet size (2xCO2+CCN minus 2xCO2) and a combination of both increased CO2
content and reduced droplet size (2xCO2+CCN minus 1xCO2) for land (solid), ocean
(dashed) and all regions (gray). Mitigation of climate change is achieved in terms of zonal-
mean surface temperature changes in the case where both CO2 is increased and cloud droplet
size is reduced. However, large residual changes can be seen for the hydrological variables P,
E and P-E. It should be noted that precipitation and runoff over land regions increase for this
case, suggesting that offsetting of global warming by reducing marine cloud droplet size is
unlikely, on average, to lead to a drying of the continent.
Fig. 9 Schematics that illustrates the changes in temperature, precipitation, evaporation, P-E,
total energy, and mass and heat fluxes for doubled atmospheric CO2 content (2xCO2 minus
1xCO2) and reduced marine cloud droplet size (2xCO2+CCN minus 2xCO2) and the case
where both the effects included (2xCO2+CCN minus 1xCO2). Circulation in blue shows the
direction of atmospheric mass flow, the horizontal red arrows show the direction of sensible
(SH) and latent heat (LH) fluxes, and ∆EL and ∆EO (vertical red arrows) show the gain or loss
of energy for the column of air over land and oceans (gain is downward). The numerical
values for all variables are taken or estimated from Table 1 and S1 except for SH transport
which is inferred from ∆EL, ∆EO and LH transport. Temperatures changes in the upper level
correspond to changes approximately at the 300 mb pressure level.
Fig. 10 Changes in Zonally averaged global- and annual-mean temperature for the case with
doubled atmospheric CO2 content (2xCO2 minus 1xCO2), reduced marine cloud droplet size
(2xCO2+CCN minus 2xCO2) and the case where both the effects included (2xCO2+CCN
minus 1xCO2). The hatching indicates regions where the changes are not significant at the
1% level. Significance level is estimated using a Student-t test with a sample of 40 annual
means and standard error corrected for autocorrelation (Zwiers and von Storch 1995).
Warming is maximized near surface in the polar region and the tropical tropopause, and
cooling is simulated in the stratosphere for the doubled CO2 case. For the case with reduced
marine cloud droplet size, there is cooling in the troposphere and little change in stratospheric
temperatures. When both the effects are combined, the warming in the troposphere is
mitigated but the cooling in the stratosphere is not mitigated indicating that the stratospheric
climate change is not mitigated.
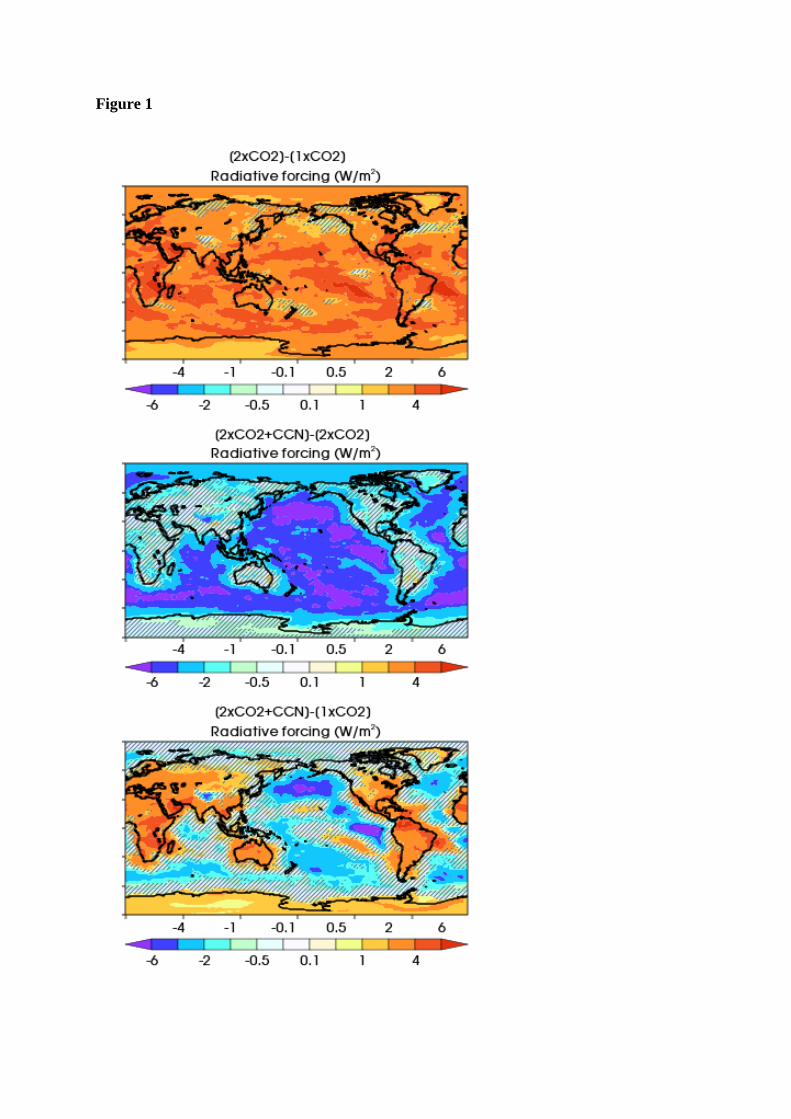
Figure 1

Figure 2
.
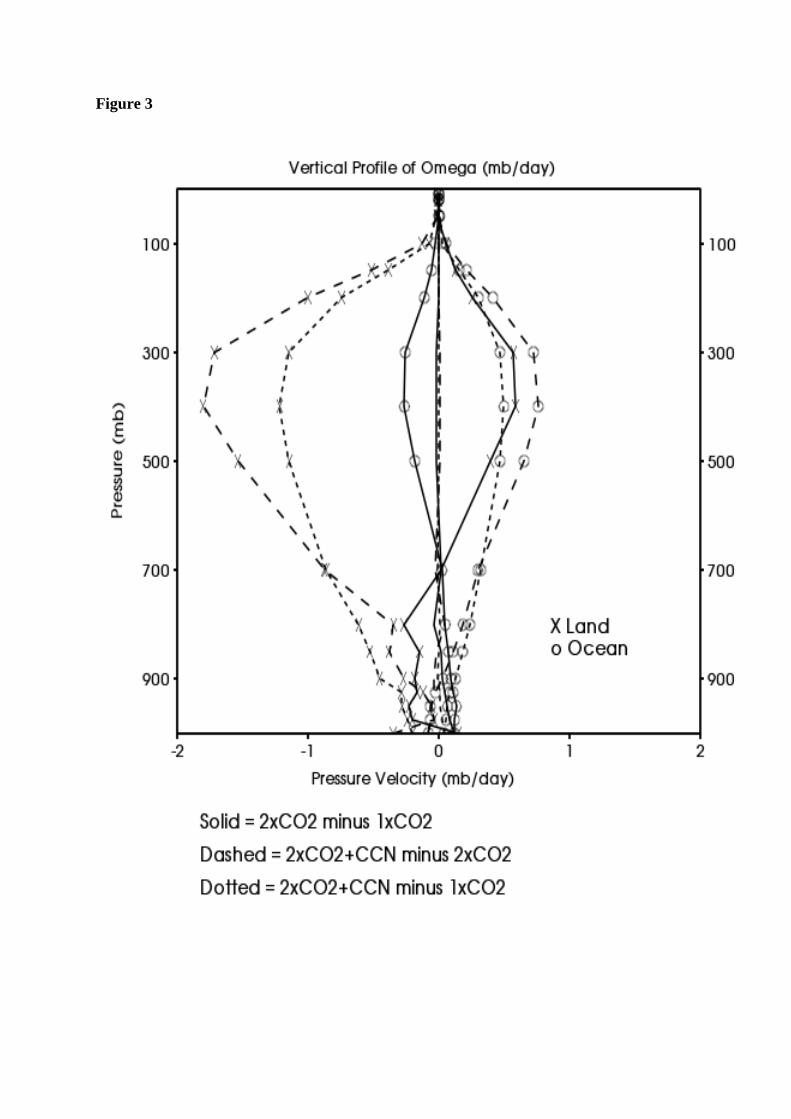
Figure 3
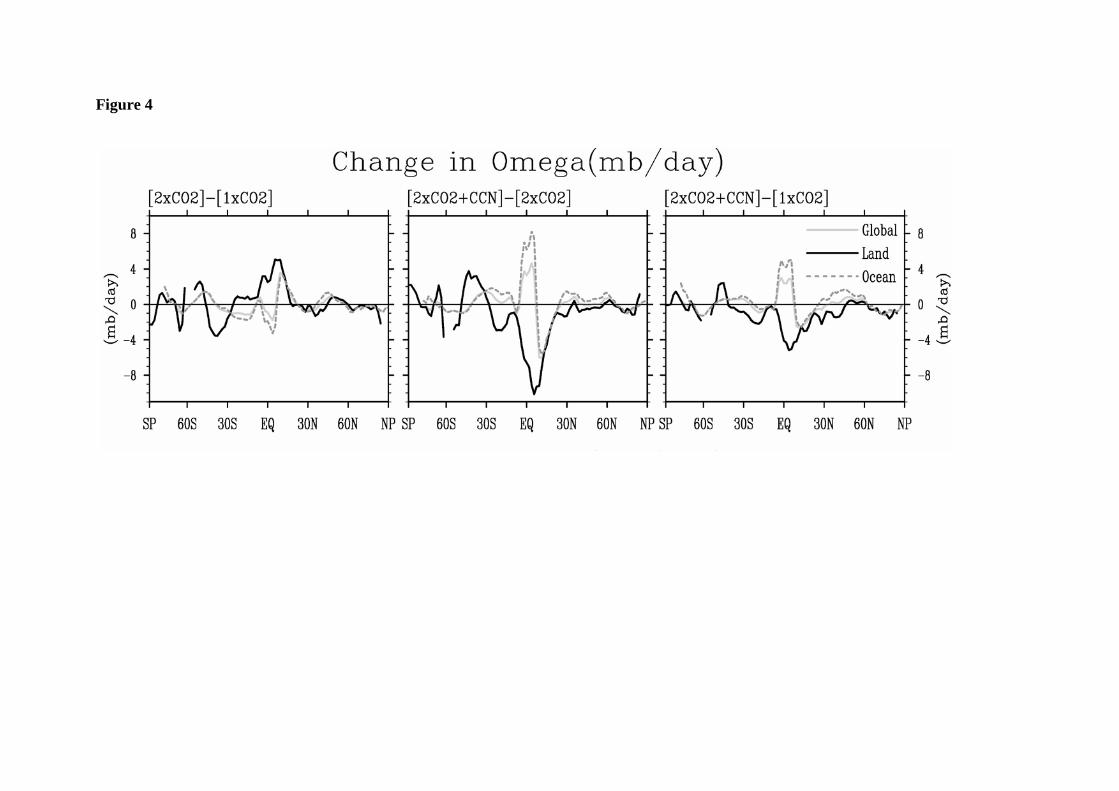
Figure 4
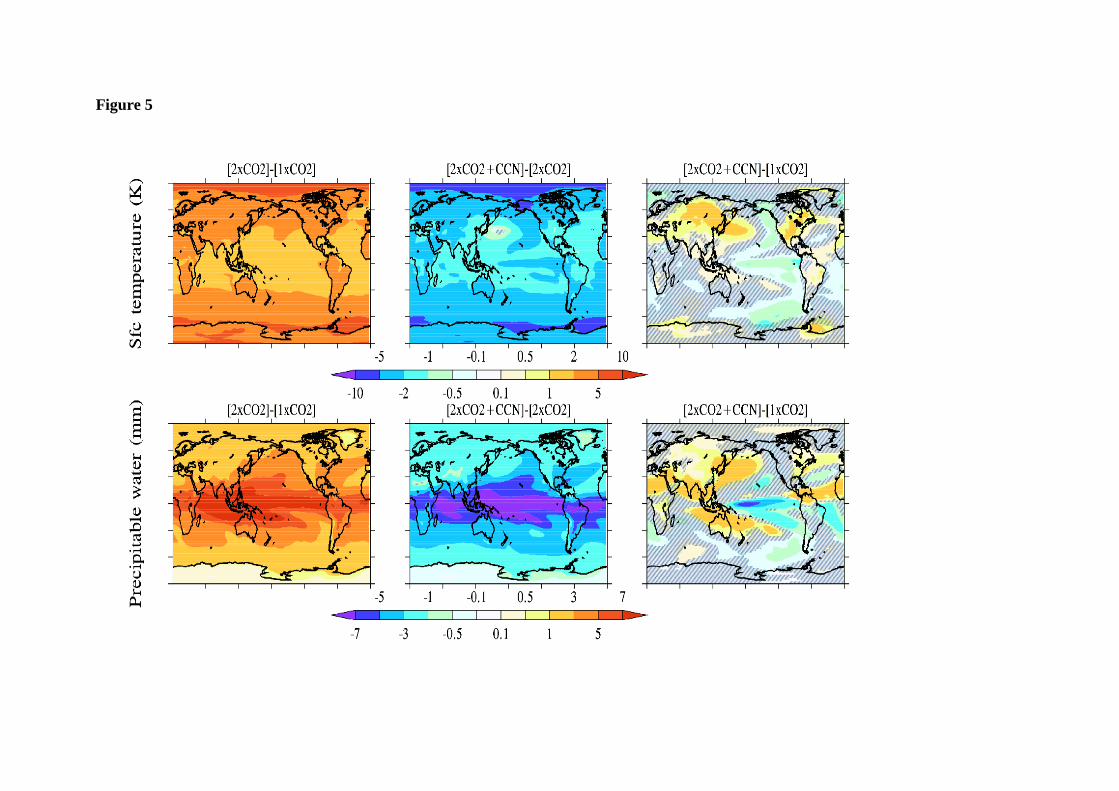
Figure 5
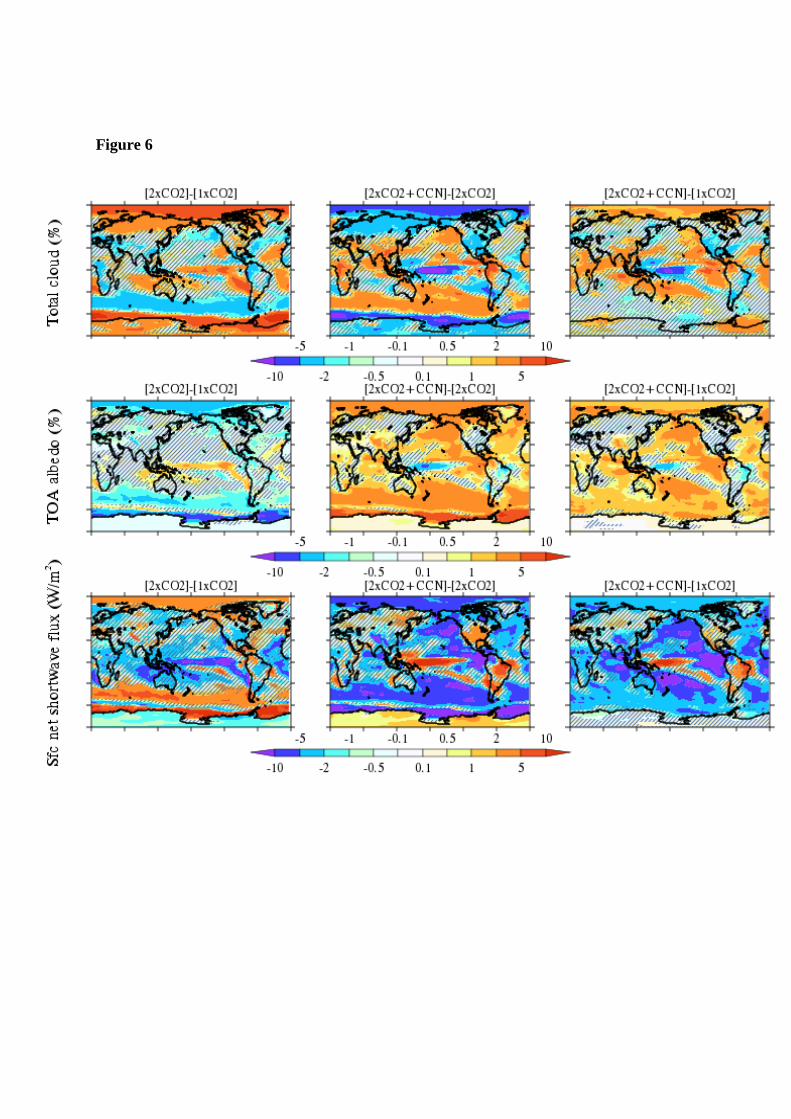
Figure 6
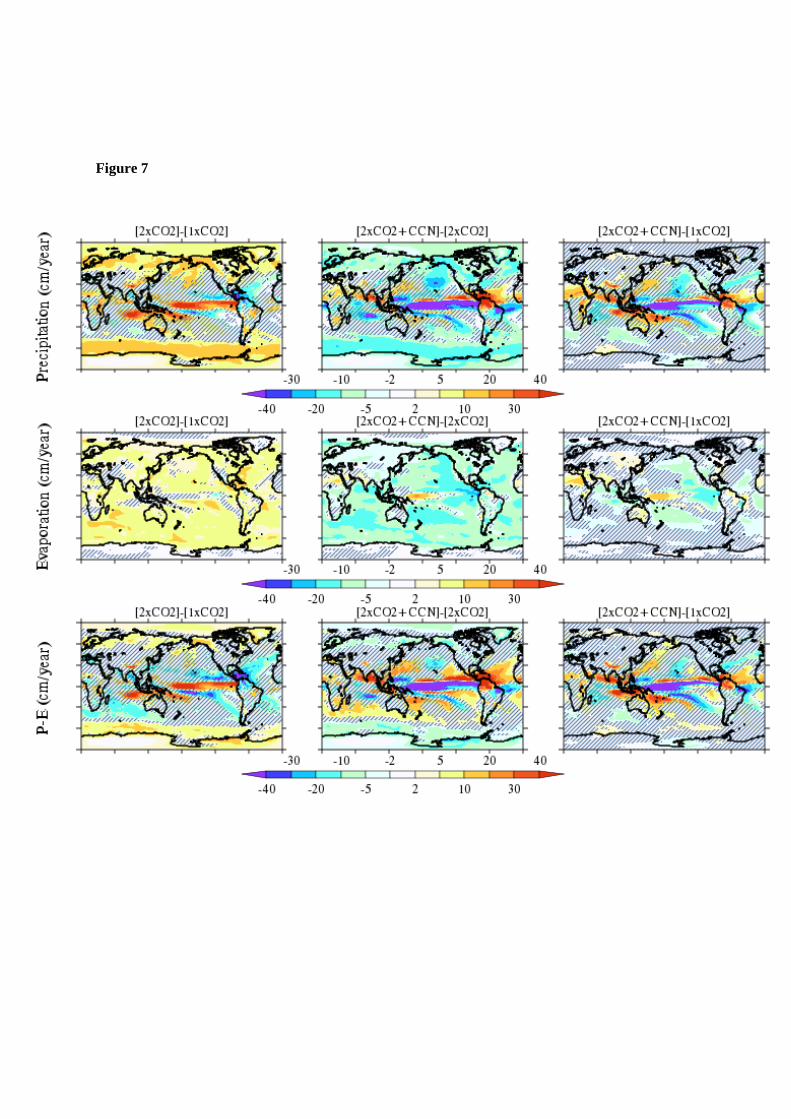
Figure 7
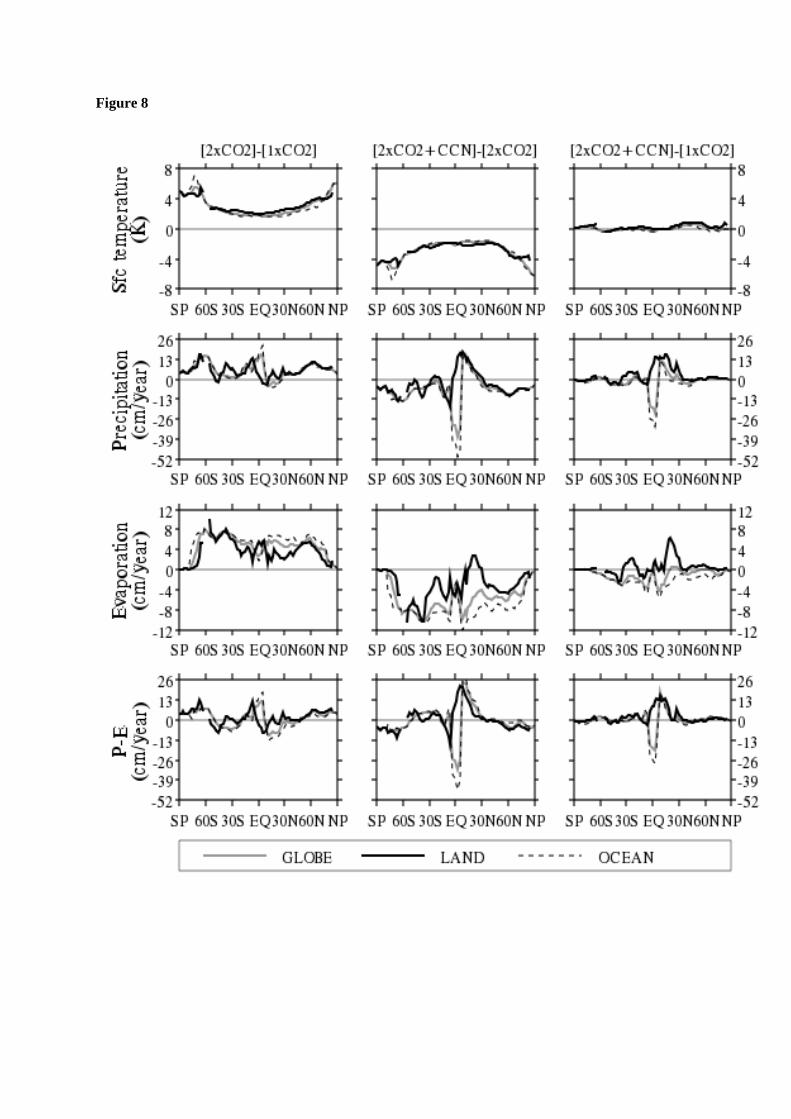
Figure 8
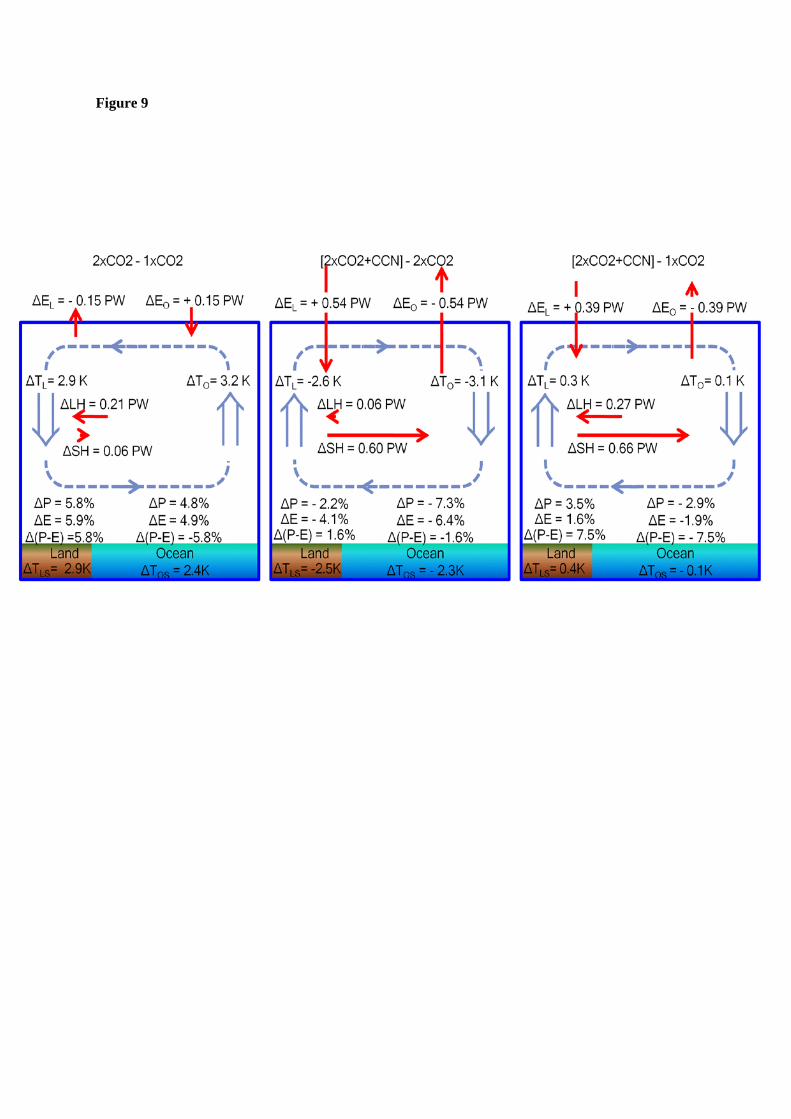
Figure 9
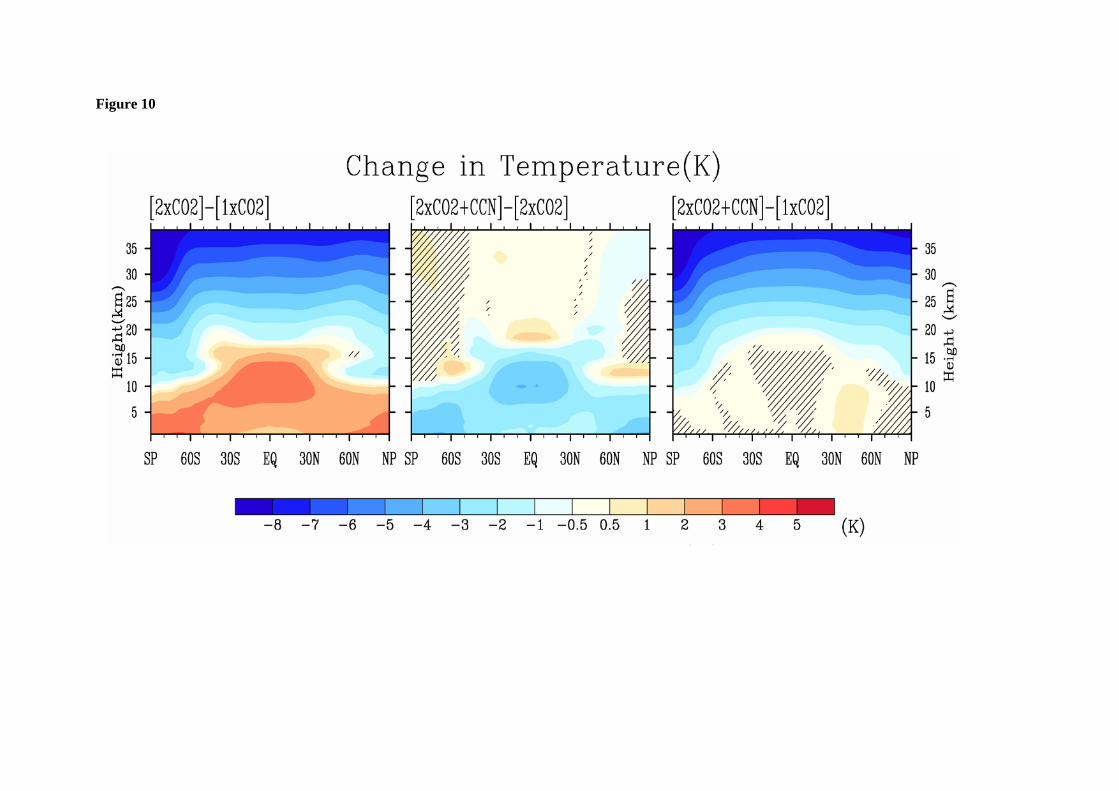
Figure 10


