UNIVERSITY OF SOUTHERN QUEENSLAND
FIELD EVALUATION AND MODELLING OF WATER AND NITROGEN MANAGEMENT STRATEGIES IN TROPICAL
LOWLAND RICE–BASED PRODUCTION SYSTEMS
A Dissertation Submitted by
Ahmad Suriadi M.Agr.Sc.
for the award of
Doctor of Philosophy
2010

Dedicated to my beloved parents: Amaq Sium & Sindawati
My wife: Sri Marliana Setianingsih and my children: Syarifana ‘Aisyah Suriadi
Ahmad ‘Aliqari Suriadi ‘Athaana Fathimah Suriadi Ahmad ‘Alifirdaus Suriadi Ahmad ‘Alikaustar Suriadi

Abstract
i
ABSTRACT
With increased competition for land and water from the urban and industrial
sectors and high population growth in the major rice producing nations, the
possibility for expanding area under rice-based farming systems is limited. Use of
marginal, coarse-textured soils of high permeability has increased over time for
production of both upland and lowland irrigated rice to meet the demand for food
and fibre to support growing populations. In irrigated rice fields with fine-textured
soil, leaching losses of N are usually low because of low permeability. However, in
highly permeable coarse-textured soils, the losses of N through leaching of nitrate-N
(NO3-N) and other processes can be substantial. Information on water and nitrogen
dynamics for rice crop on coarse-textures soils is limited. Since models can provide
an insight of the interrelationships between various components of a complex system,
the overall aim of this research is to improve crop growth simulation capability for a
range of water and nitrogen management strategies for rice-based cropping systems
in tropical environment. The specific objectives of this research project are:
1. to examine variation in water use productivity in lowland rice-based cropping
systems without significant effects on yield;
2. to explore the nitrogen dynamics in rice-rice-legume crop sequences on a typical
coarse-textured soil of lowland cropping systems in the tropics;
3. to calibrate and validate a farming system model that can be used to simulate
growth, yield, nitrogen uptake, nitrogen and water dynamics in the above rice-
based cropping systems.
To achieve these objectives, field experiments were conducted at the
Research Station of Assessment Institute for Agricultural Technology (BPTP) NTB
Lombok Indonesia (08°35′Ν, 116°13′E, 150 m elevation) on a sandy loam soil using
rice-rice-legume crop rotation over two years (2007-2009). The experiment was laid
out in a randomised split-plot design with water management treatments
(continuously submerged and alternate submerged and non-submerged, hereafter
referred to as CS and ASNS, respectively) as main plot and N-fertiliser rates (0, 70
and 140 kg N ha-1) treatments as subplot with three replications. Plant and soil
samples were collected at four main phenological stages during rice growth period
(tillering, panicle initiation, flowering and harvesting). Plant samples were measured
Abstract
ii
for dry biomass and total-N. Soil samples were taken within 0-100 cm depth from
four soil layers (0-20, 20-40, 40-70 and 70-100 cm) and each sample was analysed
for ammonium-N (NH4-N), NO3-N, total-N, and organic carbon (OC). Legumes
(peanut and soybean) were sown immediately following the second rice crop in each
calendar year. The experimental design was similar to rice by replacing CS and
ASNS treatments with peanut and soybean, respectively and reducing N-fertiliser
application rates to 0, 12 and 24 kg N ha-1. Crop and soil samples were collected at
three main phenological stages of legume (maximum vegetative, flowering and
harvesting) and analysed as for the rice crop. Data of field experiment were used to
parameterise, calibrate and validate the APSIM-Oryza model.
The results indicated that biomass, yield and N-uptake of rice were not
significantly different between ASNS and CS. Any increase in yield and N-uptake
was largely due to increased N-fertiliser application. Average irrigation water saved
with ASNS varied in the range of 36% to 44% when compared with CS irrigation
treatment. Furthermore, average water productivity in the ASNS treatment was 52%
higher than for the CS irrigation treatment. Considering these results as typical for
well-drained soils with deep ground water tables, ASNS practices can make
considerable water-saving without substantial yield reduction in irrigated lowlands
of eastern Indonesia. Furthermore, yield of both peanut and soybean crops following
the second rice crop were not affected by N fertiliser rates. The implication of this
study is that the farmers should consider ASNS as a water saving technology in this
region of study and should not consider applying N-fertiliser for peanut and soybean
crops when it follows the second rice crop.
Seasonal variation in soil nitrogen and carbon in lowland rice-based cropping
systems indicated significant effects of N-fertiliser treatments on NH4-N and NO3-N
concentration in soil, but only on a few occasions for irrigation treatments. For
example, NO3-N concentration in soil under ASNS treatment was higher than the CS
treatment during panicle initiation and flowering stages in the later part of the rice
growing seasons. Since rice prefers ammonium over the nitrate form of N, increased
nitrate concentration during the periods of non-submergence in ASNS irrigation
treatment could have adversely affected N-uptake by rice. However, no significant
difference in N-uptake was observed between CS and ASNS possibly because of the
small magnitude of NO3-N concentration differences between these irrigation
treatments. . Since floodwater is another useful source of N for the rice crop,
Abstract
iii
measurements in this experiment showed NH4-N concentration in soil and
floodwater to be mostly higher than NO3-N concentration that allowed adequate N-
uptake. Organic carbon as an indicator of soil organic matter and overall soil fertility
was not affected by irrigation and N fertiliser treatments during the experiment.
During the legume season, increased rates of N-fertiliser application
increased NH4-N and NO3-N concentration at various soil depths throughout crop
growth. Increased concentration of available forms of N as a result of increased level
of N-fertiliser applied to legumes decreased the number and weight of root nodules
on some occasions. Since increased N-fertiliser application increased N-uptake and
seed N-uptake but not yield, N-fertiliser application is not recommended for legumes
in this region on the basis of improved crop quality.
The APSIM-Oryza model was mostly able to capture the variable effects of
water and N management strategies on crop growth, nitrogen and carbon dynamic in
soil, and the dynamics of ponded water depth under anaerobic and aerobic soil
conditions in the rice-rice-legume crop sequence as practiced in the tropical region of
eastern Indonesia. The model satisfactorily simulated crop variables such as biomass,
yield, leaf area index (LAI) and N-uptake. The model also satisfactorily simulated
the variation of water depth during rice growth period. However, the simulation of N
dynamics and floodwater (ponding) in the ASNS irrigation treatment need further
improvement. The APSIM-Oryza model provided an operational and a promising
modelling framework to test future cropping practices and improve making farm
decisions to develop more sustainable and effective lowland rice-based farming
systems. This thesis has produced a dataset to calibrate and evaluate the model
performance by capturing the dynamics of various forms of nitrogen and daily
ponded water depth for water limited rice-based cropping systems. More extensive
field experimental testing is needed to increase confidence with the widespread use
of this model.
Certification of Dissertation
iv
CERTIFICATION OF DISSERTATION
I certify that the ideas, experimental work, results, analyses, software and
conclusions reported in this dissertation are entirely my own effort, except where
otherwise acknowledged. I also certify that the work is original and has not been
previously submitted for any other award, except where otherwise acknowledged.
__________________________________ _______________
Ahmad Suriadi, Candidate Date
ENDORSEMENT:
__________________________________ _______________
Dr. Rabindra K. Misra, Principal Supervisor Date
__________________________________ _______________
Dr. Yahya G. Abawi, Associate Supervisor Date

Acknowledgements
vi
ACKNOWLEDGEMENTS
It is not possible to complete this dissertation without genuine support and generous
help from a number of people to whom I wish to express my sincere gratitude.
I would like to express my sincere thanks to my principal supervisor Dr. Rabi Misra
and associate supervisor Dr. Yahya Abawi for their invaluable guidance, patience
and persistence in helping me to complete this dissertation. Without their support, it
would not be possible for me to complete this research project. Their guidance,
sacrifice and help will be remembered during the rest of my life. I would also like to
thank Mr. Don Gaydon (CSIRO St. Lucia Brisbane) for his guidance with the use of
APSIM-Oryza model. Without his help, it would not have been possible to run the
APSIM model in this project.
Without the financial support from the Australian Centre for International
Agricultural Research (ACIAR) who offered me the Postgraduate Scholarship, I
would not be able to undertake this study.
Thanks to Dr. Dwi Praptomo Sudjatmiko, MS., Head of BPTPNTB Lombok
Indonesia, for giving permission to conduct field experiments within the Research
Station. Sincere thanks are also due to the BPTPNTB staff, Mr Yunus and Mr Abdul
Gaffar, for their kind support and assistance throughout the field experiment.
My thanks go to all the staff and research students of the Faculty of Engineering &
Surveying and staff of the Office of Research and Higher Degrees who helped me in
various ways during my stay at the University of Southern Queensland. I also cannot
forget my friends and their families, who are outside the university, for their
kindness and support during my stay in Toowoomba. Thanks to Dr. Sunil Dutta for
his help with statistical analysis.
I am as ever, especially indebted to my parents, brothers and sisters for their love and
support throughout my life. Finally, my sincere thanks go to my wife Sri Marliana
Setianingsih and my children, Syarifana ‘Aisyah Suriadi, Ahmad Aliqari Suriadi,
‘Athaana Fathimah Suriadi and Ahmad Alifirdaus Suriadi for their love, patience and
support throughout this study. Lastly, I offer my regards and blessings to all of those
who supported me in any respect during the completion of this study.
Table of contents
vi
TABLE OF CONTENTS
ABSTRACT .................................................................................................................. i
CERTIFICATION OF DISSERTATION ................................................................... iv
ACKNOWLEDGEMENTS ........................................................................................ vi
TABLE OF CONTENTS ............................................................................................ vi
LIST OF FIGURES ..................................................................................................... x
LIST OF TABLES ..................................................................................................... xx
CHAPTER I ................................................................................................................. 1
Introduction .................................................................................................................. 1
1. 1 Background ...................................................................................................... 1
1. 2 Research hypotheses: ....................................................................................... 5
1. 3 Overall research aim ........................................................................................ 5
1. 4 Objectives ......................................................................................................... 6
1. 5 Outcomes of the study ...................................................................................... 6
1. 6 Structure of the Thesis ..................................................................................... 6
CHAPTER II ................................................................................................................ 9
Review of literature ...................................................................................................... 9
2.1 Lowland rice-based cropping systems ............................................................. 9
2.2 Nitrogen dynamics in lowland rice-based farming systems .......................... 11
2.2.1 Nitrogen mineralisation and immobilisation ........................................... 13
2.2.2 Nitrification ............................................................................................. 14 2.2.3 Denitrification ......................................................................................... 15
2.2.4 Fixation.................................................................................................... 16
2.3 Water management practices in lowland rice farming systems ..................... 18
2.3.1 Continuously submerged soil ................................................................. 19
2.3.2 Alternately submerged and non-submerged (ASNS) ............................. 19 2.3.3 Saturated soil culture .............................................................................. 20
2.3.4 Aerobic rice ............................................................................................ 21
2.4 Water balance ................................................................................................. 22 2.4.1 Surface runoff (Q) ................................................................................... 23
2.4.2 Deep percolation (P)................................................................................ 23
2.4.3 Evapotranspiration (ET) .......................................................................... 24
2.5 Modelling rice-based cropping systems ......................................................... 25
2.5.1 Rice model............................................................................................... 25
Table of contents
vii
2.5.2 APSIM-Oryza model............................................................................... 26
2.6 Summary ........................................................................................................ 28
CHAPTER III ............................................................................................................ 29
Methodology of Field Experiment ............................................................................. 29
3.1 Site and climate .............................................................................................. 29
3.2 Rice experiment ............................................................................................. 32 3.2.1 Experimental design ................................................................................ 32
3.2.2 Field preparation ..................................................................................... 34
3.2.3 Rice planting ........................................................................................... 34
3.2.4 Fertiliser application ................................................................................ 34
3.2.5 Irrigation .................................................................................................. 35 3.2.6 Pest and weed control .............................................................................. 39
3.2.7 Sampling and measurements ................................................................... 39
3.2.7.1 Floodwater sampling .............................................................................. 39
3.2.7.2 Soil ......................................................................................................... 40
3.3 Legume experiment ........................................................................................ 41 3.3.1 Soil preparation and legume crops cultivation ........................................ 42
3.3.2 Plant sampling ......................................................................................... 44
3.3.3 Soil sampling ........................................................................................... 44
3.3.4 Nodulation ............................................................................................... 44
3.4 Statistical analysis .......................................................................................... 44
CHAPTER IV ............................................................................................................ 45
Growth and yield of lowland rice on coarse soils in response to water-saving irrigation and nitrogen management strategies .............................................. 45
4.1 Introduction .................................................................................................... 45
4.2 Materials and methods ................................................................................... 47
4.3 Results ............................................................................................................ 48 4.3.1 Weather ................................................................................................... 48 4.3.2 Ground water table .................................................................................. 48
4.3.3 Flood water dynamics during rice growth periods .................................. 49
4.3.4 Water productivity at various irrigation and N fertiliser treatments ....... 52
4.3.5 Nitrogen uptake ....................................................................................... 54
4.3.6 Crop growth and development ................................................................ 55
4.3.7 Yield and grain quality ............................................................................ 57
4.4 Discussion ...................................................................................................... 60
4.5 Concluding remarks ....................................................................................... 61
Table of contents
viii
CHAPTER V .............................................................................................................. 62
Nitrogen dynamics in rice-based cropping systems under irrigation and nitrogen fertiliser management practices...................................................................... 62
5.1 Introduction .................................................................................................... 62
5.2 Materials and methods ................................................................................... 64
5.3 Results and discussion ................................................................................... 65 5.3.1 NH4-N dynamics in soil under various irrigation and N fertiliser
treatments ................................................................................................ 65 5.3.2 NO3-N dynamics in soil under various irrigation and N fertiliser
treatments ................................................................................................ 71 5.3.3 Total-N dynamics in soil under various irrigation and N fertiliser
treatments ................................................................................................ 77 5.3.4 Organic carbon dynamics in soil under various irrigation and N fertiliser
treatments ................................................................................................ 82 5.3.5 NH4-N and NO3-N in floodwater during rice growth periods ................ 83
5.4 Concluding remarks ....................................................................................... 87
CHAPTER VI ............................................................................................................ 88
Growth and yield of legumes and nitrogen dynamics following rice in tropical lowland rice-based cropping system .............................................................. 88
6.1 Introduction .................................................................................................... 88
6.2 Materials and methods ................................................................................... 89
6.3 Result and discussion ..................................................................................... 90 6.3.1 Dynamics of organic carbon and nitrogen under legumes and N fertiliser
treatments ................................................................................................ 90 6.3.2 Nodulation ............................................................................................... 95 6.3.3 Above ground biomass of legumes ......................................................... 99
6.3.4 Yield and harvest index of legumes ...................................................... 102
6.3.5 Various aspects of crop N ..................................................................... 103
6.4 Concluding remarks ..................................................................................... 105
CHAPTER VII ......................................................................................................... 106
Simulation of tropical lowland rice-based cropping systems at various nitrogen and water managements ...................................................................................... 106
7.1 Introduction .................................................................................................. 106
7.2 Material and methods ................................................................................... 109 7.2.1 Description of field experiment............................................................. 109
7.2.2 Model overview and description ........................................................... 110
7.2.2.1 Rice module ......................................................................................... 110
7.2.2.2 Peanut and soybean modules ............................................................... 112

Table of contents
ix
7.2.2.3 SoilN module ....................................................................................... 112
7.2.2.4 SoilWat module .................................................................................... 113
7.2.2.5 Pond module ........................................................................................ 113
7.2.3 Model parameterisation and calibration ................................................ 116
7.2.3.1 Rice module ......................................................................................... 116
7.2.3.2 Peanut and soybean modules ............................................................... 117
7.2.3.3 SoilN module ....................................................................................... 118
7.2.3.4 SoilWat modules .................................................................................. 119
7.2.3.5 Pond modules ....................................................................................... 119
7.2.4 Model validation ................................................................................... 120
7.2.5 Data analysis ......................................................................................... 120
7.3 Results .......................................................................................................... 121 7.3.1 Model calibration .................................................................................. 121
7.3.1.1 Floodwater dynamics during rice growth period ................................. 121
7.3.1.2 pH and temperature of floodwater ....................................................... 127
7.3.1.3 Soil organic carbon (OC) dynamics ..................................................... 128
7.3.1.4 Simulated and measured of ammonium-N concentration in soil ......... 131 7.3.1.5 Simulated and measured nitrate-N concentration in soil ..................... 137 7.3.1.6 Biomass and yield ................................................................................ 143
7.3.1.7 Leaf area index (LAI) of rice and legume crops .................................. 149
7.3.1.8 N-uptake of rice and legume crops ...................................................... 153
7.3.2 Model validation ................................................................................... 157
7.3.2.1 Floodwater dynamics during rice growth period ................................. 157
7.3.2.2 Organic carbon dynamics of soil ......................................................... 164
7.3.2.3 Nitrate-N and ammonium-N dynamics of soil ..................................... 166
7.3.2.4 Biomass, yield and leaf area index of rice and legume crops .............. 166
7.3.2.5 N-uptake of rice and legume crops ...................................................... 169
7.4 Discussion .................................................................................................... 171
7.5 Concluding remarks ..................................................................................... 176
CHAPTER VIII ........................................................................................................ 177
General discussion and conclusions ......................................................................... 177
8.1 Productivity of rice and legumes.................................................................. 178
8.2 Nitrogen and carbon dynamics in rice-based cropping systems .................. 179
8.3 Modelling rice-based cropping systems with APSIM-Oryza ...................... 181
8.4 Conclusions .................................................................................................. 183
REFERENCES ......................................................................................................... 185
APPENDIX 1. Logic commands for rice-rice legume crop sequences for APSIM-Oryza ............................................................................................................ 208
List of Figures
x
LIST OF FIGURES
Chapter 2
Figure 2.1 Schematic of soil mineral N dynamics under aerobic and anaerobic conditions in lowland rice-based cropping systems (George et al., 1992). ................................................................................................................. 13
Figure 2.2 Schematic pathway and enzymes involved with denitrification of nitrogen (Martens, 2005). ...................................................................................... 16
Figure 2.3 Components of water balance in flooded rice field (Tabbal, 2002) ......... 23
Chapter 3
Figure 3.1 Map of Indonesia and Lombok Island where the site experimental site is located (dot red).. .................................................................................... 29
Figure 3.2 Average monthly rainfall and daily evaporation (ET) over 13 years (1997-2009) at the experimental site. ................................................................ 30
Figure 3.3 Average daily radiation (Radn), maximum (maxT) and minimum (minT) temperature over 13 years (1997-2009) at the experimental site. .......... 31
Figure 3.4 Layout of the field experiment. CS = continuously submerged; ASNS = alternately submerged and non-submerged; F0, F1 and F2 = 0, 70 and 140 kg N ha−1 respectively. Arrows indicate inflow and out flow water ....... 33
Figure 3.5 Value of discharge coefficient (C) and head correction factor (k) for various notch angles of a V-notch weir ................................................... 37
Figure 3.6 A schematic representation of V-notch weir installed in the experimental sites and associated measurements. ......................................................... 37
Figure 3.7 PVC pipes installed at all experimental plots to measure daily ponding depth and water depth below soil surface. .............................................. 38
Figure 3.8 Covered metal cylinder installed just outside of the experimental plots for the measurement of daily percolation rates for the experimental site. 1, Cylinder just installed; 2, cylinder covered to minimise evaporation; 3, observing water depth in cylinder. .......................................................... 39
Chapter 4
Figure 4.1 Daily fluctuation in groundwater table depth at the experimental site from 23 November 2007 to 31 December 2008. ............................................. 49
Figure 4.2 Variation in daily water depth and rainfall for CS and ASNS irrigation treatments during 2007/2008 (A) and 2008 (B) rice growing seasons. Negative value of water depth indicates presence of water level below soil surface............................................................................................... 50

List of Figures
xi
Figure 4.3 Variation in daily water depth and rainfall for CS and ASNS irrigation treatments during 2008/2009 (C) and 2009 (D) rice growing seasons. Negative value of water depth indicates presence of water level below soil surface............................................................................................... 51
Figure 4.4 The effects of irrigation treatments (CS and ASNS) and N fertiliser application rates (F0, F1 and F2) on water productivity over four rice growing seasons. For specific water productivity component, similar letter(s) for a given season (2007/2008, 2008, 2008/2009 and 2009) indicate the difference between mean values to be less than LSD. LSD values for the interaction of irrigation×nitrogen on water productivity for four consecutive seasons were 0.02, 0.04, 0.02 and 0.02 kg grain m- 3
water. Vertical bars indicate SE (n = 3). ................................................. 54
Figure 4.5 Effects of irrigation treatments (CS and ASNS) and nitrogen fertiliser rates (F0, F1 and F2) on above ground biomass at various stages of growth during four rice growing seasons of 2007/2008, 2008, 2008/2009 and 2009. ................................................................................................. 56
Figure 4.6 Effects of irrigation treatments (CS and ASNS) and nitrogen fertiliser rates (F0, F1 and F2) on leaf area index at different stages of rice growth in four rice growing seasons.................................................................... 57
Chapter 5
Figure 5.1 Influence of N fertiliser (F0 = 0 kg N ha-1); F1 = 70 kg N ha-1 and F2 = 140 kg N ha-1) on NH4-N concentration in soil in various soil depth at tillering (A), panicle initiation (B), flowering (C) and harvesting (D) stages in rice wet season 2007/2008 (2). ................................................. 69
Figure 5.2 Influence of N fertiliser ((F0 = 0 kg N ha-1); F1 = 70 kg N ha-1 and F2 = 140 kg N ha-1) on NH4-N concentration in soil in various soil depth at tillering (A), panicle initiation (B), flowering (C) and harvesting (D) stages in rice wet season 2008/2009 (4). ................................................. 70
Figure 5.3 Influence of irrigation treatments (CS = continuously submerged and ASNS = alternately submerged and non-submerged) on NH4-N concentration in soil at 0-20 cm soil depth at panicle initiation (PI), flowering (F) and harvesting (H) stages in rice reasons of 2008/2009 and 2009. For specific NH4-N concentration in soil, similar letter(s) within the set of phenological stages (PI, F, H, PI and F) indicate that the difference between mean values are less than LSD. LSD values in each phenological stages were 0.049, 0.046, 0.036, 0.048 and 0.048 mg kg-1, respectively.............................................................................................. 71
Figure 5.4 Influence of N fertiliser (F0 = 0 kg N ha-1); F1 = 70 kg N ha-1 and F2 = 140 kg N ha-1) on NO3-N concentration in soil in various soil depth at tillering (A), panicle initiation (B), flowering (C) and harvesting (D) stages in rice season 2007/2008 (1) and 2008 (2) ................................... 73
List of Figures
xii
Figure 5.5 Influence of N fertiliser (F0 = 0 kg N ha-1); F1 = 70 kg N ha-1 and F2 = 140 kg N ha-1) on NO3-N concentration in soil in various soil depth at tillering (A), panicle initiation (B), flowering (C) and harvesting (D) stages in rice season 2008/2009 (3) and 2009 (4). .................................. 75
Figure 5. 6 Influence of irrigation treatment (CS = continuously submerged and ASNS = alternately submerged and non-submerged) on NO3-N concentration in soil in various soil depth at panicle initiation (B) and flowering (C) stages of rice reason 2008 (2), 2008/2009 (3) and 2009 (4). ................................................................................................................. 76
Figure 5.7 Influence of N fertiliser (F0 = 0 kg N ha-1); F1 = 70 kg N ha-1 and F2 = 140 kg N ha-1) on total-N concentration in various soil depth at tillering (A), panicle initiation (B), flowering (C) and harvesting (D) stages in rice season 2007/2008 (1) and 2008 (2). ........................................................ 80
Figure 5.8 Influence of N fertiliser (F0 = 0 kg N ha-1); F1 = 70 kg N ha-1 and F2 = 140 kg N ha-1) on total-N concentration in various soil depth at tillering (A), panicle initiation (B), flowering (C) and harvesting (D) stages of rice season 2008/2009 (3) and 2009 (4). ................................................. 81
Figure 5.9 Influence of irrigation treatments (CS = continuously submerged and ASNS = alternately submerged and non-submerged) on total-N concentration in soil at 0-20 cm soil depth at panicle initiation (PI), flowering (F) and harvesting (H) stages during rice reasons of 2008/2009 and 2009. For specific total-N, similar letter(s) within the set of four phenological stages (H, PI, F and H) indicate that the differences between mean values are less than LSD. LSD values in each phenological stages were 0.005, 0.031, 0.045, 0.047 g kg-1, respectively. ................................................................................................................. 82
Figure 5.10 Effects of irrigation treatments (CS = continuously submerged and ASNS = alternately submerged and non-submerged) on organic carbon (OC) concentration in soil at 0-20 cm soil depth at panicle initiation (PI), flowering (F) and harvesting (H) stages in rice reasons of 2008/2009 and 2009. For specific total-N, similar letter(s) within the set of four phenological stages (H, PI, F and H) indicate that the differences between mean values are less than LSD. LSD values in each phenological stages were 0.042, 0.049, 0.045 and 0.047 g kg-1, respectively.............................................................................................. 83
Figure 5.11 NH4-N dynamics in floodwater during rice growth as influenced by N fertiliser and irrigation treatments during four rice growth periods in 2007/2008, 2008, 2008/2009 and 2009 seasons. For N fertiliser treatments, significance of treatments is denoted as ‘***’ for p ≤ 0.001; ‘**’ for p ≤ 0.01 and ‘*’ for p ≤ 0.05. ..................................................... 85
List of Figures
xiii
Figure 5.12 NO3-N dynamics in floodwater during rice growth as influenced by N fertiliser and irrigation treatments during four rice growth periods in 2007/2008, 2008, 2008/2009 and 2009 seasons. For N fertiliser treatments, significance of treatments is denoted as ‘***’ for p ≤ 0.001; ‘**’ for p ≤ 0.01 and ‘*’ for p ≤ 0.05. ..................................................... 86
Chapter 6
Figure 6.1 Spatial and temporal variation of NH4-N concentration in soil as affected by N fertiliser application rates at vegetative (A; 31 DAS), flowering (B; 45 and 48 DAS for peanut and soybean respectively) and harvesting stages (C; 98 and 94 DAS for peanut and soybean, respectively) during 2008 (1) and 2009 (2)seasons................................................................. 93
Figure 6.2 Spatial and temporal variation of NO3-N concentration in soil as affected by N fertiliser application rates at vegetative (A; 31 DAS), flowering (B; 45 and 48 DAS for peanut and soybean respectively) and harvesting stages (C; 98 and 94 DAS for peanut and soybean, respectively) during (1) 2008 and (2) 2009 seasons................................................................. 94
Figure 6.3 Mean weight and number of nodule/hill during soybean and peanut growth periods in 2008 season as affected by N fertiliser. * indicates p≤0.05. ..................................................................................................... 96
Figure 6.4 Mean weight and number of nodule/hill during soybean and peanut growth periods in 2009 season as affected by N fertiliser. * indicates p≤0.05. ..................................................................................................... 97
Figure 6.5 Relation between nodules number and NH4-N and NO3-N concentration in soils at 0-20 cm depth in peanut (solid lines) and soybean (dash lines) at various phenological stages (maximum vegetative (ж) flowering (■) and maturity (▲)) during 2008 and 2009 seasons. ................................. 98
Figure 6.6 Biomass development during peanut and soybean growth periods as affected by N fertiliser treatments in 2008 and 2009 seasons. .............. 100
Chapter 7
Figure 7.1 Simulated and measured daily water depth during rice growth period for continuously submerged (CS) and alternately submerged and non-submerged irrigation treatments in early wet-season of 2007/2008 and dry-season of 2008 for the calibration data sets. Negative value of water depth indicates presence of water level below soil surface. .................. 125
Figure 7.2 Simulated and measured pH and temperature during rice growth periods. ............................................................................................................... 127
Figure 7.3 Simulated and measured soil organic carbon at different soil layers during crop growth periods in whole year of rice-rice-legume crops sequence of 2007-2008.............................................................................................. 129
Figure 7.4 Simulated and measured NH4-N concentration in soil at various soil layers (1 = 0-20 cm; 2 = 20-40 cm depth) and N fertiliser rates (a = 0 kg

List of Figures
xiv
ha-1, b = 70 kg N ha-1 and c = 140 kg N ha-1) in CS irrigation treatment during crop growth periods in whole year of rice-rice-peanut crops sequence of 2007-2008.......................................................................... 132
Figure 7.5 Simulated and measured NH4-N concentration in soil at various soil depths (3 = 40-70 cm; 4 = 70-100 cm depth) and N fertiliser rates (a = 0 kg ha-1, b = 70 kg N ha-1 and c = 140 kg N ha-1) in CS irrigation treatment during crop growth periods in whole year of rice-rice-peanut crops sequence of 2007-2008. ............................................................... 133
Figure 7.6 Simulated and measured NH4-N concentration in soil at various soil layers (1 = 0-20 cm; 2 = 20-40 cm depth) and N fertiliser rates (a = 0 kg ha-1, b = 70 kg N ha-1 and c = 140 kg N ha-1) in ASNS irrigation treatment during crop growth periods in whole year of rice-rice-soybean crops sequence of 2007-2008. ............................................................... 134
Figure 7.7 Simulated and measured NH4-N concentration in soil at various soil depths (3 = 40-70 cm; 4 = 70-100 cm depth) and N fertiliser rates (a = 0 kg ha-1, b = 70 kg N ha-1 and c = 140 kg N ha-1) in ASNS irrigation treatment during crop growth periods in whole year of rice-rice-soybean crops sequence of 2007-2008. ............................................................... 135
Figure 7.8 Simulated and measured NO3-N concentration in soil at various soil layers (1 = 0-20 cm; 2 = 20-40 cm depth) and N fertiliser rates (a = 0 kg ha-1, b = 70 kg N ha-1 and c = 140 kg N ha-1) in CS irrigation treatment during crop growth periods in whole year of rice-rice-peanut crops sequence of 2007-2008.......................................................................... 138
Figure 7.9 Simulated and measured NO3-N concentration in soil at various soil depths (3 = 40-70 cm; 4 = 70-100 cm) and N fertiliser rates (a = 0 kg ha-
1, b = 70 kg N ha-1 and c = 140 kg N ha-1) in CS irrigation treatment during crop growth periods in whole year of rice-rice-peanut crops sequence of 2007-2008.......................................................................... 139
Figure 7.10 Simulated and measured NO3-N concentration in soil at various soil layers (1 = 0-20 cm; 2 = 20-40 cm) and N fertiliser rates (a = 0 kg ha-1, b = 70 kg N ha-1 and c = 140 kg N ha-1) in ASNS irrigation treatment during crop growth periods in whole year of rice-rice-soybean crops sequence of 2007-2008.......................................................................... 140
Figure 7.11 Simulated and measured NO3-N concentration in soil at various soil depths (3 = 40-70 cm; 4 = 70-100 cm depth) and N fertiliser rates (a = 0 kg ha-1, b = 70 kg N ha-1 and c = 140 kg N ha-1) in ASNS irrigation treatment during crop growth periods in whole year of rice-rice-soybean crops sequence of 2007-2008. ............................................................... 141
Figure 7.12 Simulated and measured total biomass of rice in CS irrigation treatment and peanut in whole year of rice-rice-peanut crops sequence at various urea fertiliser rates; (a) is 0 kg ha-1 for both rice and peanut crops; (b) is 70 and 12 kg N ha-1 for rice and peanut crop respectively; (c) is 140 and 24 kg N ha-1 for rice and peanut respectively........................................ 145
Figure 7.13 Simulated and measured total biomass of rice in ASNS irrigation treatment and soybean in whole year of rice-rice-soybean crops sequence at various N fertiliser rates; (a) is 0 kg ha-1 for both rice and soybean
List of Figures
xv
crops; (b) is 70 and 12 kg N ha -1 for rice and soybean crops respectively; (c) is 140 and 24 kg N ha-1 for rice and soybean respectively. ............. 146
Figure 7.14 Simulated and measured yield of rice in whole year of rice-rice-legume crops sequence of 2007-2008 calibration data set solid line is 1:1 relationship. ........................................................................................... 147
Figure 7.15 Simulated and measured leaf area index (LAI) of rice in CS irrigation treatment and peanut in whole year of rice-rice-peanut crops sequence in 2007-2008 at various N fertiliser rates; (a) is 0 kg ha-1 for both rice and peanut crops; (b) is 70 and 12 kg N ha-1 for rice and peanut crops respectively; (c) is 140 and 24 kg N ha-1 for rice and peanut respectively. ............................................................................................................... 150
Figure 7.16 Simulated and measured leaf area index (LAI) of rice for ASNS irrigation treatment and soybean in whole year of rice-rice-soybean crops sequence at various N fertiliser rates; (a) is 0 kg ha-1 for both rice and soybean crops; (b) is 70 and 12 kg N ha -1 for rice and soybean crops respectively; (c) is 140 and 24 kg N ha-1 for rice and soybean respectively............................................................................................ 151
Figure 7.17 Simulated and measured N-uptake of rice in CS irrigation treatment and peanut in whole year of rice-rice-peanut crops sequence in 2007-2008 at various N fertiliser rates; (a) is 0 kg ha-1 for both rice and peanut crops; (b) is 70 and 12 kg N ha-1 for rice and peanut crops respectively; (c) is 140 and 24 kg N ha-1 for rice and peanut respectively. ......................... 154
Figure 7.18 Simulated and measured N-uptake of rice in ASNS irrigation treatment and soybean in whole year of rice-rice-soybean crops sequence at various N fertiliser rates; (a) is 0 kg ha-1 for both rice and soybean crops; (b) is 70 and 12 kg N ha-1 for rice and soybean crops respectively; (c) is 140 and 24 kg N ha-1 for rice and soybean respectively. ............................. 155
Figure 7.19 Simulated and measured daily depth during rice growth periods at 10.4 mm day-1 infiltration rate for continuously submerged (CS) and alternately submerged and non-submerged (ASNS) irrigation treatments in wet- 2008/2009 and dry-season 2009 for the validation data sets. Negative value of water depth indicates presence of water level below soil surface............................................................................................. 159
Figure 7.20 Simulated and measured daily water depth during rice growth period when percolation rates reset to 17.1 mm day-1 in continuously submerged (CS) irrigation treatment in wet-season of 2008/2009 and dry-season of 2009 for the validation data sets. ........................................................... 160
Chapter 8
Figure 8.1 Variation in yield of rice over four seasons with total water used from rainfall and irrigation for various irrigation and fertilizer treatments. .. 178
Figure 8.2 A comparison of simulated and measured concentration of NH4-N within the top 20 cm of soil during the validation period of two rice seasons in 2008-09.................................................................................................. 180
List of Figures
xvi
Figure 8.3 A comparison of simulated and measured N-uptake by rice for CS and ASNS treatments during the validation period of two rice seasons in 2008-2009.............................................................................................. 180
Figure 8.4 Simulated grain yield versus measured grain yield of rice over two seasons in 2008-09 used for model validation. Open and filled symbols denote data from CS and ASNS treatments, respectively. The solid line indicates the fitted regression line for the presented data and the dashed line represents the 1:1 line. .................................................................... 182
List of Tables
xx
LIST OF TABLES
Chapter 3
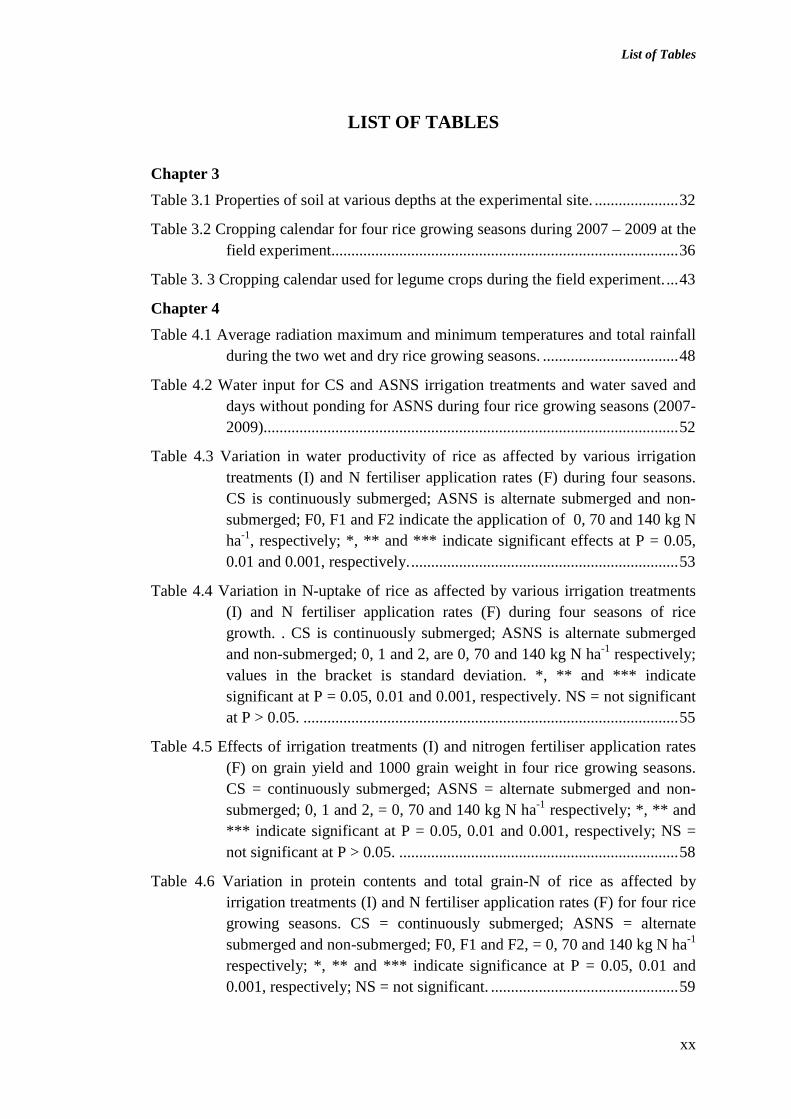
Table 3.1 Properties of soil at various depths at the experimental site. ..................... 32
Table 3.2 Cropping calendar for four rice growing seasons during 2007 – 2009 at the field experiment....................................................................................... 36
Table 3. 3 Cropping calendar used for legume crops during the field experiment. ... 43
Chapter 4
Table 4.1 Average radiation maximum and minimum temperatures and total rainfall during the two wet and dry rice growing seasons. .................................. 48
Table 4.2 Water input for CS and ASNS irrigation treatments and water saved and days without ponding for ASNS during four rice growing seasons (2007-2009)........................................................................................................ 52
Table 4.3 Variation in water productivity of rice as affected by various irrigation treatments (I) and N fertiliser application rates (F) during four seasons. CS is continuously submerged; ASNS is alternate submerged and non-submerged; F0, F1 and F2 indicate the application of 0, 70 and 140 kg N ha-1, respectively; *, ** and *** indicate significant effects at P = 0.05, 0.01 and 0.001, respectively. ................................................................... 53
Table 4.4 Variation in N-uptake of rice as affected by various irrigation treatments (I) and N fertiliser application rates (F) during four seasons of rice growth. . CS is continuously submerged; ASNS is alternate submerged and non-submerged; 0, 1 and 2, are 0, 70 and 140 kg N ha-1 respectively; values in the bracket is standard deviation. *, ** and *** indicate significant at P = 0.05, 0.01 and 0.001, respectively. NS = not significant at P > 0.05. .............................................................................................. 55
Table 4.5 Effects of irrigation treatments (I) and nitrogen fertiliser application rates (F) on grain yield and 1000 grain weight in four rice growing seasons. CS = continuously submerged; ASNS = alternate submerged and non-submerged; 0, 1 and 2, = 0, 70 and 140 kg N ha-1 respectively; *, ** and *** indicate significant at P = 0.05, 0.01 and 0.001, respectively; NS = not significant at P > 0.05. ...................................................................... 58
Table 4.6 Variation in protein contents and total grain-N of rice as affected by irrigation treatments (I) and N fertiliser application rates (F) for four rice growing seasons. CS = continuously submerged; ASNS = alternate submerged and non-submerged; F0, F1 and F2, = 0, 70 and 140 kg N ha-1 respectively; *, ** and *** indicate significance at P = 0.05, 0.01 and 0.001, respectively; NS = not significant. ............................................... 59
List of Tables
xxi
Chapter 5
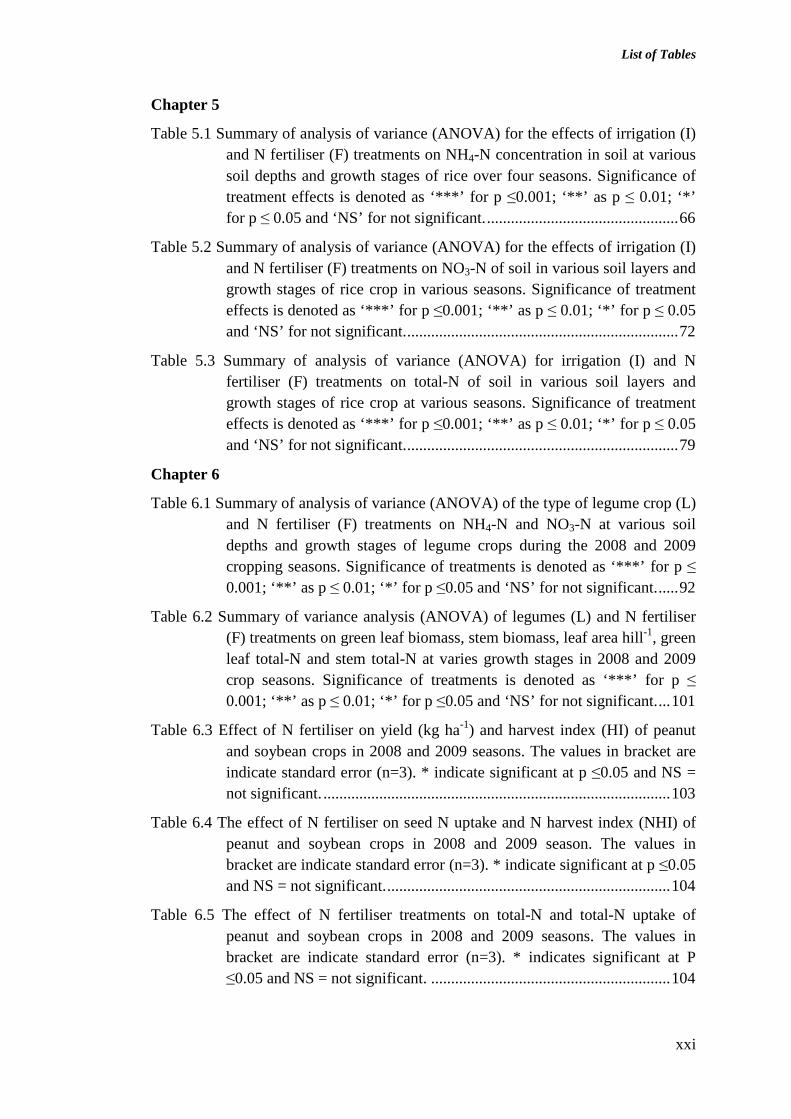
Table 5.1 Summary of analysis of variance (ANOVA) for the effects of irrigation (I) and N fertiliser (F) treatments on NH4-N concentration in soil at various soil depths and growth stages of rice over four seasons. Significance of treatment effects is denoted as ‘***’ for p ≤0.001; ‘**’ as p ≤ 0.01; ‘*’ for p ≤ 0.05 and ‘NS’ for not significant. ................................................ 66
Table 5.2 Summary of analysis of variance (ANOVA) for the effects of irrigation (I) and N fertiliser (F) treatments on NO3-N of soil in various soil layers and growth stages of rice crop in various seasons. Significance of treatment effects is denoted as ‘***’ for p ≤0.001; ‘**’ as p ≤ 0.01; ‘*’ for p ≤ 0.05 and ‘NS’ for not significant. .................................................................... 72
Table 5.3 Summary of analysis of variance (ANOVA) for irrigation (I) and N fertiliser (F) treatments on total-N of soil in various soil layers and growth stages of rice crop at various seasons. Significance of treatment effects is denoted as ‘***’ for p ≤0.001; ‘**’ as p ≤ 0.01; ‘*’ for p ≤ 0.05 and ‘NS’ for not significant. .................................................................... 79
Chapter 6
Table 6.1 Summary of analysis of variance (ANOVA) of the type of legume crop (L) and N fertiliser (F) treatments on NH4-N and NO3-N at various soil depths and growth stages of legume crops during the 2008 and 2009 cropping seasons. Significance of treatments is denoted as ‘***’ for p ≤ 0.001; ‘**’ as p ≤ 0.01; ‘*’ for p ≤0.05 and ‘NS’ for not significant. ..... 92
Table 6.2 Summary of variance analysis (ANOVA) of legumes (L) and N fertiliser (F) treatments on green leaf biomass, stem biomass, leaf area hill-1, green leaf total-N and stem total-N at varies growth stages in 2008 and 2009 crop seasons. Significance of treatments is denoted as ‘***’ for p ≤ 0.001; ‘**’ as p ≤ 0.01; ‘*’ for p ≤0.05 and ‘NS’ for not significant. ... 101
Table 6.3 Effect of N fertiliser on yield (kg ha-1) and harvest index (HI) of peanut and soybean crops in 2008 and 2009 seasons. The values in bracket are indicate standard error (n=3). * indicate significant at p ≤0.05 and NS = not significant. ....................................................................................... 103
Table 6.4 The effect of N fertiliser on seed N uptake and N harvest index (NHI) of peanut and soybean crops in 2008 and 2009 season. The values in bracket are indicate standard error (n=3). * indicate significant at p ≤0.05 and NS = not significant. ....................................................................... 104
Table 6.5 The effect of N fertiliser treatments on total-N and total-N uptake of peanut and soybean crops in 2008 and 2009 seasons. The values in bracket are indicate standard error (n=3). * indicates significant at P ≤0.05 and NS = not significant. ............................................................ 104
List of Tables
xxii
Chapter 7
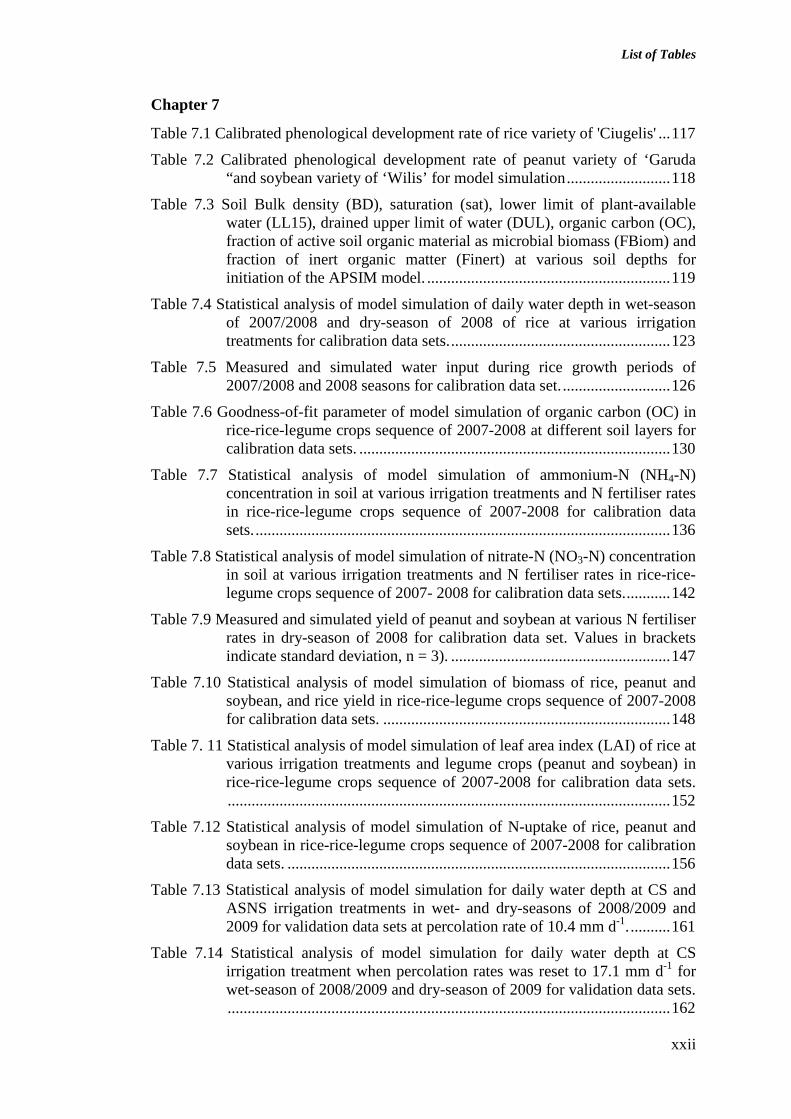
Table 7.1 Calibrated phenological development rate of rice variety of 'Ciugelis' ... 117
Table 7.2 Calibrated phenological development rate of peanut variety of ‘Garuda “and soybean variety of ‘Wilis’ for model simulation .......................... 118
Table 7.3 Soil Bulk density (BD), saturation (sat), lower limit of plant-available water (LL15), drained upper limit of water (DUL), organic carbon (OC), fraction of active soil organic material as microbial biomass (FBiom) and fraction of inert organic matter (Finert) at various soil depths for initiation of the APSIM model. ............................................................. 119
Table 7.4 Statistical analysis of model simulation of daily water depth in wet-season of 2007/2008 and dry-season of 2008 of rice at various irrigation treatments for calibration data sets. ....................................................... 123
Table 7.5 Measured and simulated water input during rice growth periods of 2007/2008 and 2008 seasons for calibration data set. ........................... 126
Table 7.6 Goodness-of-fit parameter of model simulation of organic carbon (OC) in rice-rice-legume crops sequence of 2007-2008 at different soil layers for calibration data sets. .............................................................................. 130
Table 7.7 Statistical analysis of model simulation of ammonium-N (NH4-N) concentration in soil at various irrigation treatments and N fertiliser rates in rice-rice-legume crops sequence of 2007-2008 for calibration data sets. ........................................................................................................ 136
Table 7.8 Statistical analysis of model simulation of nitrate-N (NO3-N) concentration in soil at various irrigation treatments and N fertiliser rates in rice-rice-legume crops sequence of 2007- 2008 for calibration data sets. ........... 142
Table 7.9 Measured and simulated yield of peanut and soybean at various N fertiliser rates in dry-season of 2008 for calibration data set. Values in brackets indicate standard deviation, n = 3). ....................................................... 147
Table 7.10 Statistical analysis of model simulation of biomass of rice, peanut and soybean, and rice yield in rice-rice-legume crops sequence of 2007-2008 for calibration data sets. ........................................................................ 148
Table 7. 11 Statistical analysis of model simulation of leaf area index (LAI) of rice at various irrigation treatments and legume crops (peanut and soybean) in rice-rice-legume crops sequence of 2007-2008 for calibration data sets. ............................................................................................................... 152
Table 7.12 Statistical analysis of model simulation of N-uptake of rice, peanut and soybean in rice-rice-legume crops sequence of 2007-2008 for calibration data sets. ................................................................................................ 156
Table 7.13 Statistical analysis of model simulation for daily water depth at CS and ASNS irrigation treatments in wet- and dry-seasons of 2008/2009 and 2009 for validation data sets at percolation rate of 10.4 mm d-1. .......... 161
Table 7.14 Statistical analysis of model simulation for daily water depth at CS irrigation treatment when percolation rates was reset to 17.1 mm d-1 for wet-season of 2008/2009 and dry-season of 2009 for validation data sets. ............................................................................................................... 162

List of Tables
xxiii
Table 7.15 Measured and simulated irrigation input during rice growth periods in 2008/2009 and 2009 seasons for validation data set. ............................ 163
Table 7.16 Statistical analysis of model simulation for organic carbon (OC) in rice-rice-legume crops sequence of 2008-2009 at various soil layers for validation data sets. ............................................................................... 165
Table 7.17 Statistical analysis of model simulation for nitrate-N and ammonium-N concentration in soil at various irrigation treatments and N fertiliser rates in rice-rice-legume crops sequence of 2008-2009 for validation data sets. ............................................................................................................... 167
Table 7.18 Statistical analysis of model simulation for biomass, yield and leaf area index (LAI) at various irrigation treatments of rice-rice-legume crops sequence in 2008-2009 for validation data sets. ................................... 168
Table 7.19 Measured and simulated yield of peanut and soybean at various N fertiliser rates in dry-season of 2009 for validation. The values in bracket indicate standard deviation (n = 3). ....................................................... 170
Table 7.20 Statistical analysis of model simulation for N-uptake of rice at various irrigation treatments and legume crops in rice-rice-legume crops sequence of 2008-2009 for validation data sets. ................................... 170


