
Item 6a, Attachment 1, Page 1 of 62
WILSHIRE ASSOCIATES W i l s h i r e C o n s u l t i n g
C a l i f o r n i a P u b l i c E m p l o y e e s ’ R e t i r e m e n t S y s t e m P e r f o r m a n c e R e v i e w – D e c e m b e r 3 1 , 2 0 1 7

Item 6a, Attachment 1, Page 2 of 62
W i l s h i r e C o n s u l t i n g
DECEMBER 2017 ASSET CLASS ASSUMPTIONS
DEV EMG GLOBAL LT NON-USUS EX-US MRKT EX-US GLOBAL PRIVATE CORE CORE US HIGH BOND US GLOBAL PRIVATE REAL US
STOCK STOCK STOCK STOCK STOCK EQUITY CASH BOND BOND TIPS YIELD (HDG) RES RES RE CMDTY ASSETS CPIEXPECTED COMPOUND RETURN (%) 6.25 6.25 6.25 6.45 6.45 8.75 1.75 3.55 3.60 2.95 4.95 1.30 5.40 5.60 6.90 3.70 6.60 1.95EXPECTED ARITHMETIC RETURN (%) 7.55 7.70 9.20 8.05 7.80 12.10 1.75 3.70 4.05 3.10 5.40 1.35 6.75 6.75 7.80 4.75 6.95 1.95EXPECTED RISK (%) 17.00 18.00 26.00 18.75 17.15 28.00 1.25 5.15 9.85 6.00 10.00 3.50 17.00 15.80 14.00 15.00 8.40 1.75CASH YIELD (%) 2.00 3.00 2.00 2.75 2.35 0.00 1.75 3.55 4.75 3.05 8.15 1.65 3.95 3.95 2.65 1.75 2.85 0.00
CORRELATIONSUS STOCK 1.00DEV EX-US STOCK (USD) 0.81 1.00EMERGING MARKET STOCK 0.74 0.74 1.00GLOBAL EX-US STOCK 0.83 0.96 0.86 1.00GLOBAL STOCK 0.94 0.92 0.82 0.94 1.00PRIVATE EQUITY 0.74 0.64 0.62 0.67 0.74 1.00CASH EQUIVALENTS -0.05 -0.09 -0.05 -0.08 -0.07 0.00 1.00CORE BOND 0.28 0.13 0.00 0.09 0.20 0.31 0.19 1.00LT CORE BOND 0.31 0.16 0.01 0.12 0.23 0.32 0.11 0.93 1.00US TIPS -0.05 0.00 0.15 0.05 0.00 -0.03 0.20 0.60 0.47 1.00HIGH YIELD BOND 0.54 0.39 0.49 0.45 0.51 0.34 -0.10 0.25 0.32 0.05 1.00NON-US BOND (HDG) 0.16 0.25 -0.01 0.18 0.18 0.26 0.10 0.67 0.64 0.39 0.26 1.00US RE SECURITIES 0.59 0.47 0.44 0.49 0.56 0.50 -0.05 0.17 0.23 0.10 0.56 0.05 1.00GLOBAL RE SECURITIES 0.65 0.59 0.56 0.62 0.66 0.58 -0.05 0.17 0.22 0.11 0.62 0.03 0.94 1.00PRIVATE REAL ESTATE 0.54 0.44 0.44 0.47 0.52 0.51 -0.05 0.19 0.25 0.09 0.57 0.05 0.77 0.76 1.00COMMODITIES 0.25 0.34 0.39 0.38 0.32 0.27 0.00 -0.02 -0.02 0.25 0.29 -0.10 0.25 0.28 0.25 1.00REAL ASSET BASKET 0.42 0.43 0.50 0.48 0.47 0.43 0.01 0.24 0.25 0.41 0.53 0.06 0.65 0.69 0.69 0.59 1.00INFLATION (CPI) -0.10 -0.15 -0.13 -0.15 -0.13 -0.10 0.10 -0.12 -0.12 0.15 -0.08 -0.08 0.05 0.03 0.05 0.44 0.26 1.00
REAL ESTATEEQUITY FIXED INCOME REAL ASSETS
©2017 Wilshire Associates. 2

Item 6a, Attachment 1, Page 3 of 62
W i l s h i r e C o n s u l t i n g
ECONOMIC REVIEW AS OF DECEMBER 31, 2017
CPI (ALL ITEMS)SEASONALLY ADJUSTED Dec-17 0.1 3-Mo. 0.6
Nov-17 0.4 12-Mo. 2.1Oct-17 0.1 10-Yr. (Annual) 1.6
BREAKEVEN INFLATION 10-Yr. 2.0CONSUMER SENTIMENT Dec-17 95.9U. OF MICHIGAN SURVEY Nov-17 98.5
1-Yr. Ago 98.2 10-Yr. Avg 79.1MANUFACTURING Dec-17 59.7INST. FOR SUPPLY MGMT Nov-17 58.2 >50 ExpansionPURCHASING MNGRS' IDX 1-Yr. Avg. 57.6 <50 ContractionNote: Seasonally adjusted CPI data is utilized to better reflect short-term pricing activity.
December/2017 CPI is based on Federal Reserve of Philadelphia Survey of Professional Forecasters
MONTHLY CHANGE CUMULATIVE CHANGE
KEY ECONOMIC INDICATORS
CHANGE IN SECTOR
Real GDP
Consumer Spending
$(18,000)
$(15,000)
$(12,000)
$(9,000)
$(6,000)
$(3,000)
$-
$3,000
$6,000
$9,000
$12,000
$15,000
$18,000
-10.00%
-8.00%
-6.00%
-4.00%
-2.00%
0.00%
2.00%
4.00%
6.00%
8.00%
10.00%
Quart
erly G
DP (
$bil)
Annualized G
row
th
CHANGES IN REAL GDP (2009 BASE YEAR)
Annualized Change in Real GDP Private Investment Series9 Government Spending
(5.0)
-
5.0
10.0
15.0
(200)
(100)
-
100
200
300
400
Unem
plo
ym
ent
Rate
(%
)
Job G
row
th/L
oss (
thou)
UNEMPLOYMENT RATE AND JOB GROWTH/LOSS
Job Growth (Loss) Unemployment Rate
Data sources: Bureau of Labor Statistics, U.S. Treasury, University of Michigan, Institute for Supply Management, Bureau of Economic Analysis
©2017 Wilshire Associates. 3

Item 6a, Attachment 1, Page 4 of 62
W i l s h i r e C o n s u l t i n g
ANNUAL EQUITY RETURNS
• U.S. Equity has now produced 9 straight years of positive returns since 2008
• Wilshire 5000 Total Market Index was up +21.0% in 2017
• EPS growth remained strong in 2017; Operating earnings rose 17.4%
31
24 24
-11 -11
-21
32
13
6
16
6
-37
28
17
1
16
33
13
1
13
21
-10
-22
-12
-21
-29-32
-13
-8 -7 -8 -10
-49
-27
-16-20
-10
-6-7
-12 -11
-3
-60
-50
-40
-30
-20
-10
0
10
20
30
40
WILSHIRE 5000 INDEXWORST INTRA-PERIOD SELLOFF VS ANNUAL RETURN (%)
Annual Return Largest Selloff
-15%
-10%
-5%
0%
5%
10%
15%
20%
S&P 500 EARNINGS GROWTH (Operating EPS)
QoQ YoY
©2017 Wilshire Associates. 4

Item 6a, Attachment 1, Page 5 of 62
W i l s h i r e C o n s u l t i n g
HISTORICALLY LOW LEVELS OF EQUITY RISK
• 2017 was one of the least volatile years in nearly four decades
– Largest drawdown for the year was -2.75%
– Only 4 trading days where the market was down 1% or more
Year 1% 2% 3% 4%
Max Risk 40.56% -48.54% 71 42 24 17 -17.23%
Avg 15.45% -13.81% 28.1 7.6 2.3 1.0 -4.00%
Med 13.21% -9.94% 22.5 4.0 1.0 0.0 -3.29%
Min Risk 6.96% -2.74% 3 0 0 0 -1.36%
Level 6.96% -2.75% 4 0 0 0 -1.85%
Rank 1 2 2 1 1 1 7
Annual
Volatility
Largest
Drawdown
Number of Days Down: Worst
Down Day
0%
5%
10%
15%
20%
25%
30%
35%
40%
45%
1980 1985 1990 1995 2000 2005 2010 2015
ANNUAL VOLATILITY (WILSHIRE 5000 INDEX)
©2017 Wilshire Associates. 5

Item 6a, Attachment 1, Page 6 of 62
W i l s h i r e C o n s u l t i n g
FEDERAL RESERVE
• Federal Reserve began their balance sheet normalization program during Q4; targeting $10B in reductions per month with the goal of reaching $50B per month in Q4 2018
• Total reductions have equaled only $17B through mid-January 2018
$-
$0.5
$1.0
$1.5
$2.0
$2.5
$3.0
$3.5
$4.0
$4.5
$5.0
FEDERAL RESERVE: BALANCE SHEET FORECAST ($T)
U.S. Treasuries Mortgage-backed Securities Other Original ForecastData sources: Federal Reserve
©2017 Wilshire Associates. 6
Item 6a, Attachment 1, Page 7 of 62
W i l s h i r e C o n s u l t i n g
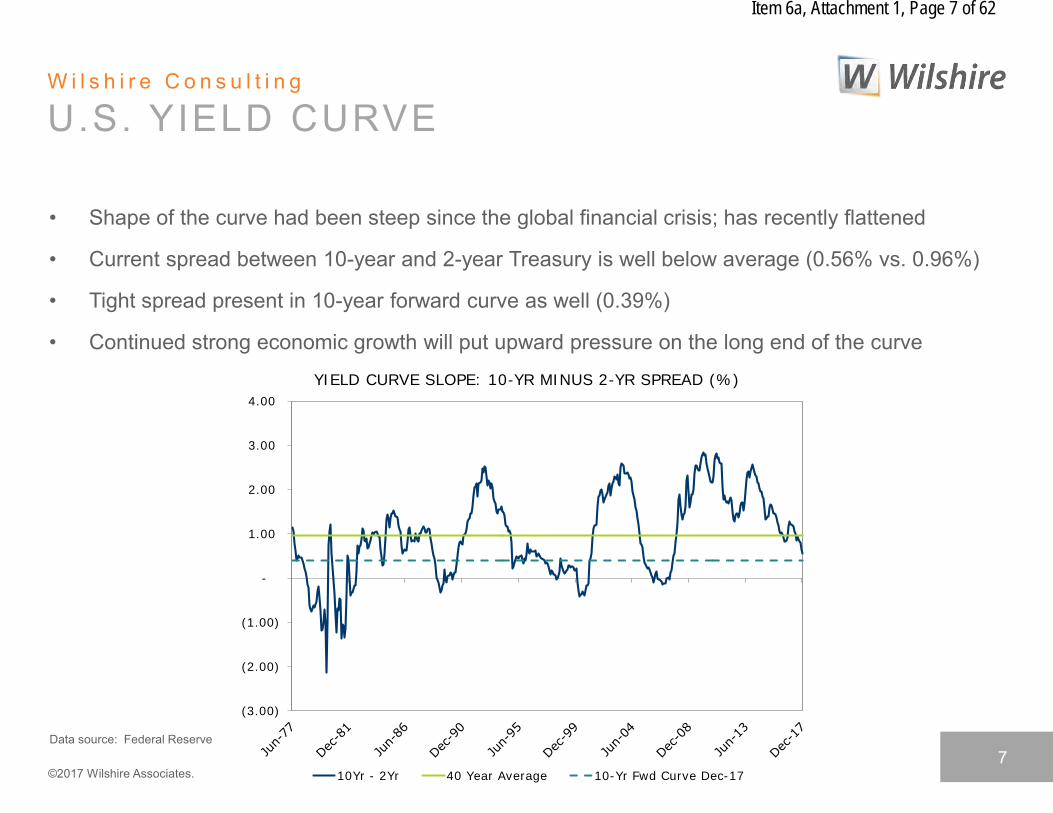
U.S. YIELD CURVE
• Shape of the curve had been steep since the global financial crisis; has recently flattened
• Current spread between 10-year and 2-year Treasury is well below average (0.56% vs. 0.96%)
• Tight spread present in 10-year forward curve as well (0.39%)
• Continued strong economic growth will put upward pressure on the long end of the curve
(3.00)
(2.00)
(1.00)
-
1.00
2.00
3.00
4.00
YIELD CURVE SLOPE: 10-YR MINUS 2-YR SPREAD (%)
10Yr - 2Yr 40 Year Average 10-Yr Fwd Curve Dec-17
Data source: Federal Reserve
©2017 Wilshire Associates. 7

Item 6a, Attachment 1, Page 8 of 62
W i l s h i r e C o n s u l t i n g
CalPERS Expected Return and Risk Estimates
6.10% 6.12%7.41% 7.43%
11.47% 11.94%
0.65%
0.0%
5.0%
10.0%
15.0%
Target Allocation Actual Allocation
Expected Return - 10 Yr Expected Return - 30 Yr
Expected Risk Expected Allocation Based TE
©2017 Wilshire Associates. 8

Item 6a, Attachment 1, Page 9 of 62
W i l s h i r e C o n s u l t i n g
Asset and Risk Allocation
54.0%
20.0%
13.0%
9.0%4.0%
0.0%
Target Asset Allocation
Growth
Income
Real Assets
Inflation
Liquidity
ARS/Other Perf
58.4%18.9%
10.6%
7.8%
4.2%0.1%
Actual Asset Allocation
Growth
Income
Real Assets
Inflation
Liquidity
ARS/Other Perf
81.98%
6.86% 9.69%
1.47% -0.01% 0.00%
Contribution to Total Risk - Target Allocation
Growth
Income
Real Assets
Inflation
Liquidity
ARS/Other Perf
85.27%
6.02%7.52%
1.17% -0.01% 0.03%
Contribution to Total Risk - Actual Allocation
Growth
Income
Real Assets
Inflation
Liquidity
ARS/Other Perf
©2017 Wilshire Associates. 9

Item 6a, Attachment 1, Page 10 of 62
W i l s h i r e C o n s u l t i n g
Drivers of Expected Excess Risk
4.40%
-1.11%
-2.39%
-1.16%
0.19% 0.08%
-6.0%
-4.0%
-2.0%
0.0%
2.0%
4.0%
6.0%
Growth Income Real Assets Inflation Liquidity ARS/OtherPerf
CalPERS Asset Allocation Variance
101.64%
0.19%
-2.96%
0.74%
-0.03%
0.42%
-20.0%
0.0%
20.0%
40.0%
60.0%
80.0%
100.0%
120.0%
Growth Income Real Assets Inflation Liquidity ARS/OtherPerf
Contribution to TF Tracking Error
• This excess risk forecast is based on asset allocation variance only
• Other sources of risk (structural within asset classes, manager/program specific source of tracking error, covariance) are not considered here
©2017 Wilshire Associates. 10

Item 6a, Attachment 1, Page 11 of 62
W i l s h i r e C o n s u l t i n g
Total Fund – Performance Market
Value Qtr 1-Year 3-Year 5-Year 10-Year VaR Sharpe Info
TOTAL FUND $350.0 bil 4.0% 15.7% 7.6% 9.0% 4.9% $42.6 bil 1.6 0.2
Total Fund Policy Benchmark 4.0% 15.5% 7.6% 8.8% 6.1% 1.6 0.0
Actuarial Rate 1.8% 7.5% 7.5% 7.5% 7.6%
GROWTH 203.2 5.6% 23.2% 10.0% 11.9% 6.0% $42.7 bil 1.4 -0.2
Growth Policy Benchmark 5.9% 24.2% 10.4% 12.4% 7.1% 1.5 0.0
PUBLIC EQUITY 176.4 5.8% 24.0% 10.0% 11.8% 5.5% $36.0 bil 1.2 0.6
Public Equity Policy Benchmark 5.8% 24.4% 9.9% 11.6% 5.8% 1.1 0.0
PRIVATE EQUITY 26.7 4.2% 18.0% 9.9% 12.6% 9.1% $9.1 bil 3.6 -0.3
Private Equity Policy Benchmark 6.1% 22.9% 12.0% 15.4% 13.2% 1.5 0.0
INCOME 65.6 1.3% 7.2% 3.7% 3.3% 6.0% $7.3 bil 0.6 1.3
Income Policy Benchmark 1.3% 6.6% 3.0% 2.5% 5.3% 0.4 0.0
REAL ASSETS 36.8 2.0% 8.5% 9.4% 10.4% -0.9% $5.1 bil 1.7 0.1
Real Assets Policy Benchmark 1.6% 6.4% 9.1% 9.9% 6.4% 2.4 0.0
INFLATION 27.4 4.0% 6.3% 0.1% -2.0% 0.1% $2.0 bil -0.4 0.7
Inflation Policy Benchmark 3.9% 6.2% -0.2% -2.5% 0.1% -0.4 0.0
LIQUIDITY 14.7 0.3% 1.2% 0.7% 0.4% 1.1% $0.0 bil 0.2 -0.3
Liquidity Policy Benchmark 0.3% 0.9% 0.6% 0.6% 1.2% 0.2 0.0
ABSOLUTE RETURN STRATEGIES 0.3 1.8% 6.4% 0.6% 3.0% 1.5% 0.6 -0.5
Absolute Return Strategies Policy Benchmark 1.2% 5.6% 5.5% 5.4% 5.9% 23.5 0.0
EXTERNAL MULTI-ASSET CLASS COMPOSITE 1.4 4.8% 13.9% 5.8% 7.1% -.-% N/A N/A
Absolute 7.5% 1.8% 7.5% 7.5% 7.5% -.-% N/A N/A
TRUST LEVEL PORTFOLIO MANAGEMENT / OTHER 0.7 -.-% -.-% -.-% -.-% -.-% N/A N/A
TERMINATED AGENCY POOL 0.1 1.8% 5.0% 2.6% -.-% -.-% N/A N/A
TOTAL FUND PLUS TAP 350.1 4.0% 15.7% 7.6% 9.0% 4.9% N/A N/A
5-Year Ratios
©2017 Wilshire Associates. 11
Item 6a, Attachment 1, Page 12 of 62
W i l s h i r e C o n s u l t i n g
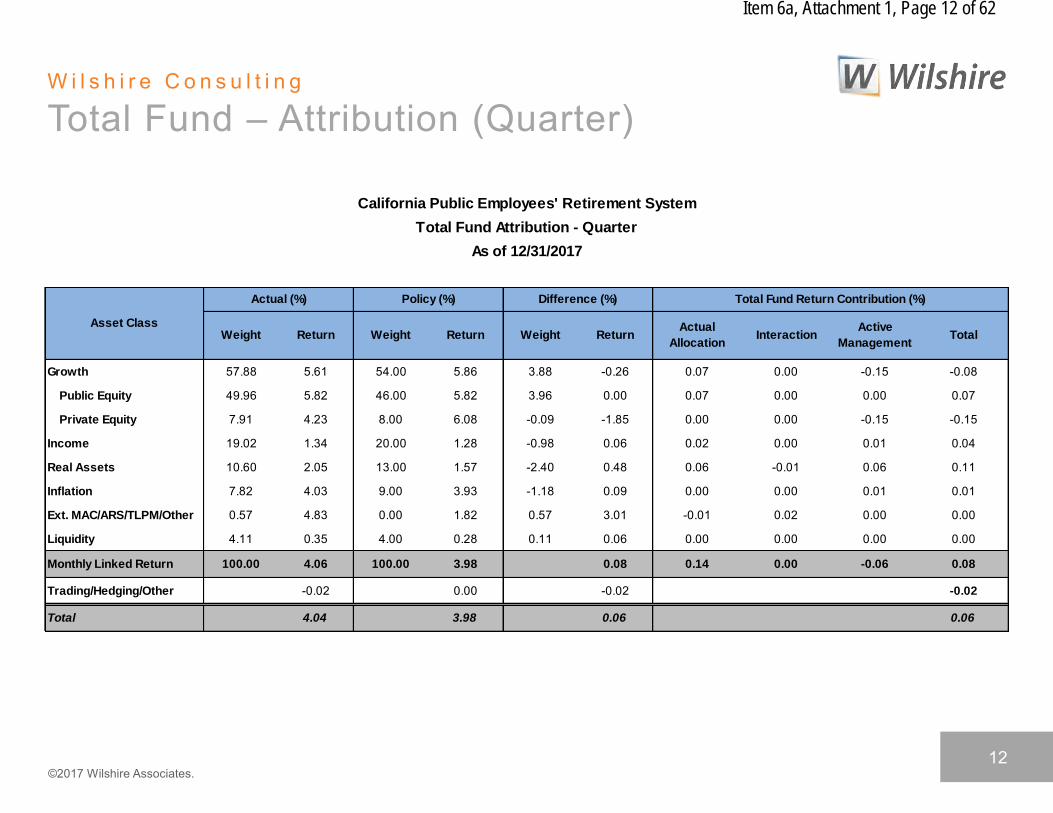
Total Fund – Attribution (Quarter)
Growth 57.88 5.61 54.00 5.86 3.88 -0.26 0.07 0.00 -0.15 -0.08
Public Equity 49.96 5.82 46.00 5.82 3.96 0.00 0.07 0.00 0.00 0.07
Private Equity 7.91 4.23 8.00 6.08 -0.09 -1.85 0.00 0.00 -0.15 -0.15
Income 19.02 1.34 20.00 1.28 -0.98 0.06 0.02 0.00 0.01 0.04
Real Assets 10.60 2.05 13.00 1.57 -2.40 0.48 0.06 -0.01 0.06 0.11
Inflation 7.82 4.03 9.00 3.93 -1.18 0.09 0.00 0.00 0.01 0.01
Ext. MAC/ARS/TLPM/Other 0.57 4.83 0.00 1.82 0.57 3.01 -0.01 0.02 0.00 0.00
Liquidity 4.11 0.35 4.00 0.28 0.11 0.06 0.00 0.00 0.00 0.00
Monthly Linked Return 100.00 4.06 100.00 3.98 0.08 0.14 0.00 -0.06 0.08
Trading/Hedging/Other -0.02 0.00 -0.02 -0.02
Total 4.04 3.98 0.06 0.06
California Public Employees' Retirement System
Total Fund Attribution - Quarter
As of 12/31/2017
Asset Class
Actual (%) Policy (%) Difference (%) Total Fund Return Contribution (%)
Weight Return Weight Return Weight ReturnActual
AllocationInteraction
Active
ManagementTotal
©2017 Wilshire Associates. 12

Item 6a, Attachment 1, Page 13 of 62
W i l s h i r e C o n s u l t i n g
Total Fund – Attribution (Calendar YTD)
Growth 56.67 23.15 54.00 24.19 2.67 -1.04 0.21 -0.02 -0.52 -0.33
Public Equity 48.56 24.03 46.00 24.38 2.56 -0.35 0.21 -0.01 -0.15 0.06
Private Equity 8.10 18.04 8.00 22.90 0.10 -4.86 0.00 -0.01 -0.38 -0.38
Income 19.00 7.22 20.00 6.57 -1.00 0.65 0.08 -0.01 0.14 0.21
Real Assets 10.88 8.49 13.00 6.41 -2.12 2.09 0.19 -0.05 0.29 0.43
Inflation 8.44 6.33 9.00 6.16 -0.56 0.17 0.01 0.00 0.02 0.02
Ext. MAC/ARS/TLPM/Other 0.51 13.88 0.00 7.50 0.51 6.38 -0.04 0.04 0.00 -0.01
Liquidity 4.50 1.15 4.00 0.86 0.50 0.30 -0.07 0.00 0.01 -0.05
Monthly Linked Return 100.00 15.75 100.00 15.48 0.27 0.38 -0.05 -0.06 0.27
Trading/Hedging/Other -0.02 0.00 -0.02 -0.02
Total 15.73 15.48 0.25 0.25
California Public Employees' Retirement System
Total Fund Attribution - Calendar Year-to-Date
As of 12/31/2017
Asset Class
Actual (%) Policy (%) Difference (%) Total Fund Return Contribution (%)
Weight ReturnActive
ManagementTotalWeight Return Weight Return
Actual
AllocationInteraction
©2017 Wilshire Associates. 13

Item 6a, Attachment 1, Page 14 of 62
W i l s h i r e C o n s u l t i n g
Total Fund – Attribution (Fiscal YTD)
Growth 57.27 11.35 54.00 11.55 3.27 -0.19 0.12 0.00 -0.11 0.01
Public Equity 49.32 11.62 46.00 11.62 3.32 0.00 0.12 0.00 0.00 0.12
Private Equity 7.95 9.73 8.00 11.11 -0.05 -1.38 0.00 0.00 -0.11 -0.11
Income 19.22 2.71 20.00 2.60 -0.78 0.12 0.03 0.00 0.02 0.06
Real Assets 10.76 4.52 13.00 3.00 -2.24 1.51 0.10 -0.04 0.20 0.27
Inflation 7.83 7.38 9.00 6.99 -1.17 0.39 0.01 0.00 0.04 0.04
Ext. MAC/ARS/TLPM/Other 0.54 9.06 0.00 3.68 0.54 5.38 -0.02 0.03 0.00 0.01
Liquidity 4.38 0.68 4.00 0.55 0.38 0.13 -0.02 0.00 0.01 -0.02
Monthly Linked Return 100.00 8.10 100.00 7.74 0.36 0.22 -0.02 0.16 0.36
Trading/Hedging/Other -0.01 0.00 -0.01 -0.01
Total 8.09 7.74 0.35 0.35
Weight ReturnActual
AllocationInteraction
Active
ManagementTotal
As of 12/31/2017
Asset Class
Actual (%) Policy (%) Difference (%) Total Fund Return Contribution (%)
Weight Return Weight Return
California Public Employees' Retirement System
Total Fund Attribution - Fiscal Year-to-Date
©2017 Wilshire Associates. 14
Item 6a, Attachment 1, Page 15 of 62
W i l s h i r e C o n s u l t i n g
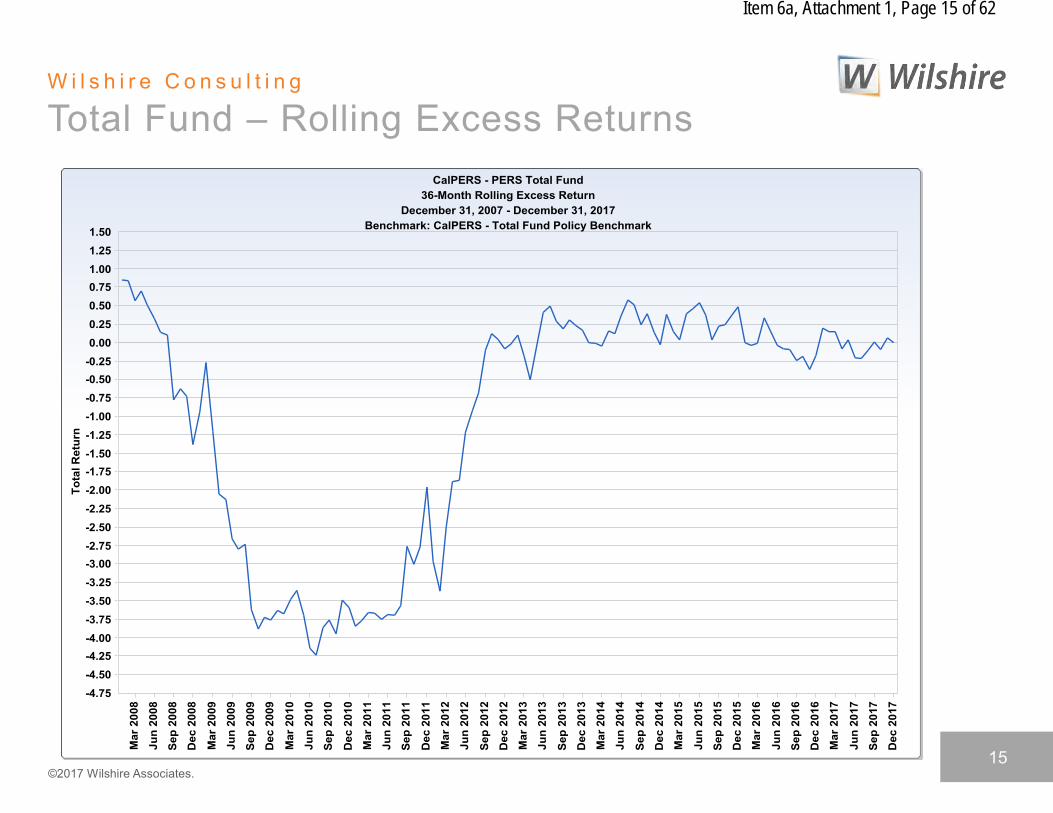
Total Fund – Rolling Excess Returns
©2017 Wilshire Associates. 15

Item 6a, Attachment 1, Page 16 of 62
W i l s h i r e C o n s u l t i n g
Total Fund – Rolling Tracking Error
©2017 Wilshire Associates. 16
Item 6a, Attachment 1, Page 17 of 62
W i l s h i r e C o n s u l t i n g
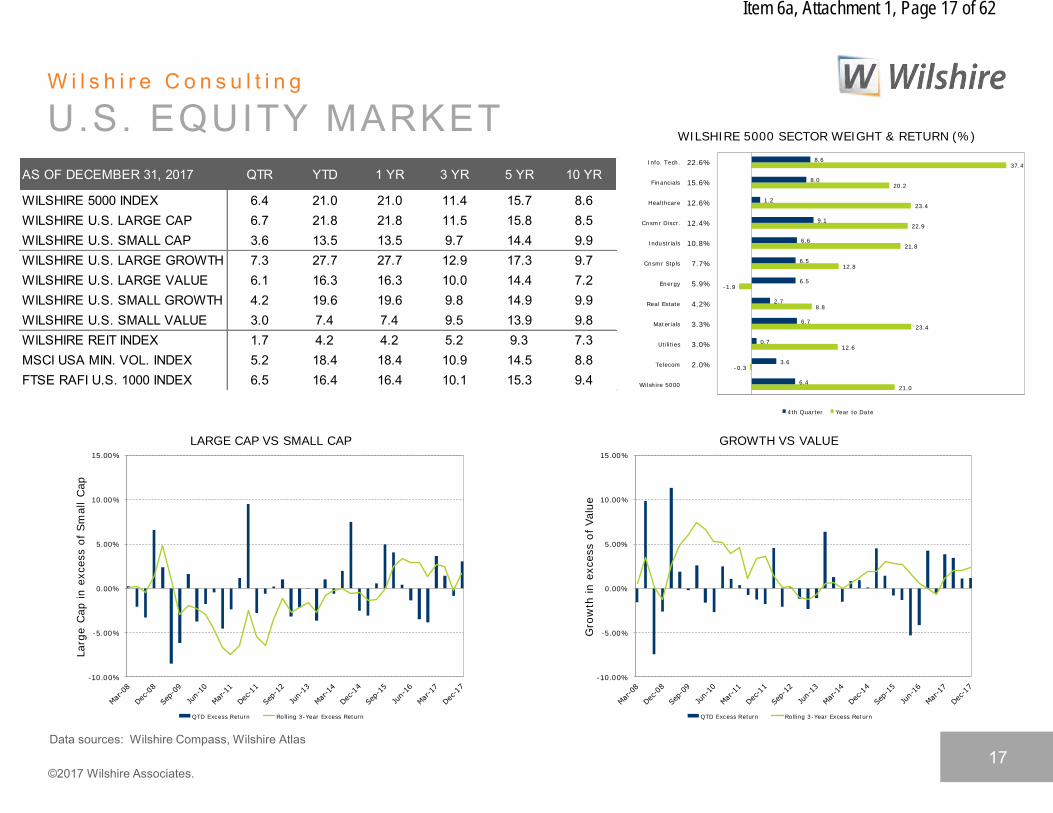
U.S. EQUITY MARKET
21.0
-0.3
12.6
23.4
8.8
-1.9
12.8
21.8
22.9
23.4
20.2
37.4
6.4
3.6
0.7
6.7
2.7
6.5
6.5
6.6
9.1
1.2
8.0
8.6
Wilshire 5000
Telecom
Utilities
Materials
Real Estate
Energy
Cnsmr Stpls
Industrials
Cnsmr Discr.
Healthcare
Financials
Info. Tech.
2.0%
3.0%
3.3%
4.2%
5.9%
7.7%
10.8%
12.4%
12.6%
15.6%
22.6%
WILSHIRE 5000 SECTOR WEIGHT & RETURN (%)
4th Quarter Year to Date
AS OF DECEMBER 31, 2017 QTR YTD 1 YR 3 YR 5 YR 10 YR
WILSHIRE 5000 INDEX 6.4 21.0 21.0 11.4 15.7 8.6WILSHIRE U.S. LARGE CAP 6.7 21.8 21.8 11.5 15.8 8.5WILSHIRE U.S. SMALL CAP 3.6 13.5 13.5 9.7 14.4 9.9WILSHIRE U.S. LARGE GROWTH 7.3 27.7 27.7 12.9 17.3 9.7WILSHIRE U.S. LARGE VALUE 6.1 16.3 16.3 10.0 14.4 7.2WILSHIRE U.S. SMALL GROWTH 4.2 19.6 19.6 9.8 14.9 9.9WILSHIRE U.S. SMALL VALUE 3.0 7.4 7.4 9.5 13.9 9.8WILSHIRE REIT INDEX 1.7 4.2 4.2 5.2 9.3 7.3MSCI USA MIN. VOL. INDEX 5.2 18.4 18.4 10.9 14.5 8.8FTSE RAFI U.S. 1000 INDEX 6.5 16.4 16.4 10.1 15.3 9.4
-10.00%
-5.00%
0.00%
5.00%
10.00%
15.00%
Larg
e C
ap in e
xcess o
f Sm
all C
ap
LARGE CAP VS SMALL CAP
QTD Excess Return Rolling 3-Year Excess Return
-10.00%
-5.00%
0.00%
5.00%
10.00%
15.00%
Gro
wth
in e
xcess o
f Valu
e
GROWTH VS VALUE
QTD Excess Return Rolling 3-Year Excess Return
Data sources: Wilshire Compass, Wilshire Atlas
©2017 Wilshire Associates. 17
Item 6a, Attachment 1, Page 18 of 62
W i l s h i r e C o n s u l t i n g
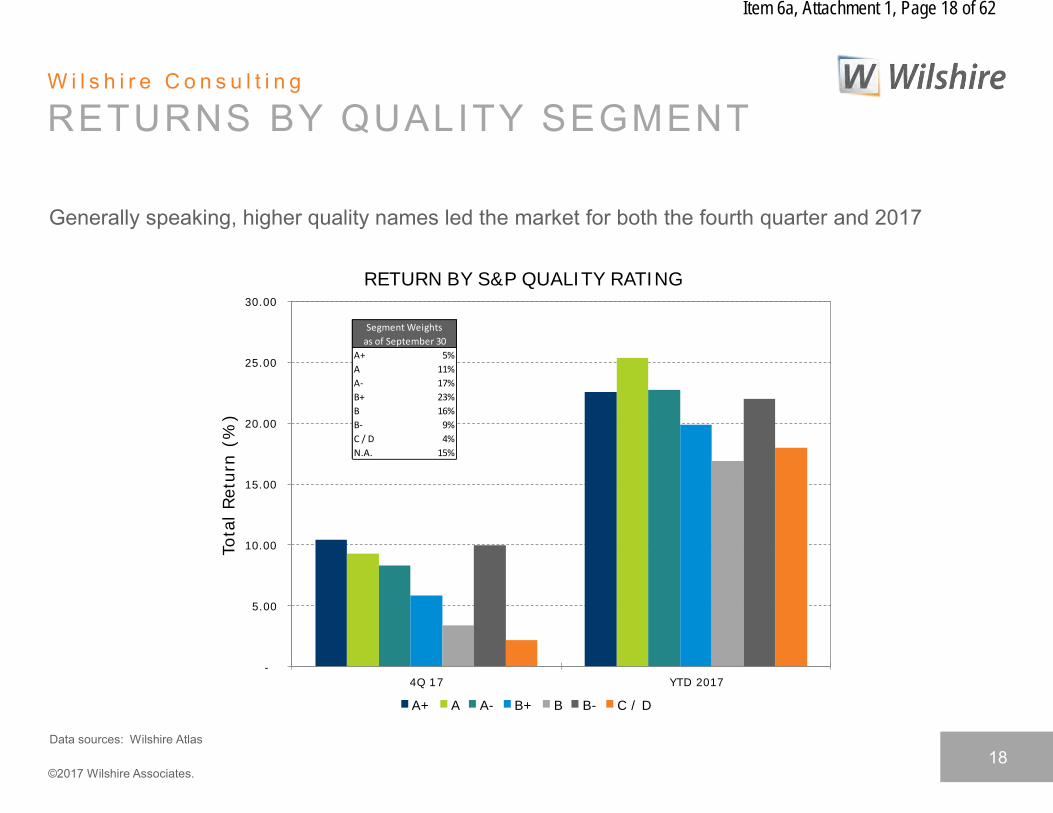
RETURNS BY QUALITY SEGMENT
Generally speaking, higher quality names led the market for both the fourth quarter and 2017
-
5.00
10.00
15.00
20.00
25.00
30.00
4Q 17 YTD 2017
Tota
l Retu
rn (
%)
RETURN BY S&P QUALITY RATING
A+ A A- B+ B B- C / D
A+ 5%
A 11%
A- 17%
B+ 23%
B 16%
B- 9%
C / D 4%
N.A. 15%
Segment Weights
as of September 30
Data sources: Wilshire Atlas
©2017 Wilshire Associates. 18
Item 6a, Attachment 1, Page 19 of 62
W i l s h i r e C o n s u l t i n g
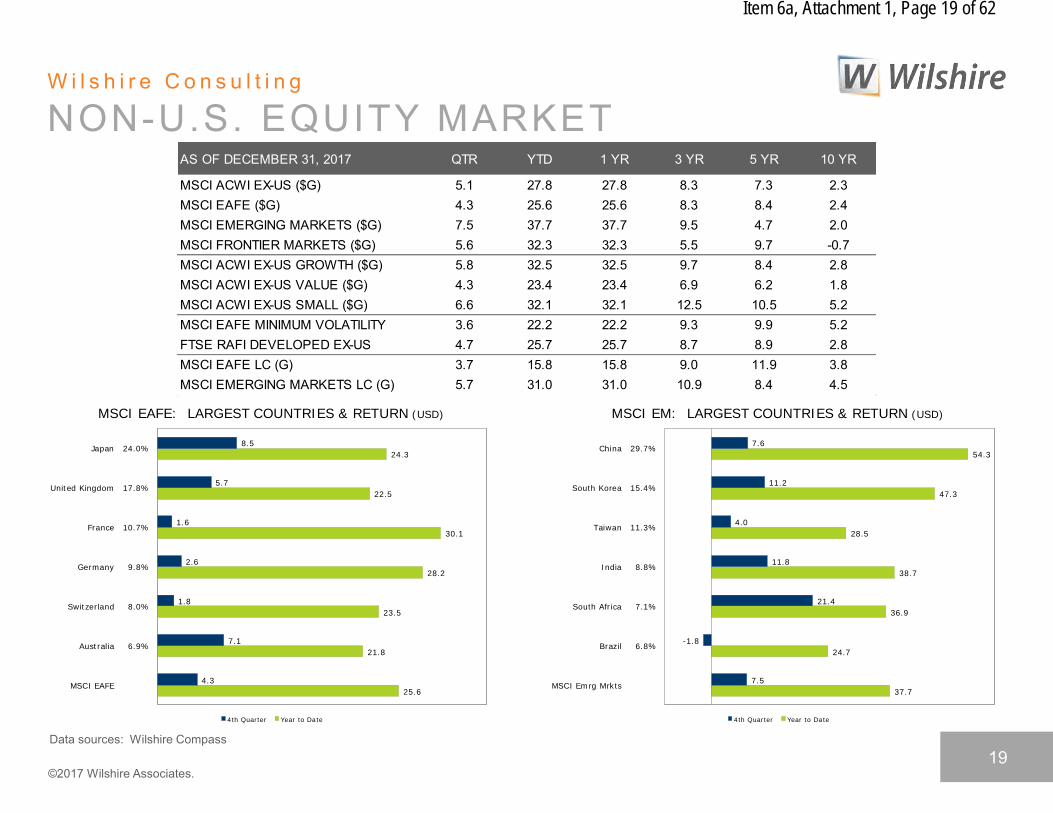
NON-U.S. EQUITY MARKET AS OF DECEMBER 31, 2017 QTR YTD 1 YR 3 YR 5 YR 10 YR
MSCI ACWI EX-US ($G) 5.1 27.8 27.8 8.3 7.3 2.3MSCI EAFE ($G) 4.3 25.6 25.6 8.3 8.4 2.4MSCI EMERGING MARKETS ($G) 7.5 37.7 37.7 9.5 4.7 2.0MSCI FRONTIER MARKETS ($G) 5.6 32.3 32.3 5.5 9.7 -0.7MSCI ACWI EX-US GROWTH ($G) 5.8 32.5 32.5 9.7 8.4 2.8MSCI ACWI EX-US VALUE ($G) 4.3 23.4 23.4 6.9 6.2 1.8MSCI ACWI EX-US SMALL ($G) 6.6 32.1 32.1 12.5 10.5 5.2MSCI EAFE MINIMUM VOLATILITY 3.6 22.2 22.2 9.3 9.9 5.2FTSE RAFI DEVELOPED EX-US 4.7 25.7 25.7 8.7 8.9 2.8MSCI EAFE LC (G) 3.7 15.8 15.8 9.0 11.9 3.8MSCI EMERGING MARKETS LC (G) 5.7 31.0 31.0 10.9 8.4 4.5
25.6
21.8
23.5
28.2
30.1
22.5
24.3
4.3
7.1
1.8
2.6
1.6
5.7
8.5
MSCI EAFE
Australia
Switzerland
Germany
France
United Kingdom
Japan
6.9%
8.0%
9.8%
10.7%
17.8%
24.0%
MSCI EAFE: LARGEST COUNTRIES & RETURN (USD)
4th Quarter Year to Date
37.7
24.7
36.9
38.7
28.5
47.3
54.3
7.5
-1.8
21.4
11.8
4.0
11.2
7.6
MSCI Emrg Mrkts
Brazil
South Africa
India
Taiwan
South Korea
China
6.8%
7.1%
8.8%
11.3%
15.4%
29.7%
MSCI EM: LARGEST COUNTRIES & RETURN (USD)
4th Quarter Year to Date
Data sources: Wilshire Compass
©2017 Wilshire Associates. 19
Item 6a, Attachment 1, Page 20 of 62
W i l s h i r e C o n s u l t i n g
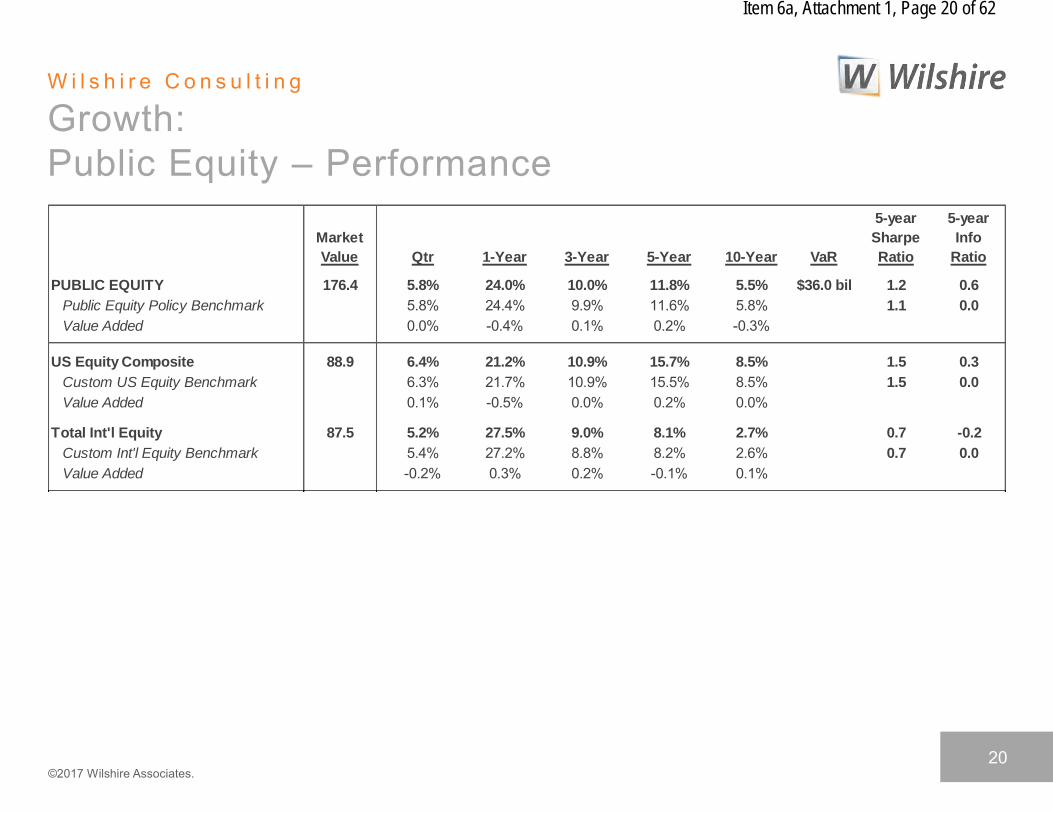
Growth: Public Equity – Performance
Market
Value Qtr 1-Year 3-Year 5-Year 10-Year VaR
5-year
Sharpe
Ratio
5-year
Info
Ratio
PUBLIC EQUITY 176.4 5.8% 24.0% 10.0% 11.8% 5.5% $36.0 bil 1.2 0.6
Public Equity Policy Benchmark 5.8% 24.4% 9.9% 11.6% 5.8% 1.1 0.0
Value Added 0.0% -0.4% 0.1% 0.2% -0.3%
US Equity Composite 88.9 6.4% 21.2% 10.9% 15.7% 8.5% 1.5 0.3
Custom US Equity Benchmark 6.3% 21.7% 10.9% 15.5% 8.5% 1.5 0.0
Value Added 0.1% -0.5% 0.0% 0.2% 0.0%
Total Int'l Equity 87.5 5.2% 27.5% 9.0% 8.1% 2.7% 0.7 -0.2
Custom Int'l Equity Benchmark 5.4% 27.2% 8.8% 8.2% 2.6% 0.7 0.0
Value Added -0.2% 0.3% 0.2% -0.1% 0.1%
©2017 Wilshire Associates. 20

Item 6a, Attachment 1, Page 21 of 62
W i l s h i r e C o n s u l t i n g
Growth: Public Equity – Rolling Excess Returns
©2017 Wilshire Associates. 21

Item 6a, Attachment 1, Page 22 of 62
W i l s h i r e C o n s u l t i n g
Growth: Public Equity – Rolling Tracking Error
©2017 Wilshire Associates. 22
Item 6a, Attachment 1, Page 23 of 62
W i l s h i r e C o n s u l t i n g
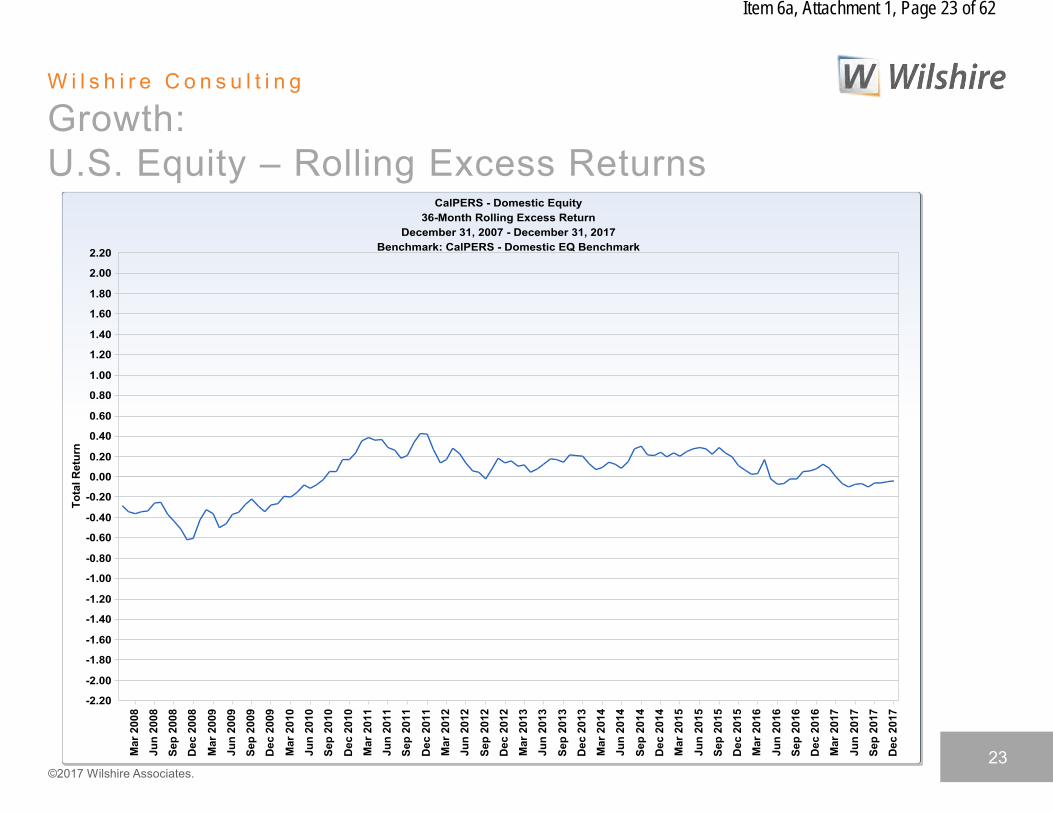
Growth: U.S. Equity – Rolling Excess Returns
©2017 Wilshire Associates. 23

Item 6a, Attachment 1, Page 24 of 62
W i l s h i r e C o n s u l t i n g
Growth: U.S. Equity – Rolling Tracking Error
©2017 Wilshire Associates. 24

Item 6a, Attachment 1, Page 25 of 62
W i l s h i r e C o n s u l t i n g
Growth: International Equity – Rolling Excess Returns
©2017 Wilshire Associates. 25
Item 6a, Attachment 1, Page 26 of 62
W i l s h i r e C o n s u l t i n g
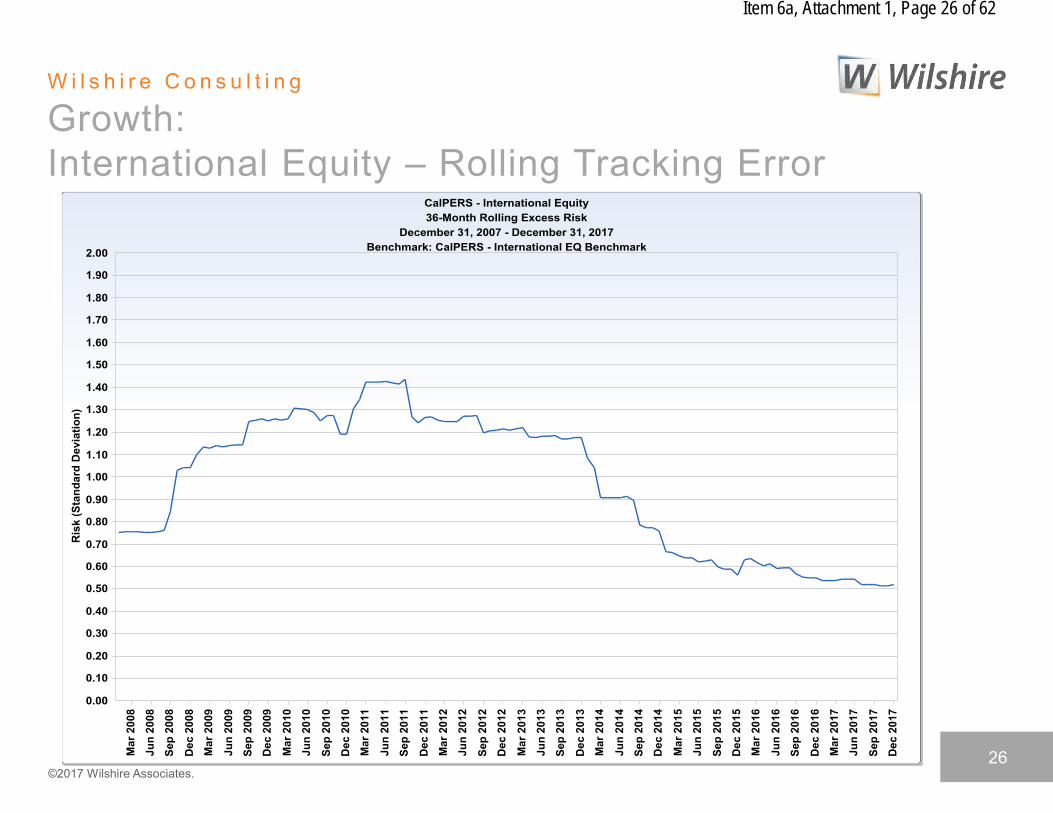
Growth: International Equity – Rolling Tracking Error
©2017 Wilshire Associates. 26
Item 6a, Attachment 1, Page 27 of 62
W i l s h i r e P r i v a t e M a r k e t s
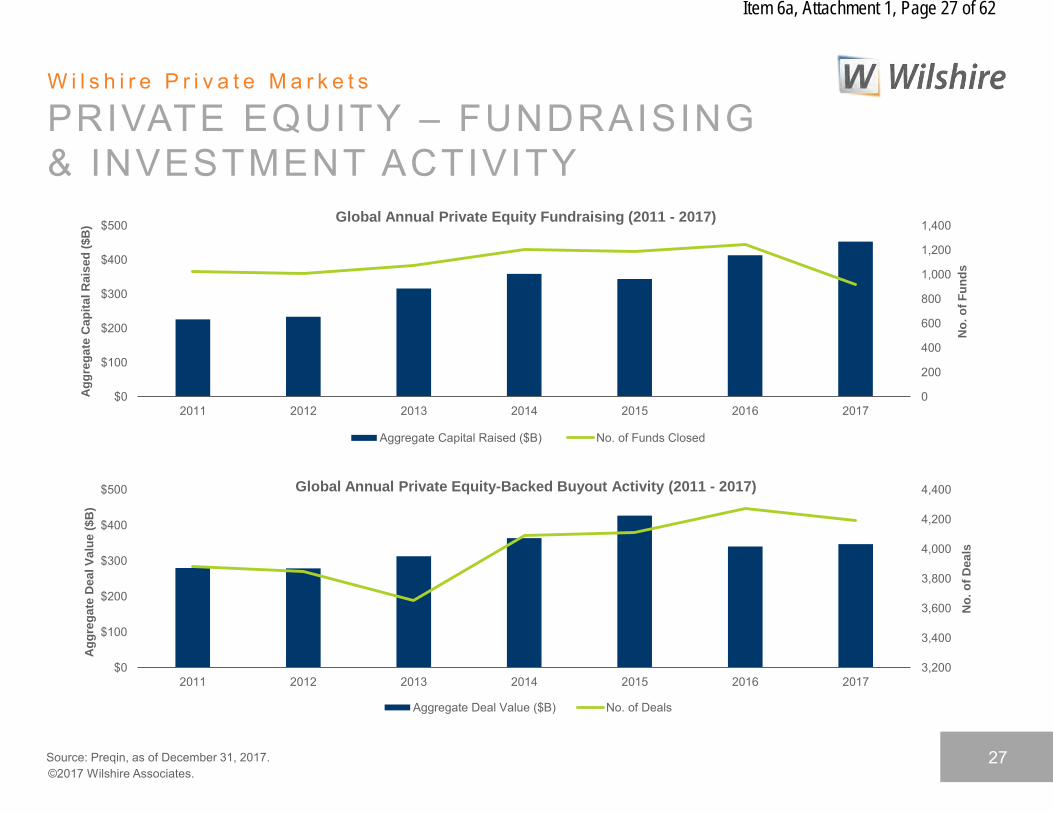
PRIVATE EQUITY – FUNDRAISING & INVESTMENT ACTIVITY
Global Annual Private Equity Fundraising (2011 - 2017)
Ag
gre
ga
te C
ap
ita
l R
ais
ed
($
B) $500 1,400
1,200
1,000
$300 800
600 $200
400 $100
200
$0 0 2011 2012 2013 2014 2015 2016 2017
Aggregate Capital Raised ($B) No. of Funds Closed
$500 Global Annual Private Equity-Backed Buyout Activity (2011 - 2017) 4,400
$400
No
. o
f F
un
ds
3,200
3,400
3,600
3,800
4,000
4,200
$0
$100
$200
$300
$400
2011 2012 2013 2014 2015 2016 2017
No
. o
f D
ea
ls
Ag
gre
ga
te D
ea
l V
alu
e (
$B
)
Aggregate Deal Value ($B) No. of Deals
Source: Preqin, as of December 31, 2017. ©2017 Wilshire Associates.
27

Item 6a, Attachment 1, Page 28 of 62
W i l s h i r e P r i v a t e M a r k e t s
PRIVATE EQUITY – PRICING & VALUATIONS
Purchase Price Multiples (2000 - 2017)12x
10.6x 10.3x 10.0x 9.7x 9.7x 10x 9.1x 8.8x 8.7x 8.8x 8.5x 8.4x 8.4x 7.7x 8x 7.3x 7.1x 6.7x 6.6x 6.4x
6x
4x
2x
0x 2000 2001 2002 2003 2004 2005 2006 2007 2008 2009 2010 2011 2012 2013 2014 2015 2016 2017
Venture Capital Median Pre-Money Valuations ($M) (2006 - 2017)$45 $300
$0 $0 2006 2007 2008 2009 2010 2011 2012 2013 2014 2015 2016 2017
Angel/Seed Series A Series B Series C Series D+
$50
$100
$150
$200
$250
$5
$10
$15
$20
$25
$30
$35
$40
Se
rie
s C
, S
eri
es
D+
An
ge
l/S
ee
d, S
eri
es
A,
Se
rie
s B
Source: S&P LBO; Pitchbook, as of December 31, 2017 ©2017 Wilshire Associates.
28
Item 6a, Attachment 1, Page 29 of 62
W i l s h i r e P r i v a t e M a r k e t s
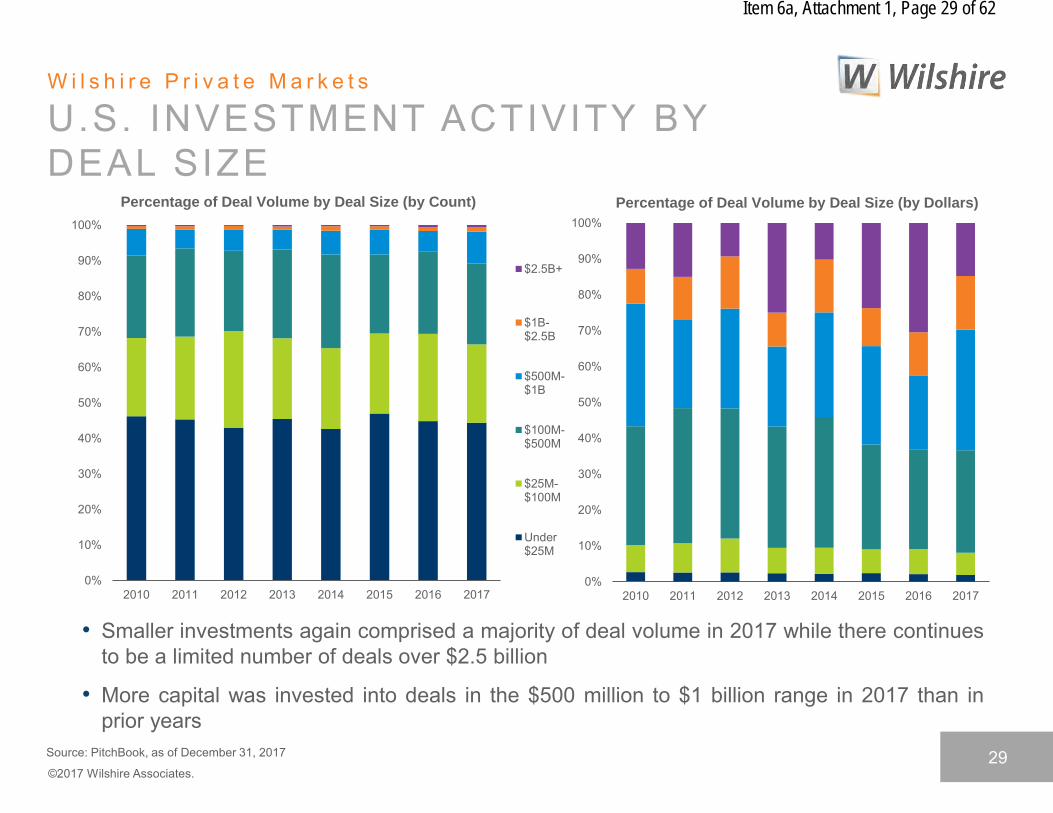
U.S. INVESTMENT ACTIVITY BY DEAL SIZE
Percentage of Deal Volume by Deal Size (by Count) Percentage of Deal Volume by Deal Size (by Dollars)
100% 100%
90% $2.5B+
90%
80% 80%
$1B-70% 70% $2.5B
60% 60% $500M-$1B
50% 50%
$100M-40% 40% $500M
30% 30% $25M-$100M
20% 20%
Under 10% 10% $25M
0% 0% 2010 2011 2012 2013 2014 2015 2016 2017
• Smaller investments again comprised a majority of deal volume in 2017 while there continues to be a limited number of deals over $2.5 billion
• More capital was invested into deals in the $500 million to $1 billion range in 2017 than in
2010 2011 2012 2013 2014 2015 2016 2017
prior years Source: PitchBook, as of December 31, 2017
©2017 Wilshire Associates. 29

Item 6a, Attachment 1, Page 30 of 62
W i l s h i r e P r i v a t e M a r k e t s
PRIVATE EQUITY DRY POWDER
Private Equity Dry Powder by Fund Type (2008 - Q3 2017)
$1,400
$1,200
$1,000
$800
$600
$400
$200
$-2008 2009 2010 2011 2012 2013 2014 2015 2016 2017*
Buyout Venture Growth Other Private Equity
• Global private equity dry powder continues to increase, topping $1.1 trillion across all fund types
• This abundant capital should continue to fuel private equity deal flow over the next few years
Dry
Po
wd
er
(bn
)
*Source: Preqin, as of September 30, 2017
©2017 Wilshire Associates. 30
Item 6a, Attachment 1, Page 31 of 62
W i l s h i r e P r i v a t e M a r k e t s
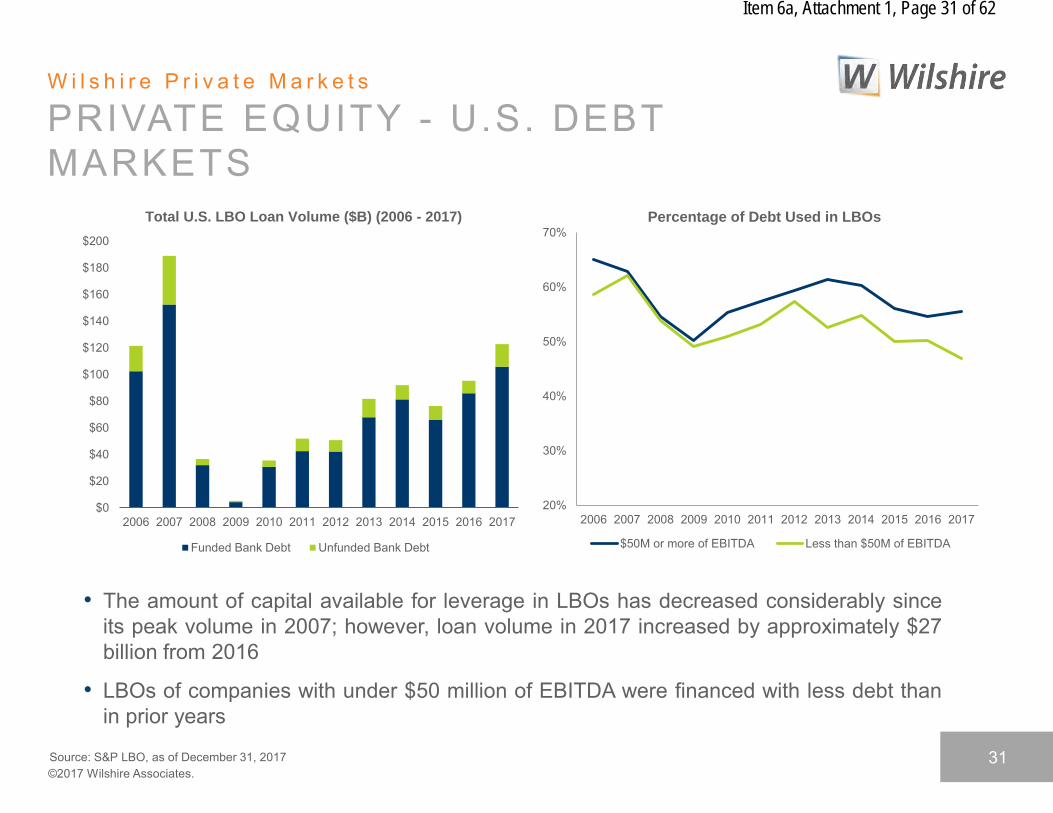
PRIVATE EQUITY - U.S. DEBT MARKETS
$0
$20
$40
$60
$80
$100
$120
$140
$160
$180
$200
Total U.S. LBO Loan Volume ($B) (2006 - 2017)
20%
30%
40%
50%
60%
70% Percentage of Debt Used in LBOs
2006 2007 2008 2009 2010 2011 2012 2013 2014 2015 2016 2017 2006 2007 2008 2009 2010 2011 2012 2013 2014 2015 2016 2017
$50M or more of EBITDA Less than $50M of EBITDA Funded Bank Debt Unfunded Bank Debt
• The amount of capital available for leverage in LBOs has decreased considerably since its peak volume in 2007; however, loan volume in 2017 increased by approximately $27 billion from 2016
• LBOs of companies with under $50 million of EBITDA were financed with less debt than in prior years
Source: S&P LBO, as of December 31, 2017 ©2017 Wilshire Associates.
31

Item 6a, Attachment 1, Page 32 of 62
W i l s h i r e P r i v a t e M a r k e t s
PRIVATE EQUITY- U.S. LBO PURCHASE PRICE MULTIPLES
Purchase Price Multiples of U.S. LBO Transactions (2006 - 2017)
12x 10.6x 10.3x 10.0x 9.7x 9.7x 10x 9.1x 8.8x 8.7x 8.8x 8.5x
7.7x 8.4x
8x
6x
4x
2x
0x 2006 2007 2008 2009 2010 2011 2012 2013 2014 2015 2016 2017
Debt/EBITDA Equity/EBITDA Others
• As debt remains readily available, purchase price multiples for U.S. LBOs continue to increase and remain high relative to 2009’s low
Source: S&P LBO, as of December 31, 2017
©2017 Wilshire Associates. 32

Item 6a, Attachment 1, Page 33 of 62
W i l s h i r e C o n s u l t i n g
Growth: Private Equity – Performance
Market
Value Qtr 1-Year 3-Year 5-Year 10-Year VaR
5-year
Sharpe
Ratio
5-year
Info
Ratio
PRIVATE EQUITY 26.7 4.2% 18.0% 9.9% 12.6% 9.1% $9.1 bil 3.6 -0.3
PE Policy Benchmark 6.1% 22.9% 12.0% 15.4% 13.2% 1.5 0.0
Value Added -1.9% -4.9% -2.1% -2.8% -4.1%
Private Equity Partnership Investments 26.5 4.2% 18.0% 10.0% 12.7% 9.3%
Private Equity Distribution Stock 0.2 8.7% 53.8% -18.8% -13.2% -9.3%
©2017 Wilshire Associates. 33

Item 6a, Attachment 1, Page 34 of 62
W i l s h i r e C o n s u l t i n g
Growth: Private Equity – Rolling Excess Returns
©2017 Wilshire Associates. 34

Item 6a, Attachment 1, Page 35 of 62
W i l s h i r e C o n s u l t i n g
Growth: Private Equity – Rolling Tracking Error
©2017 Wilshire Associates. 35

Item 6a, Attachment 1, Page 36 of 62
W i l s h i r e C o n s u l t i n g
U.S. FIXED INCOME
0
200
400
600
800
1,000
1,200
1,400
1,600
1,800
2,000
Option A
dju
ste
d S
pre
ad (
bps)
BLOOMBERG BARCLAYS FIXED INCOME INDEXES
Securitized IG Corporate Aa Corporate High Yield
0.00
0.50
1.00
1.50
2.00
2.50
3.00
3.50
0 5 10 15 20 25 30
Yie
ld (
%)
Maturity (yrs)
TREASURY YIELD CURVE
Current Quarter Previous Quarter One Year Ago
AS OF DECEMBER 31, 2017 YTM DURATION QTR YTD 1 YR 3 YR 5 YR 10 YR
BLOOMBERG BARCLAYS AGGREGATE 2.7 6.0 0.4 3.6 3.6 2.2 2.1 4.0BLOOMBERG BARCLAYS TREASURY 2.2 6.2 0.1 2.3 2.3 1.4 1.3 3.3BLOOMBERG BARCLAYS GOV'T-REL. 2.7 5.5 0.3 4.2 4.2 2.2 1.9 3.7BLOOMBERG BARCLAYS SECURITIZED 2.9 4.4 0.2 2.5 2.5 1.9 2.0 3.8BLOOMBERG BARCLAYS CORPORATE 3.3 7.6 1.2 6.4 6.4 3.9 3.5 5.7BLOOMBERG BARCLAYS LT G/C 3.5 15.4 2.8 10.7 10.7 4.5 4.4 7.3BLOOMBERG BARCLAYS LT TREASURY 2.7 17.6 2.4 8.5 8.5 2.8 3.5 6.6BLOOMBERG BARCLAYS LT GOV't-REL. 4.0 12.6 2.1 11.9 11.9 4.5 4.1 7.0BLOOMBERG BARCLAYS LT CORP. 4.0 14.3 3.3 12.1 12.1 5.9 5.3 7.8BLOOMBERG BARCLAYS U.S. TIPS * 2.4 7.7 1.3 3.0 3.0 2.0 0.1 3.5BLOOMBERG BARCLAYS HIGH YIELD 6.2 3.9 0.5 7.5 7.5 6.3 5.8 8.0TREASURY BILLS 1.4 0.25 0.3 0.8 0.8 0.4 0.3 0.4
* Yield and Duration statistics are for a proxy index based on similar maturity, the Bloomberg Barclays U.S. Treasury 7-10 Year Index
Data sources: Wilshire Compass, Bloomberg Barclays, U.S. Treasury
©2017 Wilshire Associates. 36
Item 6a, Attachment 1, Page 37 of 62
W i l s h i r e C o n s u l t i n g
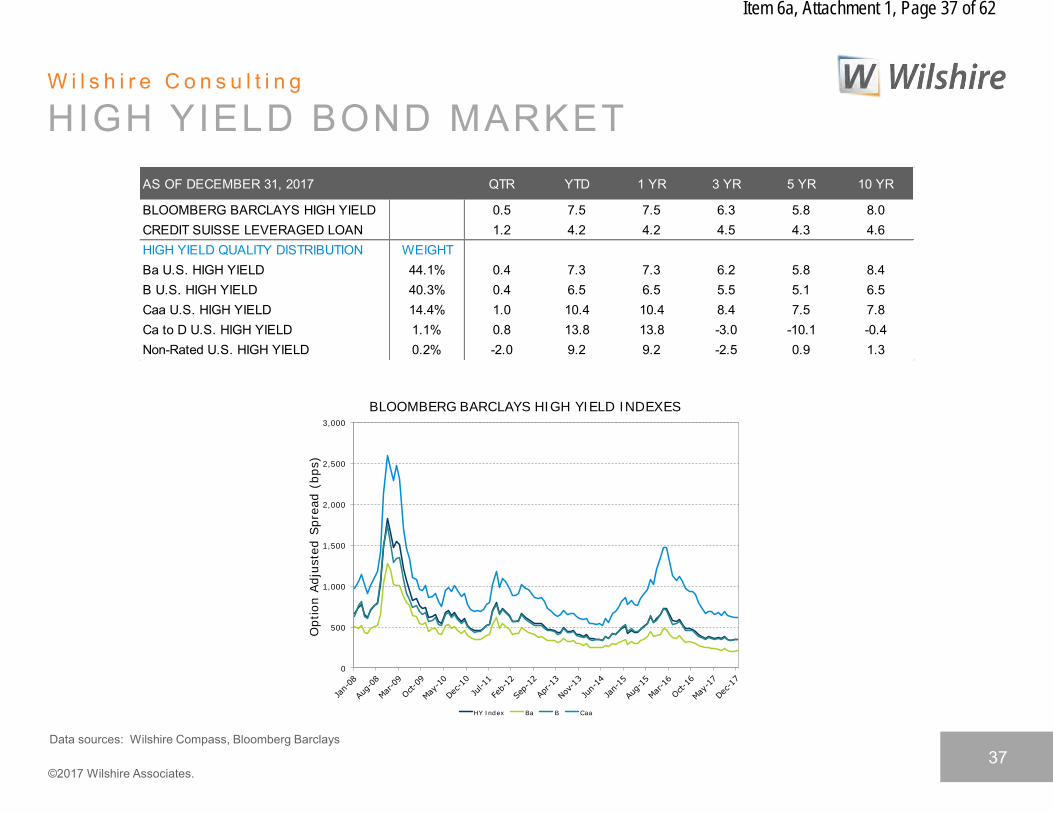
HIGH YIELD BOND MARKET
AS OF DECEMBER 31, 2017 QTR YTD 1 YR 3 YR 5 YR 10 YR
BLOOMBERG BARCLAYS HIGH YIELD 0.5 7.5 7.5 6.3 5.8 8.0CREDIT SUISSE LEVERAGED LOAN 1.2 4.2 4.2 4.5 4.3 4.6HIGH YIELD QUALITY DISTRIBUTION WEIGHTBa U.S. HIGH YIELD 44.1% 0.4 7.3 7.3 6.2 5.8 8.4B U.S. HIGH YIELD 40.3% 0.4 6.5 6.5 5.5 5.1 6.5Caa U.S. HIGH YIELD 14.4% 1.0 10.4 10.4 8.4 7.5 7.8Ca to D U.S. HIGH YIELD 1.1% 0.8 13.8 13.8 -3.0 -10.1 -0.4Non-Rated U.S. HIGH YIELD 0.2% -2.0 9.2 9.2 -2.5 0.9 1.3
0
500
1,000
1,500
2,000
2,500
3,000
Option A
dju
ste
d S
pre
ad (
bps)
BLOOMBERG BARCLAYS HIGH YIELD INDEXES
HY Index Ba B Caa
Data sources: Wilshire Compass, Bloomberg Barclays
©2017 Wilshire Associates. 37
Item 6a, Attachment 1, Page 38 of 62
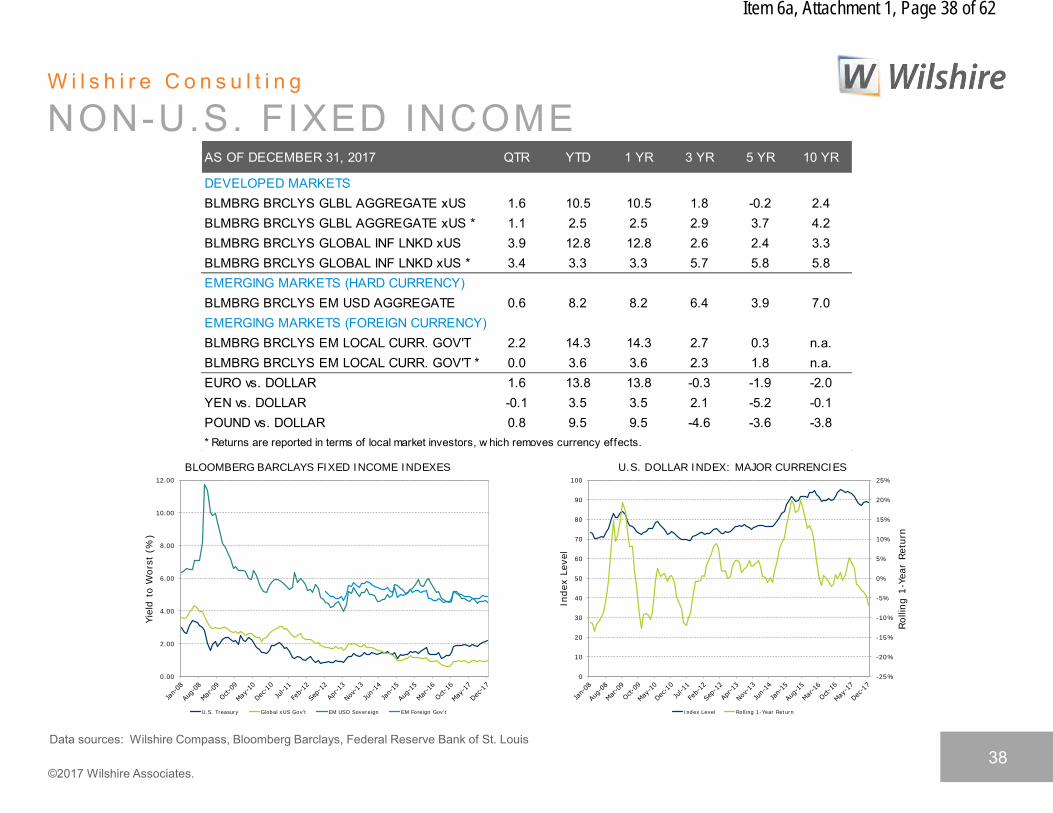
W i l s h i r e C o n s u l t i n g
NON-U.S. FIXED INCOME AS OF DECEMBER 31, 2017 QTR YTD 1 YR 3 YR 5 YR 10 YR
DEVELOPED MARKETSBLMBRG BRCLYS GLBL AGGREGATE xUS 1.6 10.5 10.5 1.8 -0.2 2.4BLMBRG BRCLYS GLBL AGGREGATE xUS * 1.1 2.5 2.5 2.9 3.7 4.2BLMBRG BRCLYS GLOBAL INF LNKD xUS 3.9 12.8 12.8 2.6 2.4 3.3BLMBRG BRCLYS GLOBAL INF LNKD xUS * 3.4 3.3 3.3 5.7 5.8 5.8EMERGING MARKETS (HARD CURRENCY)BLMBRG BRCLYS EM USD AGGREGATE 0.6 8.2 8.2 6.4 3.9 7.0EMERGING MARKETS (FOREIGN CURRENCY)BLMBRG BRCLYS EM LOCAL CURR. GOV'T 2.2 14.3 14.3 2.7 0.3 n.a.BLMBRG BRCLYS EM LOCAL CURR. GOV'T * 0.0 3.6 3.6 2.3 1.8 n.a.EURO vs. DOLLAR 1.6 13.8 13.8 -0.3 -1.9 -2.0YEN vs. DOLLAR -0.1 3.5 3.5 2.1 -5.2 -0.1POUND vs. DOLLAR 0.8 9.5 9.5 -4.6 -3.6 -3.8* Returns are reported in terms of local market investors, w hich removes currency effects.
0.00
2.00
4.00
6.00
8.00
10.00
12.00
Yie
ld t
o W
ors
t (%
)
BLOOMBERG BARCLAYS FIXED INCOME INDEXES
U.S. Treasury Global xUS Gov't EM USD Sovereign EM Foreign Gov't
-25%
-20%
-15%
-10%
-5%
0%
5%
10%
15%
20%
25%
0
10
20
30
40
50
60
70
80
90
100
Rollin
g 1
-Year
Retu
rn
Index L
evel
U.S. DOLLAR INDEX: MAJOR CURRENCIES
Index Level Rolling 1-Year Return
Data sources: Wilshire Compass, Bloomberg Barclays, Federal Reserve Bank of St. Louis
©2017 Wilshire Associates. 38

Item 6a, Attachment 1, Page 39 of 62
W i l s h i r e C o n s u l t i n g
Income – Performance
Market
Value Qtr 1-Year 3-Year 5-Year 10-Year VaR
5-year
Sharpe
Ratio
5-year
Info
Ratio
INCOME 65.6 1.3% 7.2% 3.7% 3.3% 6.0% $7.3 bil 0.6 1.3
Income Policy Benchmark 1.3% 6.6% 3.0% 2.5% 5.3% 0.4 0.0
Value Added 0.0% 0.6% 0.7% 0.8% 0.7%
U.S. Income 59.8 1.4% 6.7% 3.9% 3.7% 6.3% 0.8 1.4
U.S. Income Policy Benchmark 1.3% 6.0% 3.2% 2.9% 5.6% 0.5 0.0
Value Added 0.1% 0.7% 0.7% 0.8% 0.7%
Non-U.S. Income 5.7 1.2% 12.6% 2.0% -0.5% 3.1% -0.2 0.8
Non-US Income Policy Benchmark 1.3% 11.6% 1.8% -1.0% 2.1% -0.2 0.0
Value Added -0.1% 1.0% 0.2% 0.5% 1.0%
©2017 Wilshire Associates. 39

Item 6a, Attachment 1, Page 40 of 62
W i l s h i r e C o n s u l t i n g
Income – Rolling Excess Returns
©2017 Wilshire Associates. 40

Item 6a, Attachment 1, Page 41 of 62
W i l s h i r e C o n s u l t i n g
Income – Rolling Tracking Error
©2017 Wilshire Associates. 41

Item 6a, Attachment 1, Page 42 of 62
W i l s h i r e C o n s u l t i n g
U.S. Income – Rolling Excess Returns
©2017 Wilshire Associates. 42

Item 6a, Attachment 1, Page 43 of 62
W i l s h i r e C o n s u l t i n g
U.S. Income – Rolling Tracking Error
©2017 Wilshire Associates. 43
Item 6a, Attachment 1, Page 44 of 62
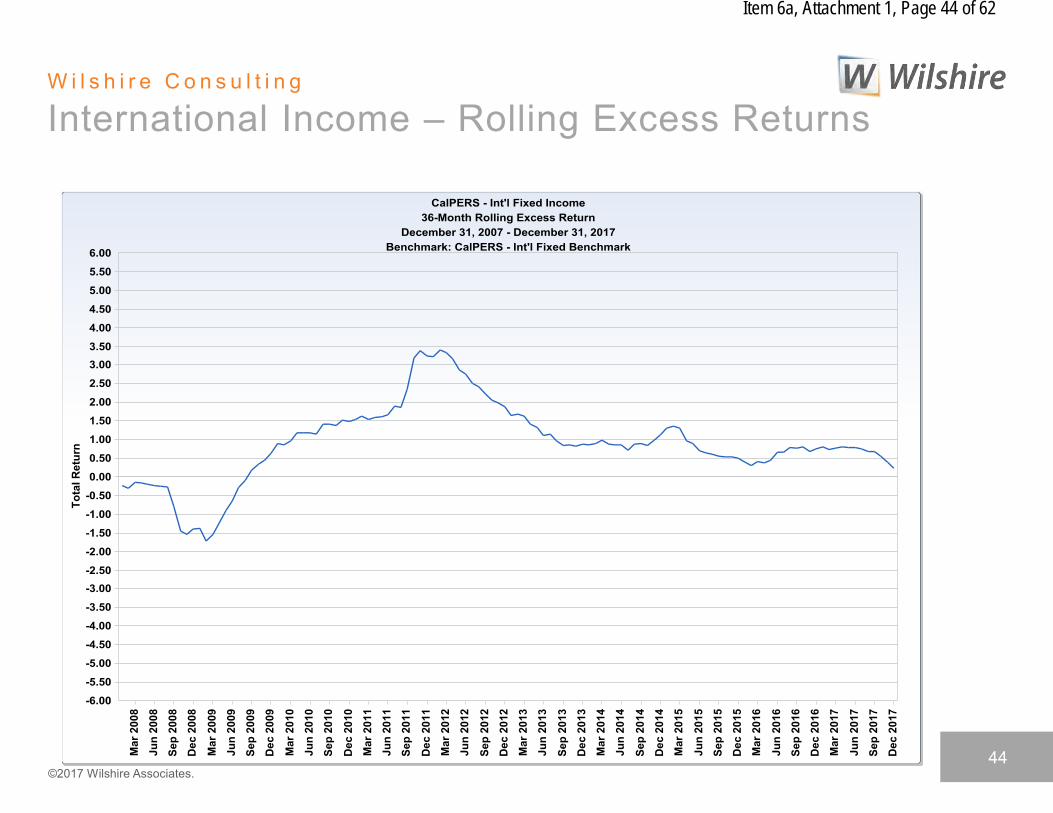
W i l s h i r e C o n s u l t i n g
International Income – Rolling Excess Returns
©2017 Wilshire Associates. 44

Item 6a, Attachment 1, Page 45 of 62
W i l s h i r e C o n s u l t i n g
International Income – Rolling Tracking Error
©2017 Wilshire Associates. 45
Item 6a, Attachment 1, Page 46 of 62
W i l s h i r e C o n s u l t i n g
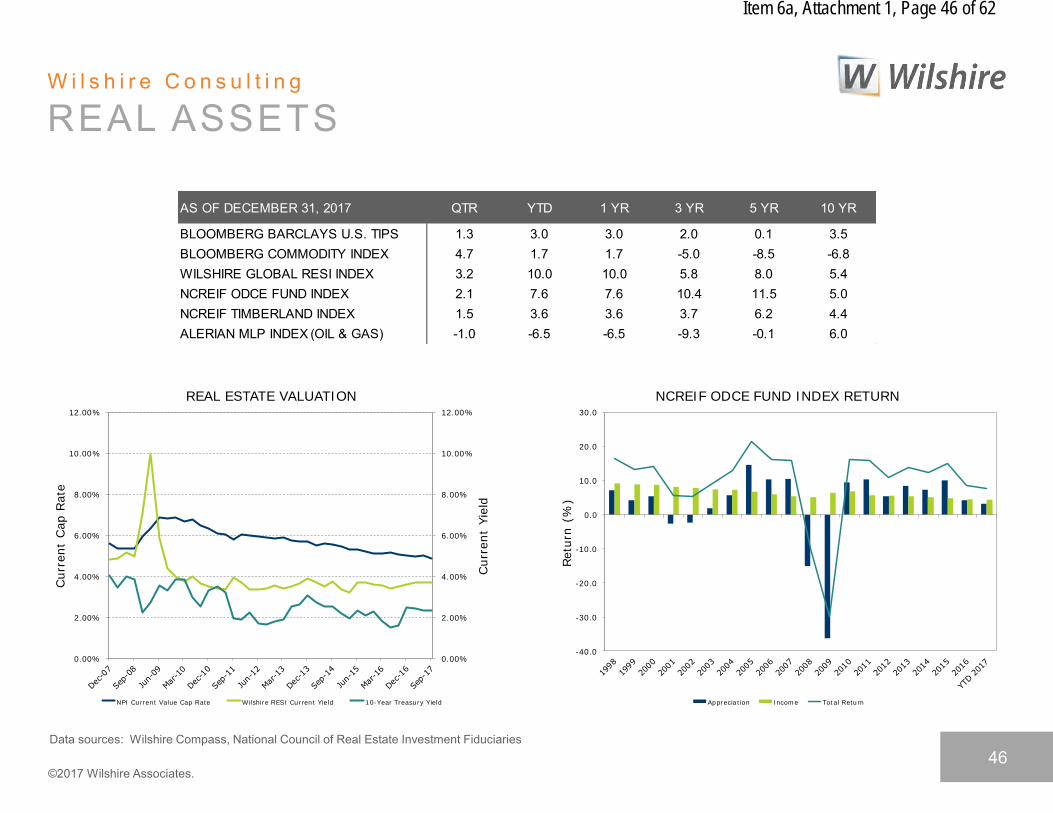
REAL ASSETS
AS OF DECEMBER 31, 2017 QTR YTD 1 YR 3 YR 5 YR 10 YR
BLOOMBERG BARCLAYS U.S. TIPS 1.3 3.0 3.0 2.0 0.1 3.5BLOOMBERG COMMODITY INDEX 4.7 1.7 1.7 -5.0 -8.5 -6.8WILSHIRE GLOBAL RESI INDEX 3.2 10.0 10.0 5.8 8.0 5.4NCREIF ODCE FUND INDEX 2.1 7.6 7.6 10.4 11.5 5.0NCREIF TIMBERLAND INDEX 1.5 3.6 3.6 3.7 6.2 4.4ALERIAN MLP INDEX (OIL & GAS) -1.0 -6.5 -6.5 -9.3 -0.1 6.0
0.00%
2.00%
4.00%
6.00%
8.00%
10.00%
12.00%
0.00%
2.00%
4.00%
6.00%
8.00%
10.00%
12.00%
Curr
ent
Yie
ld
Curr
ent
Cap R
ate
REAL ESTATE VALUATION
NPI Current Value Cap Rate Wilshire RESI Current Yield 10-Year Treasury Yield
-40.0
-30.0
-20.0
-10.0
0.0
10.0
20.0
30.0
Retu
rn (
%)
NCREIF ODCE FUND INDEX RETURN
Appreciation Income Total Return
Data sources: Wilshire Compass, National Council of Real Estate Investment Fiduciaries
©2017 Wilshire Associates. 46
Item 6a, Attachment 1, Page 47 of 62
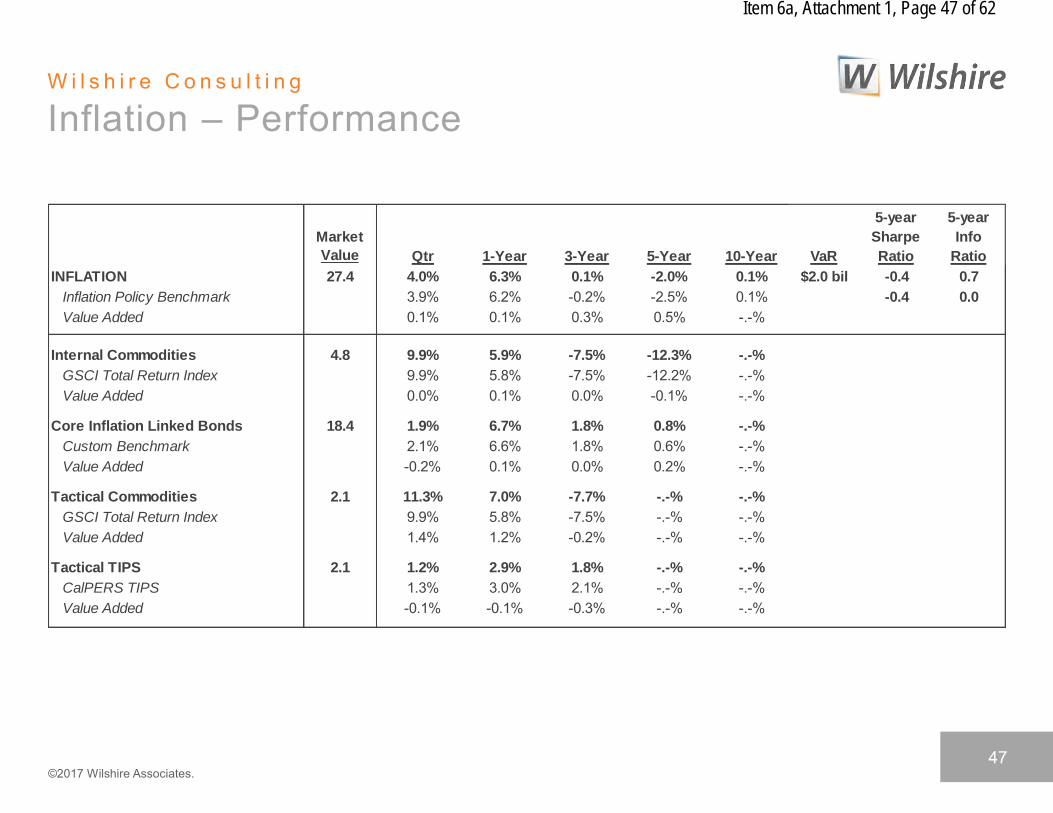
W i l s h i r e C o n s u l t i n g
Inflation – Performance
Market
Value Qtr 1-Year 3-Year 5-Year 10-Year VaR
5-year
Sharpe
Ratio
5-year
Info
Ratio
INFLATION 27.4 4.0% 6.3% 0.1% -2.0% 0.1% $2.0 bil -0.4 0.7
Inflation Policy Benchmark 3.9% 6.2% -0.2% -2.5% 0.1% -0.4 0.0
Value Added 0.1% 0.1% 0.3% 0.5% -.-%
Internal Commodities 4.8 9.9% 5.9% -7.5% -12.3% -.-%
GSCI Total Return Index 9.9% 5.8% -7.5% -12.2% -.-%Value Added 0.0% 0.1% 0.0% -0.1% -.-%
Core Inflation Linked Bonds 18.4 1.9% 6.7% 1.8% 0.8% -.-%
Custom Benchmark 2.1% 6.6% 1.8% 0.6% -.-%Value Added -0.2% 0.1% 0.0% 0.2% -.-%
Tactical Commodities 2.1 11.3% 7.0% -7.7% -.-% -.-%
GSCI Total Return Index 9.9% 5.8% -7.5% -.-% -.-%Value Added 1.4% 1.2% -0.2% -.-% -.-%
Tactical TIPS 2.1 1.2% 2.9% 1.8% -.-% -.-%
CalPERS TIPS 1.3% 3.0% 2.1% -.-% -.-%Value Added -0.1% -0.1% -0.3% -.-% -.-%
©2017 Wilshire Associates. 47
Item 6a, Attachment 1, Page 48 of 62
W i l s h i r e C o n s u l t i n g
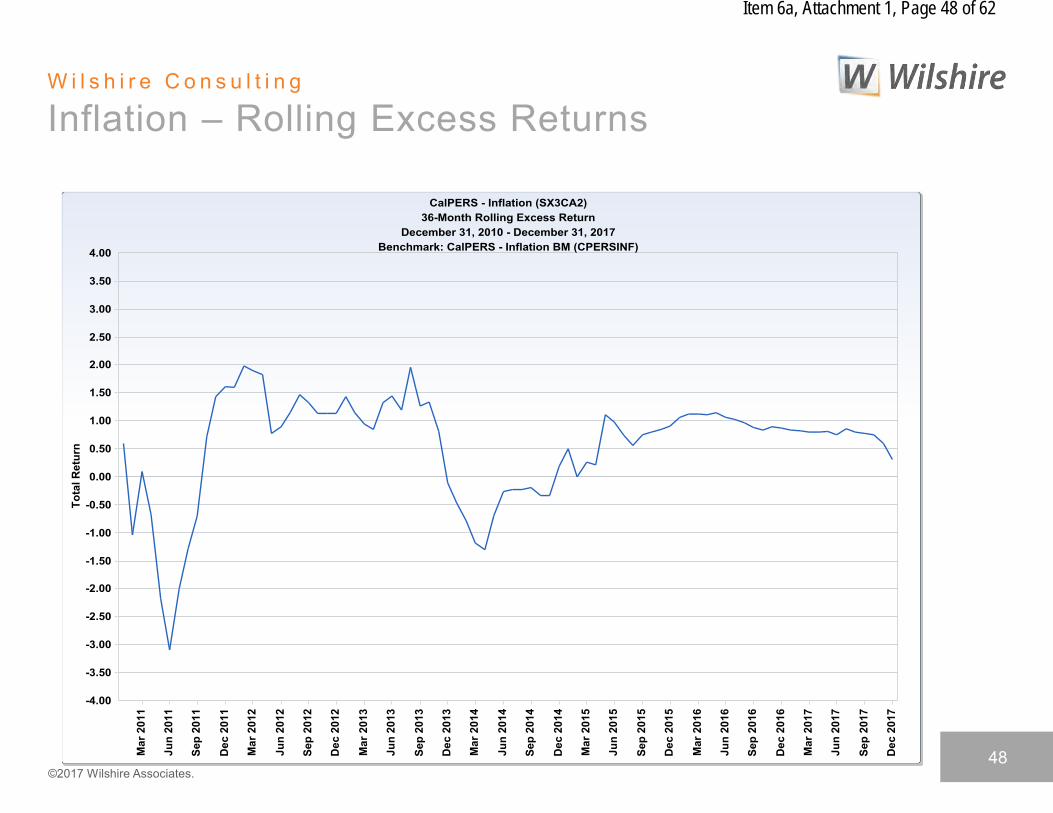
Inflation – Rolling Excess Returns
©2017 Wilshire Associates. 48
Item 6a, Attachment 1, Page 49 of 62
W i l s h i r e C o n s u l t i n g
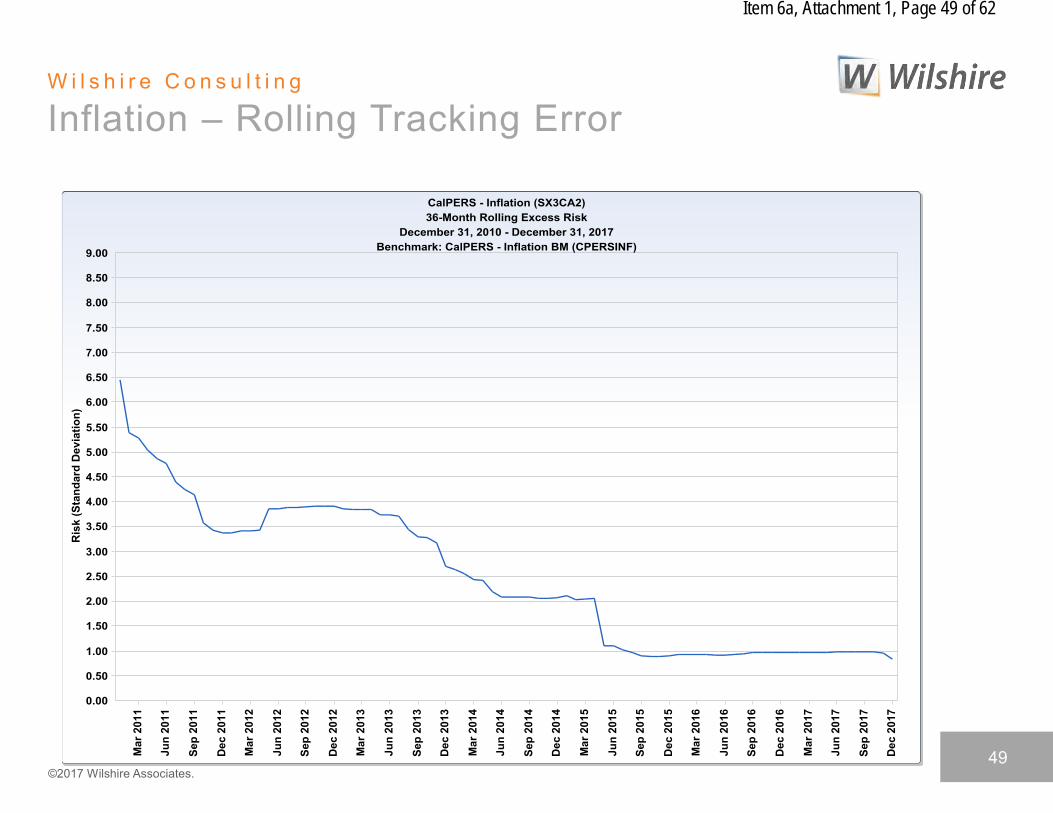
Inflation – Rolling Tracking Error
©2017 Wilshire Associates. 49
Item 6a, Attachment 1, Page 50 of 62
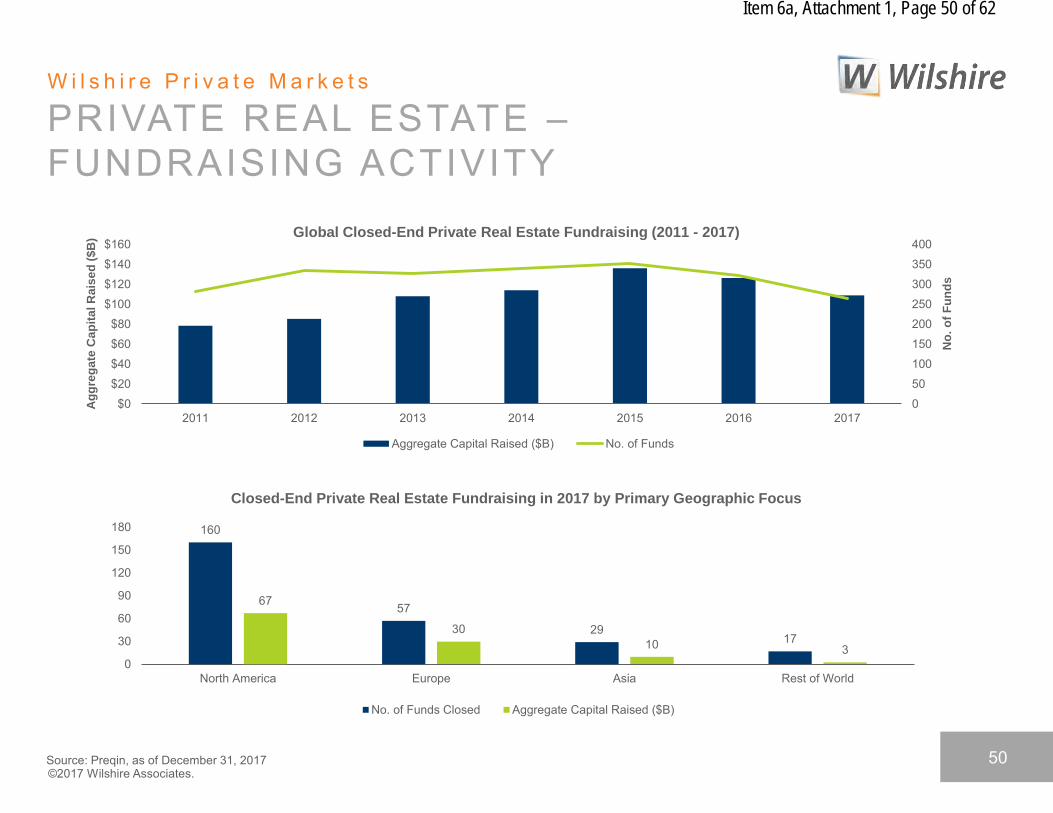
W i l s h i r e P r i v a t e M a r k e t s
PRIVATE REAL ESTATE – FUNDRAISING ACTIVITY
Ag
gre
ga
te C
ap
ita
l R
ais
ed
($
B) Global Closed-End Private Real Estate Fundraising (2011 - 2017)
$160 400
$140 350
$120 300
$100 250
$80 200
$60 150
$40 100
$20 50
$0 0 2011 2012 2013 2014 2015 2016 2017
Aggregate Capital Raised ($B) No. of Funds
Closed-End Private Real Estate Fundraising in 2017 by Primary Geographic Focus
180 160
150
120
90 67 57 60
30 29 30 1710 3 0
North America Europe Asia Rest of World
No. of Funds Closed Aggregate Capital Raised ($B)
No
. o
f F
un
ds
Source: Preqin, as of December 31, 2017 ©2017 Wilshire Associates.
50
Item 6a, Attachment 1, Page 51 of 62
W i l s h i r e C o n s u l t i n g
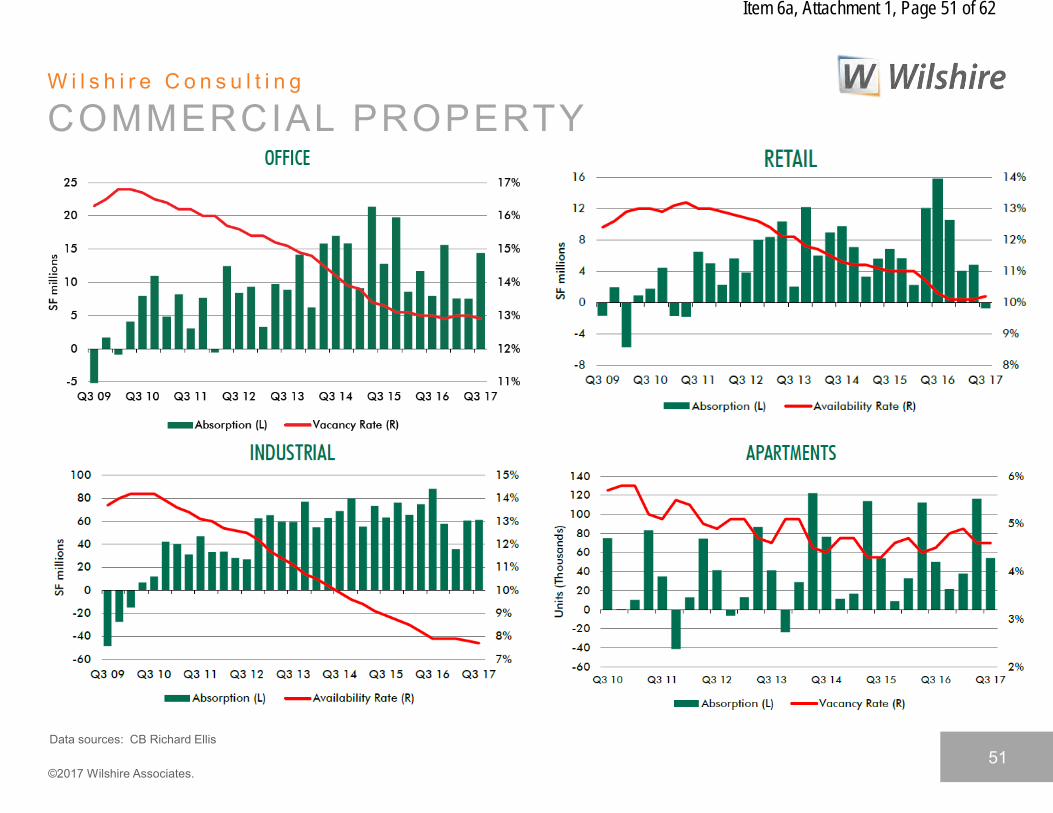
COMMERCIAL PROPERTY
Data sources: CB Richard Ellis
©2017 Wilshire Associates. 51
Item 6a, Attachment 1, Page 52 of 62
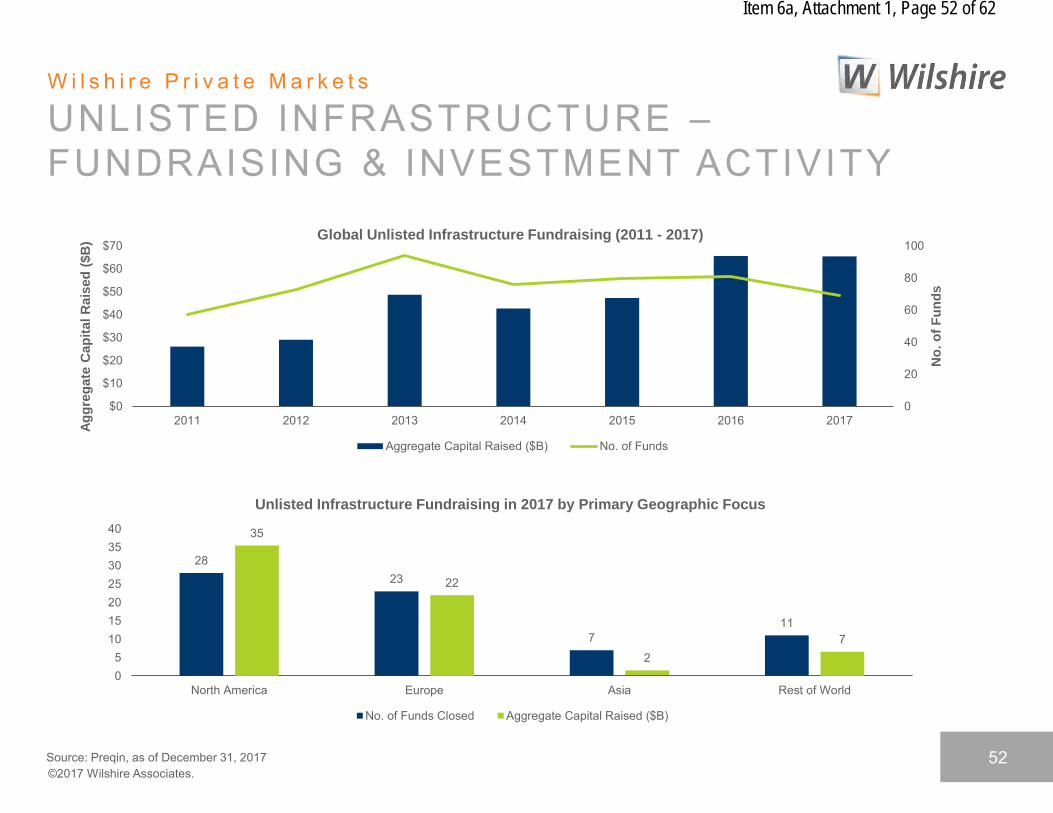
W i l s h i r e P r i v a t e M a r k e t s
UNLISTED INFRASTRUCTURE – FUNDRAISING & INVESTMENT ACTIVITY
0
20
40
60
80
$0
$10
$20
$30
$40
$50
$60
No
. o
f F
un
ds
Ag
gre
ga
te C
ap
ita
l R
ais
ed
($
B)
Global Unlisted Infrastructure Fundraising (2011 - 2017)$70 100
2011 2012 2013 2014 2015 2016 2017
Aggregate Capital Raised ($B) No. of Funds
Unlisted Infrastructure Fundraising in 2017 by Primary Geographic Focus
40 35 35
2830 23 22
20
15
25
11 710 7
5 2
0 North America Europe Asia Rest of World
No. of Funds Closed Aggregate Capital Raised ($B)
Source: Preqin, as of December 31, 2017 ©2017 Wilshire Associates.
52

Item 6a, Attachment 1, Page 53 of 62
W i l s h i r e C o n s u l t i n g
TIMBER
Data sources: Forest Investment Associates
©2017 Wilshire Associates. 53

Item 6a, Attachment 1, Page 54 of 62
W i l s h i r e C o n s u l t i n g
Real Assets – Performance
Market
Value Qtr 1-Year 3-Year 5-Year 10-Year VaR
5-year
Sharpe
Ratio
5-year
Info
Ratio
REAL ASSETS 36.8 2.0% 8.5% 9.4% 10.4% -0.9% $5.1 bil 1.7 0.1
Real Assets Policy Benchmark 1.6% 6.4% 9.1% 9.9% 6.4% 2.4 0.0
Value Added 0.4% 2.1% 0.3% 0.5% -7.3%
Real Estate 30.7 1.4% 7.8% 10.0% 10.9% -1.3% $4.7 bil 1.6 0.1
Real Estate Policy Benchmark 1.6% 6.7% 9.8% 10.6% 7.2% 2.3 0.0
Value Added -0.2% 1.1% 0.2% 0.3% -8.5%
Forestland 2.0 -0.1% 0.8% -3.0% -0.1% -0.4%
NCREIF Timberland Index 0.6% 3.3% 5.2% 7.1% 5.2%Value Added -0.7% -2.5% -8.2% -7.2% -5.6%
Infrastructure 4.2 8.2% 18.2% 12.4% 14.3% 13.3%
CPI + 400 BPS 1Qtr Lag 1.8% 6.3% 5.3% 5.3% 6.2%Value Added 6.4% 11.9% 7.1% 9.0% 7.1%
©2017 Wilshire Associates. 54

Item 6a, Attachment 1, Page 55 of 62
W i l s h i r e C o n s u l t i n g
Real Assets – Rolling Excess Returns
©2017 Wilshire Associates. 55
Item 6a, Attachment 1, Page 56 of 62
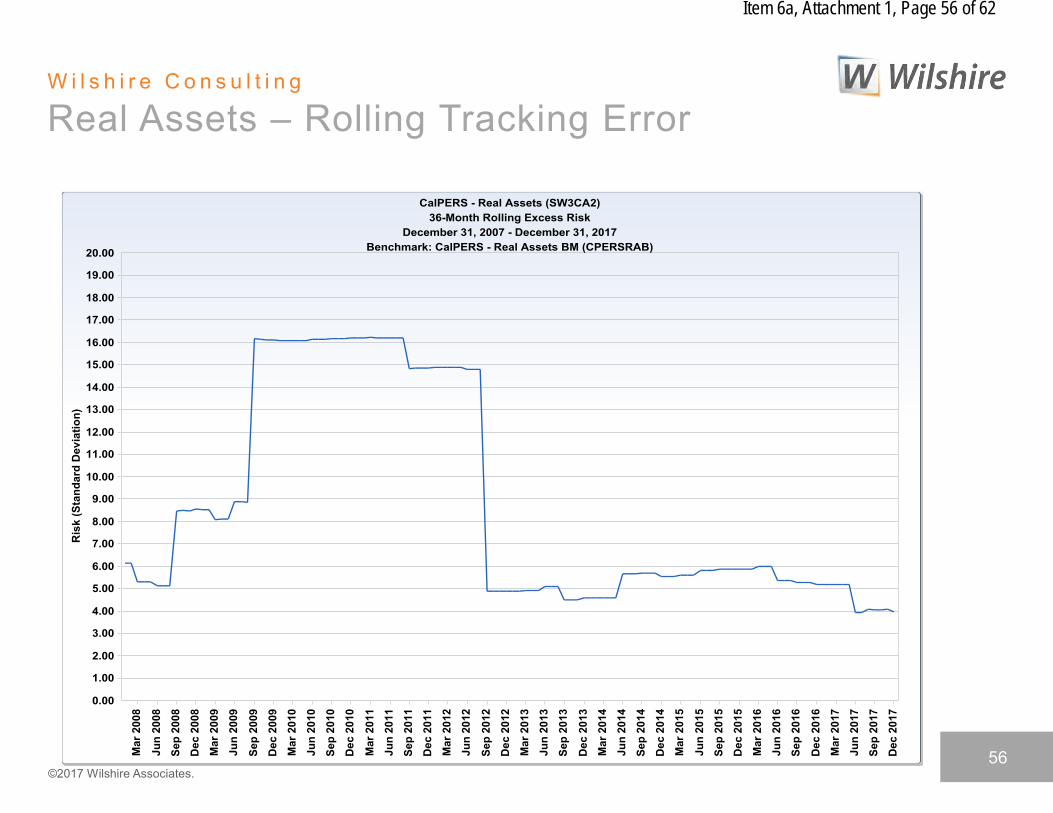
W i l s h i r e C o n s u l t i n g
Real Assets – Rolling Tracking Error
©2017 Wilshire Associates. 56
Item 6a, Attachment 1, Page 57 of 62
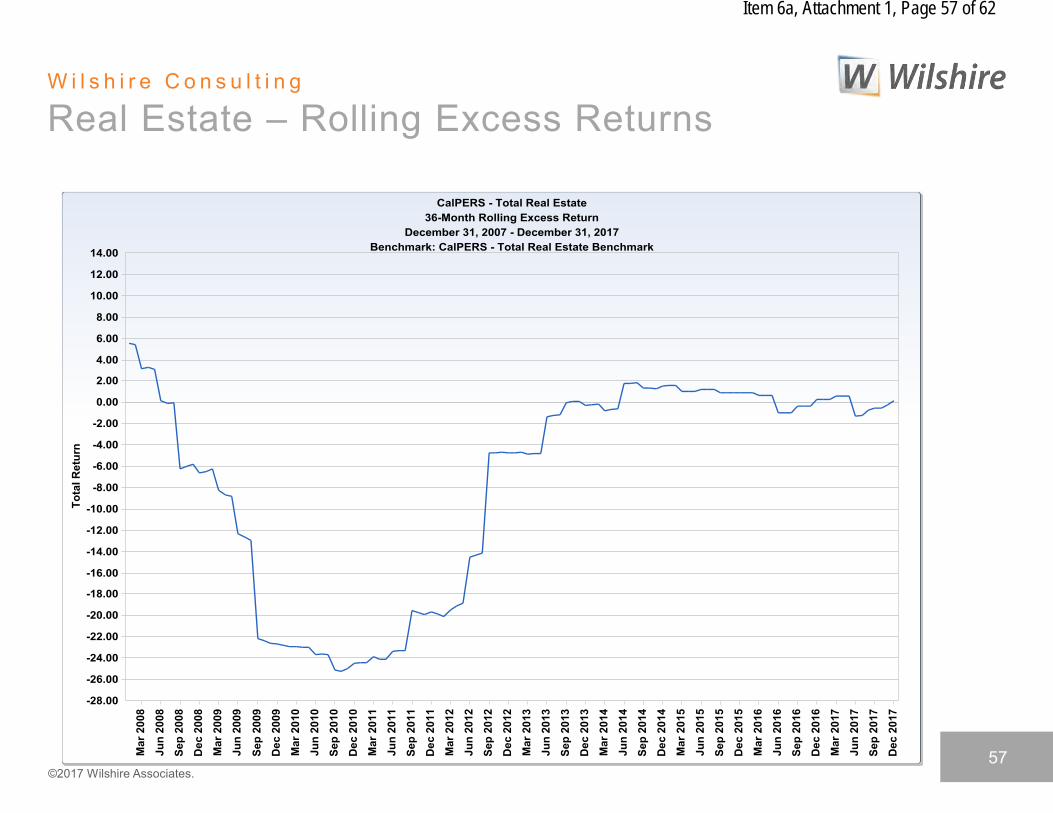
W i l s h i r e C o n s u l t i n g
Real Estate – Rolling Excess Returns
©2017 Wilshire Associates. 57

Item 6a, Attachment 1, Page 58 of 62
W i l s h i r e C o n s u l t i n g
Real Estate – Rolling Tracking Error
©2017 Wilshire Associates. 58
Item 6a, Attachment 1, Page 59 of 62
W i l s h i r e C o n s u l t i n g
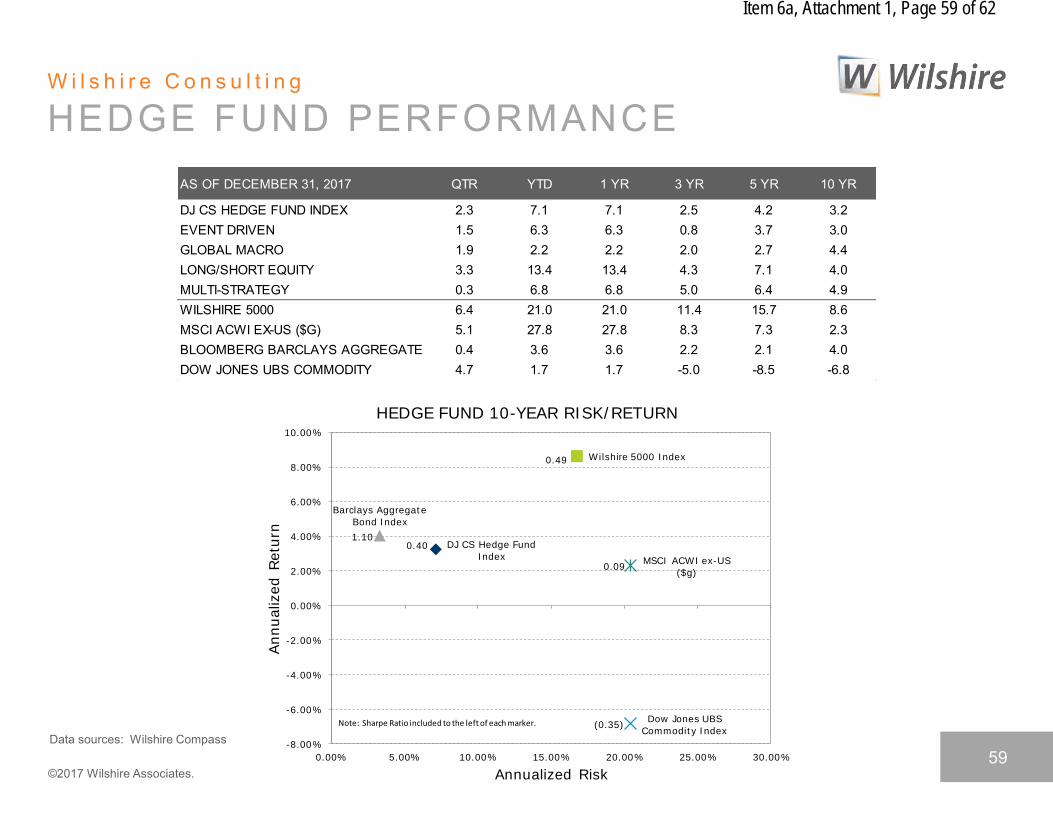
HEDGE FUND PERFORMANCE
AS OF DECEMBER 31, 2017 QTR YTD 1 YR 3 YR 5 YR 10 YR
DJ CS HEDGE FUND INDEX 2.3 7.1 7.1 2.5 4.2 3.2EVENT DRIVEN 1.5 6.3 6.3 0.8 3.7 3.0GLOBAL MACRO 1.9 2.2 2.2 2.0 2.7 4.4LONG/SHORT EQUITY 3.3 13.4 13.4 4.3 7.1 4.0MULTI-STRATEGY 0.3 6.8 6.8 5.0 6.4 4.9WILSHIRE 5000 6.4 21.0 21.0 11.4 15.7 8.6MSCI ACWI EX-US ($G) 5.1 27.8 27.8 8.3 7.3 2.3BLOOMBERG BARCLAYS AGGREGATE 0.4 3.6 3.6 2.2 2.1 4.0DOW JONES UBS COMMODITY 4.7 1.7 1.7 -5.0 -8.5 -6.8
DJ CS Hedge Fund
Index
Wilshire 5000 Index
Barclays Aggregate
Bond Index
Dow Jones UBS
Commodity Index
MSCI ACWI ex-US
($g)
0.40
0.49
1.10
(0.35)
0.09
-8.00%
-6.00%
-4.00%
-2.00%
0.00%
2.00%
4.00%
6.00%
8.00%
10.00%
0.00% 5.00% 10.00% 15.00% 20.00% 25.00% 30.00%
Annualized R
etu
rn
Annualized Risk
HEDGE FUND 10-YEAR RISK/RETURN
Note: Sharpe Ratio included to the left of each marker.
Data sources: Wilshire Compass
©2017 Wilshire Associates. 59
Item 6a, Attachment 1, Page 60 of 62
W i l s h i r e C o n s u l t i n g
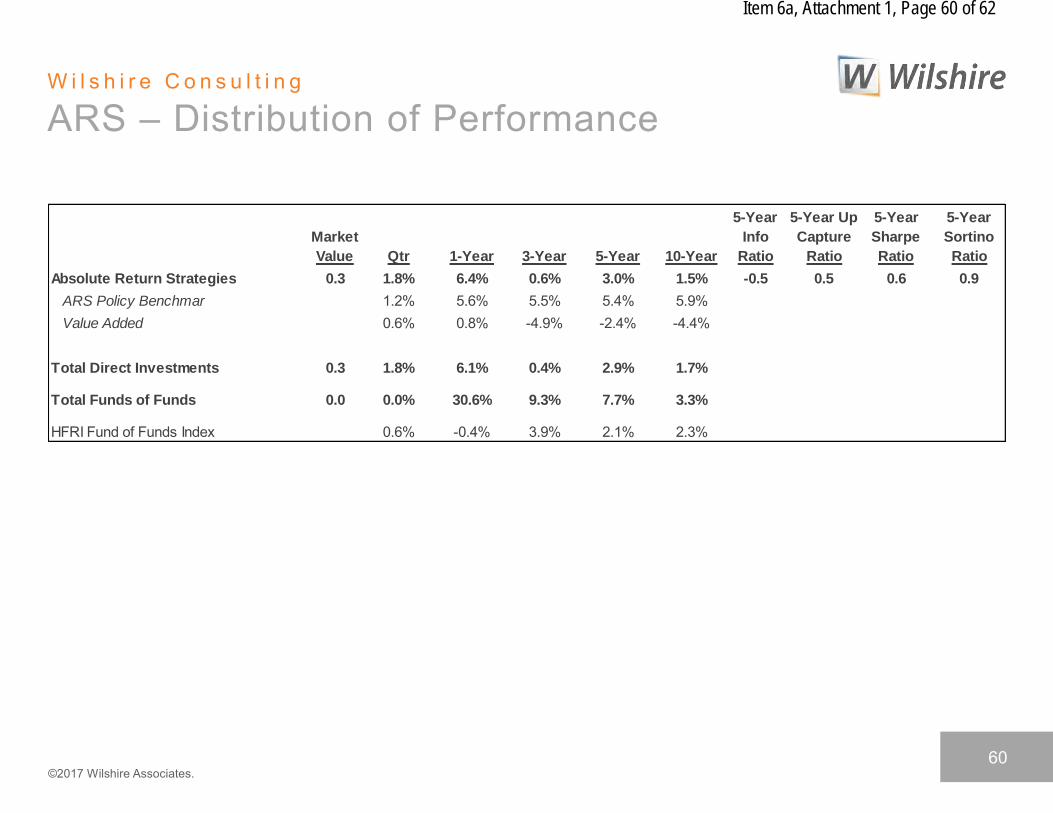
ARS – Distribution of Performance
Market
Value Qtr 1-Year 3-Year 5-Year 10-Year
5-Year
Info
Ratio
5-Year Up
Capture
Ratio
5-Year
Sharpe
Ratio
5-Year
Sortino
Ratio
Absolute Return Strategies 0.3 1.8% 6.4% 0.6% 3.0% 1.5% -0.5 0.5 0.6 0.9
ARS Policy Benchmar 1.2% 5.6% 5.5% 5.4% 5.9%Value Added 0.6% 0.8% -4.9% -2.4% -4.4%
Total Direct Investments 0.3 1.8% 6.1% 0.4% 2.9% 1.7%
Total Funds of Funds 0.0 0.0% 30.6% 9.3% 7.7% 3.3%
HFRI Fund of Funds Index 0.6% -0.4% 3.9% 2.1% 2.3%
©2017 Wilshire Associates. 60

Item 6a, Attachment 1, Page 61 of 62
W i l s h i r e C o n s u l t i n g
ASSET CLASS PERFORMANCE
ANNUALIZED5-YEAR
2012 2013 2014 2015 2016 2017 AS OF 12/2017Emrg Mrkts U.S. Equity REITs REITs MLPs Emrg Mrkts U.S. Equity
18.6% 33.1% 31.8% 4.2% 18.3% 37.7% 15.7%Developed MLPs U.S. Equity U.S. Equity High Yield Developed REITs
17.9% 27.6% 12.7% 0.7% 17.1% 25.6% 9.3%REITs Developed Core Bond Core Bond U.S. Equity U.S. Equity Developed17.6% 23.3% 6.0% 0.6% 13.4% 21.0% 8.4%
U.S. Equity High Yield MLPs T-Bills Commodities High Yield High Yield16.1% 7.4% 4.8% 0.1% 11.8% 7.5% 5.8%
High Yield REITs U.S. TIPS Developed Emrg Mrkts REITs Emrg Mrkts15.8% 1.9% 3.6% -0.4% 11.6% 4.2% 4.7%
U.S. TIPS T-Bills High Yield U.S. TIPS REITs Core Bond Core Bond7.0% 0.1% 2.5% -1.4% 7.2% 3.6% 2.1%MLPs Core Bond T-Bills High Yield U.S. TIPS U.S. TIPS T-Bills4.8% -2.0% 0.0% -4.5% 4.7% 3.0% 0.3%
Core Bond Emrg Mrkts Emrg Mrkts Emrg Mrkts Core Bond Commodities U.S. TIPS4.2% -2.3% -1.8% -14.6% 2.6% 1.7% 0.1%T-Bills U.S. TIPS Developed Commodities Developed T-Bills MLPs0.1% -8.6% -4.5% -24.7% 1.5% 0.8% -0.1%
Commodities Commodities Commodities MLPs T-Bills MLPs Commodities-1.0% -9.5% -17.0% -32.6% 0.3% -6.5% -8.5%
ASSET CLASS RETURNS - BEST TO WORST
Data sources: Wilshire Compass Note: Developed asset class is developed equity markets ex-U.S., ex-Canada
©2017 Wilshire Associates. 61
Item 6a, Attachment 1, Page 62 of 62
W i l s h i r e C o n s u l t i n g
IMPORTANT INFORMATION
This material contains confidential and proprietary information of Wilshire Associates Incorporated (Wilshire), and is intended for the exclusive use of the person to whom it is provided. It may not be disclosed, reproduced or redistributed, in whole or in part, to any other person or entity without prior written permission from Wilshire. Third party information contained herein has been obtained from sources believed to be reliable. Wilshire gives no representations or warranties as to the accuracy of such information, and accepts no responsibility or liability (including for indirect, consequential or incidental damages) for any error, omission or inaccuracy in such information and for results obtained from its use. Information and opinions are as of the date indicated, and are subject to change without notice.
This material is intended for informational purposes only and should not be construed as legal, accounting, tax, investment, or other professional advice.
This report may include estimates, projections and other "forward-looking statements." Due to numerous factors, actual events may differ substantially from those presented.
Wilshire® is a registered service mark of Wilshire Associates Incorporated, Santa Monica, California. All other trade names, trademarks, and/or service marks are the property of their respective holders.
Copyright © 2017 Wilshire Associates Incorporated. All rights reserved.
©2017 Wilshire Associates. 62


