Download - Agency CMBS Market Watch - Credit Suisse

DISCLOSURE APPENDIX AT THE BACK OF THIS REPORT CONTAINS IMPORTANT DISCLOSURES AND ANALYST CERTIFICATIONS.
CREDIT SUISSE SECURITIES RESEARCH & ANALYTICS BEYOND INFORMATION®
Client-Driven Solutions, Insights, and Access
26 February 2016 United States
Fixed Income Research Securitized Products
FOR INSTITUTIONAL CLIENTS ONLY
Agency CMBS Market Watch
Research Analysts Serif Ustun
212 538 4582 [email protected]
Roger Lehman 212 325 2123
Benjamin Rozyn 212 538 2173
Market Update ■ The Agency CMBS market continued to grow in 2015. Total issuance was
about $120 billion across the various sectors we track, of which nearly $90 billion came from the GSEs.
■ GSE loan production volume jumped nearly 57% last year after FHFA broadened its affordable housing criteria in May. This effectively provided more lending capacity for the lenders, above the $30 billion cap set for each GSE in 2015.
■ The annual cap was increased to $31 billion for this year (subject to quarterly review by FHFA), and we expect total GSE issuance to be approximately $100 billion (including loans with affordable components).
■ Prepayments and delinquencies remained low for both Freddie Mac K-deal and Fannie Mae DUS loans.
■ The project loan market faced headwinds with increased competition from private lenders and GSEs (since targeted affordable loans are not counted toward their limits). GNR securitizations also dropped to $15 billion in 2015 from $19 billion in the prior year.
■ Despite a year-over-year decline in issuance, we think project loan production is poised to increase this year. Low interest rates, recently announced mortgage insurance premium reductions as well as the new HUD guidelines for lower project capital needs assessment (PCNA) reserves should lead to a greater amount of FHA lending.
■ Multifamily permits are rising, which should also translate into increasing construction project loan volumes.
■ With higher loan production, we expect GNR REMIC issuance this year to rebound. Additionally, the interest rate reduction program (LM IRR) continues to be well utilized by servicers/lenders and results in newly issued GN pools from the existing FHA loans.
■ Project loan prepayments remained robust last year with nearly $12 billion prepaid. About half of the prepayments were due to LM IRRs. The most active cohorts were 2010 and 2011, followed by 2013.
■ Prepayment speeds for 2012 and later cohorts are still below 15% CPR. However with more seasoning, we expect these cohorts to prepay faster. We present historical prepayment seasoning curves by loan age for construction and refi project loans.
Links for Agency CMBS reports: Compendium Report
Agency CMBS Market Primer

26 February 2016
Agency CMBS Market Watch 2
Table of contents Figure 1: Agency CMBS spreads table .................................................................... 3 Figure 2: Freddie Mac K-Deal spreads .................................................................... 3 Figure 3: Fannie Mae ACES (FNA) spreads ............................................................ 3 Figure 4: GNR spreads ............................................................................................ 3 Figure 5: SBA and SBIC spreads ............................................................................. 3 Figure 6: ACMBS primary dealer net positions ........................................................ 4 Figure 7: Agency CMBS transaction volume ........................................................... 4 Figure 8: Historical issuance .................................................................................... 4 Figure 9: REMIC issuance ....................................................................................... 4 Figure 10: Outstanding Agency CMBS: $468 billion ................................................ 4
Ginnie Mae Project Loans 6 Figure 11: GNR REMIC issuance ............................................................................ 6 Figure 12: GN project loan MBS issuance by program ............................................ 6 Figure 13: Project loan production volume and 10-year UST rates ......................... 7 Figure 14: Multifamily building permits ..................................................................... 7 Figure 15: GN MBS prepayments ............................................................................ 8 Figure 16: GN MBS cohort summary ....................................................................... 8 Figure 17: Historical CPRs by cohort (loan origination year) ................................... 8 Figure 18: Prepayment seasoning curves by loan age ............................................ 9 Figure 19: New construction loan (Sec 221d4, Sec 232) prepayment seasoning curves ..................................................................................................................... 10 Figure 20: Refi (Sec 223a7 & Sec 223f) prepayment seasoning curves ............... 10 Figure 21: Default seasoning curves by loan age .................................................. 10 Figure 22: Worst performing GNR deals by vintage .............................................. 10
Freddie Mac: K-Deals 11 Figure 23: Historical K-deal issuance ..................................................................... 11 Figure 24: GSEs multifamily loan production ......................................................... 11 Figure 25: Freddie Mac K-Deal pipeline ................................................................. 11 Figure 26: New issue K-Deals (10-year, 7-year and floating rate series) .............. 12 Figure 27: Delinquent and/or specially serviced loans in K-deals .......................... 12 Figure 28: Historical K-deal losses ......................................................................... 12 Figure 29: 10-year K-deal new issue spreads versus conduit CMBS .................... 13 Figure 30: Interest-only loans in 10-year K-deals .................................................. 13 Figure 31: 10-year K-deal LTVs ............................................................................. 13
Fannie Mae DUS 14 Figure 32: GSEs multifamily loan production ......................................................... 14 Figure 33: Fannie Mae DUS MBS loan types ........................................................ 14 Figure 34: Fannie Mae FNA issuance (GeMS and other FNAs) ............................ 14 Figure 35: FNA 10yr spreads versus conduit CMBS and K-deal 10yr A2s ........... 15 Figure 36: New issue FNA deals ............................................................................ 15 Figure 37: Prepayments in post 2009 FNA REMICs .............................................. 15
SBA 504/CDC 16 Figure 38: Prepayments in post 2009 FNA REMICs .............................................. 16 Figure 39: Voluntary and Involuntary prepay speeds ............................................. 16 Figure 40: SBA 504 payment speeds by cohort ..................................................... 17
SBIC Debentures and Participating Securities 18 Figure 41: SBIC Debentures payment speeds ....................................................... 18 Figure 42: SBIC Participating Securities (PSPC) payment speeds ....................... 18

26 February 2016
Agency CMBS Market Watch 3
Figure 1: Agency CMBS spreads table (spread to swap)
As of MoM Last 3 mo Last 6 mo 2015 2014 Sector Avg Life 2/25/2016 Δ bps Δ bps Tight/Wide Δ bps Tight/Wide Average Range Average Range GNR 5yr 130 15 20 110 / 130 25 105 / 130 98 85 / 115 113 105 / 125 10yr 140 17 30 110 / 140 30 110 / 140 106 100 / 115 118 110 / 130 IO 250 50 50 200 / 250 75 175 / 250 163 130 / 200 178 130 / 230 FNA 5yr 88 13 29 59 / 90 46 42 / 90 42 28 / 70 41 30 / 55 10yr 95 -3 18 77 / 110 37 58 / 110 60 46 / 90 45 32 / 56 IO 175 50 50 125 / 175 50 125 / 175 126 125 / 130 153 120 / 200 FREMF 5yr 80 12 22 58 / 80 38 42 / 80 38 25 / 62 37 28 / 54 7yr 85 15 27 58 / 85 43 40 / 85 44 34 / 70 34 28 / 40 10yr 93 2 17 76 / 105 36 56 / 105 57 43 / 87 42 30 / 53 Class B 445 75 110 335 / 480 235 210 / 480 206 145 / 345 156 120 / 205 Class C 700 210 250 450 / 750 445 250 / 750 270 190 / 460 220 157 / 335 IO (X1) 250 25 25 225 / 250 90 160 / 250 159 125 / 225 119 90 / 175 SBA 504 10yr 85 12 20 65 / 85 35 50 / 85 51 38 / 70 35 27 / 45 SBIC 10yr 100 17 25 75 / 100 45 55 / 100 58 48 / 80 46 40 / 55 Conduit CMBS 5yr 96 9 11 85 / 96 25 71 / 96 66 48 / 86 60 52 / 77 10yr 163 15 35 128 / 165 44 115 / 165 104 80 / 137 85 71 / 95 Source: Credit Suisse
Figure 2: Freddie Mac K-Deal spreads Figure 3: Fannie Mae ACES (FNA) spreads
Credit Suisse Credit Suisse
Figure 4: GNR spreads Figure 5: SBA and SBIC spreads
Credit Suisse Credit Suisse
9385
80
20
30
40
50
60
70
80
90
100
110
2/15 5/15 8/15 11/15 2/16
FREMF 10yrFREMF 7yrFREMF 5yr
bp
95
88
20
30
40
50
60
70
80
90
100
110
2/15 5/15 8/15 11/15 2/16
FNA 10yr
FNA 5yr
bp
140
130
80
90
100
110
120
130
140
2/15 5/15 8/15 11/15 2/16
GNR 10yrGNR 5yr
bp
100
85
2030405060708090
100110
2/15 5/15 8/15 11/15 2/16
SBIC10yrSBAP 504 10yr
bp

26 February 2016
Agency CMBS Market Watch 4
Figure 6: ACMBS primary dealer net positions Figure 7: Agency CMBS transaction volume
Credit Suisse, NY Fed Credit Suisse, NY Fed
Figure 8: Historical issuance ($billion) Ginnie Mae Project Loans Fannie Mae Freddie Mac Small Business Administration
Vintage /Cohort
GNR REMICs
GN MBS (Sec 242 Hospital)
GN MBS
(other)*
FNA REMICs (ACES)
FN Multifamily
Megas
FN DUS MBS
(other)*
FREMF K-Deals
FRESB Small
Balance
SBA 7(a)
Pools
SBAP 504 CDC
SBIC Deben- tures
Total Agency CMBS
2016ytd 2.4 0.0 0.9 1.9 0.0 5.7 5.5 0.3 1.2 0.6 0.0 18.4 2015 15.6 0.8 7.0 14.0 3.3 30.7 35.4 1.8 6.5 3.4 2.4 120.8 2014 18.6 0.6 1.4 13.3 1.6 17.9 21.3 0.0 5.7 3.7 2.0 86.1 2013 23.6 0.9 0.6 11.6 2.4 20.2 28.0 0.0 4.6 4.7 1.7 98.2 2012 19.3 1.6 0.2 13.4 2.9 19.0 21.2 0.0 4.3 5.1 1.4 88.4 2011 15.1 0.6 0.4 4.8 4.3 14.1 13.7 0.0 4.3 3.7 1.4 62.4 2010 11.1 1.3 0.8 4.1 1.4 13.4 6.4 0.0 3.3 3.5 0.9 46.3 2009 5.9 1.0 0.5 1.1 1.2 9.4 2.1 0.0 2.8 3.5 0.9 28.5 *Standalone MBS pools which have not been securitized in multiple-pool deals (i.e., in REMICs and/or Megas) Source: Credit Suisse, Ginnie Mae, Fannie Mae, Freddie Mac, the BLOOMBERG PROFESSIONAL™ service, CMAlert
Figure 9: REMIC issuance Figure 10: Outstanding Agency CMBS: $468 billion
Note: Non-guaranteed classes of FREMF K-Deals are included Credit Suisse, the BLOOMBERG PROFESSIONAL™ service, CMAlert Standalone pools (i.e., not been securitized in multiple-pool deals)
Credit Suisse, Ginnie Mae, GSEs, the BLOOMBERG PROFESSIONAL™ service
$6.2
5.05.56.06.57.07.58.08.59.09.5
10.0
Feb 15 May 15 Aug 15 Nov 15 Feb 16
$bn
0
100
200
300
400
500
600
700
800
Feb 15 May 15 Aug 15 Nov 15 Feb 16
Avg. VolumeRunning 4-weeks avg
$mn
15.1 19.3 23.6 18.6 15.62.4
4.8
13.411.6
13.3 14.0
1.9
13.7
21.228.0
21.335.4
5.5
33.6
53.9
63.1
53.3
65.0
9.8
0
10
20
30
40
50
60
70
2011 2012 2013 2014 2015 2016ytd
FREMFFNAGNR
$bn
$80b
$18b
$126b
2
$54b
$109b
$14b
$27b $27b
$9b
GN Project Loan REMIC
GN MBS(standalone)†
FREMF K-Deal
FNA /GeMS
FN MFMega
FN DUS MBS(standalone)†
SBA504/CDC
SBIC
SBA7(a)
FRESB

26 February 2016
Agency CMBS Market Watch 5
Tracking Agency CMBS issuance Our historical Agency CMBS issuance figures, shown in Figure 8, are comprehensive and as a result may differ from other numbers reported in the marketplace.
Most of the headline Agency CMBS figures only refer to REMIC-style securitizations for Ginnie Mae (GNRs), Freddie Mac (K-Deals1) and Fannie Mae (GeMS/ACES). We include other investable products, such as standalone Fannie Mae DUS MBS and Fannie Multifamily Megas, as well as Small Business Administration securities (SBA7(a), SBA 504 and SBIC Debentures). We believe these broader issuance figures are more relevant in showing the true size of the Agency CMBS market.
We use deal securitization year (vintage) for the pools in Fannie Mae DUS REMIC (GeMS/ACES) deals, regardless of the actual MBS pool issuance year, to avoid double counting. For example, for a seasoned DUS MBS securitized in a 2015 GeMS deal, its balance is captured under FNA REMICs for 2015, not in its original cohort year.
Accordingly, the FN DUS MBS (other) bucket in Figure 8 is being revised each month retroactively, when seasoned single pass-through DUS MBS pools are securitized in new FNA REMICs. The same methodology applies to DUS MBS in FN Megas, as well as to the Ginnie Mae project loan market.
1 We note that CMAlert does not include the subordinate/non-guaranteed classes of K-Deals in its Agency CMBS tally.

26 February 2016
Agency CMBS Market Watch 6
Ginnie Mae Project Loans
Figure 11: GNR REMIC issuance Ginnie Mae REMIC issuance declined 16% in 2015 to $15.4 billion (65 transactions).
This was the second consecutive year GNR volume fell since issuance peaked in 2013 (Figure 11).
That said, we expect GNR volumes to increase this year as GN pool issuance is rebounding.
Source: Credit Suisse, Ginnie Mae, HUD
Figure 12: GN project loan MBS issuance by program FHA project loan lending dropped to $13.4 billion, last year, due to fewer refi loans ($9.7 billion).
Increased competition from GSEs and private lenders led to lower refi volume, in our view.
New construction loan volume, on the other hand, increased for a third consecutive year ($3.7 billion).
* New construction (Sec 221d4 and Sec 232) volumes are based on fully funded balances. We excluded Sec 242 Hospital loans . Source: Credit Suisse, Ginnie Mae, HUD
■ Despite declining FHA loan volume, GN MBS issuance increased to $19.0 billion, with $5.6 billion pools coming online from HUD’s interest rate reduction program.
■ Under this fast-track program, the interest rate is reduced for an existing FHA loan and the corresponding GN pool is prepaid (with penalties). Subsequently, a new GN pool is created using the same FHA loan (Pool type = LM).
■ Effectively, this program is churning new pools from the existing loans, but with a rate reduction. These pools are then included in new GNR transactions. Most of the loans have higher initial coupons (typically well above 4%) and average rate reduction is about 130 bp.
4b6b
3b 4b6b
11b
15b
19b
23b
18b15b
2b
0
4
8
12
16
20
24
2005 2006 2007 2008 2009 2010 2011 2012 2013 2014 2015 16ytd
$bn
4.6b 3.5b 2.8b 2.6b 3.2b 3.7b
9.9b 12.8b16.7b 19.2b
11.6b 9.7b
2.7b 5.6b14.5b16.3b
19.6b22.5b
17.5b19.0b
0
4
8
12
16
20
24
2010 2011 2012 2013 2014 2015
LM pools with int rate reductionRefi pools (223a7, 223f)New construction pools
26 February 2016
Agency CMBS Market Watch 7
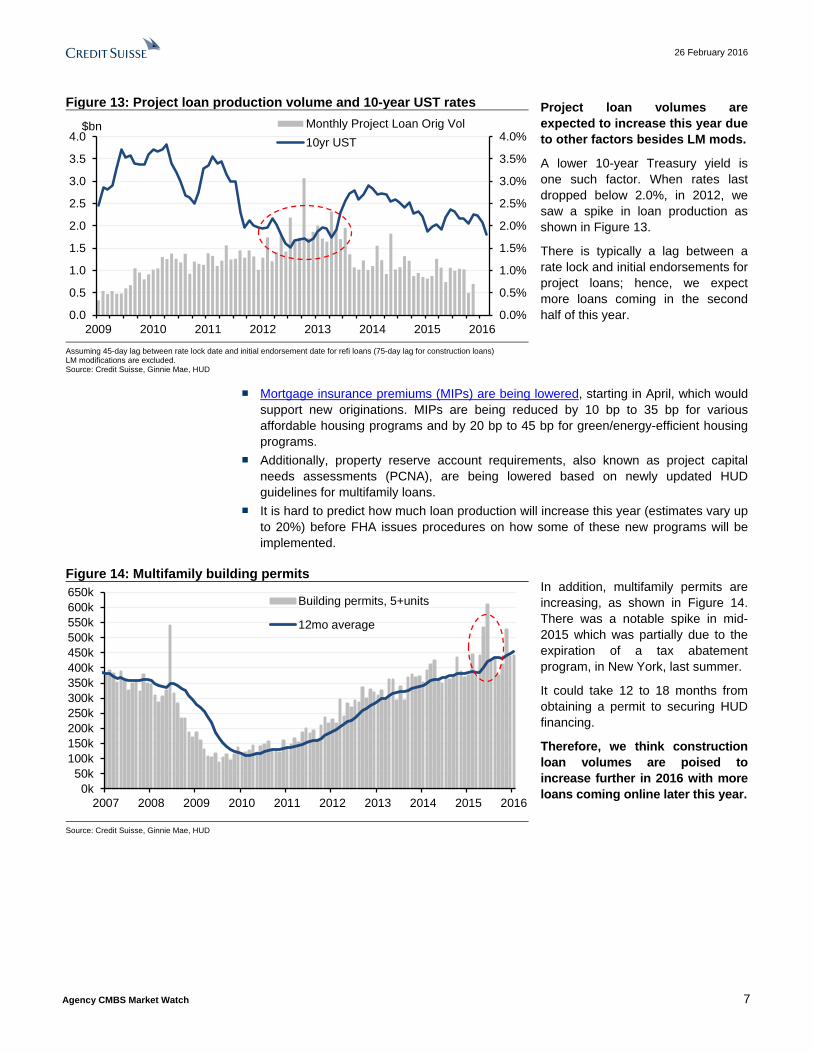
Figure 13: Project loan production volume and 10-year UST rates Project loan volumes are expected to increase this year due to other factors besides LM mods.
A lower 10-year Treasury yield is one such factor. When rates last dropped below 2.0%, in 2012, we saw a spike in loan production as shown in Figure 13.
There is typically a lag between a rate lock and initial endorsements for project loans; hence, we expect more loans coming in the second half of this year.
Assuming 45-day lag between rate lock date and initial endorsement date for refi loans (75-day lag for construction loans) LM modifications are excluded. Source: Credit Suisse, Ginnie Mae, HUD
■ Mortgage insurance premiums (MIPs) are being lowered, starting in April, which would support new originations. MIPs are being reduced by 10 bp to 35 bp for various affordable housing programs and by 20 bp to 45 bp for green/energy-efficient housing programs.
■ Additionally, property reserve account requirements, also known as project capital needs assessments (PCNA), are being lowered based on newly updated HUD guidelines for multifamily loans.
■ It is hard to predict how much loan production will increase this year (estimates vary up to 20%) before FHA issues procedures on how some of these new programs will be implemented.
Figure 14: Multifamily building permits In addition, multifamily permits are increasing, as shown in Figure 14. There was a notable spike in mid-2015 which was partially due to the expiration of a tax abatement program, in New York, last summer.
It could take 12 to 18 months from obtaining a permit to securing HUD financing.
Therefore, we think construction loan volumes are poised to increase further in 2016 with more loans coming online later this year.
Source: Credit Suisse, Ginnie Mae, HUD
0.0%
0.5%
1.0%
1.5%
2.0%
2.5%
3.0%
3.5%
4.0%
0.0
0.5
1.0
1.5
2.0
2.5
3.0
3.5
4.0
2009 2010 2011 2012 2013 2014 2015 2016
Monthly Project Loan Orig Vol10yr UST
$bn
0k50k
100k150k200k250k300k350k400k450k500k550k600k650k
2007 2008 2009 2010 2011 2012 2013 2014 2015 2016
Building permits, 5+units
12mo average

26 February 2016
Agency CMBS Market Watch 8
Figure 15: GN MBS prepayments We think prepayment activity will pick up with increasing loan volumes.
In 2015, project loan prepayments surpassed the previous year and totaled $11.8 billion. It was the second biggest prepayment year, almost on par with prepayment levels in 2013.
Nearly half of the prepayments came from LM interest rate modifications (Figure 15).
However, the majority of the prepayments came in the first half of the year.
Source: Credit Suisse, Ginnie Mae, HUD
Figure 16: GN MBS cohort summary Prepayments are overwhelmingly coming from 2010 and 2011 cohort loans in the past 12 months.
More than half of the prepayments ($5.8 billion in total) were from these cohorts, followed by the 2013 cohort ($1.3 billion).
We note that 2009 and earlier loans are mostly paid off, with less than one-fifth of the original cohort balances outstanding, as shown in Figure 16.
GN project loan cohort CPR 3mo
CPR 12mo
Paidoff in last 12mo
($bn)
Paidoff (as % of orig bal)
Orig. bal. ($bn)
Cur. bal ($bn)
Current cohort factor
2015 0.0 0.8 0.1 0.4% 19.0 18.7 0.99x 2014 1.9 8.3 1.1 6.1% 17.5 15.9 0.91x 2013 4.3 6.9 1.3 5.9% 22.5 20.1 0.89x 2012 6.5 4.7 0.8 4.1% 19.6 17.2 0.88x 2011 10.5 21.9 2.7 16.8% 16.3 10.2 0.63x 2010 38.2 44.8 3.1 21.3% 14.5 4.4 0.30x 2009 52.7 49.7 0.7 10.4% 7.2 1.0 0.14x 2008 36.5 40.2 0.2 7.8% 3.1 0.4 0.13x 2007 36.0 36.2 0.3 6.8% 3.8 0.8 0.21x 2006 46.7 43.7 0.4 7.9% 4.9 0.8 0.16x 2005 21.6 32.5 0.3 6.1% 5.2 0.7 0.14x 2004 23.5 38.6 0.4 5.2% 6.9 0.5 0.08x 2003 19.7 28.7 0.2 2.2% 8.9 0.5 0.06x
Source: Credit Suisse, Ginnie Mae, HUD
Figure 17: Historical CPRs by cohort (loan origination year) Older cohorts (2011 and earlier) continue to prepay at double-digit CPR speeds.
Recent cohorts speeds are still below 15 CPR. This is partly because these cohorts have not seasoned enough yet. In addition, they have lower coupons: the average rate for a 2012 refi loan was 3.1%.
Therefore, these borrowers are arguably less motivated to refinance, absent any meaningful equity build-up in their properties.
Source: Credit Suisse, Ginnie Mae, HUD
0
200
400
600
800
1,000
1,200
1,400
1,600
1,800
2009 2010 2011 2012 2013 2014 2015
Prepayments - Receiving int rate reduction
Prepayments - Regular
$mn$11.8b$7.5b$12.3b$9.1b$7.7b$3.3b$1.6b
0
10
20
30
40
50
60
70
80
Feb-13 Aug-13 Feb-14 Aug-14 Feb-15 Aug-15 Feb-16
2009 2010 2011
2012 2013 2014
3mo CPR

26 February 2016
Agency CMBS Market Watch 9
■ Project loans seldom prepay in earlier years, but speeds ramp up over time. This can be seen from historical prepayment speeds by loan age, in Figure 18. Our methodology in this table differs slightly from the CPR calculation: we measure payment speeds based on absolute loan age, for each cohort, regardless of whether loans exited the lockout period or not.
■ With more seasoning, 2012 and later cohort loans are likely to prepay with higher speeds, eventually reaching 15%-20% CPR levels, by year five or six.
■ We acknowledge that the historical data have limitations to support our view, with interest rates having been mostly on the decline since the early 2000s. But we would argue that, unlike the residential market, project loan borrowers tend to be less interest-rate sensitive and are more likely to prepay when property prices and rents increase enough to unlock value from their properties (i.e., higher equity, increased reserve accounts).
Figure 18: Prepayment seasoning curves by loan age The speeds in this table represent voluntary prepayments in each year, expressed as a percentage of the outstanding balance at the beginning of the year.
The denominator includes the entire outstanding balance, at the beginning of the year, regardless of whether the loans are in the lock-out period, or not, for each cohort.
Recent cohort loans have shorter or no call protection; hence, the differences between CPRs and these speeds would be minor.
Loan Cohort
Year 1
Year 2
Year 3
Year 4
Year 5
Year 6
Year 7
Year 8
Year 9
Year 10
Pre-05 avg 0 1 1 2 4 9 11 22 29 35 2005+ avg 0 2 7 15 21 25 29 36 28 29 2005 0 0 2 2 1 8 25 40 29 29 2006 0 0 1 2 9 22 28 35 28 2007 0 0 1 4 11 39 36 27 2008 0 1 4 17 39 33 36 2009 0 1 4 41 34 44 2010 0 0 19 15 31 2011 0 2 7 14 2012 0 0 3 2013 0 4 2014 2
Source: Credit Suisse, Ginnie Mae, HUD
■ Construction loans prepay faster than refi project loans. These loans are generally originated with higher rates, relative to the refi loans, because there is more uncertainty during the construction and initial lease-up phases.
■ After construction is completed, the borrowers are more likely to prepay upon exiting lockout, as they can refinance their stabilized projects at a lower interest rate.
■ Figure 19 shows prepay seasoning curves for new construction loans. We use construction start date to calculate the loan age (i.e., initial endorsement date). Therefore lack of prepayments during initial years is not surprising for these loans since the construction period typically ranges from one to three years.
■ Refi loans speeds, on the other hand, ramp up over time with minimal prepayments during the initial years and generally surpass 15% CPR by year five (Figure 20).

26 February 2016
Agency CMBS Market Watch 10
Figure 19: New construction loan (Sec 221d4, Sec 232) prepayment seasoning curves
Figure 20: Refi (Sec 223a7 & Sec 223f) prepayment seasoning curves
Loan Cohort
Yr 1
Yr 2
Yr 3
Yr 4
Yr 5
Yr 6
Yr 7
Yr 8
Yr 9
Yr 10
Pre-05 avg 0 0 0 1 6 9 11 29 31 41 2005+ avg 0 0 1 16 33 31 41 46 35 28 2005 0 0 0 1 1 7 33 56 38 28 2006 0 0 0 0 9 21 47 46 26 2007 0 0 0 1 11 50 53 11 2008 0 0 0 22 47 51 53 2009 0 0 0 21 51 59 2010 0 0 1 16 49 2011 0 0 1 31 2012 0 0 0 2013 0 0 2014 0
Loan Cohort
Yr 1
Yr 2
Yr 3
Yr 4
Yr 5
Yr 6
Yr 7
Yr 8
Yr 9
Yr 10
Pre-05 avg 0 1 1 2 1 10 10 16 27 31 2005+ avg 1 2 9 15 16 23 24 32 27 29 2005 0 1 3 3 1 9 21 32 26 29 2006 0 0 1 2 8 23 24 33 28 2007 0 0 2 6 11 31 27 32 2008 0 1 5 13 35 28 33 2009 0 1 6 52 21 37 2010 0 0 26 15 21 2011 0 3 9 9 2012 0 0 3 2013 0 5 2014 3
Source: Credit Suisse, Ginnie Mae, HUD Source: Credit Suisse, Ginnie Mae, HUD
Figure 21: Default seasoning curves by loan age Disciplined HUD underwriting and strong property fundamentals are keeping a lid on project loan defaults.
In 2015, only 19 unique GN pools (totaling $204 million) defaulted across the GNR universe.
Of note, our default category includes assignments (HUD’s formal default definition) as well as modifications/overrides in which prepayment penalties got waived and therefore were not received by the GNR investors.
Loan Cohort
Year 1
Year 2
Year 3
Year 4
Year 5
Year 6
Year 7
Year 8
Year 9
Year 10
Pre-05 avg 0.5 1.8 3.0 2.4 1.7 1.5 2.1 1.7 0.9 0.5 2005+ avg 0.0 0.1 0.5 1.3 1.5 1.3 0.7 0.7 0.2 0.2 2005 0.0 0.3 0.2 1.0 1.1 2.0 1.0 1.0 0.0 0.2 2006 0.0 0.0 0.3 0.1 0.4 1.5 0.4 0.8 0.4 2007 0.0 0.6 0.2 2.5 2.5 0.0 0.0 0.0 2008 0.0 0.0 0.6 3.9 3.4 0.8 2.0 2009 0.0 0.8 1.7 3.2 3.0 1.4 2010 0.0 0.0 1.0 1.0 0.8 2011 0.0 0.0 0.1 0.4 2012 0.0 0.1 0.0 2013 0.0 0.0 2014 0.0
Source: Credit Suisse, Ginnie Mae, HUD
Figure 22: Worst performing GNR deals by vintage The overall project loan delinquency rate remains benign, at 0.5%, with 54 unique pools totaling $430 million past due in the GNR universe.
Deal-level performance, however, could vary with select deals experiencing significantly higher delinquencies and defaults.
This dispersion can be seen in Figure 22 which shows the five worst performing GNR deals for each vintage, from 2011 to 2014, along with the vintage averages.
The deal level statistics are available for the entire GNR universe in our monthly Compendium publication.
Source: Credit Suisse, Ginnie Mae, HUD
0%1%2%3%4%5%6%7%8%9%
10%11%12%13%14%
2011
-001
2011
-042
2011
-096
2011
-144
2011
-047
Avg
2011
2012
-131
2012
-120
2012
-001
2012
-002
2012
-044
Avg
2012
2013
-138
2013
-171
2013
-055
2013
-143
2013
-030
Avg
2013
2014
-110
2014
-078
2014
-088
2014
-153
2014
-015
Avg
2014
30+day Delinquent
Defaulted
Deal % (Orig Bal)

26 February 2016
Agency CMBS Market Watch 11
Freddie Mac: K-Deals Figure 23: Historical K-deal issuance The K-Deal program had a record
year in 2015 with 30 deals totaling $36 billion priced. 10-year and 7-year deals made up collectively 55% of issuance, followed by floating-rate deals at 25% (KF00). The rest came from other series including single asset/borrower (KABC), supplemental loan (KJ00), senior housing (KS00), seasoned loan (KP00) and 15-year deal (K1500) series.
Source: Credit Suisse, Freddie Mac, Fannie Mae
Figure 24: GSEs multifamily loan production Freddie Mac’s multifamily loan production reached $47.3 billion last year, after FHFA relaxed its cap exemption criteria in May. The 2016 cap has been raised to $31 billion (from $30 billion) for each GSE. K-deal issuance is expected to remain elevated this year with about four deals per month slated to price since Q4 2015. Accordingly, Freddie Mac started to publish a deal calendar to provide more transparency (Figure 25). We provide a summary of new issue deals in Figure 26.
Source: Credit Suisse, Freddie Mac, Fannie Mae
Figure 25: Freddie Mac K-Deal pipeline February 2016 Deal series/type Loan term Rate type Issuance week of Size ($mn) K-F14 Floater 7-year Floating Feb 29 1,400 March 2016 KLH2 SASB (Loan Star) 7-year Floating March 7 1,300 K-053 10yr fixed-rate conventional 10-year Fixed March 14 1,400 K-P03 Seasoned loans 10-year Fixed March 14 1,000 KLH3 SASB (Loan Star) 7-year Floating March 28 TBD April 2016 K-054 10yr fixed-rate conventional 10-year Fixed April 4 1,300 K-F15 Floater 7-year Floating April 11 1,500 K-722 7yr fixed-rate conventional 7-year Fixed April 18 TBD K-TBD SASB 10-year Fixed April 25 1,100 May 2016 K-F16 Floater 10-year Floating May 2 1,100 K-J04 Supplemental >3-year Fixed May 9 300 K-TBD Conventional 7/10-year Fixed May 16 750 K-TBD SASB 10-year Floating May 23 1,700 K-1502 15yr fixed-rate conventional >10-year Fixed May 31 600 June 2016 K-TBD Conventional TBD TBD June 6 TBD K-TBD Conventional TBD TBD June 13 TBD K-TBD Conventional TBD TBD June 20 TBD SASB: Single Asset/Single Borrower) Source: Freddie Mac, Credit Suisse
15
5
9
2
6
14
21
28
21
36
6
0
5
10
15
20
25
30
35
40
2009 2010 2011 2012 2013 2014 2015 16ytd
Other K-Series
SASB
Floater
7yr
10yr
$bn
20.3
28.825.9
28.3
47.3
23.8
33.828.5 28.9
42.3
05
101520253035404550
2011 2012 2013 2014 2015
Freddie Mac Fannie Mae$bn
FHFA production cap

26 February 2016
Agency CMBS Market Watch 12
Figure 26: New issue K-Deals (10-year, 7-year and floating rate series)
Deal Date
priced
Orig. Balance
($million)
Class A2 Spread
(bp)
Class B Spread
(bp) Class C px
spread
AAA subord.
level Rating - Class B
Rating - Class C
Pct Full IO
Pct Partial IO B-piece buyer
K000’s K052 Jan 2016 1,396 90 425 650 18.25 BBB+ BBB- 13.2% 49.5% Torchlight K051 Dec 2015 1,196 85 350 480 18.38 BBB+ BBB-/BBB 13.5% 70.0% Related Cos. K050 Nov 2015 1,535 80 350 470 18.25 BBB+ BBB- 21.0% 70.5% Related Cos. K049 Oct 2015 1,573 76 300 415 18.00 BBB+/A- BBB-/BBB 19.3% 56.6% Torchlight K048 Sep 2015 1,569 75 280 340 18.32 BBB+ BBB- 13.5% 71.6% Berkshire Property Advisors K047 Jul 2015 1,448 58 235 275 18.00 BBB+/A- BBB-/BBB 16.2% 72.5% Angelo, Gordon and McDowell Properties K046 Jun 2015 1,588 49 195 245 18.38 BBB+ BBB- 23.8% 67.2% Carmel Partners K045 May 2015 1,577 49 175 200 18.00 BBB+/A- BBB-/BBB 24.8% 59.8% Torchlight K044 Apr 2015 1,631 47 185 225 18.63 BBB+/A- BBB-/BBB 21.2% 66.1% Berkshire Property Advisors K043 Feb 2015 1,450 49 150 220 17.13 A- BBB 27.7% 59.5% Ares Management K042 Jan 2015 1,373 48 165 250 18.00 A- BBB-/BBB 21.9% 58.9% Angelo, Gordon and McDowell Properties K700’s K721 Dec 2015 1,095 71 390 600 20.63 BBB/BBB+ BB/BBB- 27.5% 57.0% Berkshire Property Advisors K720 Oct 2015 1,583 59 375 550 19.13 BBB/BBB+ BB/BBB- 25.0% 62.7% Ares Management K719 Aug 2015 524 52 10.00 NR NR 37.7% 58.1% Bridge Investment Group K718 May 2015 1,591 34 170 250 18.50 BBB+/A- BB/BBB 24.8% 48.3% Related Cos. KF00’s KF13 Jan 2016 876 76 10.00 NR NR 4.0% 93.5% Harbor Group KF12 Nov 2015 1,390 70 10.00 NR NR 9.1% 76.8% Bridge Investment Group KF11 Nov 2015 1,651 65 10.00 NR NR 2.8% 97.2% Waterfall Asset Management KF10 Oct 2015 1,457 38 10.00 NR NR 4.3% 79.5% MKP Capital Management KF09 Aug 2015 1,534 10.00 NR NR 3.6% 89.6% Varadero Capital KF08 Jun 2015 1,549 30 10.00 NR NR 8.3% 85.3% MKP Capital Management KF07 Apr 2015 1,193 29 10.00 NR NR 0.0% 98.8% Annaly Source: Credit Suisse, Freddie Mac, CMAlert
Figure 27: Delinquent and/or specially serviced loans in K-deals
Deal Vintage Loan name
Current Balance ($mn)
Deal Pct
Loan Status
Special serv. tr.
date
MR DSCR (NCF)
MR Occupan
cy (%)
Credit problems remain low. Only three loans are currently in default and one performing loan is in special servicing.
This is equivalent to 0.07% of the outstanding universe (6900+ loans/$126 billion).
K003 2009 Highland Ridge and Highland Glen Apt 30.4 3.3% 90+ Days 11/15 0.73 76
K014 2011 The Heights At Slippery Rock 14.5 1.3% 90+ Days 7/15 0.65 99
K009 2010 Campus Habitat 8.8 0.8% 90+ Days 11/13 na 97
K702 2011 The Palms On University 31.6 3.0% Cur/Special 9/15 0.83 57 Source: Credit Suisse, Trepp
Figure 28: Historical K-deal losses
Deal Vintage Loan
Orig Bal
($mn)
Bal at Liq
($mn)
Loss Amt
($mn)
Disposition date
Loss (pct of orig
bal) Loss (pct of liq bal)
K-deals have experienced minimal losses to date.
Only three loans have resolved with losses so far.
K012 2011 University Courtyard Apartments 5.7 5.3 2.9 Sep-15 51.3 55.1 K003 2009 Arbor Green Apartments* 15.2 10.5 5.2 Oct-14 34.0 49.2 K006 2010 Green Meadows Apartments 3.9 3.7 0.4 Jul-14 9.6 10.2
* Arbor Green Apartments was assumed and modified in March 2013, resulting in a $5.2 million loss to Class B3. The modified loan was later paid off in October 2014. Source: Credit Suisse, Trepp

26 February 2016
Agency CMBS Market Watch 13
Figure 29: 10-year K-deal new issue spreads versus conduit CMBS K-deal spreads widened along with other sectors since last year. The last 10-year A2 bond (K052) priced 90 bp over swaps, nearly 50 bp wider compared to a year ago.
Conduit LCFs widened about 60 bp during the same period.
AAA subordination levels for 10-year senior bonds remained stable at slightly above 18% in the last twelve months; Class B (10%) and Class C (7.5%) were unchanged.
However Class Bs have been rated as BBB+ since last April (formerly A) and Class Cs now carry a BBB- rating (formerly BBB/BBB).
Source: Credit Suisse
Figure 30: Interest-only loans in 10-year K-deals Length of IO period for Partial IOs
Full IO and partial IO loan concentrations increased in 2015 for 10-year K-deals.
A majority of partial IO loans have five-year interest-only periods versus two or three years in prior vintages.
Vintage Amortizing Interest
Only Partial
IO Vintage 1yr 2yr 3yr 4yr 5yr 2015 14% 21% 65% 2015 2% 12% 16% 10% 59% 2014 36% 10% 54% 2014 8% 23% 33% 12% 24% 2013 23% 8% 69% 2013 7% 36% 41% 6% 10% 2012 36% 3% 61% 2012 6% 44% 22% 12% 16% 2011 52% 7% 42% 2011 5% 76% 8% 0% 11% Source: Credit Suisse, Trepp
Figure 31: 10-year K-deal LTVs
UW LTVs reverted back to 70% in 2015 versus 67% in 2014 and 69% in 2013.
Rating agency stressed LTVs rose to 115%, in 2015, from 106% in the prior year. 10-year deals have been mostly rated by Fitch and Kroll.
In 2015 vintage Fitch-rated deals, 85% of loans had stressed LTVs above 100%, compared to only 70% for 2014 vintage deals.
Source: Credit Suisse, Freddie Mac, Fitch, Moody’s, Kroll
30405060708090100110120130140150160170
30405060708090
100110120130140150160170
01/1
5
02/1
5
03/1
5
04/1
5
05/1
5
06/1
5
07/1
5
08/1
5
09/1
5
10/1
5
11/1
5
12/1
5
01/1
6
Conduit LCF AAA
K-deal 10yr A2
60 65 70 75 80 85 90 95 100 105 110 115 120 125
60 65 70 75 80 85 90 95
100 105 110 115 120 125
K01
0K
011
K01
2K
013
K01
4K
015
K01
6K
017
K01
8K
019
K02
0K
021
K02
2K
023
K02
4K
025
K02
6K
027
K02
8K
029
K03
0K
031
K03
2K
033
K03
4K
035
K03
6K
037
K03
8K
039
K04
0K
041
K04
2K
043
K04
4K
045
K04
6K
047
K04
8K
049
K05
0K
051
K05
2
2011 2012 2013 2014 2015 16
Moody's LTV Kroll LTV Fitch LTV UW LTV

26 February 2016
Agency CMBS Market Watch 14
Fannie Mae DUS Figure 32: GSEs multifamily loan production
Fannie Mae’s multifamily DUS loan production rose to $42.3 billion last year from $28.9 billion in the prior year.
Similar to Freddie Mac, Fannie Mae DUS volumes increased in the second half of the year following FHFA’s cap criteria revision.
Source: Credit Suisse, Fannie Mae, Freddie Mac
Figure 33: Fannie Mae DUS MBS loan types Floating rate ARM/SARM DUS2 issuance nearly doubled in 2015 (over $10 billion).
Longer maturity loans (12+-year) were also up, representing more than one-fifth of all issuance.
Volume of 10/9.5s, the most frequent DUS loan type, increased slightly and shorter maturity fixed-rate loans (7/6.5s and 5/4.5s) declined in 2015.
Source: Credit Suisse, Fannie Mae
Figure 34: Fannie Mae FNA issuance (GeMS and other FNAs)
The majority of DUS loan continue to trade as standalone MBS instead of being pooled in REMICs.
FNA issuance (including both GeMS and non-GeMS deals) remained subdued.
Only 17 deals totaling $14.1 billion priced in 2015, versus $13.5 billion (13 deals) in the prior year.
A little less than one-third of FNA deals include seasoned DUS collateral groups.
Source: Credit Suisse, Fannie Mae
2 We noted an increase in SARM (Structured ARM) loans which tend to be larger in loan size. FHFA's revision to GSE cap
exemption criteria has likely increased DUS lenders’ capacity to offer SARMs.
23.8
33.828.5 28.9
42.3
20.3
28.825.9
28.3
47.3
05
101520253035404550
2011 2012 2013 2014 2015
Fannie Mae Freddie Mac$bn
FHFA production cap
0
2
4
6
8
10
12
14
ARM 10/9.5 7/6.5 5/4.5 10/7 12/11.5 15/14.5 Other
2014 2015$bn
5.7
4.6
3.8
4.8
13.511.7
13.5 14.1
02468
101214161820
2011 2012 2013 2014 2015
Seasoned DUS Prior year DUSCurrent year DUS
$bn

26 February 2016
Agency CMBS Market Watch 15
Figure 35: FNA 10yr spreads versus conduit CMBS and K-deal 10yr A2s New issue spreads for 10-year classes in FNAs widened by a similar amount as the K-deal 10-year classes.
The last 10-year Class A2 (2016-M1) priced at 98 bp over swaps, about 46 bp wider compared to the first deal of 2015, a year ago.
We show new issue pricing details for all FNA transactions in Figure 36.
Source: Credit Suisse
Figure 36: New issue FNA deals
Deal Pricing month
Deal type* Lead UW Deal Bal Class WAL Px (bp) Class WAL Px (bp) Class WAL Px (bp)
FNA 2016-M2 Feb 2016 GeMS CS 927 AV2 6.6 S+83 FA 6.5 S+85 AL 12.2 S+150 FNA 2016-M1 Jan 2016 GeMS MS 946 A2 9.9 S+98 ASQ2 4.2 S+57 FNA 2015-M17 Nov 2015 GeMS GS 1,167 A2 9.7 S+89 FA 6.0 L+100 FNA 2015-M16 Nov 2015 MS 347 A2 9.8 n/a FNA 2015-M15 Nov 2015 GeMS GS 889 A2 9.7 S+80 AB2 9.7 S+86 ASQ2 2.5 S+31 FNA 2015-M14 Oct 2015 WFS 257 FA 9.2 n/a FNA 2015-M13 Oct 2015 GeMS DBS 1,017 A2 9.6 S+81 A2FL 9.6 L+67 ASQ2 3.0 S+29 FNA 2015-M12 Sep 2015 GeMS BAML 1,081 A2 9.6 S+75 FA 3.5 S+34 FNA 2015-M11 Jul 2015 DBS 760 A2 9.7 S+60 A2FL 9.5 L+44 FNA 2015-M10 Jun 2015 GeMS CITG 975 A2 11.5 S+65 FA 3.3 L+25 FNA 2015-M9 Jun 2015 WFS 303 FA 9.9 L+30 FNA 2015-M8 May 2015 GeMS CS 1,035 A2 9.6 S+51 AB2 9.6 S+56 FA 3.1 L+17 FNA 2015-M7 Apr 2015 GeMS DBS 1,007 A2 9.6 S+52 AB2 9.6 S+58 ASQ2 2.8 S+15 FNA 2015-M6 Apr 2015 WFS 315 FA 9.8 n/a FNA 2015-M5 Mar 2015 CS 511 A 9.3 n/a FNA 2015-M4 Mar 2015 GeMS MS 1,059 AV2 6.8 S+38 ABV2 6.8 S+44 FA 3.3 L+21 FNA 2015-M3 Feb 2015 GeMS GS 1,154 A2 9.7 S+50 AB2 9.7 S+55 FA 3.1 L+22 FNA 2015-M2 Feb 2015 CS 869 A 9.3 n/a FNA 2015-M1 Jan 2015 GeMS BAML 1,221 A2 9.6 S+52 AB2 9.6 S+60 ASQ2 2.9 S+26 * In a GeMS deal, underlying DUS loans are selected by Fannie Mae’s Multifamily Capital Markets group, not by a dealer Source: Credit Suisse, Fannie Mae, CMAlert
Figure 37: Prepayments in post 2009 FNA REMICs Prepayments remain low for FNA deals, especially for the recent cohort loans.
A majority of the paidoff loans (about 70%) in the last 12 months were from seasoned collateral groups.
DUS credit problems are also minimal. Only three loans are delinquent in the entire FNA universe of 8600+ loans.
We provide collateral group level statistics for the all FNA deals in our monthly Compendium.
Source: Credit Suisse, Fannie Mae
30405060708090100110120130140150160170
30405060708090
100110120130140150160170
01/1
5
02/1
5
03/1
5
04/1
5
05/1
5
06/1
5
07/1
5
08/1
5
09/1
5
10/1
5
11/1
5
12/1
5
01/1
6
Conduit LCF AAA
K-deal 10yr A2
M-deal 10yr A2
0
100
200
300
400
500
600
2014
01
2014
02
2014
03
2014
04
2014
05
2014
06
2014
07
2014
08
2014
09
2014
10
2014
11
2014
12
2015
01
2015
02
2015
03
2015
04
2015
05
2015
06
2015
07
2015
08
2015
09
2015
10
2015
11
2015
12
2016
01
Prepaid - other Prepaid with YM$mn

26 February 2016
Agency CMBS Market Watch 16
SBA 504/CDC Figure 38: Prepayments in post 2009 FNA REMICs
The latest SBA 504 debentures deal, SBAP 2016-20B, priced at 80 bp over the swaps curve (UST+66 bp), with an overall coupon of 2.27%.
This was about 10 basis points more than the previous deal.
However, the overall rate is the lowest since the June 2013 transaction, as 10-year interest rates dropped below 2.0% in January.
Source: Credit Suisse
Figure 39: Voluntary and Involuntary prepay speeds Voluntary prepayments continue to rise for SBA 504 deals. The 12-month CPR is now at 9.1%, about 220 bp higher compared to last year.
Default related prepayments (accelerations) are still declining, albeit slowly, from the record high of 6.7% in late 2010 to 0.9% as of September.
An improving economy is helping to keep the SBA 504 defaults at minimum. We show the historical prepay rates for each issuance year in Figure 40.
Source: Credit Suisse
0.000.501.001.502.002.503.003.504.00
2014
-20A
2014
-20B
2014
-20C
2014
-20D
2014
-20E
2014
-20F
2014
-20G
2014
-20H
2014
-20I
2014
-20J
2014
-20K
2014
-20L
2015
-20A
2015
-20B
2015
-20C
2015
-20D
2015
-20E
2015
-20F
2015
-20G
2015
-20H
2015
-20I
2015
-20J
2015
-20K
2015
-20L
2016
-20A
2016
-20B
SBAP spread to swap
10yr Swap Rate
9.1
0.9
0.0
2.0
4.0
6.0
8.0
10.0
12.0 Voluntary Prepay
Default/Acceleration
CPR

26 February 2016
Agency CMBS Market Watch 17
Figure 40: SBA 504 payment speeds by cohort Voluntary Prepayments
Year All 1998 1999 2000 2001 2002 2003 2004 2005 2006 2007 2008 2009 2010 2011 2012 2013 2014 2015 1 0.7 1.0 0.5 0.5 0.5 0.2 0.8 0.9 1.3 1.4 0.9 0.4 0.2 0.5 0.5 0.6 1.0 1.1 0.8 2 2.3 1.9 1.3 2.3 2.2 2.5 3.2 3.2 4.1 3.7 1.6 0.5 0.4 1.1 1.4 2.6 3.1 4.7 3 4.0 2.2 3.0 7.6 6.9 5.4 5.3 5.3 6.0 3.6 0.8 0.9 1.5 3.0 3.7 4.6 5.4 4 5.5 4.0 7.4 13.0 8.7 7.3 6.2 7.7 4.1 1.4 1.0 1.9 2.9 4.8 7.5 6.8 5 7.4 8.7 13.0 15.5 11.5 8.4 7.1 4.9 2.4 2.5 2.8 4.4 5.9 8.4 10.4 6 9.1 14.1 14.1 15.0 11.2 9.7 5.8 2.5 3.2 5.6 6.8 7.6 8.3 11.9 7 10.2 12.0 13.1 13.2 12.6 8.9 3.4 4.1 5.6 10.5 10.1 9.9 11.9 8 11.9 12.8 13.2 17.0 12.5 5.3 5.0 7.9 10.9 15.6 12.7 13.0 9 13.3 12.6 14.1 17.1 7.9 7.3 7.5 15.5 16.3 16.7 16.1 10 18.2 18.5 16.8 17.3 14.4 17.8 19.2 22.5 19.3 22.6 11 20.6 20.0 14.5 18.0 20.7 24.7 22.5 20.0 23.2 12 18.0 12.7 14.6 17.9 21.0 23.9 16.7 18.1 13 17.8 11.6 18.7 18.2 23.0 19.2 22.4 14 20.2 17.2 22.1 20.6 21.2 26.5 15 22.3 18.3 23.0 25.6 25.3 16 18.4 20.9 15.2 18.6
Involuntary Prepayments (Default/Acceleration) Year All 1998 1999 2000 2001 2002 2003 2004 2005 2006 2007 2008 2009 2010 2011 2012 2013 2014 2015
1 0.8 0.3 0.3 0.4 0.9 0.9 0.4 0.4 0.4 0.5 1.1 2.6 3.4 1.1 0.4 0.3 0.2 0.2 0.3 2 2.1 1.0 1.0 1.6 2.0 1.7 0.9 0.9 1.0 1.9 4.4 8.7 6.9 2.4 1.4 0.7 0.5 0.5 3 2.8 1.0 1.5 2.6 2.5 1.7 1.1 1.1 1.7 4.1 9.2 8.7 6.1 2.5 0.9 0.9 0.4 4 2.8 1.3 1.9 2.5 1.6 1.0 0.9 1.4 3.0 6.6 9.1 7.0 4.0 1.4 0.8 0.8 5 2.5 1.2 1.2 1.8 0.9 0.8 0.9 2.0 5.3 6.9 6.1 4.7 2.5 1.0 0.8 6 2.4 1.6 1.0 1.3 1.5 1.1 1.8 3.4 4.9 4.9 4.1 3.3 1.8 1.2 7 2.0 0.8 0.5 0.6 0.8 1.4 2.9 4.0 3.6 3.5 2.6 2.2 1.5 8 1.9 0.7 0.5 1.5 1.6 3.4 3.9 3.0 2.6 2.5 1.2 1.6 9 1.8 0.7 0.6 1.7 3.3 2.6 2.7 2.4 1.9 1.8 1.4 10 1.7 0.4 1.0 3.8 3.8 2.3 1.4 1.4 1.4 1.2 11 2.0 1.3 1.8 4.0 2.4 3.5 1.2 1.2 0.9 12 2.1 2.2 2.9 4.0 2.9 1.7 0.9 1.5 13 1.6 1.6 1.5 1.1 2.5 1.7 0.2 14 1.2 0.9 0.7 0.6 1.3 0.8 15 1.9 1.4 2.0 2.6 2.2 16 2.1 0.8 0.4 4.2
Total Prepayments Year All 1998 1999 2000 2001 2002 2003 2004 2005 2006 2007 2008 2009 2010 2011 2012 2013 2014 2015
1 1.5 1.4 0.9 0.9 1.4 1.1 1.2 1.3 1.7 2.0 2.0 3.0 3.6 1.6 0.9 0.9 1.2 1.3 1.1 2 4.5 2.9 2.3 3.9 4.2 4.2 4.1 4.1 5.0 5.6 6.0 9.2 7.3 3.5 2.8 3.3 3.5 5.2 3 6.8 3.3 4.5 10.1 9.3 7.1 6.4 6.4 7.6 7.7 9.9 9.6 7.5 5.5 4.6 5.5 5.8 4 8.2 5.3 9.2 15.3 10.2 8.2 7.1 9.1 7.0 8.0 10.1 8.8 6.8 6.2 8.3 7.6 5 9.9 9.9 14.1 17.1 12.3 9.1 8.0 6.9 7.6 9.3 8.8 9.0 8.3 9.4 11.1 6 11.4 15.6 15.1 16.2 12.7 10.7 7.5 5.9 8.0 10.3 10.7 10.7 10.0 13.0 7 12.1 12.7 13.6 13.7 13.3 10.2 6.2 8.0 9.1 13.8 12.6 11.9 13.3 8 13.8 13.5 13.7 18.3 14.0 8.5 8.8 10.7 13.4 17.8 13.8 14.4 9 15.0 13.2 14.7 18.7 11.1 9.8 10.1 17.8 18.0 18.3 17.3 10 19.8 18.8 17.7 20.7 17.9 19.9 20.4 23.7 20.6 23.7 11 22.4 21.1 16.2 21.6 22.9 27.7 23.6 21.1 24.0 12 19.9 14.7 17.2 21.6 23.6 25.3 17.6 19.5 13 19.2 13.1 20.0 19.2 25.2 20.8 22.6 14 21.3 18.0 22.7 21.2 22.4 27.2 15 23.9 19.6 24.8 27.8 27.3 16 20.2 21.6 15.6 22.1
Source: Credit Suisse, Trustee reports Issue year is based on SBA fiscal year, which is from October 1 to September 30.

26 February 2016
Agency CMBS Market Watch 18
SBIC Debentures and Participating Securities Figure 41: SBIC Debentures payment speeds
Annual CPR (Year Since Origination) Deal Life
Time Speed Deal
Original Balance
($mn) Rate Current Factor
Vol. Prepay
Default (Accel.) 1 2 3 4 5 6 7 8 9 10
SBIC 2004-10A $185 4.12 0.00x 0.74x 0.21x 0.0% 1.9% 3.8% 9.6% 7.2% 27.4% 39.9% 49.5% 72.0% 100.0% 27.2% SBIC 2004-10B $256 4.68 0.00x 0.90x 0.10x 0.4% 0.4% 9.6% 4.5% 7.6% 34.6% 20.9% 66.3% 66.1% 100.0% 28.8% SBIC 2005-10A $205 5.04 0.00x 0.81x 0.13x 0.5% 0.0% 7.4% 3.4% 6.9% 60.1% 28.8% 27.2% 63.7% 100.0% 25.7% SBIC 2005-10B $197 4.94 0.00x 0.82x 0.08x 0.0% 0.0% 0.5% 8.6% 2.2% 37.2% 32.4% 41.3% 27.5% 55.3% 20.9% SBIC 2006-10A $185 5.52 0.01x 0.93x 0.06x 0.0% 0.0% 1.1% 9.6% 4.8% 46.1% 52.3% 47.0% 76.7% 33.1% SBIC 2006-10B $198 5.54 0.14x 0.80x 0.07x 0.0% 0.0% 0.0% 2.7% 7.2% 45.9% 38.5% 19.0% 46.6% 18.4% SBIC 2007-10A $240 5.38 0.04x 0.90x 0.07x 6.7% 5.0% 7.4% 15.0% 28.8% 33.8% 65.3% 48.7% 29.9% SBIC 2007-10B $238 5.53 0.08x 0.84x 0.09x 9.1% 0.0% 0.7% 27.0% 36.0% 44.8% 40.7% 70.4% 29.2% SBIC 2008-10A $290 5.47 0.18x 0.75x 0.08x 8.6% 5.0% 4.4% 21.1% 31.8% 47.5% 7.4% 19.6% SBIC 2008-10B $361 5.89 0.04x 0.84x 0.12x 0.8% 13.0% 31.6% 41.4% 44.0% 55.7% 73.4% 38.1% SBIC 2009-10A $262 4.62 0.37x 0.52x 0.11x 1.0% 3.1% 3.8% 16.7% 31.0% 30.2% 15.3% SBIC 2009-10B $319 4.23 0.28x 0.63x 0.09x 1.0% 0.2% 15.6% 22.0% 45.9% 30.8% 20.0% SBIC 2010-10A $339 4.11 0.34x 0.57x 0.09x 1.7% 8.2% 16.0% 15.9% 28.5% 14.5% SBIC 2010-10B $563 3.22 0.60x 0.29x 0.11x 0.4% 4.5% 12.2% 13.6% 10.7% 8.2% SBIC 2011-10A $823 4.10 0.68x 0.25x 0.07x 1.1% 1.7% 11.7% 13.0% 7.0% SBIC 2011-10B $559 2.88 0.73x 0.27x 0.01x 0.4% 2.7% 8.0% 24.9% 7.1% SBIC 2012-10A $571 2.77 0.79x 0.20x 0.01x 0.2% 0.6% 16.5% 6.1% SBIC 2012-10B $802 2.25 0.87x 0.13x 0.00x 0.1% 1.5% 15.8% 4.0% SBIC 2013-10A 1,064 2.35 0.92x 0.06x 0.02x 2.7% 4.0% 3.3% SBIC 2013-10B 623 3.64 0.82x 0.18x 0.00x 8.2% 5.6% 7.4% SBIC 2014-10A 996 3.19 0.92x 0.08x 0.00x 1.6% 1.6% SBIC 2014-10B 1,006 3.02 0.99x 0.01x 0.00x 0.2% 0.2% SBIC 2015-10A 1,150 2.52 0.99x 0.01x 0.00x 1.6% 1.6% SBIC 2015-10B 1,192 2.83 1.00x 0.00x 0.00x 0.0% 0.0%
Payment through September 2015. Next payment date is March 2016. Post 2007 debentures have no prepayment penalty feature. Source: Credit Suisse, SBA
Figure 42: SBIC Participating Securities (PSPC) payment speeds
Deal Orig. Bal.
($mn) Rate Current Factor
Vol. Prepay
Default (Accel.)
Annual CPR (Year Since Origination) Deal Life Time
Speed 1 2 3 4 5 6 7 8 9 10 SBIC 2003-P10A $423 4.52 0.00x 0.52x 0.46x 2.9% 7.0% 19.1% 29.9% 28.7% 36.1% 57.2% 47.5% 3.0% 100% 35.9% SBIC 2003-P10B $450 5.14 0.00x 0.49x 0.51x 2.9% 12.4% 15.6% 26.2% 34.3% 30.0% 31.3% 36.9% 33.9% 100% 34.5% SBIC 2004-P10A $469 4.50 0.00x 0.44x 0.53x 2.9% 11.6% 16.2% 19.8% 31.9% 42.8% 37.6% 16.9% 53.0% 100% 30.1% SBIC 2004-P10B $491 4.75 0.00x 0.45x 0.49x 3.6% 9.0% 12.6% 32.3% 27.9% 31.1% 21.2% 28.5% 48.8% 100% 25.0% SBIC 2005-P10A $698 4.64 0.00x 0.49x 0.45x 4.0% 13.1% 16.2% 23.3% 35.7% 31.4% 39.0% 39.5% 27.0% 100% 24.8% SBIC 2005-P10B $611 4.94 0.00x 0.60x 0.35x 2.0% 8.2% 18.5% 18.6% 25.3% 38.2% 31.2% 48.5% 43.7% 100% 26.5% SBIC 2006-P10A $580 5.52 0.00x 0.55x 0.45x 3.8% 13.4% 19.8% 24.6% 41.4% 27.7% 46.4% 64.5% 67.6% 100% 56.7% SBIC 2006-P10B $502 5.68 0.00x 0.49x 0.50x 1.2% 5.6% 11.9% 28.3% 34.0% 35.6% 44.4% 65.9% 80.9% 93.8% 47.3% SBIC 2007-P10A $496 5.46 0.08x 0.37x 0.51x 4.5% 8.3% 14.3% 20.6% 28.6% 32.6% 37.0% 26.0% 42.2% 24.8% SBIC 2007-P10B $431 5.79 0.07x 0.41x 0.47x 3.7% 8.3% 16.9% 19.7% 29.7% 41.9% 30.5% 38.8% 46.5% 26.3% SBIC 2008-P10A $314 5.90 0.11x 0.26x 0.52x 1.3% 17.0% 12.5% 17.0% 29.7% 27.0% 19.9% 55.3% 24.2% SBIC 2008-P10B $325 5.94 0.19x 0.22x 0.53x 2.9% 22.7% 15.2% 11.6% 23.0% 23.9% 34.0% 22.8% 19.8% SBIC 2009-P10A $322 4.73 0.30x 0.24x 0.36x 4.6% 15.5% 11.7% 8.8% 18.5% 16.9% 30.8% 15.6% Payment through February 2016. Next payment date is May 2016. PSPC program is discontinued Source: Credit Suisse, SBA

26 February 2016
Agency CMBS Market Watch 19
GLOBAL FIXED INCOME AND ECONOMIC RESEARCH
Ric Deverell Global Head of Fixed Income and Economic Research
212 538 8964 [email protected]
GLOBAL SECURITIZED PRODUCTS RESEARCH
Roger Lehman Head of Global Securitized Products Research 212 325 2123 [email protected]
RESIDENTIAL MORTGAGES CMBS Mahesh Swaminathan Roger Lehman Group Head Group Head 212 325 8789 212 325 2123 [email protected] [email protected] AGENCY MBS NON-AGENCY MBS
Glenn Russo Marc Firestein Serif Ustun, CFA Benjamin Rozyn 212 538 6881 212 325 4379 212 538 4582 212 538 2173 [email protected] [email protected] [email protected] [email protected]
EUROPE CS PLUS/LOCUS MARKETING
Helen Haworth, CFA Shana Drvostep Jason Howell Group Head 212 538 1401 212 325 2117 44 20 7888 0757 [email protected] [email protected] [email protected]
Carlos Diaz Marion Pelata 44 20 7888 2414 44 20 7883 1333 [email protected] [email protected]

26 February 2016
Agency CMBS Market Watch 20
Disclosure Appendix Analyst Certification Serif Ustun, Roger Lehman and Benjamin Rozyn each certify, with respect to the companies or securities that the individual analyzes, that (1) the views expressed in this report accurately reflect his or her personal views about all of the subject companies and securities and (2) no part of his or her compensation was, is or will be directly or indirectly related to the specific recommendations or views expressed in this report. Important Disclosures Credit Suisse's policy is only to publish investment research that is impartial, independent, clear, fair and not misleading. For more detail, please refer to Credit Suisse's Policies for Managing Conflicts of Interest in connection with Investment Research: http://www.csfb.com/research-and-analytics/disclaimer/managing_conflicts_disclaimer.html . Credit Suisse's policy is to publish research reports as it deems appropriate, based on developments with the subject issuer, the sector or the market that may have a material impact on the research views or opinions stated herein. The analyst(s) involved in the preparation of this research report received compensation that is based upon various factors, including Credit Suisse's total revenues, a portion of which are generated by Credit Suisse's Investment Banking and Fixed Income Divisions. Credit Suisse may trade as principal in the securities or derivatives of the issuers that are the subject of this report. At any point in time, Credit Suisse is likely to have significant holdings in the securities mentioned in this report. As at the date of this report, Credit Suisse acts as a market maker or liquidity provider in the debt securities of the subject issuer(s) mentioned in this report. For important disclosure information on securities recommended in this report, please visit the website at https://rave.credit-suisse.com/disclosures/view/fixedincome or call +1-212-538-7625. For the history of trade ideas suggested by the Fixed Income Research department over the previous 12 months, please view the document at http://research-and-analytics.csfb.com/docpopup.asp?ctbdocid=330703_1_en . Credit Suisse clients with access to the Locus website may refer to http://www.credit-suisse.com/locus . For the history of trade ideas suggested by Emerging Markets Strategy Research, please see the latest Emerging Markets Fixed Income Views report on Credit Suisse PLUS . For the history of recommendations provided by Technical Analysis, please visit the website at https://plus.credit-suisse.com/ECP_S/app/container.html#loc=/MENU_FI_ECON_TECHNICAL_ANALYSIS . Credit Suisse does not provide any tax advice. Any statement herein regarding any US federal tax is not intended or written to be used, and cannot be used, by any taxpayer for the purposes of avoiding any penalties. Structured Securities, Derivatives, Options, and Futures Disclaimer General risks: Structured securities, derivatives, options (OTC and listed), and futures (including, but not limited to, commodity, foreign exchange, and security futures) are complex instruments that are not suitable for every investor, may involve a high degree of risk, may be highly illiquid, and may be appropriate investments only for sophisticated investors who are capable of understanding and assuming the risks involved. There is a risk of unlimited, total, or significant loss resulting from the use of these instruments for trading and investment. Before entering into any transaction involving these instruments, you should ensure that you fully understand their potential risks and rewards and independently determine that they are appropriate for you given your objectives, experience, financial and operational resources, and other relevant circumstances. For options, please ensure that you have read the Options Clearing Corporation's disclosure document, available at: http://www.optionsclearing.com/publications/risks/riskchap1.jsp. Risk of losses on options: The maximum potential loss on buying a call or put option is the loss of total premium paid. The maximum potential loss on selling a call option is unlimited. The maximum potential loss on selling a put option is substantial and may exceed the premium received by a significant amount. There are many other options combinations that entail significant risks and transaction costs: you should ensure they are appropriate for your situation and that you understand the risks. Risk of losses on futures: The maximum potential loss on buying a futures contract is substantial (the loss of the value of the contract) and can be amplified by leverage. The maximum potential loss on selling a futures contract is unlimited. OTC options and other derivatives: In discussions of OTC options and other derivatives, the results and risks are based solely on the hypothetical examples cited; actual results and risks will vary depending on specific circumstances. Investors are urged to consider carefully whether these products, as well as the products or strategies discussed herein, are suitable to their needs. While some OTC markets may be liquid, transactions in OTC derivatives may involve greater risk than investments in exchange-listed derivatives because there is no exchange market on which to liquidate a position and it may be very difficult to assess the value of the position because bid and offer prices need not be quoted. Structured products: These products often have a derivative component. As a result, they carry not only the risk of loss of principal, but also the possibility that at expiration the investor will own the reference asset at a depressed price. Even if a structured product is listed on an exchange, active and liquid trading markets may not develop and the structured product may be thinly traded. Taxation: Because of the importance of tax considerations for many option and other derivative transactions, investors considering these products should consult with their tax advisors as to how taxes affect the outcome of contemplated options or other derivatives transactions. You should consult with such tax, accounting, legal or other advisors as you deem necessary to assist you in making these determinations. Transaction costs: Such costs may be significant in option strategies calling for multiple purchases and sales of options and other derivatives, such as spreads and straddles. Commissions and transaction costs may be a factor in actual returns realized by the investor and should be taken into consideration. Trading on margin: Margin requirements vary and should be determined before investing as they can impact your profit potential. If the market moves against your position, you may be called upon by your broker to deposit a substantial amount of additional margin funds, on short notice, in order to maintain your position. If you do not provide the required funds within the time required by your broker, your position may be liquidated at a loss, and you will be liable for any resulting deficit in your account. Further information: Supporting documentation for any claims, comparisons, recommendations, statistics or other technical data in this material will be supplied upon request. Any trade information is preliminary and not intended as an official transaction confirmation. If you have any questions about whether you are eligible to enter into these transactions with Credit Suisse, please contact your sales representative.

26 February 2016
Agency CMBS Market Watch 21
References in this report to Credit Suisse include all of the subsidiaries and affiliates of Credit Suisse operating under its investment banking division. For more information on our structure, please use the following link: https://www.credit-suisse.com/who-we-are This report may contain material that is not directed to, or intended for distribution to or use by, any person or entity who is a citizen or resident of or located in any locality, state, country or other jurisdiction where such distribution, publication, availability or use would be contrary to law or regulation or which would subject Credit Suisse AG or its affiliates ("CS") to any registration or licensing requirement within such jurisdiction. All material presented in this report, unless specifically indicated otherwise, is under copyright to CS. None of the material, nor its content, nor any copy of it, may be altered in any way, transmitted to, copied or distributed to any other party, without the prior express written permission of CS. All trademarks, service marks and logos used in this report are trademarks or service marks or registered trademarks or service marks of CS or its affiliates. The information, tools and material presented in this report are provided to you for information purposes only and are not to be used or considered as an offer or the solicitation of an offer to sell or to buy or subscribe for securities or other financial instruments. CS may not have taken any steps to ensure that the securities referred to in this report are suitable for any particular investor. CS will not treat recipients of this report as its customers by virtue of their receiving this report. The investments and services contained or referred to in this report may not be suitable for you and it is recommended that you consult an independent investment advisor if you are in doubt about such investments or investment services. Nothing in this report constitutes investment, legal, accounting or tax advice, or a representation that any investment or strategy is suitable or appropriate to your individual circumstances, or otherwise constitutes a personal recommendation to you. CS does not advise on the tax consequences of investments and you are advised to contact an independent tax adviser. Please note in particular that the bases and levels of taxation may change. Information and opinions presented in this report have been obtained or derived from sources believed by CS to be reliable, but CS makes no representation as to their accuracy or completeness. CS accepts no liability for loss arising from the use of the material presented in this report, except that this exclusion of liability does not apply to the extent that such liability arises under specific statutes or regulations applicable to CS. This report is not to be relied upon in substitution for the exercise of independent judgment. CS may have issued, and may in the future issue, other communications that are inconsistent with, and reach different conclusions from, the information presented in this report. Those communications reflect the different assumptions, views and analytical methods of the analysts who prepared them and CS is under no obligation to ensure that such other communications are brought to the attention of any recipient of this report. Some investments referred to in this report will be offered solely by a single entity and in the case of some investments solely by CS, or an associate of CS or CS may be the only market maker in such investments. Past performance should not be taken as an indication or guarantee of future performance, and no representation or warranty, express or implied, is made regarding future performance. Information, opinions and estimates contained in this report reflect a judgment at its original date of publication by CS and are subject to change without notice. The price, value of and income from any of the securities or financial instruments mentioned in this report can fall as well as rise. The value of securities and financial instruments is subject to exchange rate fluctuation that may have a positive or adverse effect on the price or income of such securities or financial instruments. Investors in securities such as ADR's, the values of which are influenced by currency volatility, effectively assume this risk. Structured securities are complex instruments, typically involve a high degree of risk and are intended for sale only to sophisticated investors who are capable of understanding and assuming the risks involved. The market value of any structured security may be affected by changes in economic, financial and political factors (including, but not limited to, spot and forward interest and exchange rates), time to maturity, market conditions and volatility, and the credit quality of any issuer or reference issuer. Any investor interested in purchasing a structured product should conduct their own investigation and analysis of the product and consult with their own professional advisers as to the risks involved in making such a purchase. Some investments discussed in this report may have a high level of volatility. High volatility investments may experience sudden and large falls in their value causing losses when that investment is realised. Those losses may equal your original investment. Indeed, in the case of some investments the potential losses may exceed the amount of initial investment and, in such circumstances, you may be required to pay more money to support those losses. Income yields from investments may fluctuate and, in consequence, initial capital paid to make the investment may be used as part of that income yield. Some investments may not be readily realisable and it may be difficult to sell or realise those investments, similarly it may prove difficult for you to obtain reliable information about the value, or risks, to which such an investment is exposed. This report may provide the addresses of, or contain hyperlinks to, websites. Except to the extent to which the report refers to website material of CS, CS has not reviewed any such site and takes no responsibility for the content contained therein. Such address or hyperlink (including addresses or hyperlinks to CS's own website material) is provided solely for your convenience and information and the content of any such website does not in any way form part of this document. Accessing such website or following such link through this report or CS's website shall be at your own risk. This report is issued and distributed in Europe (except Switzerland) by Credit Suisse Securities (Europe) Limited, One Cabot Square, London E14 4QJ, England, which is authorised by the Prudential Regulation Authority and regulated by the Financial Conduct Authority and the Prudential Regulation Authority. This report is issued and distributed in Europe (except Switzerland) by Credit Suisse International, One Cabot Square, London E14 4QJ, England, which is authorised by the Prudential Regulation Authority and regulated by the Financial Conduct Authority and the Prudential Regulation Authority. This report is being distributed in Germany by Credit Suisse Securities (Europe) Limited Niederlassung Frankfurt am Main regulated by the Bundesanstalt fuer Finanzdienstleistungsaufsicht ("BaFin"). This report is being distributed in the United States and Canada by Credit Suisse Securities (USA) LLC; in Switzerland by Credit Suisse AG; in Brazil by Banco de Investimentos Credit Suisse (Brasil) S.A or its affiliates; in Mexico by Banco Credit Suisse (México), S.A. (transactions related to the securities mentioned in this report will only be effected in compliance with applicable regulation); in Japan by Credit Suisse Securities (Japan) Limited, Financial Instruments Firm, Director-General of Kanto Local Finance Bureau (Kinsho) No. 66, a member of Japan Securities Dealers Association, The Financial Futures Association of Japan, Japan Investment Advisers Association, Type II Financial Instruments Firms Association; elsewhere in Asia/ Pacific by whichever of the following is the appropriately authorised entity in the relevant jurisdiction: Credit Suisse (Hong Kong) Limited, Credit Suisse Equities (Australia) Limited, Credit Suisse Securities (Thailand) Limited, regulated by the Office of the Securities and Exchange Commission, Thailand, having registered address at 990 Abdulrahim Place, 27th Floor, Unit 2701, Rama IV Road, Silom, Bangrak, Bangkok 10500, Thailand, Tel. +66 2614 6000, Credit Suisse Securities (Malaysia) Sdn Bhd, Credit Suisse AG, Singapore Branch, Credit Suisse Securities (India) Private Limited (CIN no. U67120MH1996PTC104392) regulated by the Securities and Exchange Board of India as Research Analyst (registration no. INH 000001030) and as Stock Broker (registration no. INB230970637; INF230970637; INB010970631; INF010970631), having registered address at 9th Floor, Ceejay House, Dr.A.B. Road, Worli, Mumbai - 18, India, T- +91-22 6777 3777, Credit Suisse Securities (Europe) Limited, Seoul Branch, Credit Suisse AG, Taipei Securities Branch, PT Credit Suisse Securities Indonesia, Credit Suisse Securities (Philippines ) Inc., and elsewhere in the world by the relevant authorised affiliate of the above. Credit Suisse (Hong Kong) Limited ("CSHK") is licensed and regulated by the Securities and Futures Commission of Hong Kong under the laws of Hong Kong, which differ from Australian laws. CSHKL does not hold an Australian financial services licence (AFSL) and is exempt from the requirement to hold an AFSL under the Corporations Act 2001 (the Act) under Class Order 03/1103 published by the ASIC in respect of financial services provided to Australian wholesale clients (within the meaning of section 761G of the Act). Research on Taiwanese securities produced by Credit Suisse AG, Taipei Securities Branch has been prepared by a registered Senior Business Person. Research provided to residents of Malaysia is authorised by the Head of Research for Credit Suisse Securities (Malaysia) Sdn Bhd, to whom they should direct any queries on +603 2723 2020. This report has been prepared and issued for distribution in Singapore to institutional investors, accredited investors and expert investors (each as defined under the Financial Advisers Regulations) only, and is also distributed by Credit Suisse AG, Singapore branch to overseas investors (as defined under the Financial Advisers Regulations). By virtue of your status as an institutional investor, accredited investor, expert investor or overseas investor, Credit Suisse AG, Singapore branch is exempted from complying with certain compliance requirements under the Financial Advisers Act, Chapter 110 of Singapore (the "FAA"), the Financial Advisers Regulations and the relevant Notices and Guidelines issued thereunder, in respect of any financial advisory service which Credit Suisse AG, Singapore branch may provide to you. This information is being distributed by Credit Suisse AG (DIFC Branch), duly licensed and regulated by the Dubai Financial Services Authority (“DFSA”). Related financial services or products are only made available to Professional Clients or Market Counterparties, as defined by the DFSA, and are not intended for any other persons. Credit Suisse AG (DIFC Branch) is located on Level 9 East, The Gate Building, DIFC, Dubai, United Arab Emirates. This research may not conform to Canadian disclosure requirements. In jurisdictions where CS is not already registered or licensed to trade in securities, transactions will only be effected in accordance with applicable securities legislation, which will vary from jurisdiction to jurisdiction and may require that the trade be made in accordance with applicable exemptions from registration or licensing requirements. Non-U.S. customers wishing to effect a transaction should contact a CS entity in their local jurisdiction unless governing law permits otherwise. U.S. customers wishing to effect a transaction should do so only by contacting a representative at Credit Suisse Securities (USA) LLC in the U.S. Please note that this research was originally prepared and issued by CS for distribution to their market professional and institutional investor customers. Recipients who are not market professional or institutional investor customers of CS should seek the advice of their independent financial advisor prior to taking any investment decision based on this report or for any necessary explanation of its contents. This research may relate to investments or services of a person outside of the UK or to other matters which are not authorised by the Prudential Regulation Authority and regulated by the Financial Conduct Authority and the Prudential Regulation Authority or in respect of which the protections of the Prudential Regulation Authority and Financial Conduct Authority for private customers and/or the UK compensation scheme may not be available, and further details as to where this may be the case are available upon request in respect of this report. CS may provide various services to US municipal entities or obligated persons ("municipalities"), including suggesting individual transactions or trades and entering into such transactions. Any services CS provides to municipalities are not viewed as "advice" within the meaning of Section 975 of the Dodd-Frank Wall Street Reform and Consumer Protection Act. CS is providing any such services and related information solely on an arm's length basis and not as an advisor or fiduciary to the municipality. In connection with the provision of the any such services, there is no agreement, direct or indirect, between any municipality (including the officials, management, employees or agents thereof) and CS for CS to provide advice to the municipality. Municipalities should consult with their financial, accounting and legal advisors regarding any such services provided by CS. In addition, CS is not acting for direct or indirect compensation to solicit the municipality on behalf of an unaffiliated broker, dealer, municipal securities dealer, municipal advisor, or investment adviser for the purpose of obtaining or retaining an engagement by the municipality for or in connection with Municipal Financial Products, the issuance of municipal securities, or of an investment adviser to provide investment advisory services to or on behalf of the municipality. If this report is being distributed by a financial institution other than Credit Suisse AG, or its affiliates, that financial institution is solely responsible for distribution. Clients of that institution should contact that institution to effect a transaction in the securities mentioned in this report or require further information. This report does not constitute investment advice by Credit Suisse to the clients of the distributing financial institution, and neither Credit Suisse AG, its affiliates, and their respective officers, directors and employees accept any liability whatsoever for any direct or consequential loss arising from their use of this report or its content. Principal is not guaranteed. Commission is the commission rate or the amount agreed with a customer when setting up an account or at any time after that. Copyright © 2016 CREDIT SUISSE AG and/or its affiliates. All rights reserved. Investment principal on bonds can be eroded depending on sale price or market price. In addition, there are bonds on which investment principal can be eroded due to changes in redemption amounts. Care is required when investing in such instruments. When you purchase non-listed Japanese fixed income securities (Japanese government bonds, Japanese municipal bonds, Japanese government guaranteed bonds, Japanese corporate bonds) from CS as a seller, you will be requested to pay the purchase price only.


