Africa’s future and the World Bank’s support to it
1
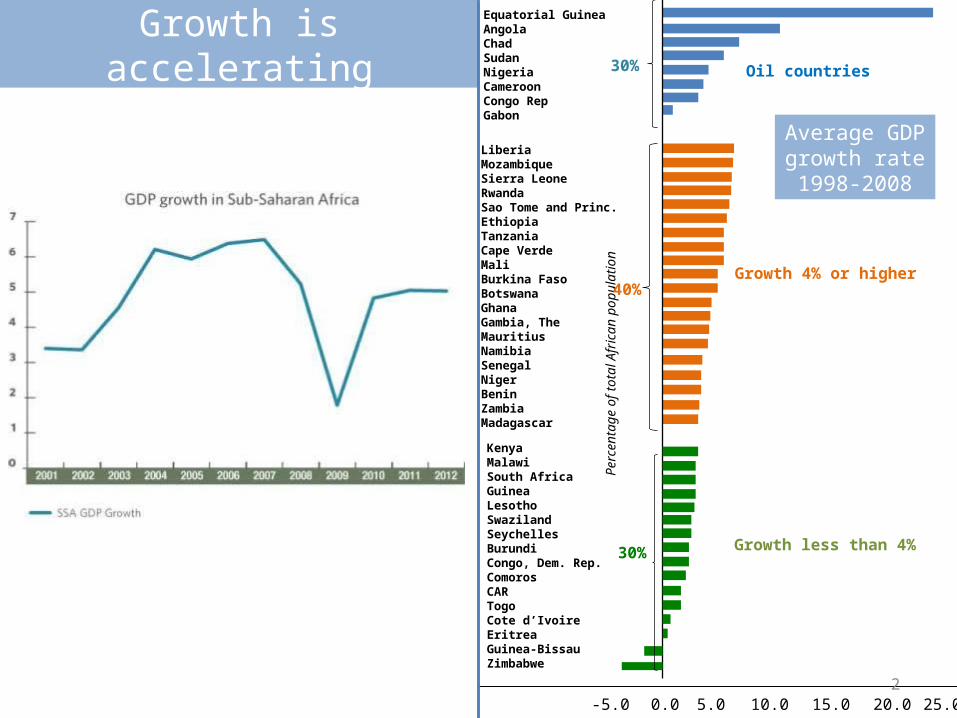
Growth is accelerating•Thanks to continued, prudent economic policies, rapid rebound from the crisis
Equatorial GuineaAngolaChadSudanNigeriaCameroonCongo RepGabon
LiberiaMozambiqueSierra LeoneRwandaSao Tome and Princ.EthiopiaTanzaniaCape VerdeMaliBurkina FasoBotswanaGhanaGambia, TheMauritiusNamibiaSenegalNigerBeninZambiaMadagascar
KenyaMalawiSouth AfricaGuineaLesothoSwazilandSeychellesBurundiCongo, Dem. Rep.ComorosCARTogoCote d’IvoireEritreaGuinea-BissauZimbabwe
0.0-5.0 5.0 10.0 15.0 20.0 25.0
Per
cent
age
of to
tal A
fric
an p
opul
atio
n
30%
40%
30%
Oil countries
Growth 4% or higher
Growth less than 4%
Average GDP growth rate 1998-2008
2
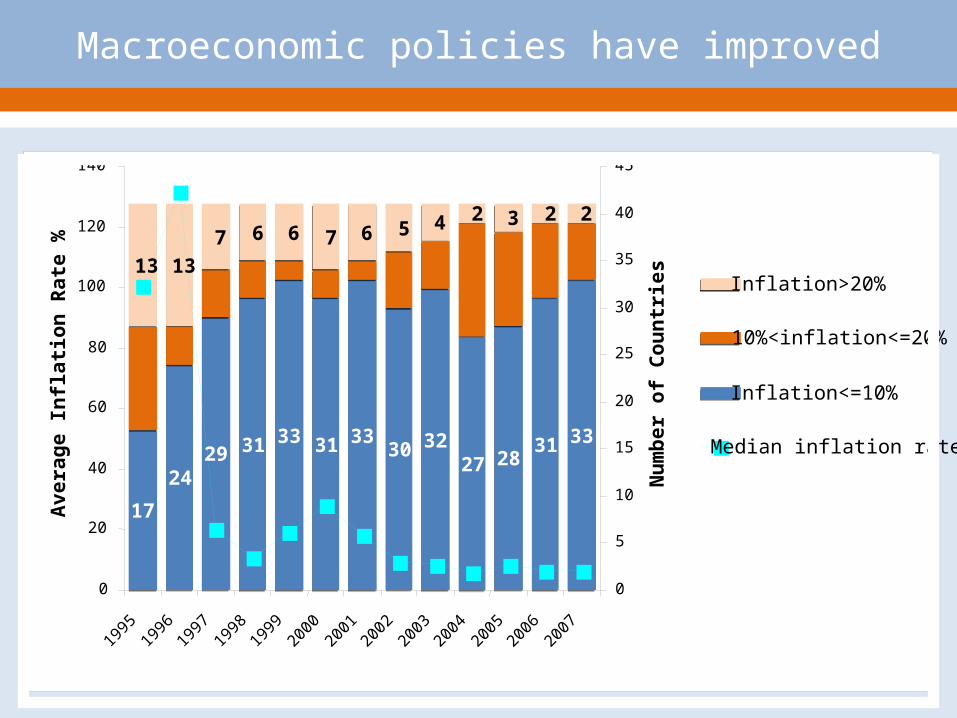
17
2429 31 33 31 33
30 3227 28
31 33
13 13
7 6 6 7 6 5 4 2 3 2 2
0
20
40
60
80
100
120
140
1995
1996
1997
1998
1999
2000
2001
2002
2003
2004
2005
2006
2007
Av
era
ge
In
fla
tio
n R
ate
%
0
5
10
15
20
25
30
35
40
45
Nu
mb
er
of
Co
un
trie
s Inflation>20%
10%<inflation<=20%
Inflation<=10%
Median inflation rate
Macroeconomic policies have improved
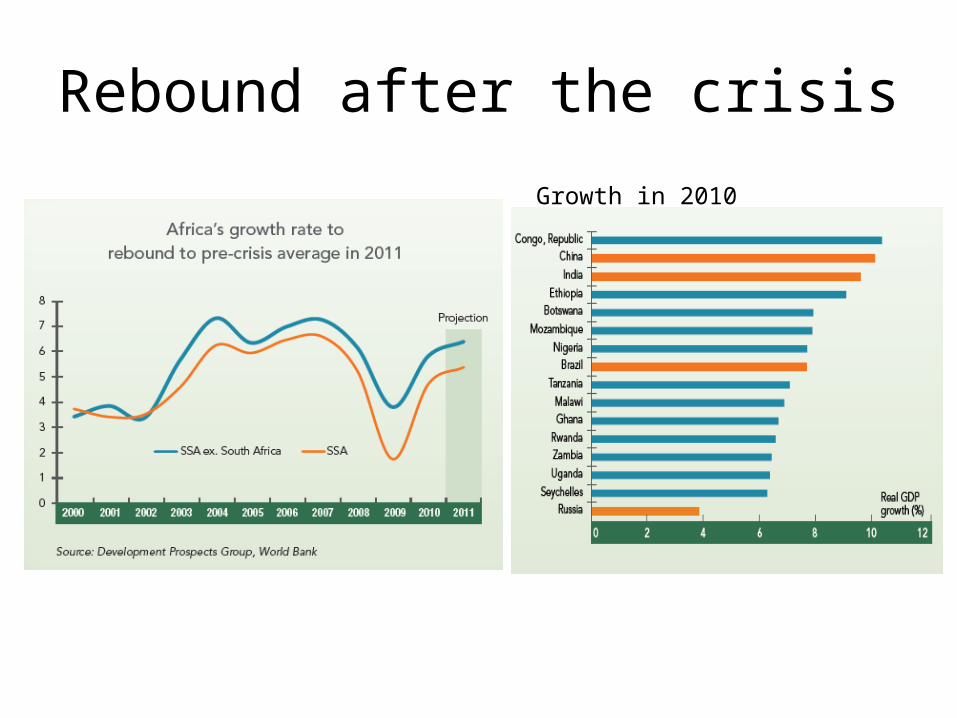
Rebound after the crisis
Growth in 2010
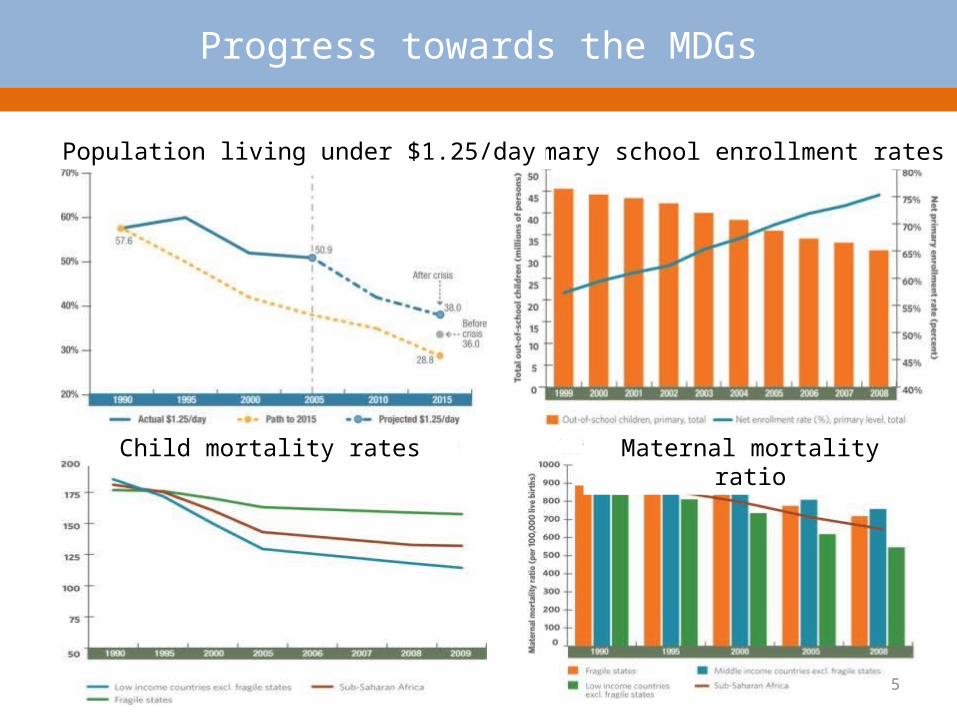
Progress towards the MDGs
Primary school enrollment ratesPopulation living under $1.25/day
Child mortality rates Maternal mortality ratio
5
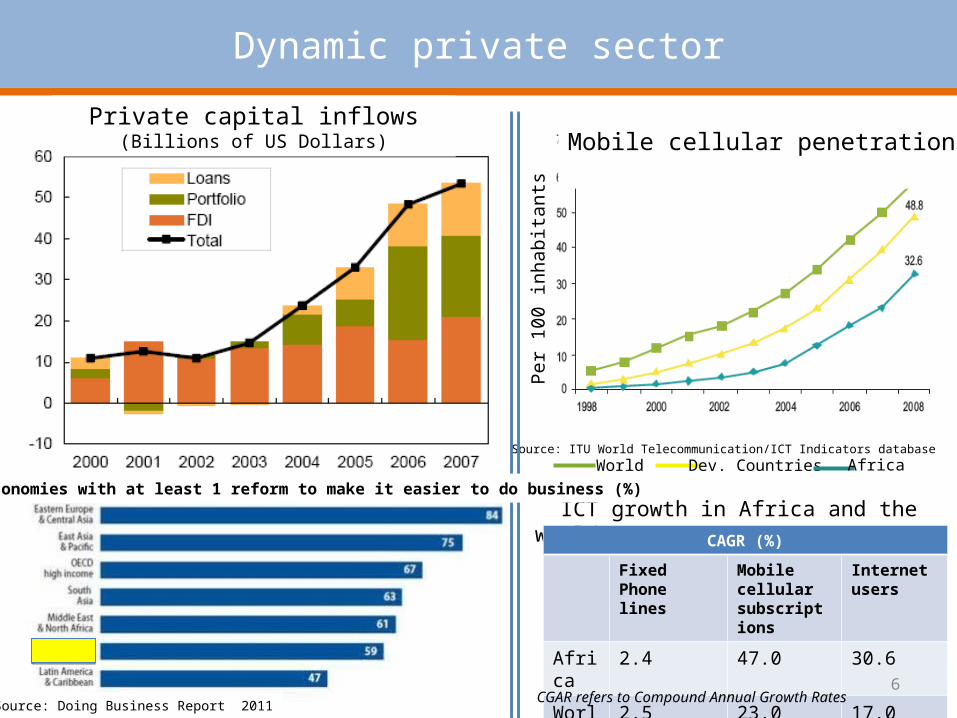
Dynamic private sector
World Dev. Countries Africa
Per 1
00 in
habi
tant
s
Source: ITU World Telecommunication/ICT Indicators database
Private capital inflows(Billions of US Dollars) Mobile cellular penetration
ICT growth in Africa and the world, 2003-2008 CAGR (%)
Fixed Phone lines
Mobile cellular subscriptions
Internet users
Africa 2.4 47.0 30.6
World 2.5 23.0 17.06
CGAR refers to Compound Annual Growth Rates
Share of economies with at least 1 reform to make it easier to do business (%)
Source: Doing Business Report 2011
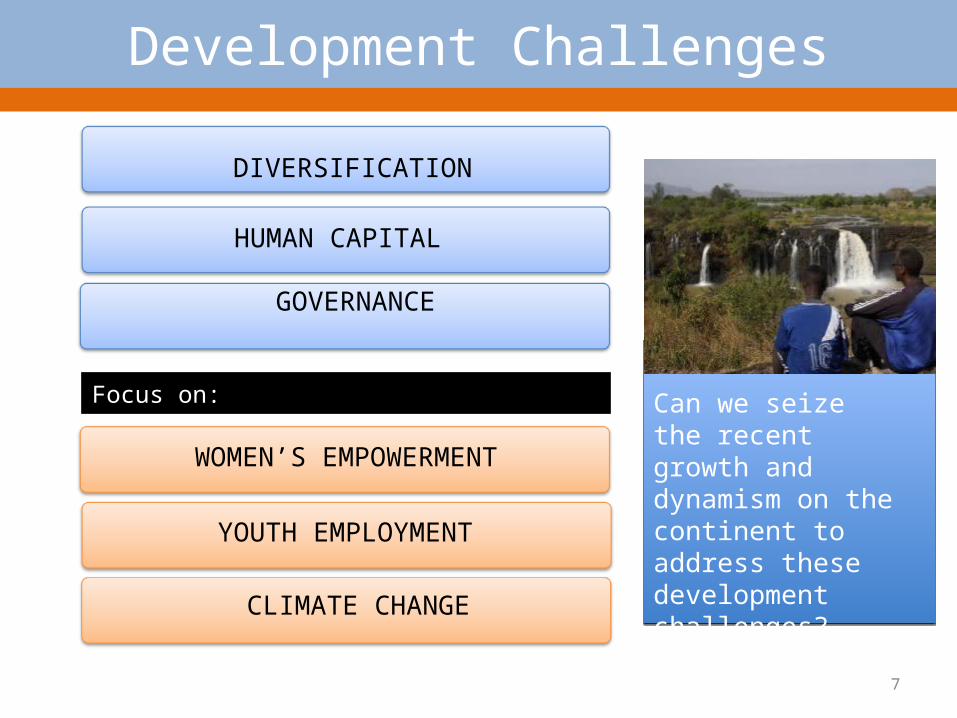
DIVERSIFICATION
HUMAN CAPITAL
GOVERNANCE
Development Challenges
CLIMATE CHANGE
YOUTH EMPLOYMENT
WOMEN’S EMPOWERMENT
Focus on: Can we seize the recent growth and dynamism on the continent to address these development challenges?
7
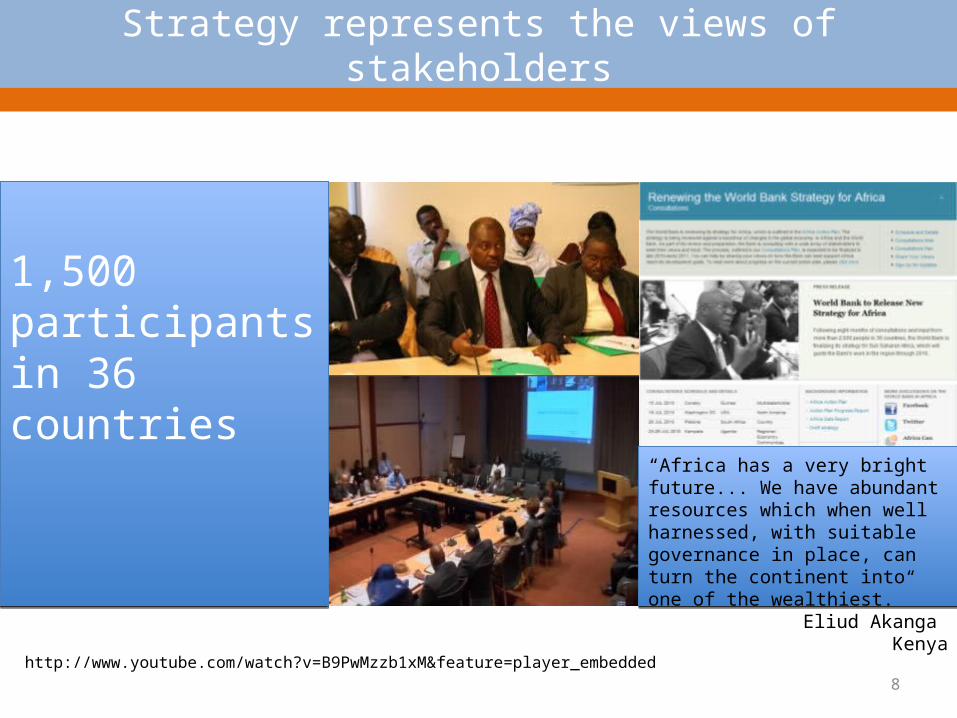
1,500 participants in 36 countries
Strategy represents the views of stakeholders
http://www.youtube.com/watch?v=B9PwMzzb1xM&feature=player_embedded
“Africa has a very bright future... We have abundant resources which when well harnessed, with suitable governance in place, can turn the continent into one of the wealthiest.”
Eliud Akanga Kenya
8
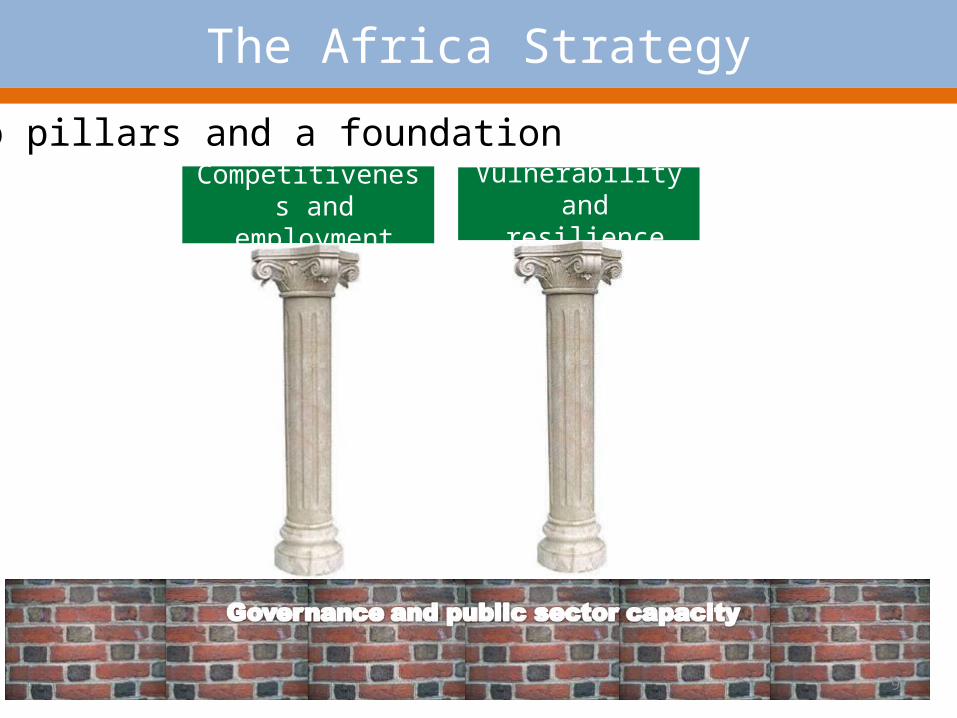
Competitiveness and employment
Vulnerability and resilience
Two pillars and a foundation
The Africa Strategy
9
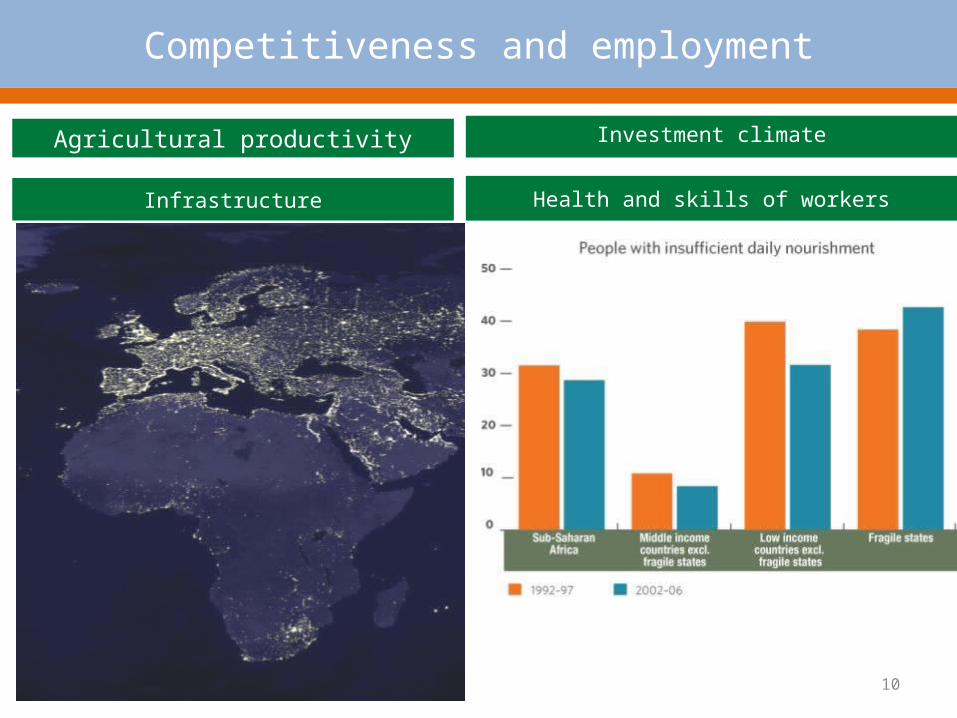
Infrastructure
Investment climate
Health and skills of workers
Competitiveness and employment
Agricultural productivity
Source: Briceño-Garmendia, Smits, and Foster 2008. 10
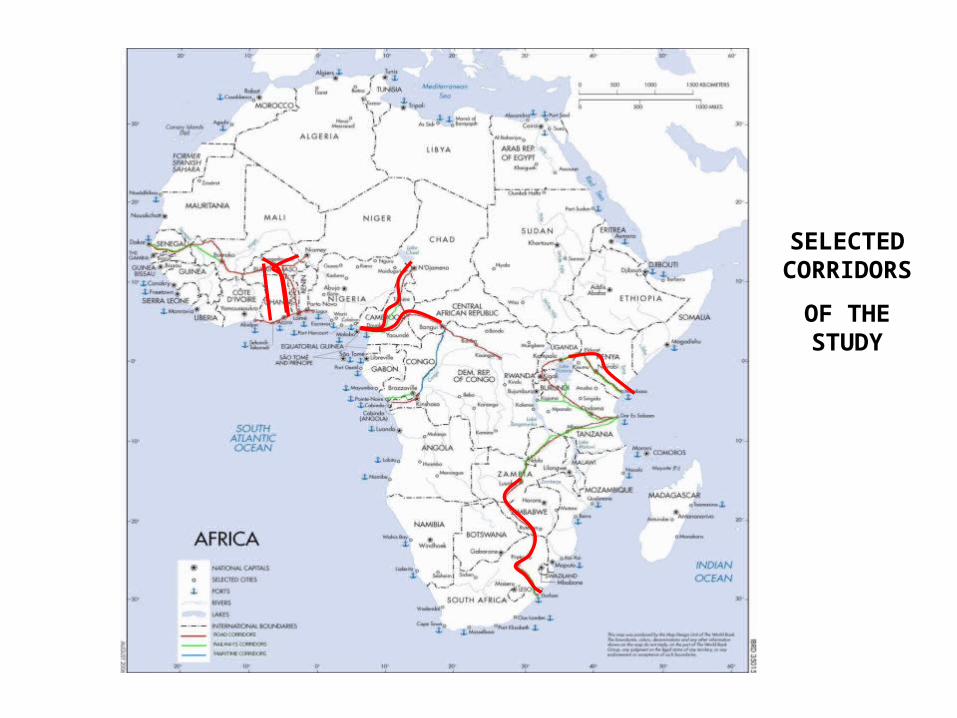
SELECTED CORRIDORS
OF THE STUDY
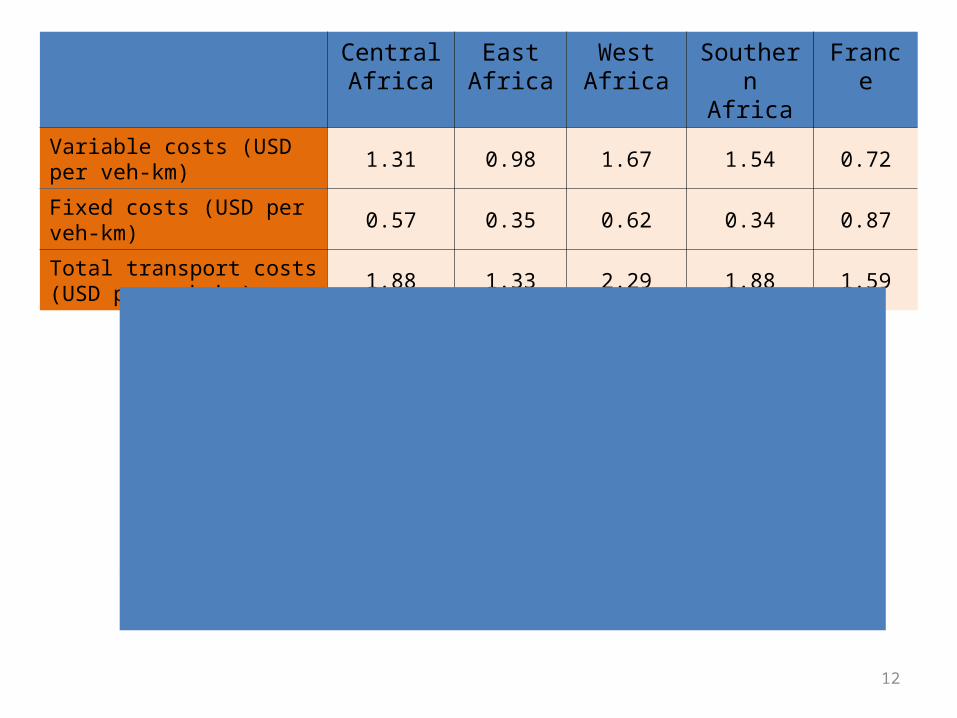
Central Africa
East Africa
West Africa
Southern Africa
France
Variable costs (USD per veh-km) 1.31 0.98 1.67 1.54 0.72
Fixed costs (USD per veh-km) 0.57 0.35 0.62 0.34 0.87
Total transport costs (USD per veh-km) 1.88 1.33 2.29 1.88 1.59
12
23.5 4
5 5 5
78
11
0
2
4
6
8
10
12
14
Pakis
tan
Bra
zil
US
A
Chin
a
Weste
rn
Euro
pe –
long
dis
tance
Afr
ica-
Durb
an-
Lusaka
Afr
ica-
Lom
é -
Ouagadougou
Afr
ica –
Mom
basa
Kam
pala
Afr
ica-
Douala
-
Ndja
ména
Avera
ge t
ransport
prices
(in U
S c
ents
per
tkm
)
Pakis
tan
Braz
il
USA Chin
aW
este
rn Eu
rope
Long
- Dist
ance
Afric
aDur
ban
- Lus
aka
Afric
a – Lo
me-
Ouaga
doug
ouAf
rica
Mom
basa
-Kam
pala
Afric
a
Douala
-Ndj
amen
a
Average Transport Prices(in US cents per tkm)
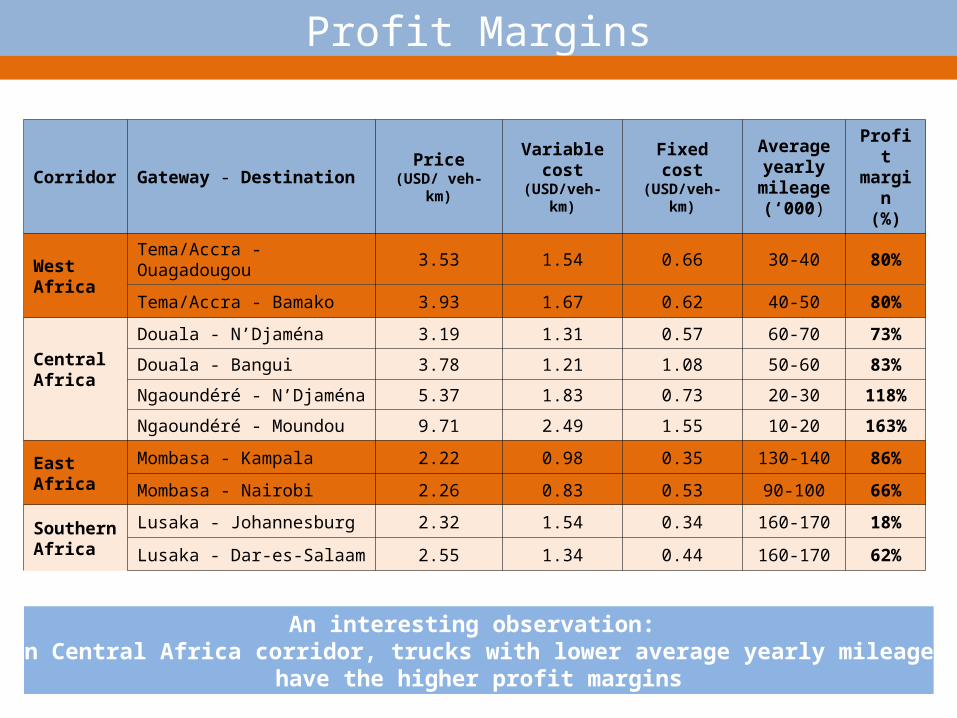
Corridor Gateway - Destination Price(USD/ veh-km)
Variable cost
(USD/veh- km)
Fixed cost(USD/veh- km)
Average yearly
mileage (‘000)
Profit margin
(%)
West Africa
Tema/Accra - Ouagadougou 3.53 1.54 0.66 30-40 80%
Tema/Accra - Bamako 3.93 1.67 0.62 40-50 80%
Central Africa
Douala - N’Djaména 3.19 1.31 0.57 60-70 73%
Douala - Bangui 3.78 1.21 1.08 50-60 83%
Ngaoundéré - N’Djaména 5.37 1.83 0.73 20-30 118%
Ngaoundéré - Moundou 9.71 2.49 1.55 10-20 163%
East Africa
Mombasa - Kampala 2.22 0.98 0.35 130-140 86%
Mombasa - Nairobi 2.26 0.83 0.53 90-100 66%
Southern Africa
Lusaka - Johannesburg 2.32 1.54 0.34 160-170 18%
Lusaka - Dar-es-Salaam 2.55 1.34 0.44 160-170 62%
An interesting observation: On Central Africa corridor, trucks with lower average yearly mileage
have the higher profit margins
Profit Margins
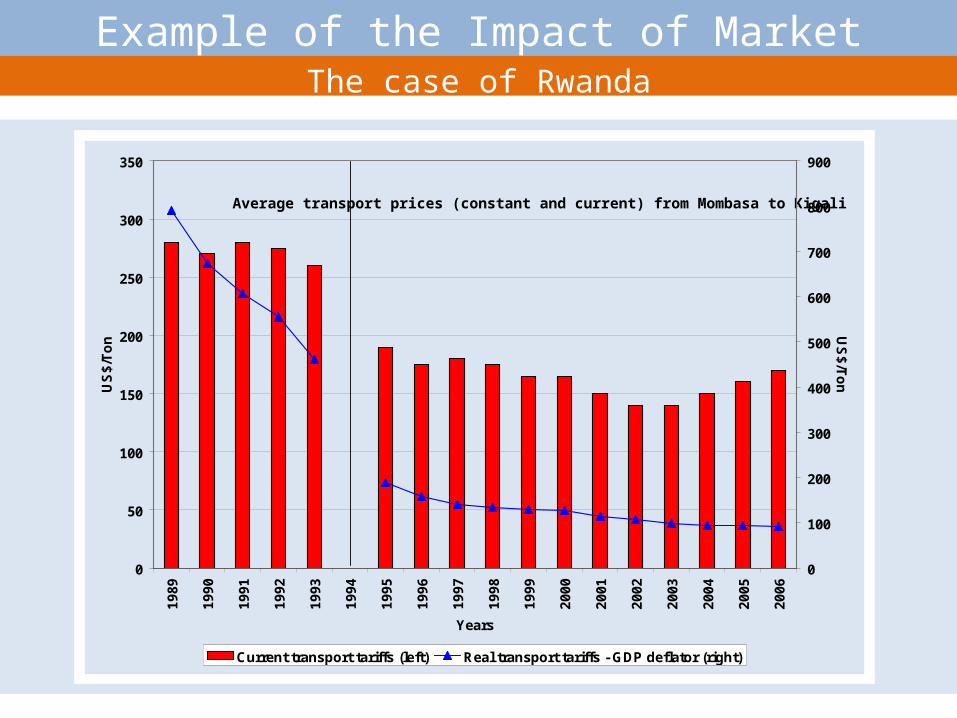
Average transport prices (constant and current) from Mombasa to Kigali
0
50
100
150
200
250
300
3501
98
9
19
90
19
91
19
92
19
93
19
94
19
95
19
96
19
97
19
98
19
99
20
00
20
01
20
02
20
03
20
04
20
05
20
06
Years
US
$/T
on
0
100
200
300
400
500
600
700
800
900
US
$/T
on
Current transport tariffs (left) Real transport tariffs - GDP deflator (right)
After liberalizationBefore liberalization
Example of the Impact of Market Deregulation:The case of Rwanda
Competitiveness and employment
0.0
1.0
2.0
3.0
4.0
5.0
2000-04 2001-05 2002-06 2003-07 2004-2008
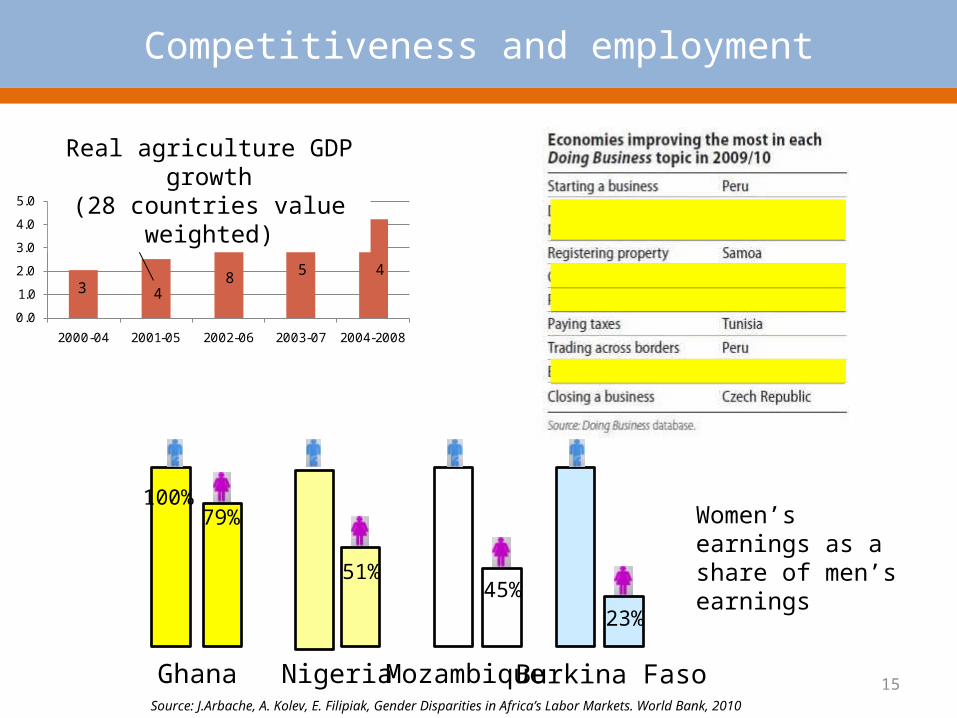
Real Agricultural GDP (28 countries value weighted)
48 5
34
#of countries > 5%/yr
Real agriculture GDP growth(28 countries value weighted)
15Ghana Nigeria Mozambique Burkina Faso
100%
51%45%
23%
79%
Source: J.Arbache, A. Kolev, E. Filipiak, Gender Disparities in Africa’s Labor Markets. World Bank, 2010
Women’s earnings as a share of men’s earnings
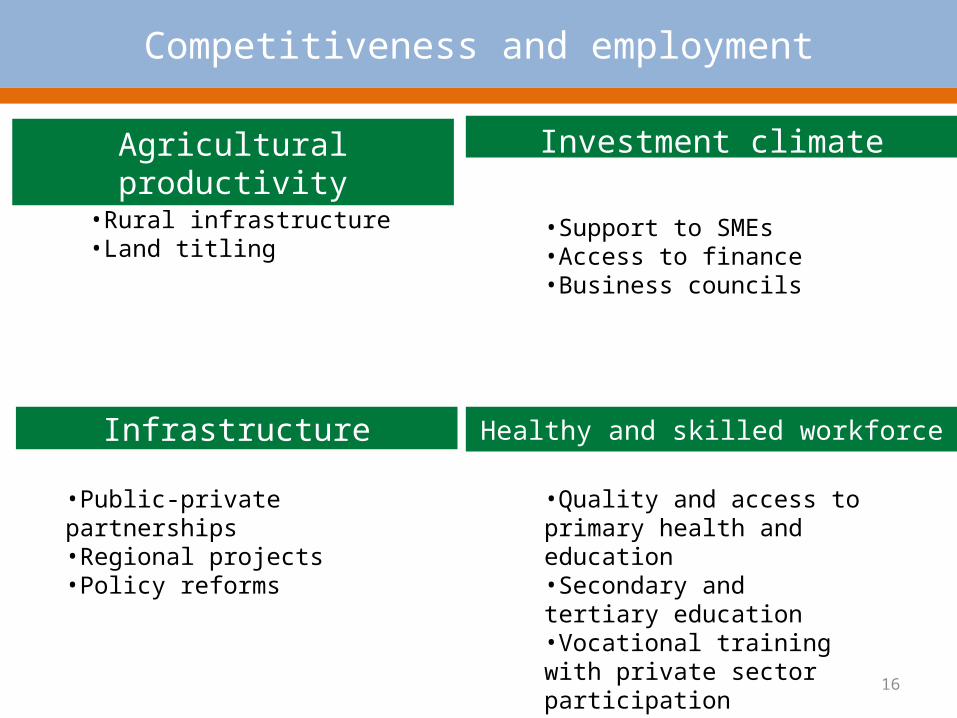
Infrastructure
Investment climate
Healthy and skilled workforce
Competitiveness and employment
Agricultural productivity
16
•Rural infrastructure•Land titling
•Support to SMEs•Access to finance•Business councils
•Public-private partnerships•Regional projects•Policy reforms
•Quality and access to primary health and education•Secondary and tertiary education•Vocational training with private sector participation
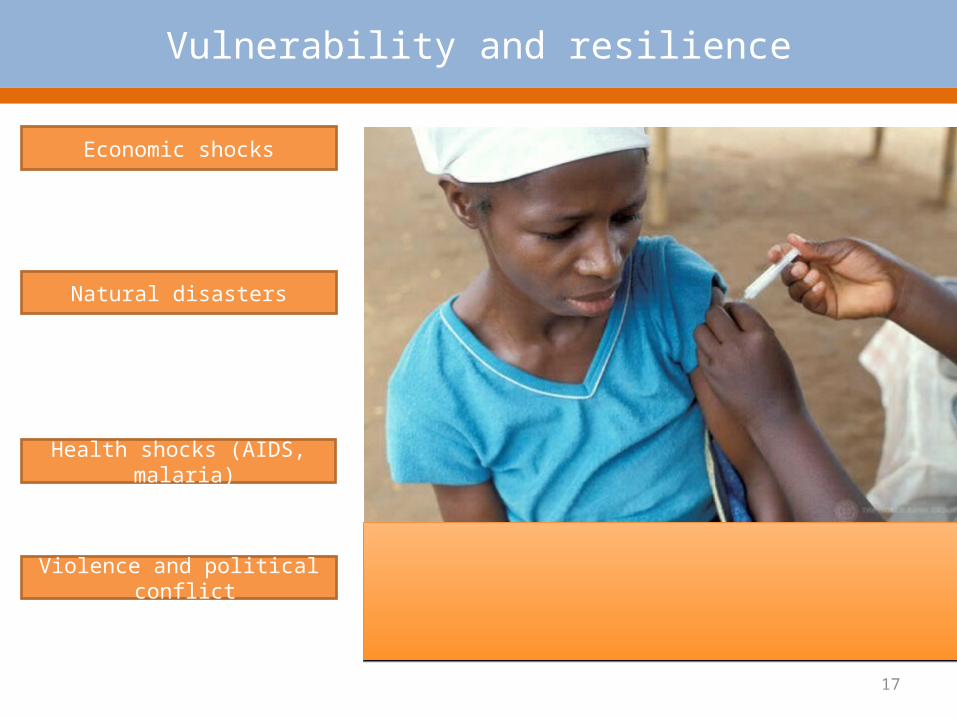
Economic shocks
Health shocks (AIDS, malaria)
Natural disasters
Violence and political conflict
Vulnerability and resilience
17
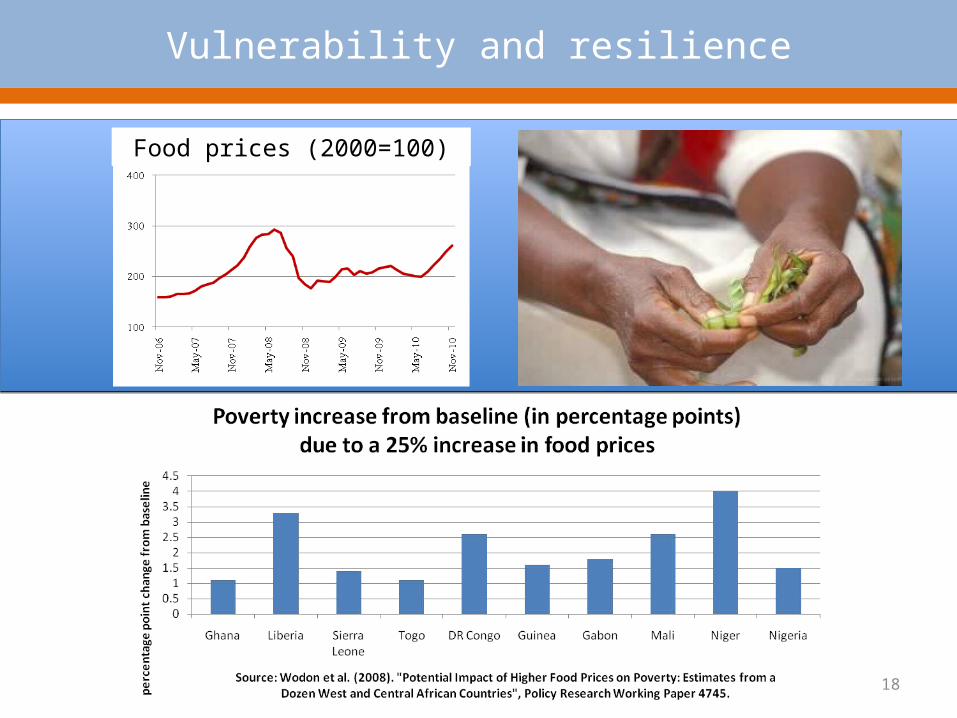
Vulnerability and resilience
Food prices (2000=100)
18
Source: Costs to Developing Countries of Adapting to Climate Change, World Bank, 2009. http://blogs.worldbank.org/dmblog/node/651
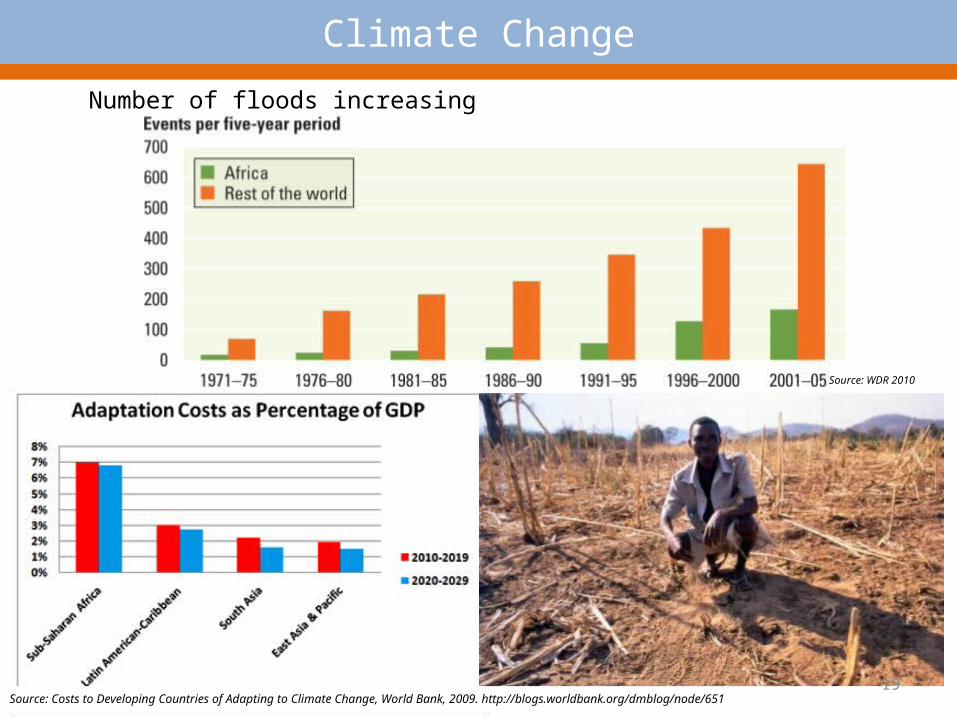
Climate Change
Number of floods increasing
Source: WDR 2010
19
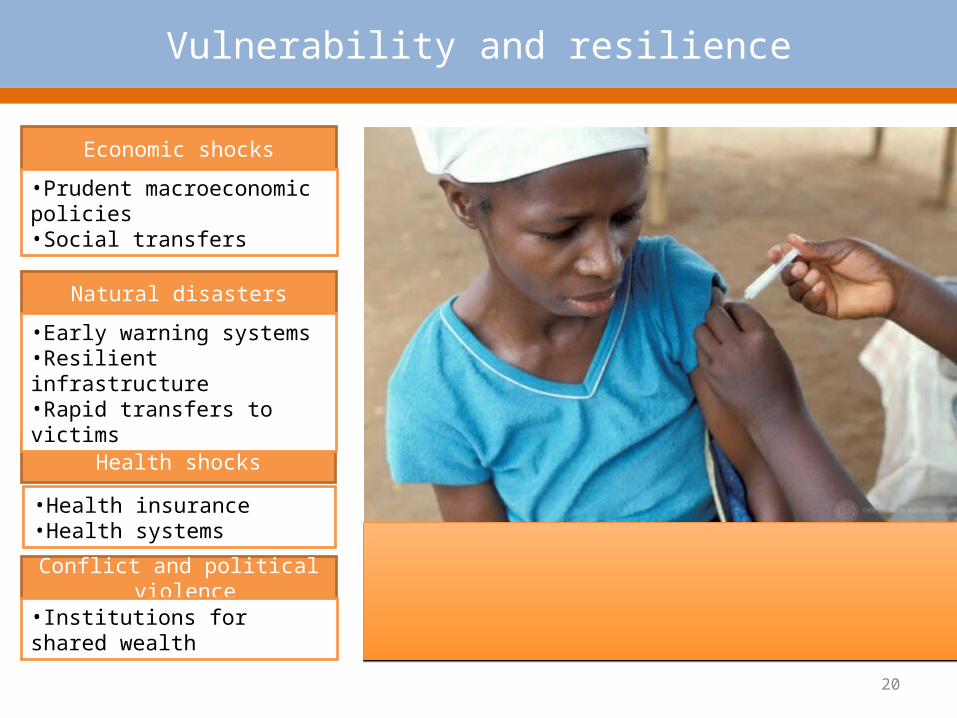
Economic shocks
Health shocks
Natural disasters
Conflict and political violence
Vulnerability and resilience
•Prudent macroeconomic policies•Social transfers
•Health insurance•Health systems
•Early warning systems•Resilient infrastructure•Rapid transfers to victims
•Institutions for shared wealth
20
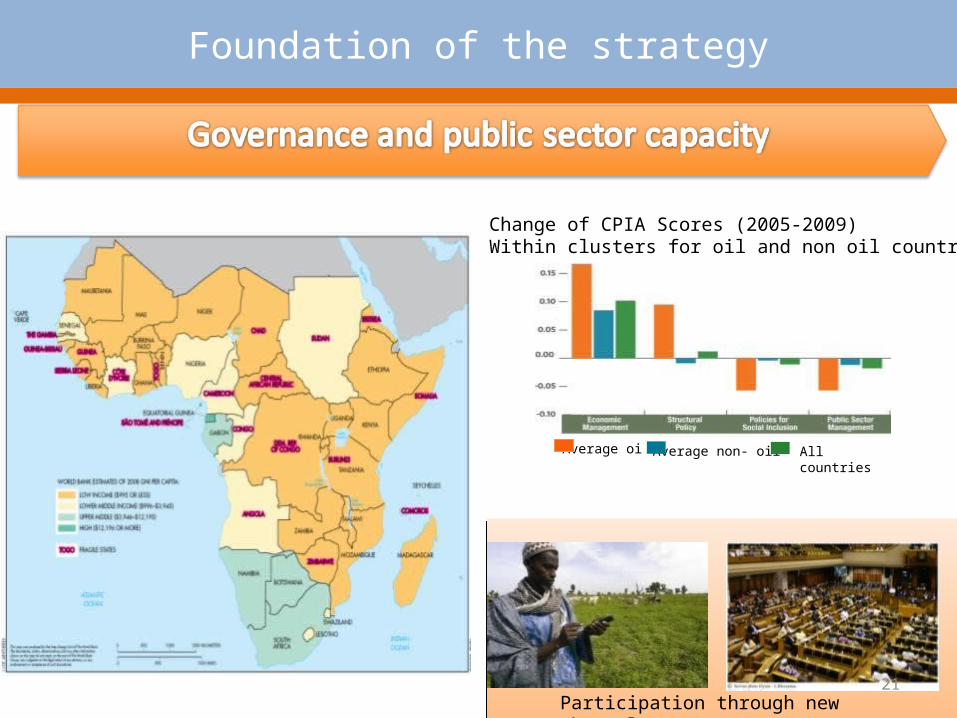
Foundation of the strategy
Change of CPIA Scores (2005-2009)Within clusters for oil and non oil countries
Average oil Average non- oil All countries
Participation through new channels21
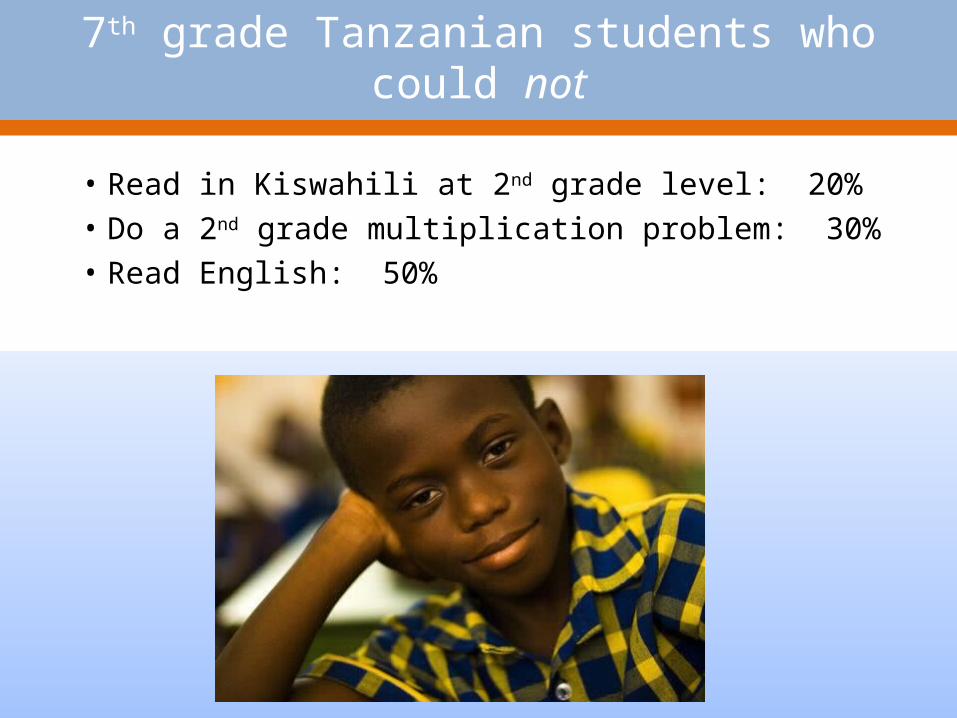
Percentage of 7th grade students in Tanzania who CANNOT
• Read in Kiswahili at 2nd grade level: 20%• Do a 2nd grade multiplication problem: 30%• Read English: 50%
7th grade Tanzanian students who could not
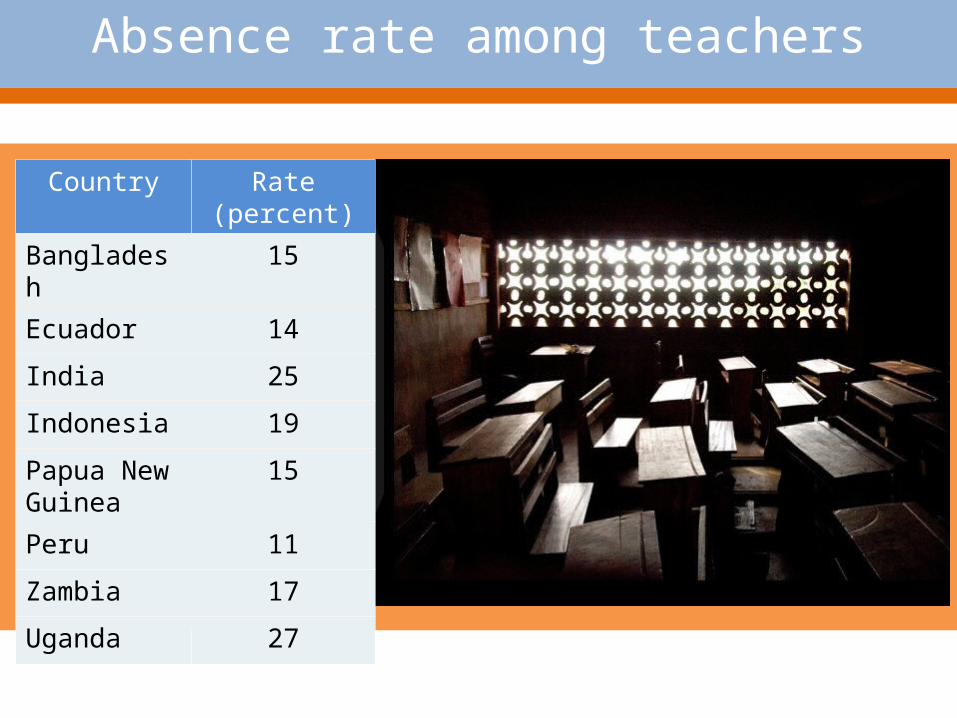
Absence rate among teachers
Country Rate (percent)
Bangladesh 15
Ecuador 14
India 25
Indonesia 19
Papua New Guinea
15
Peru 11
Zambia 17
Uganda 27
24
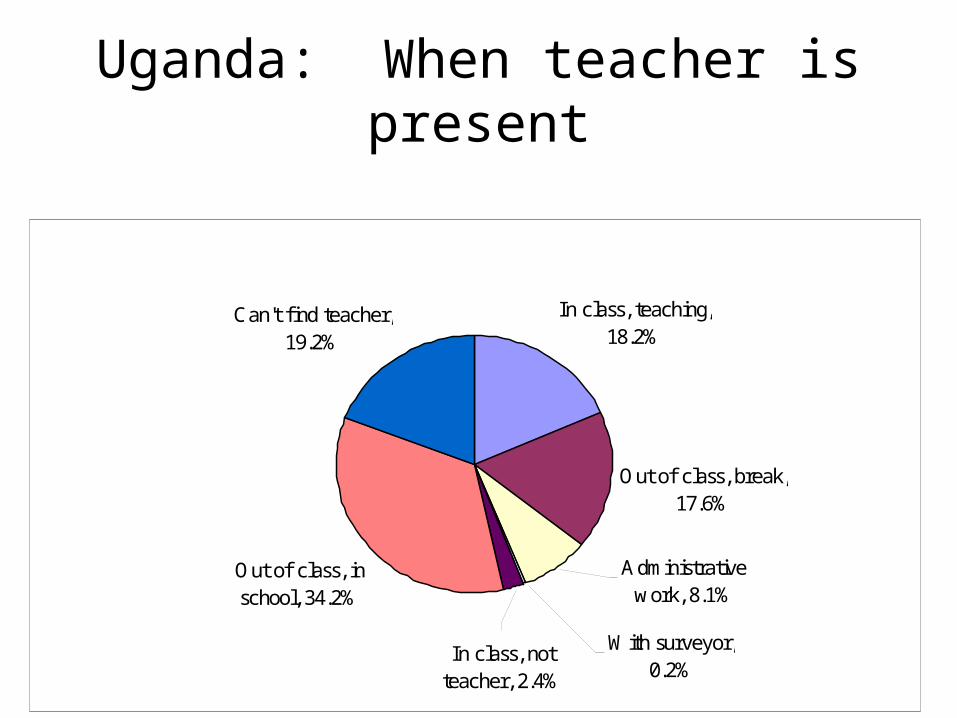
Uganda: When teacher is present
In class, teaching, 18.2%
Out of class, break, 17.6%
Out of class, in school, 34.2%
Can't find teacher, 19.2%
Administrative work, 8.1%
With surveyor, 0.2%
In class, not teacher, 2.4%
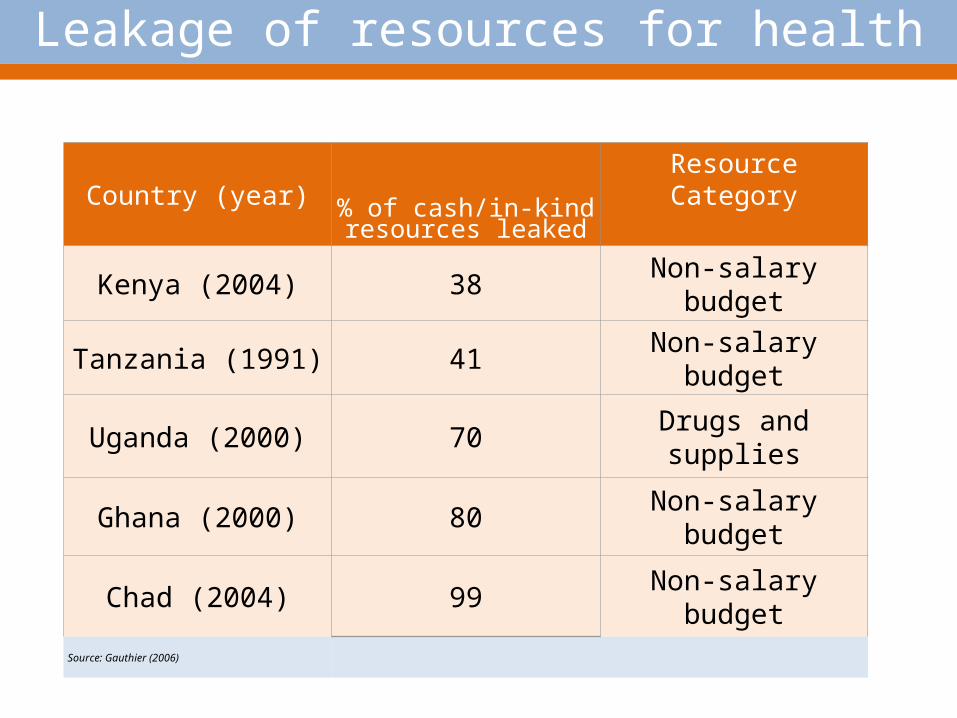
Country (year) % of cash/in-kindresources leaked
Resource Category
Kenya (2004) 38Non-salary
budget
Tanzania (1991) 41Non-salary
budget
Uganda (2000) 70Drugs and supplies
Ghana (2000) 80Non-salary
budget
Chad (2004) 99Non-salary
budgetSource: Gauthier (2006)
Leakage of resources for health
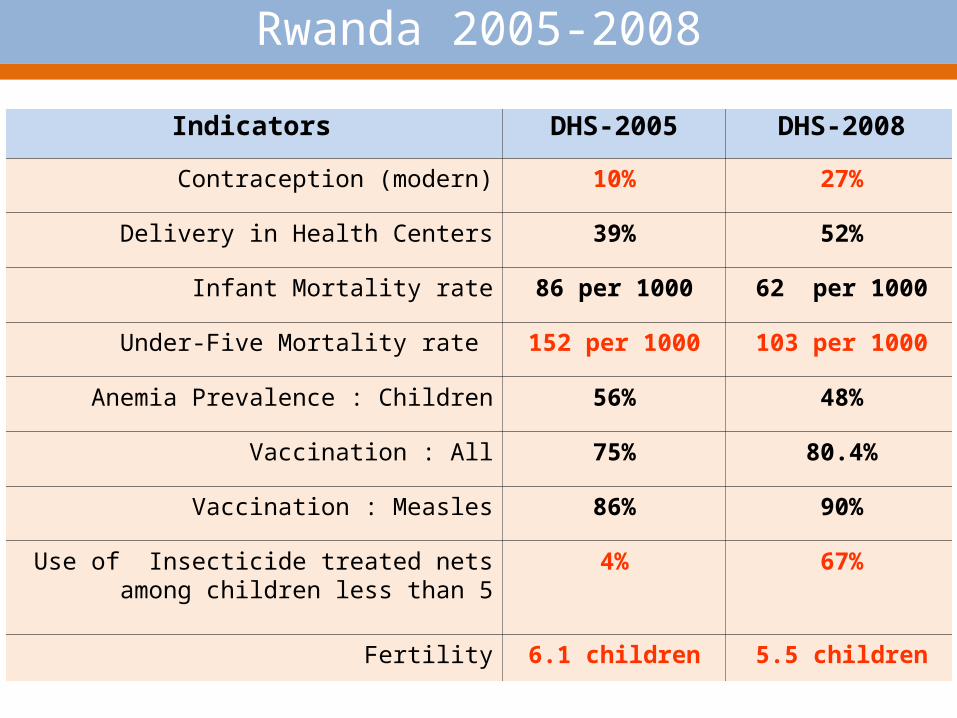
Indicators DHS-2005 DHS-2008
Contraception (modern) 10% 27%
Delivery in Health Centers 39% 52%
Infant Mortality rate 86 per 1000 62 per 1000
Under-Five Mortality rate 152 per 1000 103 per 1000
Anemia Prevalence : Children 56% 48%
Vaccination : All 75% 80.4%
Vaccination : Measles 86% 90%
Use of Insecticide treated nets among children less than 5
4% 67%
Fertility 6.1 children 5.5 children
Rwanda 2005-2008
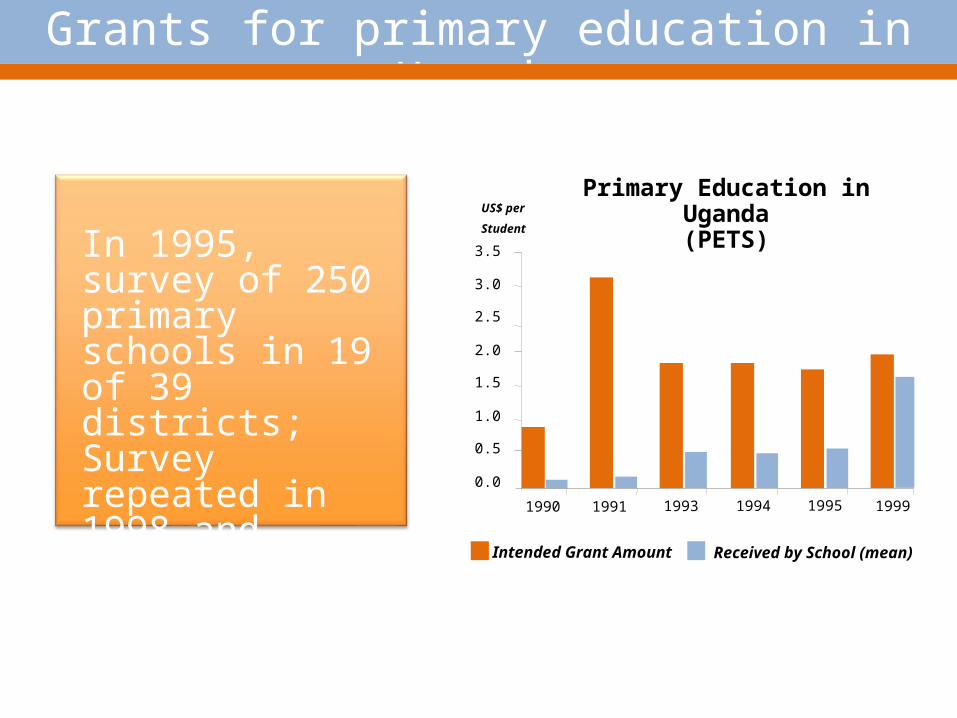
Primary Education in Uganda(PETS)
0.0
0.5
1.0
1.5
2.0
2.5
3.0
3.5
1990 1991 1993 1994 1995
US$ per
Student
Intended Grant Amount Received by School (mean)
1999
Grants for primary education in Uganda
In 1995, survey of 250 primary schools in 19 of 39 districts;Survey repeated in 1998 and 2000.
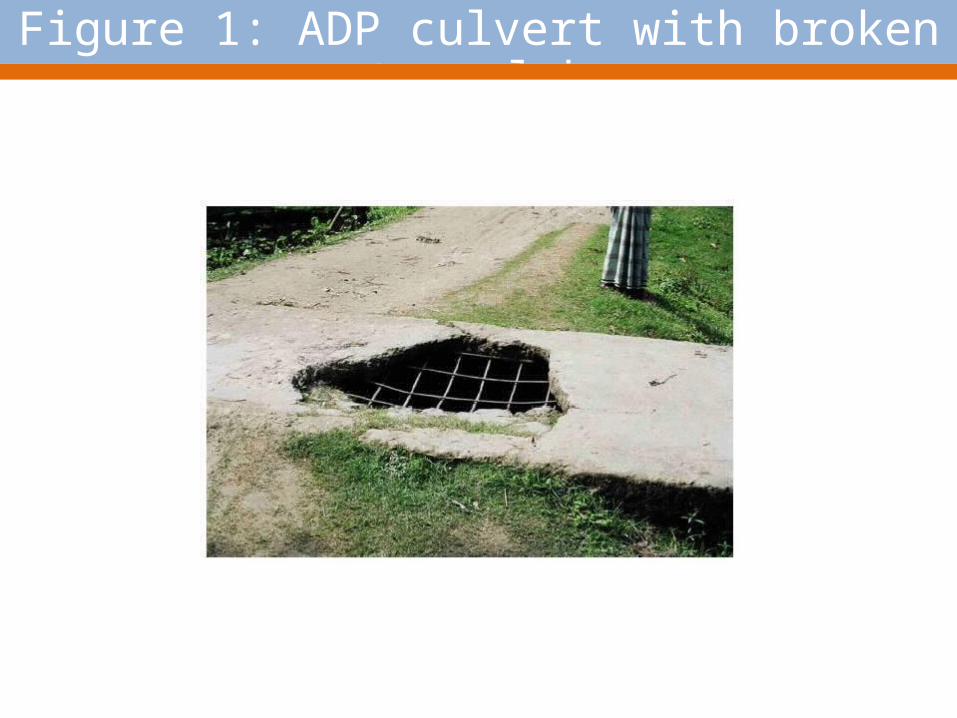
Figure 1: ADP culvert with broken top slab
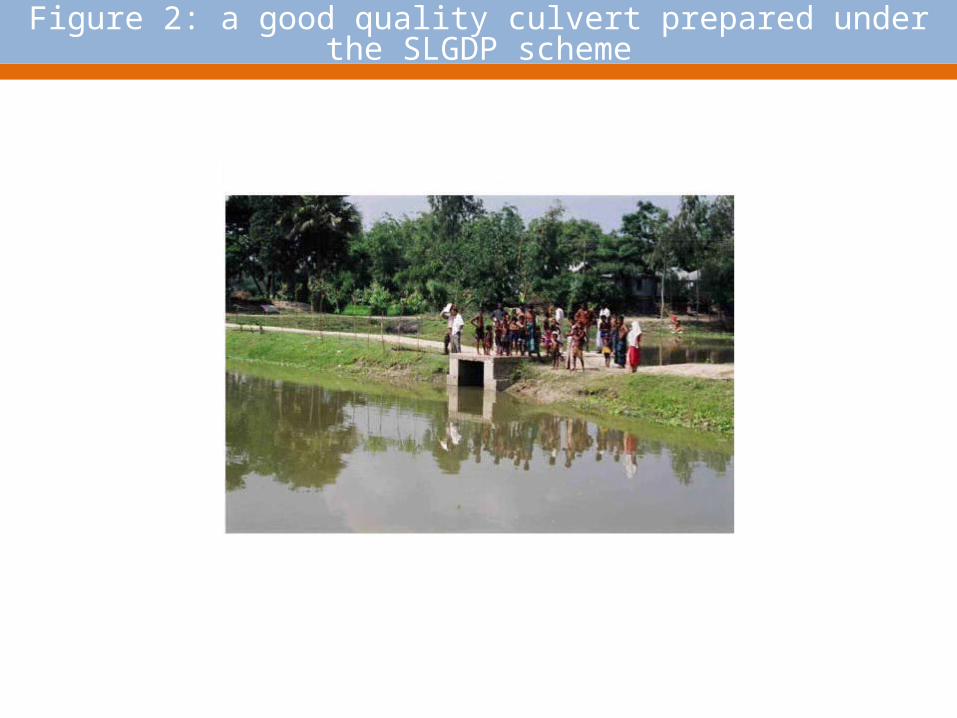
Figure 2: a good quality culvert prepared under the SLGDP scheme
Foundation of the strategy
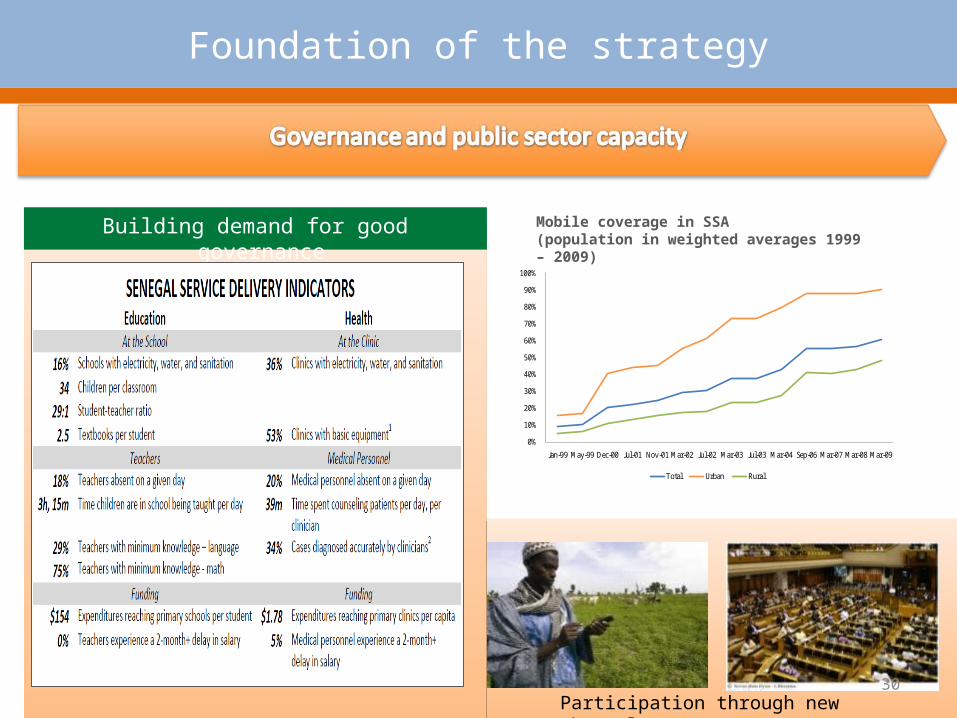
Building demand for good governance
Participation through new channels30
0%
10%
20%
30%
40%
50%
60%
70%
80%
90%
100%
Jan-99 May-99 Dec-00 Jul-01 Nov-01 Mar-02 Jul-02 Mar-03 Jul-03 Mar-04 Sep-06 Mar-07 Mar-08 Mar-09
Total Urban Rural
Mobile coverage in SSA (population in weighted averages 1999 – 2009)
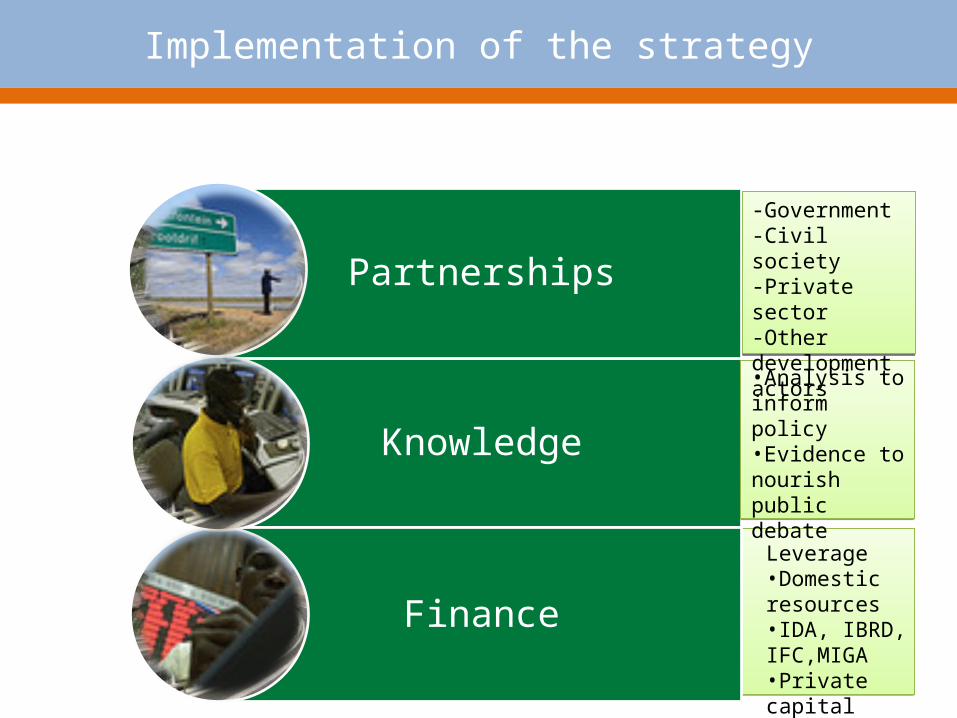
Knowledge
Finance
Partnerships
Implementation of the strategy
Leverage•Domestic resources•IDA, IBRD, IFC,MIGA•Private capital
•Analysis to inform policy•Evidence to nourish public debate
-Government-Civil society-Private sector-Other development actors
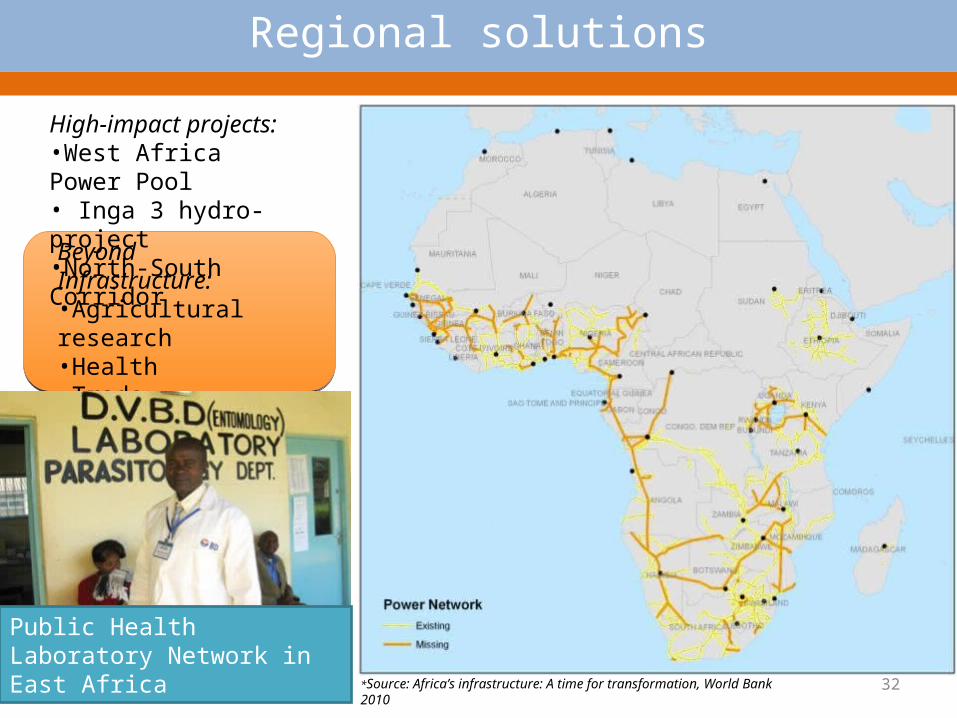
*Source: Africa’s infrastructure: A time for transformation, World Bank 2010
Regional solutions
Beyond Infrastructure:•Agricultural research•Health•Trade integration
Public Health Laboratory Network in East Africa
High-impact projects:•West Africa Power Pool• Inga 3 hydro-project •North-South Corridor
32
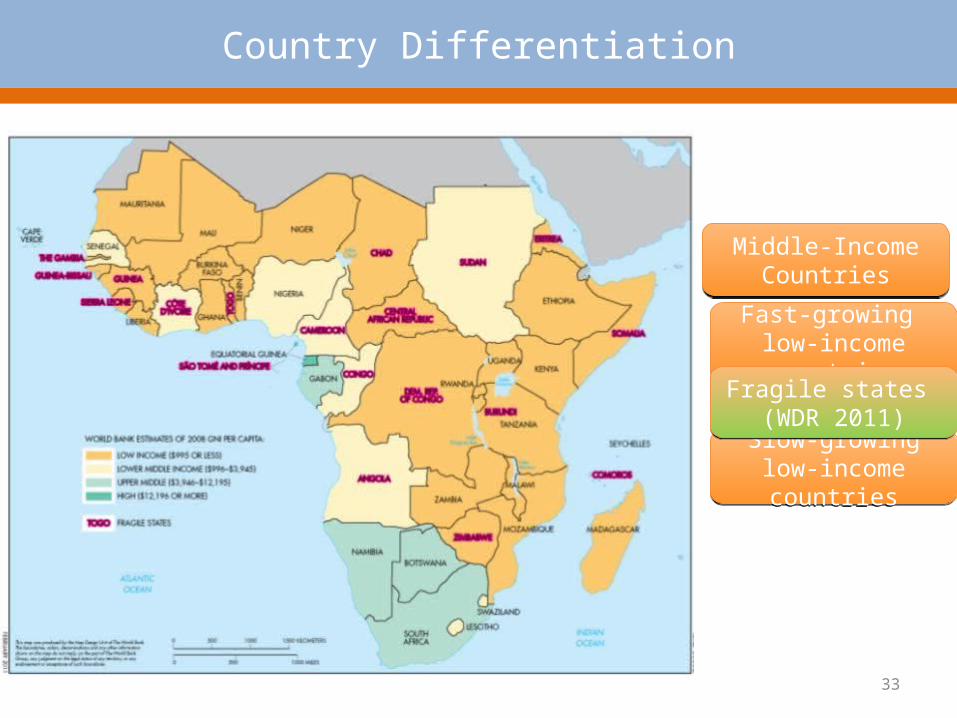
Middle-Income Countries
Middle-Income Countries
Fast-growing low-income countries
Fast-growing low-income countries
Country Differentiation
33
Slow-growing low-income countries
Slow-growing low-income countries
Fragile states (WDR 2011)
Fragile states (WDR 2011)
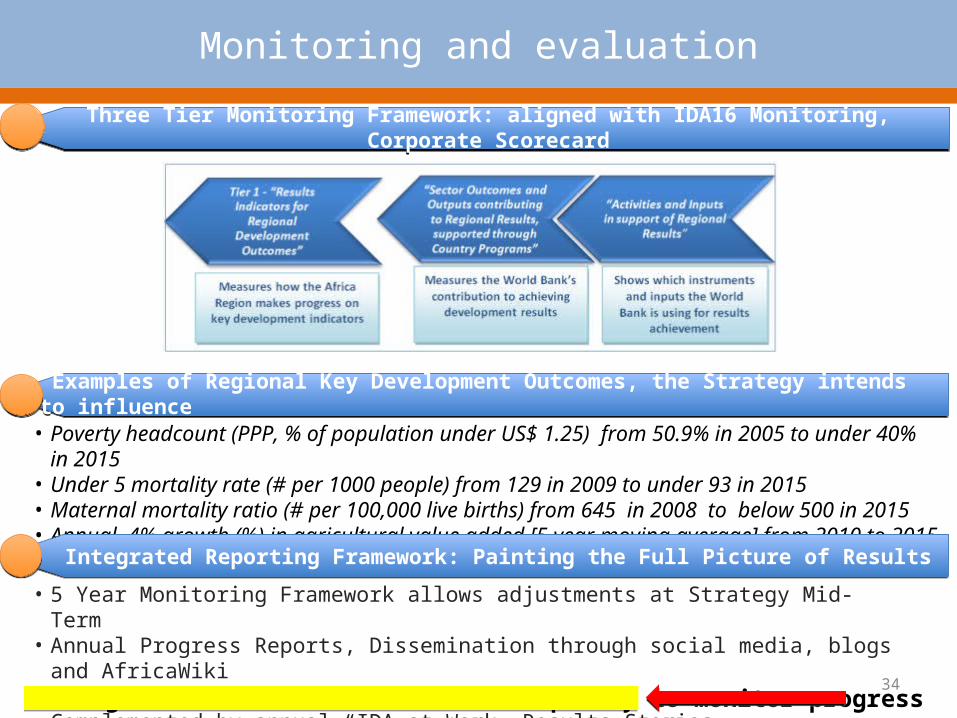
• 5 Year Monitoring Framework allows adjustments at Strategy Mid-Term• Annual Progress Reports, Dissemination through social media, blogs and AfricaWiki• Drawing from CAS results• Complemented by annual “IDA at Work” Results Stories
Monitoring and evaluation
• Poverty headcount (PPP, % of population under US$ 1.25) from 50.9% in 2005 to under 40% in 2015• Under 5 mortality rate (# per 1000 people) from 129 in 2009 to under 93 in 2015• Maternal mortality ratio (# per 100,000 live births) from 645 in 2008 to below 500 in 2015• Annual 4% growth (%) in agricultural value added [5 year moving average] from 2010 to 2015
Three Tier Monitoring Framework: aligned with IDA16 Monitoring, Corporate Scorecard
Three Tier Monitoring Framework: aligned with IDA16 Monitoring, Corporate Scorecard
Examples of Regional Key Development Outcomes, the Strategy intends to influence
Examples of Regional Key Development Outcomes, the Strategy intends to influence
Integrated Reporting Framework: Painting the Full Picture of Results Integrated Reporting Framework: Painting the Full Picture of Results
Strengthen countries’ statistical capacity to monitor progress34
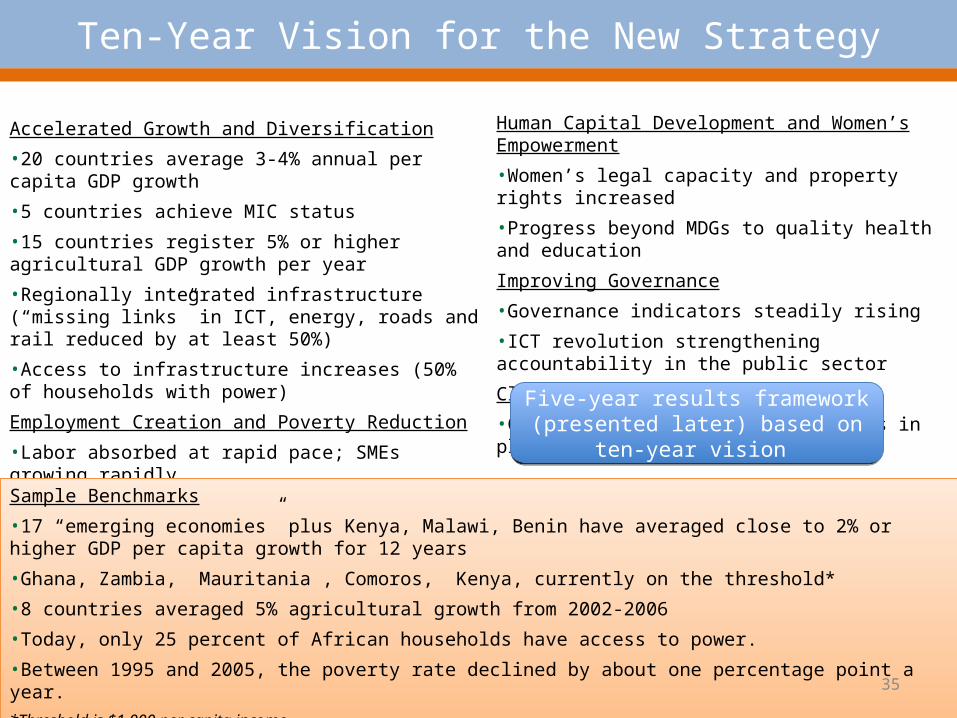
Ten-Year Vision for the New Strategy
Accelerated Growth and Diversification
•20 countries average 3-4% annual per capita GDP growth
•5 countries achieve MIC status
•15 countries register 5% or higher agricultural GDP growth per year
•Regionally integrated infrastructure (“missing links” in ICT, energy, roads and rail reduced by at least 50%)
•Access to infrastructure increases (50% of households with power)
Employment Creation and Poverty Reduction
•Labor absorbed at rapid pace; SMEs growing rapidly
•Decline in poverty rate by 12 percentage points
Sample Benchmarks
•17 “emerging economies” plus Kenya, Malawi, Benin have averaged close to 2% or higher GDP per capita growth for 12 years
•Ghana, Zambia, Mauritania , Comoros, Kenya, currently on the threshold*
•8 countries averaged 5% agricultural growth from 2002-2006
•Today, only 25 percent of African households have access to power.
•Between 1995 and 2005, the poverty rate declined by about one percentage point a year. *Threshold is $1,000 per capita income
Human Capital Development and Women’s Empowerment
•Women’s legal capacity and property rights increased
•Progress beyond MDGs to quality health and education
Improving Governance
•Governance indicators steadily rising
•ICT revolution strengthening accountability in the public sector
Climate Change
•Climate change adaptation measures in place
Five-year results framework (presented later) based on ten-year vision
Five-year results framework (presented later) based on ten-year vision
35


