Download - Afghan Opium Survey 2011

8/3/2019 Afghan Opium Survey 2011
http://slidepdf.com/reader/full/afghan-opium-survey-2011 1/30
Afghanistan
Opium Survey 2011Summary fndings
O C T O B E R
2 0 1 1
Islamic Republic of Afghanistan
Ministry of Counter Narcotics

8/3/2019 Afghan Opium Survey 2011
http://slidepdf.com/reader/full/afghan-opium-survey-2011 2/30
ABBREVIATIONSAGE Anti-government Elements
ANP Afghan National PoliceCNPA Counter Narcotics Police of AfghanistanGLE Governor-led eradicationICMP Illicit Crop Monitoring Programme (UNODC)ISAF International Security Assistance ForceMCN Ministry of Counter-NarcoticsSMD Survey and Monitoring Directorate (MCN)UNODC United Nations Office on Drugs and Crime
ACKNOWLEDGEMENTSThe following organizations and individuals contributed to the implementation of the 2011Afghanistan Opium Survey and to the preparation of this report:
Ministry of Counter-Narcotics:
Mohammad Ibrahim Azhar (Deputy Minister), Haroon Rashid Sherzad (Director General), Policy&Coordination, Mir Abdullah (Deputy Director of Survey and Monitoring Directorate), Saraj Ahmad(Deputy Director of Survey and Monitoring Directorate), Mohammad Khyber Wardak (Databaseofficer), Mohammad Sadiq Rizaee (GIS & Remote Sensing Analyst), Shiraz Khan Hadawe (GIS &Remote Sensing Analyst), Mohammad Ajmal (Data entry clerk), Sahar Yousofzai (Data entry clerk),Mohammad Hakim Hayat (Data entry clerk).
Survey Coordinators: Sayed Eshaq Masumi (Central Region), Abdul Mateen (Eastern Region), AbdulLatif Ehsan (Western Region), Fida Mohammad (Northern Region), Mohammed Ishaq Anderabi(North-Eastern Region), Khalil Ahmad (Southern Region), Khiali Jan Mangal (EradicationVerification and Opium Yield coordinator),
United Nations Office on Drugs and Crime (Kabul)Jean-Luc Lemahieu (Country Representative), Ashita Mittal (Deputy Representative, Programme),Devashish Dhar (International Project Coordinator), Ziauddin Zaki (National Project Coordinator),Abdul Mannan Ahmadzai (Survey Officer), Noor Mohammad Sadiq (Database Developer)
Remote sensing analysts: Ahmad Jawid Ghiasee and Sayed Sadat Mehdi Eradication reporters: Ramin Sobhi and Zia Ulhaq Sidiqi.
Survey Coordinators: Abdul Basir Basiret (Eastern Region), Abdul Jalil (Northern Region), SayedAhmad (Southern Region), Fawad Ahmad Alaie (Western Region), Mohammad Rafi (North-easternRegion), Rahimullah Omar (Central Region),
Provincial Coordinators: Fazal Mohammad Fazli (Southern Region), Mohammad Alam GhalibEastern Region), Altaf Hussain Joya (Western Region), Lutfurhaman Lutfi (Northern Region)
United Nations Office on Drugs and Crime (Vienna)Sandeep Chawla (Director, Division for Policy Analysis and Public Affairs), Angela Me (Chief,Statistics and Surveys Section-SASS), Martin Raithelhuber (Programme Officer), Irmgard Zeiler(Research Expert), Philip Davis (Statistician), Coen Bussink (GIS & Remote Sensing Expert) (allSASS), Yen-Ling Wong (Scientific Affairs Officer, Laboratory and Scientific Section), SuzanneKunnen (Public Information Assistant, Studies and Threat Analysis Section).
The implementation of the survey would not have been possible without the dedicated work of thefield surveyors, who often faced difficult security conditions.
The MCN/UNODC Illicit Crop Monitoring activities in Afghanistan were made possible by financialcontributions from the Governments of Germany, Norway, the United Kingdom and the United Statesof America.

8/3/2019 Afghan Opium Survey 2011
http://slidepdf.com/reader/full/afghan-opium-survey-2011 3/30
Afghanistan Opium Survey 2011
Summary Findings
October 2011

8/3/2019 Afghan Opium Survey 2011
http://slidepdf.com/reader/full/afghan-opium-survey-2011 4/30
Fact Sheet, Afghanistan Opium Survey 20111
2010 Changefrom 2010
2011
Net opium poppy cultivation (after eradication)123,000 ha
(104,000-145,000)+7%
131,000 ha(109,000-155,000)
Number of poppy free provinces2 20 -3 17
Number of provinces affected by poppy cultivation 14 +3 17
Eradication 2,316 ha +65% 3,810 ha
Weighted average opium yield 29.2 kg/ha +52% 44.5 kg/ha
Potential production of opium3,600 mt
(3,000-4,200)+61%
5,800 mt
(4,800-6,800)
Number of household involved in opiumcultivation
248,700 -23% 191,500
In % of total population3 6% 5%
Average farm-gate price (weighted by production)of fresh opium at harvest time
US$ 128/kg +41% US$ 180/kg
Average farm-gate price (weighted by production)of dry opium at harvest time
US$ 169/kg +43% US$ 241/kg
Current GDP4 US$ 12.7 billion US$ 16.34 billion
Total farm-gate value of opium production US$ 605 million +133% US$ 1,407 million
In % of GDP 5% 9%
Gross income from opium per ha5 US$ 4,900 +118% US 10,700
1 Numbers in brackets indicate the upper and lower bounds of the estimation range.2 Poppy-free provinces are those which are estimated to have less than 100 ha of opium cultivation.3 Based on a population of 24.5 million for 2010 and 25.0 million for 2011 and an average household sizeof 6.2 and 6.3 persons, respectively. Source: Government of Afghanistan, Central Statistical Office.4 Relation to nominal GDP of the respective year. Source: Government of Afghanistan, Central StatisticalOffice.5 Income figures are indicative only as they do not include all expenditure and income componentsassociated with opium cultivation.

8/3/2019 Afghan Opium Survey 2011
http://slidepdf.com/reader/full/afghan-opium-survey-2011 5/30
2
SUMMARY FINDINGS
Overview
The total area under opium poppy cultivation in Afghanistan in 2011 was estimated at131,000 hectares (ha), a 7% increase compared to 2010. 95% of total cultivation took place in nine provinces in the Southern and Western regions6, which include the mostinsecure provinces in the country. This confirms the link between insecurity and opiumcultivation observed since 2007.
The number of poppy-free provinces decreased from 20 in 2010 to 17 in 2011 as Baghlanand Faryab provinces in the Northern region and Kapisa province in the Eastern regionlost their poppy-free status.
Potential opium production in 2011 was estimated at 5,800 mt, a 61% increase comparedto 2010, when opium yields were much reduced due to plant diseases.
Figure 1: Opium cultivation in Afghanistan (ha), 1994-2011
7 1 , 0 0 0
5 4 , 0 0 0
5 7 , 0 0 0
5 8 , 0 0 0
6 4 , 0 0 0
9 1 , 0 0 0
8 2 , 0 0 0
8 , 0 0 0
7 4 , 0 0 0
8 0 , 0 0 0
1 3 1 , 0 0 0
1 0 4 , 0 0 0
1 6 5 , 0 0 0
1 9 3 , 0 0 0
1 5 7 , 0 0 0
1 2 3 , 0 0 0
1 2 3 , 0 0 0
1 3 1 , 0 0 0
0
25,000
50,000
75,000
100,000
125,000
150,000
175,000
200,000
1994 1995 1996 1997 1998 1999 2000 2001 2002 2003 2004 2005 2006 2007 2008 2009 2010 2011
H e c t a r e s
Source: UNODC (1994-2002), MCN/UNODC (since 2003). The high-low lines represent the upper and
lower bounds of the 95% confidence interval.
6 Regions as designated by UNODC for analytical purposes. Please refer to Table 1 for a full list.

8/3/2019 Afghan Opium Survey 2011
http://slidepdf.com/reader/full/afghan-opium-survey-2011 6/30
3
Table 1: Opium cultivation (2006-2011) and eradication (2010-2011) in Afghanistan
PROVINCECultivation
2006 (ha)
Cultivation
2007 (ha)
Cultivation
2008 (ha)
Cultivation
2009 (ha)
Cultivation
2010 (ha)
Cultivation
2011 (ha)
Change
2010-2011
(%)
Eradicatio
n in 2010
(ha)
Eradicatio
n in 2011
(ha)
Kabul 80 500 310 132 152 220 +45% 0.48 80
Khost 133 Poppy-free Poppy-free Poppy-free Poppy-free Poppy-free NA 0 0
Logar Poppy-free Poppy-free Poppy-fr ee Poppy-free Poppy-free Poppy-free NA 0 0
Paktya Poppy-free Poppy-free Poppy-fr ee Poppy-free Poppy-free Poppy-free NA 0 0
Panjshir Poppy-free Poppy-free Poppy-fr ee Poppy-free Poppy-free Poppy-free NA 0 0
Parwan 124 Poppy-free Poppy-free Poppy-free Poppy-free Poppy-free NA 0 0
Wardak Poppy-free Poppy-free Poppy-fr ee Poppy-free Poppy-free Poppy-free NA 0 0
Ghazni Poppy-free Poppy-free Poppy-fr ee Poppy-free Poppy-free Poppy-free NA 0 0
Paktika Poppy-free Poppy-free Poppy-fr ee Poppy-free Poppy-free Poppy-free NA 0 0
Central Region 337 500 310 132 152 220 45% 0.48 80
Kapisa 282 835 436 Poppy-free Poppy-free 181 NA 1 5
Kunar 932 446 290 164 154 578 +275% 0 1
Laghman 710 561 425 135 234 624 +166% 10 21
Nangarhar 4,872 18,739 Poppy-free 294 719 2,700 +276% 16 61
Nuristan 1,516 Poppy-free Poppy-free Poppy-free Poppy-free Poppy-free NA 0 0
Eastern Region 8,312 20,581 1,151 593 1,107 4,082 269% 27 89
Badakhshan 13,056 3,642 200 557 1,100 1,705 +55% 302 367
Takhar 2,178 1,211 Poppy-free Poppy-free Poppy-free Poppy-free NA 12 0
Kunduz 102 Poppy-free Poppy-free Poppy-free Poppy-free Poppy-free NA 0 0
North-eastern
Region15,336 4,853 200 557 1,100 1,705 55% 314 367
Baghlan 2,742 671 475 Poppy-free Poppy-free 161 NA 0 31
Balkh 7,232 Poppy-free Poppy-free Poppy-free Poppy-free Poppy-free NA 0 0
Bamyan 17 Poppy-free Poppy-free Poppy-free Poppy-free Poppy-free NA 0 0
Faryab 3,040 2,866 291 Poppy-free Poppy-free 145 NA 0 2
Jawzjan 2,024 1,085 Poppy-free Poppy-free Poppy-free Poppy-free NA 0 0
Samangan 1,960 Poppy-free Poppy-free Poppy-free Poppy-free Poppy-free NA 0 0
Sari Pul 2,252 260 Poppy-free Poppy-free Poppy-free Poppy-free NA 0 0
Northern Region 19,267 4,882 766 Poppy-free Poppy-free 305 NA 0 34
Hilmand 69,324 102,770 103,590 69,833 65,045 63,307 -3% 1,602 1,940
Kandahar 12,619 16,615 14,623 19,811 25,835 27,213 +5% 0 287
Uruzgan 9,703 9,204 9,939 9,224 7,337 10,620 +45% 15 154
Zabul 3,210 1,611 2,335 1,144 483 262 -46% 0 85
Day Kundi 7,044 3,346 2,273 3,002 1,547 1,003 -35% 0 235
Southern Region 101,900 133,546 132,760 103,014 100,247 102,405 2% 1,617 2,701
Badghis 3,205 4,219 587 5,411 2,958 1,990 -33% 0 36
Farah 7,694 14,865 15,010 12,405 14,552 17,499 +20% 198 212
Ghor 4,679 1,503 Poppy-free Poppy-free Poppy-free Poppy-free NA 0 43
Hirat 2,287 1,525 266 556 360 366 +2% 159 227
Nimroz 1,955 6,507 6,203 428 2,039 2,493 +22% 0 20
Western Region 19,820 28,619 22,066 18,800 19,909 22,348 12% 357 539Total (rounded) 165,000 193,000 157,000 123,000 123,000 131,000 7% 2,316 3,810
A province is defined as poppy-free when it is estimated to have less then 100 ha of opium cultivation. Dueto administrative boundary changes, estimates for Farah and Nimroz for 2009 and later were calculated considering parts of Khash Rod district, the main opium cultivating district in Nimroz, as being in Farah
province. Figures for 2008 and before include all of Khash Rod district in Nimroz province. Source: MCN/UNODC.
Opium cultivation in 2011 increased by 7%
There was slight increase in the level of opium cultivation between 2010 and 2011 asopium cultivation was estimated at 131,000 ha in 2011.

8/3/2019 Afghan Opium Survey 2011
http://slidepdf.com/reader/full/afghan-opium-survey-2011 7/30
4
95% of the opium cultivation remained concentrated in the Southern and Westernregions. Within these regions significant changes occurred. Cultivation decreased in someof the main opium poppy growing provinces (Badghis, Day Kundi, Zabul) and increased
in others (Farah, Kandahar, Nimroz, Uruzgan). Opium cultivation in Hilmand and Hiratprovinces remained stable with a small, statistically not significant decrease of 3% and2% respectively. The Northern region lost its poppy free status which it had reached in2009. Starting from a low level, increases also occurred in the Eastern region whereopium cultivation increased significantly in Kunar, Laghman and Nangarhar provinces.The increase in this region was very large in percentage terms (+269%) but small inabsolute terms, as the Eastern region contributed only 1% to the national total in 2011.
In Hilmand, opium cultivation decreased by 3% but it remained the largest opiumcultivating province. Diverging trends were observed within the province. The centralpart of Hilmand (Marja, Lashkar Gah, Nawa-i-Barukzayi and Garm Ser districts)
witnessed massive reduction in opium cultivation in 2011 mainly due to theimplementation of comprehensive counter narcotics strategies by the Ministry of CounterNarcotics and the Governor of Hilmand province. The district of Marja, which is locatedsouth of Nad Ali district, had substantial opium cultivation in the past, but only negligiblecultivation in 2011. Similarly, the northern part of Garm Ser district experienced a strongdecline in opium cultivation. The strong reduction in the opium cultivation in centralHilmand was partly compensated by an increase in cultivation in the northern andsouthern parts of the province.
By and large, the regional divide of opium cultivation between the South and rest of thecountry continued to exist in 2011. Most of the opium cultivation remained confined tosouthern and south-western provinces, which are dominated by insurgency and organized
criminal networks.

8/3/2019 Afghan Opium Survey 2011
http://slidepdf.com/reader/full/afghan-opium-survey-2011 8/30
5
H i r a t
F a r a h
N i m r o z
H i l m a n d
Z a b u l
K a n d a h a r
P a k t i k a
G h a z n i
U r u z g a n
G h o r
B a d g h i s
F a r y a b
J a w z j a n
S a r i P u l
B a l k h S
a m a n g a n
K u n d u z
T a k h a r
B a d a k h s h a n
N
u r i s t a n
K u n a r
L a g h m a
n
K a p i s a
P a r w a n
B a g h l a n
B a m y a n
W a r d a k
L o g a r
P a k t y a K h o s t N
a n
g a r h a r
P a n j s h i r
D a y K u n d i
K a b u l
7 5 ° E
7 5 ° E
7 0 ° E
7 0 ° E
6 5 ° E
6 5 ° E
3 5 ° N
3 5 ° N
3 0 ° N
3 0 ° N
O p i u m c u l t i v a t i o n i n
A f g h a n i s t a n , 2 0 0 9 - 2 0 1 1
T U R K M E N I S T A N
I R A N
P A K I S T A N
T A J I K I S T A N
U
Z B E K I S T A N
S o u r c e : G o v e r n m e n t o f A f g h a n i s t a n - N a t i o n
a l m o n i t o r i n g s y s t e m i m p l e m e n t e d b y U N O D C
N o t e : T h e b o u n d a r i e s a n d n a m e s s h o w n a n d t h e d e s i g n a t i o n s u s e d o n t h i s m a p d o n o t i m p l y o f f i c i a l e n d o r s
e m e n t o r a c c e p t a n c e b y t h e U n i t e d N a t i o n s .
C u l t i v a t i o n Y e a r
2 0 0 9
2 0 1 0
2 0 1 1
P r o v i n c i a l b o u n d a r y
I n t e r n a t i o n a l b o u n d a r y
G e o g r a p
h i c p r o j e c t i o n : W G S 8 4
¯
0
1 0 0
2 0 0
5 0
k m
6 3 3 0 7
2 4 9 3
1 0 6 2 0
1 7 4 9 9
2 7 2 1 3
3 6 6
1 0 0 3
2 7 0 0
1 9 9 0
1 4 5
1 6 1
1 7 0 5
2 6 2
6 2 4
2 2 0
5 7 8
1 8 1

8/3/2019 Afghan Opium Survey 2011
http://slidepdf.com/reader/full/afghan-opium-survey-2011 9/30
6
H i r a t
F a r a h
G h o r
H i l m a n d
N i m r o z
K a n d a h a r
B a d a k h s h a n
B a l k h
G h a z n i
Z a b u l
F a r y a b
P a k t i k a
B a d g h i s
B a g h l a n
B a m y a n
S a r i P u l
T a k h a r
D a y K u n d
i
J a w z j a n
U r u z g a n
W a r d a k
N u r i s t a n
K u n d u z
S a m a n g a n
K u n a r
L o g a r
P a k t y a
K a b u l
P a r w a n
K h o s t N
a n g
a r h a r
P a n j s h i r L
a g h m a n
K a p i s a
7 5 ° E
7 5 ° E
7 0 ° E
7 0 ° E
6 5 ° E
6 5 ° E
3 5 ° N
3 5 ° N
3 0 ° N
3 0 ° N
T U R K M
E N I S T A N
I R A N
P A K I S T A N
T A J I K I S T A N
U
Z B E K I S T A N
0
2 0 0
1 0 0
S o u r c e : G o v e r n m e n t o f A f g h a n i s t a n - N a t i o n a l m o n i t o r i n g s y s t e m i m p l e m e n t e d b y U N O D C
N o t e : T h e b o u n d a r i e s a n d n a m e s s h o w n a
n d t h e d e s i g n a t i o n s u s e d o n t h i s m a p d o n o t i m p l y o f f i c i a l e n d
o r s e m e n t o r a c c e p t a n c e b y t h e U n i t e d N a t i o n s .
G e o g r a p h i c p
r o j e c t i o n : W G S 8 4
¯
k m
5 0
O p i u m c u l t i v a t i o n i n
A f g h a n i s t a n , 2 0 1 1 ( a t p r o v i n
c e l e v e l )
L e g e n d
O p i u m
c u l t i v a t i o n ( h a )
I n t e r n a t i o n a l
b o u n d a r y
P o p p y f r e e
L e s s t h a n 1 0 0 0
1 0 0 0 - 1 0 0 0 0
h a
1 0 0 0 0 - 3 0 0 0 0 h a
M o r e t h a n 3 0 0 0 0 h a
P r o v i n c i a l b o
u n d a r y
8/3/2019 Afghan Opium Survey 2011
http://slidepdf.com/reader/full/afghan-opium-survey-2011 10/30
7
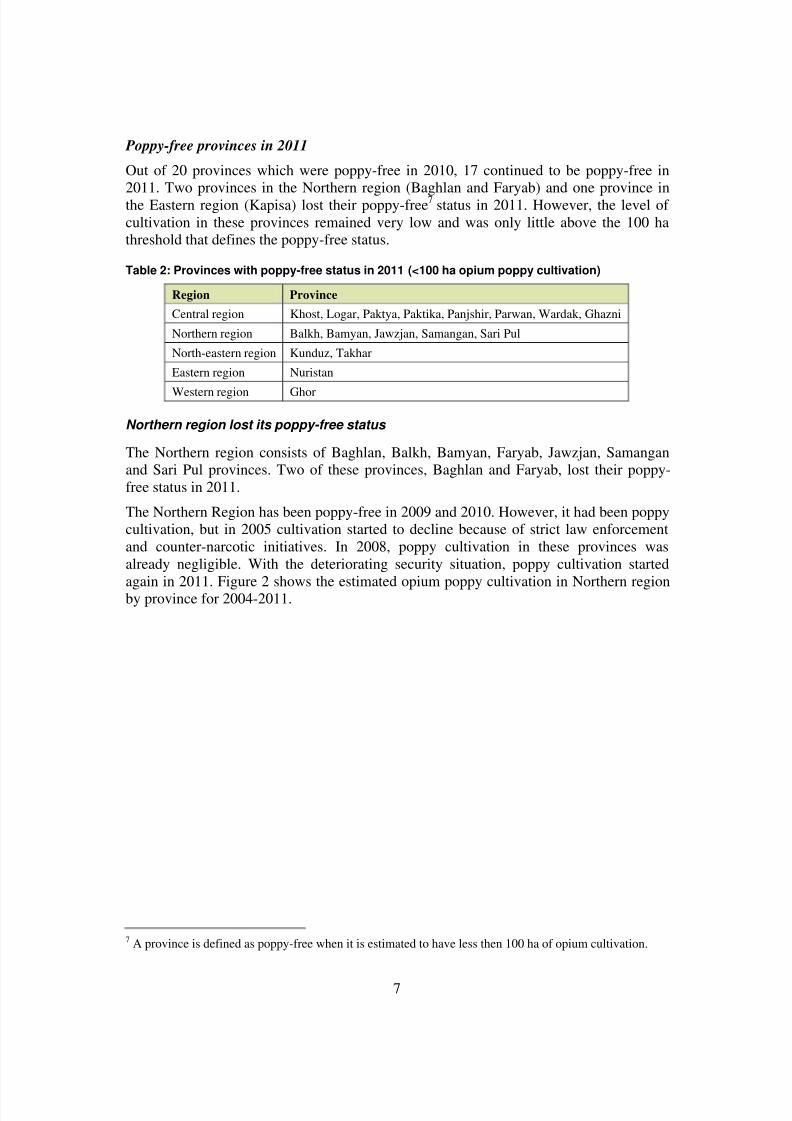
Poppy-free provinces in 2011
Out of 20 provinces which were poppy-free in 2010, 17 continued to be poppy-free in
2011. Two provinces in the Northern region (Baghlan and Faryab) and one province inthe Eastern region (Kapisa) lost their poppy-free7 status in 2011. However, the level of cultivation in these provinces remained very low and was only little above the 100 hathreshold that defines the poppy-free status.
Table 2: Provinces with poppy-free status in 2011 (<100 ha opium poppy cultivation)
Region Province
Central region Khost, Logar, Paktya, Paktika, Panjshir, Parwan, Wardak, Ghazni
Northern region Balkh, Bamyan, Jawzjan, Samangan, Sari Pul
North-eastern region Kunduz, Takhar
Eastern region Nuristan
Western region Ghor
Northern region lost its poppy-free status
The Northern region consists of Baghlan, Balkh, Bamyan, Faryab, Jawzjan, Samanganand Sari Pul provinces. Two of these provinces, Baghlan and Faryab, lost their poppy-free status in 2011.
The Northern Region has been poppy-free in 2009 and 2010. However, it had been poppycultivation, but in 2005 cultivation started to decline because of strict law enforcementand counter-narcotic initiatives. In 2008, poppy cultivation in these provinces wasalready negligible. With the deteriorating security situation, poppy cultivation started
again in 2011. Figure 2 shows the estimated opium poppy cultivation in Northern regionby province for 2004-2011.
7 A province is defined as poppy-free when it is estimated to have less then 100 ha of opium cultivation.

8/3/2019 Afghan Opium Survey 2011
http://slidepdf.com/reader/full/afghan-opium-survey-2011 11/30
8
Figure 2: Opium poppy cultivation in the Northern region by province (ha), 2004-2011
0
2,000
4,000
6,000
8,000
10,000
12,000
H e c t a r e s
20042,444 2,495 803 3,249 1,673 1,151 1,974
2005 2,563 10,837 126 2,665 1,748 3,874 3,227
2006 2,742 7,232 17 3,040 2,024 1,960 2,252
2007 671 poppy-free poppy-free 2,866 1,085 poppy-free 260
2008 475 poppy-free poppy-free 291 poppy-free poppy-free poppy-free
2009 poppy-free poppy-free poppy-free poppy-free poppy-free poppy-free poppy-free
2010 poppy-free poppy-free poppy-free poppy-free poppy-free poppy-free poppy-free
2011 161 poppy-free poppy-free 145 poppy-free poppy-free poppy-free
Baghlan Balkh Bamyan Faryab Jawzjan Samangan Sari Pul
Badakhshan remained the only opium poppy cultivating province in the North-easternregion
In the North-eastern region, Kunduz province has been poppy-free since 2007 and Takharprovince since 2008. In 2009, 2010 and 2011 Badakhshan, where in 2011 73% of opiumpoppy cultivation happened in rain-fed areas, remained the only opium cultivatingprovince in this region. Compared to cultivating provinces in the South and West, the2011 opium poppy cultivation in Badakhshan remained low at 1,705 ha, although thisrepresents a large increase (55%) from 2010. The increase happened despite theeradication of 367 ha.

8/3/2019 Afghan Opium Survey 2011
http://slidepdf.com/reader/full/afghan-opium-survey-2011 12/30
9
Figure 3: Opium poppy cultivation in Badakhshan province (ha), 2004-2011
0
2,000
4,000
6,000
8,000
10,000
12,000
14,000
16,000
H e c t a r e s
Badakhshan 15,607 7,369 13,056 3,642 200 557 1,100 1,705
2004 2005 2006 2007 2008 2009 2010 2011
Opium cultivation continued to increase in Nangarhar
Nangarhar province became poppy-free for the first time in 2008. Since 2009 opiumpoppy levels increased again. In 2010 and 2011, opium cultivation continued to increaseand reached 719 ha and 2,700 ha respectively. Considering that Nangarhar wastraditionally a large opium growing province, the area estimated in 2011 is comparativelymoderate, despite a relative increase of 276% when compared to 2010. Due to strongresistance by AGE against eradication in 2010 and 2011, only 16 ha and 61 ha of opiumpoppy cultivation could be eradicated in Nangarhar province respectively.
Figure 4: Opium cultivation in Nangarhar province (ha), 2004-2011
0
5,000
10,000
15,000
20,000
25,000
30,000
H e c
t a r e s
Nangarhar 28,213 1,093 4,871 18,739 poppy-free 294 719 2700
2004 2005 2006 2007 2008 2009 2010 2011

8/3/2019 Afghan Opium Survey 2011
http://slidepdf.com/reader/full/afghan-opium-survey-2011 13/30
10
Before 2008, the estimated levels of opium cultivation in Nangarhar province wereerratic. In 2004, cultivation was at 28,213 ha, the following year it dropped drastically to1,093 ha and was confined to remote parts of the province. In 2006, it increased again to
4,872 ha and in 2007 further increased to 18,739, before becoming poppy free in 2008.
Kapisa, Kunar and Laghman
Kapisa province in the Eastern region, maintained its low level opium cultivation from2005 till 2008. In 2009, Kapisa became poppy-free and remained so in 2010 as well.However, in 2011, Kapisa lost the poppy-free status with (181 ha) of opium cultivation.
In 2010, Kunar province in the Eastern region was very close to be poppy-free withnegligible amounts of cultivation (154 ha). In 2011, there was a significant increase(275%) in the level of opium cultivation (578 ha) in Kunar province. In Laghmanprovince, opium cultivation also increased significantly, from 234 ha in 2010 to 624 ha in
2011.
Farah remains the main opium cultivating province in the Western region
Trends in opium cultivation levels in Farah province have often been irregular. In 2008 itreached its highest cultivation level (15,010 ha). In 2009, there was a 17% decrease whilein 2010, opium cultivation increased by 17%, reaching almost the same level of 2008. In2011, there was further increase of 20% in opium cultivation (17,499 ha). Farah is themost insecure province in the Western region. In 2011, Nimroz became the secondlargest opium cultivating province in region.
Figure 5: Opium cultivation in Farah and Nimroz provinces (ha), 2004-2011
0
2,000
4,000
6,000
8,000
10,000
12,000
14,000
16,000
18,000
H e c t a r e s
Farah 2,289 10,240 7,694 14,865 15,010 12,405 14,552 17,499
Nimroz 115 1,690 1,956 6,507 6,203 428 2,039 2,493
2004 2005 2006 2007 2008 2009 2010 2011
Note: Due to administrative boundary changes, estimates for Farah and Nimroz for 2009 and later werecalculated considering parts of Khash Rod district, the main opium cultivating district in Nimroz, as beingin Farah province. Figures for 2008 and before include all of Khash Rod district in Nimroz province.

8/3/2019 Afghan Opium Survey 2011
http://slidepdf.com/reader/full/afghan-opium-survey-2011 14/30
11
Badghis poppy cultivation decreased and remained stable in Hirat
Opium cultivation level in Badghis province rose steadily between 2004 – 2009 with the
exception of 2008 when a drought and the total failure of rain-fed crops contributed to thedrop in opium cultivation. In 2010, opium cultivation decreased by 45% to 2,958 ha. In2009, good rainfall had resulted in extensive cultivation in rain-fed areas. This hadcontributed to a strong increase in opium cultivation from only 587 ha in 2008 to 5,411ha in 2009, most of which was in areas difficult to access. In 2011, there was a furtherdecrease (33%) in opium cultivation (1,990 ha) in Badghis province.
Opium cultivating levels in Hirat province continued to be comparatively low with 366ha in 2011, practically the same amount as the year before (360 ha).
Figure 6: Opium cultivation in Badghis province (ha), 2004-2011
0
1,000
2,000
3,000
4,000
5,000
6,000
H e c t a r e s
Badghis 614 2,967 3,206 4,219 587 5411 2,958 1,990
2004 2005 2006 2007 2008 2009 2010 2011
Opium cultivation in Hilmand decreased by 3%
In 2011, 78% of the Afghan opium cultivation was concentrated in the Southern region.Opium cultivation in Hilmand went down by 1,738 ha or 3% compared to 2010, adecrease which is statistically not significant. Hilmand remained the largest opium
cultivating province with 63,307 ha (48% of total opium cultivation in Afghanistan).Kandahar province, Hilmand’s neighbour to the east, experienced an opposite trend.Here, opium cultivation has been increasing since 2007. In 2010, opium cultivation inKandahar reached almost 26,000 ha, representing 21% of national cultivation. In 2011,opium cultivation in Kandahar province increased by 5% reaching 27,213 ha. Kandaharcontinues to be the second largest opium cultivating province after Hilmand.
Uruzgan province shows the strongest increase in this region from 7,337 ha in 2010 to10,620 ha in 2011 (45%), and remains the third largest opium cultivating province in theSouthern region.

8/3/2019 Afghan Opium Survey 2011
http://slidepdf.com/reader/full/afghan-opium-survey-2011 15/30
12
Figure 7: Opium cultivation in Hilmand, Kandahar and Uruzgan provinces (ha), 2005-2011
0
20,000
40,000
60,000
80,000
100,000
120,000
H e c t a r e s
Hilmand 26,500 69,323 102,770 103,590 69,833 65,045 63,307
Kandahar 12,989 12,619 16,615 14,623 19,811 25,835 27,213
Uruzgan 2,024 9,703 9,204 9,939 9,224 7,337 10,620
2005 2006 2007 2008 2009 2010 2011
Table 3: Regional distribution of opium cultivation (ha), 2010-2011
Region 2010 (ha) 2011 (ha)Change
2010-2011
(%)
2010 (ha) as% of total
2011 (ha) as% of total
Southern 100,247 102,405 2% 82% 78%
Western 19,909 22,348 12% 16% 17%
Eastern 1,107 4,082 269% 0.9% 3%
North-eastern 1,100 1,705 55% 0.9% 1%
Central 152 220 45% 0.1% 0.2%
Northern Poppy free 305 NA NA 0.2%
Rounded Total 123,000 131,000 7% 100% 100%

8/3/2019 Afghan Opium Survey 2011
http://slidepdf.com/reader/full/afghan-opium-survey-2011 16/30
13
Table 4: Main opium cultivating provinces in Afghanistan (ha), 2007-2011
Province 2007 2008 2009 2010 2011Change
2010-2011
Hilmand 102,770 103,590 69,833 65,045 63,307 -3%
Kandahar 16,615 14,623 19,811 25,835 27,213 +5%
Farah 14,865 15,010 12,405 14,552 17,499 +20%
Uruzgan 9,204 9,939 9,224 7,337 10,620 +45%
Nangarhar 18,739 Poppy- free 294 719 2,700 +276%
Badakhshan 3,642 200 557 1,100 1,705 +55%
Badghis 4,219 587 5,411 2,958 1,990 -33%
Day Kundi 3,346 2,273 3,002 1,547 1,003 -35%Nimroz 6,507 6,203 428 2,039 2,493 +22%
Rest of the country 13,074 4,828 2,131 1,383 2,535 +83%
Rounded Total 193,000 157,000 123,000 123,000 131,000 7%
Potential opium production increased in 2011 but remained lower than in 2009
In 2011, the estimated potential opium production amounted to 5,800 mt, an increase by61% over 2010. As opium cultivation remained relatively stable between 2009 and 2011,the differences in opium production in those years were due to changes in per-hectareopium yield. 2009 was a year with high opium yields (56.1 kg/ha), while in 2010, majoropium cultivation areas were affected by plant diseases, which led to a strong yieldreduction (29.2 kg/ha). In 2011, opium yields were back to “normal” levels of 44.5 kg/ha.
In 2011, the Southern region continued to produce most opium in Afghanistan,representing 85% of national production, followed by the Western region (12%).

8/3/2019 Afghan Opium Survey 2011
http://slidepdf.com/reader/full/afghan-opium-survey-2011 17/30
14
Figure 8: Potential opium production in Afghanistan (mt), 1994-2011
3 ,4 1 6
2 , 3 3 5
2 ,2 4 8
2 , 8 0 4
2 , 6 9 3
4 , 5 6 5
3 ,2 7 8
3 ,4 0 0
3 , 6 0 0
4 ,2 0 0
4 ,1 0 0
6 ,1 0 0
8 ,2 0 0
7 ,7 0 0
6 , 9 0 0
3 , 6 0 0
5 , 8 0 0
1 8 5
0
1,000
2,000
3,000
4,000
5,000
6,000
7,000
8,000
1994 1995 1996 1997 1998 1999 2000 2001 2002 2003 2004 2005 2006 2007 2008 2009 2010 2011
m t
Note: The high-low bars indicate the upper and lower bounds of the estimation range.
Table 5: Potential opium production by region (mt), 2010-2011
RegionProduction2010 (mt)
Production2011 (mt)
Change 2010-2011 (%)
Central Region 8 9 +13%
Eastern Region 56 166 +196%
North-eastern Region 56 39 -30%
Northern Region Poppy-free 12 NA
Southern Region 2,979 4,924 +65%
Western Region 478 685 +43%
Total (rounded) 3,600 5,800 +61%

8/3/2019 Afghan Opium Survey 2011
http://slidepdf.com/reader/full/afghan-opium-survey-2011 18/30
15
Eradication in 2011 was 65% more than 2010
A total of 3,810 ha of Governor-led eradication (GLE) was verified by MCN/UNODC.GLE was carried out in 18 provinces. The final figures of eradication in Badakhshan,Farah, Hilmand, Hirat, Kabul, Kandahar and Uruzgan provinces were adjusted afterverification by using satellite images.
Table 6: Eradication and opium cultivation in Afghanistan (ha) 2005-2011
Year 2005 2006 2007 2008 2009 2010 2011
Governor-led Eradication (GLE) (ha) 4,000 13,050 15,898 4,306 2,687 2,316 3,810
Poppy Eradication Force (PEF) (ha)* 210 2,250 3,149 1,174 2,663 ** **
Total (ha) 4,210 15,300 19,510 5,480 5,351 2,316 3,810
Cultivation (ha) ** 104,000 165,000 193,000 157,000 123,000 123,000 131,000% poppy in insecure provinces of South and West
56% 68% 80% 98% 99% 95% 95%
Poppy-free provinces 8 6 13 18 20 20 17
Number of provinces with eradication 11 19 26 17 12 11 18
* The activities of the Poppy Eradication Force (PEF) were discontinued after 2009.
** Net opium cultivation after eradication
Comparing the 2010 and 2011 eradication campaigns, the following can be noted:
Total eradication in 2011 was 65% higher than in 2010. In 2011, total eradicationwas 3,810 hectare in 18 provinces compared to 2,316 hectare in 11 provinces in2010.
Eradication campaign took place in more provinces compared to 2010. In 2011, aneradication campaign was carried out in 18 provinces compared to 11 provinces in2010.
In 2011, the eradication campaign started in mid-February and at the end of Februaryin Kandahar and Hilmand provinces respectively. In 2010, the eradication campaignhad started in mid-February in Hilmand whereas in Kandahar there was noeradication at all.
Eradication campaigns in 2011 were mostly undertaken in the Southern, Western, andNorth-eastern regions while there was less eradication in the Eastern and Northernregions this year compared to last year.
In 2011, the number of security incidents was higher than the year 2010. GLE teamswere attacked 48 times in 2011 while there were only 12 attacks on GLE in 2010.However, in 2011 the number of fatalities is less than 2010. This year 20 eradicationcampaign related fatalities were reported against 28 in 2010.

8/3/2019 Afghan Opium Survey 2011
http://slidepdf.com/reader/full/afghan-opium-survey-2011 19/30

8/3/2019 Afghan Opium Survey 2011
http://slidepdf.com/reader/full/afghan-opium-survey-2011 20/30
17
Figure 10: Eradication comparison by province in 2010 and 2011
3 0 2
- - -
1 9 8
- -
1 , 6
0 2
1 5 9
0 - 1 - 1 0
1 6
0 1 2
1 5
-
3 6 7
3 6
3 1
2 3 5
2 1 2
24
3
1 , 9
4 0
2 2 7
8 0
2 8 7
5 1 2 1 6
1
2 0
-
1 5 4
8 5
0
200
400
600
800
1,000
1,200
1,400
1,600
1,800
2,000
B a
d a k h s h a n
B a d g h i s
B a g h l a n
D a y K u n d i
F a r a h
F a r y a b
G h o r
H i l m a n d
H i r a t
K a b u l
K a n d a h a r
K a p i s a
K u n a r
L a g h m a n
N a n g a r h a r
N i m r o z
T a k h a r
U r u z g a n
Z a b u l
E r a d i c a t i o n i n h a
2010 2011

8/3/2019 Afghan Opium Survey 2011
http://slidepdf.com/reader/full/afghan-opium-survey-2011 21/30
18
I R A N
I R A N
P A K
I S T A N
P A K I S T A N
I N D I A
I N D I A
T U R K
M E N I S T A N
T U R K M E N I S T A N
T A J I K I S T A N
T A J I K I S T A N
U
Z B E K I S T A N
U
Z B E K I S T A N
H i r a t
F
a r a h
G h o r
H i l m a n d
N i m r o z
K a n d a h a r
B
a d a k h s h a n
G h a z n i
B a l k h
Z
a b u l
F a r y a b
B a g h l a n
B a d g h i s
P a k t i k a
S a r i P u l
D a y k u n d i
T a k h a r
B a m y a n
J a w z j a n
U r u z g a n
W a r d a k
N u
r i s t a n
K u n d u z
S a m a n g a n
K u n a r
K a b u l
N a n
g a r h a r
L o g a r
K h o s t
P a k t y a
P a r w a n
P a n j s h e r
L a g h m a n
K a p i s a
G a r m S e r
G u l r a n
S h i n d a n d
R e g - i - K h a n N i s h i n
N a d A l i
P a n j w a y e e
S h a h r a k
K h a s h R o
d
T u l a k
N o w z a d
B a l a B u l u k
K i t i
M a i w a n d
K a j r a n
J u r m
A r g o
G u r z i w a n
C h a g h c h a r a n ( P r o v i n c i a l C e n t e r )
S h a h W a l i K o t
S u r u b i
M u q u r
M u s a Q a l a
N a w a - i - B a r u k z a i
A r g h a n d a b
F a r a h ( P r o v i n c i a l C e n t e r )
K u s h k ( R a b a t - i - S a n g i )
Z h i r e
A l i n
g a r
K i s h i m
N a h e r - i - S a r a j
N i j r a b
T a
s h k a n
N i i z a m - i - S h a h i d ( G u z a r a h )
P u l - i - H i s a r
T a r n a k w a J
a l d a k
A c h i n
A l i s h e n g
Q a l a t ( P r o v i n c i a l C e n t e r )
K h u g y a n i
L a l p o o r
T i r i n K o t ( P r o v i n c i a l C e n t e r )
S h e r z a d
A r g h a n d a b
D e h S a l a h
K h a s h
P u s h t R o d
S a n g i n Q a l a
L a s h k a r g a h ( P r o v i n c i a l C e n t e r )
K a n d a h a r ( P r o v i n c l a l C e n t e r )
S a r K a n i
C h a p a r h a r
K o h B a n d
7 5 ° E
7 5 ° E
7 0 ° E
7 0 ° E
6 5 ° E
6 5 ° E
3 5 ° N
3 5 ° N
3 0 ° N
3 0 ° N
L o c a t i o n s o f G o v e r n o r - l e d
e r a d i c a t i o n
o f p o p p y f i e l d s ,
2 0 1 1
S o u r c e : M C N - U N O D C A f g h a n i s t a n E r a d i c a t i o n S u r v e y 2 0 1 1
N o t e : T h e b o u n d a r i e s a n d n a m e s s h o w n a n d
t h e d e s i g n a t i o n s u s e d o n t h i s m a p d o n o t i m p l y o f f i c i a l e n d o r s e m e n t o r a c c e p t a n c e b y t h e U n i t e d N a t i o n s .
0
1 0 0
2 0 0
5 0
K m
G C S_
W G
S_
8 4
L e g e n d
I n t e r n a t i o n a l b o u n d a r i e
s
P r o v i n c i a l b o u n d a r y
D i s t r i c t b o u n d a r y
V e r i f i e d e r a d i c a t i o n l o c a t i o n ( G L E )
E r a d i c a t i o n T a r g e t A r e a
s
P r o v i n c e s w i t h e r a d i c a t i o n
P r o v i n c e s w i t h o u t e r a d i c a t i o n

8/3/2019 Afghan Opium Survey 2011
http://slidepdf.com/reader/full/afghan-opium-survey-2011 22/30
19
Opium prices continue to be very high
In 2011, opium prices had reached high levels as a result of the unusually low opiumproduction in 2010, when major cultivation areas were affected by plant diseases.
Results from the 2009 opium survey indicated that the low opium price level in that yeardiscouraged farmers from planting opium. However, since then, opium prices havetripled. The high sale price of opium in combination with lower wheat prices may haveencouraged famers to resume opium cultivation. The high level of opium prices in 2011continues to provide a strong incentive to plant opium in the upcoming poppy season.While farmers’ decision-making on whether or not to grow opium poppy is complex, it isobvious that the high level of opium prices in 2010 could have been one of the factorsbehind a resurgence of poppy cultivation in the Northern and Eastern regions.
Figure 9: Opium prices reported by traders in Kandahar and Nangarhar, Mar 1997 - Aug 2011(US$/kg)
0
100
200
300
400
500
600
700
M a r - 9 7
J u n - 9 7
S e p - 9 7
D e c - 9 7
M a r - 9 8
J u n - 9 8
S e p - 9 8
D e c - 9 8
M a r - 9 9
J u n - 9 9
S e p - 9 9
D e c - 9 9
M a r - 0 0
J u n - 0 0
S e p - 0 0
D e c - 0 0
M a r - 0 1
J u n - 0 1
S e p - 0 1
D e c - 0 1
M a r - 0 2
J u n - 0 2
S e p - 0 2
D e c - 0 2
M a r - 0 3
J u n - 0 3
S e p - 0 3
D e c - 0 3
M a r - 0 4
J u n - 0 4
S e p - 0 4
D e c - 0 4
M a r - 0 5
J u n - 0 5
S e p - 0 5
D e c - 0 5
M a r - 0 6
J u n - 0 6
S e p - 0 6
D e c - 0 6
M a r - 0 7
J u n - 0 7
S e p - 0 7
D e c - 0 7
M a r - 0 8
J u n - 0 8
S e p - 0 8
D e c - 0 8
M a r - 0 9
J u n - 0 9
S e p - 0 9
D e c - 0 9
M a r - 1 0
J u n - 1 0
S e p - 1 0
D e c - 1 0
M a r - 1 1
J u n - 1 1
P r i c e i n ( U S $ / k g )
Nangarhar (Eastern region) Kandahar (Southern region) Simple average
Nominal prices converted to US$ at local exchange rate, not adjusted for inflation.
MCN/UNODC has monitored opium prices on a monthly basis in selected provinces of Afghanistan since 1994 (16 provinces as of August 2011). In all regions monthly pricesshowed an overall decreasing trend between 2005 and 2009 and prices differencesbetween regions got smaller. Since about mid-2009, opium prices have started to

8/3/2019 Afghan Opium Survey 2011
http://slidepdf.com/reader/full/afghan-opium-survey-2011 23/30
20
increase, most noticeably in the Eastern, Southern and Western regions. Thisdevelopment was accelerated when opium production in 2010 turned out to be unusuallylow due to the impact of plant diseases. Price differences between regions became more
and more pronounced. In 2011, opium prices started to decrease at around harvest time insome regions, but remained volatile and at a higher level than in any year since 2005.
Figure 10: Dry opium prices reported by traders, by region (US$/kg), January 2005 to August2011
0
50
100
150
200
250
300
350
400
J a n - 0 5
M a r - 0 5
M a y - 0 5
J u l - 0 5
S e p - 0 5
N o v - 0 5
J a n - 0 6
M a r - 0 6
M a y - 0 6
J u l - 0 6
S e p - 0 6
N o v - 0 6
J a n - 0 7
M a r - 0 7
M a y - 0 7
J u l - 0 7
S e p - 0 7
N o v - 0 7
J a n - 0 8
M a r - 0 8
M a y - 0 8
J u l - 0 8
S e p - 0 8
N o v - 0 8
J a n - 0 9
M a r - 0 9
M a y - 0 9
J u l - 0 9
S e p - 0 9
N o v - 0 9
J a n - 1 0
M a r - 1 0
M a y - 1 0
J u l - 1 0
S e p - 1 0
N o v - 1 0
J a n - 1 1
M a r - 1 1
M a y - 1 1
J u l - 1 1
P r i c e i n ( U S
$ / K g )
Eastern Southern Western North-eastern Northern
Table 9: Regional farm-gate prices of dry opium at harvest time (US$/kg), 2010-2011
Region
Average DryOpium Price
(US$/kg) 2010
Average DryOpium Price
(US$/kg) 2011Changeon 2010
Central Region 133 255 +92%
Eastern Region 130 290 +123%
North-eastern Region 91 218 +140%
Northern Region 104 238 +129%
Southern Region 181 232 +28%
Western Region 108 296 +174%
National averageweighted by production*
169 241 +43%
* Prices for the Central region were taken from the annual village survey as there is no monthly opiumprice monitoring in the Central region. Prices for all other regions were derived from the opium pricemonitoring system and refer to the month when opium harvest took actually place in different regions of the country.
8/3/2019 Afghan Opium Survey 2011
http://slidepdf.com/reader/full/afghan-opium-survey-2011 24/30
21
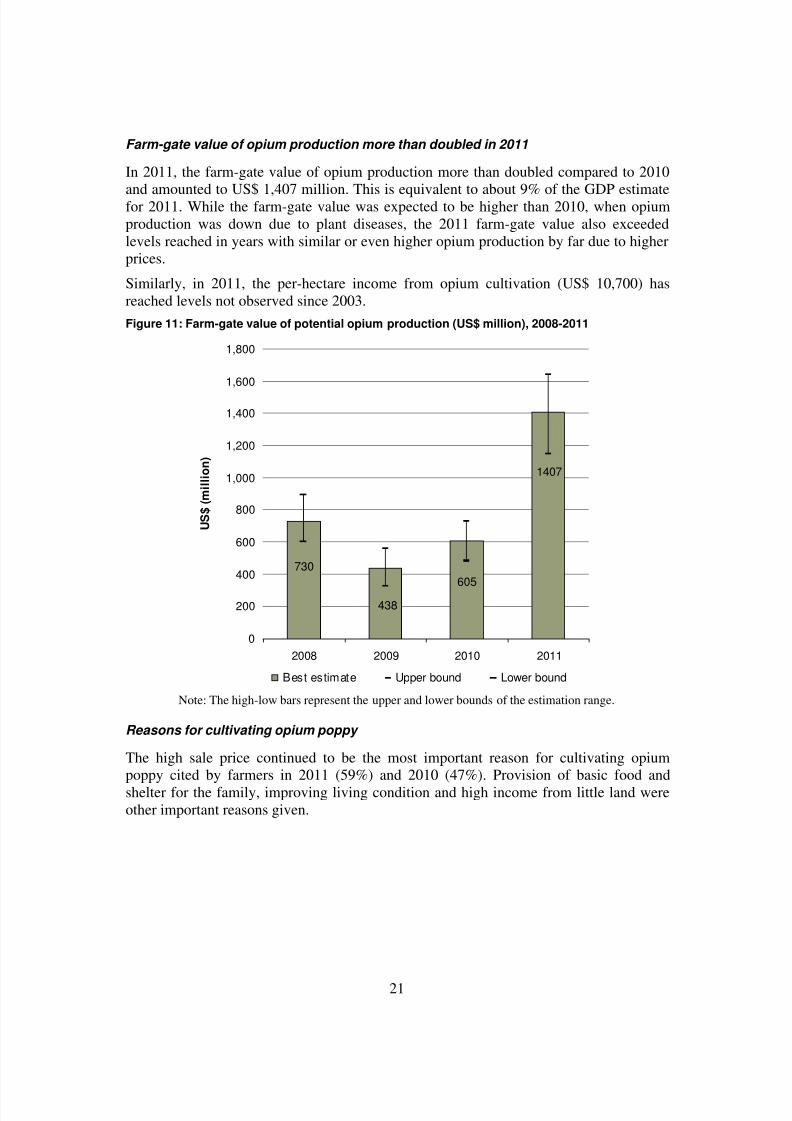
Farm-gate value of opium production more than doubled in 2011
In 2011, the farm-gate value of opium production more than doubled compared to 2010
and amounted to US$ 1,407 million. This is equivalent to about 9% of the GDP estimatefor 2011. While the farm-gate value was expected to be higher than 2010, when opiumproduction was down due to plant diseases, the 2011 farm-gate value also exceededlevels reached in years with similar or even higher opium production by far due to higherprices.
Similarly, in 2011, the per-hectare income from opium cultivation (US$ 10,700) hasreached levels not observed since 2003.
Figure 11: Farm-gate value of potential opium production (US$ million), 2008-2011
1407
730
438
605
0
200
400
600
800
1,000
1,200
1,400
1,600
1,800
2008 2009 2010 2011
U S $ ( m i l l i o n )
Best estimate Upper bound Lower bound
Note: The high-low bars represent the upper and lower bounds of the estimation range.
Reasons for cultivating opium poppy
The high sale price continued to be the most important reason for cultivating opiumpoppy cited by farmers in 2011 (59%) and 2010 (47%). Provision of basic food andshelter for the family, improving living condition and high income from little land wereother important reasons given.
8/3/2019 Afghan Opium Survey 2011
http://slidepdf.com/reader/full/afghan-opium-survey-2011 25/30
22
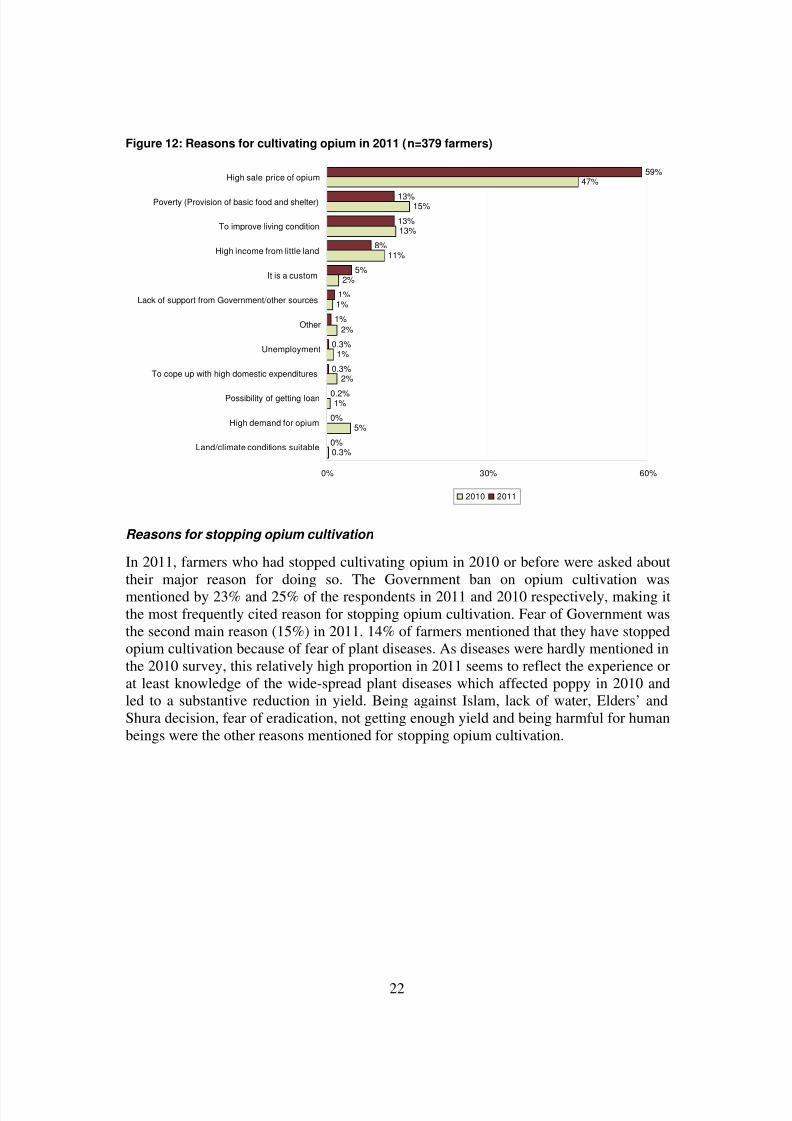
Figure 12: Reasons for cultivating opium in 2011 (n=379 farmers)
0.3%
5%
1%
2%
1%
2%
1%
2%
11%
13%
15%
47%
0%
0%
0.2%
0.3%
0.3%
1%
1%
5%
8%
13%
13%
59%
0% 30% 60%
Land/climate conditions suitable
High demand for opium
Possibility of getting loan
To cope up with high domestic expenditures
Unemployment
Other
Lack of support from Government/other sources
It is a custom
High income from little land
To improve living condition
Poverty (Provision of basic food and shelter)
High sale price of opium
2010 2011
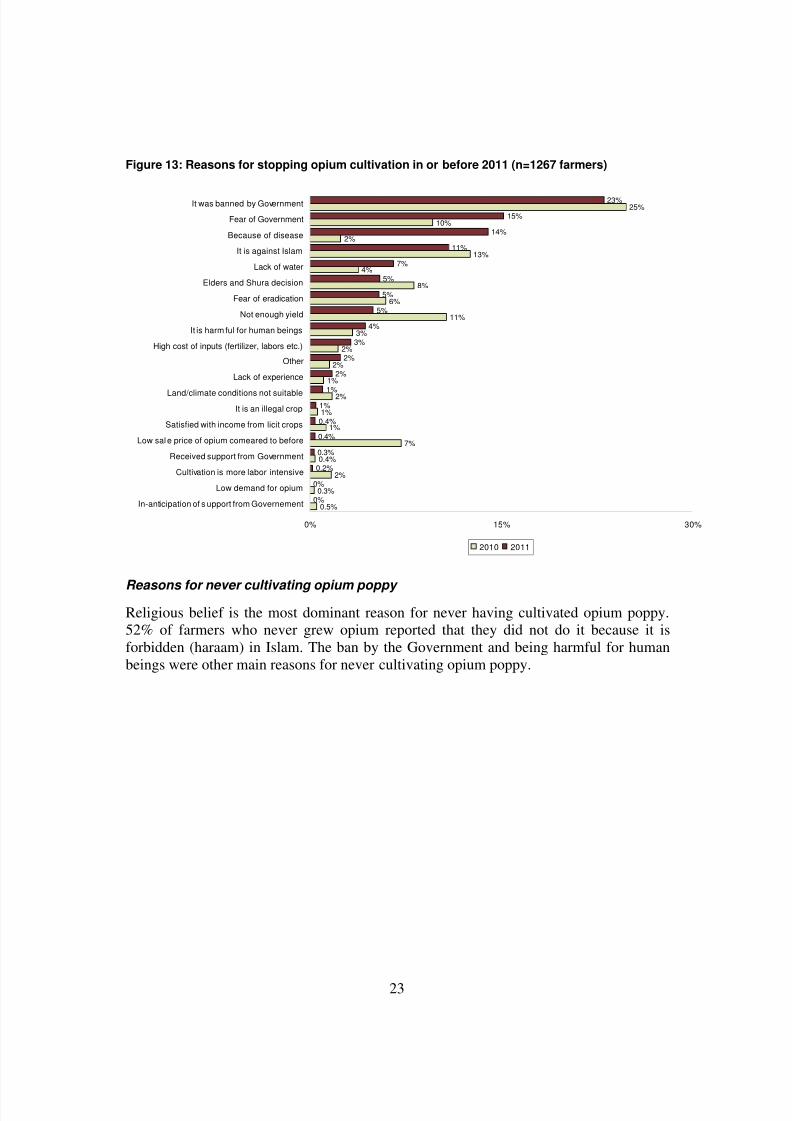
Reasons for stopping opium cultivation
In 2011, farmers who had stopped cultivating opium in 2010 or before were asked about
their major reason for doing so. The Government ban on opium cultivation wasmentioned by 23% and 25% of the respondents in 2011 and 2010 respectively, making itthe most frequently cited reason for stopping opium cultivation. Fear of Government wasthe second main reason (15%) in 2011. 14% of farmers mentioned that they have stoppedopium cultivation because of fear of plant diseases. As diseases were hardly mentioned inthe 2010 survey, this relatively high proportion in 2011 seems to reflect the experience orat least knowledge of the wide-spread plant diseases which affected poppy in 2010 andled to a substantive reduction in yield. Being against Islam, lack of water, Elders’ andShura decision, fear of eradication, not getting enough yield and being harmful for humanbeings were the other reasons mentioned for stopping opium cultivation.
8/3/2019 Afghan Opium Survey 2011
http://slidepdf.com/reader/full/afghan-opium-survey-2011 26/30
23
Figure 13: Reasons for stopping opium cultivation in or before 2011 (n=1267 farmers)
0.5%
0.3%
2%
0.4%
7%
1%
1%
2%
1%
2%
2%
3%
11%
6%
8%
4%
13%
2%
10%
25%
0%
0%
0.2%
0.3%
0.4%
0.4%
1%
1%
2%
2%
3%
4%
5%
5%
5%
7%
11%
14%
15%
23%
0% 15% 30%
In-anticipation of s upport from Governement
Low demand for opium
Cultivation is more labor intensive
Received support from Government
Low sal e price of opium comeared to before
Satisfied with income from licit crops
It is an illegal crop
Land/climate conditions not suitable
Lack of experience
Other
High cost of inputs (fertilizer, labors etc.)
It is harm ful for human beings
Not enough yield
Fear of eradication
Elders and Shura decision
Lack of water
It is against Islam
Because of disease
Fear of Government
It was banned by Government
2010 2011
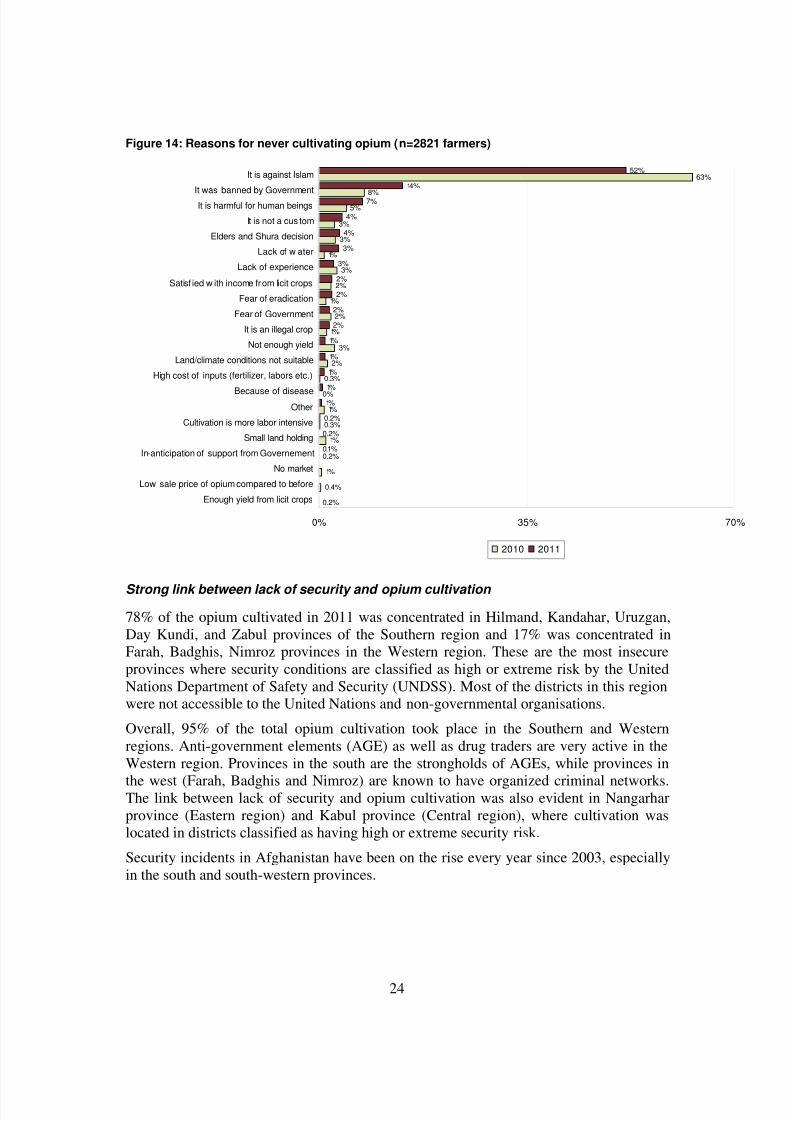
Reasons for never cultivating opium poppy
Religious belief is the most dominant reason for never having cultivated opium poppy.52% of farmers who never grew opium reported that they did not do it because it isforbidden (haraam) in Islam. The ban by the Government and being harmful for humanbeings were other main reasons for never cultivating opium poppy.
8/3/2019 Afghan Opium Survey 2011
http://slidepdf.com/reader/full/afghan-opium-survey-2011 27/30
24
Figure 14: Reasons for never cultivating opium (n=2821 farmers)
0.2%
0.4%
1%
0.2%
1%
0.3%
1%
0%
0.3%
2%
3%
1%
2%
1%
2%
3%
1%
3%
3%
5%
8%
63%
0.1%
0.2%
0.2%
1%
1%
1%
1%
1%
2%
2%
2%
2%
3%
3%
4%
4%
7%
14%
52%
0% 35% 70%
Enough yield from licit crops
Low sale price of opium compared to before
No market
In-anticipation of support from Governement
Small land holding
Cultivation is more labor intensive
Other
Because of disease
High cost of inputs (fertilizer, labors etc.)
Land/climate conditions not suitable
Not enough yield
It is an illegal crop
Fear of Government
Fear of eradication
Satisf ied w ith income from licit crops
Lack of experience
Lack of w ater
Elders and Shura decision
It is not a cus tom
It is harmful for human beingsIt was banned by Government
It is against Islam
2010 2011
Strong link between lack of security and opium cultivation
78% of the opium cultivated in 2011 was concentrated in Hilmand, Kandahar, Uruzgan,Day Kundi, and Zabul provinces of the Southern region and 17% was concentrated inFarah, Badghis, Nimroz provinces in the Western region. These are the most insecureprovinces where security conditions are classified as high or extreme risk by the UnitedNations Department of Safety and Security (UNDSS). Most of the districts in this regionwere not accessible to the United Nations and non-governmental organisations.
Overall, 95% of the total opium cultivation took place in the Southern and Westernregions. Anti-government elements (AGE) as well as drug traders are very active in the
Western region. Provinces in the south are the strongholds of AGEs, while provinces inthe west (Farah, Badghis and Nimroz) are known to have organized criminal networks.The link between lack of security and opium cultivation was also evident in Nangarharprovince (Eastern region) and Kabul province (Central region), where cultivation waslocated in districts classified as having high or extreme security risk.
Security incidents in Afghanistan have been on the rise every year since 2003, especiallyin the south and south-western provinces.

8/3/2019 Afghan Opium Survey 2011
http://slidepdf.com/reader/full/afghan-opium-survey-2011 28/30
25
Figure 15: Number of security incidents by month, January 2003 to March 2011

8/3/2019 Afghan Opium Survey 2011
http://slidepdf.com/reader/full/afghan-opium-survey-2011 29/30
26
8/3/2019 Afghan Opium Survey 2011
http://slidepdf.com/reader/full/afghan-opium-survey-2011 30/30
Vienna International Centre, PO Box 500, 1400 Vienna, Austria Tel.: (+43-1) 26060-0, Fax: (+43-1) 26060-5866, www.unodc.org
Banayee Bus Station, Jalalabad Main Road 9th District, Kabul, Afghanistan Tel.: (+93) 799891851, www.mcn.gov.af
Islamic Republic of Afghanistan
Ministry of Counter Narcotics


