
Activated Sludge Oxidations: V. The Influence of Nutrition in Determining Activated SludgeCharacteristicsAuthor(s): C. N. SawyerSource: Sewage Works Journal, Vol. 12, No. 1 (Jan., 1940), pp. 3-17Published by: Water Environment FederationStable URL: http://www.jstor.org/stable/25028991 .
Accessed: 17/06/2014 18:10
Your use of the JSTOR archive indicates your acceptance of the Terms & Conditions of Use, available at .http://www.jstor.org/page/info/about/policies/terms.jsp
.JSTOR is a not-for-profit service that helps scholars, researchers, and students discover, use, and build upon a wide range ofcontent in a trusted digital archive. We use information technology and tools to increase productivity and facilitate new formsof scholarship. For more information about JSTOR, please contact [email protected].
.
Water Environment Federation is collaborating with JSTOR to digitize, preserve and extend access to SewageWorks Journal.
http://www.jstor.org
This content downloaded from 91.229.229.44 on Tue, 17 Jun 2014 18:10:56 PMAll use subject to JSTOR Terms and Conditions
Sewage Research
ACTIVATED SLUDGE OXIDATIONS
V. THE INFLUENCE OF NUTRITION IN DETERMINING ACTIVATED SLUDGE CHARACTERISTICS
By C. N. Sawyer
Post-Doctorate Fellow, Laboratories of Hydraulic and Sanitary Engineering, University of Wisconsin, Madison, Wisconsin
In the case of activated sludge investigations, as with many other
studies, the center of attack has been from the economic angle. Be
cause of the importance of the cost of supplying large quantities of air
during the course of treatment, the oxygen requirements of the process have received considerable study during the past decade. These stud
ies have resulted in the development of at least five different methods of determining oxygen utilization by activated sludges.
"With the methods available it is possible to make simultaneous studies of the oxygen requirements of activated sludges; and thus it is natural that laboratory investigations of the influence of different food materials on this factor should receive attention.
The reports on the nutrition of activated sludge up to the present have been concerned with what might be termed
" instantaneous ef
fects of the addition of specific food materials." Bloodgood1 has
recently reported on oxygen utilization studies made with activated
sludge when they were fed synthetic sewage, milk, tomato juice, and corn waste. His results showed a close similarity between the type of
oxygen utilization rate curves produced by the synthetic sewage and
those by the milk. The rate curves produced by tomato juice and corn waste were quite alike in character but markedly different from those
given by the two previously mentioned. Although the B.O.D. loading or amount of food imposed upon the activated sludges was of the same
order of magnitude in at least one instance for each food material added, the amount of oxygen and the rate at which it was required
were quite different. Bloodgood's results emphasize the advantages to be obtained in economy of plant operation when the character of in dustrial or trade wastes and their resultant effect on oxygen usage is
known.
The author in a previous publication2 has reported the effect on
oxygen utilization when pure substances representing carbohydrates,
proteins, and fats were added to domestic sewage and fed to activated
sludge from two sources. The influence of these added food materials was found to vary with the kind of activated sludge, depending on whether or not the sludge was capable of oxidizing the nitrogen con
tained in the substrate. This study showed that both th? substrate 3
This content downloaded from 91.229.229.44 on Tue, 17 Jun 2014 18:10:56 PMAll use subject to JSTOR Terms and Conditions
4 SEWAGE WOBKS JOURNAL Jan., 1940
and the sludge were factors in determining the quantity of air required to satisfy a given B.O.D. load and showed how the air could best be
supplied to meet the changing demands with time. In a comparison of oxygen utilization rate curves, produced by ac
tivated sludges and sewages obtained from four separate sources,
Sawyer and Nichols 3 have found the curves produced by the different
sludges to be of at least two distinct types. In an attempt to determine some of the factors, important in producing these sludge variations, the
work reported in this paper was undertaken.
Experimental Methods
Feeding experiments were conducted in the laboratory on activated
sludges obtained from four cities. Portions of each sludge were placed in three-gallon wide mouth bottles. These were fed in a fill-and-draw
manner twice daily and kept well aerated to keep the sludge in suspen sion. The aeration period between feedings averaged approximately ten and one-half hours. The suspended solids in each bottle were main tained close to 1000 p.p.m. This was done by determining the sus
pended solids in the aeration mixture and wasting portions of it every other day. Sewage was collected principally from one source in City
A during the morning hours. During one set of experiments, however,
samples were collected at four different points in City A in order to obtain sewages with different characteristics. The oxygen utilization characteristics of the sludges when oxidizing identical sewage sub strates were compared weekly in the Oxy-Utilometers.5 Most of the
feeding experiments were conducted over periods of at least three
weeks.
A feeding experiment using two of the sludges mentioned above was conducted in a similar manner at one of the plants at which sludge was obtained. The feeding was performed for a period of three weeks
by the plant operator and then the sludges were brought to this labora tory for comparison.
All routine chemical tests were performed by methods outlined in Standard Methods of Water Analysis (1936).
Experimental Results
Comparative studies of the oxygen requirements 3
of various ac
tivated sludges when oxidizing the same sewage substrate have shown
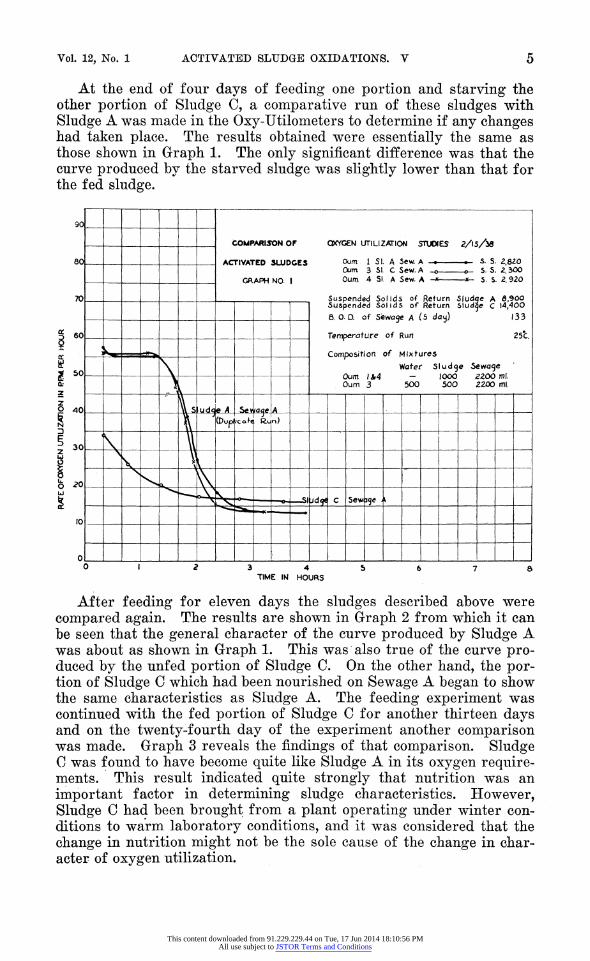
marked variations. One example of such variations is shown in Graph 1 of this paper from which it can be observed that the character of the oxidation rate curve produced by Sludge A is much different from that produced by Sludge C. Inasmuch as the only variable involved in this study was the activated sludge, it was decided to feed Sludge C on the sewage of City A to determine if it would change its characteristics on the new food supply. The supply of Sludge C was divided into two
portions, one portion was starved and the other fed on Sewage A twice each day in a fill-and-draw manner. A sample of Sludge A was fed
Sewage A simultaneously as a means of comparison.
This content downloaded from 91.229.229.44 on Tue, 17 Jun 2014 18:10:56 PMAll use subject to JSTOR Terms and Conditions
Vol. 12, No. 1 ACTIVATED SLUDGE OXIDATIONS. V 5
At the end of four days of feeding one portion and starving the other portion of Sludge C, a comparative run of these sludges with
Sludge A was made in the Oxy-Utilometers to determine if any changes had taken place. The results obtained were essentially the same as
those shown in Graph 1. The only significant difference was that the curve produced by the starved sludge was slightly lower than that for the fed sludge.
3 4 TIME IN HOURS
After feeding for eleven days the sludges described above were
compared again. The results are shown in Graph 2 from which it can
be seen that the general character of the curve produced by Sludge A
was about as shown in Graph 1. This was also true of the curve pro duced by the unfed portion of Sludge C. On the other hand, the por tion of Sludge C which had been nourished on Sewage A began to show the same characteristics as Sludge A. The feeding experiment was
continued with the fed portion of Sludge C for another thirteen days and on the twenty-fourth day of the experiment another comparison
was made. Graph 3 reveals the findings of that comparison. Sludge 0 was found to have become quite like Sludge A in its oxygen require
ments. This result indicated quite strongly that nutrition was an
important factor in determining sludge characteristics. However,
Sludge C had been brought from a plant operating under winter con
ditions to warm laboratory conditions, and it was considered that the
change in nutrition might not be the sole cause of the change in char
acter of oxygen utilization.
This content downloaded from 91.229.229.44 on Tue, 17 Jun 2014 18:10:56 PMAll use subject to JSTOR Terms and Conditions
SEWAGE WORKS JOURNAL Jan., 1940
COMPARISON OF Oxygen Utilization Studies 2-2G-3?
ACTIVATED SLUDGES
GRAPH NO. 2
Oum * I SI. C unfed S.S. 3,fcoo Oum *Z SI. C fed-S.S. 4, 100 Oum *3 SI. A ?o-?-S.S. 3.750
6.0.0 of Sewage A (5day> (Used for
Comparison) ?
Temperature of dun
Com position of rtixfufes 1 Wafer Sludge
?53
ZOX.
Oum*! 0um*2. 0unrc*3
500 700
lOOO 600 ISOO
Sewage i Too ed il oo ml 1700 ml
1 i '
Sludge A Sewage Al
\ Sludge C (fed on Sewage A 11 days) Sc?fogg A
3 4
TIME IN HOURS
SCH
OOL tr
D O X oc Id a.
2 OJ QI
70L
601
50 Z O
i 40L
COMPARISON OF
ACTIVATED SLUDGES
GRAPH NO. 3
Oxygen UtiliJtoiion Studies 3-10-38
0um*2SI.C fed-S.S. 3,480 Oum* 4 SI. A ??-x?S.S. 3, ?bO
i\ pa
*
ilvdge fttSgwage A
&.O.D. of sewage A (5 day) (Used for Comparan)
Temp?rature of Run
Composition of rtufures r
sludge Sewage
Ail Mi'<es llootr
204
*o?C
S 30L
? > X o
\
i Slud<j? C (fed an Sewage A Z4. days ) + Sewa<je A
20L
oc lOU
3 4 TIME IN HOURS
This content downloaded from 91.229.229.44 on Tue, 17 Jun 2014 18:10:56 PMAll use subject to JSTOR Terms and Conditions
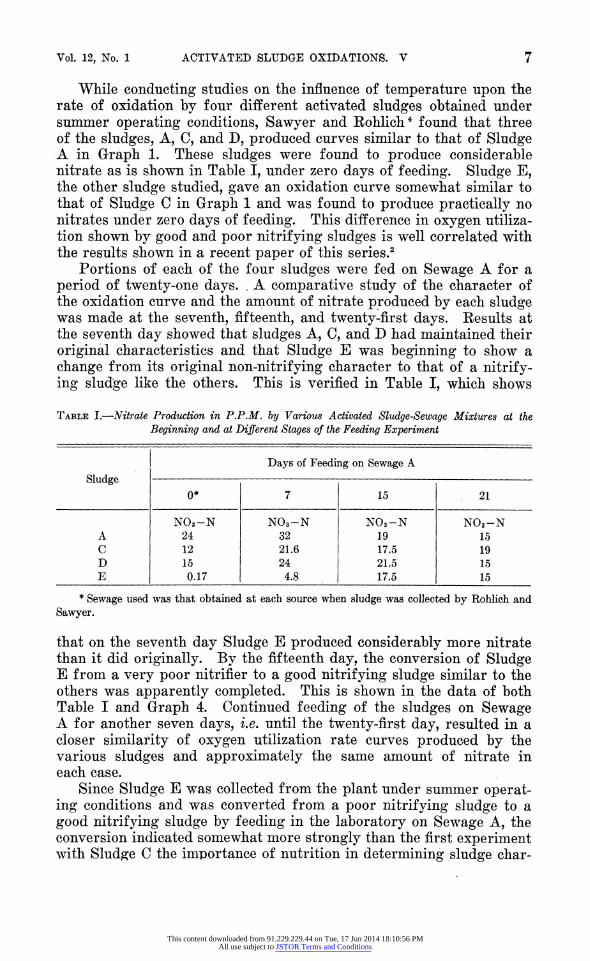
Vol. 12, No. 1 ACTIVATED SLUDGE OXIDATIONS. V 7
While conducting studies on the influence of temperature upon the rate of oxidation by four different activated sludges obtained under summer operating conditions, Sawyer and Rohlich4 found that three of the sludges, A, C, and D, produced curves similar to that of Sludge
A in Graph 1. These sludges were found to produce considerable
nitrate as is shown in Table I, under zero days of feeding. Sludge E, the other sludge studied, gave an oxidation curve somewhat similar to
that of Sludge C in Graph 1 and was found to produce practically no nitrates under zero days of feeding. This difference in oxygen utiliza
tion shown by good and poor nitrifying sludges is well correlated with the results shown in a recent paper of this series.2
Portions of each of the four sludges were fed on Sewage A for a
period of twenty-one days. . A comparative study of the character of
the oxidation curve and the amount of nitrate produced by each sludge was made at the seventh, fifteenth, and twenty-first days. Results at
the seventh day showed that sludges A, C, and D had maintained their
original characteristics and that Sludge E was beginning to show a
change from its original non-nitrifying character to that of a nitrify
ing sludge like the others. This is verified in Table I, which shows
Table I.?Nitrate Production in P.P.M. by Various Activated Sludge-Sewage Mixtures at the
Beginning and at Different Stages of the Feeding Experiment
Sludge
Days of Feeding on Sewage A
0* 15 21
A
C
D
E
NO3-N
24
12
15
0.17
NO
32
21.6
24
4.8
N N03-N
19
17.5
21.5
17.5
N03-N
15
19
15
15
* Sewage used was that obtained at each source when sludge was collected by Rohlich and
Sawyer.
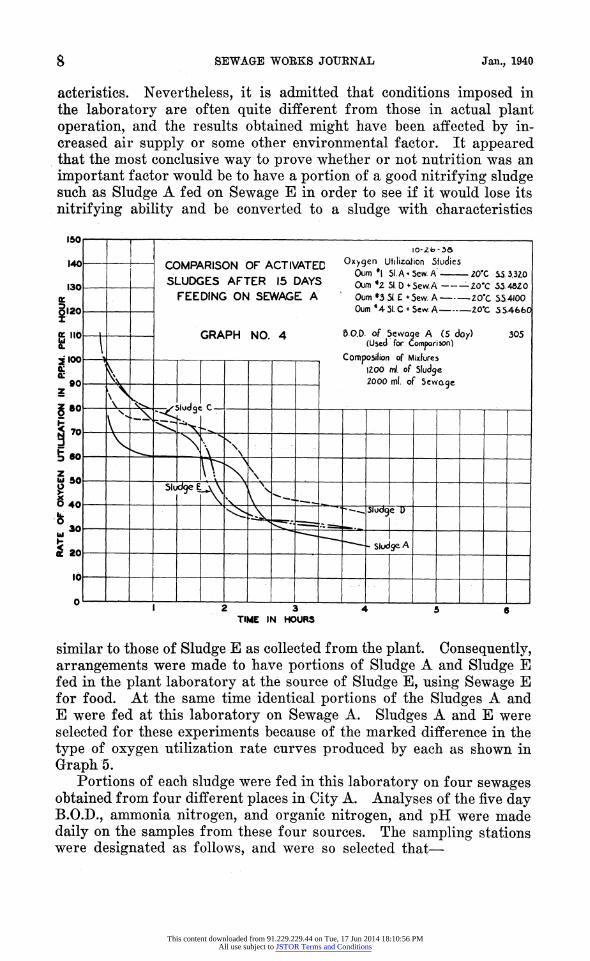
that on the seventh day Sludge E produced considerably more nitrate than it did originally. By the fifteenth day, the conversion of Sludge
E from a very poor nitrifier to a good nitrifying sludge similar to the others was apparently completed. This is shown in the data of both Table I and Graph 4. Continued feeding of the sludges on Sewage
A for another seven days, i.e. until the twenty-first day, resulted in a
closer similarity of oxygen utilization rate curves produced by the
various sludges and approximately the same amount of nitrate in
each case.
Since Sludge E was collected from the plant under summer operat
ing conditions and was converted from a poor nitrifying sludge to a
good nitrifying sludge by feeding in the laboratory on Sewage A, the conversion indicated somewhat more strongly than the first experiment
with Sludge C the importance of nutrition in determining sludge char
This content downloaded from 91.229.229.44 on Tue, 17 Jun 2014 18:10:56 PMAll use subject to JSTOR Terms and Conditions
8 SEWAGE WOBKS JOUENAL Jan., 1940
acteristics. Nevertheless, it is admitted that conditions imposed in the laboratory are often quite different from those in actual plant operation, and the results obtained might have been affected by in creased air supply or some other environmental factor. It appeared that the most conclusive way to prove whether or not nutrition was an
important factor would be to have a portion of a good nitrifying sludge such as Sludge A fed on Sewage E in order; to see if it would lose its
nitrifying ability and be converted to a sludge with characteristics
150
140
130
120
gno] 2100
90
g SO
E 70
^
COMPARISON OF ACTIVATED SLUDGES AFTER 15 DAYS
FEEDING ON SEWAGE A
GRAPH NO. 4
IO-ZfoO?
Oxygen Utilization Studies Oum *i SI. A * Sew. A' 20*C S.S.3.3ZO Oum H SI. D +Sew.A--20'C 55 4?Z0 Oum *3 51 ? +5ew. A-20*C S.5.4IOO Oum 44 51. C + Sew. A-20*C 5.S4660
:^fe?: Sludge
C
^
? O.D. of Sewage A (5 ?oy)
(Used for Comparison)
Composifion of Mixtures
1200 ml. of Sludge
2000 ml. of Sewage
305
? 80
5 501 Sludge ?A
? 40
&
20
Sludge D
Sludge A
10
TIME IN HOURS
similar to those of Sludge E as collected from the plant. Consequently, arrangements were made to have portions of Sludge A and Sludge E fed in the plant laboratory at the source of Sludge E, using Sewage E for food. At the same time identical portions of the Sludges A and E were fed at this laboratory on Sewage A. Sludges A and E were selected for these experiments because of the marked difference in the
type of oxygen utilization rate curves produced by each as shown in
Graph 5. Portions of each sludge were fed in this laboratory on four sewages
obtained from four different places in City A. Analyses of the five day B.O.D., ammonia nitrogen, and organic nitrogen, and pH were made
daily on the samples from these four sources. The sampling stations were designated as follows, and were so selected that?
This content downloaded from 91.229.229.44 on Tue, 17 Jun 2014 18:10:56 PMAll use subject to JSTOR Terms and Conditions
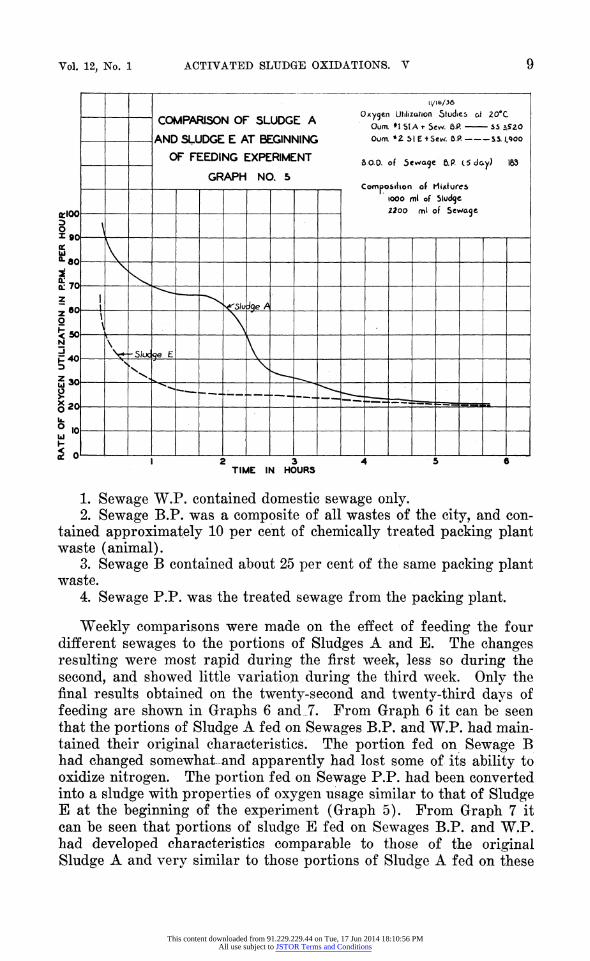
Vol. 12, No. 1 ACTIVATED SLUDGE OXIDATIONS. V 9
COMPARISON OF SLUDGE A
AND SLUDGE E AT BEGINNING
OF FEEDING EXPERIMENT
GRAPH NO. 5
U/\b/3&
Oxygen Utilization Studies at 20*C
Oum. *1 St A + Sew. O.P.-Si 3.S20 Oum. *Z 51 E +Sew. O.P.-S3.1.900
SCO. of Sewage O.P. 15 day)
163
Composition of Mixtures looo ml of Sludge Z20O ml of Sewage.
2 3 TIME IN HOURS
1. Sewage W.P. contained domestic sewage only. 2. Sewage B.P. was a composite of all wastes of the city, and con
tained approximately 10 per cent of chemically treated packing plant waste (animal).
3. Sewage B contained about 25 per cent of the same packing plant waste.
4. Sewage P.P. was the treated sewage from the packing plant.
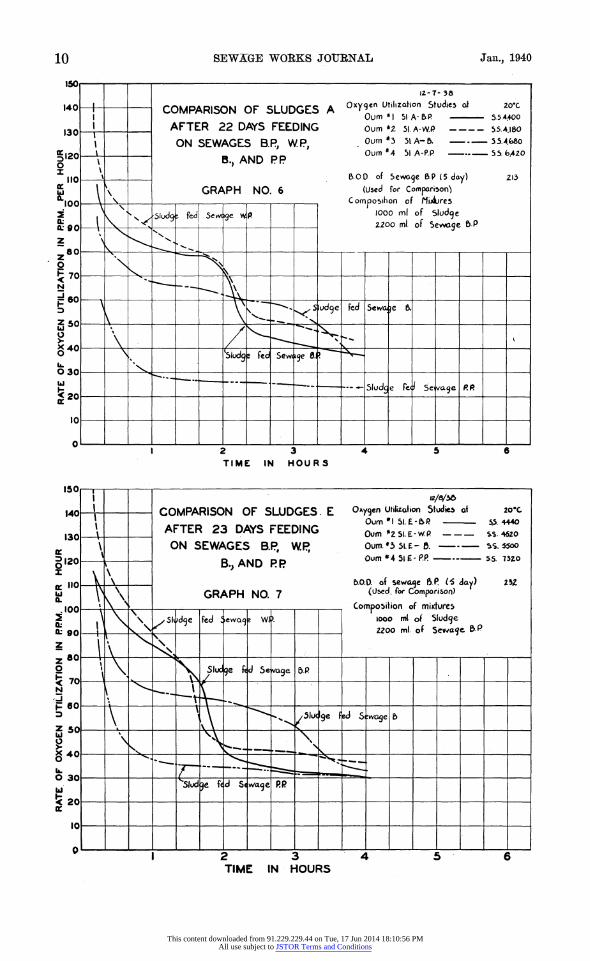
"Weekly comparisons were made on the effect of feeding the four
different sewages to the portions of Sludges A and E. The changes resulting were most rapid during the first week, less so during the
second, and showed little variation during the third week. Only the final results obtained on the twenty-second and twenty-third days of
feeding are shown in Graphs 6 and.7. From Graph 6 it can be seen that the portions of Sludge A fed on Sewages B.P. and W.P. had main tained their original characteristics. The portion fed on Sewage B had changed somewhat and apparently had lost some of its ability to oxidize nitrogen. The portion fed on Sewage P.P. had been converted
into a sludge with properties of oxygen usage similar to that of Sludge E at the beginning of the experiment (Graph 5). From Graph 7 it can be seen that portions of sludge E fed on Sewages B.P. and W.P.
had developed characteristics comparable to those of the original
Sludge A and very similar to those portions of Sludge A fed on these
This content downloaded from 91.229.229.44 on Tue, 17 Jun 2014 18:10:56 PMAll use subject to JSTOR Terms and Conditions
10 SEWAGE WOBKS JOURNAL Jan., 1940
2 3
TIME IN HOURS
COMPARISON OF SLUDGES. E
AFTER 23 DAYS FEEDING ON SEWAGES B.P. W.E>
B.,AND RR
I2/6/3?
Oayoen Utilization Studies oi 20#C
Oum*ISI.?-&P - 5S. 4440
Oum *Z SI. E* w.P- ss. 4520
Oum.*3 SI.E- B.- "iS. 5500
Oum *4 51 ?- PR- S.S. 73ZO
6.0.0. of sewage ?P. (5 day)
(Used, for Comparison)
Composition of mixtures
looo ni of Sludge 2200 ml of Sciage &P
2 3 TIME IN HOURS
This content downloaded from 91.229.229.44 on Tue, 17 Jun 2014 18:10:56 PMAll use subject to JSTOR Terms and Conditions
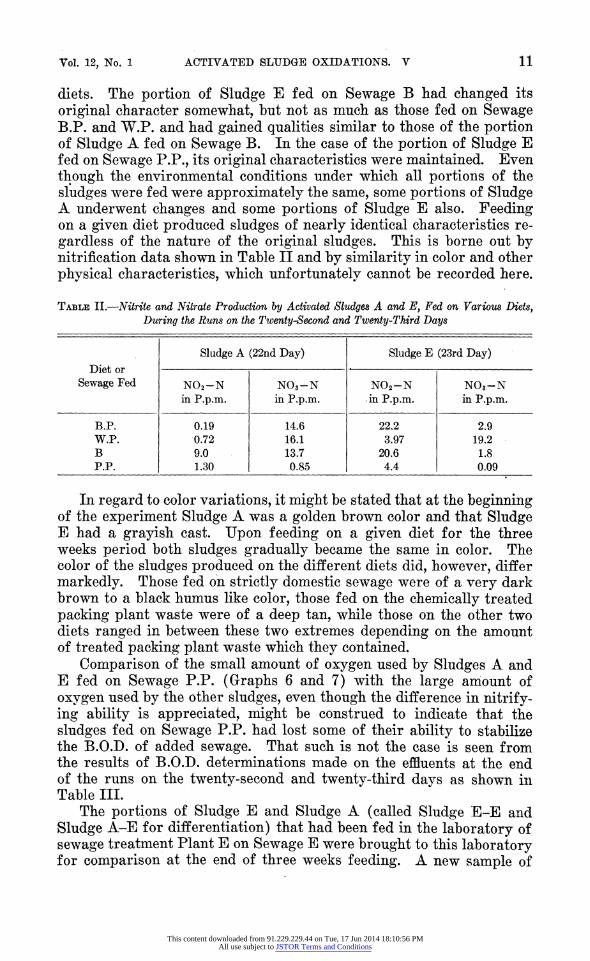
Vol. 12, No. 1 ACTIVATED SLUDGE OXIDATIONS. V 11
diets. The portion of Sludge E fed on Sewage B had changed its
original character somewhat, but not as much as those fed on Sewage B.P. and W.P. and had gained qualities similar to those of the portion of Sludge A fed on Sewage B. In the case of the portion of Sludge E fed on Sewage P.P., its original characteristics were maintained. Even
though the environmental conditions under which all portions of the
sludges were fed were approximately the same, some portions of Sludge A underwent changes and some portions of Sludge E also. Feeding on a given diet produced sludges of nearly identical characteristics re
gardless of the nature of the original sludges. This is borne out by nitrification data shown in Table II and by similarity in color and other
physical characteristics, which unfortunately cannot be recorded here.
Table II.?Nitrite and Nitrate Production by Activated Sludges A and E, Fed on Various Diets, During the Runs on the Twenty-Second and Twenty-Third Days
Diet or
Sewage Fed
Sludge A (22nd Day)
NO2-N
in P.p.m.
N03-N
in P.p.m.
Sludge E (23rd Day)
NO2-N
in P.p.m.
N03-N
in P.p.m.
B.P.
W.P.
B
P.P.
0.19
0.72
9.0
1.30
14.6
16.1
13.7
0.85
22.2
3.97
20.6
4.4
2.9
19.2
1.8
0.09
In regard to color variations, it might be stated that at the beginning of the experiment Sludge A was a golden brown color and that Sludge E had a grayish cast. Upon feeding on a given diet for the three weeks period both sludges gradually became the same in color. The color of the sludges produced on the different diets did, however, differ
markedly. Those fed on strictly domestic sewage were of a very dark
brown to a black humus like color, those fed on the chemically treated
packing plant waste were of a deep tan, while those on the other two
diets ranged in between these two extremes depending on the amount
of treated packing plant waste which they contained.
Comparison of the small amount of oxygen used by Sludges A and E fed on Sewage P.P. (Graphs 6 and 7) with the large amount of oxygen used by the other sludges, even though the difference in nitrify ing ability is appreciated, might be construed to indicate that the sludges fed on Sewage P.P. had lost some of their ability to stabilize the B.O.D. of added sewage. That such is not the case is seen from the results of B.O.D. determinations made on the effluents at the end of the runs on the twenty-second and twenty-third days as shown in Table III.
The portions of Sludge E and Sludge A (called Sludge E-E and Sludge A-E for differentiation) that had been fed in the laboratory of sewage treatment Plant E on Sewage E were brought to this laboratory for comparison at the end of three weeks feeding. A new sample of
This content downloaded from 91.229.229.44 on Tue, 17 Jun 2014 18:10:56 PMAll use subject to JSTOR Terms and Conditions
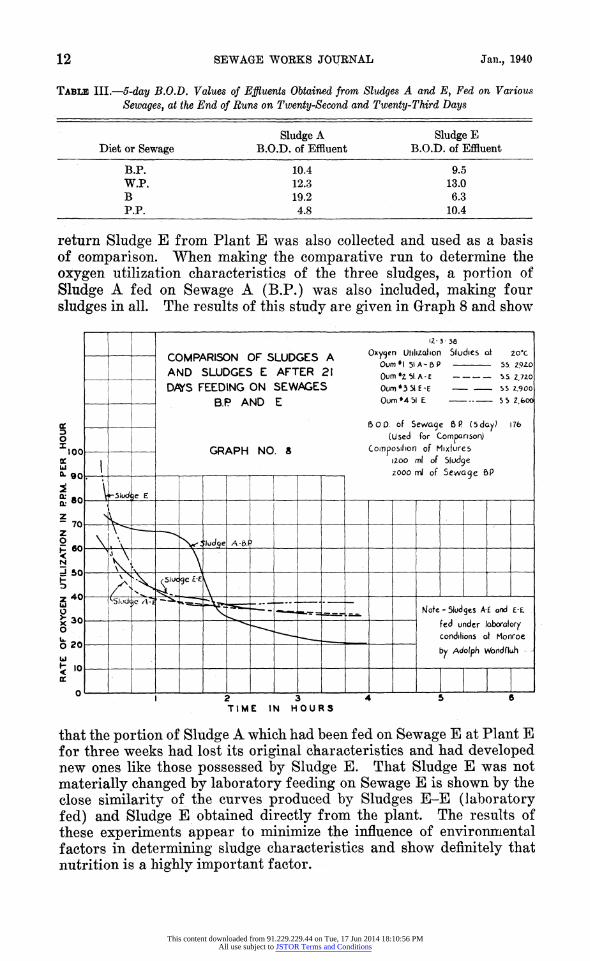
12 SEWAGE WOEKS JOUENAL Jan., 1940
Table III.?5-day B.O.D. Values of Efluents Obtained from Sludges A and E> Fed on Various
Sewages, at the End of Runs on Twenty-Second and Twenty-Third Days
Diet or Sewage
Sludge A B.O.D. of Effluent
Sludge E B.O.D. of Effluent
B.P.
W.P.
B
P.P.
10.4
12.3
19.2
4.8
9.5
13.0
6.3
10.4
return Sludge E from Plant E was also collected and used as a basis of comparison. When making the comparative run to determine the
oxygen utilization characteristics of the three sludges, a portion of
Sludge A fed on Sewage A (B.P.) was also included, making four
sludges in all. The results of this study are given in Graph 8 and show
COMPARISON OF SLUDGES A AND SLUDGES E AFTER 21
DATS FEEDING ON SEWAGES
B.P AND E
12-3-3fi
Oxygen Utilization Sludies oi 2o*c Oum*l 5IA-6P -? 5.5. 292.0
Oum *l SI A - E - 5.S 2.720 0um*3 5U-E- b s 2.900
0um*4 5l E. - 5 5 2>oo|
6 0 0. of Sewage OR (5day)
(Used for Comparison)
Composition of Mixtures
1200 ml of Sludge 2000 ml of Sewage 6P
176
Hoie. - Sludges A? ano E-fc
fed under laboratory conditions ot Monroe
by Adolph Wondfluh
that the portion of Sludge A which had been fed on Sewage E at Plant E for three weeks had lost its original characteristics and had developed new ones like those possessed by Sludge E. That Sludge E was not
materially changed by laboratory feeding on Sewage E is shown by the close similarity of the curves produced by Sludges E-E (laboratory fed) and Sludge E obtained directly from the plant. The results of these experiments appear to minimize the influence of environmental
factors in determining sludge characteristics and show definitely that nutrition is a highly important factor.
This content downloaded from 91.229.229.44 on Tue, 17 Jun 2014 18:10:56 PMAll use subject to JSTOR Terms and Conditions
Vol. 12, No. 1 ACTIVATED SLUDGE OXIDATIONS! V 13
Now that it is established that the character of the diet is an im
portant factor in determining activated sludge characteristics, we can
turn our attention to an analysis of the different sewages used in the
feeding experiments in an attempt to find the cause of the changes
produced. Since, from a chemical standpoint, the most important differences in the sludges appeared to be their variation in ability to oxidize nitrogen, it would seem most reasonable to consider the car
bonaceous and nitrogenous substances present in the sewages used.
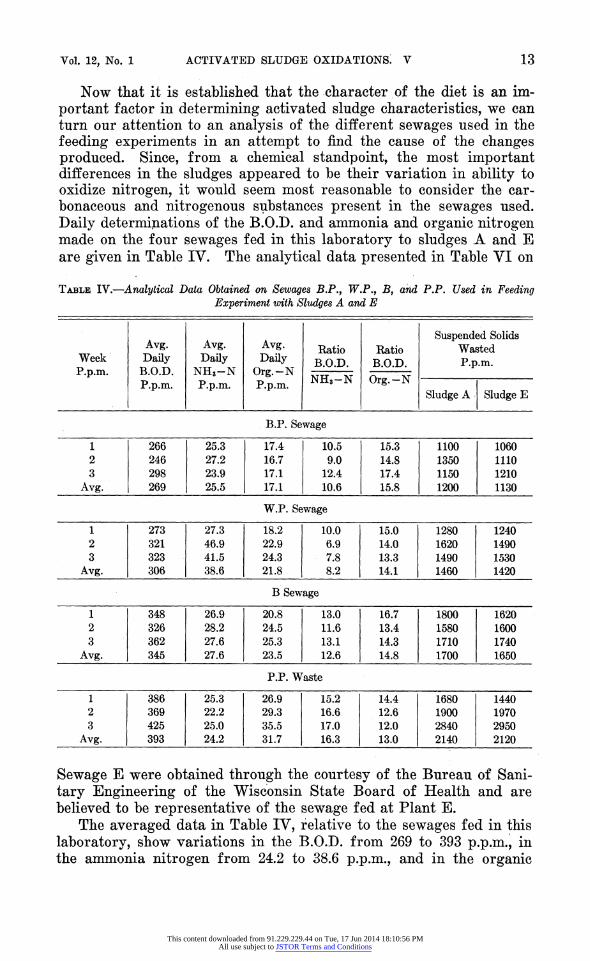
Daily determinations of the B.O.D. and ammonia and organic nitrogen made on the four sewages fed in this laboratory to sludges A and E are given in Table IV. The analytical data presented in Table VI on
Table IV.?Analytical Data Obtained on Sewages B.P., W.P., B, arid P.P. Used in Feeding
Experiment with Sludges A and E
Week
P.p.m.
Avg.
Daily B.O.D.
P.p.m.
Avg.
Daily NH3-N
P.p.m.
Avg.
Daily Org.-N
P.p.m.
Ratio B.O.D.
NH3-N
Ratio B.O.D.
Org.-N
Suspended Solids Wasted
P.p.m.
Sludge A Sludge E
B.P. Sewage
1
2
3
Avg.
266 246 298 269
25.3
27.2
23.9
25.5
17.4
16.7
17.1
17.1
10.5
9.0
12.4
10.6
15.3
14.8
17.4
15.8
1100 1350 1150 1200
1060 1110 1210 1130
W.P. Sewage
1
2
3
Avg.
273 321 323 306
27.3
46.9
41.5
38.6
18.2
22.9
24.3
21.8
10.0
6.9
7.8
8.2
15.0
14.0
13.3
14.1
1280 1620 1490 1460
1240 1490 1530 1420
B Sewage
1
2
3
Avg.
348 326 362 345
26.9
28.2
27.6
27.6
20.8
24.5
25.3
23.5
13.0
11.6
13.1
12.6
16.7
13.4
14.3
14.8
1800 1580 1710 1700
1620 1600 1740 1650
P.P. Waste
1
2
3
Avg.
386 369 425 393
25.3
22.2
25.0
24.2
26.9
29.3
35.5
31.7
15.2
16.6
17.0
16.3
14.4
12.6
12.0
13.0
1680 1900 2840 2140
1440 1970 2950 2120
Sewage E were obtained through the courtesy of the Bureau of Sani
tary Engineering of the "Wisconsin State Board of Health and are believed to be representative of the sewage fed at Plant E.
The averaged data in Table IV, relative to the sewages fed in this
laboratory, show variations in the B.O.D. from 269 to 393 p.p.m., in
the ammonia nitrogen from 24.2 to 38.6 p.p.m., and in the organic
This content downloaded from 91.229.229.44 on Tue, 17 Jun 2014 18:10:56 PMAll use subject to JSTOR Terms and Conditions
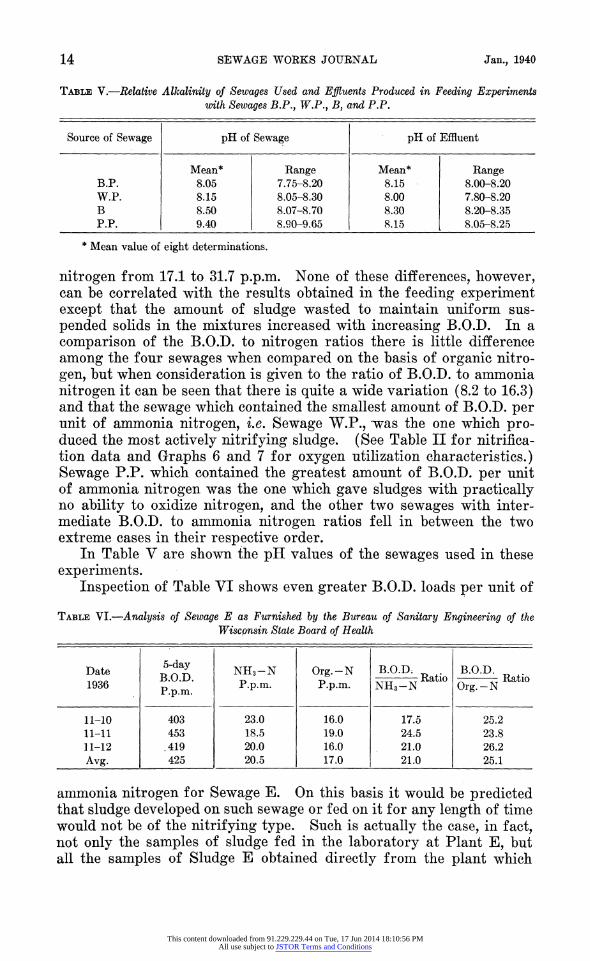
14 SEWAGE WORKS JOURNAL Jan., 1940
Table V.?Relative Alkalinity of Sewages Used and Effluents Produced in Feeding Experiments with Sewages B.P., W.P., B, and P.P.
Source of Sewage pH of Sewage pH of Effluent
B.P.
W.P.
B
P.P.
Mean*
8.05
8.15
8.50
9.40
Range 7.75-8.20
8.05-8.30
8.07-8.70
8.90-9.65
Mean*
8.15
8.00
8.30
8.15
Range 8.00-8.20
7.80-8.20
8.20-8.35
8.05-8.25
* Mean value of eight determinations.
nitrogen from 17.1 to 31.7 p.p.m. None of these differences, however, can be correlated with the results obtained in the feeding experiment except that the amount of sludge wasted to maintain uniform sus
pended solids in the mixtures increased with increasing B.O.D. In a
comparison of the B.O.D. to nitrogen ratios there is little difference
among the four sewages when compared on the basis of organic nitro
gen, but when consideration is given to the ratio of B.O.D. to ammonia
nitrogen it can be seen that there is quite a wide variation (8.2 to 16.3) and that the sewage which contained the smallest amount of B.O.D. per unit of ammonia nitrogen, i.e. Sewage W.P., was the one which pro duced the most actively nitrifying sludge. (See Table II for nitrifica tion data and Graphs 6 and 7 for oxygen utilization characteristics.) Sewage P.P. which contained the greatest amount of B.O.D. per unit
of ammonia nitrogen was the one which gave sludges with practically no ability to oxidize nitrogen, and the other two sewages with inter
mediate B.O.D. to ammonia nitrogen ratios fell in between the two
extreme cases in their respective order.
In Table V are shown the pH values of the sewages used in these
experiments.
Inspection of Table VI shows even greater B.O.D. loads per unit of
Table VI.?Analysis of Sewage E as Furnished by the Bureau of Sanitary Engineering of the
Wisconsin State Board of Health
Date
1936
11-10
11-11
11-12
Avg.
5-day B.O.D.
P.p.m.
403 453 .419
425
NH3-N
P.p.m.
23.0
18.5
20.0
20.5
Org.-N
P.p.m.
16.0
19.0
16.0
17.0
B.O.D.
NH3-N Ratio
17.5
24.5
21.0
21.0
B.O.D.
Org.-N Ratio
25.2
23.8
26.2
25.1
ammonia nitrogen for Sewage E. On this basis it would be predicted that sludge developed on such sewage or fed on it for any length of time
would not be of the nitrifying type. Such is actually the case, in fact, not only the samples of sludge fed in the laboratory at Plant E, but all the samples of Sludge E obtained directly from the plant which
This content downloaded from 91.229.229.44 on Tue, 17 Jun 2014 18:10:56 PMAll use subject to JSTOR Terms and Conditions
Vol. 12, No. 1 ACTIVATED SLUDGE OXIDATIONS. V 15
have been studied in this laboratory have never shown anything but a trace of ability to oxidize nitrogen.
Discussion
Although the activated sludge process of sewage treatment has been
developed and applied extensively during a period in which great ad vances have been made in the field of animal and plant nutrition, there has been little attempt to correlate or apply this knowledge to this
method of sewage treatment. There are, no doubt, several reasons for
this delay. Probably the most important one is the tendency of many plant operators to accept with resignation everything which emerges from the contributing sewers. Such acquiescence may be due to in
difference of the operator but, more probably, to constant frustration
of his attempts to gain equipment, assistance, and cooperation in mak
ing a study of his problem with regard to their significance and control. The inadequacy of the routine tests (B.O.D., ammonia N, organic N,
etc.) applied in sewage analysis to dietary evaluation has also retarded
the application and correlation of knowledge gained in other biological fields. The nature of the routine observations normally performed to
determine the relative characteristics of activated sludge, namely color,
odor, settleability, and enumeration of the grosser microscopic life are
of such a qualitative nature that little information of value can be ex
pected. Of these tests, only the one which determines the settling characteristics of the sludge has found much application and it has become indispensable from an operating standpoint. Tie variation in
color of the activated sludge from plant to plant has been of consider able concern to many people, and has been the basis upon which "good" and "poor" sludges have frequently been judged. On the basis of
operating results, there is considerable question of the value of this observation when applied to different plants, but it does, however, ap
pear to have considerable value at a given plant. In the field of animal nutrition, studies have been made to ascertain
the most suitable diets for all animals of economic significance. The constituents of a good diet for one group of animals may be widely different from those for another, but fundamentally, from a chemical
standpoint, they are all constituted of the three classes of food ma
terials, namely carbohydrates, fats, and proteins, with a liberal supply of the essential mineral elements in addition. The feeding of animals for prolonged periods on diets that are severely out of balance results
in malnutrition and possibly in the development of a "deficiency dis ease." The remedy most generally applied is, of course, the addition
of the deficient material to the diet to bring it back to normal. In the field of biological sewage treatment, we are dealing with an
other group of organisms which live upon a food supply which man has chosen to waste. It would be illogical to assume that the principles of nutrition found applicable from the largest to the smallest animals do not apply to the still lower forms of organisms which are so im
This content downloaded from 91.229.229.44 on Tue, 17 Jun 2014 18:10:56 PMAll use subject to JSTOR Terms and Conditions
16 SEWAGE WORKS JOURNAL Jan., 1940
portant in the disposal of wastes without the development of a nuisance. Of what the optimum diet for activated sludge organisms consists no one has so far determined, but no doubt it would be safe to predict that it contains at least some of each of the three classes of food ma
terials and a liberal allowance of the essential mineral elements.
Domestic sewage is probably the most balanced waste of all because of its origin, since man habitually attempts to balance his diet to the best of his knowledge and the "crumbs which fall from his table'9 are bound to be constituted of all the essential food materials. In this connection it is of interest to bear in mind that the most successful
applications of the activated sludge process have been on strictly domestic sewages or on sources of sewage so large that diversification
of industries presumably do not produce an unbalanced sewage for
treatment. On the other hand, in a small city with a single large in
dustry releasing a strong unbalanced waste into the sewers, the sew
age may become so loaded with one particular class of food material that a normal activated sludge will not develop. When the optimum dietary requirements of activated sludge are known, such cities may find relief from their troubles by encouraging the establishment of industries within their jurisdiction which will release wastes of a character to put the sewage back into balance with respect to the nu
tritional requirements of the sludge. Some study, from a nutritional standpoint, should be given to the present practice of primary clarifica tion, since in most cases the ratio of B.O.D. to ammonia nitrogen and other nutritional characteristics are markedly affected by such treat
ment. In some cases elimination of the practice may be desirable, while in others more efficient clarification may be advantageous. The
disposal of garbage in sanitary sewer systems may well be studied from a similar viewpoint. Undoubtedly, the nutritional characteris
tics of garbage are quite different from sewage, and, consequently, in some cases may be a desirable addition while in other cases it might tend to throw the resulting sewage still further out of balance and be
most undesirable. These avenues of study appear to be the logical lines of attack on the problem. It would seem that any others must first be shown to be justified economically.
Summary
1. Laboratory feeding experiments were conducted at room tem
peratures with four activated sludges (A, C, D, and E) possessing widely different characteristics and with five different sewages. In all cases, dissimilar sludges fed on a given sewage as a diet gained similar characteristics within a three weeks period.
2. Although the activated sludges were all fed under nearly iden tical environmental conditions, the character of sludge produced on
each diet was distinctly different. On certain diets, sludges which were originally poor nitrifier s became strong nitrifiers, and on other diets, sludges which were good nitrifiers lost the ability and became essen tially non-nitrifiers.
This content downloaded from 91.229.229.44 on Tue, 17 Jun 2014 18:10:56 PMAll use subject to JSTOR Terms and Conditions
Vol. 12, No. 1 ACTIVATED SLUDGE OXIDATIONS. V 17
3. The variation in nitrifying ability of the sludges fed on the differ ent diets could not be correlated with the B.O.D., ammonia nitrogen, or
organic nitrogen content of the food materials when each of these fac tors was considered individually.
4. The B.O.D. to ammonia nitrogen ratio in the different diets showed a variation from 8.2 to 21.0. Sludges fed on the diet containing only 8.2 p.p.m. of B.O.D. for one p.p.m. of ammonia nitrogen developed the greatest ability to oxidize nitrogen, while the sludges fed on diets
containing 16 or more p.p.m. of B.O.D. per unit of ammonia nitrogen lost most of their ability to oxidize nitrogen. Sewages with ratios be tween 8.2 and 16 gave sludges with intermediate abilities of oxidizing nitrogen which fell into their respective order.
5. The color of the sludges resulting from the feeding experiments was influenced markedly by the presence of a chemically treated pack
ing house waste. The colors of the sludges varied from a dark brown on a diet of domestic sewage to a deep tan on the treated packing plant
waste diet.
Acknowledgments
The author wishes to express his appreciation to the Wisconsin Alumni Eesearch Foundation for a grant-in-aid which has made this
research project possible, to Dr. W. D. Stovall, Director of the Wis consin State Laboratory of Hygiene, for the loan of the Oxy-Utilom eters, to Professor L. H. Kessler and Dr. M. Starr Nichols who have
sponsored this research project and given freely of their counsel, and
to Mr. Adolph Wandfluh, Superintendent of the Monroe, Wisconsin, Sewage Treatment Plant, who conducted one of the feeding experi
ments in his laboratory. References
1. Don E. Bloodgood, "Biologic Oxidation," This Journal, 10, 927 (1938). 2. C. N. Sawyer, "Factors Involved in Prolonging the Initial High Rate of Oxygen Utiliza
tion by Activated Sludge-Sewage Mixtures,'' Ibid., 11, 595 (1939). 3. C. N. Sawyer and M. Starr Nichols, "A Comparison of Oxygen Utilization by Activated
Sludges Obtained from Four Wisconsin Municipalities, ' '
Ibid., 11, 462 (1939). 4. C. N. Sawyer and G. A. Rohlich, "The Influence of Temperature on the Rate of Oxygen
Utilization by Activated Sludges/ '
Ibid., 11, 946 (1939). 5. C. N. Sawyer and M. Starr Nichols, "Effect of Sludge Concentration and Temperature
upon Oxygen Utilization of Activated Sludges," Ibid., 11, 51 (1939).
This content downloaded from 91.229.229.44 on Tue, 17 Jun 2014 18:10:56 PMAll use subject to JSTOR Terms and Conditions


