
A UNIFIED FRAMEWORK FOR
SPACECRAFT OPERATIONS
By
David Verrier
SUBMITTED IN PARTIAL FULFILLMENT OF THE
REQUIREMENTS FOR THE DEGREE OF
DOCTOR OF PHILOSOPHY
AT
CRANFIELD UNIVERSITY
c© Copyright Cranfield University 2001
All rights reserved. No part of this publication may be
reproduced without the written permission of the copyright holder.
University: Cranfield University
Department: College of Aeronautics
Degree: Ph.D.
Submitted: April 2001
Author: David Verrier
Title: A Unified Framework for Spacecraft Operations
Supervisor: T.S.Bowling
Presentation: 28 Nov. 2002
This thesis is submitted in partial fulfilment of the
requirements for the degree of Doctor of Philosophy
c© Copyright Cranfield University 2001
All rights reserved. No part of this publication may be
reproduced without the written permission of the copyright holder.

Dl� moe$i l�bimen~ko$i Kiski
iii

iv

Table of Contents
Table of Contents v
List of Tables viii
List of Figures x
Abstract xiii
Acknowledgements xv
1 Introduction 3
1.1 Background . . . . . . . . . . . . . . . . . . . . . . . . . . . . . . . . 3
1.2 Increasing Knowledge Transfer . . . . . . . . . . . . . . . . . . . . . . 8
1.3 Structure of this Thesis . . . . . . . . . . . . . . . . . . . . . . . . . . 12
2 Space Projects 15
2.1 Introduction . . . . . . . . . . . . . . . . . . . . . . . . . . . . . . . . 15
2.2 The Space Business . . . . . . . . . . . . . . . . . . . . . . . . . . . . 16
2.3 Space Project Life Cycle: Who, What and When . . . . . . . . . . . 17
2.4 Mission Operations . . . . . . . . . . . . . . . . . . . . . . . . . . . . 23
2.5 Operations Commonality . . . . . . . . . . . . . . . . . . . . . . . . . 30
2.6 Mission Differences . . . . . . . . . . . . . . . . . . . . . . . . . . . . 31
2.7 Industrial Policy . . . . . . . . . . . . . . . . . . . . . . . . . . . . . 37
2.8 Summary . . . . . . . . . . . . . . . . . . . . . . . . . . . . . . . . . 39
3 Organisational Behaviour 41
3.1 Introduction . . . . . . . . . . . . . . . . . . . . . . . . . . . . . . . . 41
3.2 Behaviour . . . . . . . . . . . . . . . . . . . . . . . . . . . . . . . . . 42
3.3 Rules And Procedures . . . . . . . . . . . . . . . . . . . . . . . . . . 45
3.4 Flight Control Teams . . . . . . . . . . . . . . . . . . . . . . . . . . . 48
3.5 Organisations . . . . . . . . . . . . . . . . . . . . . . . . . . . . . . . 58
3.6 Summary . . . . . . . . . . . . . . . . . . . . . . . . . . . . . . . . . 66
v

4 Risk 69
4.1 Introduction . . . . . . . . . . . . . . . . . . . . . . . . . . . . . . . . 69
4.2 Risk Perception . . . . . . . . . . . . . . . . . . . . . . . . . . . . . . 71
4.3 Risks Encountered During A Programme Life-time . . . . . . . . . . 71
4.4 Risk Management . . . . . . . . . . . . . . . . . . . . . . . . . . . . . 73
4.5 Risk Analysis . . . . . . . . . . . . . . . . . . . . . . . . . . . . . . . 80
4.6 Summary . . . . . . . . . . . . . . . . . . . . . . . . . . . . . . . . . 85
5 Ground Segment Preparation 87
5.1 Introduction . . . . . . . . . . . . . . . . . . . . . . . . . . . . . . . . 87
5.2 Satellite Database . . . . . . . . . . . . . . . . . . . . . . . . . . . . . 88
5.3 User Manual . . . . . . . . . . . . . . . . . . . . . . . . . . . . . . . . 104
5.4 Flight Control Procedures . . . . . . . . . . . . . . . . . . . . . . . . 106
5.5 System Validation . . . . . . . . . . . . . . . . . . . . . . . . . . . . . 109
5.6 Simulations . . . . . . . . . . . . . . . . . . . . . . . . . . . . . . . . 110
5.7 Reviews . . . . . . . . . . . . . . . . . . . . . . . . . . . . . . . . . . 113
5.8 Summary . . . . . . . . . . . . . . . . . . . . . . . . . . . . . . . . . 115
6 Control Systems 119
6.1 Introduction . . . . . . . . . . . . . . . . . . . . . . . . . . . . . . . . 119
6.2 Control System Procurement . . . . . . . . . . . . . . . . . . . . . . . 120
6.3 Commonality Between FCS and CCE . . . . . . . . . . . . . . . . . . 121
6.4 Automation . . . . . . . . . . . . . . . . . . . . . . . . . . . . . . . . 126
6.5 Summary . . . . . . . . . . . . . . . . . . . . . . . . . . . . . . . . . 132
7 Vocabulary 133
7.1 Introduction . . . . . . . . . . . . . . . . . . . . . . . . . . . . . . . . 133
7.2 Jargon . . . . . . . . . . . . . . . . . . . . . . . . . . . . . . . . . . . 134
7.3 Ontology . . . . . . . . . . . . . . . . . . . . . . . . . . . . . . . . . . 136
7.4 Summary . . . . . . . . . . . . . . . . . . . . . . . . . . . . . . . . . 149
8 Formal Methods 151
8.1 Introduction . . . . . . . . . . . . . . . . . . . . . . . . . . . . . . . . 151
8.2 What is Z? . . . . . . . . . . . . . . . . . . . . . . . . . . . . . . . . 152
8.3 Outline of a Specification . . . . . . . . . . . . . . . . . . . . . . . . . 154
8.4 Tools . . . . . . . . . . . . . . . . . . . . . . . . . . . . . . . . . . . . 155
8.5 Example Specification: Satellite Operations . . . . . . . . . . . . . . 157
8.6 Detailed Specification . . . . . . . . . . . . . . . . . . . . . . . . . . . 161
8.7 Summary . . . . . . . . . . . . . . . . . . . . . . . . . . . . . . . . . 167
9 The Nature of Complexity 169
9.1 Introduction . . . . . . . . . . . . . . . . . . . . . . . . . . . . . . . . 169
9.2 Algorithmic Information Content . . . . . . . . . . . . . . . . . . . . 172
9.3 Effective Complexity . . . . . . . . . . . . . . . . . . . . . . . . . . . 173
vi

9.4 Causes of Complexity . . . . . . . . . . . . . . . . . . . . . . . . . . . 174
9.5 Example . . . . . . . . . . . . . . . . . . . . . . . . . . . . . . . . . . 179
9.6 Complexity Management . . . . . . . . . . . . . . . . . . . . . . . . . 183
9.7 Summary . . . . . . . . . . . . . . . . . . . . . . . . . . . . . . . . . 190
10 Telemetry and Telecommand 193
10.1 Introduction . . . . . . . . . . . . . . . . . . . . . . . . . . . . . . . . 193
10.2 PCM Telecommands . . . . . . . . . . . . . . . . . . . . . . . . . . . 194
10.3 Packet Telecommanding . . . . . . . . . . . . . . . . . . . . . . . . . 195
10.4 Telemetry . . . . . . . . . . . . . . . . . . . . . . . . . . . . . . . . . 196
10.5 Packet Telemetry . . . . . . . . . . . . . . . . . . . . . . . . . . . . . 200
10.6 Summary . . . . . . . . . . . . . . . . . . . . . . . . . . . . . . . . . 201
11 Information Theory 203
11.1 Introduction . . . . . . . . . . . . . . . . . . . . . . . . . . . . . . . . 203
11.2 Information Theory . . . . . . . . . . . . . . . . . . . . . . . . . . . . 203
11.3 Background: Hypergraph . . . . . . . . . . . . . . . . . . . . . . . . . 206
11.4 Fixed Format Telemetry . . . . . . . . . . . . . . . . . . . . . . . . . 209
11.5 Analysis of Flags . . . . . . . . . . . . . . . . . . . . . . . . . . . . . 212
11.6 A Packet: With Details Please! . . . . . . . . . . . . . . . . . . . . . 214
11.7 Information Usage . . . . . . . . . . . . . . . . . . . . . . . . . . . . 216
11.8 Summary . . . . . . . . . . . . . . . . . . . . . . . . . . . . . . . . . 217
12 Synthesis 219
13 Conclusion 225
13.1 Summary . . . . . . . . . . . . . . . . . . . . . . . . . . . . . . . . . 225
13.2 Discussion . . . . . . . . . . . . . . . . . . . . . . . . . . . . . . . . . 231
13.3 Further Work . . . . . . . . . . . . . . . . . . . . . . . . . . . . . . . 235
References 236
A Ontology Outline 243
A.1 Interface . . . . . . . . . . . . . . . . . . . . . . . . . . . . . . . . . . 243
A.2 Equipment . . . . . . . . . . . . . . . . . . . . . . . . . . . . . . . . . 251
vii

viii
List of Tables
2.1 OSI Reference Model . . . . . . . . . . . . . . . . . . . . . . . . . . . 24
2.2 X.25 Implementation of OSI Reference Model . . . . . . . . . . . . . 24
2.3 TCP/IP Suite and OSI Reference Model . . . . . . . . . . . . . . . . 25
2.4 Theoretical Spacecraft Operations Model . . . . . . . . . . . . . . . . 26
2.5 Spacecraft Operations Model and Available Standards . . . . . . . . . 27
5.1 Example Telemetry Parameter Characteristics Table . . . . . . . . . 89
5.2 Example Database Table . . . . . . . . . . . . . . . . . . . . . . . . . 95
6.1 Intentions of automation compared with results . . . . . . . . . . . . 127
10.1 PCM Telecommand . . . . . . . . . . . . . . . . . . . . . . . . . . . . 195
10.2 Telemetry Format . . . . . . . . . . . . . . . . . . . . . . . . . . . . . 198
ix

x

List of Figures
1.1 Classical View of Spacecraft Engineering . . . . . . . . . . . . . . . . 4
1.2 Knowledge Transfer Between Projects By Individuals . . . . . . . . . 8
1.3 Critical Knowledge Transfer Between Projects . . . . . . . . . . . . . 11
2.1 Integration Local Test (Stand-alone) . . . . . . . . . . . . . . . . . . 18
2.2 Integration and Test (in Simulated System) . . . . . . . . . . . . . . 19
2.3 Participation in the Project Life Cycle . . . . . . . . . . . . . . . . . 21
2.4 Physical and Virtual Paths . . . . . . . . . . . . . . . . . . . . . . . . 28
2.5 Monitoring and Control Layers . . . . . . . . . . . . . . . . . . . . . 28
2.6 Interfacing Monitoring and Control Layers . . . . . . . . . . . . . . . 29
2.7 Monitoring and Control Loops in Space Mission Operations . . . . . 34
3.1 Years on ERS Project . . . . . . . . . . . . . . . . . . . . . . . . . . 53
3.2 ESOC Structure . . . . . . . . . . . . . . . . . . . . . . . . . . . . . . 59
3.3 ESOC Reorganisations . . . . . . . . . . . . . . . . . . . . . . . . . . 60
3.4 Multiple Reporting in ESOC . . . . . . . . . . . . . . . . . . . . . . . 61
3.5 EUTELSAT Structure . . . . . . . . . . . . . . . . . . . . . . . . . . 61
4.1 Decision Utility . . . . . . . . . . . . . . . . . . . . . . . . . . . . . . 76
4.2 Risk Management(after Hollnagel [25]) . . . . . . . . . . . . . . . . . 79
5.1 Initial Database Schema . . . . . . . . . . . . . . . . . . . . . . . . . 96
5.2 Corrected Database Schema . . . . . . . . . . . . . . . . . . . . . . . 100
5.3 Completed Schema . . . . . . . . . . . . . . . . . . . . . . . . . . . . 101
6.1 Schematic Diagram of Functions in FCS . . . . . . . . . . . . . . . . 122
6.2 Schematic Diagram of Functions in CCE . . . . . . . . . . . . . . . . 122
6.3 Automation and Manpower . . . . . . . . . . . . . . . . . . . . . . . 130
xi
7.1 Protege Overview . . . . . . . . . . . . . . . . . . . . . . . . . . . . . 140
7.2 An Ontology in Protege . . . . . . . . . . . . . . . . . . . . . . . . . 141
7.3 Protege Instance Editor . . . . . . . . . . . . . . . . . . . . . . . . . 143
7.4 Herschel-Planck Equipment types . . . . . . . . . . . . . . . . . . . . 144
7.5 Herschel-Planck Units . . . . . . . . . . . . . . . . . . . . . . . . . . 145
7.6 Herschel-Planck Instrument HFI . . . . . . . . . . . . . . . . . . . . . 146
7.7 Herschel-Planck Instrument HFI . . . . . . . . . . . . . . . . . . . . . 147
7.8 Herschel-Planck Instrument HFI architecture . . . . . . . . . . . . . . 148
9.1 Comparative Complexity . . . . . . . . . . . . . . . . . . . . . . . . . 170
9.2 Effective Complexity . . . . . . . . . . . . . . . . . . . . . . . . . . . 174
11.1 Shannon Information of a Binary Digit . . . . . . . . . . . . . . . . . 207
11.2 Example Hypercube - a 4-cube . . . . . . . . . . . . . . . . . . . . . 208
11.3 Information of a Multi Digit System . . . . . . . . . . . . . . . . . . . 210
11.4 Information of Single-Change System . . . . . . . . . . . . . . . . . . 211
11.5 Information of Flag-based Monitoring . . . . . . . . . . . . . . . . . . 213
11.6 Information of Optimum Flag-based Monitoring . . . . . . . . . . . . 214
11.7 Information of Packet-Based Monitoring System . . . . . . . . . . . . 215
12.1 Knowledge Transfer Between Projects By Individuals . . . . . . . . . 221
12.2 Effective Knowledge Transfer Between Projects . . . . . . . . . . . . 222
xii

Abstract
This work analyses the current state of the art in the Spacecraft Operations domain.
It reviews the structure and practices within the European space industry and shows
how the industry is generally shaped by national or international non-governmental
organisations. Although it draws most material from the author’s experience in
Europe whilst working on commercial space projects and international scientific
projects, it compares and contrasts this with the US manned space programme and
the Russian space programme.
The space industry in Europe has inefficient working practices and a poor market
structure which lacks incentives. The civil service-based organisations that admin-
ister the majority of national and European space activity have a poor internal
organisation, are often slow to react, exhibit little delegation and reduce individual
initiative. Recommendations are made about industrial policy, and how organisa-
tions should approach risk management and how teams should be formed and should
interact.
The spacecraft and instruments are normally built by specialised teams and
organisations. This results in a conceptual gap between those who acquire knowledge
whilst building and testing the systems and those who will operate the system. It
is necessary to explicitly transfer the knowledge to the operations team, and there
are weak mechanisms for doing so. At the same time, the operations team also has
to prepare the ground segment to control a spacecraft and exploit a payload that,
from their point of view, may be poorly defined.
It is proposed that the traditional paper-based products (user manual and flight
procedures) could be usefully supplemented or replaced by a knowledge base. An
ontology to define a vocabulary is developed and it is shown to facilitate knowledge
capture and exploration. The availability of such a facility would then also assist
xiii

xiv
future missions (or even missions running in parallel) to understand the problems
that their colleagues have, and adapt or incorporate the solution if it was applicable.
There is a significant trend for spacecraft to become more complex and to have
many computers and a great deal of software on-board. This make the system
difficult to operate, and can also lead to unexpected results, since the state space of
a software-driven system is so large. For terrestrial systems, formal methods have
been developed to try to counteract the trend: by proving certain behaviour in the
specification, the number of paths that need to be tested can be significantly pruned.
It is proposed here that formal methods could be adopted to test and communicate
knowledge, as well as to improve the design.
The trend to have increasingly intelligent sub-systems has been occurred in par-
allel to the trend to have increasingly sophisticated data communication. This is
applicable equally to command and monitoring. The information content of param-
eters is analysed, and the content of flags and simple packets is calculated.

Acknowledgements
I would like to thank Tom Bowling, my supervisor, for his many suggestions and
patient support during this rather long research.
Of course, I am grateful to my parents for their patience and love. Without them this
work would never have come into existence (literally). Without my wife, Tatiana,
this would not have been worth doing.
Finally, I wish to thank John and Paulo because they taught me so much, and they
made my job such a pleasure.
David Verrier
April 25, 2001
Vega Group PLC
Welwyn Garden City
xv

Glossary
ASW Address and Synchronisation Word
BCH Bose Chaudhuri Hocquenghem
CCSDS Consultative Committee for Space Data System
CFE Customer Furnished Equipment
CFI Customer Furnished Item
CLTU Command Link Transmission Unit
CRP Contingency Recovery Procedure
DBMS Database Management System
ESA European Space Agency
ESOC European Space Operations Centre (part of ESA)
FCP Flight Control Procedure
FMECA Failure Modes, Effects and Criticality Analysis
FOP Flight Operations Procedures
LEOP Launch and Early Orbit Phase
MSSS Multi Satellite Support System
OCC Operations Control Centre
OSI Open System Interconnection
PCM Pulse Coded Modulation
PCM standard ESA Standard for telemetry and telecommands (superseded)
SCOS Spacecraft Control and Operations System
SQL Structured Query Language
TC Telecommand
TM Telemetry
1

2

Chapter 1
Introduction
’The unexamined life is not worth living.’
Socrates (469 - 399 B.C.)
This work relates the current state of the art in the Spacecraft Operations industry.
It is based on the author’s experience on commercial space projects, international
scientific projects and manned space projects.
1.1 Background
The author’s experience after more than 15 years in the space industry is that space
projects are usually last a long time and have a lot of people working on them. Even
though the recent experience indicates that rather more consideration is given to
designing spacecraft that can be operated easily than used to be the case, the author
identifies a number of factors that tend to make the spacecraft operations difficult:-
• Launch-centric view of the space-project.
• Fluctuating participation in development life-cycle leads to a lack of continuity
in people and knowledge across the project.
• People perform different roles, have different viewpoints and use a different
vocabulary at various stages in the development. This leads to a perception
3

4
Design and
ManufactureOperationsLaunch
Industry Launch Authority
Operator
Operations are given less emphasis
Highly visible areas
The most visible aspect of a space mission is the launch. Some people are alsoaware that engineering goes into the design, integration and test of a spacecraft,but historically the importance of operations have been neglected.
Figure 1.1: Classical View of Spacecraft Engineering
gap, a difference between the logical understanding of different people who are
really talking about different parts of the same whole.
• Structural and organisational problems lead to a lack of knowledge sharing
across the project.
1.1.1 Launch-centric view of space projects
Many people seem to consider that the most difficult part of the project is when the
spacecraft is designed, built, integrated, tested and launched. Some people actually
consider that this is the whole project and that what comes after the launch is
almost unconnected with what happens before the launch. However, this viewpoint
is inconsistent with the actual purpose of the spacecraft: usually to gather data or to
perform some other service or task. After launch, the industrial team that built the

5
satellite starts to run-down, with the more experienced people usually being the first
to leave a project, since they are most in demand else-where. Within the author’s
experience,it is even known for the management team to change or run-down before
the spacecraft is launched, long before it can reveal any scientific results or enter
into service, and so before it is revealed whether the decisions that were taken during
the development were correct. This is a clear indicator that the operations phase is
not given a very high priority.
This launch-centric view is shown in Figure 1.1. This can be highly imbalanced,
since the whole reason for building and launching the spacecraft was to perform a
purpose and return some results, but also the post-launch phase is usually at least
as long as the pre-launch phase. It is also worth noting that the tasks of building,
launching and operating the satellite are very often performed by different teams.
This is true for most American missions (commercial or military), Russian missions
(still mostly military or defence-oriented) and European missions.
Most of the remaining factors are linked to reducing the knowledge transfer either
from one project to another or through time on the same project.
1.1.2 Fluctuating Participation Throughout Project Life-Cycle
The people who design the satellite systems are usually different from the people
who build and integrate it, and in turn it is frequently the case that yet another a
different group operates the satellite. This is virtually always the case in missions
operated by the European Space Agency, ESA, where there is usually also a separate
ESA team managing the procurement of the satellite (and payload).
After the launch, the industrial team that assembled the spacecraft disbands and
the management team is assigned to another project. During the duration of the
procurement, technology continued advancing and so it is rare for a completely new
project to use the same kind of technology as a previous project. Whilst a particular

6
technology (e.g. microprocessors with the mil-std-1750 instruction set) is used on a
number of different project in parallel, different projects apply it in different ways
and so build up different sets of experience. Unfortunately, the lifetime of a project
is often comparable to the lifetime of the technology, so very few people get to use
the same technology again. However, they have gained a particular experience and
overcome certain problems, and so on their next project, there may be a tendency
to carry out a strategy to mitigate against problems with a previous technology that
may never occur with the new technology.
1.1.3 Different Roles Have Different Viewpoints and Vocab-ulary
Another factor that seems to have become a problem is that people and jobs have
become increasingly more specialised. This leads them to take a particular view of
the spacecraft and can easily lead to the situation where different specialists cannot
understand each other’s points of view. The partial antidote to this situation is
the systems engineer, who is supposed to be able to take an overview of all of the
areas and have a high-level understanding of the main problems in each domain.
Specialists also tend to develop their own vocabulary and jargon, which although it
might make it easier for them to do their job, also acts as a barrier to communication
across disciplines.
A further complication is that all of these points of view need to be explained to
the operations team. The operations team normally has least insight into the details
of the spacecraft, often never actually seeing the real flight hardware and having to
build up a knowledge base from formal documentation and information transfer.
The operations team normally starts out quite small, and then slowly increases in
size as launch approaches. Their initial vague ideas slowly materialise with time as
the actual hardware is manufactured and assembled, and as they get more contact
with the documentation and perhaps even with with the satellite. However,they

7
can never reach the same level of knowledge and understanding as a specialist who
designed the spacecraft system. It may be more, or it may be less, but it is never
the same. This process leaves a perception gap, a difference between the logical
understanding of different people who are really talking about different parts of the
same thing. The various specialists may not fully understand each others problems,
and the operations team may not understand every facet of how the spacecraft
works.
1.1.4 Structural and Organisational Problems
Many projects use equipment that is more or less standard, and then introduce some
modification to it to tailor it to the specific mission, often including renaming the
unit.This makes it more difficult for other people see the heritage of a particular
unit, and thus makes it very difficult for people who work on one project to learn
from other projects. If a third mission comes along, it is unclear if the technology
is appropriate.
Another way in which the long project durations block knowledge transfer is
because it results in de-skilling. If people stay attached to one generation of tech-
nology, since technology progresses continually, this means falling behind the current
technology, giving reduced innovation and an overall loss of technical skills. The fact
that people tend to stay on one project means that they can build up considerable
knowledge and experience on that one project. The question is, who does this bene-
fit? The only opportunity to transfer information is at the end of the project, when
people are redeployed from one project to another. Figure 1.2 shows the problem.
This transfer is ineffective, since it relies on vacancies in new projects becoming
available at the same time as other projects are ending, and also as mentioned be-
fore, the technology base will have changed. Furthermore, if the development and

8
OperationsIntegration
and Verification
Design Manufacturing OperationsIntegration
and Verification
Design Manufacturing
OperationsIntegration
and Verification
Design Manufacturing OperationsIntegration
and Verification
Design Manufacturing
OperationsIntegration
and Verification
Design Manufacturing OperationsIntegration
and Verification
Design Manufacturing
Individual Learning
Time
Knowledge transfer that relies on individuals from the development team movingfrom one project to another has several disadvantages:- (i) it does not include thefinal evaluation of the design in operations; (ii) it is very slow, since it can takeplace after the development is completed; (iii) it does not benefit projects that runin parallel, which are most likely to be using similar technology.
Figure 1.2: Knowledge Transfer Between Projects By Individuals
operations teams are separate, then the developers will not have any real-world feed-
back on how their design performed and whether or not their decisions on the design
and implementation were correct.
1.2 Increasing Knowledge Transfer
This thesis proposes several ways to improve the knowledge transfer within the
contemporary industrial situation and organisational frameworks that exist in the
European space industry. It is shown that the current organisations are often not
ideally suited to their responsibilities and functions, but this is accepted as a con-
straint. Trying to change the current political and industrial situation is regarded
as out of scope.
The author identifies that in his experience, many projects have failed to learn
from each other. There are many reasons why this is so, but some of the main
reasons are:
9
• Poor allocation of manpower
• Inability to share knowledge within a project
• Inability to share knowledge across projects
1.2.1 Manpower Allocation
Since projects run over such long periods of time, it is too expensive to have the
specialists available all the time and difficult to allocate the specialists when they
are needed. The industrial consortia that manufacture satellites have an incentive
to use their staff with good reputations to bring in new work, and then to try to get
the work done as cheaply as possible. This usually means that most of the work is
performed by people with much less experience.
At the same time, in the operations field, the peak in the manpower demand usu-
ally occurs during the launch and entry into service. This means that the operations
team usually starts off small, and then gradually increases until launch, and then
slowly decreases. It is the author’s personal experience that many organisations try
to absorb this temporary increase in staff by using external consultants. This can
mean that the consultants get to work in launch preparation and the Launch and
Early Orbit phase (LEOP) and then they are no longer required and they usually
leave to work on another project.
However, it is precisely during the LEOP when there is most opportunity for
learning and for judging whether or not the design decisions that shaped the space-
craft and ground segment design were correct. The consultants then join another
project as it builds up its manpower profile, and often have to live with the same
mistakes as were discovered in the project that they had just left, or discover that
the new project has implemented a completely new and different solution to an issue
that was also addressed on the previous project. This can lead to the situation where

10
a lot of the knowledge that is transferred from one project to another is only trans-
ferred via temporary workers, and most knowledge gained from the critical project
phases is actually stored outside the organisation. This leads the organisation to
become very dependent upon external companies and people.
1.2.2 Knowledge Sharing Within a Project
The author has known many projects where there was no overall spacecraft database
of telemetry and telecommands. Often there were several, overlapping databases,
where some of the data was stored, but there was initially no single configuration-
controlled place where all teams could refer to for telemetry and telecommands.
This is so fundamental to information sharing that most operations centres known
to the author have realised that this is a problem and try to insist that there is
a project-wide database. The European Space Agency ESA is proposing a stan-
dard format within the framework of the Consultative Committee for Space Data
Systems, CCSDS. However, sometimes there can still be a problem with inherited
systems. For example, on projects with a long duration or with multiple generations
of spacecraft, the operations team might have an old control system (along with an
old database format) and then the manufacturer or one of the payload providers
might offer a spacecraft database that is incompatible with the existing system in
some respect (e.g. identifier length or content). This can result in the operations
team using a different set of identifiers from the design or integration teams, which
results in much more work for everybody, as well as a clear loss in transparency.
1.2.3 Knowledge Sharing Across Projects
It can be very difficult for one project to learn from another project. The author’s
experience indicates that unfortunately this is as applicable to projects running in
parallel as it is to projects running in series. Currently much re-use takes place either
by re-using the technology ’as-is’, or by re-using the specification as it was at the

11
Project A
Specification
Project A
Design
Results
Experience
Project BProject B
Design
Specification
Results
Experience
Internalfeedback
Internalfeedback
High valueknowledgetransfer
Projects start of with a specification and then a design is conceived to satisfy thespecification. This may generate some internal feedback which may (or not) resultin an updated specification or the decision to use ”as-is”. The design is then putinto service operationally which generates experience. This will generate feedbackinto either the design or perhaps even the specification. This feedback is valuableto any other project, since it shows what went wrong and what the team had tochange (or would have changed if it had been able to). This prevents mistakesbeing repeated.
Figure 1.3: Critical Knowledge Transfer Between Projects
beginning of the project. This means that it is very difficult for a project to benefit
from the actual experience that has been gained by another project. What would
be really useful to follow-on projects would be to know the changes that the earlier
project had to make during the design, why such changes were necessary, and what
they would try to do differently if they had the opportunity (see Figure 1.3. For
them, it is hindsight, but for the upcoming project, it is foresight! Unfortunately, it
can be a non-trivial amount of work to perform such a review,and the old project
has no immediate benefit and so no strong incentive to perform it.

12
1.3 Structure of this Thesis
Chapter 1 is this introduction to the thesis. Chapter 2 introduces the Space Business,
and outlines some of the problems that can occur during a space project. It explains
why the people who operate a spacecraft are rarely the people who built it.
Organisations are one of structures which provide the context for the spacecraft
operations. Typically spacecraft operations are performed in teams within substan-
tial organisations. Chapter 3 discusses the roles of the individual members of the
team, the actors who perform these roles, and takes a critical look at some of the
organisations in which these people perform their roles.
Risk is present in every kind of business or activity. Chapter 4 discusses the nature
of risk, how it can occur in space programmes and methods used to manage the risk
inherent in space exploitation. It shows that humans are often very poor judges of
probability and of the risk that ensues. This is also a new application of existing
methods.
Chapter 5 shows how many organisations prepare for the launch or entry into service
of their satellites. It also looks at how the valuable knowledge gained during design,
manufacture and testing of the satellite is transferred to the people who actually do
the operations of the satellite when it is in orbit.
Computer systems are used to control the satellites and payloads before and af-
ter launch. In Chapter 6, the two systems are compared, found to have much in
common, and it is proposed that cost-savings could be made via a common, or har-
monised, development. This idea probably even pre-dates the author’s entry into
the space industry, but it is still a very topical question, since almost no projects
have made use of the commonality approach. The author is working on a European
scientific project to try to implement this strategy and realise the cost-savings.
Chapter 7 illustrates how the vocabulary used varies from one mission to another,

13
and how this can be a barrier to prevent the benefits of experience being passed
around. This introduces the concept of an ontology to manage the knowledge,
which is a novel application of a technique well-known in the circles of artificial
intelligence.
Formal Methods are introduced in Chapter 8 as one possible solution to the problem
of transferring knowledge across time and place as is required on modern space
missions. Formal methods are techniques which have been used for many years in
the fields of software specification and high-reliability computing, and this Chapter
adopts one particular method to show the benefit of a precise specification.
Complexity is one of the factors against which operations engineers must struggle
throughout the project, both before and after launch. In Chapter 9 the author
discuses the sources of complexity, and strategies for reducing the rate at which
complexity makes itself felt. This is an innovative look at the problems associated
with remote command and control.
Satellites are controlled and monitored in-orbit by a ground system via radio signals.
Chapter 10 gives a brief introduction to the systems that are used in western Europe
for this purpose and shows how they transfer information from the space segment
to the ground segment. This is a fairly standard introduction to current practice.
In Chapter 11 the Shannon Information of a fixed format telemetry system is cal-
culated and compared with a packet system, and an event-driven packet system. It
is shown that the information scales much better with packet-based systems. This
is an original result which is the sole work of the author.
Chapter 12 discusses the results of all the Chapters and brings together the individ-
ual threads of each Chapter. Chapter 13 presents a summary, a shortened discussion
and recommendations for further work.

14

Chapter 2
Space Projects
2.1 Introduction
This Chapter gives a high-level overview of the space business. Section 2.2 looks at
how the industry is structured in Europe and why the people who operate satellites
and space systems are rarely the people who design and build the satellites and
payloads.
The following section, Section 2.3, shows who participates in the spacecraft life-
cycle, how the participation varies from one phase to another, and why this can be
a problem.
Section 2.4 discusses mission operations. It proposes an ’Operations Model’ by
comparison with several protocol models that have been developed in industry. Us-
ing this, it is possible to see which areas are already covered international standards
and which areas are left for individual missions to design and implement themselves.
Sections 2.5 and 2.6 look at commonality in the mission operations concept across
different missions, and then at the differences.
Section 2.7 concentrates on Europe and looks at how the industry operates in a
distorted market place and some of the conflicts and inefficiencies that can result.
15

16
2.2 The Space Business
Many missions fly for many years (e.g. ten years is almost the minimum for a
telecommunications satellite, with consumables such as fuel often sized for many
more years). Before launch they all have a test and integration phase that lasts
several years. Often the design of the sub-systems is started much earlier, and it is
not unknown for negotiations prior to the start of design work to last more than one
year. When Cluster 1 was destroyed in an explosion shortly after launch on the first
Ariane 5 flight, V501, some experimenters had already been working on the project
for fifteen years.
Historically, most of the companies and organisations that build spacecraft have
been hardware-oriented, and have had little experience or desire to participate in
the development of software systems or to participate in mission operations.
Within both ESA-driven missions and commercial procurements, the activities
associated with mission operations and those with design, integration and test have
been separated almost from the very start of a satellite procurement. This division
of the procurement into separate satellite engineering and operations activities can
be the source of many problems, inefficiencies and duplication of effort. For exam-
ple, the prime contractor needs to develop and maintain a system for testing the
performance during spacecraft integration and launch site activities. At the same
time, the operations team needs to produce a control system that will be used to
operate the satellite and payload after launch. As a consequence, the operations
team has only a few opportunities to test the control system with the real hard-
ware before launch, and so it is often necessary to produce a software simulator of
the satellite and instruments to test the control system and train the flight control
team. This division can also lead to the situation where the project management
views the operations preparation as being somehow less important than the satellite
integration activities.

17
However, this separation is likely to continue, because it sometimes make sense!
In a similar way to the aviation industry, the manufacturers specialise in the man-
ufacture of the flight hardware, but do not expect to operate it, although there are
evidence of a trend for them to become involved more actively in the maintenance
activities. Even though it might not be the theoretical optimum, industry must
continue from where it actually is, not where it should be. Most organisations that
want to operate satellites are already operating satellites built by various manufac-
turers, and so already have considerable ’sunk costs’ in the investment in people
and control systems, and so they do not want to (or cannot reasonably) change to a
whole new control system every time they take a satellite from a new manufacturer,
and nor do they wish to become chained to a single manufacturer. This means that
they either have to adapt their existing infrastructure to the new satellite, or specify
modifications to the satellite so that it suits their infrastructure.
2.3 Space Project Life Cycle: Who, What and
When
This section includes a description of the life cycle of a space project, the types of
resources that must be monitored and controlled for a mission and the types of users
(referred to as agents) that monitoring and control the activities of the resources.
The prime contractor, sub-system manufacturers or instrument teams use a
checkout system (usually referred to as the Central Checkout System, CCS) during
the following phases of the project life cycle:
1. Development and test of individual units
2. Integration and test of subsystems at system level
3. Integration and test of payload at system level
4. Test of the fully integrated spacecraft as a complete mission system
18
InstrumentorSub-system Test
EquipmentTesting
Monitor andControl flow
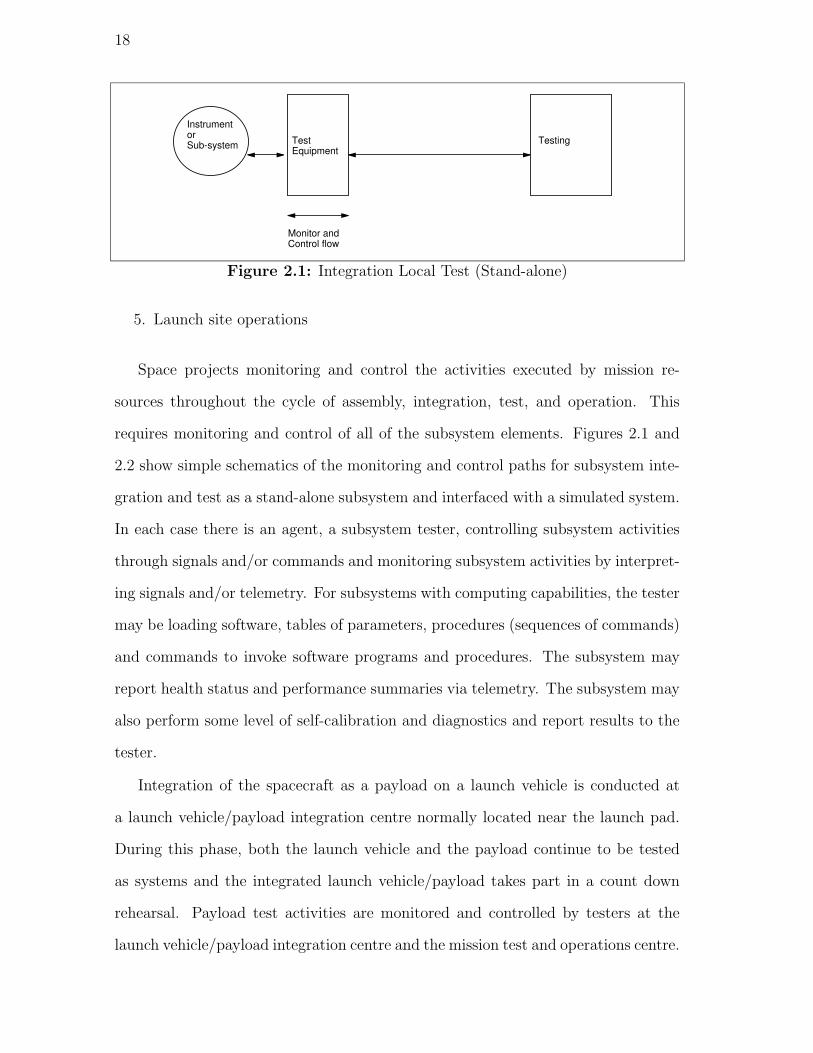
Figure 2.1: Integration Local Test (Stand-alone)
5. Launch site operations
Space projects monitoring and control the activities executed by mission re-
sources throughout the cycle of assembly, integration, test, and operation. This
requires monitoring and control of all of the subsystem elements. Figures 2.1 and
2.2 show simple schematics of the monitoring and control paths for subsystem inte-
gration and test as a stand-alone subsystem and interfaced with a simulated system.
In each case there is an agent, a subsystem tester, controlling subsystem activities
through signals and/or commands and monitoring subsystem activities by interpret-
ing signals and/or telemetry. For subsystems with computing capabilities, the tester
may be loading software, tables of parameters, procedures (sequences of commands)
and commands to invoke software programs and procedures. The subsystem may
report health status and performance summaries via telemetry. The subsystem may
also perform some level of self-calibration and diagnostics and report results to the
tester.
Integration of the spacecraft as a payload on a launch vehicle is conducted at
a launch vehicle/payload integration centre normally located near the launch pad.
During this phase, both the launch vehicle and the payload continue to be tested
as systems and the integrated launch vehicle/payload takes part in a count down
rehearsal. Payload test activities are monitored and controlled by testers at the
launch vehicle/payload integration centre and the mission test and operations centre.

19
InstrumentorSub-system Test
EquipmentTesting
Monitor andControl flow
SimulatedControl andMonitoring
SimulatedSystembehaviour
EnvironmentSimulation
Figure 2.2: Integration and Test (in Simulated System)
Monitoring and control techniques used in this phase are similar to the ones used in
spacecraft integration and test.
Finally, mission operations begin after the payload (from the point of view of
the launcher, this is the entire spacecraft + instruments/payload) has separated
from the launch vehicle. The mission operations centre monitors and controls both
the spacecraft and the ground terminals used to track and communicate with the
spacecraft. Monitoring and control techniques used in this phase usually include all
those used in ground testing, the major difference being that there is no support
equipment to control or monitor. The control centre uses one or more dedicated
Mission Control Systems to control the satellites in flight.
In order to achieve the objectives of a space project, the activities carried out
through the mission resources must be controlled and monitored. In the past, most
of the agents monitoring and controlling mission resources have been people. It
is now increasingly common that tasks be divided between people and computers,
so the term agents is used in preference. The different types of mission resources
and the agents that monitoring and control them are discussed in the following
paragraphs.

20
2.3.1 Resources
Taken as a set, the systems employed to execute a mission (e.g., spacecraft, launch
vehicle, ground terminals, launch pad facility) are the mission resources. Different
types of systems are employed throughout the life cycle of a project, yet the tech-
niques for the monitoring and control of those systems have many common factors.
The reasons for this commonality can be explored by considering that these systems
each consist of subsystems that, in turn, consist of components.
Monitoring and control in space missions can be performed at the system, sub-
system, or component level and is frequently performed at all levels simultaneously.
To the extent that monitoring and control is done at the component level, the mon-
itoring and control problems and techniques used to address them are the same
for similar component types even though they are part of different systems. Dif-
ferent component types may have different monitoring and control problems and
techniques.
As the level of monitoring and control moves up to subsystem and system level,
the monitoring and control problem is less tied to the type of components. The
monitoring and control problem can be dealt with in terms of higher-level abstrac-
tions (such as ’system functions’ or object characteristics and behaviours). Such
abstractions may be absolutely necessary if the typical agents monitoring and con-
trolling subsystems or systems are not intimately familiar with the components that
make up those subsystem or systems.
2.3.2 Agents
As discussed in the previous section, there are many different agents monitoring
and controlling mission resources during the life cycle of a space project. These
agents can be categorised by the roles they play in the life cycle, and by the mission
resource they monitoring and control. The author, together with colleagues at the

21
Time
Time
Time
Time
Sub-systemDevelopment
Assembly, Integration & Test (AIT)
LauncherIntegration
Launch &Early OrbitPhase(LEOP)
MissionOperations
Experts
Maintainers
Operators
Integratorsand testers
This figure shows how the participation of the different categories of people variesover the project life cycle.
Figure 2.3: Participation in the Project Life Cycle
European Space Agency, has developed the following set of agent categories. The
level of participation of each type of agent in each project phase are depicted in
Figure 2.3.
Experts: These agents supply expertise on the characteristics and be-
haviour of mission resource components, subsystems, or sys-
tems. Typically they design the mission resources and assist
in their integration and test. They may have need to mon-
itoring and control mission resources during operations in
order to respond to anomalies. They may do this from a
mission operations centre or from a remote site via a link to
a mission operations centre.
Maintainers: These agents maintain any mission resource components,

22
subsystems, or systems that need attention in order to con-
tinue performing to specified requirements. Their location
depends upon which resource they are maintaining. For the
control system, they will usually based at a mission opera-
tions centre, but may also perform work ’on site’ for ground
terminals or at the home institute for payload team mem-
bers.
Operators: These agents operate the mission resources (e.g., spacecraft,
checkout equipment, and ground facilities terminals) in or-
der to achieve the mission objectives. They typically moni-
toring and control activities abstracted to the subsystem and
system levels. They usually perform their function from a
mission operations centre, but may perform work ’on site’.
Integrators and Testers: These agents put together subsystems and systems and test
them to create delivered mission systems to support the
achievement of mission objectives. Typically these agents
are mainly involved with mission systems early in their life
cycle, however integration and testing of new capabilities
can continue during the operational phase of a project, par-
ticularly for resources designed to support multiple missions.
This may include teams of scientists and researchers operat-
ing within their own institute, as well as sub-system devel-
opers. These agents usually perform their functions from a
test and operations facility. For self-testing subsystems and
systems, the agent may be an automated agent operating
within the subsystem or system.

23
2.4 Mission Operations
This section discusses several views of space mission operations in order to explain
in detail the context in which space mission resources are monitored and controlled.
The author found it interesting to analyse the overall system by dissecting it into
layers. This approach was developed by analogy to common practice in the commu-
nications industry with great success.
The Open System Interconnection (OSI) reference model describes how informa-
tion from a software application in one computer moves through a network medium
to a software application in another computer. It is a conceptual model composed
of seven layers, each specifying particular functions. The model was developed by
the International Organisation for Standardisation (ISO) in 1984, and it is now con-
sidered the primary architectural model for inter-computer communications. The
OSI model divides the tasks involved with moving information between networked
computers into seven smaller, more manageable groups of tasks. A task or group
of tasks is then assigned to each of the seven OSI layers. Each layer is reasonably
self-contained so that the tasks assigned to each layer can be implemented inde-
pendently. This has the advantage of decoupling layers as much as possible, so that
technical solutions offered by one layer can be changed or updated without adversely
affecting the other layers. A given layer in the OSI model generally communicates
with three other OSI layers: the layer directly above it, the layer directly below it,
and its equivalent layer in other networked computer systems. Table 2.1 details the
seven layers of the Open System Interconnection (OSI) reference model
The users should, according the OSI model, only interface with each other at
level 7, and leave the intermediate details to the other layers. The OSI model
is a theoretical model which has a few implementations, although none of them
implement the whole stack of 7 layers. The most faithful implementation was the
x.25 set of communication standards, which was very successful for a number of

24
Name Description7 Application End user services6 Presentation Data problems and data compression5 Session Authentication and authorisation4 Transport Guarantee end-to-end delivery of packets3 Network Packet routing2 Data Link Transmit and receive packets across a physical network link1 Physical The cable or physical connection itself
Table 2.1: OSI Reference Model
Name Description7 Application6 Presentation5 Session4 Transport3 Network Packet Layer protocol PLP2 Data Link Link Access Procedure, Balanced LAPB1 Physical Serial standard X21bis
Table 2.2: X.25 Implementation of OSI Reference Model
years, and is still used widely. As can be seen in Table 2.2, it only addressed the
lower three layers.
This means that any applications that communicate via X.25 have to handle
the tasks that are attributed to the layers 4,5 and 6 themselves. It is interesting
to compare the implementation of X.25 with a more modern competitor, TCP/IP.
Internet protocols were first developed in the mid-1970s, when the Defense Advanced
Research Projects Agency (DARPA) became interested in establishing a packet-
switched network that would facilitate communication between computer systems
consisting of different hardware and software. The result of this development effort
was the Internet protocol suite, completed in the late 1970s. TCP/IP later was
included with Berkeley Software Distribution (BSD) UNIX and has since become
the foundation on which the Internet and the World Wide Web (WWW) are based.

25
Name Description7 Application Telnet, FTP, SMTP,6 Presentation5 Session4 Transport Transmission Control Protocol TCP,3 Network Routing protocols, IP, Address Resolution Protocol, ARP2 Data Link not specified1 Physical not specified
Table 2.3: TCP/IP Suite and OSI Reference Model
As can be seen from 2.3, the TCP/IP suite only implements a few layers in the OSI
reference model, but it still became very widely used.
TCP forms part of the Transport Layer of the OSI Model, and splits the format-
ted application data up into segments. It provides connection orientated, acknowl-
edgement and reliable transport services between end hosts. In layman’s terms, it’s
responsible for establishing and maintaining the connection until data exchanged by
application programs is complete, guaranteed delivery of data and for reassembling
the data segments back into the order in which they were sent.
Internet Protocol or IP is part of the Network Layer of the OSI Model. IP is
connectionless. Each packet is treated independently from others. IP is responsible
for the delivery of data, via routing and logical addressing.
The Link layer, level 2, is not addressed by TCP/standards, and so every com-
puter has the freedom, and the duty, to implement the services necessary to interface
the Network layer in any way it pleases. This is normally handled by the Operating
System device driver interface to the network interface on the computer. It is inter-
esting to note that the standard applications, such as Telnet or ftp only allow the
user to perform very simple, almost atomic tasks, however, by luck or design they
were what people wanted to do between computers that were networked. Telnet is
a way of getting a command prompt on a remote machine (”get me there”) and the

26
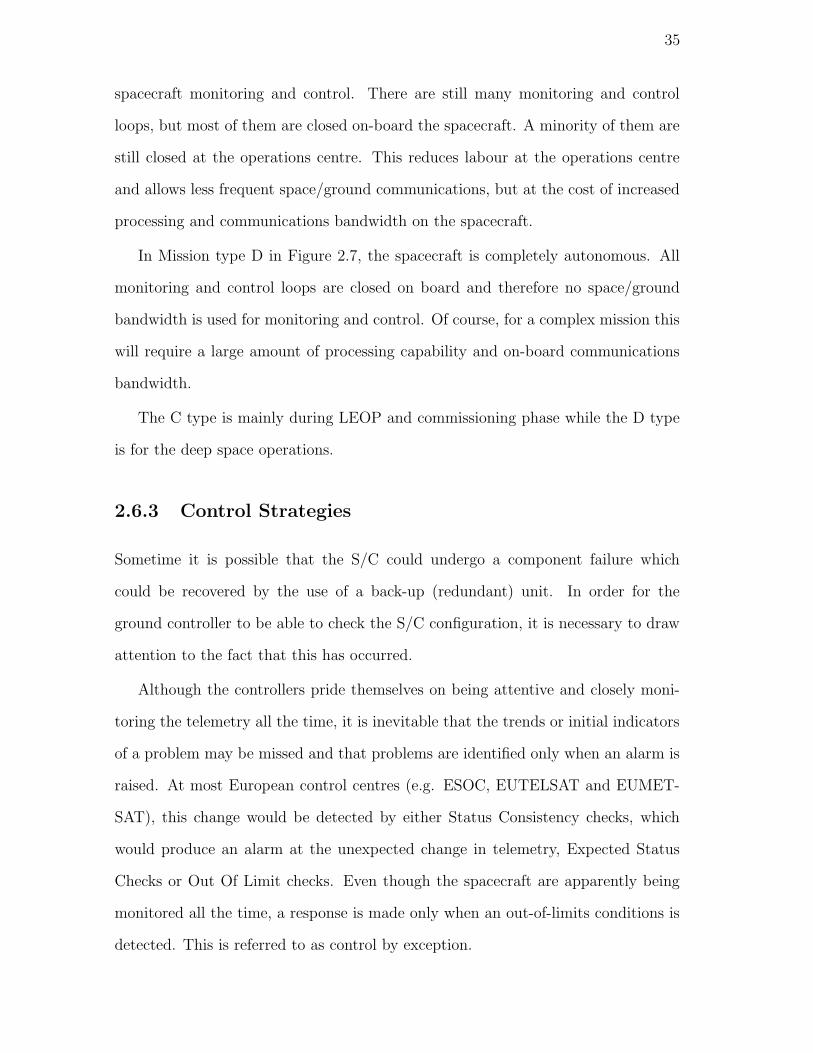
Name Description6 Activity Mission Specific Operations5 Decision-Support Monitor and Control Applications4 Message Packet Utilisation3 Data Link Telemetry and Telecommand Packets2 Coding Encoding scheme1 Physical Radio Frequency Modulation
Table 2.4: Theoretical Spacecraft Operations Model
File Transfer Protocol ftp is way of getting data that is on a remote machine sent
to the local machine (”bring something here”).
It is interesting to draw parallels between the communication industry and the
space industry. The author developed Table 2.4 as an ”Operations” model to com-
pare and contrast it to the implementations of the OSI model.
As with the OSI model, for each layer of the model, components in one stack can
communicate with the equivalent component in another stack without knowledge
of the underlying mechanisms to transfer the data. Similarly, each layer must be
able to pass information one layer up or down, but the design should precludes the
need for individual layers to have any greater scope. Table 2.5 shows that many
of the lower layers of the model stack have already been specified by various or-
ganisations. Initially this was performed by military or national organisations such
as ESA and NASA, but these standards have generally been superseded by wider
multi-party CCSDS (Consultative Committee for Space Data System) recommen-
dations. However, it is noteworthy that the upper levels of the Operations Models
remain mission-specific.
In the same way as Telnet lets the user behave is if he or she is actually sitting
in front of the remote computer, the different layers interact to shield the user
from the complexity of the data transfer. For example, an agent (perhaps the
scientific user in their home institute) has a virtual path to the resource (their

27
Name Description6 Activity Mission-specific operations5 Decision-Support Mission-specific Monitor and Control Applications4 Message Standard: Packet Utilisation Standard
(and mission-specific extensions)3 Data Link Standard: Telemetry and Telecommand Packet Standard2 Coding Standard: Encoding scheme1 Physical Standard: Radio Frequency Modulation
Table 2.5: Spacecraft Operations Model and Available Standards
payload instrument), even though in practice the telecommands may be routed
via a central mission control centre, a ground station, the spacecraft before finally
arriving at the instrument. The same also applies to data downlink, of course.
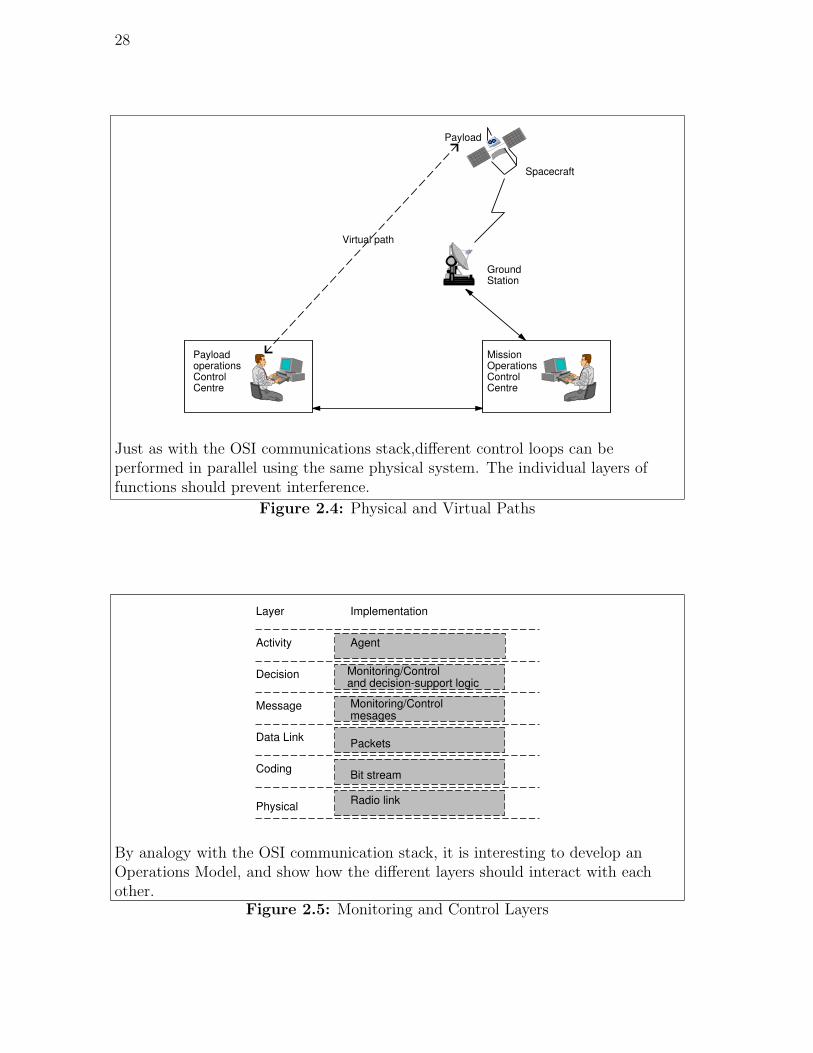
Figure 2.4 shows a simple schematic of the major flight and ground systems of a
space mission operation (a similar setup for a checkout system can exist before launch
by replacing the Payload Operations Centre with a Payload Checkout System).
Some of the monitoring and control of the ground station, spacecraft, and payload
are carried out over ’virtual paths’ from the payload and S/C operations centres.
Some level of autonomy resides in the spacecraft and the payload, allowing local
monitoring and control.
This concept of an Operations Model can be neatly fitted in with the high-level
concept of agents and resources that was introduced earlier. If the agent wishes
to do something with the resource (e.g. an instrument), she interfaces through the
layer with the decision support layer (e.g. a control system). This layer contains the
applications that provide decision support logic to assist the agent in the monitor-
ing and control process. These applications are programmed to determine whether
commands are safe and effective, to compare monitoring data against expected re-
sponses or states, and to automatically respond to certain monitoring data by issuing
commands.
As shown in Figure 2.6, the monitoring and control functionality is built upon
28
PayloadoperationsControl Centre
Mission OperationsControl Centre
Ground Station
Spacecraft
Payload
Virtual path
Just as with the OSI communications stack,different control loops can beperformed in parallel using the same physical system. The individual layers offunctions should prevent interference.
Figure 2.4: Physical and Virtual Paths
Physical
Coding
Data Link
Message
Decision
Activity Agent
Monitoring/Controland decision-support logic
Monitoring/Controlmesages
Packets
Bit stream
Radio link
Layer Implementation
By analogy with the OSI communication stack, it is interesting to develop anOperations Model, and show how the different layers should interact with eachother.
Figure 2.5: Monitoring and Control Layers

29
Physical
Coding
Data Link
Message
Decision
Activity Agent
Monitoring/Controland decision-support logic
Monitoring/Controlmesages
Packets
Bit stream
Radio link
Layer Implementation
Resource
Monitoring/Controland decision-support logic
Monitoring/Controlmesages
Packets
Bit stream
Radio link
Implementation
Each level in this Operations Model should directly interface only with the layersabove and below it, and should carry out a dialogue with the equivalent layer inthe the next protocol stack. This could equally apply to the interaction betweenthe ground control team and the spacecraft,or the spacecraft control software anda payload.
Figure 2.6: Interfacing Monitoring and Control Layers
the messaging services in the the messaging layer. These messaging services are the
mechanisms that provide a consistent way to communicate monitoring and control
information. Monitoring and control information is placed in or extracted from
messages at both the agent and resource conducting the monitoring and control
dialogue. The implementation details of the service are hidden from the agent.
Underlying the service are two way flows of messages that consist of requests and
responses similar to the concepts of the client/server model.
The underlying flows of messages use the data link, coding and physical layers to
get the messages to the intended recipient, the resource. The concept is extensible,
in that the target resource could also be, for example, the onboard data handling
system of the spacecraft, which is a resource when viewed from the ground, but
can also perform as an agent with respect to another resource such as a scientific
instrument. Some common monitoring and control functions can be executed either
on ground or on-board and so ideally the same monitoring and control interface

30
definition language can be used.
2.5 Operations Commonality
This section discusses the system from the spacecraft operations point-of-view. It
describes features that are common to all spacecraft mission operations and those
features that will vary from mission to mission. These views define the space mission
operational environment in which the layered monitoring and control and commu-
nication functions must be performed.
Spacecraft engineering operations can be categorised into a few functions that
are common to all space missions. These functions are ’end-to-end’, that is, they are
performed by coordinated activities at both the operations centre and the spacecraft.
For any given mission the allocation of activities between the operations centre and
spacecraft may differ, however these end-to-end functions are done for all space
missions supporting a payload.
1. Orbit/Trajectory which includes those functions necessary to place the payload
in the proper position/velocity in space
2. Attitude/Pointing which includes those functions necessary place the payload
in the proper orientation
3. Power which includes those functions necessary to supply the payload with
sufficient power,
4. Thermal which includes those functions necessary to maintain the payload
within allowable temperature range,
5. Data Handling which includes those functions necessary to exchange data be-
tween payload elements, transform payload data, associate payload and space-
craft data, or preserve payload data.

31
6. System Executive which coordinates the functional areas listed above to the
extent necessary to achieve space mission objectives. On a manned mission,
this will include the crew members.
7. Life Support Systems are an additional requirement for manned missions,
to provide a benign environment containing the correct availability of Oxy-
gen,water, food, etc and waste removal.
2.6 Mission Differences
Although the end-to-end functions are common to the spacecraft operational envi-
ronment for monitoring and control, there are significant differences from mission
to mission in requirements on monitoring and control loop performance and con-
straints placed on monitoring and control loop implementation by processing power
and communication bandwidths available from the mission resources.
2.6.1 Monitoring and Control Loops
The monitoring and control dialogue between the agent and the mission resource
form a monitoring and control loop. The loop consists of a control instruction (e.g.
command) sent from the agent to the mission resource, the execution of the instruc-
tion by the resource and an optional response (e.g., monitoring information) from
the mission resource to the agent indicating the results of the executed instruction.
If the mission resource is required to respond this is ’closed loop’, if not it is ’open
loop’.
In closed loop control, the mission resource response may give rise to another
command when the agent monitors it and the cycle around the loop repeats itself.
The total monitoring and control dialogue for any given mission is made of many of
these loops and repeated cycles around the closed loops. The requirements on time-
liness of exchanges of information in these loops is driven by the mission objectives.

32
Tightly coupled closed loops are necessary to execute some types of dynamic control
or to protect mission resources in case of anomalies. Other loops may be loosely
coupled closed loops or open loops. Tightly coupled closed loops are characterised
by short turnaround times and/or intensive exchange of monitoring and control in-
formation. Loosely coupled closed loops are characterised by long turnaround times
and/or sparse exchange of information.
Several different kinds of closed loop control may be distinguished. At the sim-
plest level, the agent monitors the telemetry, observes that a change is needed and
sends commands that will carry out the change. The agent can monitoring the
desired change throughout the dialogue. This is a case of direct control.
The next case is when the agent sees that a change is necessary, and sends
commands that will result in this change being carried out. To close the loop, the
resource should report back that the change has been completed. This is supervisory
control.
At the extreme level, the resource can monitoring itself, and report back to the
agent that it believes that everything is in order, or even only reports to the agent
when it needs assistance. This is autonomy, a strategy of great inherent risk, since
the system must monitoring its own health, and there are risks that for example,
one failure might mask another.
The system should allow for these variations in monitoring and control loop
requirements by allowing for distribution and portability of monitoring and control
applications across the set of mission resources. Note that space missions that have
little space/ground communications bandwidth available to support the monitoring
and control dialogue, that have long periods when space/ground communications
links or not available, or that have long two-way communication times are, in general,
forced to close the more critical monitoring and control loops on board the spacecraft.
This will be discussed more in the next section.

33
2.6.2 Available Bandwidth and Processing Power
For checkout operations there will be little or no reason to consider processing power
or communication bandwidth limitations. However, for space systems, limitations
(sometimes severe) are placed on computer, memory, and communications resources
due to mass and power available and the radiation environment of space. The impact
of this upon the mission operations concept is much more severe than the impact
upon the checkout system, so it is possible the the space system can be checked-out
on ground in an unrepresentative way. In this section, this author explains a simple
comparison between mission types that he developed.
Simple missions (type A in Figure 2.7) may have relatively few monitoring and
control loops and need to only close a few of them on-board the spacecraft. These
missions can be accomplished even though there is not much processing power and
not much on-board or space/ground communications bandwidth available to sup-
port monitoring and control applications. As missions become more complex with
relatively many monitoring and control loops, various distributions of monitoring
and control capabilities in mission resources can satisfy mission needs.
Mission type B shown in Figure 2.7 is an example of one design solution that has
been used frequently in the past. The additional monitoring and control loops are
closed at the operations centre, again except for those few that must be closed on
the spacecraft. However, this has become quite labour intensive at the operations
centre and has tended to force almost continuous space/ground communications.
These features drive up mission operations costs and are unacceptable solutions for
most missions being designed to hold down life cycle costs. However, automated
applications at the operations centre acting as monitoring and control agents for
humans can reduce life cycle costs even for these types of missions if the Earth-
Space link availability and bandwidth allows it.
Mission type C (in Figure 2.7) is an example of building more ’autonomy’ into

34
Operations
Center
Spacecraft
Monitor & Control Loops
Monitor & Control Loops
Monitor & Control Loops
M&C Loops
Simple mission, S/C has small on-board
processing power and communications
bandwidth, small space/ground communications
bandwidth
Complex mission, S/C has small on-board
processing power and communications
bandwidth, large space/ground communications
bandwidth
Complex mission, S/C has medium on-board
processing power and communications
bandwidth, small space/ground communications
bandwidth
Complex mission, S/C has large on-board
processing power and communications
bandwidth, no space/ground communications
bandwidth
A
B
C
D
Different types of mission may require different mixtures of on-board control ,on-ground control or control by human intervention. A flexible control strategyshould be able to move fairly easily between human interaction, toground-automation and then to onboard automation. The optimum point will be afunction of the available contact period, the required bandwidth, and the requiredreaction time.
Figure 2.7: Monitoring and Control Loops in Space Mission Operations
35
spacecraft monitoring and control. There are still many monitoring and control
loops, but most of them are closed on-board the spacecraft. A minority of them are
still closed at the operations centre. This reduces labour at the operations centre
and allows less frequent space/ground communications, but at the cost of increased
processing and communications bandwidth on the spacecraft.
In Mission type D in Figure 2.7, the spacecraft is completely autonomous. All
monitoring and control loops are closed on board and therefore no space/ground
bandwidth is used for monitoring and control. Of course, for a complex mission this
will require a large amount of processing capability and on-board communications
bandwidth.
The C type is mainly during LEOP and commissioning phase while the D type
is for the deep space operations.
2.6.3 Control Strategies
Sometime it is possible that the S/C could undergo a component failure which
could be recovered by the use of a back-up (redundant) unit. In order for the
ground controller to be able to check the S/C configuration, it is necessary to draw
attention to the fact that this has occurred.
Although the controllers pride themselves on being attentive and closely moni-
toring the telemetry all the time, it is inevitable that the trends or initial indicators
of a problem may be missed and that problems are identified only when an alarm is
raised. At most European control centres (e.g. ESOC, EUTELSAT and EUMET-
SAT), this change would be detected by either Status Consistency checks, which
would produce an alarm at the unexpected change in telemetry, Expected Status
Checks or Out Of Limit checks. Even though the spacecraft are apparently being
monitored all the time, a response is made only when an out-of-limits conditions is
detected. This is referred to as control by exception.
36
It is the personal experience of the author that some control centres in Russia
have abandoned the routine analysis up TM altogether, and so even switch the
transmitter off, removing all routine contact with the ground controllers. When
an autonomous reconfiguration occurs, the S/C sends a Ground call by turning the
transmitter on and transmitting an identifiable signal. This is subsequently detected
(after an unknown interval) by a ground station, which then makes a full acquisition
of TM. This can be regarded as the ultimate implementation of control by exception.
Note that in this case a full history of telemetry is not available unless it is stored
on-board.
The Russians are in the process of reversing this strategy, partly through the
desire to meet market needs (the new customers are mostly Western, and expect
to be able to monitoring and predict outages before they happen) and partly as a
desire to increase the system reliability.
This author would explain this situation by looking at the underlying economics
of the centralised economy. The Russian production strategy evolved in a time of
central management when the factory was expected to make satellites and the only
customer was the military. There were no penalties for early satellite failure, and
launch costs were not paid by the military. This encouraged the development of
many satellites with relatively short life-times, and some dramatic under perfor-
mances. One example known to the author from his personal experience concerned
a C-Band transmitter being produced by a supplier in Russia in 1998. It had an
expected lifetime of 300 hours. Following the drift to a market economy after the
breakdown of the Soviet Union, that the Russian satellite manufacturer has freedom
to select suppliers and an incentive to do so. They selected an equivalent Japanese
item which weighs less, produces more radio frequency power and has a qualified
lifetime of 10 years.
The principal disadvantage of the control by exception strategy is that it reduces

37
the quality of service provided. Seeing a unit enter a failure state that might not
be recovered by the on-board automation does not change the reliability of the
spacecraft, but even a warning of 2 minutes before a loss of attitude or loss of
service can be sufficient to switch customers from one spacecraft to another. This
does increase the quality of service from the customer point of view. Since almost
all telecommunications providers have a constellation of satellites, some of which are
collocated, this is a major advantage for them. On a science mission, this possibility
does not exist.
2.7 Industrial Policy
There are a number of political and economic factors which tend to disturb the pro-
curement process. This increases costs and reduces the quality of the final product.
Most of these can be seen within the European Space Agency’s processes.
1. As national barriers to trade have broken down all over Europe, but especially
within the European Union, a massive consolidation has taken place, to the
point that there are now only two industrial consortia capable of acting in the
role of industrial prime contractor for a large satellite procurement.
The European Space Agency failed to adapt its rules to the changing envi-
ronment. ESA has rules in place which require that each member state to
receive a percentage of the work (by value) of each project that is related to
the amount that the country contributes to ESA. This is the policy of justes
retours, fair returns. For example, if a country contributes 10% of the value
of a project, this would indicate that companies within that country should
receive 10% of the value of the project. This leads to projects being broken up
into numerous small work packages which can be easily distributed geographi-
cally, which can easily drive up the price of the work, or more usually, decrease

38
the quality of the product because so much money is wasted integrating small
units and even on travelling.
2. Some countries have a very small industrial base, and this means that effec-
tively one or two companies must be in every consortium. It is not unusual
for a company in Spain or Italy to appear in both competing consortia that
are bidding for work.
3. The requirement of balancing the distribution of work also means that it is
difficult to write contracts that include penalties for late delivery or poor
design. No project manager will let himself be left in the situation where
he/she has 90% of a satellite and the prime contractor will not do any more
work, and so it is difficult to impose penalty clauses. Often work packages are
completed and paid before the satellite is integrated and tested, and almost
always paid before the satellite enters the nominal operations phase.
4. Since the number of bidders for each contract is so low, it is difficult to nego-
tiate payment terms which are end-loaded, to keep the suppliers working until
the end. This practice is very common on other commercial contracts.
5. The bid evaluation procedure specifically excludes references to previous work
on other projects, so even if a company has developed a bad piece of hard-
ware/software on a previous mission, this cannot be included in the evaluation.
The evaluation can only refer to the ’quality’ of the current bid, which is a few
percent of the overall evaluation.
6. For scientific missions, the funding for the instruments is completely separate
from funding for the spacecraft. This brings the instrument teams potentially
into conflict with the spacecraft team, but the project management has no
direct leverage over the science teams. Similarly, the funding for the scientific

39
data processing is separate from the spacecraft, so there is little incentive
for cost-saving by combining the development, integration and post-launch
operations or even cooperating across different phases.
7. The size of many ESA projects means that they are often very complicated. It
is always tempting a include another instrument, but the result is that projects
get bigger and slower. The project Herschel-Planck spent more than one year
between the end of phase A, proof of concept, to the beginning of phase B,
design. The size of the satellites and the speed of the progression also drives
up the costs. It is difficult to maintain staff continuity over such a long project.
8. Companies in North America are not immune to the vagaries of political mis-
management. After a number of ’Spy Crises’, the USA imposed dramatically
tightened restrictions upon the export of information related to almost any
technology, explicitly including the aerospace industry. It is the personal ex-
perience of the author that this means that for a commercial contract e.g. for
a communications satellite, American companies can offer to deliver a satellite
to a US launch site, but are seldom able to provide background information
that is necessary for the evaluation of the design or for operations. If the pur-
chaser insists on receiving adequate information about what he/she is buying,
then it is clearly very difficult to select an American company.
2.8 Summary
This chapter has discussed the space business from a very high-level. Section 2.2
has shown how the industry is structured and why the industry is normally divided
into separate communities of satellite operators and satellite builders. This division
certainly leads to inefficiencies in information transfer and usually also to cost in-
creases for the duplicated development of checkout and control systems even though

40
there is significant commonality between the two.
Section 2.3 has shown who participates in the spacecraft life-cycle, how the par-
ticipation varies from over the project lifetime, and why this can be a problem.
Section 2.4 discussed mission operations. It proposed an ’Operations Model’ to
show which areas are already covered by international standards and which areas
are left for individual missions to design and implement themselves.
The optimum point will be a function of the available contact period, the required
bandwidth, and the required reaction time. Sections 2.5 and 2.6 looked at the
commonality in the operations concept across different missions, and then at the
differences. There is a broad spectrum of control activity that can be performed on-
board, on ground or by human intervention. Different types of mission may require
different mixtures of these techniques. A flexible control strategy should be able to
move fairly easily between human interaction, to ground-automation and then to
onboard automation.
Finally, since much of the space activity relies on government funding of some
form or another, it is easy for activities to become dominated or distorted by political
activity or interference. Section 2.7 has shown how the industry operates in a
distorted market place and some of the conflicts and inefficiencies that can result.

Chapter 3
Organisational Behaviour
3.1 Introduction
Organisations perform actions by requiring an agent (human or machine) to perform
according to a certain structure. These actions are governed by one or more of the
following:
• Rules and Procedures
• Intervention by supervisor
• New Project/Task Force/Review Team
• New Department
All of these structures and practices are present within the space industry, and
it is interesting to compare and contrast the different emphasis given to each. This
Chapter examines the different kinds of behaviour that is displayed by individuals
and organisations. Behaviour is broken-down into skill-based behaviour,rule-based
behaviour and knowledge-based behaviour and the different benefits and disadvan-
tages of each are discussed in section 3.2.
Section 3.3 classifies rules and procedures according to different criteria, and
section 3.4 shows the structures that the author has experienced in the teams of
people responsible for operating spacecraft, and section 3.4.4 looks at the dynamics
41

42
of people working in teams and some problems frequently associated with teams.
Section 3.4.5 presents guidelines for individuals and how they should interact within
groups in order to reach a good decision.
The nature of some of the organisations that operate satellites is discussed in
section 3.5. This sections looks at several European civil satellite operators, all
of which started out as non-governmental organisations and one of which made a
transition to a commercial company. It discusses the way that these organisations
procure satellites, the internal structure of the organisations, the problems that each
organisation faces and the ways that they have reacted to their challenges.
3.2 Behaviour
The aviation industry has been in existence for much longer than the space industry,
and it is interesting to see what lessons can be learned from aviation and applied to
the space industry.
’The behaviour of a skilled operator...may be broadly broken into three
categories. Skill-based behaviours are those that rely on stored routines
or motor programmes that have been learned through practice and which
may be executed without conscious thought... Rule-based behaviours are
those for which a routine or procedure has been learned. The compo-
nents of rule-based behaviour may compromise a set of discrete skills.
Knowledge-based behaviours are those for which no procedure has been
established...[and] require the pilot to evaluate information, and then use
his knowledge and experience to formulate a plan for dealing with the
situation’[18].

43
3.2.1 Skill-based Behaviour
Skills may be acquired in different ways, for example, by practicing the whole pat-
tern of behaviour until the desired result is achieved or by giving conscious attention
to individual aspects of the skill. This may seem to be less relevant to spacecraft
operations, since there is not a clear element of physical skill compared with, for
example, an aircraft’s manual approach and landing. However, many activities are
performed so frequently that they become automated by the operator and as such,
can be considered skill-based, and this can bring several problems. For example, the
skill may be stored as ’non-declarative knowledge, i.e. the possessor of the skill may
not be able to articulate what the components of the skill are, and this may cause
difficulty if he wishes to pass the skill on to another person’[18]. Furthermore, the
operator can, when busy or distracted, ’make the correct initial decision, inadver-
tently exercise the wrong skill, but fail to monitor his activity and remain completely
unaware of the mistake that he has made. This mechanism is very common on flight
decks’[18].
A second route to error is referred to as ’environmental capture’. It occurs with
a skill that is ’frequently operated in the same environment (and becomes a habit),
it may be elicited by that environment even though the pilot [or operator] has not
made a conscious decision to operate the skill’[18]. Green reports that ’virtually all’
pilots who have landed with the undercarriage up have combined these errors, and
adds the final reminder ’it should be remembered that these errors of skill do not
happen to novices, since they have to think about what they are doing. They occur
only to those with experience’[18].
3.2.2 Rule-based Behaviour
Procedures and checklists should normally be stored either on paper or electronically.
Procedures are widely used in the aviation and space industries, and Green[18]

44
attributes the safety of commercial aviation to their use, together with the associated
training and checking. Even though the details of the procedure may be stored, the
operator still needs to retain a basic memory of the procedure in order to retrieve
an action it. Green reports that ’errors in procedural behaviour are usually because
the pilot has made a initial misidentification of the problem and engages the wrong
procedure entirely...Errors may also occur if the pilot believes that it is safe to depart
from procedure’[18].
3.2.3 Knowledge-Based Behaviour
Green provides a very simple example to illustrate some important aspects of how
people tend to evaluate evidence and make decisions. ’Imagine that you are told
that there is a rule that connects sets of three numbers, and that you have the task of
discovering the rule. To help you, you are given an example of a set of three numbers
that fits the rule; you can try out further sets of numbers and will be told if they fit
the rule or not. The example set of numbers is 2, 4, 6. A person playing this game
will often try a set of numbers such as 10, 12, 14 and be told that the set fits the rule.
He will try several similar sets of numbers and come rapidly (perhaps after only one
trial) tot he conclusion that the rule is n, n + 1, n + 2, only to be told that this is
not the rule. Despite being told this, the future examples that the person tries are
likely to be further instances that fit his own inference (eg 24, 26, 28) and when he
is told that they fit the rule, he becomes more and more sure that n, n + 1, n + 2 is
the right rule, and may even refuse to believe that it is not the rule. Another person
may come by a similar path, and equally rapidly, to the conclusion that the rule is
n, 2n, 3n, try out such instances (eg 50, 100, 150), to be told that they fit the rule,
and be equally disappointed to be told that it is not the rule. The explanation is
that the rule is ’Any three numbers in ascending order’[18].
Green uses this and other examples to arrive at the following conclusions[18]:

45
• Data may be ambiguous.
• People are very keen to structure information and make inferences from it.
• The inferences that people make are very heavily influenced by their experi-
ences and by the probability structure of the data.
• Once a person has formulated a certain way of thinking about the problem, it
appears difficult for him to get out of that way of thinking and try a different
interpretation of the data.
• Even if a person tries to test his hypothesis about a set of information he
is likely to try only positive instances of his hypothesis and unlikely to try
negative instances of his hypothesis.
• Even if a person is presented with instances that negate his hypothesis, he is
likely to disregard them.
• People make inferences in accord with their wishes, hopes and desires.
• Having a hypothesis reduces anxiety and stress compared with admitting to
oneself that one does not understand what is going on.
Given these fundamental limits on knowledge-based activities and the frequent pit-
falls, it is important for members of the flight control team to be aware of potential
mistakes and for both individuals and the whole team, particularly the leader, to
behave in a certain manner. This is discussed further in section 3.4.5.
3.3 Rules And Procedures
Rules are the ”lowest levels” or fine grained source of control, and ideally they should
be unambiguous and deterministic. Each of the higher levels usually uses all of the
lower levels and is hence not as efficient, although flexibility is introduced as a form

46
of compensation. It is the author’s experience that people working in the industry
assume that all activities to be carried out on the satellite are proceduralised and
that any attempt to perform activities for which a procedure has not been provided
would require specific authorisation from the project management.
Rules can be classified in many ways. One technique divides rules initially into 2
categories: constraint rules and deviation rules. Constraint rules, as the name sug-
gests, specify policies or conditions that restrict behaviour, intervention or structure.
Deviation rules help infer policies or facts from other facts.
3.3.1 Response Rules
Stimulus/Response rules constrain behaviour by defining WHEN and IF conditions
that must be true for a particular operation to be triggered e.g.
WHEN the stock level of a product is less than re-order point then
reorder WHEN library book requested by borrower
IF a copy available THEN
check out this copy to borrow
ELSE place next copy of book on reserve
Stimulus/Response rules constrain behaviour within an event context. The same
action could be called in multiple contexts. When an IF condition must be true for
an operation to be performed correctly a different kind of rule is required.
3.3.2 Operation Rules
Operation constraint rules specify those conditions that must hold before and after
an action starts to ensure that the action performs correctly. Such constraints are
completely independent of the event context and should be vital to the execution of
the operation. In the field of software engineering Bertrand Meyer [31] states that
these rules should be viewed as a contract that binds both the method (procedure
call) and its requesters (execution context):

47
”if you call me with the precondition satisfied I promise to deliver a final
state in which the post-condition satisfied” [31].
Precondition rules say that the operation cannot go ahead unless (all) these con-
straints are met. In contrast, post condition rules guarantee the result of an opera-
tion. In a perfect world, they might not be necessary, but if a practical point of view
is adopted, the possibility of failure must be accepted and post conditions supply a
mechanism for triggering an action after an unexpected failure: in software terms
this is an exception handler.
3.3.3 Structure Constraint Rules
Structure constraint rules specify policies or conditions about objects (things) e.g.;
attributes, and interactions between things. An attribute could be constrained:
IT MUST ALWAYS HOLD THAT an employees salary cannot be greater
than that of the manager
Structural constraint rules are not context sensitive they must be true whatever the
phase of life of the object.
3.3.4 Inference Rules
Inference rules specify that if certain facts are true, a conclusion can be inferred.
Note that if inference rules are specified in an IF AND ONLY IF form, they operate
bidirectionally.
3.3.5 Supervision
Satellites and their associated ground segments are supposed to be operated ac-
cording to procedures, as outlined above. When it is not possible to decide which
procedure to run, or a procedure fails, than the catch-all clause is to refer the prob-
lem up the defined chain of supervision. Each supervisor then has to decide if she/he

48
is happy accepting that level of risk, and taking a decision, or referring it upwards
again.
3.4 Flight Control Teams
In the author’s experience, the structure of most flight control teams can be com-
pared by considering different roles to be performed, the actors who perform those
roles, and the functions of the various roles.
3.4.1 Roles
Spacon (Spacecraft Controller)
Spacons generally perform routine functions. The ground control system is usually
highly automated, but often each individual task must be initiated by the Spacon.
They generally work in shifts and there is usually at least one spacon present all the
time. Spacons generally have a secondary-level education.
Analyst
Routine trend analysis is performed by a senior spacon, or a former spacon who
has moved off the shift rotation into a day job. This is a much-coveted status for a
spacon.
Engineer (Spacecraft Operations Engineer, SOE)
Engineers generally either write procedures or specify/write software which form
part of the mission control system. The procedures are usually executed by a spa-
con, and during the mission the engineer only really has to respond to anomalies.
Engineers always have a university level education, usually in a technical subject:
engineering, physical science or sometimes mathematics/computer science

49
Manager (Spacecraft Operations Manager)
The SOM is responsible for the entire team. She/he will normally assign tasks
within the team and then expect a report upon their completion. Most of the
activities are delegated to be performed under the supervision of the engineer, with
the SOM being called in the event of a major anomaly or if it becomes necessary
to interface with other organisations. The SOM usually has many years experience
as an engineer on a number of different projects, and has a similar, university-level
education
3.4.2 Agents
The roles outlined above have to be performed by agents, people or computer sys-
tems. EUTELSAT and ESOC are both European organisations and both have a
mixture of staff types: Permanent staff (called ”Staff” in the language of the indus-
try) and temporary staff (referred to as ”Contractors”). EUMETSAT also has same
mixture, but suffers from a different set of problems.
1. Staff:
Staff are European civil servants, a status which brings with it many advan-
tages: tax free salary, private health insurance, and a subsidised education
for their children. Until recently, staff were recruited directly into permanent
positions. This permanence, coupled with the substantial benefits in life-style,
mean that very few staff leave, and that they subsequently accumulate in the
organisation hierarchy. Although now days most staff are initially employed
on a 4 or 6 year contract, it is rare for a staff member who wishes to stay not
to get offered a renewed contract (e.g. 6 years). EUMETSAT has been trying
to enforce the principal of rotation of staff, by making it clear that staff will
not be offered a third contract after the first two, which can bring problems
of its own since projects tend to be very long both before and after launch.

50
2. Contractors:
Contract staff are provided by various contract companies throughout Eu-
rope. In terms of providing operations engineers, Vega is the market leader
in Europe. The staff are supposed to provide continuity and the contractors
are supposed to be recruited to perform a particular well-defined task, on the
understanding that they will leave when that task is completed. In a static
market, the rationale of hiring contractors to help out in periods of intense
activity would seem to be a good one, but the market for spacecraft oper-
ations seems to be expanding, and as soon as people are viewed as ’having
experience’, they become highly valued throughout the industry. Although
the period from pre-launch through to entry into service is very stressful, it
is also the time when most learning takes place, and therefore when the most
valuable experience is accumulated. Relying upon contractors for this phase
can therefore lead to a loss of experience, which is heightened if the staff mem-
bers have been busying themselves in management positions. This becomes
further amplified since engineers have a natural desire to concentrate on the
most interesting part of the life-cycle, and after having gained experience of
one launch or service entry, the engineer then becomes a much more attractive
proposition to other projects within the same organisation or outside it.
3. Automation:
At both ESOC and EUTELSAT, the level of automation in the ground segment
is surprisingly low. The satellites are designed to be capable of 48 hours
autonomy (i.e. no ground intervention) but the ground segments still have
a lot of redundancy, e.g. at EUTELSAT it is possible to transfer control to
a complete back-up control centre within 2 hours. There is little evidence of
optimisation of the trade-off between satellite autonomy and ground segment
robustness.
51
The control system can usually perform limited, pre-defined commanding ac-
tivities once they have been enabled by the controller, e.g. send this command
at a certain time, send this command when this mode equation (logical state)
is true.
The experience with ground-based autonomy (of the kind often branded as
’Artificial Intelligence’) is poor, in that often delivers less than it promises, it
replaces one operations engineer with one operations engineer and one software
engineer, and is unreliable. Despite having all actions proceduralised, there is
an enormous amount of implicit knowledge that is required in order to decide
which is the correct procedure to run at any given time.
3.4.3 Functions
A Spacecraft Controller generally has very little to do and those operations that are
frequently necessary soon tend to be routine. Spacons are present as insurance for
the time when something goes wrong. Routine trend analysis is usually performed
by a senior spacon or analyst. Analysts have historically also been responsible for
manually entering the satellite database of telecommands and telemetry, since an
electronic import of data from the manufacturer has not been possible, largely for
non-technical reasons. Analysts are generally responsible for updating the satellite
database if a change needs to made, such as adding or modifying telemetry displays,
or changing status texts, calibrations curves or limit checks.
The engineer initially writes procedures or designs systems which are used by
the spacon. During the mission (i.e. the very purpose for which the satellite was
procured) the engineer only really has to respond to anomalies. Anomalies are diffi-
cult to classify by their nature, and when an anomaly occurs sufficiently frequently,
it becomes almost normal until, of course, it changes.

52
Initially engineers are fully occupied in control system (be it in software or pro-
cedure) development, and the launch and entry into service are seen as high points.
Spacons are usually either busy with the existing missions or are recruited so close to
launch that it is difficult for them to contribute to the service entry in a useful way,
and largely the launch and entry into service can be seen as ’On the job’ training for
the shift staff. The procedures necessary to control the satellite should be already
written by the time that the satellite is launched.
Close to launch and in commissioning, the job is very demanding but it soon
tails off into routine: waiting for anomalies to occur in order to recover them. These
occur about once every 2 - 3 days, the same term being used for a minor glitch to a
catastrophe. As the project settles down into the routine phase, the engineers often
lose interest and move onto other projects or leave the establishment entirely. If
a person leaves, the contractor provides a replacement. They are usually replaced
with younger, less-experienced engineers.
The current contract at ESOC requires a 3 month hand-over period from one
engineer to another. During this time, it is necessary to show the incoming engineer
all the procedures and how to use them as well as how to work with the spacons
and other elements in the ground station systems. Initially the replacement is full
of enthusiasm for the new position, and can usually continue to learn on the job.
However, eventually the thrill wears off and this person will also wish to be replaced.
This person has less emotional loyalty to the program having missed the excitement
of the launch and the other associated birth pains of a new satellite. There is
evidence that people who join the mission at an earlier phase stay longer than those
who join later. This is shown in figure 3.1, which shows the number of years that
each person stayed with the project, in the order that they joined the project.
This is likely to be a big problem on long-term projects, such as Rosetta or the
International Space Station. It means that regular rotation of staff will have to be

53
1
2
3
4
5
6
7
8
9
10
11
2 4 6 8 10 12 14 16 18 20
’ers-dat’
This figure shows the number of years that an engineer on the ERS project stayedon the project before leaving(vertical axis), in the order that they joining theproject . Note the false origin. After the launches of ERS1 and ERS2 the meanduration on-project dropped and seems to stabilised at around 2 years.
Figure 3.1: Years on ERS Project

54
introduced to try to keep them fresh and interested, or else they will simply leave.
This is a particular problem for a large institutional bureaucracy, since it requires
them to perform well in one of their weakest areas: staff management.
Engineers are typically highly-qualified academically, full of enthusiasm, and
welcoming of the challenge of learning how to operate a new satellite. In the space
business, more than most other industries, people do it because they want to do it,
not because they have to do it. Most engineers believe that their skills are highly
marketable elsewhere, but still chose to stay within the space industry even when it
is beset with delays or disasters.
3.4.4 Team Dynamics
There are a number of factors that impact the way people to other people and to
the equipment under their responsibility. One very simplified version presented in
[18] suggests that people should be evaluated in two independent qualities in order
to predict how they may interact as a team. ’The first is concern to achieve task
goals (goal-directed style) and the second is concern to keep team members happy
(person-directed style)... The actual style of behaviour that is appropriate may be
somewhat context-specific, and many of the factors bound up in successful leadership
may be indefinable. For example, much has been written on why Churchill was a
successful wartime, but not peacetime, leader’[18].
Other factors that will clearly influence the way team members interact with
each other are perceived ability, status with respect to each other, and role within
the team.
One reason for having a team of people operating the spacecraft is to produce
better quality decisions and better solutions than would be produced by one alone.
Green reports on the extensive results of aviation research ’It is generally true that
the decision made by a group will be better in quality than the average decisions

55
made by the members of the group, but perhaps slightly depressing that the group
problem solving ability will rarely improve upon the problem solving ability of the
ablest member of the group. From this point of view, therefore, the function of
having more than one person in a crew is to improve the chances of having an
able person there, rather than to have an interaction between crew members that
produces better decisions than any would produce individually’[18].
The process of recognising and accepting a correct solution and implementing a
decision of a group is subject to further factors, which include the ideas of conformity,
compliance, status, polarisation and group lifetime.
conformity Sometime members of a group will say that they agree with the de-
cision, or simply remain silent,for fear showing that they disagree with the
group. This can be further exaggerated by differences in status within the
group. The classic experiment cited in [18] to demonstrate this is a test where
a group of people are asked to compare the lengths of some lines with the
length of a standard reference line. The answer is normally obvious, but when
the subject is placed in a group of ’stooges’ who start off giving the right an-
swers, but gradually switch to supply wrong answers many subjects will agree
with the group even when they believe the group is wrong. Interestingly, ’this
effect is almost maximised when the size of the group holding the opposing
opinion is four’[18].
compliance A person’s response to a situation is sensitive to the context. An
experiment has shown that ’a householder would be more likely to agree to
having a large road safety poster in his front garden if he had either previously
refused to have an even larger sign or had already accepted having a smaller
sign’[18].

56
status People who are perceived as having a higher status tend to force more com-
pliance from their team. For example, after a test on a simple problem which
on military flight crew, 30% of pilots (a role with high status in the group)
got the correct answer, compared with 50% of navigators (medium status) and
30% of gunners (low status). However, 90% of pilots who got the correct an-
swer were able to persuade their group that their answer was correct, whereas
only 80% of navigators and 60% of the gunners were able to do so [18].
polarisation If individual members of a group already tend to hold a viewpoint,
then the group will tend to that viewpoint more strongly. This can be a
problem if a set of bold individuals form a group, as the result can be unduly
bold [18].
group lifetime If members of a group do not know each other, then this reinforces
the need for standardised procedures, whereas if a group spends a lot of time
together, then it may come to rely upon interpersonal knowledge than on
adherence to standard procedures[18]. It is also slightly unfortunate that in
identifying an ’in’ group, of which someone considers him/herself a member,
then there is an implicit formation of an ’out’ group. Team members may
forget that they are members of more than one group (e.g. employees, local
residents, human beings) and should remember to bear in mind that many of
the people outside the immediate group are in fact colleagues, and that little
is to be gained by treating ’them’ as the enemy[18].
3.4.5 Individual Operations Strategies
Green reports that ’Aviation has traditionally been very strong in training individual
skills and rule-based behaviours but has not generally provided pilots with practice
at solving possibly ill-defined problems on a group basis’[18]. This is what the
recent (from 1995) introduction of Flight Deck Management and Cockpit Resource
57
Management training as part of the formal (and mandatory) parts of commercial
pilot training try to address. Green provides the following guidelines to teams to
follow in order to come to a good group decision and also maintain the team morale:
• The leader should avoid giving an indication of his own opinion or idea at the
outset. If any member of the team has another idea, he will then be reluctant
to share it since it may appear to contradict the leader.
• The leader should specifically and overtly solicit the ideas and opinion of team
members and encourage them to express doubts and objections to a particular
course of action. This is to ensure that the potential problems are fully aired
and not ignored.
• When the leader has made a decision, he should explain his reasons for arriving
at that decision to the other members. Failure to do so could make the other
team members feel as if their own ideas have either not been considered or not
heard.
• All team members should not hesitate to raise uncertainties through worry of
appearing foolish or weak.
• When asked for an opinion, it should be given fully and clearly without worry-
ing about what the other people want to say, but not in an emotionally loaded
or dominant way.
• Deal in evidence and not prejudice. Team members should not become too
attached to their own points of view and simply try to get their own way.
Members should accept group decisions unless they feel that it contains some
hazard that has not been appreciated by the group.
• Don’t let others progress down wrong paths just to appear clever
• Don’t compete, don’t get angry and don’t shout[18].

58
3.5 Organisations
3.5.1 ESOC
ESOC’s structure has changed with time as successive directors try to inject energy
into and breakdown barriers within an ageing organisation. It is a typical, mature
bureaucracy, being more than 25 years old and populated by career civil servants on
permanent contracts. As part of the European Space Agency, ESOC has suffered
from lack of direction, intermittent funding and lack of responsiveness. Many func-
tions are performed centrally, in the expectation that this will give cost savings, but
the inefficiencies often far outweigh the cost savings. The following example illus-
trates this point. ESA has four large establishments, in France, the Netherlands,
in Germany (i.e. ESOC) and in Italy. The catering for all four establishments is
procured centrally on a single contract, with the results that for the most recent
competitive tender, only 2 companies could meet the needs in all establishments.
By centralising the contract, effectively local companies were unable to apply, since
they lacked the infrastructure in each country. This meant that there was not very
much competition in the tender.
ESOC has a deep structure with very low fan-out (see Figure 3.2). The Director
tends to be a political appointment and then a number of Department Heads (2,3,
or 4 Departments in recent years) report to him. Each Department consists of 2
or 3 Divisions and most Divisions consist of 1 or 2 sections. The two most recent
Directors established an independent cabinet called the Management Support Office
to determine what policy should be and to monitor its implementation through the
Departmentalised structure. This clear duplication of resources seems to indicate
that even the Directors felt that they were unable to impose policy throughout the
organisation.
ESOC has undergone re-structuring several times over the recent years. Figure
3.3 attempts to show how the departments have been shuffled back and forth over

59
Management SupportOffice
Flight ControlTeam
Mission Control Section
Flight OperationsDivision
MissionOperationsDepartment
Ground SegmentEngineering Department
Director
ESOC exhibits are deep structure with very low fan-out. This is characteristic of alow level of delegation.
Figure 3.2: ESOC Structure
the five years 1992-97. The names given are not the formal ones, since those names
changed even more frequently. At the Divisional level, the changes have been even
more noticeable, and the organisation still has many inconsistencies. For example,
in Figure 3.2, only the manager of the team reports to the section shown. The
members of the team still also report to a managers of different sections, e.g. as to
the grey box in Figure 3.2.
ESOC has a mixture of permanent staff and consultants provided by contract
companies. The ESOC operations division consists of a series of operations teams.
Each team has one or more SOMs - always a staff position. Then there is a number
of engineers, most of whom are employed by a contract company. ESOC specifies
from year to year how many people shall be provided to supply engineering support.
The staff are supposed to provide continuity and the contractors are supposed to be
hired and fired to smooth out the peaks and troughs. But, either the staff do not
have sufficient time to learn the details (if they are on several projects or also have
management responsibilities) or they are not sufficiently experienced in a range of
topics. The current projects last so long that some staff members are made into S/C
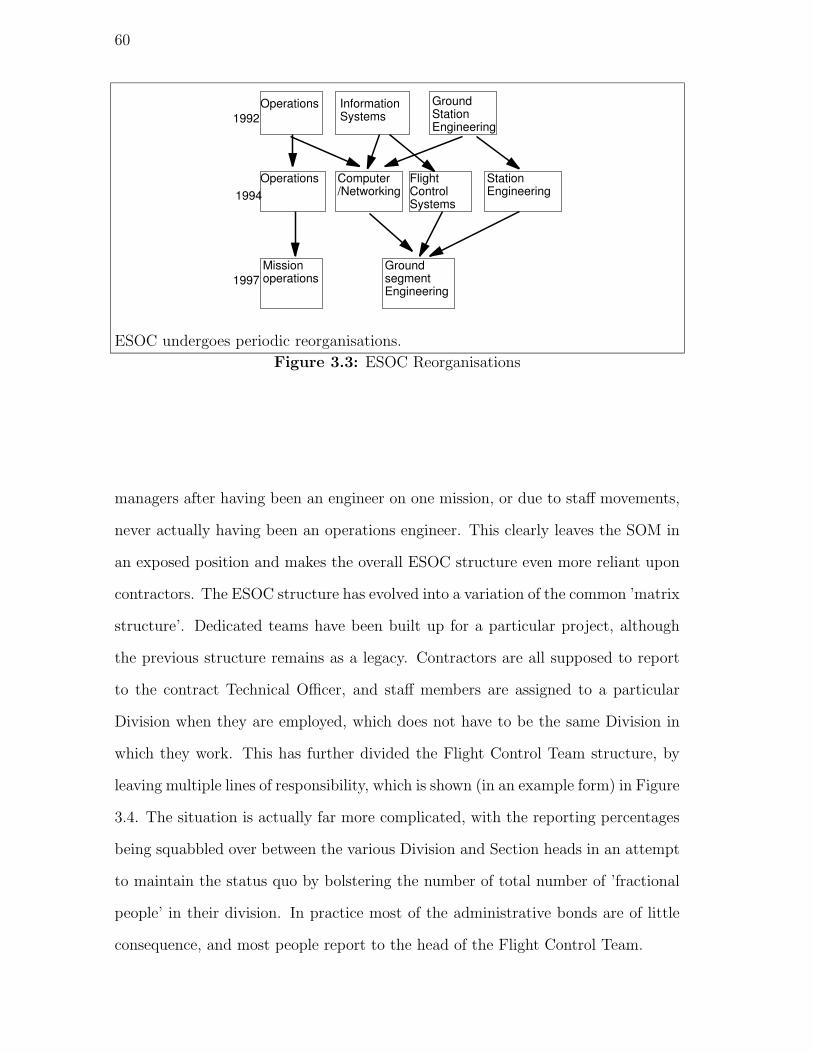
60
Operations InformationSystems
GroundStationEngineering
Operations Computer/Networking
FlightControlSystems
StationEngineering
Missionoperations
GroundsegmentEngineering
1992
1994
1997
ESOC undergoes periodic reorganisations.
Figure 3.3: ESOC Reorganisations
managers after having been an engineer on one mission, or due to staff movements,
never actually having been an operations engineer. This clearly leaves the SOM in
an exposed position and makes the overall ESOC structure even more reliant upon
contractors. The ESOC structure has evolved into a variation of the common ’matrix
structure’. Dedicated teams have been built up for a particular project, although
the previous structure remains as a legacy. Contractors are all supposed to report
to the contract Technical Officer, and staff members are assigned to a particular
Division when they are employed, which does not have to be the same Division in
which they work. This has further divided the Flight Control Team structure, by
leaving multiple lines of responsibility, which is shown (in an example form) in Figure
3.4. The situation is actually far more complicated, with the reporting percentages
being squabbled over between the various Division and Section heads in an attempt
to maintain the status quo by bolstering the number of total number of ’fractional
people’ in their division. In practice most of the administrative bonds are of little
consequence, and most people report to the head of the Flight Control Team.

61
100% reporting
70% reporting
30% reporting
Key
Mission ControlSection
OperationsControl Section
Eng1
Eng2
SOM#1
Flight ControlTeam #1
Eng1
Eng2
SOM#2
Flight ControlTeam #2
Science MissionsDivision
The ESOC structure tends to have multiple reporting for different projects,task-forces and working groups. Since many managers do not have fullresponsibility for the people who are working for them, this can make it difficult toallocate resources correctly and difficult for the engineers to prioritise the differenttasks they are given.
Figure 3.4: Multiple Reporting in ESOC
Director-General
Engineering Dept. Operations Dept. Commercial Dept.Administration Dept.
Satellite Engineering Div Satellite Operation Communication
Satellite OperationsSection
Ground Control SystemsSection
Ground StationSection
Figure 3.5: EUTELSAT Structure
3.5.2 EUTELSAT
At EUTELSAT, one division is responsible for all the satellite operations as shown
in Figure 3.5 and another manages the satellite procurement process.
This is obviously a much leaner organisation, with much greater fan-out. EU-
TELSAT is not without its peculiarities though: for more than 2 years there was
no overall organigram, since the management believed that it is not necessary and
would hinder the relations between the Divisions.
On many projects the lack of coherency between operations and engineering
leads to a lack of understanding of the operational needs during the procurement,

62
and results in designs that are difficult to operate or require expensive changes in
the ground segment software.
EUTELSAT has adopted the idea of a single ’kernel’ control system software with
special modifications for each mission. Thus every time a new ’family’ of spacecraft
is added, this increases the complexity of the control system. EUTELSAT allows two
external companies to bid for each software maintenance work package, and normally
gives the major tailoring due to a new satellite ’family’ to a single contractor. The
contractor then starts updating the kernel software as necessary. In the meantime,
of course, the same contractor (and the competitor) is changing the software on the
other satellite control systems. Since they cannot change the kernel, they have to
introduce a series of local ’patches’ to each system. When all changes need to be
integrated with the new kernel, the result is a nightmare of dependencies. Each
new family n needs to be integrated with (n-1)! other systems. The extra cost
of developing and testing the ground system is not adequately fed-back into the
procurement process. The EUTELSAT strategy makes sense if each ’family’ has
many members, but the last two families consisted of one satellite each!
3.5.3 EUMETSAT
EUMETSAT is also an organisation with low fan-out, and the division of tasks
from the projects that procure the spacecraft from the people that will operate the
spacecraft is again present.
3.5.4 Differences Between ESOC and EUTELSAT
Scope of Control
ESOC performs the launch and early orbit phase control for all of its own satellites
and for some external customers. EUTELSAT does not perform its own LEOP,
preferring to take delivery of a tested and checked out system on station. This is
analogous to the role of an airline, as opposed to a flight test centre where almost

63
every type operated is a fully new type. At EUTELSAT the business area is si-
multaneously well defined and confined to the provision of broadcast television and
telephone services. Since EUTELSAT fulfils its business interests by operating the
S/C and reselling the transmission capacity to other organisations, it does not need
to expand the capital effort in the risky parts.
Manning Levels
At EUTELSAT it is normal to have two spacons controlling more than ten satellites,
although when more than two satellites manoeuvre at the same time, an extra
controller is brought in. This is because manoeuvres are perceived to be the times
of greatest risk in EUTELSAT routine operations, analogous to the approach and
landing of an aircraft. Software will be developed soon to perform and monitor
station keeping manoeuvres. This is similar to the manning level at ESOC, even
though ESOC controls unique, bespoke satellites.
EUTELSAT considers that it is worth investing in expensive training e.g. one
of the new spacons at EUTELSAT underwent a 6 month training phase, including
about 3 months of one to one training from an engineer and 3 months of shadowing
another spacon. Spacons are viewed as a long term resource and experience is more
valuable than academic ”smartness” or the ability to innovate. Both ESOC and
EUTELSAT require 6 people to provide full shift coverage, although the financial
pressure upon ESOC has been so great that for one particular mission, ERS-2 (when
it was still operating ERS-1 every few months), the decision was taken to not use
all the periods of contact with the satellite, but to only use the ground station
passes where it was possible to both receive telemetry and send commands. This is
obviously a management decision that increases the risk of a failure going undetected
and uncorrected for a longer time.

64
Responsibilities
ESOC generally receives responsibility for all engineering work, including on-board
software maintenance, whereas EUTELSAT writes and strictly enforces contracts
with the satellite manufacturer. ESA-ESOC traditionally gets poor post-commissioning
support from the manufacturer even when it is specified in the contract with indus-
try. Unfortunately, ESA has little leverage over the manufacturers. The stage
payments are typically small, and since the political condition within ESA makes
it difficult (impossible) to stop contractors from winning new work, there is little
incentive for industry to continue to provide high quality support. On the contrary,
since ESA runs a series of procurements in parallel with the long duration missions
that are already flying, industry has every incentive to use its experienced staff to
win new work rather than keeping them on routine support. This is also much
more popular with the engineers, who would much prefer to design and develop new
things instead of maintaining the old equipment.
By comparison, EUTELSAT is able to force much better support from its con-
tractors, since the legal team is ready to intervene, and since the contracts are
drafted in a way that favours EUTELSAT.
3.5.5 Problems
ESOC
ESA has suffered from the build up of people over more than 25 years, becoming a
slow-moving bureaucracy, with out of date financial techniques and little delegation
of authority. Many documents require a large number of signatures, which often
results in documents being ’hand-carried’ around the establishment from one office
to another.
65
EUMETSAT
EUMETSAT suffers from other problems. Rather than having an accretion of staff
over the years, there is a certain deficit in experience. EUMETSAT took a conscious
decision to limit the duration that anyone can stay with the organisation by limiting
both the length of employment contract and the number of contract renewals. The
aim was presumably to avoid the creation of an aging organisation like ESA. A
result of enforcing this principle of rotation is that there very little continuity on the
project, since many projects take more than 10 years to go from conception to launch.
This leads to an overall loss of experience and vulnerability to external contractors.
It also means that some staff may not take decisions that are in the long-term
interest of EUMETSAT, since, they have no long term future with EUMETSAT,
however well they perform.
EUMETSAT takes on contactors to supplement their staff numbers, like at
ESOC. At ESOC there is a five year frame contract through which a number of
people from one or two companies are recruited, at EUMETSAT the people are
recruited directly for particular work packages of 1 or 2 years. This may increase
competition on price per contractor hour, but it can also bring contractors into con-
flict with each other, since they are sometimes competing for the same resources
(i.e. vacancies). It can also mean that contractors have little reason to cooperate
with each other, and leaves potential reasons for them to make their colleagues look
bad or ineffective.
EUTELSAT
EUTELSAT started as an international organisation, an off-shoot from the European
Space Agency. Over the last two years EUTELSAT has been readied for a pseudo-
privatisation, with the organisation being split into two parts: one part to continue
with its existing regulatory functions, and the other to compete as a commercial

66
satellite operator. This led to a massive drop in moral as people feared for their
benefits, such as tax-free salaries and cars with education and family allowances.
The uncertainty over the future caused many people to leave, and the resulting
recruitment process was poorly handled. The Personnel Department was used to
administering according to a predefined set of rules, and avoiding setting any kind
of precedent. Managers were able to say who they wanted for a particular position,
but had no control over the salary that was offered by the Personnel Department,
which had no experience of a commercial environment.
3.6 Summary
This Chapter has shown how organisations typically achieve their goals by encoding
activities in procedures, creating teams and trying to build up a particular kind of
culture. It has looked at the kinds of teams that have been encountered by the
author in his experience in the space industry and broken down individual types
of behaviour into skill-based, procedure-based and knowledge-based behaviour. It
has suggested some best-practice guidelines for how team leaders and team mem-
bers should interact in order to arrive at the best solution. In the Chapter 4, the
question of how an organisation can and should manage risk is addressed, and then
section 5.7 shows via the STS 51-L Challenger launch decision, the consequences of
a break down in communication between the individuals and teams of operations,
engineering and management.
The space industry, as well as facing some unique challenges, also faces many
normal business and organisation challenges. Managers should be able to meet the
career aspirations of their workers, and control their workload. Because so much
space-related work is carried out by organisations with bureaucratic roots and a
military or civil service mentality, personnel development has typically been a low
priority. The amount of delegation has also been typically low, with managers often

67
not responsible for some of the effects of their decisions.
The organisations examined here all became dependent upon the short-term
supply of labour to meet their peak work-load. People who are only working on
short-term contracts inevitably only have a reduced level of allegiance to the or-
ganisation that hosts them, and can easily move on. This tends to drive up wage
levels within the contract companies since the supply of experienced labour is re-
stricted, and give the contract companies an incentive to replace experienced people
with more junior, cheaper people. This reduces the amount of knowledge available
within the organisation.
The typical structure of a hierarchy with a low fan-out, often covering many
sites that are a long way away from each other- perhaps even in different countries,
can make it very easy for the management to lose contact with the people who
have the first-hand knowledge of the state of the mission and the current problems.
This prevents the free flow of information that is vital for taking major decisions
correctly.

68
Chapter 4
Risk
4.1 Introduction
Every person and organisation faces risk. Risk is fundamental to the planning and
implementation processes of every organisation.Risk is often treated in a negative
context, but it is also the companion of opportunity. ’Business risk arises as much
from the likelihood that something good won’t happen as it does from the threat
that something bad will happen’[12].
Some organisations, particularly in the financial sector have developed special
departments to perform tasks called risk management, but few other organisations
have taken such a serious approach. The literature reflects this situation: ’Even
now, the literature on managing risk is slim compared to that on finance and almost
without exception, it becomes preoccupied with with the management of financial
risk and the use of derivatives’[3].
Risk is most often associated with insurance, but ideally companies and organ-
isations would engineer their own approach to risk, and then seek insurance where
appropriate, rather than blithely paying premiums at almost any cost. By identify-
ing risk, risk can become another resource, and an organisation can try to distinguish
itself from others in its ability to manage risk.
In the space industry, risk and risk management are often restricted to sub-issues,
such as reliability and safety. However, focussing so closely on one area may leave
69

70
many other areas unwatched, so that, for example, a company building a launcher
may try to concentrate upon building a reliable launcher (especially after some
setbacks in the development), but may fail to see the greater threats of changing
markets due to over-supply or problems related to macro-economic phenomena such
as currency fluctuation. More generally, risk and opportunity can be seen in the
following situations:
• Finance
• Decision-making
• Process and structure
• People and Machines
• Legal and regulatory requirements
• Customer/Client needs
• Environmental considerations.
and it is management’s job to ensure that the whole organisation is aware of and
shares the same goals. This Chapter shows that risk management is fundamentally
about people and processes, although there are many tools and techniques that can
assist, but not replace, human judgement. Section 4.2 shows how people perceive
risk in different ways at different times. Chapter 3 showed that one of the ways
organisations can perform a task is by setting up a new project or team. Section 4.3
analyses the risk that can occur during a project or programme. Risk management
is broken down into three phases, risk control, risk reduction and risk containment
in Section 4.4, which shows how these techniques are used in the space industry.
Section 4.5 shows in more detail risk items can be identified and the risk can be
quantified.

71
4.2 Risk Perception
People perceive risk in different ways, so there are different types of risk. These
include:
• individual risk versus organisational risk or societal risk;
• voluntary risk versus involuntary risk;
• high-probability, low-impact risks versus low-probability, high-impact risks;
• delayed impact risks versus immediate consequence risks;
• risks with low-value impacts for many, versus risks with disastrous conse-
quences for a few;
When individuals ’voluntarily’ take risks, they sometimes seem to accept rather
high risks for relatively modest benefits. This can be explained by noticing that
when Organisations or individuals are in ’involuntary’ situations, they no longer
believe that they can personally control or influence their exposure to the risk, and
the perceived risk is much greater than when a person or individual is in control.
One result of research into decision taking in the private sector is that decision
makers tend to avoid risks rather than confronting them. Another study showed
that some managers often view risk as a challenge that should be overcome through
use of formal knowledge and experience. A way of reconciling these two observations
would be to note that an admission of risk would then also be an admission of the
lack of the latter qualities.
4.3 Risks Encountered During A Programme Life-
time
Sage [37] identified several risks present when developing a new system:

72
1. Technical performance risk results when the fielded system performs in a way
that creates hazards or poor operating properties. A technical risk could be a
risk to society or other harm that results from the way the system performs.
2. Acquisition schedule risk results when the intended entry into service needs to
be migrated to some later time. This is very common in space programmes.
3. Acquisition cost risk results when the anticipated cost of fielding the system
increases beyond that forecast. This is also very common with the space
industry, especially in centrally-funded programmes which have little or no
penalty for the introduction of delays.
4. Supportability risk arises when the operational system is unsupportable by
the planned maintenance and operations efforts. This is common when the
part of an organisation that operates the system is remote from the part of
the organisation that procures the system.
5. Programmatic foundation risk is created by events outside the formal control
of the management process. This could be due to internal factors (such as
research and development difficulties) or factors outside the organisation. An
example of this kind is the ESA Hermes programme, which although beset by
organisational and technological difficulties, cost and schedule over-runs, was
only finally terminated due to the rising costs of German re-unification[9].
It is important to note that technical and programmatic risks are generally the
cause of schedule or cost risks. The latter are detected before the entry into ser-
vice, whereas the technical risk is often only apparent at the entry into service (e.g.
launch, hand-over). Soon after, the supportability risks become known. It is im-
portant to be able to identify the source of the perceived risk in order to implement
corrective management efforts. Sage[37] also cites key potential risk areas when

73
trying to introduce a high-technology product. With appropriate adaptation to the
field of spacecraft engineering these are:
• Inadequately emerged technology, which results in a poor system;
• New systems that are not an acceptable substitute for that which they replace;
• Specification drift due to changing customer requirements, especially when the
volatility was not identified;
• Technological leapfrogging by a competitive system;
• A lack of credibility, either on the part of the system or the organisation that
develops it;
• Too lengthy a time scale to field a working system;
• Inappropriate standards, either because they are lacking or because they are
present and conflict with other standards;
• Lack of proper infrastructure.
4.4 Risk Management
In the space industry, much emphasis is given to reliability. Reliability is the proba-
bility that a system will perform some specified function under specified conditions
for a specified length of time. Risk is more difficult to define. It involves two
elements:
• probability
• cost.
Although it is the author’s direct experience that most organisations have some
kind of risk management procedures, this seems to be used in a very narrow sense.

74
According to [3] in many organisations the ’Cult of the amateur’ is still prevalent.
’Where it is adventurous it has too often indulged in blind speculation, leading to
spectacular failure with the natural bureaucratic response of stiffening regulation’[3].
Carroll reports[3] that many commercial financial institutions generally have much
more advanced risk management processes than their public-sector counterparts.
However the introduction of risk management is relatively recent feature - he quotes
his experience of introducing treasury management into a financial institution in
1985, which then went on to become the first in the sector to introduce risk man-
agement. There is an enormous body of literature on financial risk management, and
many practices are now mandated by the regulatory authorities[1]. Carroll favours
a holistic approach to risk management, extending it to the enterprise and how the
enterprise interacts with its environment.
Carroll proposes a framework to allow people and organisations to evaluate
themselves[3]. He present checklists and questionnaires on the following areas for
individuals to fill in and answer to see how these factors impact on their organisation.
• Financial implication
• Decision making
• Process and structure
• People and Machines
• Legal and regulatory requirements
• Customer/Client needs
• Environmental considerations
• Communication requirements[3].

75
The traditional analytical approach to evaluating risk employs probability dis-
tributions of alternative choices. A utility function is defined which has four basic
dimensions:
• The probability of winning
• Amount to win
• Probability of losing
• Amount to lose.
In most cases, management is the process of ensuring that something happens,
and the aim is both to make it happen and to continue to happen. This could
be, for example, to improve the quality of the product, or to improve efficiency
(e.g. by reducing the resources required to perform a task). There is always a clear
relation between the event (e.g. manufacturing) and the entity being controlled
(time, energy, money). By comparison, risk does not have such a clear relation
with events. According to Hollnagel ”Risk is used to characterise a certain state
of the world, or a consequence, that is (1) unwanted, (2) uncertain, and (3) in the
future” [25].
Furthermore, most management systems deal with something that is monitored
either continuously or periodically, but can at least be assessed on a regular basis.
From the point of view of risk management, the goal is often to prevent something
from happening - i.e. to ensure that the risk-initiating event does not occur, and
so risk management systems must deal with something that is far from being a
continuous quantity. The desired event is actually the non-occurrence of an event.
The consequence of an event is the result of an event occurring, but the risk remains
the same whether or not the event occurs. The consequence is uncertain until the
event happens, and is always undesirable. Once the event happens (releasing the
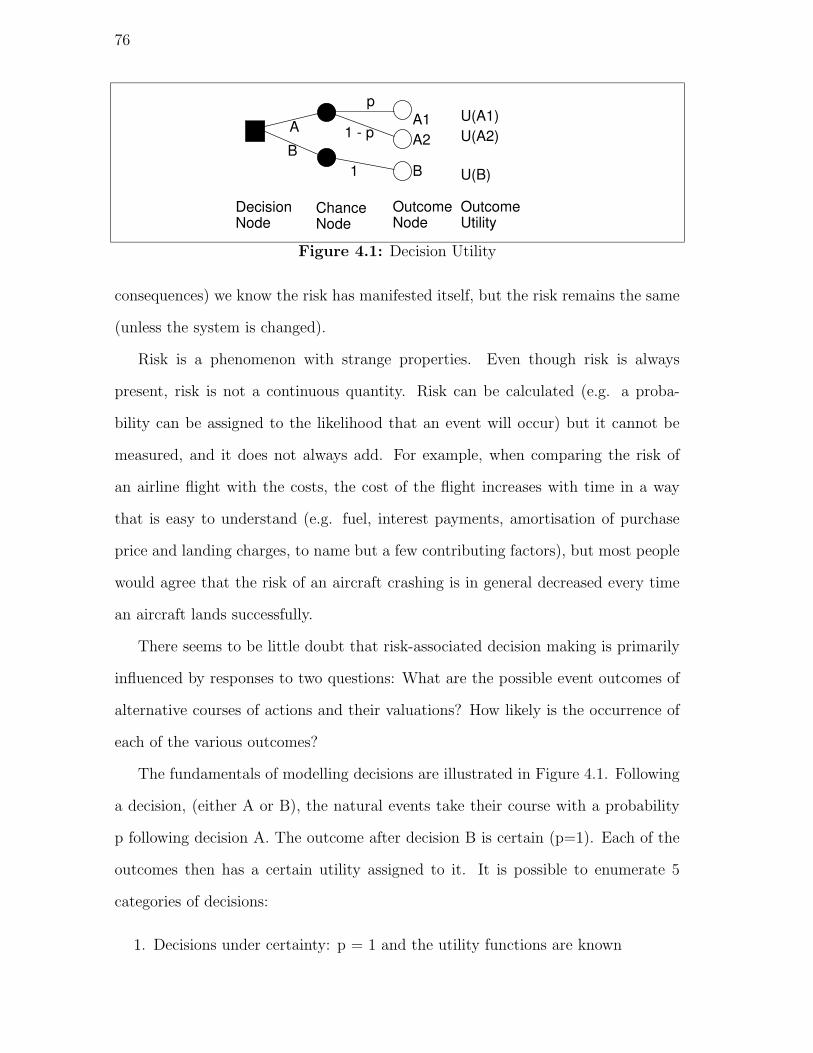
76
DecisionNode
ChanceNode
OutcomeNode
A
B
p
1 - pA1A2
B1
Outcome Utility
U(A1)U(A2)
U(B)
Figure 4.1: Decision Utility
consequences) we know the risk has manifested itself, but the risk remains the same
(unless the system is changed).
Risk is a phenomenon with strange properties. Even though risk is always
present, risk is not a continuous quantity. Risk can be calculated (e.g. a proba-
bility can be assigned to the likelihood that an event will occur) but it cannot be
measured, and it does not always add. For example, when comparing the risk of
an airline flight with the costs, the cost of the flight increases with time in a way
that is easy to understand (e.g. fuel, interest payments, amortisation of purchase
price and landing charges, to name but a few contributing factors), but most people
would agree that the risk of an aircraft crashing is in general decreased every time
an aircraft lands successfully.
There seems to be little doubt that risk-associated decision making is primarily
influenced by responses to two questions: What are the possible event outcomes of
alternative courses of actions and their valuations? How likely is the occurrence of
each of the various outcomes?
The fundamentals of modelling decisions are illustrated in Figure 4.1. Following
a decision, (either A or B), the natural events take their course with a probability
p following decision A. The outcome after decision B is certain (p=1). Each of the
outcomes then has a certain utility assigned to it. It is possible to enumerate 5
categories of decisions:
1. Decisions under certainty: p = 1 and the utility functions are known
77
2. Decisions under probabilistic uncertainty : p such that 0 < p < 1 is known,
and the utilities are known
3. Decisions under probabilistic imprecision: p is imprecise and the utility func-
tions are known
4. Decisions under information imperfection: p may be precise, the utility func-
tions may be imprecise
5. Decisions under conflict: the values of p and U may be changed by an opponent
It is rare that decisions under certainty involve risk, by their very nature. De-
cisions in category 5, conflict, in which the probabilities typically have the form of
variable quantities that can be altered by the actions of a competitor, is typical of
game theory. This is a situation which is mercifully rare in satellite engineering.
The aim of decision assessment is to provide a framework for describing how people
choose, or should best choose, when the outcomes that arise from those decisions
are obscured by lack of information or the presence of uncertainty. Behavioural
psychology can provide information concerning both the decision process and the
judgment process. System modelling should in principle allow the decision to be
represented in a clear way, and probability theory allows, in principle, the decision
maker to make best use of the information available. Utility theory guarantees that
the choice will reflect the declared preferences of the decision maker, if everything
has been modelled correctly!
A theory of choice is said to be rational if it involves giving numerical measures to
these probabilities and values, and aggregating these numbers into a single figure of
merit that the decision maker should maximise in order to obtain the best strategy.
In classical gambles, outcomes are simply different amounts of money, and often the
probabilities of the various outcomes could be calculated from simple models with
easily determined objective probabilities. In system engineering then, the objective

78
probabilities are often subjective, and the simple value of an event needs to be
replaced with the decision maker’s subjective utility.
The classical formulation for maximum expected utility has a number of in-
herent difficulties. Cost/benefit must be integrated to produce a single number,
which is then multiplied by the probability of that outcome. While this makes the
computability more easy, it brings the associated problem that it is difficult to dis-
tinguish between a situation where there is a small (almost zero) probability of a
very large loss, or a very large probability (nearly one) of a small loss. Another
factor that is not considered is the immediacy of the result. Most people would be
much more reluctant to accept a 0.001 probability of loss of life tomorrow than a
0.001 probability of loss of life over the next 20 years. This seems to indicate that
some kind of integrated probability (potential) must be introduced.
Hollnagel[25] defines three different ways to manage risk according to the different
parts of the life cycle. These are illustrated in Figure 4.2.
• Risk Control
• Risk Reduction
• Risk Containment
4.4.1 Risk Control
Risks can be controlled at the operational level (i.e. day to day) or at a management
level. The principal difference from risk reduction is that risk control takes place
when the system is already operational. Control thus tends to be tactical rather
than strategic. Although this is appealing, it is a difficult practical concept since
risk itself cannot be directly measured. For spacecraft operations, this would mean,
for example, using existing procedures, even though a new procedure with a short-cut
might be desirable, or using established hardware rather than innovative technology.

79
Condition 1
Condition 2
Condition n
Risk initiatingevent
ConsequenceRiskInitiatingEvent
Risk ControlEnsure that theconditions leading tothe event do not jointlyreach the thresholdlevel
Risk ReductionEnsure that the a prioririsks are lower thanthe acceptablemaximum value
Risk ContainmentEnsure that theconsequences do nottrigger another riskinitiating event
After Hollnagel
Figure 4.2: Risk Management(after Hollnagel [25])
4.4.2 Risk Reduction
This is normally achieved by design improvements, often to the physical system, but
also to the operating environment or the organisation, e.g. the distribution of roles
and responsibilities. The aim is to get the risk below the maximum acceptable risk
e.g. designing a system that has no known single point failures.
4.4.3 Risk Containment
This aims to contain the consequences engendered by an event, should it ever oc-
cur. This could be physical containment (e.g. steel/concrete containment vessel)
or functional (a crash barrier to stop a car that has already suffered an accident
from crossing into the on-coming traffic and causing further injury or loss of life).
For spacecraft operations, this could be having extra support staff available during
periods of critical operations, or using control systems with ’hot’ redundancy (with
two or more systems running in parallel, each capable of performing the whole task)
instead of ’cold’ redundancy (a replacement system is available but is not running
and needs to be started in order take over control), or performing critical activities

80
during periods of double ground station coverage.
4.5 Risk Analysis
4.5.1 Prospective Risk Analysis
This is a classical approach which places emphasis on risk reduction, which can be
described as assessing the risks inherent in a system in order to decide whether or
not they are below the limit of acceptable risk. This can be done by calculating the
risk of specific events and predicting the likely outcomes. This is the classic Failure
Modes, Effects and Criticality Analysis, FMECA. Risk containment extends this
technique to look further downstream in a fault tree in order to consider the range
of potential consequences of an event. This enables the responsible authorities to
identify those events which may lead to serious consequences, and also to become
aware of (and hopefully restrict) the possibility for one event to have consequences
which trigger other events. The third part of risk management that was identified
above, risk control, plays a smaller part in prospective risk analysis, being largely
incorporated in risk reduction.
4.5.2 Retrospective Risk Analysis
The main emphasis is upon risk control, the aim being to identify all the conditions
that jointly led to the risk-initiating event. Analysis of an incident that has already
taken place provides a full understanding of what happened and the opportunity to
learn. It should
• provide a probable root cause (or causes);
• identify which changes could prevent a re-occurrence
• update the data (i.e. probabilities) and methods that were used in the initial
analysis.

81
Risk reduction and risk containment play only minor roles in a retrospective
analysis, since the event has already happened. This is the classic Board of Enquiry.
4.5.3 Synchronous Risk Analysis
Hollnagel [25] proposes that a third type of risk management be studied, which he
refers to as Synchronous Risk Management. Admitting that ideally retrospective risk
analysis would not be needed, since there would be no accidents, he suggests that
prospective risk management be continued into the operational phase. This would
make it more similar to a conventional control system, in that it would monitor the
relevant parameters of the system to find discrepancies, and then provide advice
principally in the area of risk containment.
All three of the techniques mentioned above require an adequate basis for mod-
elling. Each analysis is based on compound elements, assumptions about those ele-
ments and the relations between them. The relations between them would typically
be of the cause-consequence type which could either link causes to consequences or
consequences to causes. The analysis is based upon a simplified representation of the
plant, and the two major questions that must be asked (and answered) during the
model development are: what should be modelled and how should it be modelled?
For many many years it was believed[37] to be sufficient to confine the model
to the hardware elements used within the system. Initially this could provided
much useful information, but in many fields (and satellite engineering in particular),
the reliability of the individual mechanical and electrical components has increased
significantly, and it was realised that in many incidents, software systems with a
human operator played an important role in how the risk initiating events occurred
and developed.
It can be very difficult to model the failure modes of a software system, but some
qualitative analysis can normally be performed to define some kind of boundary. For

82
example, if the system needs to be restarted, or even completely re-installed, this
should be included as a case that subsumes a number of smaller failures. However, a
more difficult case to model is what happens when the software performs ’correctly’
(i.e. as specified) and no failure is identified, but the wrong action was initiated. In
this case software systems must be treated like their human counterparts.
Initially the human operator was incorporated into a system model by treating
the human as a machine. Although difficult to justify now, it seems as if this was
done because it was
• the established practice
• there was a lack of usable alternatives.
Subsequent research, and a number of high profile incidents, eventually led to the
ability to analyse and describe human cognition. This proved that human errors,
which had previously only been treated at the operational level, could also arise
at the management level. ”Factors such as training, work demands, time pressure,
availability of the procedures, design of the work place and quality of information
display all turned out to have a direct effect on the probability of errors occur-
ring” [25].
Management factors affect the likelihood of errors in a number of ways. Some
factors, such as training policies, procedures, equipment or work planning, have
an indirect effect, whereas other factors, such as organisational culture that the
management creates (and is part of) or the priority that organisation assigns to
safety and productivity can have direct effects. Models must be able to account for
the dynamics of how an event can develop, as well as the statics. The dynamics
are needed to account for the interaction between people and between people and
machines.
Although different researchers may emphasise the technological, the psychologi-
cal/cognitive or the organisational/contextual parts of the system, the consensus of

83
opinion is that a model must include all three aspects. Models that consider only
one factor will not suffice.
4.5.4 Modelling Techniques
Technology pushes onwards relentlessly to change the way we work - whether there
is a need to change or not. For risk management this has two implications. Firstly
the target systems that are being analysed change due to the introduction of com-
puters. This means that risk management method must be able to to model and
analyse the effects of computerisation. Secondly, perhaps necessarily in response
to the complexity of the target systems, risk management techniques have them-
selves become computerised. Manual methods (which includes methods that use
computers for text processing or type setting) have always suffered from the fact
that analyses are necessarily incomplete. Even for a very simple system it is just
impossible to investigate all possible conditions and combinations of conditions.
There is a clear reason for wanting to introduce the symbol processing capabilities
of computers. But this potential advantage also has an associated cost, since the
introduction of computers will bring a further layer of complexity to the analysis
and may therefore increase the imprecision and uncertainty, exactly the opposite of
what was intended. Hollnagel [25] refers to these as Scylla and Charybdis, two mon-
sters from Greek mythology who lived on either side of the Strait of Messina. Scylla
seized sailors and devoured them, and Charybdis, the whirlpool, created shipwrecks.
Manual Analysis
When compared with prospective risk analysis, retrospective risk analysis has two
advantages. Firstly, uncertainty is virtually eliminated because the event has hap-
pened. Some imprecision may remain if it is difficult or impossible to get all the
required data. Secondly, there is ample time. The investigation of an air accident
may last for years and can focus upon a single event. In contrast, a prospective

84
analysis usually needs to be completed before a certain deadline, often when the
system become operational, and has to consider not one but all possible events.
A retrospective analysis typically relies upon risk control and thus starts with the
consequences and identifies the (chain of) events that gave rise to them. This can
run into problems when the causal reasons are complex. A natural reaction is to
stop the analysis at an arbitrary point or to make simplifying assumptions to allow
the analysis to continue. It is in any case difficult to justify a particular stopping
point. Prospective risk management relies mainly on risk reduction, which depends
on the ability to correctly predict the consequence of a particular event. Here the
limitation is that event trees can easily become too large to be analysed manually -
or even displayed - unless some simplifications are made.
Computerised Analysis
The attraction of computers is that they can handle models that are more complex
and that they can do so faster and more reliably than a human. It is tempting to
use the same manual methods on a computer, but simply transferring the existing
methods will not be enough to overcome the combinatorial complexity of even a
simple system. Even the results of e.g. playing chess by brute-force suggest that
much optimisation is necessary in order to make significant progress, as well as a
great deal of domain-specific knowledge. But most risk analysis methods require
a substantial input from an experienced human in order to work, whether this in-
volves interpreting incomplete data, inventing assumptions or conditions or seeing
in which sense the event trees should be developed. A hybrid system would aid both
prospective and retrospective analyses.
For retrospective methods, the identification of links in the event chain by a
human can be improved because more alternatives can be easily tested. Similarly
the thoroughness that a retrospective analysis requires is also better provided by
computers, even if this only extends to book-keeping.

85
Prospective analyses can be significantly improved by the use of computerised
predictions or simulations. Even a limited dynamic system can produce much richer
results than those of a manual, necessarily static, analysis. Even though comput-
erised analyses need not per se be more correct than the corresponding manual work,
the fact that the results differ should be a ground for fruitful discussion.
While computerisation obviously holds out promise, it suffers from the two usual
shortcomings associated with information technology. It is easy to become blinded
by the computer and to not really understand what it does. There is a strong bias
to take the output of a computer as real, especially if that output is presented in
a convincing fashion. Secondly, there is the familiar problem of verifying and vali-
dating what computers do. Most systems are verified on a very small data set. For
retrospective risk analysis it may be possible to ’calibrate’ the computerised method
on known cases, but this does not ensure that the results will be correct in other
situations. For prospective analysis, there are by definition no test cases on which
the system could be tested. In summary it seems therefore that the choice between
manual and computerised risk management is a choice between incompleteness and
inaccuracy.
4.6 Summary
This Chapter has shown that every person and organisation faces risk and that risk
is fundamental to the planning and implementation processes of every organisation.
More generally, risk and opportunity can be seen in the following situations:
• Financial implication
• Decision making
• Process and structure
• People and Machines
86
• Legal and regulatory requirements
• Customer/Client needs
• Environmental considerations
• Communication requirements[3].
Risk management is more oriented towards people, processes and human judge-
ment than safety and reliability, although these are important factors. Section 4.2
showed how people perceive risk in different ways at different times. Section 4.3
showed some of the ways risk can occur during a project or programme, which is
one of the way that an organisation performs a task or reaches a goal. Section 4.4
broke risk management down into three phases, risk control, risk reduction and risk
containment and showed how these techniques can be applied in the space industry.
Section 4.5 showed how risk events can be identified and the risk can be quantified.

Chapter 5
Ground Segment Preparation
5.1 Introduction
As mentioned in Chapter 1, since the satellite is often being operated by a different
organisation to the one that built or integrated it, somehow the people responsible
for operating the satellite must be trained and prepared for their forthcoming tasks.
The satellite database is one of the most important interfaces between the satel-
lite constructor(s) and the satellite operator(s). This is discussed in section 5.2.
This section explains the sound theoretical basis for a relational structure, as well as
discussing several other structures prevalent in European spacecraft control centres.
As outlined in the Chapter 3, the users require skill-based, procedure-based
and knowledge-based behaviour. The User Manual is one of the terms used to
describe the documentation that the spacecraft developer is supposed to deliver
to help the end-users understand and operate the spacecraft and payloads safely
and successfully. The User Manual should be the source of procedure-based and
knowledge-based behaviour. This is discussed in section 5.3. The procedures are
used for the routine work, and the structure of the flight control procedures is
discussed in section 5.4.
According to the author’s experience, spacecraft (or a family of spacecraft) are
frequently being procured as part of a whole system, which often has a very large
87

88
ground segment that needs to be developed, maintained and operated in parallel to
the space segment. Section 5.5 discusses how the spacecraft database is validated
through a series of tests between the ground segment and the space segment, which
are frequently called System Validation Tests in Europe.
The role of simulations in preparing the individuals and teams mentioned in
the previous Chapter is discussed in section 5.6. It shows how they are useful in
preparing the individuals to cope with the stress of operational situations, as well
as forging a team.
Since satellites are normally only procured by large organisations, there is nor-
mally a formalised process for checking the progress at various phases in the pro-
curement and operations. These are referred to as reviews. They are important
since it gives management an opportunity to investigate the current status of the
programme, and also forces management to take a position on various items that
are flagged as risks to the programme. However, this only operates correctly if the
correct data is made available to the correct people. As mentioned previously, in
large organisations with extensive hierarchies, this can be very difficult to achieve,
and there is a danger that the reviews may become so formal that the people who
have the working knowledge may not feel that they are able to participate in this
process. This is discussed in section 5.7.
5.2 Satellite Database
The satellite database is one of the most important interfaces between the satellite
constructor(s) and the satellite operator(s). Although there can be more impor-
tant interfaces to convey the information from one party to the other, the satellite
database is important because it is unambiguous and relatively concise. If an appro-
priate database system is used for its creation and management (see the following)

89
ID Description Units High Limit Low Limit Width Byte Offset Bit Offset
A123 ES1 Status None 1 45 6
A124 ES1 Voltage Volts 4.5 5.2 16 46 0
B100 CPU Voltage Volts 4.5 5.5 16 48 0
Table 5.1: Example Telemetry Parameter Characteristics Table
then it is relatively easy to check the completeness. A textual description may con-
vey more understanding of how a system or unit works, but it is difficult to check
it for completeness. A relational database is far easier to check for completeness
and correctness, whereas arguments about the largely textual User Manual may
easily degenerate into differing opinions about how to explain a piece of text or
even whether or not it is relevant. With a database system the goal, at least, is
usually clear, even though many implementations fall short of the ideal. It is thus
interesting to examine where this strength in a database system comes from.
At the simplest level, a database system is simply a computerised record-keeping
system. At first glance, a simple file system may seem to perform the same tasks,
and so one can imagine a simple file (e.g. a text file containing values separated by
commas) with the contents shown in Table 5.1. However, it simplifies the discussion
if we initially consider only a hypothetical system, without being constrained, for
the time being, by any implementation details.
The title provided in the first row may or may not actually be present in the
file. Usually it is preferable for it to not be there, and it is provided here only for
ease of reference. The data within a particular file is referred to as a table, for fairly
obvious reasons. The rows of such a table can be thought of as representing the
individual, logical records of the database. Likewise, the columns can be regarded
as representing the fields of those logical records. Even from a simple example as
this, several questions arise: What is in Byte Offset 45, bit 7? What byte and
bit numbering convention is used? Where is Byte 0, in the telemetry transfer from
90
header or the data field? Where is bit 0, and which way does the numbering increase?
If parameters A124 and B100 are 16 bit values, are they byte swapped? Is there a
calibration curve to show the relation between analogue (calibrated) value and the
bit pattern (raw value)? The ESA Packet TM Standard defines the answers to some,
but not all, of these questions. It is difficult to accept that a textual description of
the same data would have generated as many questions, since it was the format of
the presentation that rendered the gaps so obvious.
5.2.1 Why a Database?
Even though the examples given here are trivial, it most be obvious that most of the
advantages detailed below become ever more significant as the database increases in
size.
1. Currency: Up-to-date accurate information is available on demand.
2. Less drudgery: The sheer tedium of maintaining files by hand is eliminated,
and the quality is improved.
3. Compact: No need to wade through voluminous paper files or archives.
4. Speed: A machine can retrieve (and change) data faster and more accurately
than a human can.
5. Availability: usually more than one user can access the database at one time
(although there may need to be some restrictions).
This means that most databases are multi-user, and in any case, the goal of most
multi-user systems is to allow each individual user to behave as if she were working
with a single user system. Redundancy can be controlled: in a non-database system,
each application (or, for example, employee) has its (her) own private files. This
can often lead to a considerable redundancy in stored data. For example, consider
91
the simple case where a supervisor prints off a schedule for the two-week period,
starting in one week’s time, and distributes 12 copies to her team. During that
three week time period in which the plan has (or may have) validity, all changes will
need to be marked up one by one by each employee individually. If each member
does not rigorously incorporate all changes, as they become known, then the team
will be operating on the basis of an incoherent data set. This might mean that on
one particular day, two people turn up, or worse, that one day nobody is available to
perform the necessary tasks. Here the redundancy has introduced an inconsistency.
This is always a risk when data is replicated in an uncontrolled manner. It can be
equally disastrous whether applied to an operations schedule, design documentation,
or telemetry processing information.
By using a database management system (DBMS), the data can be shared be-
tween users without introducing inconsistencies, and, furthermore, new applications
can be developed that operate against the same data. In other words, this means
that it may be possible to develop new applications without having to add any new
stored data. This facility can act as a sort of ’future proofing’, reducing the effort
of introducing arbitrary new functions in the future.
Standardisation of data storage comes as an easy by-product of using a DBMS.
This could include corporate, departmental, national or international standards.
Data standardisation is particularly desirable since it aids data interchange and the
migration of data between systems. It thus becomes easier to upgrade the system.
Since a single DBMS can provide complete control over the database, its use can
ensure both that the only way to access the data is through the formal channels, and
can also define security rules to be checked whenever any access is made. Different
rules can be defined for reading, writing, insertion, etc., on different levels of data:
Table, report, query etc. Note, however, that without such rules, the organisation
might be exposing its data to greater risk than in an uncontrolled, uncentralised

92
system, so a DBMS not only permits but also requires a good security system to be
set-up.
5.2.2 Why relational?
A relational database is basically just a database where the data is perceived by the
user as tables (and nothing but tables) and the operators at the user’s disposal (e.g.
for data retrieval) are operators that generate new tables from old. For example,
there will be one operator to extract a subset of rows of a given table, and another
to extract a subset of the columns - and of course a row subset and a column subset
of a table can bother in turn be regarded as tables them selves.’ [8]. The name
’relational’ is just a mathematical term for a table that satisfies certain conditions.
It is now very common for the terms ’relation’ and ’table’ to be used as synonyms,
and in many cases they are. However, the relational model [7], formulated by Dr.
E. F. Codd, a researcher at IBM, deliberately introduced new terms that were not
in wide-spread use in computing circles at the time. This was because many of the
terms in use, such as table or record, meant different things to different people, and
thus lacked the precision that Codd wanted for a formal theory. For example, the
term ’record’ could mean a programming structure, a logical or physical storage
structure or a type definition. Thus the relational theory avoids the use of the term
record completely: it uses the term ’tuple’ (short for ’n-tuple’).
Relational theory is a combination of set theory and first-order predicate logic.
The first element to be defined is a domain. A domain provides a set of scalar values
from which a relation can take its actual values. Domains are the smallest semantic
unit of data i.e. they have no logical internal structure as far as the DBMS is con-
cerned. For example, a database of employees might include an employees name as
a string ”DAVID”, which consists of a sequence of characters, but by decomposing
the name into the individual characters, we lose the meaning. A domain is a named

93
subset of scalar values, for example the set of all possible names. Thus domains are
pools of values, from which actual attribute values can be drawn, and a domain is
really nothing more than data type, as the term is used in modern programming lan-
guages. For example, the following is a legal fragment of the programming language
Ada:
Type DAY is (MON, TUE, WED, THU, FRI, SAT, SUN);
Subtype DAY_OF_MONTH is INTEGER range 1 .. 31;
Most DBMS available today provide only limited scope for domains as Codd
defined them. Instead, they provide the ability to characterise attributes as being
one of a small range of primitive data types. These could include floating point
numbers, integers of various ranges, or character strings of a defined length. A
relation has two parts: a header and a body. The header is a fixed set of attribute-
name/domain name pairs: { < A1 : D1 >,< A2 : D2 >, . . . , < An : Dn > }. The
attribute names A1,A2, . . . ,An are all distinct. In the informal representation, the
header corresponds to the column headings. The body consists of a set of tuples.
Each tuple consists of a set of attribute-name/attribute-value pairs: {< A1 : Vi1 >
,< A2 : Vi2 >, . . . , < An : Vin > } (i = 1, 2, . . . ,m, where m is the number of
tuples in the set). In each tuple, there is precisely one attribute-name/attribute
value pair for each attribute in the heading. The value m is called the cardinality
of the relation, and the value n is the degree of the relation. In informal contexts it
is normal to omit the attribute names from the table, because we have an informal
convention that says that each individual value in the table is actually a value of
the attribute whose name appears at the top of the column.
Much as the image of a table is sometimes useful, it also suggests some things
that are not true. It suggests, for example, that the tuples (the rows in the table)
are in some top-to bottom order, but this is not the case. It could also suggest that
the columns have some predefined order. This is also false. The columns may be

94
moved into any order, as long as the headings are moved at the same time as the
attribute values. The number of attributes in a given relation is called the degree, or
sometimes the arity of the relation. A relation of degree one is called unary, degree
two is called a binary relation, and an arbitrary relation of degree n is called an
n-ary relation.
It is tempting to think that a unary relation can simulate a domain, because a
domain looks like a table with one column. However, there is an important differ-
ence: domains are static, whereas relations can change over time. Note also that
domains contain all possible values of the relevant attribute.
Several properties follow from the definition of a relation.
1. There are no duplicate tuples. The body of the relation is a set, and sets,
by definition, include no duplication (Note that the database language SQL
(originally Structured Query Language) [27] does permit tables to contain
duplicate rows, but this means that SQL is not a purely relational language.
This is probably attributable to the compromises necessary to get a standard
approved in the real world when there is already a large installed user base).
It follows from the absence of duplication that every relation has a candidate
for a primary key. Since tuples are unique, at least the combination of all the
attributes can (if necessary) serve as a primary key, and usually some lesser
combination is adequate.
2. Tuples are unordered, top to bottom. As before, this property follows from
the fact that the body of a relation is mathematical set, which is unordered.
3. Attributes are unordered left to right. This follows from the fact that the
header of a relation is a set, which, of course, is unordered.
4. Attribute values are atomic. This means that every individual attribute does
not contain any structure, i.e. there is never a collection of values. This can

95
ID DescriptionA123 ES1 StatusA124 ES1 VoltageB100 CPU A Voltage
Table 5.2: Example Database Table
also be restated as ’relations do not contain repeating groups’. A relation
that satisfies this condition is said to be normalised, or in First Normal Form
(FNF). This implies that as far as relational theory is concerned, all relations
are normalised. The point is that it is easy to propose table structures that are
not normalised, especially if new information is added without due attention
being paid to the meaning or context of the information.
5.2.3 Relations and Predicates
Every relation has an intended interpretation or meaning. This meaning may be
made available to the other users of the RDBMS by naming a table, although the
name is used only as a label within the operation of the RDBMS itself. Consider
the (fictitious) relation illustrated by table 5.2, and let ID be the primary key.
The meaning of the relation defined by this table could be approximately put into
English as:
there exists a relation between telemetry parameters and descriptions
such that every parameter has a unique identifier (ID) and the telemetry
parameter with the identifier ID can be described by the text in the
Description field.
This statement can be regarded as a predicate with four arguments, which yields
a proposition that is either true or false. At any one time, the relation contains
exactly those tuples which make the predicate evaluate to true. It follows that
when a tuple is presented for insertion into the relation, the DBMS should accept

96
TPCT TMID Description CalCurve Type Validity
CalCurvesCCID Title Points x1 y1x2y2 x3 y3
METMIDEquation
ESTTMIDMode1ES1Mode2ES2Mode3ES3
OOLTMIDMode1UL1LL1Mode2UL2LL2
Figure 5.1: Initial Database Schema
only those tuples which make the predicate evaluate to true. This is the theoretical
soundness that makes the relational model so robust [8].
A relational database is also ideal for defining interfaces. If a RDBMS is correctly
normalised, then adding a relation (table) can easily incorporate further changes.
Compatibility is a minor problem: either the relation exists or it does not exist.
However, if the interface is a data structure that does not follow the relational ideal,
then modifications may be required to an existing relation. This could mean, for
example, changing the field width in a table, or more usually, adding or changing a
field within a table. This means that compatibility becomes a major problem: the
old table is not compatible with the new one, and databases in different places need
to be changed synchronously.

97
5.2.4 Example Telemetry Database
Let us examine an example database in detail (see figure 5.1). The Telemetry
Parameter Characteristics table (TPCT) is supposed to include all of the information
pertaining to an individual parameter. It includes a description field, some type
information (e.g. floating point, signed integer, unsigned integer) and a field to
identifier which Calibration Curve that should be used to convert a raw digital
value in telemetry to an engineering value (e.g. to a temperature in Celsius). This
example database also includes a table of Mode Equations, in the Mode Equation
table (MET). Mode equations are assumed to be a simple combination of logical
operators on existing telemetry parameters, e.g. a certain Mode might become true
when a redundant earth sensor is in use. This mode might then be used to show
that angular measurements from the redundant sensor are valid. The validity mode
should appear in the Validity field of the TPCT. The remaining tables are the Out
of Limits table (OOL) and the Expected Status Table. Both the OOL and the EST
are indexed by the field TMID.
The OOL can be used to define a normal operating range for a parameter. This
could be, for example, the fact that a prime sensor was expected to be in use, and
if ever it was found to be OFF, an alarm should be raised. An alternative, and
perhaps better example, would be to define limits to analogue parameters, so that
an alarm would be generated whenever an equipment item got too hot or too cold.
An example usage of the EST would be to say that if the redundant earth sensor
were selected, then one would normally expect a redundant processor to be in the
status ON. Thus if the redundant processor was OFF and the redundant Earth
Sensor was in use, an alarm should be generated and the operator would have to
react to the situation.
The structure that is shown above is fairly typical of that used in control systems
throughout Europe, being similar to that initially developed at the European Space

98
Agency’s Space Operations Centre, ESOC in the 1970s and subsequently spread
around Europe under ESA’s rather flexible licensing structure. There are, however,
a number of problems inherent in such a structure. First of all, let us examine the
Calibration Curve Table, CCT. It is obviously not normalised.
Normalisation is the process of efficiently organising data in a database. It has
two goals:
• Eliminate redundant data (for example, storing the same data in more than
one table)
• Ensure data dependencies make sense (only storing related data in a table).
The database community has developed a series of guidelines for ensuring that
databases are normalised. These are referred to as normal forms and are num-
bered from one (the lowest form of normalisation, referred to as first normal form
or 1NF) through five (fifth normal form or 5NF) or sometimes even higher.
First normal form (1NF) sets the very basic rules for an organised database:
• Eliminate duplicate attributes from the same table.
• Create separate relations (tables) for each group of related data and identify
each tuple(row) with a unique attribute or set of attributes (the primary key).
Second normal form (2NF) further addresses the concept of removing duplicate data:
• Remove subsets of data that apply to multiple tuples of a table and place them
in separate rows.
• Create relationships between these new tables and their predecessors through
the use of foreign keys.
Third normal form (3NF) goes one large step further:
• Remove attributes that are not dependent upon the primary key.

99
Finally, fourth normal form (4NF), also known as Boyce-Codd normal form (BCNF)
has one requirement:
• A relation is in BCNF if and only if every determinant is a candidate key.
These normalisation guidelines are, of course, cumulative. For example, for a relation
to be in 2NF, it must first fulfill all the criteria of a 1NF database. A clear warning
of lack of normalisation is when attribute descriptions have numbers, e.g. x1, x2 etc.
Calibration curves can usually have different numbers of points, a maximum of 16
points being typical, although only 5 have been shown here. This is why an entry is
also required to say how many points contain meaningful data. If a calibration curve
only contained 2 data points, the remaining points would be empty! Although this
is an acceptable waste from a resource point-of-view since satellite databases are
typically very small, with perhaps 5000 TM parameters, of which 500 might require
calibration curves, it is an unnecessary evil.
As outlined in the guidelines, the standard way to normalise such a table is by
splitting it into one or more tables. This is shown below. There are no extraneous
indices or flags. For a given calibration curve there can only be one engineering value
(y) associated with each individual raw (x) value. Furthermore, if, for example, on
the previous architecture, it was desired to enter a new point between existing
points, some of the existing points need to be moved, i.e. re-numbered. This is not
necessary after the improvement. A point can be added anywhere in the calibration
curve. A further difficulty is in the relation between the TPCT and the CCT. Not
all parameters have calibration curves (e.g. a simple counter, or a status parameter
will not need a calibration curve) and one calibration curve can be used by more
than one parameter. This again leads to a situation where one of the fields in a
table can contain a null value, and sometimes a meaningful piece of information.
This is the crux of relational theory. There are no special flags linking one table to
another. The tables are simply files that behave according to certain rules. It is in
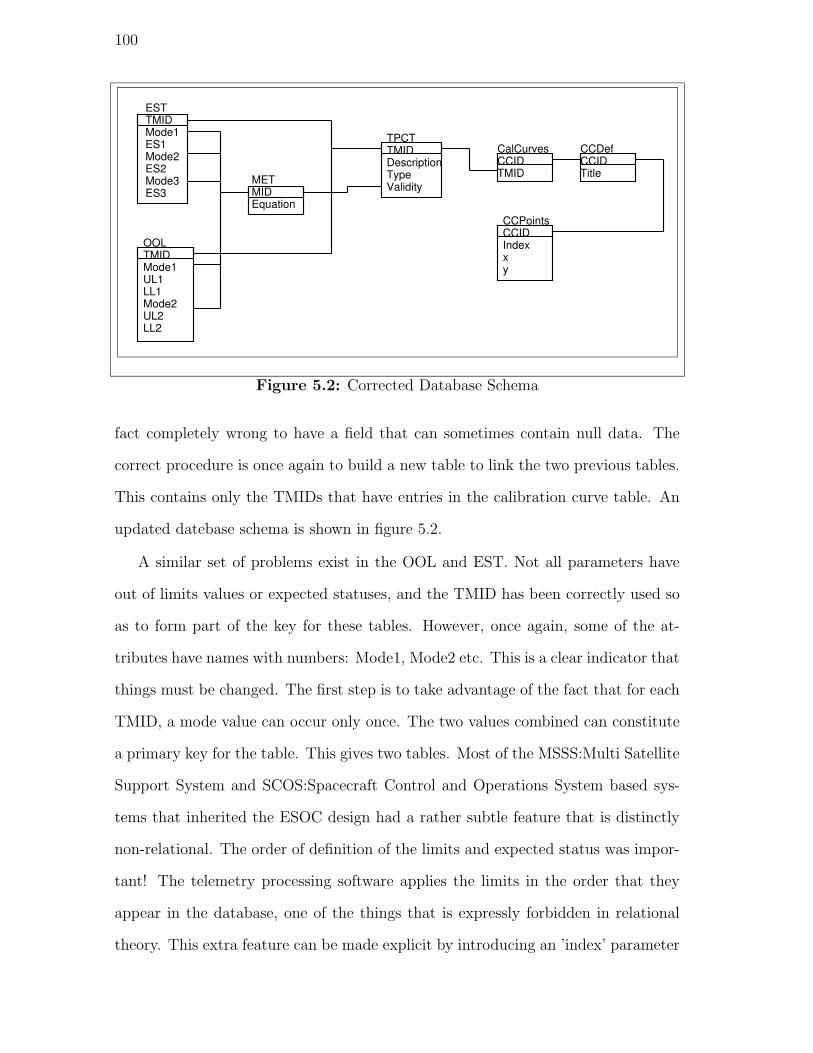
100
TPCT TMID Description Type Validity
CCDefCCID Title MET
MIDEquation
ESTTMIDMode1ES1Mode2ES2Mode3ES3
OOLTMIDMode1UL1LL1Mode2UL2LL2
CalCurvesCCID TMID
CCPointsCCID Index x y
Figure 5.2: Corrected Database Schema
fact completely wrong to have a field that can sometimes contain null data. The
correct procedure is once again to build a new table to link the two previous tables.
This contains only the TMIDs that have entries in the calibration curve table. An
updated datebase schema is shown in figure 5.2.
A similar set of problems exist in the OOL and EST. Not all parameters have
out of limits values or expected statuses, and the TMID has been correctly used so
as to form part of the key for these tables. However, once again, some of the at-
tributes have names with numbers: Mode1, Mode2 etc. This is a clear indicator that
things must be changed. The first step is to take advantage of the fact that for each
TMID, a mode value can occur only once. The two values combined can constitute
a primary key for the table. This gives two tables. Most of the MSSS:Multi Satellite
Support System and SCOS:Spacecraft Control and Operations System based sys-
tems that inherited the ESOC design had a rather subtle feature that is distinctly
non-relational. The order of definition of the limits and expected status was impor-
tant! The telemetry processing software applies the limits in the order that they
appear in the database, one of the things that is expressly forbidden in relational
theory. This extra feature can be made explicit by introducing an ’index’ parameter

101
TPCT TMID Description Type
CCDefCCID Title MET
MIDEquation
ESTMTMIDModeIndexESID
OOLTMTMIDModeIndexOOLID
CalCurvesCCID TMID
CCPointsCCID Index x y
OOLOOLIDULLL
ESTESIDES
Validity TMID Mode
Figure 5.3: Completed Schema
to be used to show in which order the checks should be applied.
The next potential improvement is to allow for the fact that telemetry parameters
may have similar limit sets or expected status sets. For example, if individual cell
voltages are available, they will usually be identical. This means that perhaps 120
limits (if there are three batteries of forty cells each) will be identical. This can be
performed by allowing a limit set to have an identifier. It is important to emphasise
that this places no restriction upon the ability of the user to define any possible
limits upon any telemetry parameter. It is simply an opportunity to reflect a real-
life situation in the relations in the database structure. Any sensibly defined editor
would make such changes transparent to the user. The well-protected user does not
need to act upon the tables directly. She/he can access the contents of the database
via forms populated with suitable queries that access the tables. These changes are
shown in figure 5.3.
5.2.5 Discussion
Some of the changes that have been made to the initial database may be perceived
as being cosmetic, but they brought about a substantial increase in the robustness
of the database, without necessarily changing the interface for the user in terms of
data entry forms or printouts. For example, in the initial case, consider what would

102
have happened if a parameter did not need a calibration curve. In the field for the
calibration curve identifier in the TPCT, there would be a null. Now consider the
case when someone enters a calibration curve number in that field that does not
exist. Either we accept that the database can be inconsistent for a while, or we have
to write some software to check one of the other tables and to trap this error if it
occurs. If the database is only single user, this is possible, but if many users can
write and read from the database, either we need to take a very defensive view point
and lock all records, making the database single user for a short time, or we accept
that people risk working with an inconsistent database. In the relational model, flags
which indicate that an item is present in another table are simply not necessary, and
such a mistake is not possible. However, then it becomes important to understand
the relationships between the tables. Indeed, the relationships between the tables
are just as important as the contents of the tables.
5.2.6 Object-oriented Databases
Nobody who has been in contact with information technology in the last 10 years
can have escaped the latest fashion, object- orientation. The general idea is that
object-oriented languages enable people to program at a higher level of abstraction.
Rather than dealing with bits and bytes, or integers and records, people can en-
capsulate a certain amount of functionality and data together to make an object.
The object (some languages prefer to talk about instances of an object) can only be
interfaced through a predefined set of messages. The advantage of encapsulation is
that it allows the internal representation of objects to be changed without requiring
any of the applications that use those objects to be rewritten - provided of course
that any such change in the internal representation is accompanied by a correspond-
ing change to the code that implements the applicable methods. In other words,
encapsulation implies data independence.

103
Object-oriented languages have managed to tame, to a certain extent, the mas-
sive complexity of tangled computers and protocols that are used in modern user
interfaces. Almost inevitably there has been trend to start using them first, to inter-
face with databases and then within databases. The current fashion is to actually
’store’ the objects in a database, however there are a number of ’standards’ for doing
so, none of which seem to be wholly satisfactory. There is no clear definition of what
constitutes an object (some answer ”Everything!”[38, 8], some exclude integers[6],
some exclude strings etc. etc[35]). Moreover, difficulties exist in interconnecting
object-oriented databases in a way that is not a problem for relational databases.
For example, if an object is identified by an Object Identifier in one place, it is not
at all clear if the same set of data should have the same Object Identifier when it is
replicated to a different site or be assigned a different one [8]. The author’s profes-
sional experience in this area is that in order to get differing object-oriented systems
to communicate, an extra layer of software (often referred to as ”middle-ware” is
required. This can further chain the database, which should be a logical model, to
a particular technology, which is a major disadvantage for the overall maintenance.
ESOC has developed (yet another) new generation control system [20] that is
object-oriented, but all of the current control systems store the ”Mission Information
Base” (new generation terminology for the database) in a relational database, albeit
that because so many tables were carried forward from a previous system, the tables
are still far from normalised.
5.2.7 Run-time Databases
Historically, telemetry processing was so computer intensive that it could not always
be performed in real-time. In order to minimise the computational effort, the infor-
mation in the database was de-normalised, spread out into a form that was easier

104
to access from the control system. This normally meant that after a change to the
database had been made, a separate distribution had to be performed. This might
have required anything from a short pause in telemetry processing to a restart of
the system software. Operationally such a two phase system is highly undesirable.
It brings with it separate problems about version control (when was the distribu-
tion started? Did my changes get incorporated?) and traceability (what was in the
database when this parameter went out of limits?).
Since processor speeds are now so much greater, there is little justification for
the run-time distribution, but many systems are so locked in the past it is a major
change to upgrade them. For example, one previous system was hosted on a machine
that was so fast that it was only ever possible to see any CPU usage when one of the
tasks was stuck in a loop. The rest of the time it was using less than 1% of CPU.
5.2.8 Database Summary
With the current level of technology there is no significant benefit in moving to
leading edge technology (often rightly referred to as the bleeding edge). Much benefit
could be obtained by the operations engineers having a much greater knowledge of
the intricacies of the database and the reasons for its current architecture.
5.3 User Manual
The User Manual (or Operations Handbook, ORH) is supposed to describe every-
thing that it is necessary to know about an instrument or subsystem. In short, it
should describe:
• what it is,
• how to operate it,
• what to do if things go wrong.

105
It normally consists of a mixture of plain text, diagrams and pictures. Often the
prime contractor is required to make a presentation on the satellite and sub-systems.
There are a number of limitations with the attempt to transfer knowledge by means
of the User Manual.
1. Normally the documentation has to be supplied in English, but none of the
remaining prime contractors in Europe are actually in Britain. Consequently
the UM is often written by people whose first language is not English, and it
is often poorly written and poorly structured.
2. Often the UM is prepared and delivered late in the project. The prime con-
tractor has schedule pressures from a number of sources, and the UM is a
low priority. Nobody will delay the launch because the documentation is not
ready.
3. Few engineers enjoy writing about what they have already developed, and
often do not see it as part of their main functions.
4. The writing of the UM tends to get passed down to junior staff who often do not
have the in-depth knowledge that goes across departmental and professional
boundaries, and do not have the position or power to get this information.
5. It is possible to review a document for correctness, but it is impossible to judge
whether anything is missing.
Since the User Manual is usually produced by the team that designed the sub-
system or instrument, when there is a conflict over the allocation of resources to
resolve a problem with the flight article,the documentation always loses out. Fur-
thermore, this means that the documentation tends to suffer from the same problem
as the whole spacecraft life-cycle: it takes such a long time to produce, that few peo-
ple stay in the same job on more than one project and so few people produce more
106
than one User Manual in a lifetime.
Furthermore, since there is no standard structure for the information to be pro-
vided, it varies enormously in quality and quantity from one sub-system or instru-
ment to another and from project to another. Just because the documentation
produced by a company was good on a previous project, that does not mean that it
will be good on the next project since there is no real process in place to make sure
that documentation is produced, and that the quality increases with time
5.4 Flight Control Procedures
Almost everywhere within the space industry (and other places and industries),
people operate according to procedures. The Flight Control Team will normally
spend several man-years of effort in preparing a massive document called the Flight
Operations Plan, FOP. Normally the contract with the manufacturer specifies that
procedures shall be delivered, but these are often incomplete or incorrect, since the
manufacturer usually has very little experience with flight operations. This is often
further complicated by the presence of Customer Furnished Items, CFI: a part of the
spacecraft or payload developed by a separate contractor or, on scientific missions, a
consortium of scientists. The manufacturer will usually, and understandably, refuse
all responsibility for CFI, on the basis that they are beyond its control. Unfor-
tunately this can result in the database, User Manual and flight procedures being
incoherent or incomplete since they were developed by different teams.
At ESOC (and according to the author’s experience, throughout most of the Eu-
ropean space industry) nominal procedures for operating the spacecraft and instru-
ments are referred to as Flight Control Procedures (FCP). Procedures that should be
executed in response to an out-of-limits condition or an emergency are called Con-
tingency Recovery Procedures (CRP). In North America the naming differs only

107
slightly, and in Russia same terminology is used. The term timeline is used to de-
scribe a series of activities over time. The advantages of working by procedure are
that they bring reproducibility of workmanship and traceability. If the procedures
are correct, they will normally produce the correct result, unless the wrong proce-
dure is being used (or at the wrong time) or the system has changed (e.g. due to
failure or aging). Even if the procedure does not work, it will usually be possible to
call an expert to investigate, and restore the system to an operational condition and
then improve the procedure. Thus the use of procedures should produce a knowledge
base that is always improving.
The disadvantages of working by procedure are that they can result in a de-
skilling of the task, and a lack of flexibility in the resultant operations. The latter
can be overcome organisationally, by maintaining the team so that it can respond
to the changing needs of the operators by writing or rewriting the procedures.
In the author’s experience there is often a lack of understanding about how to
write procedures. The following guidelines encapsulate the author’s experience of
writing procedures, helping other organisations to write procedures and integrating
sets of procedures from different authors and organisations to get a homogenous
operations concept. There is more than a passing resemblance to the algorithm
outlined for normalising a database. Perhaps this is not surprising, since the idea is
reduce duplication and simplify the choice of procedure as much as possible. Some
of the rules conflict with each other to a certain extent.
1. Procedures should be written to perform a single activity or for a single pur-
pose.
For example, if a system is designed so that it can fail for many reasons, but
that the resultant action is always to switch to a redundant unit, then there
could be one procedure for diagnosis, and then another procedure for switching
to the redundant unit. This could help avoid the proliferation of procedures

108
such as
(a) Pump failure diagnosis after low flow rate alarm
(b) Pump failure diagnosis after temperature alarm
(c) Pump failure diagnosis after voltage alarm
(d) Switch over pump due to mechanical blockage
(e) Switch over pump due to electrical failure
(f) Switch over pump due to routine maintenance
because the last three might essentially only contain the same activities. In-
deed, unless the activities associated with the first three activities were found
to be very lengthy, it would probably be preferable to condense them into a
single anomaly/malfunction diagnosis procedure,since as a system fails, it is
not always predictable which symptom will be appear first, and executing a
procedure that is too focussed on one aspect may prevent the operator from
getting an overview of the real problem. Thus the above six procedures could
easily be condensed into the following two:
(a) Pump failure diagnosis
(b) Pump switch over
2. Procedures should generally be tied as closely to the sub-system as possible.
This is important because procedures should normally be written by people
with detailed knowledge of the particular sub-system or instrument. This helps
maximise the chance that the procedure is complete and correct. However, the
very fact that the procedure is being written by a specialist means that if they
make assumptions about things outside their specialisation, they may be wrong
or somehow in-applicable to the situation that pertains when the procedure

109
is run. For example, this could occur when an instrument procedure makes
assumptions about the telemetry rate, or power budget or attitude, all of which
are factors that normally need to be managed very closely at system level.
3. The number of system level procedures should be minimised with only proce-
dures that change multiple subsystems being considered as system level pro-
cedures.
4. A good procedure should indicate when it is appropriate, and also when it
cannot be used.
5. The number of procedures should be as small as possible.
6. However,the procedures should cover every planned activity and cater for each
defined failure mode.
5.5 System Validation
The database is normally developed by the industrial prime contractor and the
sub-contractors and instrument principal investigator teams. They can introduce
changes and tune limits, change status texts, etc. during the integration of their
systems and instruments. The database is delivered to the control centre either in
the form of printout, or increasingly through electronic media. Within the control
centre, the database must be either entered manually into the database system used
for the control system or imported electronically. This is obviously a substantial
amount of work, especially if it needs to be repeated if updates are received.
If the database system in use in the control centre is different from that in use by
the manufacturer, then obviously there is a need to validate the database before it
is used in mission operations. The normal way to do this is to arrange a few periods
where the Mission Control System can receive telemetry from the manufacturer and

110
send telecommands to the satellite while it is still on the ground. These are referred
to as System Validation Tests, SVT.
The ground segments for the most recent ESOC missions have been designed to
use a single database, which can be accessed by the prime contractor, the integration
team, the scientific instrument teams as well as the operations team. Changes
between databases propagate automatically from one site to another.
SVT are still necessary even with a common database, since they also validate
as far as possible the flight procedures, the Mission Control System and can help
to confirm (or disprove) the Flight Control Team’s understanding of the way the
satellite works.
Since the spacecraft is often being procured as part of a much wider programme
(e.g. for global navigation systems, or for scientific investigation) it is important to
test the overall system. A series of tests referred to as End-to-End tests, or System
Operational Verification, are used for this. Normally this should include the entire
space segment (e.g. the spacecraft and payloads while they are still on the ground)
as well as the ground segment, perhaps including scientific institutes, and industrial
partners from around the world. As the scope of the system grows, it becomes not
only more difficult to find windows when all the partners are available, but more
important to do so.
5.6 Simulations
Simulation is more than a tool for the pre-launch preparation, it is one of the most
useful techniques available for all phases of the mission. It does not matter that the
simulator is usually not a high fidelity representation of the whole spacecraft. As in
other industries, the simulator exists to replace the resource of interest (the satellite
or instrument(s) or payload) but it also means that certain elements of the ground
segment are not required.
111
At ESOC, simulators are usually built (i.e. the software is written) by an inde-
pendent company, not the satellite prime contractor. This is because the simulator
is procured as part of the operations activities, not part of the satellite engineering.
This can lead to difficulty in accessing timely, correct, detailed information about
the satellite design, but it does have the advantage of having an independent com-
pany compare the different levels of design documentation. This can be especially
useful when the instruments are customer-furnished items, and the prime contractor
does not need to study beyond the interfaces.
At ESOC, since the various satellites are typically very different from one another
in their system design and target mission, it is usual to prepare for the launch with
a very intensive simulations campaign. This consists of various stages:
OCC Simulations: The mission control team in the Operations Control Centre
(OCC) work with the simulator replacing the entire ground
segment and space segment. The use of the simulator means
that the flight control team can rehearse procedures that might
be difficult, dangerous or impossible with the real hardware.
Station Simulations: The ground station personnel train on their own using all the
real ground station equipment and simulated data. Histori-
cally data tapes were recorded from satellite testing and dis-
patched to the ground stations, but now there is usually a
simple test system (e.g. PC-based) that provides a source of
telemetry and a sink for telecommands. Since most satellites
now use closed loop packet telecommanding with verification
of reception onboard, normally the test source can even re-
act to telecommands by providing the correct verification of
reception and command execution.

112
Network Simulations: The ground station staff and equipment take part in the sim-
ulation, playing their actual role at the correct time, and the
mission control team interact with the simulator for data, and
the ground stations for data and voice interfaces.
Integrated Simulations: Not all missions require these. This is the name given to
simulations with external agencies (e.g. During the EURECA
launch/retrieval, NASA Johnson Space Center, including the
astronauts), but at ESOC the term is used for any partici-
pation e.g. use of an external ground station with no extra
control centre.
The simulations are very important because it gives a chance for the flight pro-
cedures, control system and database to be verified in a meaningful way, as close
as possible to the actual operational scenario. The learning also takes place at a
higher level, since the simulations campaign is a opportunity for the control team to
grow together and start operating and feeling like a team. Prior to this phase, the
relevant people were working in isolation: The flight dynamics people concentrating
on their own issues, software specialists on development and testing, and the flight
control team were normally been concentrating on understanding the User Manual
and writing procedures.
As Green reports, based on extensive results in the aviation industry, ’...training
has two distinct functions. The first is to provide the pilot with practice in executing
the skills and procedures that he will need to to deal with real emergencies in the
air. The second is to reduce the stress generated by the real emergency and to
prevent it reaching incapacitating proportions by exposing him to the same, or
similar conditions, in the simulator’ [18].
The simulations campaign provides an invigorating way of learning to work as a
team, and also in gaining confidence that the team will be able to solve the problems

113
when they occur on the day. This can be very important for the members of the
team who are new to the project.
5.7 Reviews
Reviews are the formal process that organisations try to go through in order to
maximise the likelihood of mission success. The actual milestones vary from one
organisation to another, but typically there will be separate reviews for the space
segment and ground segment. For the space segment (and for the project as a whole)
the following reviews may be scheduled:
• Preliminary Design Review
• Critical Design Review
• Flight Readiness Review
• Launch Readiness Review
These can be very intimidating to the uninitiated, since there is normally a Review
Board populated by upper management who are trying to go through the details of
the project, and who call for evidence to be presented to them in an almost judicial
manner. Unfortunately, there is usually little time available for these excellent minds
to sift through the details of the project in any real depth,and so normally the project
team have to decide what is important, and draw it to the attention of the board
members for their consideration.
This judicial atmosphere, and the conflicts resulting from resource and schedule
pressures, can make the formal review rather adversarial. This can mean that the
review board gets very little information on which to base decisions. The people
empowered to speak are the line managers and team leaders, and any doubts or
lack of approval from the team members can easily be missed out. Rather like the

114
’first past the post’ election system in the UK elections, it tends to give rather
extreme results than proportional representation. This is the effect referred to as
’polarisation’ in Section 3.4.4. It is interesting to contrast the recorded remarks of
senior management during the shuttle STS 51-L Flight Readiness Review, such as
’My God, Thiokol, when do you want me to launch, next April?’ and some of the
rules outlined in Section 3.4.4 designed to be used to correct a good group decision.
Vaughan [40] reports how, after having gone through the Flight Readiness Review
for the Shuttle launch STS 51-L and reached a launch decision, when asked about
their opinions about some new data, many specialist engineers simply thought that
their ideas about how a sub-system might perform were simply not of a sufficient
quality to voice in such a forum: ”I felt we didn’t have a real strong position. We
had a lot of, you know, feelings that we were concerned about those temperatures,
but we didn’t have a solid position that we could quantify”[40]. The atmosphere had
then changed so that ”instead of proving that it was safe to fly, they had to prove
it was unsafe.” The mission ended 73 seconds after launch as STS 51-L, Challenger
and its seven crew disappeared in a huge fireball.
This demonstrates how people, and organisations, must retain humility and scep-
ticism to function correctly. NASA had basically made risk-taking part of the routine
on the Shuttle programme, since before the first flight, there were six volumes on
the acceptable flight risks. NASA and the contractor seemed to be participating in
”a kind of Russian roulette. ... (The Shuttle) flies (with O-ring erosion) and
nothing happens. Then it is suggested, therefore, that the risk is no longer so high
for the next flights. We can lower our standards a little bit because we got away
with it last time. ... You got away with it, but it shouldn’t be done over and over
again like that”[36].
Eventually, overturning the STS 51-L launch decision would have been implicitly
overturning all of the previous launch decisions as well, and that was too great a

115
task for any one person, or organisation.
5.8 Summary
As mentioned in Chapter 1, since the satellite is often being operated by a different
organisation to the one that built or integrated it, somehow the people responsible
for operating the satellite must trained and prepared for their forthcoming tasks.
The transfer of knowledge is an essential part of spacecraft operations engineering.
This Chapter has shown that most low-level information is now transferred in the
form of a database.
The satellite database is one of the most important interfaces between the satel-
lite constructor(s) and the satellite operator(s). However, the higher-level knowledge
is still transferred separately, usually in the form of documents containing textual
descriptions, diagrams and procedures. This makes the descriptions and procedures
potentially inconsistent with the database and because it is also manually produced,
it may also be internally inconsistent or incomplete.
As outlined in the previous Chapter, the users require skill-based, procedure-
based and knowledge-based behaviour. The User Manual is one of the terms used
to describe the documentation that the spacecraft developer is supposed to deliver
to help the end-users understand and operate the spacecraft and payloads safely
and successfully. The User Manual should be the source of procedure-based and
knowledge-based behaviour.
The User Manual is usually produced by the team that designed the sub-system
or instrument. Thus, when there is a conflict over the allocation of resources to
resolve a problem with the flight article,the documentation always loses out. Fur-
thermore, this means that the documentation tends to suffer from the same problem
as the whole spacecraft life-cycle: it takes such a long time to produce, that few peo-
ple stay in the same job on more than one project and so few people produce more

116
than one User Manual in a lifetime.
Since there is no standard structure for the information to be provided, it varies
enormously in quality and quantity from one sub-system or instrument to another
and from project to another, and just because the documentation was good on a
previous project does not mean that it will be good on the next project since there is
no real process in place to make sure that it is produced, and that quality increases
with time. Chapters 7 and 8 of this work indicate some of the methods that could be
used both to ensure that documentation thorough, and to reason with the knowledge
that is encapsulated in the documentation.
Spacecraft (or a family of spacecraft) are frequently being procured as part of
a whole system, which often has a very large ground segment that needs to be
developed, maintained and operated in parallel to the space segment. Section 5.5
discussed how the ground segment and the space segment are validated.
The role of simulations in preparing the individuals and teams mentioned in
the previous Chapter was discussed in section 5.6. It shows how they are useful in
preparing the individuals to cope with the stress of operational situations, as well
as forging a team.
Since satellites are normally only procured by large organisations, there is nor-
mally a formalised process for checking the progress at various phases in the pro-
curement and operations. These are called reviews. This was discussed in section
5.7. Reviews are particularly important since they force management to take a po-
sition on various items that are flagged as risks to the programme. However, this
only operates correctly if the correct data is made available to the correct people.
As mentioned previously, in large organisations there is a danger that the reviews
may become so formal that the people who have the working knowledge may not
feel that they are able to participate in this process. A good example of this was the
almost judicial nature of the NASA flight readiness review boards. This prevented

117
the free flow of information that was vital for making the launch decision correctly.

118

Chapter 6
Control Systems
6.1 Introduction
The procurement of a Flight Control System (FCS) is one of the major tasks that
faces a flight control team as it prepares for launch. This is also one of the major
costs of the pre-launch ground segment preparation activities, since not only must
the system be specified, it must be designed, tested and accepted before the mission
operations can begin.
Section 6.2 examines the options for procuring a control system, first looking
at the buy-or-build decision, and then the contractual implications of fixed price
developments compared to time and materials developments. This section links
strongly into Section 6.3, which looks at the issues of commonality between the
check-out system used by the spacecraft manufacturer and then control system that
is designed to be used by the operations team after launch.
It is often tempting to try to bring cost-savings to a project by introducing
automation, either to the space segment or into the ground segment to control the
space segment. The issue of when and how to automate the ground segment is
discussed in 6.4, which presents some of the complications of doing so, as well as
some of the theoretical limitations to the automated approach.
119

120
6.2 Control System Procurement
There are various options about how the FCS can be procured. One of the first major
choices is whether it should be based on an existing solution, hopefully for either a
similar mission or using a generic system. The fashionable phrase at the moment is
COTS - Commercial Off The Shelf software. The general idea is that it is possible to
define some set of core functions across all missions, and then to adapt the generic
system to meet the particular needs of the mission and that this should be cheaper
than writing an entire control system from scratch. A compromise architecture is
to adopt a generic kernel, and then write further software as necessary. This is
generally what ESOC does.
The next major choice is about how the procurement contract should be financed,
typically being a choice of either Fixed-price or Time and Materials (T&M). If a
fixed-price contract is to be placed, then normally the requirements must be precisely
known and stable. Every change to the requirements after the contract kick-off
will usually result in an additional charge from the developer. Time and materials
contracts are unfashionable at the moment, the feeling being that it encourages
developers to use up all available resources during the development phase, and to
not be sufficiently ’goal oriented’. However, a fixed price contract is essentially a bet
with a contractor about the effort needed to implement the requirements. Naturally
all prudent contractors will include margin in their estimates, a risk premium on
top of the estimated actual costs of delivering the system as specified. This extra
margin is why a fixed-price solution is not always the cheapest development method,
depending generally upon the stability of the requirements and the availability of
any deliverable items that are required as inputs to the contract. A fixed price
contract can lead to some very bitter negotiations about the detailed interpretation
of the requirements, and usually the developer is in the stronger position: the flight
control team simply cannot fly the mission without the control system, and as time
121
continues to run, that puts increasing pressure on the purchaser to make extra funds
available to keep the developers working.
There is a strong tendency for a COTS architecture to imply a fixed-price con-
tract, but this does not always have to be the case.
As discussed in Chapter 2, during the satellite design, integration and test a
control system is needed to monitor and test the satellite units and systems. This
is normally referred to as the Central Checkout Equipment, CCE. Regardless of the
details of the positioning of the satellite with respect to other satellite missions, there
is normally a lot of commonality between the needs of the Flight Control team post-
launch, and the needs of the AIV team before launch. This means that normally
two systems are developed to meet a similar set of needs. This is independent
of the architecture (COTS or bespoke) of the implementation, although obviously
the more flexible the system, the more likely it is to be able to satisfy the diverse
requirements.
6.3 Commonality Between FCS and CCE
This section examines the very high-level functional requirements for a Flight Con-
trol System and a Central Checkout System. The functional building blocks for a
Flight Control System and for the Central Checkout Equipment are given in Figure
6.1 and Figure 6.2.
We can now discuss and compare the functional building blocks represented in
figures 6.1 and 6.2 to show what functions are common in the CCE and FCS.
• Man Machine Interfaces - this function provides the operator with the inter-
faces to the monitoring and control system, including the database system.
The layout and content of each display used for telemetry and telecommand-
ing are defined in the database system. This function is identical for the FCS

122
Man Machine Interfaces
Chain
Database System
Ground Station Interfaces ExternalInterfaces
Functional Building Blocks for
FCPGenerator
OBSMM
DataArchive
Man MachineInterfaces
DatabaseManagementSystem
TMProcessingChain
TCProcessingChain
Ground StationInterfaces
FCP
Generation
OB
SM
External
Interfaces
Data
Archive
Figure 6.1: Schematic Diagram of Functions in FCS
Man Machine Interfaces
Chain
Database System
Ground Station Interfaces ExternalInterfaces
Functional Building Blocks for
FCPGenerator
OBSMM
DataArchive
Man MachineInterfaces
DatabaseManagementSystem
TMProcessingChain
TCProcessingChain
Spacecraft Interfaces
FCP
Generation
OB
SM
External
Interfaces
Data
Archive
Figure 6.2: Schematic Diagram of Functions in CCE

123
and CCE. It must be possible to define or select screen layouts according to
which tasks are currently being undertaken.
• Database System - this function allows the definition and handling of all the
mission parameters required to drive the system. This includes mainly all
detailed definitions of telemetry and telecommands and of the user-definable
displays. The CCE must monitor and control the spacecraft and ground test
equipment so the CCE database should include definitions required for these
functions.
• Telemetry Processing Chain - this function performs the processing of teleme-
try, including parameters extraction and interpretation, automatic limit-checking,
short-term filing and special processing (derived parameters). The Teleme-
try Processing Chain is driven by the definitions stored in the operational
database. For CCE functions telemetry processing chain must also be capable
of monitoring Special Checkout Equipment (SCOE).
• Data Archiving and Distribution - this function supports the long-term archiv-
ing and the on and off-line (retrieval) data distribution to a variety of exter-
nal users to the FCS, in particular to the scientific community, industry and
Project engineers. In the FCS this function has to satisfy strict security rules
in order to prevent external access to the front-end control system.
• Telecommand Processing Chain - this function performs the processing nec-
essary for telecommands construction, uplink and execution verification. The
command processing chain is driven from the command and sequence defi-
nitions stored in the operational database. For the CCE, the telecommand
processing chain must also be capable of commanding SCOEs.
• Ground Station Interfaces - this function handles all interfaces to the ground
stations for a number of functions such as Telemetry, Telecommands, Tracking,

124
transfer of station-specific files, etc. The Flight Control System must be able
to simultaneously connect to several ground stations. This is clearly unique to
the FCS although a corresponding, unique interface exists for the CCE, since
it may be required to communicate with the spacecraft in a way that is not
possible during mission operations, i.e. via a hardwired link.
• Procedures - The CCE uses computerised procedures to automatically drive
the test sessions. These are sometimes referred to as test scripts. They contain
instructions to the test equipment, commands for the spacecraft and decision
steps using the monitoring functions of the telemetry chain (for both space-
craft and test equipment data). The analogous components for the FCS are
referred to as Flight Operations Procedures. This scope of this function in-
cludes the tools to produce all the procedures and timelines necessary to carry
out the flight operations. Typically the final product is a paper document,
the Flight Operations Plan, but connections of the generation tool to the
Database System is required to allow automatic references to the telemetry
and telecommand items and generation of command sequences derived from
the procedures, to be stored in the operational database itself.
• On-Board Software Maintenance (OBSM) - this system that is used to main-
tain the on-board software via the normal uplink, the handling of configuration
control and the facilities required for uplink verification
• External Interfaces - for the FCS, these are the interfaces to other functional
blocks that form the overall ground segment facilities of a typical satellite
mission, e.g. the Flight Dynamics System. For a scientific mission this would
also include interfaces to the Mission Planning System, the Data Distribution
System, and perhaps to one or more Science Operations Centres. These are all
typically considered as unique, off-line functions. For the CCE this includes

125
the interfaces to the special checkout equipment and the payload checkout
systems which are controlled by the CCE.
From the above discussion it is clear that there is a large degree of commonal-
ity between the two systems. In particular, the following functions are duplicated
between the Flight Control System and the Central Checkout Equipment:
1. Man Machine Interfaces - there are clear benefits in maintaining the same man
machine interface for the CCE and the operational system because AIT/AIV
people are involved in mission operations and operational people are involved
in checkout activities. Keeping the same interfaces save preparation and train-
ing costs and increase safety.
2. Database System - there are clear benefits in maintaining the same database
for the CCE and the Operational System. This would save preparation costs
and make the two systems consistent. There should be one master database
for checkout and operations.
3. Telemetry Processing Chain - this function is in general the same in the two
systems and can be capable to monitor spacecraft telemetry and data received
from other external interfaces such as SCOE’s and ground stations.
4. Telecommand Processing Chain - this function is in general the same in the
two systems and can be capable to command the spacecraft and other external
interfaces such as SCOE’s and ground stations.
5. Control Procedures Generator - this function should combine the functions of
test script and flight procedures generation, using a common control language
that can be interpreted by the ground systems into single telecommands for
debugging.

126
6. Data Archiving and Distribution - this function is identical in the two systems
and should be combined with the obvious advantage to present to external
users the same functional interfaces for acquisition of data in all phases of the
project.
7. On-Board Software Maintenance - this function is identical in the two sys-
tems and should be combines with the obvious advantage to present the same
functional interface for on-board software maintenance.
6.4 Automation
It is often tempting to try to bring cost-savings to a project by introducing automa-
tion, either to the space segment or into the ground segment to control the space
segment.
When new automation is introduced into a system or when there is an increase
in the autonomy of automated systems, developers often assume that adding ”au-
tomation” is a simple substitution of a machine activity for human activity – this is
referred to as ’the substitution myth’[43]. Woods suggests that partly because in re-
ality tasks and activities are highly interdependent or coupled ’adding or expanding
the machine’s role changes the cooperative architecture, changing the human’s role
often in profound ways. New types or levels of automation shift the human role to
one of monitor, exception handler, and manager of automated resources’[43]. This
is shown in Table 6.1. ’What is needed is better understanding of how the machine
operates, not just how to operate the machine’[43].
The theoretical problem with any attempt to automate is the following: Godel’s
Theorem seems to indicate that any formal language above a certain complexity
used to describe a system is either inconsistent or incomplete. Incomplete in this
sense means that there are true statements about the system that cannot be derived

127
Putative benefit Results found in studies[43]better results, same system(substitution)
transforms practice, the roles of people change
frees up resources: 1. off loadswork
create new kinds of cognitive work, often at thewrong times
frees up resources: 2. focususer attention on the right an-swer
more threads to track; makes it harder for prac-titioners to remain aware of and integrate all ofthe activities and changes around them
less knowledge new knowledge and skill demandsautonomous machine team play with people is critical to successsame feedback new levels and types of feedback are needed to
support peoples’ new rolesgeneric flexibility explosion of features, options and modes create
new demands, types of errors, and paths towardsfailure
reduce human error both machines and people are fallible; new prob-lems associated with human-machine coordina-tion breakdowns
Table 6.1: Intentions of automation compared with results
from the system axioms. Godel dealt with first order systems, for example a series
of statements about a system. He then showed that going to a higher order system
(for example, making statement about all statements) introduces the problem of
either inconsistency or incompleteness.
Turing then went even further, looking at how a logic is applied to produce
deriving proofs, and he showed that even if a logic system contains only first-order
statements, it is possible to write a program that will not reach a conclusion in finite
time. Even worse from the point of view of applying logic to a control a system,
he showed that there is no way to tell in advance if a conclusion will be reached in
finite time i.e. the only way to see if a statement can be proven in a logic system is
to try to prove it!
Initially the ’system’ is defined as being the system, and the controller is separate;
the next stage is when the system equals controller + system, etc. This is not to say
that automation is impossible, it is aimed at sounding a note of warning to those

128
who think that automation can solve all problems. If a control system is designed to
maintain a system within certain boundaries, then this is possible. However, when
the system ’suddenly’(i.e. faster than the controller can cope with) moves into an
area where the controller was not designed to operate, the controller may not be
able to recover the situation and may even exacerbate it.
The key point seems to be the introduction of self-references. This ensures that
any system described in a language that is powerful enough to be expressive is also
incomplete. Without them, the language is not expressive enough. It is possible to
side-step this constraint for one moment, by introducing a meta-language which can
reason about the first language, but the same question then immediately arises in
the meta-language. The solution to this problem is then a meta-meta-language ...
and so on.
The only way out that still produces something useful is to try to transcribe some
of the problems and pitfalls that have already been incurred on various projects,
describe some of the lessons learned, and generally provide a ’check list’ of things
that should be considered on various missions. The problem that is encountered
straight away is that descriptions differ from one project to another, and even from
one person to another on the same project.
Hofstadter[24] introduced the terms I-mode and M-mode to describe two different
kinds of reasoning. In M-mode, it is possible to work only ”in your capacity as a
machine”, thus applying axioms or production rules to the already proven set of
theorems. In I-mode, by contrast, the work is ”in your capacity as a thinking being”.
If the documentation is perfect (even if it presented in some pseudo-mathematical
notation such as a formal method) it is possible to get a lot of information using
M-mode to generate new theorems. Perhaps that will be sufficient to cover almost
every situation that is likely to be encountered, but there will still be room for
I-mode thinking, to assess commonality, and spot differences in behaviour. The

129
operations engineer needs to be able to perform in both modes.
One of the more practical reasons against major automation can be explained
by comparing the cost of automation compared with the the cost of manpower. The
author proposes that these can be broadly modelled as expecting to scale as shown in
Figure 6.3. The cost of automating the first stage of the operations should be quite
low, but the cost will increase, probably at an increasing rate, as the automation
is required to do more, e.g. handle all different failures, special cases cases that
might occur, restart after any problems, handle exceptional cases. Conversely, the
manpower costs for a very low level of automation will be very high, if this includes
manually generating telecommands and checking telemetry raw values. This will
reduce as the automation increases, but eventually the saving will be very small,
since it is difficult to eliminate all positions, since the manpower analysis should also
include the problem of who maintains and operates the automated system.
Each organisation should decide for itself how much it would cost to develop each
level of automation, compared with the savings that would be realised by reducing
the manpower level. In making this decision, it is also important to include the
amount and level of training that will be required to operate the system over the
lifetime of the project and to maintain the skills of the staff at the appropriate
level. Dekker et al [10] report a number of organisational problems associated with
the introduction of automated systems, particularly illustrated by a ship which run
aground after nearly two days of being guided precisely off-course by a GPS-based
system that was displaying an error message after its antenna became disconnected.
However the meaning of the message was not understood by the crew, and the crew
failed to investigate the difference between the location reported by the GPS system
and the other means available [10]:
• During the entry into service, the manufacturer provided familiarisation train-
ing to the first crew. However, at the time that the ship ran aground, only

130
Scope ofAutomation
0% 100%
Scope ofAutomation
0% 100%
Cost ofAutomation
Cost of Manpower
The authors model: the cost of automation will generally increase with the scopeof automation whereas the cost of manpower will decrease as the amount ofautomation increases. The optimal point will be for each organisation to decide,perhaps on a mission-specific basis, as a function of how efficiently it can developor re-use automation, compared with the cost of the manpower available to it.
Figure 6.3: Automation and Manpower

131
one member of the crew remaind from that original session;
• Training of other crew members had been ’on the job’;
• None of the crew was fully proficient in the navigation system, and certainly
did not understand its failure modes;
Training restricted a basic set of modes, and how these modes work in routine sit-
uations. Often this is all an organisation can offer in terms of preparation, because
instructors themselves (often colleagues) are not proficient in or exposed to the sys-
tems broader functionality. Dekker refers to this as ’teaching of recipes’[10]. ’Recipes
restrict the range of options and modes taught, and they concentrate on the systems
input-output relationships rather than on its internal workings...pedagogically and
operationally, recipes are problematic. They work only if the basics provide a co-
herent foundation that aids learning the more difficult parts. That is, if they equip
practitioners with the appropriate skills for coordinating the automation in more
difficult circumstances...Generally, recipes create the ironic situation that training
focuses on those parts of the automated systems that are the easiest to learn. The
more complicated parts, the surprising mode transitions, the unexpected failure
modes, these are all for individuals to learn later on their own... And for them to
learn on the line[operationally], where slack to recover from going sour ... may not
exist’[10].
Dekker gives a further examples, quoting an airline pilot as saying, ’I can’t fly
anymore, but I can type fifty words a minute now’ and another captain (about
the interaction with the aircraft mode control panel), ’Oh now it goes into this
mode - that means I can...uh... I cant ...uh...move the throttles by hand, or...I’m
not sure exactly’[10] which reinforce the fact that the organisational aspects of the
introduction and maintenance of automated systems must be fully accounted for in
the decision-making process.

132
6.5 Summary
This Chapter has examined briefly some of the strategic choices that must be made
in developing a control system for spacecraft operations. There is substantial com-
monality across missions, holding out the possibility of large-scale reuse of software
and systems. This has resulted in an increasing number of COTS solutions being
proposed. This Chapter has shown that a common approach to checkout and control
system development is possible and that it might bring cost benefits. Even though
it might cost more in the initial phases such as review of the design specifications,
benefits and cost savings are expected to occur in the following areas:
• Overall development cost of the common building blocks
• Preparation of the mission database and flight operations procedures
• Consistency between checkout system and flight control system
• Validation of mission database and flight operations procedures
The approach of maintaining a single mission database has been followed on the
ESA projects Rosetta and Mars Express, and the integration between the ground
control system and the Electronic Ground Support Equipment (EGSE) has been
further extended for the ESA project Herschel/Planck.
This Chapter has also shown that automation is often introduced with the aim
of reducing costs, but studies have shown that the impact is often to change the
skill set required to do the job, and to drive up the indirect costs e.g. to maintain
proficiency at a level required for manual operation to take over from the automation
when the situation deteriorates, often under time pressure. The way automation can
contribute to the complexity of the overall operational scenario is further discussed
in Chapter 9.

Chapter 7
Vocabulary
7.1 Introduction
The User Manual is one of the names used to describe the documentation that the
spacecraft developer is supposed to deliver to help the end-users understand and
operate the spacecraft and payloads safely and successfully. Section 5.3 identified
several frequent problems with the documentation that describes the spacecraft and
its systems.
The User Manual is usually produced by the team that designed the sub-system
or instrument. Thus, when there is a conflict over the allocation of resources to
resolve a problem with the flight article,the documentation always loses out.
Furthermore, the documentation tends to suffer from the same problem as the
whole spacecraft life-cycle: it takes such a long time to produce, that few people
stay in the same job on more than one project and so few people produce more than
one User Manual in their career.
Since there is no standard structure for the information to be provided, it varies
enormously in quality and quantity from one sub-system or instrument to another
and from project to another, and just because the documentation was good on a
previous project does not mean that it will be good on the next project since there is
no real process in place to make sure that it is produced, and that quality increases
with time. Overall, it is fair to say that it is difficult to produce a user manual
133

134
because there is not standard to say what it should contain or how to produce it.
This Chapter indicates some of the methods that could be used both to ensure
that documentation complete and correct, and the following chapter, Chapter 8,
illustrates a way to reason with the knowledge that is encapsulated in the documen-
tation.
Section 7.2 illustrates how the introduction of new names for existing concepts
makes it difficult to produce the User Manual to a consistent standard and prevents
re-use of documentation from one project to another, and section 7.3 illustrates a
powerful new technique to make information available to the users in a systematic
way, that allows them to browse it graphically or scan hierarchies in a way that is
convenient for them.
7.2 Jargon
As Hamming[22] reports, ’Every field seems to have its own special jargon,one which
tends to obscure what is going on from the outsider - and also, at times, from
insiders.’ He defines jargon as a special language to facilitate communication over
a restricted area of things or events. However, it also blocks thinking outside the
original area for which it was defined to cover. Hamming even asserts that the use of
jargon is an instinctive social phenomena to increase the coherency of a group and
exclude outsiders[22]. Since groups now have much more interaction than before,
and projects often span countries or even continents, the use of such jargon can be
a significant impediment to the free flow of knowledge.
People (or at least, scientists and engineers) seem to have an inexhaustible ability
to introduce new names for things, even though they may be fundamentally the same
as existing devices. Once the name ’television’ was coined, nobody tried to insist
on giving a different name to the technique of viewing pictures at a distance, even
after it went from black and white (monochrome) to colour (polychrome) technology.

135
Consumers did not want to talk of CTV, instead of TV. But now the consumer is
weighed down by a whole new burden of vocabulary, such HDTV, D2MAC etc.
The same thing, and worse, happens in the space industry. For example, one
instrument on the Mars Pathfinder mission was called the MPC. This name hardly
gives any information about its function or architecture, but the name is clearly
tied to the mission: MPC stands for Mars Pathfinder Camera. The same unit was
designed to fly on a series of subsequent missions, but the prime contractor had to
change the name of this unit for each one. This is a classic way of obfuscation: Any
procedure or database item for this unit would need to be changed for each mission,
and if it were not otherwise known, the operations team might never realise that
their experience with one unit could have been relevant on a following mission.
Perhaps this is being done for commercial reasons: the magic though smoke
and mirrors of the Marketing Department might be able to present each unit as
more innovative, more important, more worth having if the name keeps changing.
Or perhaps this helps a Project Manager feel that he/she really is getting value
for money, since the unit now caries the name of the project embedded inside it.
However, this technique can sometimes backfire in other ways, besides loss of op-
erational knowledge. For example, High-resolution Radiometer for FIRST (HiFi)
was an instrument on the FIRST spacecraft, due to be launched in 2007. But the
project name has recently had its name changed from FIRST to Herschel, leaving
the instrument with a name that is almost devoid of meaning.
Some rules for avoiding this kind of (trivial and serious) problem are as follows:
• Avoid naming a unit after the technology that went into it.
• Avoid naming a unit after what it supersedes (advanced, improved, next-
generation etc).
• Name a unit after what it does, not how it does it, since functions are more

136
likely to persist with time.
• Never name a unit after the project or mission.
7.3 Ontology
An ontology is an explicit specification of some topic. It could be viewed as the
antidote to jargon, since each term has an explicit definition, and the relationships
between terms are also defined. The term ontology seems to generate some contro-
versy in AI circles. The word ’ontology’ is used in philosophy to refer to that part
of meta-physics which relates to the nature of existence.
In the context of knowledge sharing, the term ’ontology’ is often used to mean
the specification of a conceptualisation. It is ’a formal and declarative representation
which includes the vocabulary (or names) for referring to the terms in that subject
area and the logical statements that describe what the terms are, how they are re-
lated to each other, and how they can or cannot be related to each other. Ontologies
therefore provide a vocabulary for representing and communicating knowledge about
some topic and a set of relationships that hold among the terms in that vocabulary.’
[19].Thus it is really a formalised dictionary.
Ontologies are designed to help share knowledge. For pragmatic reasons, it is
usual to write ontologies as a set of definitions of a formal vocabulary, although
this is not the only way. They are often equated with taxonomic hierarchies of
classes, but class definitions, and the subsumption relation, but ontologies need not
be limited to these forms. Ontologies are also not limited to conservative definitions,
that is, definitions in the traditional logic sense that only introduce terminology and
do not add any knowledge about the world.
When the knowledge of a domain is represented in a declarative formalism, the set
of objects that can be represented is called the universe of discourse. For knowledge-
based systems, what ”exists” is only that which can be represented (perhaps this is

137
the cause of the adoption of ’ontology’ to express this concept). This set of objects,
and the describable relationships among them, are reflected in the representational
vocabulary with which a knowledge-based program represents knowledge. However
it is important to maintain a distinction between an ontology and a knowledge base.
An ontology is a common understanding of concepts. Knowledge may be represented
with an ontology and stored in a knowledge base.
In such an ontology, definitions associate the names of entities in the universe of
discourse (e.g., classes, relations, functions, or other objects) with human-readable
text describing what the names mean, and formal axioms that constrain the inter-
pretation and well-formed use of these terms. Formally, an ontology is the statement
of a logical theory.
We say that an agent commits to an ontology if its observable actions are con-
sistent with the definitions in the ontology. We use common ontologies to describe
ontological commitments for a set of agents so that they can communicate about a
domain of discourse without necessarily operating on a globally shared theory. The
idea of ontological commitments is based on the Knowledge-Level perspective [33] .
The Knowledge Level is a level of description of the knowledge of an agent that is
independent of the symbol-level representation used internally by the agent. Knowl-
edge is attributed to agents by observing their actions; an agent ”knows” something
if it acts as if it had the information and is acting rationally to achieve its goals.
Gruber [19] proposed a preliminary set of design criteria for ontologies whose
purpose is knowledge sharing and inter-operation:
• Clarity: An ontology should effectively communicate the intended meaning
of defined terms. Definitions should be objective. While the motivation for
defining a concept might arise from social situations or computational re-
quirements, the definition should be independent of social or computational
context. Formalism is a means to this end. When a definition can be stated

138
in logical axioms, it should be. Where possible, a complete definition (a pred-
icate defined by necessary and sufficient conditions) is preferred over a partial
definition (defined by only necessary or sufficient conditions). All definitions
should be documented with natural language.
• Coherence: An ontology should be coherent: that is, it should sanction in-
ferences that are consistent with the definitions. At the least, the defining
axioms should be logically consistent. Coherence should also apply to the con-
cepts that are defined informally, such as those described in natural language
documentation and examples. If a sentence that can be inferred from the ax-
ioms contradicts a definition or example given informally, then the ontology is
incoherent.
• Extendibility: An ontology should be designed to anticipate the uses of the
shared vocabulary. It should offer a conceptual foundation for a range of
anticipated tasks, and the representation should be crafted so that one can
extend and specialise the ontology monotonically. In other words, one should
be able to define new terms for special uses based on the existing vocabulary,
in a way that does not require the revision of the existing definitions.
• Minimal encoding bias: The conceptualisation should be specified at the
knowledge level without depending on a particular symbol level encoding. An
encoding bias results when representation choices are made purely for the con-
venience of notation or implementation. Encoding bias should be minimised,
because knowledge sharing agents may be implemented in different represen-
tation systems and styles of representation.
• Minimal ontological commitment: An ontology should require the minimal
ontological commitment sufficient to support the intended knowledge sharing
activities. An ontology should make as few claims as possible about the world

139
being modelled, allowing the parties committed to the ontology freedom to
specialise and instantiate the ontology as needed. Since ontological commit-
ment is based on consistent use of vocabulary, ontological commitment can be
minimised by specifying the weakest theory (allowing the most models) and
defining only those terms that are essential to the communication of knowledge
consistent with that theory.
Ontology design, like most design problems, will require making tradeoffs among
the criteria. However, the criteria are not inherently at odds. For example, in the
interest of clarity, definitions should restrict the possible interpretations of terms.
Minimising ontological commitment, however, means specifying a weak theory, ad-
mitting many possible models. These two goals are not necessarily contradictory:
the clarity criterion talks about a definition of terms, whereas ontological com-
mitment is about the conceptualisation being described. Having decided that a
distinction is worth making, one should give the tightest possible definition of it.
Formal languages are required to express an ontology which, as said earlier, is
nothing more than a formalised dictionary. A number of languages have been de-
signed or constructed to express ontologies. Just some of them are KIF (Knowledge
Interchange Format[17]), OKBC (Open Knowledge Base Connectivity[41]) and OIL
(Ontology Inference Layer[26]). There are many tools available on the Internet
for developing ontologies. Indeed, most representations have at least one tool set
that has been used to test the representation language, and many have many more.
OKBC is, in fact, a definition of a programming interface to allow different tools to
communicate with each other.
Part of an ontology created by the author is given in Appendix A as an example.
It works at the descriptive level, showing how a vocabulary can be structured from
the operational point-of-view, not going into too much detail when it would not
be visible either directly or indirectly to the ground-based team. The ontology

140
presented in Appendix A was originally developed by the author using a semi-
graphical User Interface onto a freely available web-accessed server-based system
Ontolingua[15]. This system was very useful, but it had the significant disadvantage
of being difficult to capture the output in a textual form suitable for incorporation
into a thesis. A further ontology was implemented by the author using the tool
Protege [30, 32] to meet the specific needs of an on-going project, and a snapshot
of the ”index” of this ontology is given in Appendix A. The following screen shots
illustrate the user interface and demonstrate how easy it is to use the tool. After
starting the application, the first window that the user can see is the Class Editor,
shown in Figure 7.1.
A Protege ontology consists of classes, slots, facets and axioms. Classes are
the concepts of a particular domain and, in terminology reminiscent of the object-
oriented approach popular in software engineering, each class has a set of attributes
called slots. A Protege knowledge bases includes both classes and instances of
The main window of the Protege tool. This is the Class Editor.
Figure 7.1: Protege Overview

141
classes. The Class Editor is used to control or create relationships between classes
(by moving classes around the hierarchy). Classes can have multiple super-classes
(”parents”) and multiple sub-classes (”children”).
The ”Relationship” window on the left of Figure 7.1 shows the hierarchy. It is
possible to click on one of items in the Class-Relationship window and ’drill-down’
through the hierarchy. If the user clicks upon a class in the Relationship window,
then the ”Template Slots” window shows the slots (attributes) of that class. This
is shown in Figure 7.2.
In the Class Editor, it is possible to click on one of items in the Class-Relationshipwindow and ’drill-down’ through the hierarchy. The slots (attributes) of each classcan be seen on the right-hand side in the area labelled ’Template slots’.
Figure 7.2: An Ontology in Protege
The author implemented the ontology in two main branches: the Equipment
hierarchy and the Interface hierarchy. The Equipment branch follows the typical
breakdown of the spacecraft according to the author’s experience, having separate
branches for System, Instrument, Unit, Actuator and Sensor. The Interface branch

142
was designed to show how the items specified in the Equipment branch are connected
with each other, which might include electrical interfaces, such as 28V power supply,
or a data exchange. The data exchange interface was further refined into a serial link
or a data bus, which were then further refined into different standards frequently
encountered by the author, such as an SMCS-1355 link, and a Mil-Std 1553 data bus.
Since the ontology is checked by the editor, it is possible to specify that a certain
kind of relationship can only take place between certain classes, for example, that a
only classes that have the ”28V class” as a superclass can supply or receive 28V i.e.
it is possible to check the knowledge base for internal consistency. Conversely, it is
also possible to specify the ”arity” of relationships, the number of participants, so
that a Mil-Std-1553 bus class might, for example, require precisely one class to be
specified as a bus master, and at least one class to be specified as a remote terminal.
The ontology is augmented by the presence of instances which illustrate how the
ontology would be used to describe a particular mission. Figure 7.3 shows how the
user can create instances of a particular class and fill out the data for their slots
(attributes).

143
This screen shot shows the Instance Editor. It is used to populate the ontology.This makes it possible to test how suitable an ontology will be, as well as alsopermitted Protege to serve as a knowledge base for a project.
Figure 7.3: Protege Instance Editor

144
The ease of editing instances and classes in parallel makes it relatively easy to
develop a knowledge base. The Protege editor is being developed largely by the
Stanford Medical Informatics at the Stanford University School of Medicine as an
open-source project. There is a well-defined Application Programming Interface
(API) and as a result, many other groups in both academia and industry have
developed a range of ”plug-ins” that add further functionality, either by adding a
storage format or new functions. There is a plug-in for an expert system, as well as
a plug-in for a prolog-like language. These make it easy to change classes and slots,
as well as to perform queries on the whole knowledge base.
One of the exceedingly interesting plug-ins for the user interface is the Simple
Hierarchical Multi-Perspective Views[29] plug-in called Jambalaya. The following
figures show how useful this ability to have different views on a sub-system can be.
Using one of the plug-in components, it is possible produce a more graphicallayout to illustrate different relationships between different classes. This makes itvery easy to explore a design.
Figure 7.4: Herschel-Planck Equipment types

145
In Figure 7.4 the classes are shown as a network of boxes, with the arcs and
arrows between them corresponding to the relationships between classes.
The user can view the structure at different levels of detail and from different
viewpoints. When the user uses the mouse to double-click on one of the boxes, it
opens to reveal the internal structure as in Figure 7.5.
The user can view the structure at different levels of detail and from differentviewpoints. In this diagram the internal structure of one of the equipment classesis revealed.
Figure 7.5: Herschel-Planck Units
It is possible to filter which set of relationships (arcs) are shown in order to
increase the clarity of the diagram, or to facilitate the search for a particular piece
of information. In Figure 7.6 the details of the instances of the payload units (of
the Unit-PL) class are shown.

146
This figure shows that it is possible to zoom in on one area and see in whichrelationships units participate, for example,relationships between payload unitsand power units.
Figure 7.6: Herschel-Planck Instrument HFI

147
This tool make it very easy to browse for information and generally learn about
a particular instrument or subsystem. It is possible to zoom in and out and view
the data that is stored in the knowledge base in different ways. Figure 7.7 shows
this.
It is possible to zoom in on one area and see in which relationships unitsparticipate. If the diagram become too cluttered, the labels on the arcs can beremoved, or set to appear when the mouse is moved over a particular arc. Thisfacilitates exploration.
Figure 7.7: Herschel-Planck Instrument HFI
As further examples of how this innovative tool allows the user to explore a
knowledge base, Figure 7.8 shows which parts of the instrument HFI are connected
by the High Speed Link (HSL) serial communication link and shows which parts of
HFI are connected by the Low Speed Link (LSL) serial communication link. These
diagrams illustrate how easy it is to see and display different sets of information
from the knowledge base in a visually appealing manner.
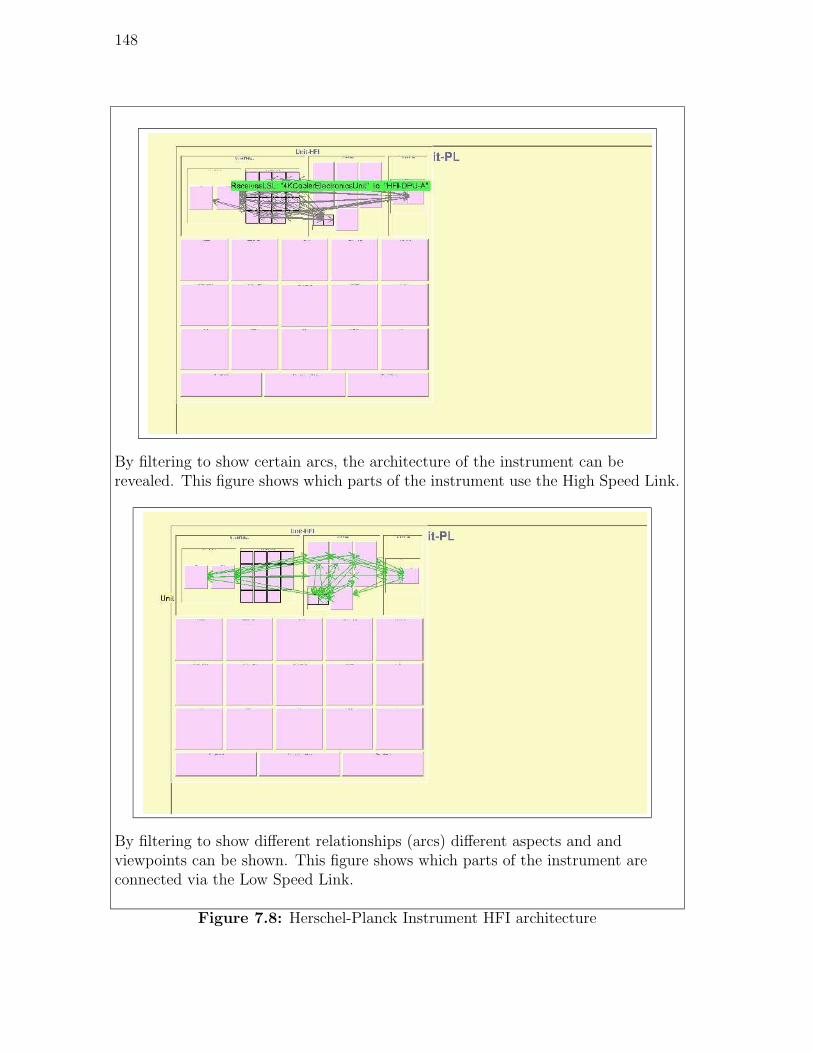
148
By filtering to show certain arcs, the architecture of the instrument can berevealed. This figure shows which parts of the instrument use the High Speed Link.
By filtering to show different relationships (arcs) different aspects and andviewpoints can be shown. This figure shows which parts of the instrument areconnected via the Low Speed Link.
Figure 7.8: Herschel-Planck Instrument HFI architecture
149
7.4 Summary
The User Manual is to help the end-users understand and operate the spacecraft
and payloads safely and successfully.
Since there is no standard structure for the information to be provided, it varies
enormously in quality and quantity from one sub-system or instrument to another
and from project to another, and just because the documentation was good on a
previous project does not mean that it will be good on the next project since there is
no real process in place to make sure that the quality increases with time. Overall,
it is fair to say that it is difficult to produce a user manual because their is not
standard to say what it should contain or how to produce it.
This Chapter has shown a method that could be used both to ensure that docu-
mentation complete and correct,and the following chapter, Chapter 8, illustrates a
way to reason with the knowledge that is encapsulated in the documentation.
Section 7.2 has shown how the introduction of new names for existing concepts
makes it difficult to produce the User manual to a consistent standard and prevents
re-use of documentation from one project to another, and section 7.3 illustrated a
powerful technique with its roots in artificial intelligence that allows users to browse
data and display relationships graphically, whilst at the same time permitting writers
to check their input obeys certain consistency constraints which will highlight when
or where information is incomplete.
The short example in Appendix A is sufficient to show that even a consistent
ontology is not a panacea.
The Appendix contains examples about one instrument (HFI) and the Low Speed
Link that some units within HFI use to communicate. The current ontology would
require an additional 250 pages to print out or view via a web browser. It is apparent
that the volume of a complete ontology would be a significant burden upon any
contractor to produce, or any operations team to read. However, it is something

150
that only needs to be done once, and it is better to do a minimal component of
it properly rather than aim for a complete Theory of Everything that can never
be completed. Since this shows how much information is require for an incomplete
model, it also shows how much information would really be required for a complete
set of documentation.
Without an approach that makes it easier to develop a knowledge base that can
be checked and transferred easily, future projects are destined to repeat many of the
mistakes of their predecessors simply because it is too difficult to learn from them.

Chapter 8
Formal Methods
8.1 Introduction
Modern spacecraft and their payloads are extremely complex devices. Often they
are required to have high autonomy, they are often sent on unique missions, they
are expensive and the subject of high expectations. However they are still being
design and tested using fundamentally the same methods as their predecessors:
personal experience, manual design and limited testing of a few scenarios with the
real hardware.
One of the most lucid arguments in favour of formal methods is presented in
[34] ”..the building of ships has been practised for over two thousand years, and
the construction of houses and bridges for considerably longer. Small wonder, then
that the many principles of civil, nautical, structural and mechanical engineering
have become part of our collective consciousness. For instance few would begin to
build even a model boat without a set of drawings, and one hardly remarks on the
need for plans to be prepared for a new house or even an extension to an old one.
Time has not yet allowed us to acquire the equivalent body of expertise with which
to surround and support the development of software-based systems. Consequently
many systems are constructed with little or no overt attention to any underlying
theory, and without the benefit of centuries of experience in the selection of those
techniques which are likely to to confer success.”
151

152
Discrete systems are based a very simple logic, usually binary logic, in which
the system is usually either in one state or another. By comparison, in structural
mechanics a material is subject to a either static or continuously varying forces and
responds in a continuous fashion. The structural system has a clear boundary, and
the limits can be calculated and tested. If a new phenomena is discovered, such
as shock-loading, or fatigue, then that can also be calculated and extrapolated and
tested. ”By testing a structural system to its limits, we can be reasonably sure
that if we stay in a well-defined envelope, the structure will be able to carry out
the task intended”[34]. Although the discrete system may sound simpler, it scales
differently. In contrast , for a discrete system ”for a medium sized system containing
1000 decisions ..would require more than 10300 test cases”[34].
Formal methods bring the benefit of being able to argue a particular case based
upon a rigorously defined specification. ”Proof of one property at the specification
stage may yield a result which corresponds to the behaviour of a very large num-
ber of possible execution sequences, offering an increased level of confidence with
the opportunity of reducing test cases”[34]. The method chosen here is the Z lan-
guage. This chapter demonstrates how formal methods may be applied to analyse
the malfunctioning of a real-world system.
8.2 What is Z?
Z is a formal specification notation based on first order predicate logic and set theory.
It was developed at the Programming Research Group at the Oxford University
Computing Laboratory (OUCL) and elsewhere in the late 1970s. International ISO
standardisation is ongoing (Z is already adopted as a British Standard). This thesis
cannot hope to replace a good tutorial (e.g. [34, 42]) and the interested reader
is referred to these or the many other for more detailed information however this
section and the following sections give an introduction to Z and show how it can be

153
applied in the context of spacecraft engineering.
The main ingredients in Z are the following:
1. The use of mathematical data types to model the data in a system.
2. The use of the notation of predicate logic to describe abstractly the effect of
each operation of a system and to enable us to reason about its behaviour.
3. The way of decomposing a specification into small pieces called schemas. By
splitting the specification into schemas, we can present it piece by piece.
Schemas are used to describe both static and dynamic aspects of a system.
The static aspects include
• the states it can occupy;
• the invariant relationships that are maintained as the system moves from
state to state.
The dynamic aspects include:
• the operations that are possible;
• the relationship between their inputs and outputs;
• the changes of state that happen.
4. The Z Schema Calculus
This is the way ”objects” are introduced. Schemas can either refer to objects
as nouns or to operations as verbs (actions). As mentioned in the chapter
on Relational Theory, the relations between objects are as important as the
objects themselves. The Z schema calculus combines the schema descriptions
into one schema and defines how they can be manipulated.
• Schema Name: Each schema must have a name. By naming them we
have a method to refer to them.

154
• Schema Signature: The signature sets out the names and types of the
entities introduced in the schema.
• Schema Predicate: The predicate sets out the relationships between the
entities in the signature by defining a predicate over the signature entities.
Normally these features are ’packaged’ typographically in a box to enhance
the clarity of the specification although these shapes can be visually quite
intimidating for the newly initiated! A schema is shown in Z as follows:
SchemaName
Signature : defines objects used the predicates section
logical predicates
Note that although we can specify the various requirements for an operation
separately, and then combine them into a single specification of the whole
behaviour of the operation, this doesn’t mean that each requirement must be
implemented separately, and the implementations combined somehow.
The separation of normal operation from error-handling which is the simplest
but also the most common kind of modularisation possible with the schema
calculus.
8.3 Outline of a Specification
A Z specification should follow a fairly standard structure. As an introduction to the
notation a simple example is given, although it cannot replace a detailed tutorial.
Preliminary analysis
First the requirements are analysed to identify the important parts of the problem;
they are described by sets and constants. The first section should include the basic
elements which are to be used throughout the whole specification. They are given

155
what is referred to as global scope. Given sets are used as types in the rest of the
specification.
Application-oriented theory
Often some special purpose theory has to be developed when writing specifications
- after the global declarations, and before the description of the state.
Describing the abstract state
Next, the abstract state is described using one or more schemas.
The initial state
A schema that describes the initial state of the system is given.
Specifying the successful case of operations
Each operation is specified, ignoring any error conditions.
Preconditions
The preconditions of the partial operations are calculated.
Schemas describing error cases
Normally, we wish to build complete interfaces so that systems can handle any input
and provide sensible results.
Making the operations total
The partial operations that describe the successful cases and the various errors are
combined to give a total description.
8.4 Tools
There are a number of tools[11][28] available which provide a great deal of support
for maintaining and checking a specification. Some tools include limited automatic

156
theorem proving, although for non-trivial specifications, the user must guide the
tool in certain places.

157
8.5 Example Specification: Satellite Operations
Controlling a satellite involves a combination of hardware, software and human
operators. It can be difficult to predict how this distributed system can fail. The
components are each designed and built by specialists in individual areas, and it
becomes the responsibility of the operations team to safely operate the system so as
to maximise availability.
8.5.1 Given Sets
This defines the things that we will talk about.
[SWITCH ]
Define some specific types.
DischargeSwitchState ::= DOpen | DClosed
ChargeSwitchState ::= COpen | CClosed
8.5.2 State Definition
An individual battery is described in the following schema :
BasicBattery
DischargeSwitch : DischargeSwitchState
ChargeSwitch : ChargeSwitchState
DischargeSwitch = DClosed ⇒ ChargeSwitch = COpen
ChargeSwitch = CClosed ⇒ DischargeSwitch = DOpen
which simply says that in this model, a battery has two switches, one for charging
the battery and one for discharging it. A constraint that the switches should not be
closed together at the same time is made explicit here.

158
8.5.3 Operation Definition
Within this simple model, we then say that to charge the battery we close one of
the switches.The use of the ”prime” notation (shown by a ′) permits to differentiate
between the states before the operation and the states after after the operation.
The Z view of an operation is then as being a relationship between a set of all
before states and the set of all after states. It makes no presumption about how the
particular operation is implemented.
StartCharging1
BasicBattery
BasicBattery ′
ChargeSwitch = COpen
ChargeSwitch ′ = CClosed
DischargeSwitch ′ = DischargeSwitch
Z allows certain abbreviations and conventions to be used within the notation
that do not impair the mathematical rigour. The line ∆BasicBattery shows that
this schema imports the schema BasicBattery and BasicBattery′ and modifies the
state only as shown. The before and after versions of the other variables are the
same, and so do not need to be explicitly shown. With this abbreviated notation
we can write that to discharge the battery we close the other switch.
StartDischarging1
∆BasicBattery
DischargeSwitch = DOpen
DischargeSwitch ′ = DClosed
ChargeSwitch ′ = ChargeSwitch
and then develop schema to describe the end of charging and the end of discharging
too.
159
StopCharging1
∆BasicBattery
ChargeSwitch ′ = COpen
DischargeSwitch ′ = DischargeSwitch
StopDischarging1
∆BasicBattery
DischargeSwitch ′ = DOpen
ChargeSwitch ′ = ChargeSwitch
8.5.4 Pre-Condition Calculation
One of the advantages of using a formal method is to investigate under what cases
the defined operations can succeed. This is called calculating the preconditions of
an operation. In English. this would be equivalent to defining an function called
pre Op such that for an operation Op, there exists a state after the operation Op
as long as the preconditions are satisfied. More mathematically, the pre-conditions
for an operation Op are defined as:
pre Op = ∃ State ′; Outs • Op
where
State ′ is the modified state variables
Outs are the output variables of the operation.
For the operation to be total, it should be possible to start it in any state, and thus
∀ State ′; in : IN ; • pre Op should be a theorem that can be proved in our system.
This then gives:
theorem PreStartCharging1
∀BasicBattery ′ • pre StartCharging1

160
By expanding this gives
BasicBattery
∃ChargeSwitch ′ : ChargeSwitchState,
DischargeSwitch ′ : DischargeSwitchState; •
StartCharging1
Which expands to
DischargeSwitch : DischargeSwitchState
ChargeSwitch : ChargeSwitchState
DischargeSwitch = DClosed ⇒ ChargeSwitch = COpen
ChargeSwitch = CClosed ⇒ DischargeSwitch = Dopen
⇒ ChargeSwitch = COpen ∧ DischargeSwitch = DOpen
Which should have been ’intuitively’ obvious from the outset, but has been calcu-
lated here. These preconditions can then be added and tested:
theorem ModifiedPreStartCharging1
∀BasicBattery | ChargeSwitch = COpen ∧ DischargeSwitch = DOpen
• pre StartCharging1
This can be expanded to give the result true in a theorem checker[11] or type
checkers [28].
161
8.6 Detailed Specification
Now let us examine a more complicated situation, a little closer to real life. In order
to measure the performance of a battery, and to re-condition it if necessary, this
battery is fitted with a resistor, of known resistance, referred to as a shunt. The
battery can be switched out from the support of the Main bus, and then discharged
through this shunt. The time taken to reach a standard voltage (equal to end of
discharge limit) allows the stored energy of the battery to be measured. The battery
then needs to be recharged very slowly (trickle charge) to avoid damage. This is
because if the battery voltage is low, the current into it from the normal charger
would be too high.
8.6.1 Component Specification : Shunt
Component Data Type Definition
ShuntState ::= ShuntOn | ShuntOff
TrickleState ::= TrickleOn | TrickleOff
Component State Definition
Shunt
ShuntRelay : ShuntState
Trickle : TrickleState
Component Operations
The following operations are possible:

162
DeepDischargeStart
∆Shunt
ShuntRelay = ShuntOff
ShuntRelay ′ = ShuntOn
Trickle = TrickleOff
Trickle ′ = TrickleOff
DeepDischargeCompletion
∆Shunt
ShuntRelay = ShuntOn
ShuntRelay ′ = ShuntOff
Trickle = TrickleOff
Trickle ′ = TrickleOff
After the deep discharge, the battery is then charged with a low current (referred
to as trickle charging):
TrickleCharge
∆Shunt
ShuntRelay = ShuntOff
ShuntRelay ′ = ShuntOff
Trickle = TrickleOff
Trickle ′ = TrickleOn
TrickleCompletion
∆Shunt
Trickle = TrickleOn
Trickle ′ = TrickleOff

163
8.6.2 Component Specification : Pressure Detectors
Component Data Type Definition
Let us define three ranges of pressure: a nominal range and a low threshold and
a high threshold, together with two signals which trigger when the appropriate
threshold is breached.
PressureRange ::= Plo | Pmid | Phi
HPSignal ::= High | NotHigh
LPSignal ::= Low | NotLow
PressureSensor
CellHighPressure : HPSignal
CellLowPressure : LPSignal
Pressure : PressureRange
Pressure = Phi ⇔ CellHighPressure = High
Pressure = Plo ⇔ CellLowPressure = Low
8.6.3 Main Specification
The rest of the battery is similar to the previous example. It would be possible to
simply refer to the the previous schema BasicBattery or repeat the definition here.
Data Type Declarations
DischargeSwitchState ::= DOpen | DClosed
ChargeSwitchState ::= COpen | CClosed

164
State Definition
BasicBattery
DischargeSwitch : DischargeSwitchState
ChargeSwitch : ChargeSwitchState
DischargeSwitch = DClosed ⇒ ChargeSwitch = COpen
ChargeSwitch = CClosed ⇒ DischargeSwitch = DOpen
The ComplexBattery has all of the same features of BasicBattery with some
additional ones, including the shunt. The following schema shows the state of the
ComplexBattery and shows that it includes a shunt.
ComplexBattery
BasicBattery
Shunt
PressureSensor
Operations
In the following, we introduce the symbol Ξ in Z, which is the same as ∆ which
introduces the before and after schema, but with the addition of predicates to equate
( all) of the before and after states of the declared variables.
Here we describe the charging process. The pressure increases when charging
takes place i.e. when the charge switch is closed, the pressure is allowed to increase
until the high limit.
Charging
∆ComplexBattery
ΞShunt
ChargeSwitch = CClosed
Pressure ′ 6= Phi

165
Similarly, when a battery is discharging, the pressure drops, but should not be
allowed to drop below the low limit.
Discharging
∆ComplexBattery
ΞShunt
DischargeSwitch = DClosed
Pressure ′ 6= Plo
Normally the battery is kept almost fully charged. It discharges slowly, and the
internal pressure drops. When the low pressure threshold is reached the battery is
charged up again until the pressure reaches the high threshold.
RoutineControl
∆ComplexBattery
ΞShunt
(Pressure = Phi ∧ DischargeSwitch = DClosed) ∨
(Pressure = Plo ∧ ChargeSwitch = CClosed) ∨
Pressure = Pmid
8.6.4 Error Cases
It is possible to define two error cases; that is charging when the pressure is at the
high limit, or discharging when the pressure is at the lower limit.
report ::= Ok | HighPressure | LowPressure
OverPressure
ΞComplexBattery
r ! : report
CellHighPressure ′ = High ∧ ChargeSwitch ′ = CClosed
r ! = HighPressure

166
UnderPressure
ΞComplexBattery
r ! : report
CellLowPressure ′ = Low ∧ DischargeSwitch ′ = DClosed
r ! = LowPressure
It is now possible to combine the RoutineControl and the error cases to make a
schema NominalOperations.
NominalOperations = RoutineControl ∨ OverPressure ∨ UnderPressure
8.6.5 Test Cases
After performing DeepDischarge, DeepDischargeCompletion, TrickleCharge and Trick-
leChargeCompletion the battery should be back in its starting state.
Here we construct a series of test cases by sequentially composing the schema,
one after the other.
Test1 = DeepDischarge o9 DeepDischargeCompletion
Test2 = TrickleCharge o9 TrickleCompletion
Test3 = Test1 o9 Test2
theorem BackToNormal3
Test3 ⇒ ΞShunt
i.e Test3, the result of applying all of these schema, implies that the end state is
the same as the beginning state. This Theorem can be expanded to give the result
true, as desired.

167
8.7 Summary
Formal methods bring the benefit of being able to argue a particular case based
upon a rigorously defined specification. By proving a property of a design early in
the mission life-time, perhaps even before hardware is built, it may result in a cost
saving, by reducing testing, or a dramatic increase in reliability. Formal methods
were developed to be applied to software systems, but are applicable to any discrete
system.
One of the main benefits of formal methods is that it requires a statement of
the problem. This is also sometimes a disadvantage, since some of the knowledge
might not be available. Obviously the main advantage of using a formal method
for the design specification and testing would arise if the overall life-cycle were to
be improved, and the same knowledge of the state space that was tested at the
design phase were also to be used in the testing and qualification phase, and even
if the same source of data were to be used in the user manual. With the idea of an
ontology from Chapter 7 this idea of a single knowledge base for the entire mission
can be applied.

168

Chapter 9
The Nature of Complexity
Of three ordinary people, two must have the same sex.
Daniel Kleitmam
9.1 Introduction
Complexity is defined as the opposite of simplicity, but in terms of trying to eval-
uate the complexity of a system, that (almost recursive) definition does not help.
When trying to compare different designs of satellite, one could initially try to count
the number of distinct telecommands that a satellite can accept, but several ques-
tions arise. Should this number include telecommands with parameters? How are
different parameter values taken into account? How does the number of teleme-
try parameters affect this value? If we avoid these questions for the moment, this
definition would lead logically to the concept that the complexity of a system was
related to the length of its description and it is interesting to analyse this concept
in more detail. For example, what characterises the complexity of a group of inter-
connected computers? As discussed by Gell-Mann[16], a number of nodes can be
interconnected in many different ways and it is interesting to examine the relative
complexity of such networks as shown in Figure 9.1.
Most people will agree that A is simple - no nodes are connected. In case B,
some, but not all, nodes are connected. In C, all the dots are connected, but not
169

170
12
3
45
12
3
45
12
3
45
12
3
45
12
3
45
12
3
45
A B C
D E F
Figure 9.1: Comparative Complexity
in all possible ways. In D, the connections that are present in C are absent, and
those that are absent in C are present; C and D are thus complements of each other.
Similarly E is the complement of B, and F is the complement of A, since all nodes
are connected in all possible ways. This results in what can also be referred to as an
undirected graph. The same information can be shown in matrix form, where each
node represents a column and a row, and a ’1’ indicates that a connection exists
between the two nodes. It is assumed that no node can be connected to itself, and
so the items on the leading diagonal can be disregarded.
A =
0 0 0 0 0
0 0 0 0 0
0 0 0 0 0
0 0 0 0 0
0 0 0 0 0
B =
0 0 1 1 1
0 0 0 0 0
1 0 0 0 0
1 0 0 0 0
1 0 0 0 0
C =
0 1 0 1 1
1 0 1 0 0
0 1 0 1 0
1 0 1 0 1
1 0 0 1 0
D =
0 0 1 0 0
0 0 0 1 1
1 0 0 0 1
0 1 0 0 0
0 1 1 0 0
E =
0 1 0 0 0
1 0 1 1 1
0 1 0 1 1
0 1 1 0 1
0 1 1 1 0
F =
0 1 1 1 1
1 0 1 1 1
1 1 0 1 1
1 1 1 0 1
1 1 1 1 0

171
Most people will agree that case A is simple, i.e. has the least complexity, and
that case B, is more complex than case A. One immediate reaction might be that
case F is the most complex, but there is potentially a good argument to be made
that the property of having all the nodes connected is the same as having none of
the nodes connected. If the convention used in the matrix notation is inverted, ie.
1 = not connected, case F is the same as case A, so perhaps case F belongs at the
bottom of the complexity scale, with case A. The patterns shown in B and E are
evidently more complex than A (and therefore F), and the same can be said for
cases C and D. Note that this analysis might break down if the links between node
are not identical, or change in nature. For example in the domain of control, one is
generally more interested in imposing one’s will upon a system, and so the diagrams
need to be enhanced to include the introduction of information from the outside
world, and then flowing from one node to another. This means that the topology
cannot be represented by an undirected graph.
On a more philosophical note, it should be remarked that if the complexity of a
system is related to the length of its description, then complexity is not an intrinsic
property of that which is being described. Any description of complexity is neces-
sarily context-dependent, and may even be subjective. Not only is the level of detail
at which the system is being described subjective, it depends upon the vocabulary
available. For example, to someone with experience in the space industry, it might
be sufficient to say that a satellite has an Earth sensor, whereas to communicate
the same information to a novice, one would have to start from first principles, per-
haps even with an introduction to orbital mechanics! These ideas can be integrated
into what Gell-Mann refers to as ’crude complexity’: ”the length of the shortest
message that will describe a system, ...,to someone at a distance, employing lan-
guage, knowledge and understanding that both parties share (and know they share)
beforehand.”

172
9.2 Algorithmic Information Content
During the 1960s, three authors (Kolmogorov, Chaitin and Solomonoff) indepen-
dently developed the concept of Algorithmic Information Content, AIC[16]. They
envisaged that a description to a given level would be encoded into a string of binary
digits, and assumed the existence of an idealised, all-purpose computer with no limit
on its storage capacity. They then defined the length of the shortest program that
would make the computer printout the string and then stop as being the Algorithmic
Information Content of the string. These theorists were interested in how descrip-
tion of systems such as those defined above would vary as the number of nodes was
increased towards infinity, and so the initial differences that would result from the
use of one computer or one language instead of another were dwarfed by the effects
due to scaling up the problem. One curious property of Algorithmic Information
Content is that it is not computable. We can never be sure that the Algorithmic
Information Content of a string is not lower than we think it is. There may always
be a theorem or algorithm that would permit the description to be further com-
pressed. This result is reminiscent of Godel’s Theorem, that stunned the world of
mathematics by proving that it was not possible to formulate a system of axioms
for all of mathematics and prove them consistent, and was thus impossible to derive
the truth or falsity of all mathematical propositions. However, it is possible to put
an upper bound on the Algorithmic Information Content of a description, although
the AIC may of course be lower than this.
A further flaw in the use of Algorithmic Information Content to define complexity
for our purposes is that since Algorithmic Information Content effectively deals with
the compressibility of message strings, Algorithmic Information Content is largest
for random strings, and randomness is not what is usually meant by complexity.
In fact it is the non-random aspects of a system (or of a string) which contribute
to its effective complexity, which can be characterised as the length of a concise

173
description of the regularities of that system.
What we are really interested in is the knowledge gained by separating the reg-
ularities in a system from the random occurrences, since we wish to understand the
behaviour of the system. This is analogous to learning a language. If the student’s
native language is ’similar’ in some way to the new language to be learned, a system
consisting of some rules and a look-up table might be very effective. However, for
every exception to the rules, the length of the description increases. The new student
(or young child) is able to effectively separate grammatical features from the other
factors that gave rise to the sentence that was heard or read. One thing that does
become obvious from the calculation of the Algorithmic Information Content is that
comparisons between systems of differing complexity become more meaningful as
the descriptions become longer. At the absurd extreme, it is evidently meaningless
to differentiate between the simplicity or the complexity of a one bit string. This
leads us to the idea that complexity is linked to the presence of similarities in de-
scriptions, but not absolute identities. The description of the system thus contains
a series of patterns that may re-occur throughout the description.
9.3 Effective Complexity
If the system being described has absolutely no regularities in it, then the compressed
description (which can also be referred to as a schema) will contain no patterns. To
put it differently, the schema will have zero length. This gives us the kind of property
that we desire in a useful definition of complexity, since if we study a random string,
even though its Algorithmic Information Content is maximal for its length, we can
learn nothing useful from it. At the other end of the scale, when the Algorithmic
Information Content is near zero, the bit string is entirely regular, the effective
complexity should also be zero, since the message is so easily compressed. Thus for
the effective complexity to be high, the system must be neither too well ordered,
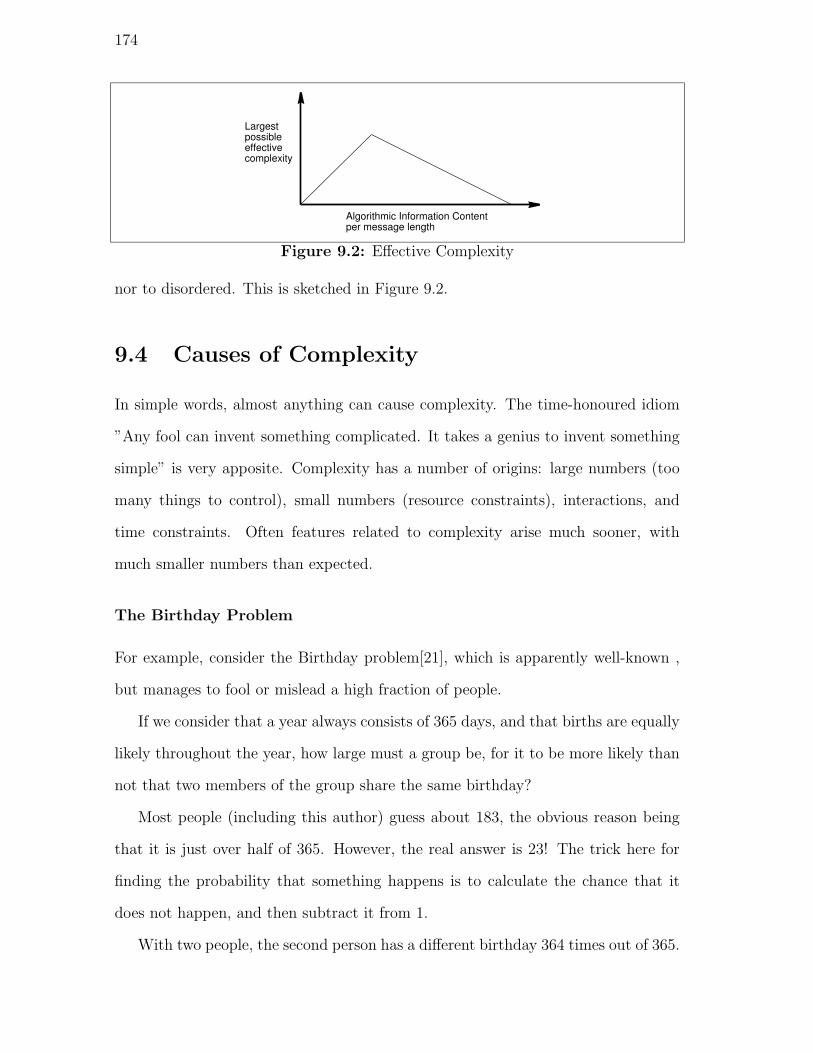
174
Largestpossibleeffectivecomplexity
Algorithmic Information Contentper message length
Figure 9.2: Effective Complexity
nor to disordered. This is sketched in Figure 9.2.
9.4 Causes of Complexity
In simple words, almost anything can cause complexity. The time-honoured idiom
”Any fool can invent something complicated. It takes a genius to invent something
simple” is very apposite. Complexity has a number of origins: large numbers (too
many things to control), small numbers (resource constraints), interactions, and
time constraints. Often features related to complexity arise much sooner, with
much smaller numbers than expected.
The Birthday Problem
For example, consider the Birthday problem[21], which is apparently well-known ,
but manages to fool or mislead a high fraction of people.
If we consider that a year always consists of 365 days, and that births are equally
likely throughout the year, how large must a group be, for it to be more likely than
not that two members of the group share the same birthday?
Most people (including this author) guess about 183, the obvious reason being
that it is just over half of 365. However, the real answer is 23! The trick here for
finding the probability that something happens is to calculate the chance that it
does not happen, and then subtract it from 1.
With two people, the second person has a different birthday 364 times out of 365.
175
A group of three people will all have different birthdays if the first two are different
(probability 364/365), and the third persons birthday is one of the remaining 363
days. So the chance of having three different birthdays is
364365
× 363365
For four people, the first three must be different (as above) and the fourth must be
on one of the remaining 362 days.
364365
× 363365
× 362365
Statisticians introduce a notation to express products such as 364× 363× 362 more
concisely. Write this as (364)3. Then the probability of 5 people having different
birthdays is
(364)43654
and the chance that ten people will have different birthdays is
(364)93659
If we extended this calculation down to a group of 366 people, the probability would
be zero. But to solve the problem in hand, it is sufficient to use a calculator or
spreadsheet to evaluate
(364)2136521 and (364)22
36522
which give 0.5243... and 0.4927...respectively, so 23 is indeed the point at which
it becomes more likely than not that a group contains two people with the same
birthday. This surprising result can be partly explained as follows. Consider that
when the group contains 10 people, an eleventh person has 10 chances of size 1365
of
having a common birthday. If there is no common birthday, then the twelve person
has 11 chances of 1365
, and so on. There are K × (K − 1)/2 ways of choosing two

176
objects from a group of K objects, which means that there are 253 chances, each of
size 1365
in a group of of 23 people.
This analysis has been shown in a trivial, amusing case, but it could have more
significant implications in for example, assignments of a limited number of frequen-
cies, or slots on a bus. A constraint has shown to be much more likely to appear
than initially expected.
Ramsey Theory
H.Burkhill and L.Mirsky [2] state ”There are numerous theorems in mathematics
which assert, crudely speaking, that every system of a certain class possesses a large
sub-system with a higher degree of organisation than the original system.” All of
these structural problems can be grouped under the general heading of Ramsey
Theory. The classic Ramsey problem can be phrased in terms of the number of
guests at a party. What is the minimum number of guests that must be invited so
that either at least three guests will all know each other, or at least three guests will
be mutual strangers? To clarify the assumptions, let us assume that the relation
’knowing’ is symmetric: if Alan knows Bill, then Bill also knows Alan. Now let us
consider the situation of the sixth guest, Fred. Since Fred either knows the other
five, or does not know the other five, then by inclusion he will either know at least
three of them, or not know at least three. If we assume that Fred knows at least three
of them, Alan, Bill and Charlie (the argument works the same way with the other
assumption) then we consider what relationships the three acquaintances might have
amongst themselves. If any two of them know each other, then they, together with
Fred, will make up a group of three who know each other and we are done. If all
three of Fred’s acquaintances are mutual strangers, then we are done too, since that
gives us a group of three. This could have been proved by brute-force evaluation of
all 32, 748 possibilities but combinatorics allows some limits to be explored without

177
enumerating and testing every possible combination. R. Graham referred to this as
’Counting without counting”.
For example, if we want to guarantee a group of four people who either all know
each other or are mutual strangers, then 18 people are necessary and sufficient. For
five people, the answer is not known, but it is known to lie between 43 and 49. For
six people, the range is even bigger: 102 to 165. These are normally written as
R(3, 3), for the first example, R(4, 4) for a group of 4 who know or do not know each
other. Sometimes these symmetrical numbers are abbreviated as R(3), R(4) etc.
Ramsey numbers are not always symmetrical: it is possible, for example to define
R(4,3)=6, the number necessary to ensure either a group of 4 people who know each
other, or a group of 3 strangers, or (since the relation ’not knowing’ has the same
properties as the relation ’knowing’) a group of 4 strangers or a group of 3 people
who know each other. In fact, Ramsey Theory does not have to be restricted to a
binary relationship (which is the equivalent of two-colouring a graph), Higher-order
Ramsey numbers are defined, but none of the non-trivial ones are known, apart from
R(3, 3, 3) = 17, the number necessary for a 3 colouring of a graph.
The importance of Ramsey Theory in engineering is difficult to evaluate. It
stresses that given any number of any articles, and some kind of relationship between
them, there must be some kind of structure, and it might not be the kind of structure
that you are expecting. Part of the difficulty arises since the Ramsey numbers specify
that one of two subgraphs will be contained within the graphs, but it does not say
which. Either 3 people will know each other, or 3 people will not know each other.
If we replace the relationship ’knows’ with the relationship ’communicates with’, or
’shares power with’, or ’is physically next to’ and the implications become a little
clearer. Of course, nobody would design a spacecraft where the components could
not communicate with each other when they needed to, and so we can assume that
the main functions will be implemented in a way that corresponds to a ’connected

178
solution’, as opposed to the ’unconnected’ or isolated solution. But in some of the
ancillary functions, limitations may only becomes apparent after design, in testing
or operations.
An example may help to illustrate where it may be possible to see more relevance
to design issues. Without giving the theory, if we look at a sequence of n2 + 1
integers, there will always be a sub-sequence of at least n + 1 increasing integers
or n decreasing integers[23]. In its more general form, this can also explain the
probability of, for example, a series of stars appearing to line up to form a straight
line to an Earth-based observer. This is particularly relevant given the propensity
of human operators to see patterns (as outlined in section 3.2.3).
Ramsey theory is telling us that there will be a higher level structure in what
we create, even if we are not expecting it because we do not create it explicitly.
Ramsey theory has been applied to all sorts of communication and thermodynamic
problems with successful outcomes[23].
Self-References
Godel worked in Peano arithmetic to construct a statement that affirms its unprov-
ability. Peano arithmetic is quite basic, consisting of the formal axiomatic theory
dealing with natural numbers with the operators for addition, multiplication and
equals. Godel numbered the symbols, the well-formed formulae (WFFs) and the
axioms and proofs in a formal axiomatic system. This was his way of converting
the assertion that a specific proof establishes a specific theorem into an arithmetical
assertion. He converted the assertion into the fact that a certain natural number
(the Godel number of the proof) stands in a numerical relationship with another
natural number (the Goedel number of the theorem). The really clever part is in
how Goedel created the self-reference, because the statement doesn’t refer to itself
by containing a quoted copy. It refers to itself indirectly, saying that if a certain

179
calculation is performed, then the result is a statement that cannot be proved.
Five years later, Turing, often referred to as the first computer scientist, found
a different reason for incompleteness, almost the source of incompleteness. This
was his Halting problem. He determined that there is no algorithm, no mechanical
procedure that can ever determine in advance if another computer program will halt.
Chaitin [4, 5], one of the founders of algorithmic information theory, has spent
most of his life developing the theory, and is now convinced that complexity is best
measured by the binary size of a program trying to simulate the system in question:
”The general flavour of my work is like this. You compare the complexity of the
axioms with the complexity of the result you’re trying to derive, and if the result is
more complex than the axioms, then you can’t get it from those axioms” [5].
9.5 Example
Everyone would (probably) agree that a pile of wires could not be too complex, but
depending upon how it is wired together complexity can emerge.
Consider a basic (I hesitate to use the word simple) system: a heating circuit
for a room, operated from a mains supply. We want the room to maintain a certain
temperature, so we wind the wire in a coil, put a thermostat in the circuit and
plug it into the mains supply . The thermostat opens when it is hot (above the
desired temperature) and closes when it is cold (below the desired temperature).
This means that current flows in the heater circuit when the thermostat is cold, and
heats the air in the room, and the heater current stops when the thermostat reaches
or exceeds its desired temperature. This sounds fine.
We then realise that this is an important function, and are worried about the
impacts of failures. If the thermostat fails open, then the room gets too cold. If the
thermostat fails closed then the room gets too hot. If we duplicate the heater circuit
with another thermostat, then we protect against the case that the thermostat fails

180
open, but if either thermostat fails closed, then the room still gets too hot. One
possibility would be to implement a complicated switch, so that each thermostat
also controls the power line of the heater circuit. Another alternative would be to
introduce even more heater circuits, but make them of such a low power that a
failure in one circuit only could not make the room get too hot. The problem with
this strategy is that then the reliability of the whole system decreases in the long
term, since there are more items that can fail.
Then perhaps as an investigation of the performance of the prototype, we decide
to actually measure the temperature of the room. This requires the insertion of
one or more thermistors into the room. These thermistors provide much greater
precision (and accuracy) than the low-tech thermostats. With this data we see
that the temperature is cycling up and down within a deadband. To reduce the
temperature fluctuations, we decide to use the temperature measurements from the
thermistors to operate the switches on the heater cycles. This means that if a switch
fails closed, the thermostat will open, and the room will not get too hot. However,
the problem is now that a switch might fail open, and then the room gets too cold.
Furthermore, the thermistor could fail, and this might cause the switch to stay open
too. This has introduced another failure mode.
So it seems as if we cannot rely on a single thermistor. If we have two, we cannot
tell which one is correct, so we need at least three, and possibly more, ideally an
odd number. But if we decide to average the readings of the thermistors, if one has
failed and is giving an exceptionally low reading, then this might distort the average
so that it is out of the permitted range, and then the switch will be open, and the
room will get too cold.
So the next step is to introduce some kind of plausibility processing on the output
of the thermistors. If we have a sufficient number of measurements, we can disregard
the highest and the lowest, and then average the remaining measurements. Another

181
alternative would be try to actively detect a thermistor failure as it happens, by
looking for a sudden step in the output. Yet another implementation could be to
assume that the temperature must always be between the minima and maxima of
the thermostat, and that any reading outside of this region is erroneous and must
disregarded. The problem with the latter? If we flush the room with cold air (or hot
air, if the system is in use outside the British Isles) outside the expected temperature
range, all of the healthy thermistors will be declared failed and the outputs ignored.
What is the output of the thermistor processing when all inputs are to be ignored?
Does it have ’memory’? This could enable it to keep the same state as previously.
If a thermistor is declared failed, is it disregarded ’for now and for ever more’ or
only for the current set of measurements ? How can the customer be informed
that a component has failed? Should the customer be informed? Is it reasonable
to expect the customer/owner/operator to repair components? Can the customer
’reset’ the thermistor processing unit to make it start taking a repaired thermistor
into account?
Another solution could be to have two separate ’control systems’. One system
with a powerful heater and a coarse thermostat with a wide deadband, and smaller
heater circuit to be operated by the output of the thermistors. But then we come
down to the reliability of the original components again and what redundancy is
necessary. Can the ’fine’ heater be operated in parallel with the coarse heater? Can
it run all the time? This could be important if the room starts off cold, and we had
not considered the fact that the fine heater might have a limit to its duty cycle.
This example has shown how the complexity of a single circuit could be driven
up by a number of items including :-
• Environment
• Reliability

182
• Performance
• Changing Scope
• Usability
Initially we considered only the heater circuit, basically taking a known solution
and trying to impose it upon the problem. But slowly the scope of the problem
got bigger, so that not just a heater was required, a whole heating and monitoring
system was required.
The example system also suffered from ’requirements creep’, as we slowly ex-
panded from a system specified to maintain a given temperature to one that was
intended to take a room from almost any temperature to the desired temperature,
and we had not even addressed any cooling requirements. As an aside, a colleague
has a real central heating system for his house, bought off the shelf which includes
factors for giving weight to the outside air temperature and the amount of sunshine
incident upon the house, as well as the obligatory interface for Internet accessibility.
The really interesting questions are triggered by considering the answers to the
question ’Who monitors the monitor?’. Every time a monitoring requirement is
added, it imposes a ’new level’ to the design. Not only should the monitoring system
be more reliable than the system that it is monitoring, it should also behave correctly
over the entire potential range of operation of the system which it is monitoring,
including starting and stopping and all possible operations in between. Exactly how
much do you trust a unit that says that it has failed?
Hofstadter [24] introduced the terms ”Strange Loop” and ”Tangled Hierarchy” to
explain the phenomenon of, when moving in a single direction through the levels of
hierarchical system, the observer or participant suddenly finds herself back where she
started. Hofstadter illustrates this phenomenon in a wonderful book with examples
from music (e.g. Bach Canons), art (the works of M.C. Escher) and dialogues

183
reminiscent of Lewis Carroll’s Alice in Wonderland. He explains how complexity can
”emerge” by creating another level, almost as a way of avoiding a logical conflict.
For example, if we consider the sentence
”This sentence is a lie”
we run into a conflict, since each of the individual constituents of the sentence is (or
may be) true, but when we move to the semantic level, the sentence itself is telling
us that it is false. Which do we wish to believe? Mathematicians have continued
doing mathematics, long after Godel produced his paper, and indeed long after he
died. It is always possible to work around this conflict by introducing another axiom,
and continuing happily along in the new system, i.e. at a higher level, with greater
complexity and a greater risk, since the more axioms there are, the more there is
that can be wrong. Nothing is too complicated. Almost everything is more complex.
9.6 Complexity Management
As we have seen, as systems grow, there is an unavoidable increase in the complexity.
Although it is not possible to have a ’big’ system that is simpler (in all ways) than
a ’small’ system, it should be possible to make the complexity scale at a rate less
than the size of the system by trying to localise as many functions as possible
within modules and reducing the coupling between modules as much as possible.
This practice has been established as classic software engineering as well as in other
disciplines. This means, for example, trying to encapsulate functions such as control
and monitoring of a particular sub-system, without involving other sub-systems.
This can often be achieved for the nominal case, but is much more difficult at the
extremes of the performance envelope.
For example, when batteries charge, they get hot. Conversely,when they dis-
charge, they get cool. For everyday use as a source/sink of extra power in stabilising

184
a bus voltage, these effects can be largely ignored, however during eclipses batteries
have to work much harder, and this can cause large temperature excursions which
often require a change in the thermal control system. One telecommunications satel-
lite known to the author had a thermostatically controlled heater to control battery
temperature operating directly from the battery. In the nominal case this system
performed satisfactorily but after a few years of service, as both battery capacity
started to dwindle and the solar array no longer performed as well as at Beginning
of Life, the battery charging was taking longer and longer because the heater was
draining the battery. Left alone, it would have taken more than the time between
two eclipses to recharge, so a ground procedure was implemented to manually regu-
late all the loads in order to ensure that the batteries were charged before the next
eclipse.
If we define the goal to be to make a system as simple to operate as possible,
then at first glance, automation seems to be the key. A Russian manufacturer known
to the author from personal experience NPO-PM tries to automate as much of the
operations as possible. To this end, each sub-system is controlled by a software
model within their control system, which is supposed to model all feature of the
sub-system including known failure modes. This laudable goal is achieved with a
group of approximately 70 programmers all specialists in their own area, which would
be a massive cost in the West. The result is a control system that is highly tailored
to one satellite, and became almost useless when somebody else was commanding
the satellite! Basically, they have optimised the system for a single path through
the satellite state-space, and even with its detailed models it was ’confused’ very
easily by small changes from the current state in an unexpected direction.
Essentially NPO-PM have simplified operations until they do not exist. The
satellite is ’highly autonomous’, and designed to be capable of continuing service
tolerant to any single failure, and many double failures. Typically, the company

185
does not even routinely monitor telemetry from all of their satellites, since they are
designed to switch on a beacon as a signal that ground intervention is required.
This is similar to the way in which vending machines and lifts operate: nobody
expects to have a human operator in attendance, or technicians present on site all
the time. What has happened is that the market accepts that for certain services, it
is acceptable that either people lose small amounts of money in vending machines,
some people are unable to buy from vending machines when they want, or that
people may have to wait for a while inside a broken lift. The common theme is
that the loss of service has been accepted. Perhaps because of the high costs,
and higher profits, associated with satellite broadcasting networks, this has not yet
occurred in the West. For scientific missions, which from their nature, tend to be
very specific and non-repeatable, the costs associated with major automation in the
ground segment are still thought to not be beneficial. In any case, since the data
gathered by the science mission is the product, there must still be a link to a ground
station in some part of the control chain.
9.6.1 System Design
Sometimes the reliability and the availability of a system are linked in strange and
often contradictory ways. By definition, a safely-critical system, should always be
safe, even when this design decision adversely affects its availability. For a mission
critical system, the availability of the whole system is paramount, and so this could
conflict with individual safety. Naturally, if the system (like most satellites) is
intended to be exploited by humans rather than being necessary for their survival
this does not increase the conflict, although there might be other examples where
the decision is not so clear cut, for example, anywhere where people are involved,
such as in a train or lift. If given the chance say, to travel in a lift that has failed
its safety checks, most people would probably use the stairs, but if a company was

186
seeking to install a lift in its 10 storey HQ building, and it was given the choice
between a cheaper lift with 99.99% availability and a more expensive one with 99%
availability, most companies would be very tempted to take the cheaper one, even if
the second lift was more expensive and less available because it carried out certain
checks that were not mandated by the safety legislation in force.
Ground controllers should be provided with transitions that can cover the entire
state-space, ie. it should be possible to command all actions from the ground (and
more) that can be performed by the on-board autonomy. From the control point-
of-view, it makes little or no sense to differentiate between automatic functions that
are performed by hardware and those performed by software. The only difference
is that there is more chance of being able to correct (or change) those functions
implemented in software after the satellite has been launched.
The introduction of automation (frequently through use of software) into the
control loop (or the environment) is performed with the best intentions, however it is
frequently increases the complexity of the system. Whereas in the nominal condition,
operations may have been simplified (e.g. a single command ’Configure Attitude
Control System’), in terms of monitoring, the task remains the same (ensure that
the correct number of each type of sensor have been powered on and are working)
and any attempt to override the system for manual becomes much more difficult.
Manual configuration of an autonomous system must:
• Identify what changes have been made by the system to itself;
• Disable the system from making changes to any further units;
• Undo the changes that have been made, where necessary;
• Manually perform the changes themselves.
Software reliability is notoriously difficult to predict. One instruction executed
incorrectly (due to change or error in specification, or development) can have global

187
impact. Common techniques used by hardware engineers, such as extrapolation and
interpolation, have almost no applicability in software reliability.
9.6.2 Software Use
Certain ’classic’ failures can be readily identified in the industry.
• Fashion following - e.g. the way many firms adopted object-oriented ap-
proaches and languages, perhaps without any real thought or justification.
It is reported that the useful life of an office personal computer is now approx-
imately six months. At the end of this period, the PC can still run the same
software that it was bought to run, but the relentless march forward of the
industry, the introduction of new features and bloated software, means that
the PC can no longer run the current software.
• Exaggeration - This is closely linked to trend-setting. A new design method-
ology, a new language or a new operating system is often marketed (and hence
perceived) as a panacea.
• Too trusting - A tool can easily be developed to return an answer (’Okay’,
’true’, or ’false’) but the quality of the answer depends upon the quality of the
data used by the tool as well as, of course, the correctness of the tool itself.
People have an innate tendency to believe an answer that is produced by a
machine and to treat as unchangeable, whereas a human can be challenged.
Another failure or mistake is referred to as ’clumsy automation’. ’Clumsy au-
tomation is a label coined by Wiener to describe such poor coordination between
the human and machine. The benefits of new technology accrue during workload
troughs: when there was already virtually nothing to do, technology will give the
user even less to do. But the costs or burdens imposed by the technology (the ad-
ditional tasks, new knowledge, forcing the user to adopt new cognitive strategies,

188
new communication burdens, new attentional demands) occur during periods of
peak workload; during fast-paced periods of high criticality. This creates opportu-
nities for human error and paths to system breakdown that did not exist in simpler
systems’[10].
Woods reports his research from ’highly automated flight decks in aviation, space
mission control centers, operating rooms and critical care settings in medicine’[43]
where automation, was introduced ’in the hope that they would improve human
performance by off loading work, freeing up attention, hiding complexity’ and indi-
cates that the ’pattern that emerged is that strong but silent and difficult to direct
machine agents create new operational complexities’.
Woods reports how users described their interaction with automated systems
and the challenges that they faced. The users ’revealed clumsiness and complexity.
They described aspects of automation that were strong but sometimes silent and
difficult to direct when resources are limited and pressure to perform is greatest’[43].
Woods reported that the users frequently indicated their confusion and increasing
workload with the following phrases or their equivalents:
• ”What is it doing now?”
• ”What will it do next?”
• ”How did I get into this mode/state?”
• ”Why did it do this?”
• ”Why won’t it do what I want?”
• ”I know there is some way to get it to do what I want.”
• ”How do I stop this machine from doing this?”
and that ’the potential for surprising events related to automated systems ap-
pears to be greatest when automated systems act on their own without immediately
189
preceding directions from the human crew ...and when feedback about the activities
and future behaviour of the automated system is weak’[43]. Dekker asks what a
user should do to prevent being surprised by the automation, and ’from a variety of
accident and incident reports’[10], makes the following recommendations. ’The user
must:
• have an accurate model of how the system works;
• call to mind the portions of this knowledge that are relevant for the current
situation;
• recall past instructions which may have occurred some time ago and may have
been provided by someone else
• be aware of the current and projected state of various parameters that are
inputs to the automation;
• monitor the activities of the automated system;
• integrate all of this information and knowledge together to assess the current
and future behaviour of the automated system’[10].
9.6.3 Individual Operations Strategies
Given that Ramsey Theory indicates that in any system there will always be some
kind of pattern even in random structures and the human tendency to make and
stick to hypotheses outlined in Section 3.2.3, Green[18] suggests a number of tech-
niques and steps to be followed by pilots as they maintain mental models of their
environments. These are summarised and slightly paraphrased as:
1. Gather as much data as possible from every possible source before making an
inference

190
2. Take as much time as is available before making one’s mind up (ie Don’t jump
to conclusions).
3. Consider all of the possible interpretations of the data - including the unlikely
ones - before deciding which data fits the problem
4. After having embarked on a course of action, stop occasionally to take stock of
the situation and question if the hypothesis still fits the data as events progress
5. Consider ways to test the hypothesis in a positive and negative way
6. Be aware of the tendency to disregard data, so if new data does not fit the
hypothesis, do not disregard them but make time to reconsider the situation
and retrace the steps back to the first sign of a problem
7. Ensure that the world is not interpreted in terms of how you would like it to
be, but in terms of how it is.
8. Hope for the best, but plan for the worst
9.7 Summary
Spacecraft and spacecraft operations are complex for a number of reasons.
Space systems are usually still quite recent inventions compared with shipping,
railways, cars and the aviation industry. Systems designers (and, in the author’s
experience, also those that procure space systems) are risk averse, which has yielded
an approach to the design and implementation of evolution rather than revolution.
The disadvantage of this evolutionary approach is that each design brings a lot of
heritage with it, so there has been a gradual accretion of complexity as functions
and automation have been added on, rather than a clean overview.
191
From the point of view of the operations, the spacecraft are generally automated
and safe, but this provides little chance for learning for those in charge of the oper-
ations.
Since virtually all spacecraft operations are a form of remote control, the data
used for a hypothesis often incomplete. The information on difficult (or pathologi-
cal) cases is often not available and generally no physical examination possible at all,
compared with the case of aircraft or marine accident investigations. There is gener-
ally no sharing of data between different organisations, and the author’s experience
is that there is very little data is shared from one project to another.
There is no general measure of complexity, and no general agreement that com-
plexity is bad, so designs are not optimised for this aspect. The manufacturers
of spacecraft and instrument have little incentive to keep designs and operations
simple, and significant incentives to maintain schedule for the delivery of the flight
hardware and software. This situation is reminds the author of the situation in
the air transport industry and the attitude of ignoring human performance and and
limitations evaluation and bundling them together as ’pilot error’. This attitude
was eventually changed by a combination of legislation and financial incentives to
improve flight safety.

192

Chapter 10
Telemetry and Telecommand
10.1 Introduction
This Chapter provides a simple introduction into Satellite Telemetry and Telecom-
mand Systems. It introduces the concepts of how commands are sent to the space-
craft (telecommands) and how data is sent from the spacecraft to the ground control
centre (telemetry). It outlines the techniques which have developed with time (fixed
format telecommands and telemetry) and introduces the concepts of variable length
packets, which make better use of the available bandwidth. The issues associated
with the information transfer are extended in the next Chapter.
Satellites are commanded by sending radio signals from the Earth to the receiver
on-board the satellite. To enable the personnel on the ground to monitor the status
of the satellite, the satellite itself sends out radio signals that can be detected by
equipment on the ground. Normally there is an Operations Control Centre (OCC,
sometimes referred to as Satellite Control Centre, SCC) and one or more ground
stations. Each ground station is equipped with one or more large antennae that
can support communication with the spacecraft. In the early days of space flight,
commands were sent and telemetry was received at comparatively low frequencies,
for example VHF or UHF band. For these frequencies the familiar parabolic ’dish’
antenna were unnecessary, and stick-like Yagi antennae were common. It was also
193
194
common to have separate antennae for transmission and reception, although this is
now rare. When low frequencies were being used, antenna pointing did not need to
be very precisely controlled, either on the satellite or on the ground. Frequencies
used for communication with satellite have generally got much higher, S-Band, C-
Band or Ku-Band being common. This means that
• Higher data rates are possible
• Beam width is reduced
• Pointing requirements greater
• Losses are less.
Telecommands are sent to the spacecraft in a fixed data unit. Part of the data
unit identifies the target, just in case the telecommand should be received by the
wrong spacecraft. The remainder contains the data which will be interpreted by the
spacecraft as an instruction, with some redundancy in the form of checkbits. There
are two well-defined standards in Europe which dictate the format of the data block.
The first was the PCM Telecommand standard[13] Telecommand standard in the
industry), which was eventually superseded by the Packet Telecommand Standard
[14].
10.2 PCM Telecommands
The basic data unit is a 96 bit frame which is shown in Table 10.1.
The term ASW means Address and Synchronisation Word, which dates from
before the time that a word was conventionally (but not incontrovertibly) taken
to be 16 bits. The ASW was originally supposed to be a unique identifier for the
spacecraft decoder, but the proliferation of spacecraft forced people to reuse ASW.
The Hamming code is a 4-bit code capable of detecting a 2-bit error in the 8-bit
data and detecting and correcting 1 single bit error, although the error correcting

195
16 bit ASW = 16 bits4 bit Mode = 4 bits
8 bit Data Word 1 + 4 bits Hamming Code = 12 Bits8 bit Data Word 2 + 4 bits Hamming Code = 12 Bits8 bit Data Word 3 + 4 bits Hamming Code = 12 Bits
Repetition of Mode, DW1,DW2,DW3 = 40 BitsTotal = 96 Bits
Table 10.1: PCM Telecommand
capability is not used as part of the PCM standard. It is clear that the PCM
standard requires a significant overhead (96 bits transmitted for 24 bits of useful
data, giving a 16-bit range (address space) within the spacecraft. It also shows a
very poor use of error correction codes. ESA became the issuing authority for the
ASW Spacecraft identifiers (SCID) in Europe. When it realised that there would be
a conflict over the reuse of SCIDs, ESA decided to stop issuing ASW and encourage
(force) people to use the packet telecommand standard.
10.3 Packet Telecommanding
The basic unit of transport of the packet TC standard is the CLTU. This uses a
longer ’frame’ length, and more sophisticated error control. Instead of repeating the
data and using Hamming Codes, a BCH polynomial is iterated over the contents of
the data field. While this is theoretically more efficient, using 1 octet of checksum
for 7 octets data, it is solving a non-problem, since no European spacecraft in flight
are actually limited by the uplink speed. The uplink bottleneck has always been in
the on-board processing.
When ESA first started to control satellites, commands were sent from the
ground station. The control centre personnel (the Flight Control Team) usually
had a voice link with the ground station, and would request that one or more com-
mands be sent. These would be manually entered one by one into a telecommand
encoder, checked manually, and then transmitted. Readouts of the value of partic-
ular positions in the telemetry format could also be requested by voice. The whole

196
data stream was often recorded on tape and then shipped back to the control centre.
The next increase in sophistication was to allow the control centre to connect
to the telecommand unit in the ground station and send the telecommand elec-
tronically. Similarly the telemetry could also be relayed back to the control centre
in real-time. This was possible since the data rate for the early spacecraft was
still very low. Only the scientific data of Giotto (launched in 1985) and Hipparcos
(1989) could not be sent in the bandwidth of an ordinary telephone line, and both
could be fitted into a 64 kbps leased line. EURECA (launched in 1993) required a
return to the previous method of record and playback data, since the data rate of
256 kbps was thought to be too high for the equipment of the day. Thus EURECA
(and subsequently CLUSTER) was equipped to pass the real -time data necessary
for monitoring the health of the spacecraft back to the control centre, while the
stored data could be captured in a high-speed transfer from the satellite to the
ground station, which could buffer the data and pass it back to the control centre
as necessary.
By comparison, in the Soviet Union (and in present day Russia) the use of any
space segment was initially reserved for the military. This meant that the USSR’s
major communication satellite operator, NPO-PM, could not have direct access to
the ground stations, so control remained as something that had to be requested from
the ground station staff. This could partly explain why the Russian approach even
now favours a much more autonomous approach to spacecraft control.
10.4 Telemetry
Satellites modulate a digital stream onto a sub-carrier, sometimes via an intermedi-
ate frequency. The use of multiple analogue components onto a carrier is possible,
but that would provide a high time resolution of a small number of parameters,
exactly the opposite of what is needed. Generally only ranging data is modulated

197
directly onto the downlink. This enables the ground personnel to determine the
distance between the spacecraft and the ground station (and sometimes the radial
velocity) which, when successive measurements are made and/or multiple ground
stations used, means that the orbit of the spacecraft can be determined.
Telemetry, usually abbreviated to TM, contains different kinds of information.
Some it is needed with a high frequency (e.g. if it is necessary to show the fluctu-
ations in a signal that varies at high speed) and some things only vary at a lower
speed, so requiring less bandwidth. It would seem to be desirable to have a single
data structure that could then be sent when needed. If the situation was changing
rapidly, then the telemetry would be sent faster. However, this has a number of
associated disadvantages. The analogue properties of the radio signal would change
if no telemetry were to be modulated onto the r.f. carrier, and certain equipment
within the ground station might lose lock on the signal. It is thus necessary to al-
ways transmit some data, even if it is only to fill the downlink. These are sometimes
referred to as idle frames.
The usual technique used in PCM type telemetry systems is to send the TM
parameters in a fixed order. This is referred to as a TM format. By splitting the
single format in smaller units, variously referred to as TM frames, TM sub-frames or
sometimes sub-formats, a certain amount of flexibility concerning the rate at which
information is transmitted. If, for example, a format is defined to consist of 16
frames of telemetry, information that changes very slowly may be transmitted in a
single frame (i.e. once per format), whereas information that is varying more quickly
(or is deemed to be more important) can be transmitted in every frame. Several
situations in between the two extremes are also possible: every second frame, ev-
ery fourth frame or every eighth frame. All of these options mean that the same
fixed format, defined before flight, can be used to transmit information at different
rates. It is now appropriate to introduce some terminology that is often used within

198
Frame offset0 1 2 3 4 5 6 7 8 9 10 11 12 13 14 15
0 ASM A123 B100 C200 B100 B100 B1001 ASM A123 B100 C201 B100 B100 B1002 ASM A123 B100 C202 B100 B100 B1003 ASM A123 B100 C203 B100 B100 B1004 ASM A123 B100 C204 B100 B100 B1005 ASM A123 B100 C205 B100 B100 B1006 ASM A123 B100 C206 B100 B100 B1007 ASM A123 B100 C207 B100 B100 B1008 ASM A123 B100 C208 B100 B100 B1009 ASM A123 B100 C209 B100 B100 B10010 ASM A123 B100 C210 B100 B100 B10011 ASM A123 B100 C211 B100 B100 B10012 ASM A123 B100 C212 B100 B100 B10013 ASM A123 B100 C213 B100 B100 B10014 ASM A123 B100 C214 B100 B100 B10015 ASM A123 B100 C215 B100 B100 B100
Table 10.2: Telemetry Format
the industry, but unfortunately is not used consistently. Super-commutated usually
means that a TM parameter occurs more that once per frame and sub-commutated
means that a frame occurs less than once per frame. However, some people use the
same terms to describe the distribution of parameters per format, rather than per
frame. Thus it is always preferable to use the full term, e.g. frame sub-commutation,
to avoid ambiguity.
A simple example of a PCM format is given in Table 10.2, containing 16 frames
per format, and only 16 octets of data per frame. This example format shows some
of the basic features of fixed format telemetry. Each frame starts with a synchro-
nisation marker, which is detected by the ground equipment. Usually each frame
contains a frame counter, and each format then also contains a format counter.
Each frame contains a mixture of frame super commutated and sub commutated
data. For example, the parameters B100 occurs 4 times per frame, and is there-
fore frame super commutated. The parameter A123 occurs once per frame, and
is frame commutated. The parameters C200-215 are frame sub-commutated, but
format commutated.
However, one of the principal disadvantages of PCM Telemetry remains the fact
199
that, even if multiple format-types are developed, the channel sampling must be fixed
a long time before launch and it is difficult to modify it afterwards. If modifications
that are made to the spacecraft to change the way that parameters are sampled,
then the ground control system must also be changed.
To overcome some of the limitations of fixed period sampling, a further feature
is sometimes introduced. If one sub-system was normally producing a range of
parameters, there sometimes a feature called ’dwell’ mode. This means that rather
than transmitting a range of parameters to give a complete view of the sub-system,
it is possible to focus in upon one particular parameter and dedicate the whole
telemetry channel to one parameter and see many more measurements. Despite the
terrible contortions that this requires on the ground control system, this is still quite
a common feature since it enables the ground control team to see detailed variation
of a parameter over time. This can be particularly useful for short term or single
events, such as trying to monitor the current as a pyro device fires, to be sure that
it operates correctly.
As spacecraft have become more sophisticated and have incorporated more soft-
ware, some more complications have developed, such as the idea of a Polling Se-
quence Table, where a programmable look-up table is used as the source of each
format. Whilst this can overcome the problem of defining the channel sampling a
long time before launch, it can still leave the problem of requiring the control team
(or the control system, if it is automated) to identify when the Polling Sequence
Table was changed, and what the changes were.
Naturally, Dwell Mode and other similar delights, completely ruin the normal
processing of the telemetry frame, and mean that extra processing must be per-
formed i.e. the frame must be received, decoded, a particular location checked for
a parameter to indicate whether or not Dwell Mode is in operation, and then the
format must be processed accordingly. This means that all nominal activities, such

200
as limit checking, status checking etc. may have to be suspended for some or all
parameters in the format. This also means that it is difficult or impossible to get
detailed information from 2 or more different sub-systems at the same time. The
scheme proposed by ESA (and adopted by the CCSDS) as an answer to all of the
problems of fixed format telemetry is Packet Telemetry.
10.5 Packet Telemetry
The basic principle of packet systems is that different parameters change at different
rates at different times, and so they can be grouped according to how often we
think it is important for the ground operations team to see ’fresh’ values. Some
temperatures might not change at all for days, whereas a thruster temperature
could change rapidly whilst being prepared for firing, during the firing and even
after the firing. Similarly, we might not need to send telemetry from a scientific
instrument when the instrument is off, but when it is in use, the telemetry must be
receive and checked. This means that each sub-system or instrument can be given
an overall budget, or bandwidth of telemetry parameters in bytes per second or per
minute in different modes.
Some intelligent packet systems (usually a complex instrument or subsystem,
such as the ADCS) can change their own telemetry mode, sending data whenever
appropriate, for example, during manoeuvre operations, whereas other subsystems
might need to rely on the central data handling subsystem to poll them at the
appropriate interval to get their telemetry. Reassigning the bandwidth according to
events onboard can lead to much improved availability of pertinent information, as
long as it is done without error. The disadvantage is that it is much more complex
system, and there is more that can potentially go wrong. However, with the more
recent PCM systems (ERS-1, ERS-2), or transfer frame-based systems (Cluster),
telemetry stops updating or stops completely if the software stops running, so true

201
Packet TM is only a small step beyond the intermediate steps which are offered as
an alternative.
10.6 Summary
This Chapter has shown that there have been a number of standards to govern
how telemetry and telecommands should be formatted. The initial approach was
to use fixed messages for both telemetry and telecommands. As the complexity of
satellites increased, it became desirable to have more flexibility in the way the uplink
and downlink bandwidth were used, as well as to permit a larger address space to
distinguish the information sources and sinks within the spacecraft. This lead to
packet-based communication, in the same way that ground telephone networks went
from a series of point-to-point connections, to packet-switched networks. It brings
the advantage of using the available bandwidth better, as long as not everyone wants
to talk to everyone else at the same time. The idea of how to allocate parameters
and packets to a system so as to maximise the information rate is the subject of the
next Chapter.
The other trend of note is that the standardisation process initially consisted
on locally or nationally-mandated standards (in Europe, the standards coming from
ESA) and has then tended to include a wider and wider participation, both within
Europe, with the participation being extended to include industry, and interna-
tionally, with the establishment of more independent, international bodies, such as
the European Cooperation for Space Standardisation, ECSS, and the Consultative
Committee for Space Data Systems (CCSDS).

202

Chapter 11
Information Theory
11.1 Introduction
The standards described in the previous Chapter give the syntactical information
on how to build a telemetry frame, or telemetry format or a packet, but they do
not describe how to allocate parameters to sources or sinks, what size of parameter
is optimal, nor how the split between periodic and non-periodic information could
be made. To examine this issue, this Chapter starts off from Shannon’s information
theory (Section 11.2). Section 11.3 then looks at an example structure of a discrete
system, in this case, an array of perfect switches, and shows how the information
content of this system will vary. In Section 11.4 this example is expanded to con-
sider how it could be monitored by a fixed-format telemetry system and how well
such a monitoring system conveys information about the state of the system it is
monitoring.
11.2 Information Theory
The Shannon information[39] is defined according to the number of possibilities Z,
which in the case of a coin is two and for a die is six.
It is interesting to view information in terms of the information per symbol. Let
us consider a simple example Ro different possible events which have the same a
priori probability , e.g. the tossing of an un-biased coin. When tossing a coin, we
203

204
have two possible outcomes, and hence Ro = 2. If we were rolling a die, we would
have 6 possible outcomes, and hence Ro = 6. Thus the outcome of tossing a coin
(or rolling a die) can be perceived as the reception of a message, and only one of the
possible Ro outcomes is actually realised. Apparently, the greater Ro , the greater is
the uncertainty before the message is received and the larger will be the amount of
information after the event. In the initial situation we have no information (Io = 0)
with Ro probable outcomes. In the final situation we have an information I1 6= 0
with R1 = 1, i.e. a single outcome. We desire that I is additive when we have two
independent events, so that if we have two such sets, the total number of outcomes
is
Ro = Ro1 ∗ Ro2
then we require that the information
I (Ro1 ∗ Ro2) = I (Ro1) + I (Ro2)
This relationship can be fulfilled by choosing
I = K ∗ ln(Ro)
The constant K is arbitrary and can be fixed by some definition. Usually we consider
binary systems, so when we consider all possible ’words’ or sequences of length n,
we find that there are R = 2n realisations. If we wish to identify I with n in a binary
system, we therefore require
I = K ∗ ln(R)
I = K ∗ n ∗ ln(2)
I = n
which is fulfilled by
K = 1/(ln(2))

205
or
K = log [2](e)
With this choice of K we have
I = log [2](R)
This has the property that I is now the number of binary digits in the system, ie if
R = 8, I = 3. It is important to note that that word ’bit’ is frequently used with
two different meanings:
• To describe a Binary Digit , a usage credited to John Tukey
• To describe the amount of information in a message, if the conventions of using
logarithms to base 2 are followed, as here.
If we now consider the case where we initially have Ro equally probable initial cases
and R1 equally probable final cases, the information is
I = K ∗ log(Ro) − K ∗ log(R1)
If we want to derive a more convenient expression for the information we can proceed
as follows.
Consider a symbol stream being generated by a controller by reading off the
statuses of n flip-flops. An initial guess at the entropy might be calculated according
to the following reasoning: Each flip-flop can have two positions, referred to as on
(N) and off (F) (in information theory terms, each generator has an alphabet of
two) and each position is equally likely. This leads to the following calculation of
the entropy of the source
H := −p log2(p) − (1 − p) log2(1 − p)
On average, each digit will be a 1 with probability p (and a 0 with probability
(1 − p)), giving the curve of Shannon information as a function of probability that

206
is shown in Figure 11.1. Note that when ’information’ is almost certain, at either
extreme, the value of the information is much less. The maximum information comes
when the probabilities of a 0 or a 1 are equal i.e. for a binary stream, p = 0.5, and
for other probabilities the information is much less.
11.3 Background: Hypergraph
Now let us turn our attention to the stream as a whole (for example the TM of a
fixed format satellite, with format length n symbols. The problem is that now the
symbols are now no longer random when seen as a whole, and hence the entropy of
the source is lower (recall that a biased coin is easier to predict than a fair coin).
If there are 2 symbols, the alphabet is 2n . Because of the relatively slow dynamics,
single symbol changes are more likely than two symbol changes, which in turn are
more likely than 3 symbol changes etc., etc. The state space of this system then
looks like a hypergraph.
A hypercube is a regular graph. Each vertex has degree n, and, just like for
a 3 dimensional cube, no vertex is initially distinguishable from any other i.e. the
choice of origin is arbitrary. In a hypercube of dimension n, there are n vertices
that are one step away, from each of those there are (n − 1) vertices which are 2
steps from the starting point, although there is some overlap between second nearest
neighbours, and even more with 3rd nearest neighbours (see Figure 11.2).
In the following, let p be the probability of a transition, and then in each case,
the transition probability needs to be divided by the degree of the vertex to get the
transition matrix from the adjacency matrix. We can see that the total number of
vertices in an n-cube is 2n and that in each row r from the origin there are(n
r
)
vertices.
In the steady state, the probability of a particular vertex being occupied is
uniform (1/16 in this case). But since the numbers of vertices in each row is a

207
0.2
0.3
0.4
0.5
0.6
0.7
0.8
0.9
1
0.1 0.2 0.3 0.4 0.5 0.6 0.7 0.8 0.9 1p
This graph shows how the Shannon information of a binary digit varies with theprobability p of a change. It is maximum when the next value is unknown, anddecreases in both directions as the value becomes more predictable.
Figure 11.1: Shannon Information of a Binary Digit

208
14
15
10
11
7
12
13
2
8
4
5
3
9
6
1
0
Figure 11.2: Example Hypercube - a 4-cube
209
binomial distribution, the likelihood of being in a certain row is proportional to the
number in that row
11.4 Fixed Format Telemetry
Consider a hierarchy of switches and flags. The flags are used for monitoring an
array of n switches. For a leaf flag, it changes state if one of its relays changes state.
For a non-leaf-flag, it changes state if one of its child ’flag’ nodes changes state. If
there are n switches, and n + 1 flags then the total depth of the monitoring tree is
2. Let the probability of each switch changing state be p, then the parent node has
a total information of
∑n
i=1 (−p log2(p) − (1 − p) log2(1 − p))
= n (−p ln(p)
ln(2)−
(1 − p) ln(1 − p)
ln(2))
So it would seem from this analysis that the information increases linearly with n,
the size of the frame, and that is indeed the case (see Figure 11.3). Unfortunately, the
situation becomes more complex. Although the individual relays are independent,
they are still covered by statistical analysis, which says, for example, that a group
is less likely to go from being all ’on’ to all ’off’ than it is for one of the individual
members to go from ’on’ to ’off’. This is where the properties of the hypercube
become important. Most of the symbols involve changes in more than one digit,
and from an operational point of view, this is not desirable. We want to be able to
see the first change, not the last one.
Our desire to see the first change in n relays means that most of the information
alphabet is ignored, or never seen. We design the spacecraft (for safety’s sake) so
that the parameters are sampled fast enough to spot any change quickly, but this
reduces the information content of whole stream, since it becomes very repetitive.
Instead of having 2n symbols in our alphabet, we only have n + 1 .

210
24
68
1012
1416
1820
n
0
0.2
0.4
0.6
0.8
1
p
02468
101214161820
Info
This 3-dimensional graph shows the Shannon information (labelled Info) plottedagainst the probability of a transition pand the number of switches n.
Figure 11.3: Information of a Multi Digit System

211
24
68
1012
1416
1820
n
0
0.2
0.4
0.6
0.8
1
p
0
2
4
6
8
10
Inf
This shows that in a system which issues a new report after every single change,the maximum information is much lower than if some messages contain changes inmultiple bits. This is because the alphabet of the system has been artificiallyconstrained. This effect can be seen by comparing the vertical scale Info on thisgraph and Figure 11.3.
Figure 11.4: Information of Single-Change System

212
By comparing Figure 11.4 with Figure 11.3,and comparing the numbers on the
Info scale, it is obvious that a great deal of information has been lost by this artificial
constraint.
11.5 Analysis of Flags
If we now consider the case where the hierarchy gets extended, so that there are
n relays, and n + 2 observers. Each leaf group generates Inf(n,p) information, and
passes it up the tree. The non-leaf nodes have g relays going into them. The
behaviour of each node is now: it passes the status if there is a change (which has
probability pg , zero otherwise (probability = 1 − (pg)). The status consists of g
relays, which can always be encoded in d(log [2](g))e digits.
First we consider the case where manager/parent node raises a flag if there is
a change, else shows no change with a lowered flag. This has 2 symbols, with
information: Iflag := − (1−qg ) ln(1−qg )ln(2)
− qg ln(qg )ln(2)
, where q = 1 − p. This is because
qg is the probability of the state machine still being at the origin, i.e. all bits
unchanged, and 1− qg is the probability of it being anywhere else in the graph. We
can recast the same expression in p to get
Iflag := {−(1 − (1 − p)g) ln(1 − (1 − p)g)
ln(2)−
(1 − p)g ln((1 − p)g)
ln(2)}
This function is plotted in Figure 11.5. The information is very low for middle
and high probabilities, since as g increases, the likelihood that a change will occur
also increases, and if the flag is always either ’on’ or ’off’. This means that it becomes
predictable and the information content is lowered. At the low probabilities, the flag
becomes less predictable unless group size is large. If we partially differentiate this
function w.r.t. p to trace the maxima, we obtain
Idash := ∂
∂pIflag.
Idash := {−(1 − p)g g ln(1 − (1 − p)g)
(1 − p) ln(2)+
(1 − p)g g ln((1 − p)g)
(1 − p) ln(2)}

213
24
68
1012
1416
1820
g
0
0.2
0.4
0.6
0.8
1
p
0
0.2
0.4
0.6
0.8
1
Info
This graph shows the information of a flag that signals a change in a group of bitsbeing monitored by it. The group size is g and the probability of a change in onebit of the group is p. When p is small, the information is high, but as p increases,the information content reduces since the flag is then always indicating thatchange has occurred.
Figure 11.5: Information of Flag-based Monitoring
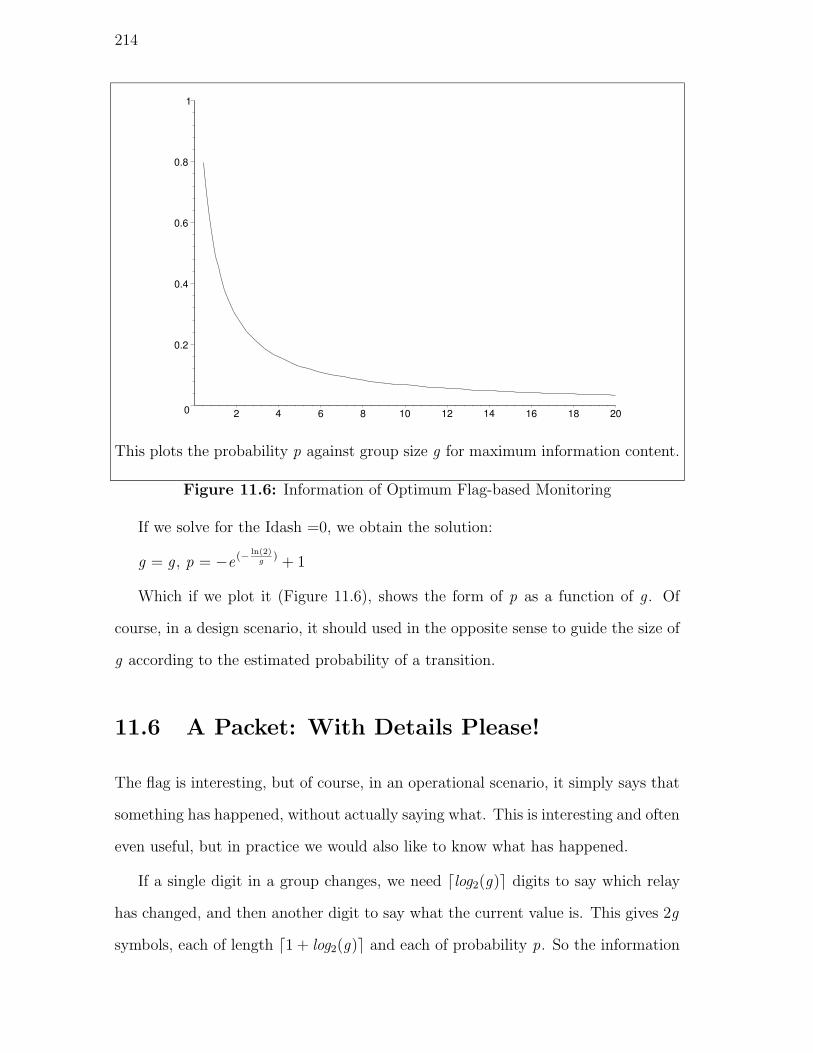
214
0
0.2
0.4
0.6
0.8
1
2 4 6 8 10 12 14 16 18 20
This plots the probability p against group size g for maximum information content.
Figure 11.6: Information of Optimum Flag-based Monitoring
If we solve for the Idash =0, we obtain the solution:
g = g , p = −e(−ln(2)
g) + 1
Which if we plot it (Figure 11.6), shows the form of p as a function of g . Of
course, in a design scenario, it should used in the opposite sense to guide the size of
g according to the estimated probability of a transition.
11.6 A Packet: With Details Please!
The flag is interesting, but of course, in an operational scenario, it simply says that
something has happened, without actually saying what. This is interesting and often
even useful, but in practice we would also like to know what has happened.
If a single digit in a group changes, we need dlog2(g)e digits to say which relay
has changed, and then another digit to say what the current value is. This gives 2g
symbols, each of length d1 + log2(g)e and each of probability p. So the information

215
0
2
4
6
8
10
g
0
0.2
0.4
0.6
0.8
1
p
00.20.40.60.8
11.21.41.61.8
2
Inf
This shows the Shannon information of a packet that says which of the relaystatuses that it is monitoring has changed, and the current value. It is plottedagainst group size g and probability p.
Figure 11.7: Information of Packet-Based Monitoring System
is.
−2gplog2(p) and the information per digit is
−2gplog2(p)dlog2(g)+1e
This compares very favourably with the coefficient of n that was calculated for
the multi-digit system. This is shown in Figure 11.7.

216
11.7 Information Usage
There is a very simple but very powerful way of modelling a system, which is to
construct a Markov Model. In a Markov model, the probability that a system makes
a transition from one state to another depends only upon the current state, not the
history of the system i.e. its path to the current state. Shannon[39] developed his
theory of information by considering discrete Markov processes, and in particular,
a special class of Markov processes, the ergodic processes.
The general idea behind an ergodic process is one of statistical homogeneity. For
example, that the thermodynamic properties of one molecule over a long time are
similar to the thermodynamic of many molecules when considered in a ’snapshot’
moment. In Shannon’s terms, every sequence produced by an ergodic process has
similar statistical properties, so as longer and longer sequences are considered, the
frequencies of each symbol occurring in a particular sequence will approach definite
limits.
We saw in the previous section that as something becomes predictable, or less
’random’, its Shannon information goes down. This is the information that would be
sufficient to allow an agent (computer or human) to follow the state of the satellite.
Unfortunately, when a human gets used to a certain behaviour, they tend to take
it for granted, and sometimes do not even perceive changes when they do occur. This
is the disadvantage of a human’s intrinsic ability to learn.
This is reminiscent of what can happen in a Kalman filter: The optimally track-
ing filter tracks the target so well that the error between the predictions and the
measurements can go to zero. Unless care is exercised in the design, the Kalman
filter will then cease to use the real measurements at all when it propagates the state
vector. This can be a problem if the target starts behaving differently. One way to
avoid this is to hard-code ranges for the Kalman gains, or even to artificially inject
noise into the measurements. The equivalent technique for a human operator is to

217
have frequent shift-changes to relieve the monotony.
11.8 Summary
In this chapter we have shown that simply repeating the telemetry as in a fixed
format telemetry system does not give a very high Shannon information. By moni-
toring for changes, we generate much more information per bit. In an event-driven
packet system that transmits telemetry packets when something has changed, the
Shannon information scales very well.
It has been shown that the information available on the ground to help an opera-
tor synchronise his internal model with the physical situation on-board the spacecraft
can be very low. There seems to be fundamental discrepancy between the way that
operators perceive information and what the information is actually telling them.
One major assumption in this analysis is that ’all bits are equal’, i.e. that a
priori no telemetry parameter is more important that another. This is decidedly
not true, but the differences are difficult to analyse in a generic way.
This technique holds out the promise that, if, combined with queuing theory,
it could give better estimates about the best way to define synchronous and non-
synchronous packet systems.

218

Chapter 12
Synthesis
This thesis started with the author’s identification of a number of factors that seemed
to to make the spacecraft operations difficult. To reiterate, these were:-
• Launch-centric view of the space-project.
• Fluctuating participation in development life-cycle leads to a lack of continuity
in people and knowledge across the project.
• People perform different roles, have different viewpoints and use a different
vocabulary at various stages in the development. This leads to a perception
gap, a difference between the logical understanding of different people who are
really talking about different parts of the same whole.
• Structural and organisational problems lead to a lack of knowledge sharing
across the project.
All spacecraft operations take place within some kind of organisational frame-
work or team. By analysing some existing organisations we have seen several short-
comings. We have also shown several expected properties: that people often want
new challenges, new projects, i.e. that they often want a career and are ambi-
tious. For a healthy organisation to remain healthy, these aspects must be planned
and monitored in just the same way that the technical operations of a satellite are
controlled.
219

220
This work has presented how organisations usually prepare for mission operations
and has attempted to identify the current best practice, as well as pointing out
anomalies and inefficiencies when they occur. The short-comings has been traced
in Chapter 2 and Chapter 3 to the project-based work with a short-term structure.
This is particularly prevalent on many ESA projects.
Chapter 4 has shown that risk can be positive as well as negative, if the people
and organisation understand it and are willing to manage it in a systematic way.
Since the responsibility for the design integration, launch and in-service opera-
tions normally lie with different teams,there are normally several different viewpoints
of the spacecraft. For example, the designer might see a electrical circuit, the inte-
grator might see a wire in a harness, and an operations engineer might see a control
loop.
It has been shown that this kind of structure creates a need for knowledge sharing
across the different actors in the space business, whilst at the same time providing
no practical mechanism to facilitate sharing of knowledge within or across projects.
The satellite designers conceive a design that satisfies a certain specification. The
components, units and systems are then built and integrated and the whole assem-
bly is tested. The units and systems will continue to be changed or tuned until the
assembled satellite is believed to have been proven to be able to fulfil its mission.
Then the knowledge gathered in designing and building the satellite takes two dif-
ferent paths - into the design of a future spacecraft, and into the operations phase
of this spacecraft.
The people designing the spacecraft have to try to document the design on the
form of User Manuals, operations procedures and the spacecraft database and pass
all the necessary information to the operations team.
At about the same time that the operations are starting, the design team will
normally be moving onto another project. However, any project that has kicked-off

221
OperationsIntegration
and Verification
Design Manufacturing OperationsIntegration
and Verification
Design Manufacturing
OperationsIntegration
and Verification
Design Manufacturing OperationsIntegration
and Verification
Design Manufacturing
OperationsIntegration
and Verification
Design Manufacturing OperationsIntegration
and Verification
Design Manufacturing
Individual Learning
Time
Knowledge transfer that relies on individuals from the development team movingfrom one project to another has several disadvantages:- (i) it does not include thefinal evaluation of the design in operations; (ii) it is very slow, since it can takeplace after the development is completed; (iii) it does benefit projects that run inparallel, which are most likely to be using similar technology.
Figure 12.1: Knowledge Transfer Between Projects By Individuals
in the time between the beginning and end of this project will be unable to benefit
from the lessons learned in this project. Any members of the design team who leave
before the spacecraft has entered service will then also not have the opportunity to
evaluate their design and implementation in a real-life situation.
The only opportunity to transfer information is at the end of the project, when
people are redeployed from one project to another. Figure 12.1, repeated from the
Introduction, shows the problem. This transfer is ineffective, since it relies on va-
cancies in new projects becoming available at the same time as other projects are
ending, and also as mentioned before, the technology base will have changed. Fur-
thermore, if the development and operations teams are separate, then the developers
will not have any real-world feedback on how their design performed and whether
or not their decisions on the design and implementation were correct.
The desired situation is shown in Figure 12.2. If knowledge can be encoded in
a way that makes it understandable to people on other projects, then they will be

222
Time
OperationsIntegration
and Verification
Design Manufacturing OperationsIntegration
and Verification
Design Manufacturing
OperationsIntegration
and Verification
Design Manufacturing OperationsIntegration
and Verification
Design Manufacturing
OperationsIntegration
and Verification
Design Manufacturing OperationsIntegration
and Verification
Design Manufacturing
Knowledge
exchange
at every
opportunity
Knowledge transfer by making knowledge available at each stage means thatprojects can access it as they need it, when they want it. Projects can benefit fromthe experience gained on other projects that are running in parallel or havealready completed.
Figure 12.2: Effective Knowledge Transfer Between Projects
able to see whether other projects had related problems and then be able to learn
from the experience that has been gained. They do not need to wait for a parallel
or preceding project to finish in order to do so.
At the highest level, satellite operations is about information processing. This
can take place over a long time-span, such as the strategic design and procurement
of control system, or in shorter time-scales, where more tactical decisions have to be
taken, such as who does what, when and how. Scientific missions are almost always
challenging, seeking for the new areas to be ’first’ in. This puts the projects under
high risk, and many projects do indeed suffer cost,schedule and quality problems.
We have seen that the people who design and build satellites, the very people
who gain insight into the the spacecraft behaviour during its integration are not
normally present throughout the useful lifetime of the satellite. This means that
the knowledge and tools that they have gained must be either transferred to the
operational team, or in the case of tools, re-implemented.

223
Currently the vast majority of operational effort (and expense) goes into the
preparation of the ground segment for launch,which includes all aspects necessary
to ensure satisfactory entry into service: procurement, verification, validation and
early operations. The spacecraft procurement process becomes an enormous docu-
mentation project, with the documentation often being written by non-native speak-
ers. Individual companies frequently have their own jargon, and equally often they
invent new names and abbreviations to describe the units that they produce or the
processes that they perform. This acts as a substantial impediment to the transfer
of knowledge to the operations team and from one operations team to another.
An ontology has been drafted which would overcome some of these problems,
and guidelines have been proposed as to how to name new developments in a way
that reduces barriers to knowledge transfer. An ontology was suggested as a possible
solution to the problem of transferring knowledge across time and place as is required
on modern space mission. This could be a substantial contribution to ease the
transfer of information. In order to try to encapsulate the knowledge embodied in
the design, it is necessary to use better tools than plain text.
Formal Methods hold out the hope of an extensible framework, that not only
enables the writer to say precisely what he means, also allows the readers and writer
to prove certain features about the system being described. Formal descriptions of
units or sub-systems can be combined to allow reasoning about the greater entity.
The ability share knowledge, and to reason about it and the spacecraft behaviour
from the start, before the satellite has been integrated, would be a great risk reduc-
tion and an enormous improvement to the current process.
As spacecraft steadily increase their performance and autonomy,the complexity
increases. Already the scientific instruments on some modern spacecraft are more
sophisticated in terms of their processing power, autonomy, or telemetry rate than
many spacecraft that are flying. The fact that the flight control team on the ground

224
sometimes need to struggle with or around an autonomous system in space is now
unfortunately common place. Flight control teams must be careful in how they form
hypotheses about the spacecraft, since often the data is ambiguous and sparse, and
the spacecraft may actually still be (mis)-behaving, even as the flight control team
try to get it to do something else. This presents a significant training challenge
for the longer-term missions, as well as missions that reuse systems from earlier
spacecraft.
Very few operations engineers get a chance to participate in the design of the
data of the system that they will eventually control. Chapter 10 presented some
of the historical standards, although now there are more in progress. Chapter 11
took a fresh look at the information that is transmitted by fixed and packet-based
systems. This is an area which could benefit from more work, and from investi-
gating the additional overhead that is enforced by the various packet standards.
More understanding in this area would help future operations engineers guide those
projects who are willing to listen in the right direction and could make the definition
of parameters and packets rather less haphazard than it is today.

Chapter 13
Conclusion
13.1 Summary
13.1.1 Space Projects
An ’Operations Model’ has been proposed to show which areas are already covered
by international standards and which areas are left for individual missions to design
and implement themselves.
There is a broad spectrum of control activity that can be performed on-board, on
ground or by human intervention. Different types of mission may require different
mixtures of these techniques. A flexible control strategy should be able to move
fairly easily between human interaction, to ground-automation and then to onboard
automation. The optimum point will be a function of the available contact period,
the required bandwidth, and the required reaction time.
The space industry operates in a distorted market place and some the conflicts
of interest and inefficiencies result. Many activities are dominated or distorted by
political activity or interference.
13.1.2 Organisation
Organisations typically achieve their goals by encoding activities in procedures, cre-
ating teams and trying to build up a particular kind of culture.
225

226
Individual types of behaviour into skill-based, procedure-based and knowledge-
based behaviour. Some guidelines have been proposed for how individuals in their
roles as team leaders and team members should interact in order to arrive at the
best solution. The catastrophic consequences of a break down in communication
between the individuals and teams of operations, engineering and management has
been shown.
The space industry, as well as facing some unique challenges, also faces many
normal business and organisation challenges. Because so much space-related work is
carried out by organisations with bureaucratic roots and a military or civil service
mentality, personnel development has typically been a low priority. The amount of
delegation has also been typically low, with managers often not responsible for some
of the effects of their decisions.
The organisations examined all became dependent upon the short-term supply
of labour to meet their peak work-load. This reduces the amount of knowledge
available within the organisation.
The typical structure of a hierarchy with a low fan-out, often covering many
geographically distinct sites, can make it very easy for the management to lose
contact with the people who have the first-hand knowledge of the state of the mission
and the current problems. This prevents the free flow of information that is vital
for taking major decisions correctly.
13.1.3 Risk
Risk and opportunity can be seen in the following situations:
• Financial implication
• Decision making
• Process and structure

227
• People and Machines
• Legal and regulatory requirements
• Customer/Client needs
• Environmental considerations
• Communication requirements.
Risk management is more oriented towards people, processes and human judge-
ment than safety and reliability, although these are important factors.
People perceive risk in different ways at different times.
Risk management can be broken into three phases, risk control, risk reduction
and risk containment
13.1.4 Ground Segment Preparation
The satellite is often being operated by a different organisation to the one that built
or integrated it, so somehow the people responsible for operating the satellite must
be trained and prepared for their forthcoming tasks. The transfer of knowledge is
an essential part of spacecraft operations engineering.
Most low-level information is now transferred in the form of a database. The
satellite database is one of the most important interfaces between the satellite con-
structor(s) and the satellite operator(s).
The higher-level knowledge is still transferred separately, usually in the form of
documents containing textual descriptions, diagrams and procedures. This makes
the descriptions and procedures potentially inconsistent with the database and be-
cause it is also manually produced, it may also be internally inconsistent or incom-
plete. When there is a conflict over the allocation of resources to resolve a problem
with the flight article, the documentation always loses out.

228
There is no standard structure for the information to be provided, it varies
enormously in quality and quantity from one sub-system to another and from one
project to another.
Spacecraft (or a family of spacecraft) are frequently being procured as part of
a whole system, which often has a very large ground segment that needs to be
developed, maintained and operated in parallel to the space segment.
Simulations are useful in preparing the individuals to cope with the stress of
operational situations, as well as forging a team.
There is normally a formalised review process for checking the progress at various
phases in the procurement and operations. These reviews are particularly important
since they force management to take a position on various items that are flagged as
risks to the programme. However, this only operates correctly if the correct data is
made available to the correct people.
13.1.5 Control System
There is substantial commonality across missions, holding out the possibility of
large-scale reuse of software and systems. A common approach to checkout and
control system development is possible and it might bring cost benefits. Even though
it might cost more in the initial phases such as review of the design specifications,
benefits and cost savings are expected to occur in the later phases.
Automation is often introduced with the aim of reducing costs, but the impact
is often to change the skill set required to do the job, and to drive up the indirect
costs e.g. to maintain proficiency at a level required for manual operation to take
over from the automation when the situation deteriorates.
13.1.6 Ontology
The User Manual is intended to help the end-users understand and operate the
spacecraft and payloads safely and successfully.

229
Since there is no standard structure for the information to be provided, it varies
enormously in quality and quantity from one sub-system to another and from one
project to another. It is difficult to produce a User Manual because there is no
standard to say what it should contain or how to produce it.
The introduction of new names for existing concepts makes it difficult to produce
the User Manual to a consistent standard and prevents re-use of documentation from
one project to another. An Ontology is a powerful tool with its roots in artificial
intelligence and knowledge management that allows users to browse data and display
relationships graphically, whilst at the same time permitting writers to check that
their input obeys certain consistency constraints which will highlight when or where
information is incomplete. Without an approach that makes it easier to develop
a knowledge base that can be checked and transferred easily, future projects are
destined to repeat many of the mistakes of their predecessors simply because it is
too difficult to learn from them.
13.1.7 Formal Methods
Formal methods were developed to be applied to software systems, but are applicable
to any discrete system. Formal methods bring the benefit of being able to argue a
particular case based upon a rigorously defined specification. By proving a property
of a design early in the mission life-time, perhaps even before hardware is built, it
may result in a cost saving, by reducing testing, or a dramatic increase in reliability.
One of the main benefits of formal methods is that it requires a statement of the
problem. This is also sometimes a disadvantage, since some of the knowledge might
not be available. When combined with the idea of an ontology, a single knowledge
base for the entire mission can be developed: the knowledge from the design phase
could also be used in the testing and qualification phase, and even be the source of
data for the user manual

230
13.1.8 Complexity
Spacecraft and spacecraft operations are complex for a number of reasons.
Systems designers are risk averse, which has yielded an approach to the design
and implementation of evolution rather than revolution. Each design brings a lot
of heritage with it, so there has been a gradual accretion of complexity as functions
and automation have been added on, rather than a clean overview.
Since virtually all spacecraft operations are a form of remote control, the data
used for a hypothesis often incomplete. The information on difficult (or patholog-
ical) cases is often not available and generally no physical examination possible at
all, compared with the case of aircraft or marine accident investigations. There is
generally no sharing of data between different organisations or from one project to
another.
There is no general measure of complexity, and no general agreement that com-
plexity is bad, so designs are not optimised for this aspect. The manufacturers
of spacecraft and instrument have little incentive to keep designs and operations
simple, and significant incentives to maintain schedule for the delivery of the flight
hardware and software.
13.1.9 Telemetry and Telecommands
There have been a number of standards to govern how telemetry and telecommands
should be formatted. The initial approach was to use fixed messages for both teleme-
try and telecommands. As the complexity of satellites increased, it became desirable
to have more flexibility in the way the uplink and downlink bandwidth were used,
as well as to permit a larger address space to distinguish the information sources
and sinks within the spacecraft. This lead to packet-based communication.
The other trend of note is that the standardisation process initially consisted
on locally or nationally-mandated standards (in Europe, the standards coming from

231
ESA) and has then tended to include a wider and wider participation, both within
Europe, with the participation being extended to include industry, and interna-
tionally, with the establishment of more independent, international bodies, such as
the European Cooperation for Space Standardisation, ECSS, and the Consultative
Committee for Space Data Systems (CCSDS).
13.1.10 Information Theory
Simply repeating the telemetry as in a fixed format telemetry system does not give a
very high Shannon information. By monitoring for changes, we generate much more
information per bit. In an event-driven packet system that transmits telemetry
packets when something has changed, the Shannon information scales very well.
The information available on the ground to help an operator synchronise his
internal model with the physical situation on-board the spacecraft can be very low.
There can be a fundamental discrepancy between the way that operators perceive
information and what the information is actually telling them.
13.2 Discussion
This work has presented how the people and organisations usually prepare for mis-
sion operations and has attempted to identify the current best practice, as well as
pointing out anomalies and inefficiencies when they occur.
At the highest level, satellite operations is about information processing. This
can take place over a long time-span, such as the strategic design and procurement
of control system, or in shorter time-scales, where more tactical decisions have to
be taken, such as who does what, when and how.
We have seen that the people who design and build satellites, the very people
who gain insight into the the spacecraft behaviour during its integration are not
normally present throughout the useful lifetime of the satellite. This means that
232
the knowledge and tools that they have gained must be either transferred to the
operational team, or in the case of tools, re-implemented.
Currently the vast majority of operational effort (and expense) goes into the
preparation of the ground segment for launch,which includes all aspects necessary
to ensure satisfactory entry into service: procurement, verification, validation and
early operations. The spacecraft procurement process becomes an enormous docu-
mentation project, with the documentation often being written by non-native speak-
ers. Individual companies frequently have their own jargon, and equally often they
invent new names and abbreviations to describe the units that they produce or the
processes that they perform. This acts as a substantial impediment to the trans-
fer of knowledge to the operations team and from one operations team to another.
An Ontology has been drafted which would overcome some of these problems, and
guidelines have been proposed as to how to name new developments in a way that
reduces barriers to knowledge transfer.
Formal Methods were suggested as a possible solution to the problem of trans-
ferring knowledge across time and place as is required on modern space mission.
This could be a substantial contribution to ease the transfer of information. In or-
der to try to encapsulate the knowledge embodied in the design, it is necessary to
use better tools than plain text. Formal Methods hold out the hope of an exten-
sible framework, that not only enables the writer to say precisely what he means,
also allows the readers and writer to prove certain features about the system being
described. Formal descriptions of units or sub-systems can be combined to allow
reasoning about the greater entity.
All spacecraft operations take place within some kind of organisational frame-
work or team. By analysing some existing organisations we have seen several short-
comings. We have also shown several expected properties: that people often want

233
new challenges, new projects, i.e. that they often want a career and are ambi-
tious. For a healthy organisation to remain healthy, these aspects must be planned
and monitored in just the same way that the technical operations of a satellite are
controlled.
For ESA missions, industrial policy encourages poor performance from industrial
consortia, and the lack of either penalties for late deliveries or incentives for good
long-term performance decrease the quality of the product. There are no real incen-
tives for scientists, industry and ESA to cooperate or coordinate their developments.
Since the industrial environment has changed so much since ESA was founded, the
procurement policy, in particular the principal of justes retours, should be reconsid-
ered. There is considerable scope for saving costs by re-using infrastructure software
and getting the different parties to cooperate across the different phases. Whilst
some phases might become more expensive, the life-cycle costs should be reduced.
We have discussed the nature of risk, showed how it can occur in space pro-
grammes and methods used to manage the risk inherent in space exploitation. Plan-
ning and learning are essential parts of risk management, but in order to be able
to learn from similar cases, it must be possible to recognise similar cases! This is
where use of an ontology would help, as would the use of formal methods to help
recognise similar patterns.
To continue at the strategic level, we have shown that there is a great deal of
commonality between the computer systems are used to control the satellites and
payloads before and after launch. Cost-savings could be made via a common, or
harmonised, development, and this would also reduce the risk at a project level,
since so many elements of the ground system would have been thoroughly tested
during the satellite integration.
Complexity can be portrayed as the eternal enemy of the operations engineer as
it must be dealt with at all phases. It is easy to render a system more complex at one

234
level, by trying to simplify it at another level. We have shown that many systems
have an inherent complexity even if they do not contain or rely upon software. If
they do contain software, then this brings great flexibility, at the cost of even greater
complexity. Even with a ’perfect’ ontology or with formal methods, there may still
be true statements about the physical world that cannot be proved: incompleteness
is a necessary property of all logic systems above a certain power. The operations
engineer must be able to operate within the formal system, but also maintain enough
scepticism and imagination to be able to raise up a level, and act intelligently.
At the tactical level, the Shannon Information of a fixed format telemetry sys-
tem has been calculated and compared with an event-driven packet system. It is
shown that the information scales much better with packet-based systems. This
means that operators get much more relevant information to analyse. People adapt
to the monotony inherent in continuous telemetry by a form of learning, which un-
fortunately means that they do not understand everything that is shown to them.
Alarms and warning lights can mitigate the loss of information by attracting atten-
tion to changes or out of limit conditions. Information theory shows just how little
information is transferred when people believe that they know what is going on.
The job of an Operations Engineer is changing. More organisational and soft
skills are necessary since almost every development is a cooperation between dif-
ferent institutes, organisations and companies. Care must be taken to nurture the
relationship with the partners, but at the same time, to steer the project in an
effective manner. The steady increase in the size of space missions and their associ-
ated ground segments means that a different set of skills are needed from the flight
control team. Knowledge of the flight hardware is no longer sufficient. Much more
experience with software and systems, in particular with the structure and content
of the database, is now necessary.

235
13.3 Further Work
The following areas merit further investigation:
• A mission model to examine current missions should be extended to propose
a more detailed framework.
• The idea of an common, extensible ontology should be further developed.
• The information transfer of different packet concepts should be analysed and
extended.

236

References
[1] BIS. Sound Practices for the Management and Supervision of Operational Risk.
Bank for International Settlements, Basel, Swizterland, 2002.
[2] Burkill, H., and Mirsky, L. Monotonicity. J. Math Anal. Appl. 41 (1973),
391–410.
[3] Carroll, T., and Web, M. The Risk Factor. Take That Ltd, Harrogate,
2001. ISBN 1-873668-37-6.
[4] Chaitin, G. The Limits of Mathematics. Springer, 1998. ISBN 981-3083-58-X.
[5] Chaitin, G. The Unknowable. Springer, 1999. ISBN 981-4021-72-5.
[6] Coad, P., and Nicola, J. Object-Oriented Programming. Yourdon Press,
1993. ISBN 0-13-032616-X.
[7] Codd, E. A relational model for data for large shared data banks. CACM
13(6) (1970).
[8] Date, C. An Introduction to Database Systems, sixth ed. Addison-Wesley,
1995. ISBN 0-202-82458-2.
[9] DE SELDING, P. B. Esa proposes end to costly hermes effort. Space News
(1992). www.space.com/spacenews/archive92/sn1992.fff231.html.
237

238
[10] Dekker, S. Automation, cognition and collaboration. Tech. Rep. HF Tech
Rep. No 2001/02, Human Factors Group, Linkping Institute of Technology,
2001. http://www.ikp.liu.se/hf/Automation.pdf.
[11] Dunford, N., and Schwartz, J. The Z/Eves User Manual. ORA Canada,
Ottawa, Ontario, 2000.
[12] EIU. Managing Business Risks. Economist Intelligence Unit, London, 1995.
[13] ESA. Pcm tc standard. Tech. Rep. ESA-PSS-45 (TTC-A-01), European Space
Agency, 1978.
[14] ESA. Packet tc standard. Tech. Rep. PSS-04-107, European Space Agency,
1992.
[15] Farquhar, A., Fikes, R., and Rice, J. The ontolingua server: A tool for
collaborative ontology construction. Tech. Rep. KSL-96-26, Stanford Knowl-
edge Systems Laboratory, 1996.
[16] Gell-Mann, M. The Quark and the Jaguar. Abacus, 1995. ISBN 0-349-
10649-5.
[17] Genesereth, M., and Fikes, R. Knowledge interchange format version
3.0. reference manual. Tech. Rep. Logic-92-1, Computer Science Department,
Stanford University, 19992.
[18] Green, R. G., Muir, H., James, M., Gradwell, D., and Green, R. L.
Human Factors for Pilots, second ed. Avebury, 1996. ISBN 0-291-39827-8.
[19] Gruber, T. R. A translation approach to portable ontologies. Knowledge
Acquisition 5(2) (1993), 199–220.
[20] Haag, S., and Jones, M. The use of new technologies in flight control
systems. In Proceedings of SpaceOps 98 (Tokyo, 1998), NASDA.

239
[21] Haigh, J. Taking Chances. Oxford University Press, 1999.
[22] Hamming, R. The Art of Doing Science and Engineering. Gordon and Breach,
Amsterdam, 1997. ISBN 90-5699-501-4.
[23] Hoffman, P. The Man Who Loved Only Numbers. 4th, 1998. ISBN 1-85702-
829-5.
[24] Hofstadter, D. R. Goedel, Escher, Bach: an Eternal Golden Braid, twenti-
eth anniversary ed. Penguin, 2000. ISBN 0-14-028920-8.
[25] Hollnagel, E. Computer Supported Risk Management, vol. 4 of Topics in
Safety, Risk. Kluwer, 1995, pp. 33–49. ISBN 0-7923-3372-1.
[26] Horrocks, I., Fensel, D., Broekstra, J., Decker, S., Erdmann,
M., Goble, C., van Harmelen, F., Klein, M., Staab, S., Studer,
R., and Motta, E. OIL: The Ontology Inference Layer. Tech. Rep.
IR-479, Vrije Universiteit Amsterdam, Faculty of Sciences, Sept. 2000. See
http://www.ontoknowledge.org/oil/.
[27] ISO. The database language sql. Tech. Rep. Document ISO/IEC 9075, Inter-
national Standards Organisation, 1992.
[28] Jia, X. The Z Type Checker. De Paul University, 1995.
[29] M.-A. D. Storey, C. B., and Michaud, J. Shrimp views: An interactive
and customizable environment for software exploration. In Proc. of Interna-
tional Workshop on Program Comprehension (IWPC ’2001) (Toronto, Ontario,
Canada, 2001), IEEE.
[30] McGuinness, N. N. . D. L. Ontology development 101: A guide to creating
your first ontology. Tech. Rep. SMI-2001-0880, Stanford University SMI, 2001.

240
[31] Meyer, B. Object -Oriented Software Construction. Prentice Hall, New York,
1988.
[32] N. F. Noy, R. W. Fergerson, . M. A. M. The knowledge model of protege-
2000: Combining interoperability and flexibility. In 12th International Confer-
ence on Knowledge Engineering and Knowledge Management (EKAW’2000)
(Juan-les-Pins,France, 2000), INRIA. SMI-2000-0830.
[33] Newell, A. The knowledge level. Artificial Intelligence 18 (1) (1982), 87–127.
[34] Potter, B., Sinclair, J., and Till, D. An Introduction to Formal Speci-
fication and Z. Prentice-Hall, Europe, 1996. ISBN 0-13-242207-7.
[35] Rist, R., and Terwilliger, R. Object-Oriented Programming in Eiffel.
Prentice Hal, 1995. ISBN 0-13-205931-2.
[36] Rogers. The presidential commission on the space shuttle challenger accident
report. Tech. rep., Rogers Commission, 1986.
[37] Sage, A. Systems Engineering for Risk Management, vol. 4 of Topics in Safety,
Risk,Reliability and Quality. Kluwer, 1995, pp. 3–32. ISBN 0-7923-3372-1.
[38] Schafer, D., and Ritz, D. A. Practical Smalltalk. Springer, 1991. ISBN
0-387-97394-X.
[39] Shannon, C. A mathematical theory of communication. Bell System Technical
Journal 27 (Jul 1948).
[40] Vaughan, D. The Challenger Launch Decision. University of Chicago, 1996.
ISBN 0-226-85175-3.
[41] V.K. Chaudhri, A. Farquhar, R. F., and Karp, P. Open knowledge
base connectivity 2.0. Tech. Rep. KSL-98-06, Stanford University KSL, 1998.

241
[42] Woodcock, J., and Davies, J. Using Z. Prentice-Hal, Europe, 1996. ISBN
0-13-948472-8.
[43] Woods, D. Decomposing automation: Apparent simplicity, real complexity.
In Automation Technology and Human Performance: Theory and Applications
(Erlbaum, 1996), R. Parasuraman and M. Mouloula, Eds.

242

Appendix A
Ontology Outline
This Appendix gives a snapshot of the real ontology. The Protege software allows the
user to link units and set interface types and also export a wealth of documentation.
This is one of the automatically generated index pages.
A.1 Interface
A.1.1 Electricty
Electricty5V
Electricty28V
• Instrument
Instances: Spire, PACS, HIFI, LFI, HFI, SCS
• Spacecraft
Instances: Herschel, Planck
• SolarGenerator
Instances: H-SolarPanel, P-SolarPanel
• Unit-LFI
Instances: RadiometerArrayAssembly, FrontEndUnit, FeedHorn, Orthomod-
eTransducer, FrontEndModule, Reference Load, WaveGuides, BackEndUnit,
243

244
BackEndModule, DataAquisitionElectronics, RadiometerElectronicsBoxAssem-
bly, PowerSupply, LFI-DPU-A, LFI-DPU-B, SPU-A, SPU-B
• Unit-HFI
Instances: FocalPlaneUnit, J-FET Box, DPU/PowerDistributionPart, Dilu-
tionCoolerSubSystem, FocalPlaneStructure, IsotopeSupplyUnit, HeatSwitches,
GasStorageUnit, DilutionCoolerControlUnit, DilutionCoolerPneumaticUnit, DI-
lutionCoolerPiping, 4KCoolerSubsystem, JTcompressors, AnciliaryGasClean-
ingPanel, ConnectingPipework, LowTemperaturePlumbing, MainElectronics,
HFI-HSL
– Unit-HFI-LSL
Instances: DilutionCoolerElectronics, 4KCoolerDriveElectronics, 4KColdUnit,
4KCoolerAncillaryUnit, 4KCoolerCompressorUnit, 4KCERegulator, 4KCool-
erElectronicsUnit
∗ DataProcessingUnit
Instances: HFI-DPU-A, HFI-DPU-B
– Unit-HFI-HSL
∗ DataProcessingUnit
Instances: HFI-DPU-A, HFI-DPU-B
∗ ReadoutElectronicsUnit
Instances: REU-Chain-00, REU-chain-01, REU-Chain-02, REU-Chain-
03, REU-Chain-04, REU-Chain-05, REU-Chain-06, REU-Chain-07,
REU-Chain-08, REU-Chain-09, REU-Chain-10, REU-Chain-11, REU,
REU-proc-A, REU-proc-B
∗ Unit-HFI-1553
∗ DataProcessingUnit
Instances: HFI-DPU-A, HFI-DPU-B

245
– LCL
Instances: HFI-01, HFI-02, HFI-03, HFI-04, HFI-05, HFI-06, HFI-07,
HFI-08, HFI-09, HFI-10, HFI-11, HFI-12, HFI-13, HFI-14, HFI-15
– PowerControlUnit
Instances: P-PCU, H-PCU
– PowerDistributionUnit
Instances: H-PDU, P-PDU
A.1.2 Data
DataStorage
• Instrument
Instances: Spire, PACS, HIFI, LFI, HFI, SCS
• Spacecraft
Instances: Herschel, Planck
• Databus
– SMCS-1355
∗ Unit-LFI
Instances: RadiometerArrayAssembly, FrontEndUnit, FeedHorn, Or-
thomodeTransducer, FrontEndModule, Reference Load, WaveGuides,
BackEndUnit, BackEndModule, DataAquisitionElectronics, Radiome-
terElectronicsBoxAssembly, PowerSupply, LFI-DPU-A, LFI-DPU-B,
SPU-A, SPU-B
– MilStd1553
∗ Instrument
Instances: Spire, PACS, HIFI, LFI, HFI, SCS

246
∗ 1553Bus
Instances: H-1553Bus, P-1553Bus
∗ CDMU
Instances: H-CDMU-A, H-CDMU-B, P-CDMU-A, P-CDMU-B
∗ Unit-LFI
Instances: RadiometerArrayAssembly, FrontEndUnit, FeedHorn, Or-
thomodeTransducer, FrontEndModule, Reference Load, WaveGuides,
BackEndUnit, BackEndModule, DataAquisitionElectronics, Radiome-
terElectronicsBoxAssembly, PowerSupply, LFI-DPU-A, LFI-DPU-B,
SPU-A, SPU-B
∗ Unit-HFI-1553
· DataProcessingUnit
Instances: HFI-DPU-A, HFI-DPU-B
• Serial
– HighSpeedLink
∗ Unit-HFI-HSL
· DataProcessingUnit
Instances: HFI-DPU-A, HFI-DPU-B
· ReadoutElectronicsUnit
Instances: REU-Chain-00, REU-chain-01, REU-Chain-02, REU-
Chain-03, REU-Chain-04, REU-Chain-05, REU-Chain-06, REU-
Chain-07, REU-Chain-08, REU-Chain-09, REU-Chain-10, REU-
Chain-11, REU, REU-proc-A, REU-proc-B
– LowSpeedLink
∗ Unit-HFI-LSL
Instances: DilutionCoolerElectronics, 4KCoolerDriveElectronics, 4KColdUnit,

247
4KCoolerAncillaryUnit, 4KCoolerCompressorUnit, 4KCERegulator,
4KCoolerElectronicsUnit
· DataProcessingUnit
Instances: HFI-DPU-A, HFI-DPU-B
A.1.3 Hierarchy
System
Instances: H-DMS, H-AOCS, H-Power, H-Thermal, H-TTC, H-RCS, P-AOCS, P-
DMS, P-Power, P-RCS, P-Thermal, P-TTC
Instrument
Instances: Spire, PACS, HIFI, LFI, HFI, SCS
Spacecraft
Instances: Herschel, Planck
Unit-PL
• Unit-LFI
Instances: RadiometerArrayAssembly, FrontEndUnit, FeedHorn, Orthomod-
eTransducer, FrontEndModule, Reference Load, WaveGuides, BackEndUnit,
BackEndModule, DataAquisitionElectronics, RadiometerElectronicsBoxAssem-
bly, PowerSupply, LFI-DPU-A, LFI-DPU-B, SPU-A, SPU-B
• Unit-HFI
Instances: FocalPlaneUnit, J-FET Box, DPU/PowerDistributionPart, Dilu-
tionCoolerSubSystem, FocalPlaneStructure, IsotopeSupplyUnit, HeatSwitches,

248
GasStorageUnit, DilutionCoolerControlUnit, DilutionCoolerPneumaticUnit, DI-
lutionCoolerPiping, 4KCoolerSubsystem, JTcompressors, AnciliaryGasClean-
ingPanel, ConnectingPipework, LowTemperaturePlumbing, MainElectronics,
HFI-HSL
– Unit-HFI-LSL
Instances: DilutionCoolerElectronics, 4KCoolerDriveElectronics, 4KColdUnit,
4KCoolerAncillaryUnit, 4KCoolerCompressorUnit, 4KCERegulator, 4KCool-
erElectronicsUnit
∗ DataProcessingUnit
Instances: HFI-DPU-A, HFI-DPU-B
– Unit-HFI-HSL
∗ DataProcessingUnit
Instances: HFI-DPU-A, HFI-DPU-B
∗ ReadoutElectronicsUnit
Instances: REU-Chain-00, REU-chain-01, REU-Chain-02, REU-Chain-
03, REU-Chain-04, REU-Chain-05, REU-Chain-06, REU-Chain-07,
REU-Chain-08, REU-Chain-09, REU-Chain-10, REU-Chain-11, REU,
REU-proc-A, REU-proc-B
– Unit-HFI-1553
∗ DataProcessingUnit
Instances: HFI-DPU-A, HFI-DPU-B
• Unit-SPIRE
Instances: HSFPU, HSJFP, HSJFS, HSDCU, HSFCU, HSDPU, HSWIH
Unit
• Unit-Power

249
– PowerDistributionUnit
Instances: H-PDU, P-PDU
– PowerControlUnit
Instances: P-PCU, H-PCU
– LCL
Instances: HFI-01, HFI-02, HFI-03, HFI-04, HFI-05, HFI-06, HFI-07,
HFI-08, HFI-09, HFI-10, HFI-11, HFI-12, HFI-13, HFI-14, HFI-15
– SolarGenerator
Instances: H-SolarPanel, P-SolarPanel
• Unit-Thermal
• Unit-DataManagement
– CDMU
Instances: H-CDMU-A, H-CDMU-B, P-CDMU-A, P-CDMU-B
– 1553Bus
Instances: H-1553Bus, P-1553Bus
– RTU
• Unit-AttitudeOrbit
– ACC
Instances: H-ACC-A, H-ACC-B, P-ACC-A, P-ACC-B
• Unit-Telecommunications
– Receiver
– Decoder
– Antenna

250
• Unit-PL
– Unit-LFI
Instances: RadiometerArrayAssembly, FrontEndUnit, FeedHorn, Ortho-
modeTransducer, FrontEndModule, Reference Load, WaveGuides, Back-
EndUnit, BackEndModule, DataAquisitionElectronics, RadiometerElec-
tronicsBoxAssembly, PowerSupply, LFI-DPU-A, LFI-DPU-B, SPU-A, SPU-
B
– Unit-HFI
Instances: FocalPlaneUnit, J-FET Box, DPU/PowerDistributionPart,
DilutionCoolerSubSystem, FocalPlaneStructure, IsotopeSupplyUnit, HeatSwitches,
GasStorageUnit, DilutionCoolerControlUnit, DilutionCoolerPneumatic-
Unit, DIlutionCoolerPiping, 4KCoolerSubsystem, JTcompressors, An-
ciliaryGasCleaningPanel, ConnectingPipework, LowTemperaturePlumb-
ing, MainElectronics, HFI-HSL
∗ Unit-HFI-LSL
Instances: DilutionCoolerElectronics, 4KCoolerDriveElectronics, 4KColdUnit,
4KCoolerAncillaryUnit, 4KCoolerCompressorUnit, 4KCERegulator,
4KCoolerElectronicsUnit
· DataProcessingUnit
Instances: HFI-DPU-A, HFI-DPU-B
∗ Unit-HFI-HSL
· DataProcessingUnit
Instances: HFI-DPU-A, HFI-DPU-B
· ReadoutElectronicsUnit
251
Instances: REU-Chain-00, REU-chain-01, REU-Chain-02, REU-
Chain-03, REU-Chain-04, REU-Chain-05, REU-Chain-06, REU-
Chain-07, REU-Chain-08, REU-Chain-09, REU-Chain-10, REU-
Chain-11, REU, REU-proc-A, REU-proc-B
∗ Unit-HFI-1553
· DataProcessingUnit
Instances: HFI-DPU-A, HFI-DPU-B
– Unit-SPIRE
Instances: HSFPU, HSJFP, HSJFS, HSDCU, HSFCU, HSDPU, HSWIH
A.2 Equipment
A.2.1 Actuator
A.2.2 Sensor
Instances: Gyro, QRS, StarMapper
A.2.3 GroundStation
A.2.4 System
Instances: H-DMS, H-AOCS, H-Power, H-Thermal, H-TTC, H-RCS, P-AOCS, P-
DMS, P-Power, P-RCS, P-Thermal, P-TTC
A.2.5 Instrument
Instances: Spire, PACS, HIFI, LFI, HFI, SCS
A.2.6 Spacecraft
Instances: Herschel, Planck

252
A.2.7 Unit
Unit-Power
• PowerDistributionUnit
Instances: H-PDU, P-PDU
• PowerControlUnit
Instances: P-PCU, H-PCU
• LCL
Instances: HFI-01, HFI-02, HFI-03, HFI-04, HFI-05, HFI-06, HFI-07, HFI-08,
HFI-09, HFI-10, HFI-11, HFI-12, HFI-13, HFI-14, HFI-15
• SolarGenerator
Instances: H-SolarPanel, P-SolarPanel
Unit-Thermal
Unit-DataManagement
• CDMU
Instances: H-CDMU-A, H-CDMU-B, P-CDMU-A, P-CDMU-B
• 1553Bus
Instances: H-1553Bus, P-1553Bus
• RTU
Unit-AttitudeOrbit
• ACC
Instances: H-ACC-A, H-ACC-B, P-ACC-A, P-ACC-B

253
Unit-Telecommunications
• Receiver
• Decoder
• Antenna
Unit-PL
• Unit-LFI
Instances: RadiometerArrayAssembly, FrontEndUnit, FeedHorn, Orthomod-
eTransducer, FrontEndModule, Reference Load, WaveGuides, BackEndUnit,
BackEndModule, DataAquisitionElectronics, RadiometerElectronicsBoxAssem-
bly, PowerSupply, LFI-DPU-A, LFI-DPU-B, SPU-A, SPU-B
• Unit-HFI
Instances: FocalPlaneUnit, J-FET Box, DPU/PowerDistributionPart, Dilu-
tionCoolerSubSystem, FocalPlaneStructure, IsotopeSupplyUnit, HeatSwitches,
GasStorageUnit, DilutionCoolerControlUnit, DilutionCoolerPneumaticUnit, DI-
lutionCoolerPiping, 4KCoolerSubsystem, JTcompressors, AnciliaryGasClean-
ingPanel, ConnectingPipework, LowTemperaturePlumbing, MainElectronics,
HFI-HSL
– Unit-HFI-LSL
Instances: DilutionCoolerElectronics, 4KCoolerDriveElectronics, 4KColdUnit,
4KCoolerAncillaryUnit, 4KCoolerCompressorUnit, 4KCERegulator, 4KCool-
erElectronicsUnit
∗ DataProcessingUnit
Instances: HFI-DPU-A, HFI-DPU-B
– Unit-HFI-HSL

254
∗ DataProcessingUnit
Instances: HFI-DPU-A, HFI-DPU-B
∗ ReadoutElectronicsUnit
Instances: REU-Chain-00, REU-chain-01, REU-Chain-02, REU-Chain-
03, REU-Chain-04, REU-Chain-05, REU-Chain-06, REU-Chain-07,
REU-Chain-08, REU-Chain-09, REU-Chain-10, REU-Chain-11, REU,
REU-proc-A, REU-proc-B
– Unit-HFI-1553
∗ DataProcessingUnit
Instances: HFI-DPU-A, HFI-DPU-B
• Unit-SPIRE
Instances: HSFPU, HSJFP, HSJFS, HSDCU, HSFCU, HSDPU, HSWIH
This completes the automatically generated index pages. The real ontology would
take more than 250 pages to print out as a hard copy, but can be easily browsed
either using an internet browser or the development user interface. The following
pages show some of the details that are available for two items, a generic HFI unit,
and a HFI unit that is connected to the High Speed Link, HSL.

255
Class Unit-HFI
Concrete Class Extends
Unit-PL,Electricty28V
Direct Instances: 1. FocalPlaneUnit
2. J-FET Box
3. DPU/PowerDistributionPart
4. DilutionCoolerSubSystem
5. FocalPlaneStructure
6. IsotopeSupplyUnit
7. HeatSwitches
8. GasStorageUnit
9. DilutionCoolerControlUnit
10. DilutionCoolerPneumaticUnit
11. DIlutionCoolerPiping
12. 4KCoolerSubsystem
13. JTcompressors
14. AnciliaryGasCleaningPanel
15. ConnectingPipework
16. LowTemperaturePlumbing
17. MainElectronics
18. HFI-HSL
Direct Subclasses: 1. Unit-HFI-LSL
2. Unit-HFI-HSL
3. Unit-HFI-1553
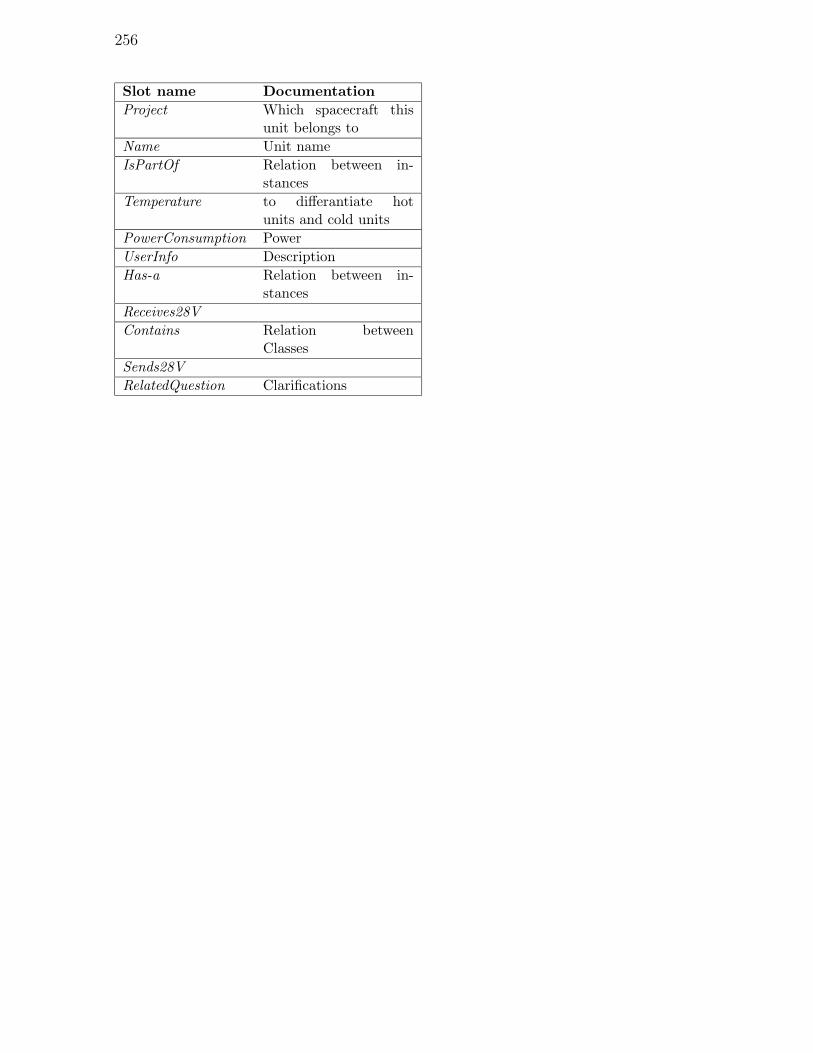
256
Slot name Documentation
Project Which spacecraft thisunit belongs to
Name Unit name
IsPartOf Relation between in-stances
Temperature to differantiate hotunits and cold units
PowerConsumption Power
UserInfo Description
Has-a Relation between in-stances
Receives28V
Contains Relation betweenClasses
Sends28V
RelatedQuestion Clarifications

257
Class Unit-HFI-HSL
Concrete Class Extends
Unit-HFI,HighSpeedLink
Direct Instances: None
Direct Subclasses: 1. DataProcessingUnit
2. ReadoutElectronicsUnit
Slot name Documentation
Project Which spacecraft this unit belongsto
Name
IsPartOf Relation between instances
Temperature to differantiate hot units and coldunits
PowerConsumption Power
UserInfo Description
Has-a Relation between instances
Receives28V
SendsHSL
Contains Relation between Classes
ReceivesHSL
Sends28V
RelatedQuestion


