A TRUST MODEL FOR ADVISOR NETWORKS IN MULTI-AGENT ENVIRONMENTS
ELHAM MAJD
FACULTY OF COMPUTER SCIENCE AND INFORMATION TECHNOLOGY
UNIVERSITY OF MALAYA KUALA LUMPUR
2015

A TRUST MODEL FOR ADVISOR NETWORKS IN
MULTI-AGENT ENVIRONMENTS
ELHAM MAJD
DESSERTATION SUBMITTED IN FULFILMENT OF
THE REQUIREMENTS FOR THE DEGREE OF DOCTOR
OF PHILOSOPHY
FACULTY OF COMPUTER SCIENCE AND
INFORMATION TECHNOLOGY
UNIVERSITY OF MALAYA KUALA LUMPUR
2015

ii
UNIVERSITY OF MALAYA
ORIGINAL LITERARY WORK DECLARATION
Name of Candidate: Elham Majd (I.C/Passport No: H95659559)
Registration/Matric No: WHA110049
Name of Degree: Doctor of Philosophy
Title of Project Paper/Research Report/Dissertation/Thesis (“this Work”):
A Trust Model for Advisor Networks in Multi-Agent Environments
Field of Study: Computer Science (Multi-agent Systems)
I do solemnly and sincerely declare that:
(1) I am the sole author/writer of this Work;
(2) This Work is original;
(3) Any use of any work in which copyright exists was done by way of fair
dealing and for permitted purposes and any excerpt or extract from, or
reference to or reproduction of any copyright work has been disclosed
expressly and sufficiently and the title of the Work and its authorship have
been acknowledged in this Work;
(4) I do not have any actual knowledge nor do I ought reasonably to know that
the making of this work constitutes an infringement of any copyright work;
(5) I hereby assign all and every rights in the copyright to this Work to the
University of Malaya (“UM”), who henceforth shall be owner of the
copyright in this Work and that any reproduction or use in any form or by any
means whatsoever is prohibited without the written consent of UM having
been first had and obtained;
(6) I am fully aware that if in the course of making this Work I have infringed
any copyright whether intentionally or otherwise, I may be subject to legal
action or any other action as may be determined by UM.
Candidate’s Signature Date: 8. June. 2015
o
Subscribed and solemnly declared before,
Witness’s Signature Date: 10. July. 2015
Name:
Designation:

iii
ABSTRACT
Multi-agent systems can break interactions in distributed and heterogeneous
environments. One of the fundamental challenges in such settings is that agents can
enter and leave the system at will; hence malicious agents may take advantage of others
by behaving in an untrustworthy way. In this case, if an agent wants to interact with
unknown provider agents, they need to request other agents to advise a trustworthy
provider. The crucial issues are then how to rely on the information provided by advisor
agents. A trust mechanism was proposed that measures and analyzes the trust value of
advisors. In fact, the proposed mechanism measures the belief and disbelief value of
each advisor in multi-agent environments utilizing reliability/ unreliability, reputation/
disrepute of each interaction. In this mechanism, the aim was to select the trustworthy
provider agent through an advice of benevolent advisors in which the actions of
advisors are accurately under analysis. The theoretical analysis was done in two parts;
first the validation of model was investigated by analyzing the average accuracy of
model in calculating the trust and trust transitivity value among advisors and by
comparison with other alternative models. Second, the average accuracy of our model in
decision-making process was investigated by trust network game. The results denote
that our approach outperforms current models in providing accurate credibility
measurements and computing an accurate trust mechanism for advisor agents in an
advisor network, also presenting an accurate decision making process to choose the
trustworthy provider. The experimental results also show the superior performance of
our proposed model in comparison with other trust models. Applying this trust model
can ensure critical transactions are performed more securely, such as those related to
banking or e-commerce.
iv
ABSTRAK
Sistem multi-ejen boleh memecahkan interaksi dalam persekitaran teragih dan
heterogen. Salah satu cabaran asas dalam tetapan ini ialah seperti ejen boleh menasuki
dan meninggalkan sistem itu bila-bila sahaja; oleh itu agen yang berniat jahat akan
mengambil kesempatan melakukannya dengan cara yang tidak boleh dipercayai. Dalam
kes ini, jika agen mahu untuk berinteraksi dengan ejen-ejen pembekal yang tidak
diketahui, mereka perlu meminta nasihat daripada ejen yang lain utuk mendapatkan
pembekal yang boleh dipercayai. Isu-isu penting kemudiannya adalah bagaimana untuk
bergantung kepada maklumat yang diberikan oleh agen penasihat.Kami mencadangkan
satu mekanisme amanah yang dapat mengukur dan menganalisis nilai kepercayaan dan
kesangsian penasihat berdasarkan komponen utama yang dikumpulkan daripada model-
model semasa.Malah, mekanisme yang dicadangkan mengukur nilai kepercayaan dan
kesangsian oleh sikap percaya setiap penasihat dalam persekitaran multi-ejen dengan
menggunakan kebolehpercayaan/ tidak boleh percaya, reputasi/tidak popular bagi setiap
interaksi. Dalam mekanisme ini, ia bertujuan memilih ejen pembekal yang boleh
dipercayai melalui nasihat daripada penasihat baik hati di mana tindakan penasihat di
bawah analisis adalah tepat. Analisis teori dilakukan dalam dua bahagian; pertama
pengesahan model telah disiasat dengan menganalisis ketepatan purata model dalam
menghitung kepercayaan dan nilai transitivity kepercayaan di kalangan penasihat dan
dengan perbandingan dengan model alternatif, model asas, model berasaskan bukti
amanah, dan model TREPPS. Kedua, purata ketepatan model kami yang dalam proses
membuat keputusan telah dianalisis dengan menggunakan amanah permainan
rangkaian. Keputusan eksperimen juga menunjukkan prestasi unggul daripada model
yang dicadangkan kami dalam perbandingan dengan model amanah lain. Menggunakan
model amanah ini boleh memastikan transaksi kritikal dilakukan lebih selamat, seperti
yang berkaitan dengan perbankan atau e-dagang.
iii
ACKNOWLEDGEMENTS
I would like to express my sincere appreciation and thanks to my research
supervisor, Dr. Vimala Balakrishnan, for her professional guidance and critical input
throughout my work on this dissertation. Her encouragement, mentorship and
unwavering support helped me overcome numerous challenges presented over the
course of this project.
I would like to thank my committee members for their insights and suggestions.
Additionally, I would like to thank the University of Malaya and the Department of
Information Systems for the support, resources and teaching opportunities they afforded
me over the duration of my studies.

iv
DEDICATION
This dissertation is dedicated to:
My loving parents, Dr. Ahmad Majd and Dr. Sedigeh Mehrabian, who
instilled in me a love of learning and to my brothers for their encouragement and
support.

v
TABLE OF CONTENT
Abstract ............................................................................................................................ iii
Abstrak ............................................................................................................................. iv
Acknowledgements .......................................................................................................... iii
Dedication ........................................................................................................................ iv
Table of Content ............................................................................................................... v
List of Figures ................................................................................................................. xii
List of Tables ................................................................................................................. xvi
List of Symbols and Abbrevations ............................................................................... xviii
List of Appendices ......................................................................................................... xix
CHAPTER 1: INTRODUCTION .................................................................................. 1
1.1 Introduction ............................................................................................................... 1
1.2 Overview ................................................................................................................... 3
1.3 Motivation ................................................................................................................. 5
1.3.1 Dissimilarity preferences .................................................................................. 6
1.3.2 Inaccurate trust value ........................................................................................ 6
1.3.3 Unpredictable behaviors ................................................................................... 7
1.3.4 Trust transitivity................................................................................................ 7
1.4 Problem Statement..................................................................................................... 7

vi
1.5 Research Aim ............................................................................................................ 8
1.6 Research Objectives ................................................................................................ 10
1.7 Research Questions ................................................................................................. 10
1.8 Scope of Research ................................................................................................... 11
1.9 Significance of Research ......................................................................................... 11
1.10 Dissertation Structure ............................................................................................ 12
CHAPTER 2: LITERATURE REVIEW .................................................................... 15
2.1 Introduction ............................................................................................................. 15
2.2 Agents and multi-agent systems .............................................................................. 16
2.3 Advisor agent and advisor network in multi-agent systems .................................... 16
2.4 Trust in multi-agent systems ................................................................................... 18
2.5 Trust models in multi-agent systems ....................................................................... 20
2.6 Main components of trust models ........................................................................... 21
2.6.1 Similarity ........................................................................................................ 21
2.6.2 Satisfaction/Dissatisfaction ............................................................................ 22
2.6.3 Reliability ....................................................................................................... 24
2.6.4 Reputation ....................................................................................................... 26
2.6.5 Belief/Disbelief ............................................................................................... 27
2.6.6 Uncertainty ..................................................................................................... 28
2.6.7 Conflict ........................................................................................................... 29
2.6.8 Trust transitivity.............................................................................................. 30
2.6.9 Decision-Making Process ............................................................................... 30
vii
2.7 Related trust models ................................................................................................ 31
2.7.1 Dynamic Trust Model ..................................................................................... 31
2.7.2 PBTrust Model ............................................................................................... 32
2.7.3 TREPPS .......................................................................................................... 33
2.7.4 FIRE ................................................................................................................ 36
2.7.5 SPORAS ......................................................................................................... 37
2.7.6 HISTOS .......................................................................................................... 37
2.7.7 TRR ................................................................................................................ 39
2.7.8 REGRET ......................................................................................................... 39
2.7.9 TNA-SL .......................................................................................................... 41
2.7.10 Probability Certainty Distribution Model ..................................................... 42
2.7.11 Evidence-based Trust Model ........................................................................ 46
2.7.12 New Evidential Trust Model ........................................................................ 47
2.8 Initial structure of TMAN ....................................................................................... 57
2.9 Summary.................................................................................................................. 59
CHAPTER 3: RESEARCH METHODOLOGY ....................................................... 61
3.1 Introduction ............................................................................................................. 61
3.2 Phase 1: Identify the components of TMAN ........................................................... 63
3.2.1 Computing Similarity ..................................................................................... 64
3.2.2 Computing Satisfaction/Dissatisfaction ......................................................... 64
3.2.3 Computing Reliability/Unreliability ............................................................... 65
3.2.4 Computing Reputation/Disrepute ................................................................... 67
viii
3.2.5 Computing Belief/Disbelief ............................................................................ 68
3.2.6 Computing Uncertainty .................................................................................. 69
3.2.7 Computing Conflict ........................................................................................ 70
3.2.8 Computing Trust transitivity........................................................................... 70
3.2.9 Computing Decision-making process ............................................................. 71
3.3 Phase 2: Design of TMAN ...................................................................................... 72
3.4 Phase 3: Test and evaluation of TMAN .................................................................. 73
3.4.1 Random selection............................................................................................ 75
3.4.2 Trade network game ....................................................................................... 76
3.5 Summary.................................................................................................................. 78
CHAPTER 4: DESIGN AND IMPLEMENTATION OF TMAN ............................ 79
4.1 Introduction ............................................................................................................. 79
4.2 Design of TMAN ..................................................................................................... 80
4.2.1 Selecting similar agents .................................................................................. 83
4.2.2 Trustworthiness of advisors ............................................................................ 90
4.2.2.1 Belief of each advisor ......................................................................... 90
4.2.2.1.1 Reliability of each advisor ................................................... 91
4.2.2.1.2 Reputation of each advisor .................................................. 94
4.2.2.2 Disbelief of each advisor .................................................................... 98
4.2.2.2.1 Unreliability of each advisor ............................................... 98
4.2.2.2.2 Disrepute of each advisor .................................................. 101
4.3.2.3 Uncertainty of each advisor .............................................................. 105

ix
4.2.2.4 Conflict of each advisor.................................................................... 106
4.2.3 Trustworthiness of each provider ................................................................. 108
4.2.3.1 Belief of each provider ..................................................................... 109
4.2.3.2 Disbelief of each provider ................................................................ 111
4.2.3.3 Uncertainty of each provider ............................................................ 113
4.2.3.4 Conflict of each provider .................................................................. 114
4.2.4 Trust transitivity............................................................................................ 115
4.2.5 Making a decision ......................................................................................... 119
4.2.6 Reward and punishment ............................................................................... 122
4.2.7 TMAN schema.............................................................................................. 123
4.3 Evaluation method of TMAN ................................................................................ 125
4.3.1 Random selection method............................................................................. 125
4.3.1.1 Average accuracy of TMAN ............................................................ 127
4.3.1.2 Comparing the performance of the TMAN with other existing models128
4.3.2 Evaluation plan with trust network game approach ..................................... 129
4.3.2.1 Accuracy of TMAN components ..................................................... 134
4.3.2.2 Performance of TMAN in decision-making process ........................ 134
4.4 Summary................................................................................................................ 134
CHAPTER 5: RESULTS AND DISCUSSION ........................................................ 136
5.1 Introduction ........................................................................................................... 136
5.2 Part 1: Evaluation of TMAN with random selection ............................................. 136
5.2.1. Experiment 1.1: Evaluation of the advisors’ trustworthiness ...................... 138

x
5.2.2 Experiment 1.2: Evaluation of the trustworthiness of providers .................. 146
5.2.3 Experiment 1.3: Trust transitivity between advisors and providers ............. 150
5.2.4 Experiment 1.4: Comparing the performance of TMAN with other existing
models .................................................................................................................... 158
5.2.4.1 Experiment 1.4.1: Comparing the performance of TMAN with other
comparable models according to group one ................................................. 158
5.2.4.2 Experiment 1.4.2: Comparing the performance of TMAN with other
comparable models according to group two ................................................. 161
5.2.4.3 Experiment 1.4.3: Comparing the performance of TMAN with other
comparable models according to group three ............................................... 164
5.2.4.4 Experiment 1.4.4: Comparing the performance of TMAN with other
comparable models according to group four ................................................ 167
5.3 Part 2: Evaluation of TMAN with the trust network game method ...................... 171
5.3.1 Experiment 2.1: Accuracy of TMAN in evaluating the trustworthiness of
agents ..................................................................................................................... 172
5.3.1.1 Experiment 2.1.1: Consistent behaviors ........................................... 172
5.3.1.2 Experiment 2.1.2: Slightly oscillating behaviors ............................. 175
5.3.1.3 Experiment 2.1.3: Oscillating behaviors .......................................... 179
5.3.2 Experiment 2.2: Performance of TMAN in selecting the provider .............. 184
5.4 Summary................................................................................................................ 186
CHAPTER 6: CONCLUSIONS, LIMITATIONS AND FUTURE WORKS ....... 188
6.1 Introduction ........................................................................................................... 188
6.2 Summary of findings and research objectives accomplished ................................ 189
xi
6.2.1 Summary of the first research objective ....................................................... 190
6.2.2 Summary of the second research objective .................................................. 191
6.2.3 Summary of the third research objective ...................................................... 192
6.3 Research Contributions ......................................................................................... 192
6.4 Research implications ............................................................................................ 194
6.5 Limitations and future research ............................................................................. 195
6.5.1 Storage space limitation ................................................................................ 195
6.5.2 Level of advisor in an advisor network ........................................................ 195
6.5.3 Time consumed for calculation .................................................................... 196
6.5.4 Cost of agents ............................................................................................... 196
6.5.5 Other components ......................................................................................... 196
6.5.6 Other domains of application........................................................................ 197
6.6 Summary................................................................................................................ 197
Refrences ...................................................................................................................... 198
xii
LIST OF FIGURES
Figure 1. 1: A sample of an advisor network .................................................................... 4
Figure 1. 2: A sample of multi-agent environment ........................................................... 9
Figure 2. 1: A sample of an advisor network .................................................................. 17
Figure 2. 2: A sample of indirect trust in multi-agent environment ............................... 19
Figure 2. 3: The ontological structure of an interaction (Sabater & Sierra, 2001c)........ 21
Figure 2. 4: HISTOS directed graph (Zacharia & Maes, 2000) ...................................... 38
Figure 2. 5: The ontological structure (Sabater & Sierra, 2001c) ................................... 40
Figure 2. 6: A multi-agent path between agent A and C................................................. 44
Figure 2. 7: Two multi-agent paths from agent A........................................................... 44
Figure 2. 8: A multi-agent network ................................................................................. 45
Figure 2. 9: Trust combination ........................................................................................ 49
Figure 2. 10: Trust aggregation ....................................................................................... 49
Figure 2. 11 Required components for TMAN ............................................................... 58
Figure 3. 1: Research methodology phases ..................................................................... 62
Figure 3. 2: Phase 3 of research methodology ................................................................ 74
Figure 4. 1: TMAN mechanism ...................................................................................... 82
Figure 4. 2: Sending query to familiar agents and collected the responses .................... 86
Figure 4. 3: Evaluating similarity of responder agents ................................................... 89
Figure 4. 4: Evaluating trustworthiness of each advisor ............................................... 108
Figure 4. 5: Evaluating trustworthiness of each provider ............................................. 115

xiii
Figure 4. 6: Evaluating trust transitivity ....................................................................... 119
Figure 4. 7: Decision-making process .......................................................................... 121
Figure 4. 8: Reward or punishment for the final selected advisors............................... 123
Figure 4. 9: TMAN schema .......................................................................................... 124
Figure 5. 1: An example for experiment 1.1 ................................................................. 138
Figure 5. 2: Average accuracy of reliability and unreliability values for benevolent
advisors across all groups and distributions .................................................................. 140
Figure 5. 3: Average accuracy of reliability and unreliability values for malicious
advisors across in each group and distribution ............................................................. 140
Figure 5. 4: Average accuracy of reputation and disrepute values for benevolent
advisors in each group and distribution ........................................................................ 141
Figure 5. 5: Average accuracy of reputation and disrepute values for malicious advisors
across in each group and distribution ............................................................................ 142
Figure 5. 6: Average accuracy of belief and disbelief of benevolent advisors across in
each group and distribution ........................................................................................... 143
Figure 5. 7: Average accuracy of belief and disbelief of malicious advisors in each
group and distribution ................................................................................................... 143
Figure 5. 8: Average accuracy of reliability and unreliability for all groups and
distributions of benevolent and malicious advisors ...................................................... 144
Figure 5. 9: Average accuracy of reputation and disrepute for all groups and
distributions of benevolent and malicious advisors ...................................................... 145
Figure 5. 10: Average accuracy of belief and disbelief for all groups and distributions of
benevolent and malicious advisors ............................................................................... 145
Figure 5. 11: An example for experiment 1.1 ............................................................... 146

xiv
Figure 5. 12: Average accuracy of belief and disbelief of benevolent providers in each
group and distribution ................................................................................................... 148
Figure 5. 13: Average accuracy of belief and disbelief of malicious providers in each
group and distribution ................................................................................................... 149
Figure 5. 14: Total average accuracy of belief and disbelief across all groups ............ 150
Figure 5. 15: An example for experiment 1.3 ............................................................... 151
Figure 5. 16: Average accuracy of belief and disbelief of benevolent providers after
trust transitivity in each group and distribution ............................................................ 153
Figure 5. 17: Average accuracy of belief and disbelief of malicious providers after trust
transitivity in each group and distribution .................................................................... 154
Figure 5. 18: Comparing the differences between belief and disbelief of benevolent and
malicious providers ....................................................................................................... 155
Figure 5. 19: Total average accuracy of belief and disbelief after trust transitivity across
all groups and distributions ........................................................................................... 156
Figure 5. 20: Differences in trustworthiness of providers before and after trust
transitivity ..................................................................................................................... 157
Figure 5. 21 An example for experiment 1.4 ................................................................ 159
Figure 5. 22 An example for experimentation .............................................................. 162
Figure 5. 23 An example for experimentation .............................................................. 165
Figure 5. 24 An example for experimentation .............................................................. 168
Figure 5. 25: Comparison of the actual behavior of advisor A and its belief computed by
TMAN (Oscillating rating =0) ...................................................................................... 174
Figure 5. 26: Comparison of the actual behavior of advisor A and its belief computed by
TMAN (Oscillating rating =0) ...................................................................................... 175

xv
Figure 5. 27: Comparison of the actual behavior of advisor B and its belief computed by
TMAN (Oscillating rating =0.05) ................................................................................. 177
Figure 5. 28: Comparison of the actual behavior of advisor B and its disbelief computed
by TMAN (Oscillating rating =0.05) ............................................................................ 178
Figure 5. 29: Comparison of the behavior of provider B and its belief computed by
TMAN (Oscillating rating =0.05) ................................................................................. 179
Figure 5. 30: Comparison of the behavior of advisor C and its belief computed by
TMAN (Oscillating rating =0.5) ................................................................................... 181
Figure 5. 31: Comparison of the behavior of advisor C and its disbelief computed by
TMAN (Oscillating rating =0.5) ................................................................................... 182
Figure 5. 32: Comparison of the behavior of provider C and its belief computed by
TMAN (Oscillating rating =0.5) ................................................................................... 183
Figure 5. 33: Comparison of the behavior of provider C and its disbelief computed by
TMAN (Oscillating rating =0.5) ................................................................................... 184
Figure 5. 34: comparing the actual behavior of providers which presented by TNG and
the final rate of selected provider by TMAN ................................................................ 185
xvi
LIST OF TABLES
Table 2. 1: Service satisfaction values presented by TREPPS (Li & Kao, 2009) .......... 33
Table 2. 2: Comparative analysis of related trust models ............................................... 52
Table 3. 1: Proposed satisfaction and dissatisfaction rates by TMAN .............................. 65
Table 4. 1: Linguistic values for importance weight of preferences criteria (Li & Kao,
2009) ........................................................................................................................................... 87
Table 4. 2: Linguistic values for rating of service satisfaction in different criteria ......... 91
Table 4. 3: Linguistic values for rating of service dissatisfaction in different criteria .... 99
Table 4. 4 Distributions of experiments ............................................................................... 126
Table 4. 5 Parameters of experiments .................................................................................. 126
Table 5. 1: An example of experiment 1.1 .................................................................... 139
Table 5. 2: An example of experimentation 1.1 ............................................................ 147
Table 5. 3: An example of experimentation 1.1 ............................................................ 152
Table 5. 4: Results of comparing TMAN with other comparable models in group one160
Table 5. 5: The result of the ANOVA test in comparing the significance of TMAN
performance with the performance of other comparable models ................................. 161
Table 5. 6: Results of comparing TMAN with other comparable models in group two163
Table 5. 7: Results of the ANOVA test in comparing the performance of TMAN with
the other comparable models ........................................................................................ 164
Table 5. 8: Results of comparing TMAN with other comparable models in group three166

xvii
Table 5. 9: The result of the ANOVA test in comparing the performance of TMAN with
the other comparable models ........................................................................................ 167
Table 5. 10: Results of comparing TMAN with other comparable models in group four169
Table 5. 11: The result of the ANOVA test in comparing the performance of TMAN
with the other comparable models ................................................................................ 170
Table 5. 12: A sample of advisor behavior in consistent TNG environment................ 173
Table 5. 13: A sample of advisor behavior in mild oscillating TNG environment....... 176
Table 5. 14: A sample of advisor behavior in oscillating TNG environment ............... 180
xviii
LIST OF SYMBOLS AND ABBREVATIONS
FNIS FuzzyNegative Ideal Solution
FPIS FuzzyPositive Ideal Solution
FTOPSIS Fuzzy Technique for Order of Preference by Similarity to Ideal Solution
NIS Negative Ideal Solution
PIS Positive Ideal Solution
TMAN Trust Model for Advisor Networks
TOPSIS Technique for Order of Preference by Similarity to Ideal Solution
TREPPS Trust-based Recommender System for the Peer Production Services
TRR Integrated Reliability-Reputation

xix
LIST OF APPENDICES
Appendix A: Matlab Programming .............................................................................. 208
1
CHAPTER 1: INTRODUCTION
1.1 Introduction
This dissertation addresses the topic of presenting a trust model for advisor
agents which make up an advisor network in a multi-agent system to recommend a
trustworthy provider to a requester agent.
The agent environment coordinates and constrains the actions that the agents can
perform at a given time. At the same time, the agent environment provides the agents
with the interfaces that are necessary in order to perceive the environment and the other
agents situated in it (Tampitsikas et al., 2012). In multi-agent environments, the same
behavior exhibited in real life among persons happens when agents work in a
cooperative way to get a recommendation. They ask other agents for the information
necessary to make a decision when they do not have that information in their knowledge
bases. Thus, recommended trust enables agents to evaluate the credibility of a stranger
agent through the recommended information provided by other users (Ding et al., 2012).
In a complex multi-agent environment, the agents cannot define the capabilities
and behavior of other agents. In this environment, the behavior of each agent forms the
global operation and evolution of the system (Griol et al., 2013). Hence, malicious
agents may take advantage of others by behaving in an untrustworthy manner. Agents in
an e-commerce environment can break contracts due to their own benefits (Jing & Ying,
2010). Therefore, the establishment of trust among stranger agents enables the extension
of a successful transaction to a much broader range of participants in an e-commerce

2
multi-agent environment (Majd & Balakrishnan, 2014; Noorian & Ulieru, 2010). In
fact, a major problem arises when a requester agent has no previous experience with
providers, but it needs a critical product offered by these providers. In this case, the
requester should select one of the providers according to the advice of other requesters,
called advisors, which have had previous interactions with those providers(Gorner et al.,
2011). Since providers and requester agents interact to achieve their goals and maximize
their profit in an agent-based e-commerce environment(Sanchez & Molina, 2010),
requester agents try to buy appropriate products based on their preferences(Battiston et
al., 2006) such as low product price, high product quality, and good customer service. In
the case that the requester agent is not familiar with providers, it needs to consult with
other requesters; they serve as advisors that suggest trustworthy providers and report the
ratings of their suggested providers according to their past interactions(Gorner et al.,
2011). The requester can then estimate the trustworthiness of providers through these
ratings(Gorner et al., 2011). However, the advisor agents can also behave maliciously
by providing wrong advice for their personal gain or exaggerate the trustworthiness of
providers in their reports(Wang et al., 2011). To ensure good interaction among agents,
the requester agents should evaluate the trustworthiness of advisors and consult with the
benevolent ones that present the correct reports about the providers (Khosravifar, 2012).
There may be a breach of trust if the requester agents select a provider according
to advice of advisors, but it does not provide proper service and fails to perform the
action as required; hence, there is a need for mechanisms which can minimize the risks
of wrong or exaggerated advice. One way of reducing risks is to build a good trust level
related to agent interactions (Botêlho et al., 2011; Herzig et al., 2010; Nedev & Nedeva,
2008).
3
In this chapter, a brief review of the topic is presented in Section 1.2. This is
followed by the motivation of doing this research in Section 1.3. Then the statement of
problem is defined in Section 1.4. Next, the aim of doing this research is described in
Section 1.5. The summary of the research objectives and scope of research are presented
in Sections 1.6 and 1.7, respectively. The chapter ends with the significance of research
in Section 1.8 and the outline of the dissertation in Section 1.9.
1.2 Overview
Agents are “sophisticated computer programs that act autonomously on behalf of
their users, across open distributed environments to solve a growing number of complex
problems”(Suriyakala et al., 2013; Yosra et al., 2013). A multi-agent system is
composed of several agents which are collectively capable of reaching goals that are
difficult to achieve by an individual agent of a monolithic system (Spinelli & Basharat,
2011).
Multi-agent systems can be developed to retrieve, apply and sort information
relevant to other agents. These systems have been used in different areas such as legal
(Drumond et al., 2007), marketplace (Wei et al., 2008), tourism (Lorenzi et al., 2010),
and e-commerce (Zhang et al., 2008). In fact, multi-agents in artificial intelligence are
closely related to agents in e-commerce, which is inherently dynamic (i.e. price of an
item changes over time), uncertain (i.e. global or ground truth is often unavailable to an
individual agent due to unreliable communication channels, faulty sensors, or the
complex and nonlinear nature of a domain), and insecure (i.e. presence of malicious
agents or new, unknown agents) (Lehtinen, 2012). As a result, electronic transactions of
e-commerce based on multi-agent systems require the presence of a mechanism of trust

4
Advisor Network
and distrust in order to ensure the fulfillment of a contract (Walter et al., 2008a; Zhou,
2009), and minimize the uncertainty associated with interactions in open distributed
systems.
The problem is that, multi-agent systems can be pressured by events outside a
defined system boundary. Moreover, in these systems it is difficult to control the agents
and their interactions. Naturally, agents can enter and leave a system at their own will.
Hence, at any given time an individual agent within the system may not be familiar with
all the other agents that exist (Teacy et al., 2006). In this situation, critical information
can be leaked and lost easily without an appropriate solution to support the security of a
system. As a result, trust established among agents promises to create more successful
transactions. In fact, trust in a multi-agent environment is “a particular level of beliefs
which an agent has about another agent or group of agents to perform a particular
action” (Bøegh, 2014; Khanna & Babu, 2012; Moyano et al., 2013; Phulre et al., 2013)
The evaluation of trust is indirectly obtained from a target agent (provider) based
on the advice of another intermediate agent, which is known as indirect trust. In this
case, the requester agent asks other agents which have similar preferences (Vassileva,
2012) to discover agents that have had interaction with provider agents to create trust
advisor paths, which comprise a network of advisor agents. A sample of an advisor
network is shown in Figure 1.1.
Figure 1.1: A sample of an advisor network
Requester Providers
5
Trust models in multi-agent systems are designed to enable agents to find
optimal partners that can produce high-quality services, and even create a good
collaborative environment (Lijian et al., 2008). Current trust models apply some
approaches, such as statistics (Pinyol & Sabater-Mir, 2013; Yuan et al., 2010),
probability theory (Teacy et al., 2006), and fuzzy logic (Li & Kao, 2009) to compute the
trustworthiness of a target agent (provider) (He et al., 2011). However, these models
focus on measuring the trust value of target agents. It is important to note that the
intention of this study is not to replicate this body of existing work. Rather, this study
focuses on recognizing a trustworthy provider through the advice of benevolent
advisors. In fact, this study proposes a trust model that measures the trustworthiness of
advisor agents among all existing advisors and selects a trustworthy provider according
to advice of these benevolent advisors.
1.3 Motivation
Agents are incapable of determining the capabilities and behaviors of others.
Hence, malicious agents may take advantage of others by behaving in an untrustworthy
way. However, even with this uncertainty in an environment, agents must be able to
make wise decisions and successfully interact with other agents. Therefore, agents
should be completely aware of their opponents, the environment, and the existing issues
when making decisions. Such information should enable agents to predict probabilities
of particular events happening and help them to act in a way that enhances their
expected effectiveness (Helbing, 2013; Yu et al., 2010). In order to minimize the
uncertainty associated with interactions in this case, agents have to trustother agents as
advisors and make a decision according to their advices.

6
Although current researches present useful solutions to compute the
trustworthiness of agents in multi-agent systems, challenges still remain. These
emerging and related challenges highlight the need for research on the way of
evaluating trust based on advice of advisor agents; in line with this, the purpose of
carrying out this research is to recognize a trustworthy provider agent through the
advice of benevolent advisors. The relevant issues are discussed in the following
subsections.
1.3.1 Dissimilarity preferences
If agents have disadvantages in only some specific aspects in the marketplace
such as customer service but were to be labelled as dishonest agents, this may pose
some challenges. The dishonest reputation of these agents will discourage future
requester agents from interacting with them, though these agents can provide
advantages in other aspects such as product quality. As a result, those agents cannot go
through a more detailed selection process although those agents and requester may
actually have similar preferences (Zhang & Cohen, 2013).
1.3.2 Inaccurate trust value
In heterogeneous multi-agent environments where agents behave autonomously,
predicting the behavior of agents cannot be completely accurate. Therefore, evaluating
the trustworthiness of agents and predicting their behavior according to this evaluation
might be inaccurate; due to this limitation, the trust mechanism should be able to
consider the effect of inaccurate reports to maintain the trustworthiness of agents and to
reduce the effect of inaccurate trust values (Jung et al., 2012).

7
1.3.3 Unpredictable behaviors
The agents can change their behavior in a multi-agent environment; the agent
which has a benevolent behavior in one interaction can exhibit a malicious behavior in
the next interaction. It is noted that some of the agents show more unstable behaviors
than others, and they have a habit of changing their behaviors in different interactions.
The unstable behavior of an agent shows that the agent cannot be trusted and engaged in
an interaction. This may pose another challenge, to explore a method which allows less
unpredictable agents to be chosen as a benevolent agent (Zhang & Cohen, 2013).
1.3.4 Trust transitivity
The importance of trust composition is obvious when considering the
organization of agent groups. In a group, agents generally interact with one another to
achieve their common goals. In this case, trust will be transitive among a network of
agents. In fact, the trustworthiness of agents which have indirect interaction with the
requester should be evaluated by transitivity of trust from the agents which have direct
interaction with requester. In such circumstances, the trust composition can play a
critical role in determining the trust values for unknown agents (Jung et al., 2012).
1.4 Problem Statement
Malicious advisor agents may make requester agents deviate from achieving
their goals. For instance, a malicious advisor agent may recommend a provider that
claims to provide services it cannot actually provide. This action can result in loss of
critical information and payment of a high price. The situation will be more critical
8
when requester agents have had no previous interactions with providers and select one
of the providers according to the wrong advice.The advisors act maliciously will cause
an unsuccessful interaction, especially in e-commerce areas, where the safety of
interaction is vital.The existing studies ignored the effect of malicious advisors and did
not compute the trust level of advisors.On the other hand, a mechanism of trust which
does not consider the similarity between the preferences of advisor and requester leads
to selecting a provider that cannot really provide services according to preferences of
requester (Zhang & Cohen, 2013). The agents of a multi-agent environment are
autonomous; thus, prediction of the behaviors of agents according to previous
interactions might be inaccurate and uncertain (Jung et al., 2012). Moreover, some
agents exhibit very inconsistent behavior (Zhang & Cohen, 2013). Another point to
highlight is that, the provider suggested by advisors leads to transitivity of trust between
advisors and their suggested providers, since the trustworthiness of these providers is
not the same as that of the advisors which suggested them (Jung et al., 2012). In fact,
the consequences of selecting a malicious advisor are especially apparent in critical
transactions, such as those related to e-commerce.
Furthermore, the major challenge faced in this research is malicious advisors
that impact the decision of requester agents and cause them to interact with
untrustworthy provider agents.
1.5 Research Aim
In light of the impact of malicious advisors on the decision of requester agents,
the aim of this research is to present a computational trust model for evaluating the
trustworthiness of each advisor and its suggested provider agent.This value can be used
9
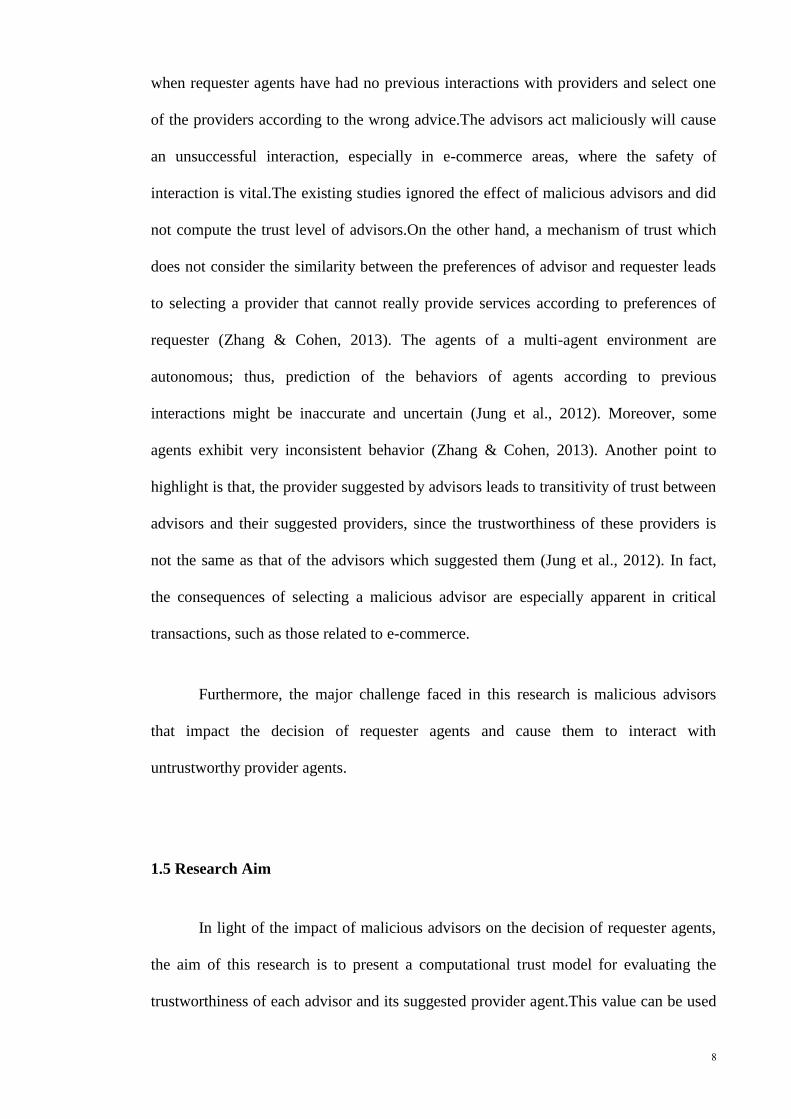
to help requester agents recognize the trustworthiness of provider agents. Then,
according to the trustworthiness of each advisor and the trust transitivity between
advisors and their suggested providers, the requester makes a decision concerning which
providers are trustworthy, based on the advice provided by these benevolent advisors.
Figure1.2 illustrates the aim of this research in more detail.
Figure 1.2: A sample of multi-agent environment
In fact, this study is based on the requester that needs to buy a service, but it has
no information about providers which can provide its needed service. In this case, to
select the most trustworthy provider, the requester asks other agents that may be
familiar with any provider which can provide its needed service. As shown in Figure
1.2, the agents which are selected as advisors can be malicious or benevolent ones.
Moreover, these advisors as shown in Figure 1.2 may have had previous interactions
with each other and form an advisor network. According to this explanation, this
research intends to evaluate the trustworthiness of advisors and their suggested
providersto select the most trustworthy provider according to advice of benevolent
advisors.
Advisor Network
Requester
Benevolent
Benevolent Trustworthy
Provider
Malicious
Benevolent Provider
Provider
Malicious Provider

10
1.6 Research Objectives
The objectivesof this research can be broken down as follows:
i. To identify the main components that can be used to present a trust model for
advisor network in multi-agent environment.
ii. Todesign and implement thetrust model based on the identified components.
iii. To evaluate the performance of the proposedmodelin a multi-agent
environment.
1.7 Research Questions
This study is based on the following questions:
i. What are the main components that can be considered to build a trust model in
a multi-agent environment?
ii. How can the components be integrated into a single trust model?
iii. How to determine the trustworthiness between the various agents, in order to
select the most trustworthy provider?
iv. How the proposed model can be evaluated?
v. How the model can be compared with other existing models to assess its
effectiveness?

11
1.8 Scope of Research
The scope of this research is multi-agent systems that focus on the e-commerce
area, especially business-to-business e-commerce where the agents can play the roles of
requesters, providers and advisors. Business-to-business (B2B) commerce is a type of
commerce transaction that exists between businesses, such as those involving a
manufacturer and wholesaler, or a wholesaler and retailer (Xu, 2012). In fact, business-
to-business e-commerce refers to substitution of computer data and processing for labor
services in the production of economic transactions (Grewal et al., 2010).
On the other hand, he software used for the purpose of simulating the multi-
agent environment and evaluating the performance of TMAN is MATLAB. In fact,
MATLAB provides a technical computing environment for numeric computation and
visualization (Etter & Kuncicky, 2011). It integrates numerical analysis, matrix
computation, signal processing, and graphics in the same environment. The system is
equipped with a mouse-driven graphical interface made up of a number of displays
(Etter & Kuncicky, 2011). Numerical calculation in MATLAB applies to well-written
scientific/mathematical subroutines. Overall, MATLAB is a useful programming
language for simulating computational projects because it has a useful tool for
mathematical equations and matrix manipulations. Since TMAN was proposed by
matrix and mathematical equations, TMAN was evaluated by using MATLAB.
1.9 Significance of Research
A system of trust is required in order to ensure the fulfillment of a contract in an
e-commerce multi-agent system, and minimize the risk associated with interactions in
electronic transactions. Trust-based advisor agents allow requester agents to be aware
12
that the advice is given by benevolent agents. Moreover, it can improve the accuracy of
advice and decrease the occurrence of errors in common interactions. Thus, the
interaction between requesters and provider agents can be more successful because
agents receive advice from benevolent advisor agents and select a trustworthy provider.
Based on the above, TMAN can significantly enrich the trust models by
selecting the most trustworthy provider by evaluating the trustworthiness of advisors
and their suggested providers; this can lead to more successful transactions between
requester and provider agents. Moreover, the advisors encourage benevolent behaviors
by using a punishment and reward mechanism. In fact, applying TMAN can ensure
critical transactions related to e-commerce are performed more securely, especially in
business-to-business e-commerce.
1.10 Dissertation Structure
This dissertation is organized in five chapters as follows:
Chapter 1: This chapter presents a description that addresses the problem
statement. It indicates the issue to be studied, contextualizes the study, contains the
motivation of doing the study, provides an introduction to the basic components,
including an overview of the focus of the study, and identifies the significance of study
to address the benefits that may be derived from doing this study. The chapter also
covers the scope of the study and sets out a clear and valid representation of what will
be found in the remaining parts of the dissertation.
Chapter 2: This chapter involves research in the context of previous models and
research pertaining to the topic, reviews primary sources that are mostly recent

13
empirical studies from scholarly journals and publications, presents a critical
comparison of the main components of previous models, and justifies how the identified
components are relevant to present a trust model for multi-agent environments. This
chapter consists of two parts. The first part describes the concept of the keywords of the
study and states the areas of the literature that will be covered. It also classifies the
existing models. The second part presents the main components which are essential for
designing the suggested trust model and investigates different methods of computing
each component. This part is concluded with the initial schema of the proposed model
based on the relationship between the identified components.
Chapter 3: This chapter describes the research methodology of this study in
three parts. The first part cites appropriate methodological literature, identifies the
selected methods of computing identified components from literature and previous
models, and determines the reasons for selecting each method. The second part proposes
a mechanism of suggested model for selecting the most trustworthy provider according
to advice of the benevolent advisor agents. This part presents the final schema of the
proposed model based on the identified components which are derived from literature.
Finally, the third part describes and justifies selection of the research setting for
evaluation of the proposed model. This part explains clearly the samples and the
simulation environment for testing the proposed model.
Chapter 4: This chapter reports the study’s main findings. In fact, this chapter
presents the findings collected from a simulated environment and presents a comparison
of the proposed model with previous existing models. This chapter contains two parts;
the first part contains the findings of testing each component of the proposed model. In
this part, the average accuracy of computing each component of the proposed model is
examined and presents the findings of comparing the proposed model with other

14
existing models. Then, the second partcontains the findings of testing performance of
TMAN in evaluating the trustworthiness and selecting the most trustworthy provider
based on different types of agent’s behaviors. In addition, this chapter synthesizes and
discusses the findings in light of the study’s research objectives and proposed model by
providing an in-depth interpretation, analysis, and synthesis of the findings.
Chapter 5: This chapter presents a set of concluding statements and
recommendations. In this chapter, the conclusion provides a summary of the major
research findings, highlighting the key achievements and drawing final conclusions. A
number of areas for further research are also outlined in this final chapter. Conclusions
are built on an integration of the study findings and analysis of the proposed model. The
conclusion part investigates each research objective according to the proposed model
and findings, identifies the proposed solutions for the problem statement, and
determines the contributions of this study. The chapter includes suggested implications
for practice based on the findings and recommendations for future research.

15
CHAPTER 2:LITERATURE REVIEW
2.1 Introduction
This chapter reviews related literature and previous models pertaining to the
topic, and investigates related literature comprising empirical studies from scholarly
journals and publications. First, the concept of multi-agent systems, advisor networks,
trust in multi-agent systems, and also trust models in multi-agent systems are described
according to the information gathered from the primary sources, namely scholarly
journals and publications. This description presents an overall view of the focus area for
this study. Then the chapter is followed by analyzing the previous trust models. Based
on this analysis, several components which should be considered when proposing
TMAN are identified; these components can help to support the research objectives and
solve the issues raised in the problem statement.
However, it must be noted that this part does not aim to cover all the existing
trust models. Instead, it focuses on the most representative models which help to
introduce the main components and also present different existing methods of
computing these components. The comparison of different existing methods for
computing the main components can reveal which method is more suitable for
designing TMAN. This chapter ends with a presentation of the basic schema of TMAN
and introduces its main structure, which is described in more detail in Chapter 3.
16
2.2 Agents and multi-agent systems
“An agent is an autonomous decision-making entity that receives sensor
information from an environment and acts based on that information.” The agents are
communicative, cooperative, goal-oriented, autonomous, adaptive, and reactive
(Hakansson & Hartung, 2012).
The environment that agents interact within is cooperative, accessible, episodic,
deterministic, dynamic and discrete. This environment can be divided into atomic
episodes, where each episode has an agent that performs a single task. Dynamic multi-
agent environment refers to an environment that does not remain static. While discrete
environment can have a finite number of states, it also can have a discrete set of
perceptions and actions (Gaur et al., 2013; Moradian & Håkansson, 2010).
“Agents interact, collaborate, coordinate and negotiate in a system that was
designed and implemented as a multi-agent system. In fact, a multi-agent architecture is
based on cooperative agents and has been developed for the integration of design,
manufacturing and shop-floor control activities” (Andreadis, Bouzakis, et al., 2014;
Andreadis, Klazoglou, et al., 2014).
2.3 Advisor agent and advisor network in multi-agent systems
In the multi-agent environment, the requester agent which does not have enough
information about providers, needs to consult with other agents that serve as advisors
reporting the ratings for each provider according to their past interactions. Based on this
information, the requester can make a decision whether to interact with providers
through the advice of these advisor agents (Gorner et al., 2013). Thus, advisor agents

17
are those agents that share preferences and viewpoints that are similar to preferences of
requester agent most of the time (Biswas et al., 2010).
The advisor agents may have interactions with each other, which form an
advisor network (Gorner et al., 2013). A sample of an advisor network is shown in
Figure 2.1.
Figure 2.1: A sample of an advisor network
As shown in Figure 2.1, advisor agent A had interaction with advisor agents B
and C. Therefore, the advisor network consists of several advisors which have
interactions with requester, provider and other advisor agents.
In multi agent environment, benevolent agents always try to support other agents
because they consider system benefit is the priority (Talib & Elshaiekh) and they does
not expect an immediate reward for its actions (Hollander & Wu, 2011) while the
malicious agents prior its own benefits. According to this explanation, in this research a
benevolent advisor is defined as the agents which consider system benefit and they
provide honesty advice according to their previous evidences. Otherwise, a malicious
advisor exaggerates is their presented information or they provide a wrong advice to
support of their own benefits. On the other hand, a benevolent provider is a trustworthy
agent which provide services according to the requester order, while a malicious
C
B A

18
provider cannot provide the services that they claimed or according to the order of
requester
2.4 Trust in multi-agent systems
“Trust (or symmetrically, distrust) is a particular level of the subjective
probability with which an agent assesses that another agent or group of agents will
perform a particular action” (Döbelt et al., 2012; Kaljahi et al., 2013; Prajapati et al.,
2013; Thirunarayan et al., 2014). In fact, trust plays a crucial role not only in supporting
the security of interact between agents, but also because agents rely on the expertise of
other trusted agents in their decision-making (Walter et al., 2008b). Trust as a dynamic
item can increase or decrease with further experiences (i.e. interactions or observations),
and they also decay over time (Sherchan et al., 2013). New experiences are more
important than old ones since old experiences may become obsolete or irrelevant with
the passing of time.
Agents can misbehave in a number of ways, such as providing fake
recommendations on servers or showing a misleading, deceptive and malicious behavior
to create problems for its competitors especially in an e-commerce competitive
environment. The challenge of building a trust mechanism is how to effectively cope
with such malicious behavior (Kaljahi et al., 2013).
In a multi-agent environment, each interaction can be divided into direct and
indirect trust. Direct trust evaluates agents according to the historical experience of
digital content, which consists of records from previous interactions between itself and
the evaluated agent (Sherchan et al., 2013). Meanwhile, indirect trust occurs when the
trust evaluation is indirectly obtained from the target agent (provider) based on the
19
Requester
Providers
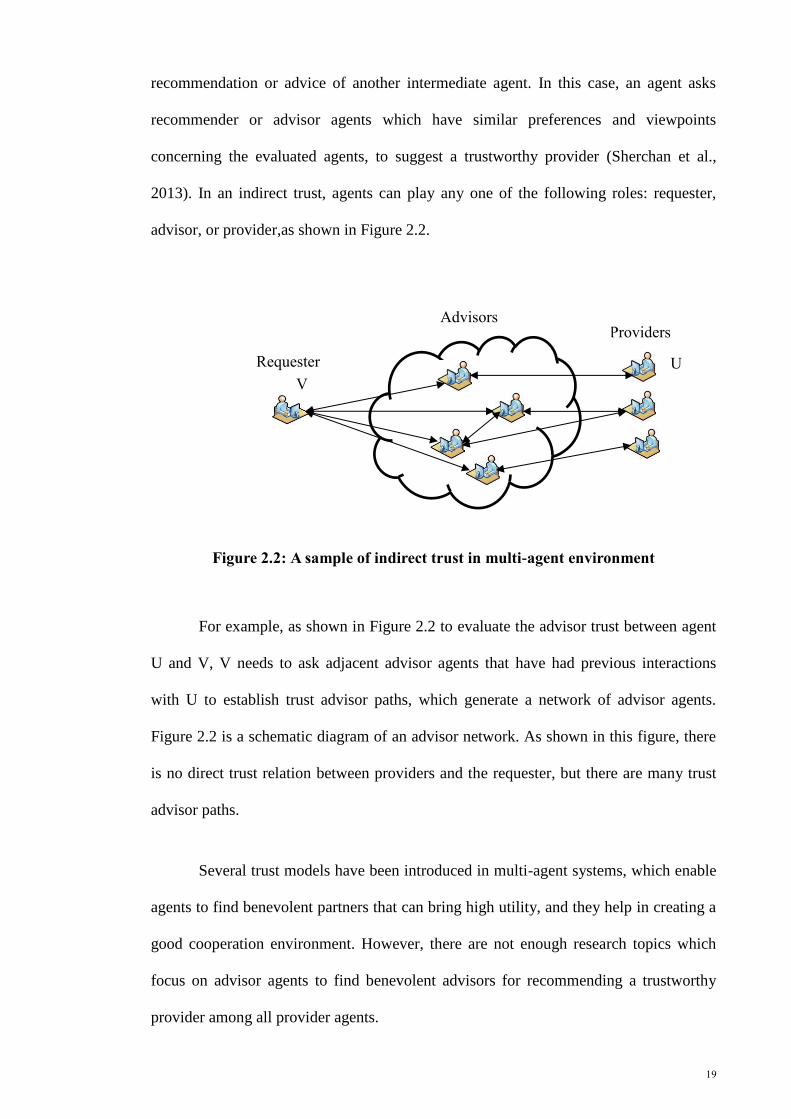
recommendation or advice of another intermediate agent. In this case, an agent asks
recommender or advisor agents which have similar preferences and viewpoints
concerning the evaluated agents, to suggest a trustworthy provider (Sherchan et al.,
2013). In an indirect trust, agents can play any one of the following roles: requester,
advisor, or provider,as shown in Figure 2.2.
Figure 2.2: A sample of indirect trust in multi-agent environment
For example, as shown in Figure 2.2 to evaluate the advisor trust between agent
U and V, V needs to ask adjacent advisor agents that have had previous interactions
with U to establish trust advisor paths, which generate a network of advisor agents.
Figure 2.2 is a schematic diagram of an advisor network. As shown in this figure, there
is no direct trust relation between providers and the requester, but there are many trust
advisor paths.
Several trust models have been introduced in multi-agent systems, which enable
agents to find benevolent partners that can bring high utility, and they help in creating a
good cooperation environment. However, there are not enough research topics which
focus on advisor agents to find benevolent advisors for recommending a trustworthy
provider among all provider agents.
Advisors
V
U

20
2.5 Trust models in multi-agent systems
“Trust models are designed into the multi-agent systems to enable agents to find
optimal partners that can produce high quality services, and even create a good
collaborative environment” (Lijian et al., 2008). These models,like TREPPS model (Li
& Kao, 2009), manage and aggregate the information which is essential for agents to
select partners in uncertain situations, and they also present information based on the
properties of multi-agent systems. These models are based on different components
which denote several roles and formulas for computing trust evaluation of each agent
and ultimately making a decision according to the evaluation of the overall
trustworthiness of an agent in different aspects(Walter et al., 2008a).
There are two main approaches to record trust values of agents and archive the
activities of all the agents in a multi-agent environment, which entail the emergence of
two types of architecture; centralized and distributed.
Centralized architecture is based on a central agent; however, this is not an
appropriate approach in a dynamic environment as the network node that houses the
central data is not accessible all the time (Balakrishnan & Majd, 2013). Under such
circumstances, if an agent requests ratings from a database, it will not be able to find
any source of data for those ratings. Consequently, the agent will be unable to compute
the accurate level of reputation value (Logenthiran et al., 2012). Furthermore, the
centralized solutions ignore possible personal affinities, biases, and standards that may
vary across various users (Logenthiran et al., 2012).
In contrast to the centralized architecture, the agents in a distributed architecture
keep track of all the agents’ activities. Hence, the user models are maintained locally by
the agents. It is not necessary to reveal personal information to a central server, and
21
agents also communicate with one another to collect information or find resources and
experts in order to pursue their users’ goals(Nusrat & Vassileva, 2012).
2.6Main components of trust models
The current trust models are presented based on several main components. In
this section, these components are introduced then existing trust models related to these
components are described. In fact, determining these components can help to support
the first objective of this research. The collected components from the most
representative trust models are similarity, satisfaction/dissatisfaction, reliability,
reputation, belief/disbelief, uncertainty, conflict, trust transitivity, and decision-making
process. Each of these components is explained in the following sections.
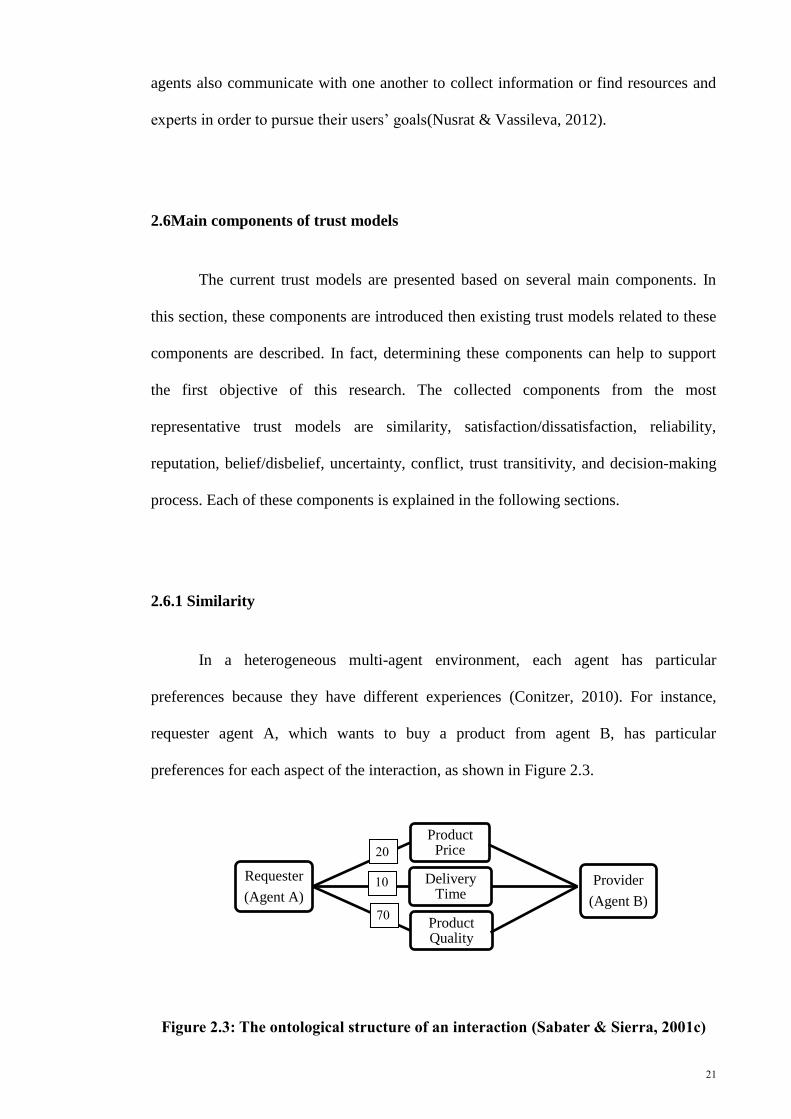
2.6.1 Similarity
In a heterogeneous multi-agent environment, each agent has particular
preferences because they have different experiences (Conitzer, 2010). For instance,
requester agent A, which wants to buy a product from agent B, has particular
preferences for each aspect of the interaction, as shown in Figure 2.3.
Figure 2.3: The ontological structure of an interaction (Sabater & Sierra, 2001c)
Requester
(Agent A)
Product Price
Delivery Time
Product Quality
Provider
(Agent B)
20
10
70

22
According to this example, agent A as a requester emphasizes on three aspects,
the product quality, product delivery time, and product price. In other words, when
agent A wants to purchase a product from provider agent B, it emphasizes 70% on
product quality, 20% on product price and 10% on delivery time. Thereby, the requester
agent A tries to select the provider that can provide the product with high quality, then it
will check the price of the product, and, finally, consider the delivery time suggested by
the providers.
Requester agents need advice when they want to buy items from several
unknown provider agents. In this case, they should consult their familiar agents to find
out which one of these providers can provide the items according to their highest value
of preference. Therefore, the trust of requester agent A towards advisor agent B should
contain a similarity between the preferences experienced by the advisor agents
(Battiston et al., 2006).
2.6.2 Satisfaction/Dissatisfaction
Agents are autonomous and any two agents may have diverse preferences for the
same item, thus they meet different productivity or degrees of satisfaction or
dissatisfaction from the consumption of the same item (Battiston et al., 2006). Hence,
when the agents complete an interaction, the service requestor needs to rate the
provider’s performance through the feedback interface in order to convey its satisfaction
or dissatisfaction of the current interaction (Li & Kao, 2009). Thus, the satisfaction/
dissatisfaction rating represents the confidence of the services and resources that the
provider agents provide (Woo et al., 2010).

23
Rating the satisfaction/dissatisfaction for a service provision is more complex
than rating according to the success or failure of the interaction. This is because the
criteria of the qualified services depend on what the requestor cares about the most,
while the requester can have dissimilar sensitivities concerning the different
perspectives of the provider’s performance.
Simply gauging the satisfaction/dissatisfaction of service performance in a
single dimension with binary rating (i.e. yes or no) may lead to a wrong prediction (Li
& Kao, 2009). This means that by dividing the behavior of each agent into exactly
positive and negative like the Multi-agent Recommendation Agents (Walter et al.,
2008b) and Dynamic Trust Model (Das et al., 2011), the evaluation of the satisfaction or
dissatisfaction of agents cannot be accurate. Generally, linguistic termleads to more
accurate judgment (Zarandi et al., 2012).
If the trust model wants to provide different formula for evaluating the
trustworthiness and untrustworthiness of agents, the range of service satisfaction should
be different from the range of service dissatisfaction. Hence, presenting formulas based
on linguistic terms, which present the value of service satisfaction of the agents as well
as the service dissatisfaction of those agents in separate ranges, is more suitable like
FIRE model (Huynh et al., 2006; Huynha et al., 2004) and REGRET model (Sabater &
Sierra, 2001a), in which the previous satisfying interactions range is between 1 and 0,
and the previous dissatisfying interactions range is between 0 and -1, and 0 represents
the neutral behavior of agents.

24
2.6.3 Reliability
Cooperation among agents can solve large-scale complex problems, which
cannot be solved by a single agent (Iantovics, 2012). However, when agents cooperate,
the possibility arises that an agent may deceive its partner for its own benefit; therefore,
selecting a reliable partner can guarantee successful cooperation to a great extent as well
as reduce unnecessary risk and expenses. In order to ensure the selection of a reliable
partner, it is necessary to investigate the reliability among agents.
The reliability of a system has generally been defined as the probability that a
system will perform as its specification for a specified duration of time (Steghöfer et al.,
2010; Sundresh, 2006). In fact, when an agent has to choose a prospective partner, it
computes the reliability value of that partner based on its past interactions with other
agents (Garruzzo & Rosaci, 2010). The lack of information about the background in
computing the reliability of the agents causes a lot of suspicion and mistrust among
agents (Wei, 2007).
TREPPS (Li & Kao, 2009) and FIRE (Huynha et al., 2004) models propose the
reliability formula based on two factors, closeness and stability factors. These two
factors can appropriately determine the concept of reliability of a specific agent. Indeed,
to define how well an agent is reliable; it is necessary to investigate the frequency of
previous interactions between two agents. In addition, the stability of agents should be
evaluated to determine whether or not the result of the interaction between two agents is
stable. The stability in previous interactions can also increase the degree of confidence
of the agents.
Moreover, FIRE model measures the reliability of each agent based on the
ratings that the agent gives to the provider according to previous interactions. In fact,

25
FIRE model presents a slightly different formula for calculating the closeness and
stability factor by considering range of -1 and 1 for the evaluation of satisfaction and
dissatisfaction. According to FIRE model as the number of previous interactions (n)
grows, the degree of the closeness factor increases until it reaches a defined threshold
(m). However FIRE model did not clearly explain how to evaluate the defined
threshold.
FIRE model (Huynh et al., 2006; Huynha et al., 2004) evaluates the rating of
stability factor called deviation reliability by using the rating that agent 𝑎 gives to agent
𝑏 for each criterion (e.g. price, delivery time, quality), the range of this weight is
between -1 and 1, and also the freshness weight of timethat gives more weight to more
recent interaction. FIRE model like TREPPS calculates the reliability of each agent by
integrating closeness and stability factor.
However, TREPPS and FIRE models ignored the effect of negative behaviours
of agents; it means that these models considered the increasing of the reliability by the
growth in the total number of previous interactions. The previous interactions involved
satisfying and dissatisfying interactions. It seems that considering the number of
previous dissatisfying interactions between two agents separate from the number of
satisfying interactions leads to a better estimate of the level of trustworthiness of the
agent. Therefore, an agent that has to select the most promising agent should calculate
the unreliability of that agent in a multi-agent environment, along with its reliability
value. It is clear that the computation of unreliability is based on the previous
dissatisfying interactions, while the reliability of each agent is calculated based on the
previous satisfying interactions. In fact, the unreliability of a system has generally been
described as the probability that a system will not perform according to its specification
for a specified duration of time.

26
2.6.4 Reputation
Reputation is a collective evaluation of an agent carried out by many other
agents. It is the total measure of trust by other agents in a network of a service provider
(Nusrat & Vassileva, 2012). Reputation is the positive public’s opinion about the
character or standing (e.g. honesty and capability) of an entity, which could be a person,
an agent, a product or a service. When a requester agent has to select the most
promising agent, it should be capable of allocating a proper weight to the reputation in
order to determine the reliability(Rosaci et al., 2011). Reputation values are based on
two aspects; endogenous and exogenous. The endogenous reputation value relates to the
concept of reciprocity, meaning an agent trusts its friends more than strangers. This is a
simple solution to deal with unreliable opinions. The endogenous method essentially
reduces the risk of receiving bad evidence by selecting reputation information from
good sources (i.e. friends) (Marsh, 1994). For example, an increase in agent X’s trust in
Y should also increase the likelihood that X will reciprocate positively to Y’s actions at
some point in the future. This form of reciprocity is evident in online transactions, such
as eBay, where a high correlation between the requester and the provider feedback
exists (Resnick & Zeckhauser, 2002). In contrast, the exogenous reputation value
accepts the positiveratings presented by stranger agents. Instead of calculating the
reputation based on the neighbourhood agents opinion, in this case the probability that a
specific agent provides accurate report, given its past opinion, is used to calculate the
reputation value (Medić, 2012).
However, the existing models did not consider the effect of the negative
opinions of other agents about a specific agent. Most existing models evaluate the
reputation of each agent based on the positive opinions of other agents about a specific
agent. In fact, requester agents can avoid the risk of purchasing, and maximize their
27
expected value of goods by dynamically considering both sets of reputable and
disreputable providers (Brusilovsky et al., 2003).
Therefore, an agent that has to select the most promising agent should consider
the value of disrepute of that agent in a multi-agent environment, along with its
reputation value. In general, the concept of disrepute is the negative public’s opinion
about the character or standing (e.g. dishonesty and incapability) of an entity. This could
be a person, an agent, a product or a service.
It seems that few previous studies consider the disrepute in evaluating the
trustworthiness of agents, whereas the proposed learning algorithm presents a scenario
for evaluating the trustworthiness of the agent by considering both reputation and
disrepute. According to this study, after each interaction, a requester rates the provider
and then compares the given rate with the threshold value, which it considered for that
interaction with the provider. If the recorded rate is more than the threshold, the
provider is considered reputable, otherwise it is disreputable.
2.6.5 Belief/Disbelief
A fundamental aspect of the human condition is that nobody can ever determine
with absolute certainty whether a proposition about the world is true or false. In
addition, whenever the truth of a proposition is expressed, it is always done by an
individual, and it can never be considered to represent a general or objective belief
(Jøsang, 2011). Trust relates to the beliefs that the trusting agent holds, which include
the belief that the second trusted agent is capable of bringing about the goal, and that it
will carry out the action to bring about the goal (Tang et al., 2011).

28
These philosophical ideas are directly reflected in the mathematical formalism
and belief representation of subjective logic (Jøsang, 2011). The trust models, which are
based on the subjective logic, follow the belief and disbelief components. In fact,
subjective logic requires trust relationships to be expressed as belief and disbelief. The
belief theory, which is based on subjective logic, is a framework related to the
probability theory, but where the probabilities over the set of possible outcomes do not
necessarily add up to 1, and the remaining probability is assigned to the union of
possible outcomes (Jøsang et al., 2006).
Dempster-Shafer evidence theory is based on subjective logic (Oren et al.,
2007), which applies a belief matrix called the opinion to express belief. An opinion, as
represented by ),,,( udbW A
x , expresses the belief of the relying agent 𝑎 in the
trustworthiness of service provider 𝑏(Jøsang et al., 2006). Where 𝑏 denotes the belief of
how well the agent can be trusted, 𝑑 represents the disbelief in how well the agent
cannot be trusted, and 𝑢 shows the uncertainty about the prediction of the agent’s
behavior, respectively. The 𝑏, 𝑑 and 𝑢 are between 0 and 1, and 𝑏 + 𝑑 + 𝑢 = 1. The
parameter is called the base rate, and is used for calculating an opinion’s probability
expectation of value (Jøsang et al., 2006).
2.6.6 Uncertainty
The accurate prediction of advisors’ behaviors is not possible while the advisors
are autonomous agents that can work independently. A provider that satisfies the
requester in one interaction may not satisfy the requester in the next interaction. Thus,
prediction of the agent’s behavior cannot be completely certain and a trust model should

29
consider the uncertainty existing in calculating the trustworthiness of advisors based on
their previous interactions.
While the values of belief and disbelief of each agent are calculated by the
requester according to the rating of previous satisfying and dissatisfying interactions
(Alani et al., 2003). With referring toJøsang et al. (2006), the interaction outcome can
be satisfying, dissatisfying and neutral. In subjective logic, the uncertainty relates to the
probability estimates of binary events.
2.6.7 Conflict
The agents can present different behaviours at different times of interactions, in
that some of them have the habit of practicing inconsistently. In order to calculate the
trustworthiness of each advisor more accurately, it is essential to consider the conflict
that advisors have in their behaviour according to the previous interactions.
The new theory, named Dezert-Smarandache theory, which is based on the
subjective logic, is able to handle both uncertainty and paradoxical information. The
Dezert-Smarandache theory is an extension of the subjective logic by overcoming this
strong constraint to consider the conflict in previous evidences(Jin & Huai-Jiang, 2010).
According to the analysis of the most representative trust models, there is one
method which presented for evaluating conflict in the agents outcomes presented by
Evidence-based Trust model (Wang & Singh, 2010). This method is based on
computing the minimum of the proportion of previous satisfying interactions to the total
number of previous satisfying and dissatisfying interactions and the proportion of

30
previous dissatisfying interactions to the total number of previous satisfying and
dissatisfying interactions.
2.6.8 Trust transitivity
Trust transitivity is considered as the possibility of using trust information from
other entities in order to infer a trust evaluation of a given entity (Alcalde & Mauw,
2010). Thus, trust transitivity is a key concept of the recommendation systems and has
attracted growing interest from researchers in recent years (Dong et al., 2007).
In this scenario, if there are two agents, A and B; inwhich A trusts B, and B
believes that proposition x is true. Then, by transitivity,agent A will also believe that
proposition x is true. Thismeans that B recommends x to A. Thetransitive linking of
these two opinions consists ofdiscounting B’s opinion about x by A’s opinion about B,in
order to derive A’s opinion about x (Bhuiyan et al., 2009). It is also noted that trust is
affected by the length of a chain of recommendations, falling as the chain gets longer,
thereby shorter paths indicate stronger links (O'Hara et al., 2004).
2.6.9 Decision-Making Process
After evaluating the trustworthiness of each agent, a decision-making
mechanism is vital to determine how theagent should be selected as the most
trustworthy agent among all agentsin a standard way. Unfortunately, the most
representative presented methods for evaluating trustworthiness of agents ignores
providing a mechanism for selecting the most trustworthy agent. However, there are a

31
few trust models that propose a decision-making process after calculating the
trustworthiness of agents.
2.7 Related trust models
According to the identified components in section 2.7, each component collected
from existing trust models. In this section, the most representative trust models which
applied these components and proposed methods for computing them are described as
follows.
2.7.1 Dynamic Trust Model
Battiston et al. (2006)presented a dynamic trust model, which provides a simple
formula to evaluate the similarity between the preferences of two agents, with each
agent’s predetermined preference on each item, in the range of -1 to 1. According to this
model, the similarity between the preferences of two agents is computed as follows:
|)|1(, aj
a
aji ffi (2.1)
Where:
ji, represents the similarity between agents i and j
iaf shows the preference value of agent i for each item a
jaf denotes the preference value of agent j in each item a
32
2.7.2 PBTrust Model
the Priority-Based Trust model (PBTrust model) presented by Su et al. (2013)
computes the trustworthiness of potential providers based on the similarities between
the description of the requested service and the reference reports in terms of different
priorities for criteria. The model applies a matrix to denote a service, since the criteria
for both the requested service and the referenced service are of the same order. A
description matrix is a vector that represents priority values for corresponding criteria.
The angle between the directions of two vectors’ is named θ, the dot product of the two
vectors indicates the cosine value of angle θ in mathematics. Since all the priorities of
the criteria are positive numbers and the sum of them is 1, the range of angle θ is 0◦ to
90◦, and the range of cos θ is 0 to 1. If θ = 0 and cos θ = 1 then there is no difference
between the direction of the two vectors and the criteria priorities of the requested
service and the referenced service are the same; hence, the reference can completely
reflect the provider’s performance for the requested service. On the other hand, if θ =
90◦ and cos θ = 0 then there is the largest possible difference between the direction of
the two vectors and the criteria priorities of the requested service and the referenced
service are totally different; hence, the reference cannot reflect the provider’s
performance for the requested service.
However, both of the models PBTrust model (Su et al., 2013) and Dynamic
Trust Model (Battiston et al., 2006)present an applicable method to compute the
similarity between two agents. The PBTrust model (Su et al., 2013) presents a more
complicated method, especially for transferring to programming language codes, while
the Dynamic Trust Model (Battiston et al., 2006) provides a simple method for
measuring the similarity between two agents by evaluating the differences in their
preference values for each criterion.
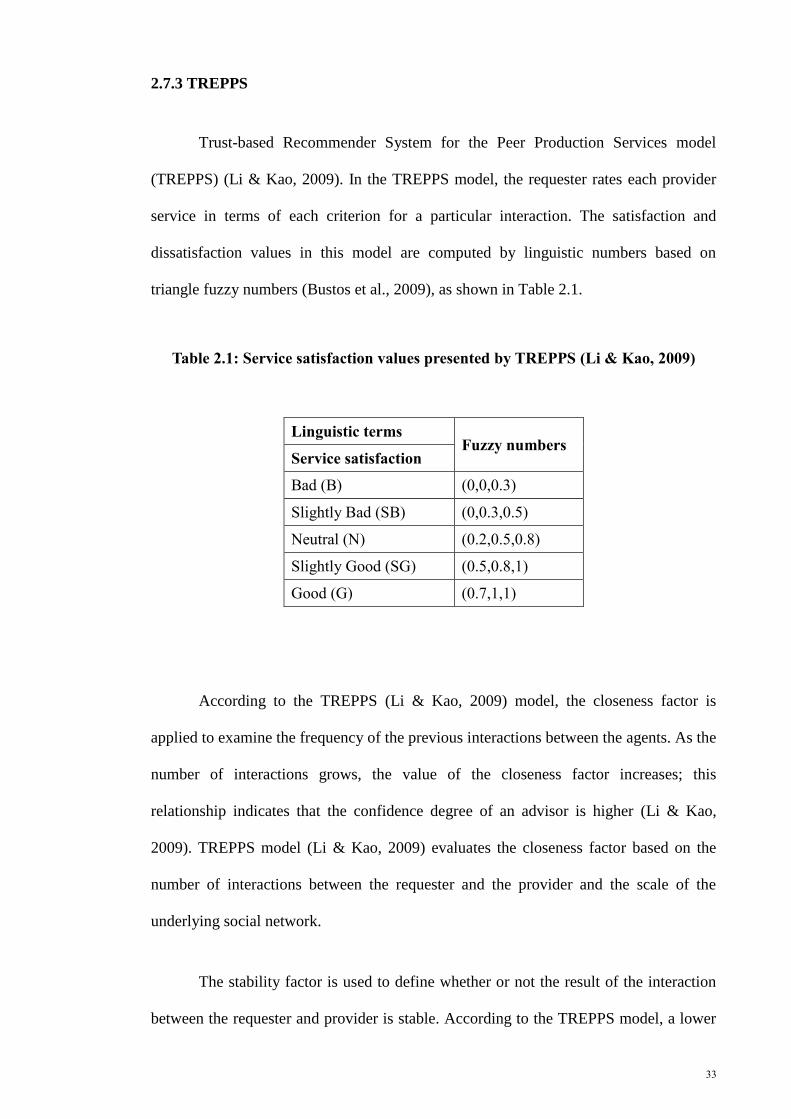
33
2.7.3 TREPPS
Trust-based Recommender System for the Peer Production Services model
(TREPPS) (Li & Kao, 2009). In the TREPPS model, the requester rates each provider
service in terms of each criterion for a particular interaction. The satisfaction and
dissatisfaction values in this model are computed by linguistic numbers based on
triangle fuzzy numbers (Bustos et al., 2009), as shown in Table 2.1.
Table 2.1: Service satisfaction values presented by TREPPS (Li & Kao, 2009)
Linguistic terms Fuzzy numbers
Service satisfaction
Bad (B) (0,0,0.3)
Slightly Bad (SB) (0,0.3,0.5)
Neutral (N) (0.2,0.5,0.8)
Slightly Good (SG) (0.5,0.8,1)
Good (G) (0.7,1,1)
According to the TREPPS (Li & Kao, 2009) model, the closeness factor is
applied to examine the frequency of the previous interactions between the agents. As the
number of interactions grows, the value of the closeness factor increases; this
relationship indicates that the confidence degree of an advisor is higher (Li & Kao,
2009). TREPPS model (Li & Kao, 2009) evaluates the closeness factor based on the
number of interactions between the requester and the provider and the scale of the
underlying social network.
The stability factor is used to define whether or not the result of the interaction
between the requester and provider is stable. According to the TREPPS model, a lower
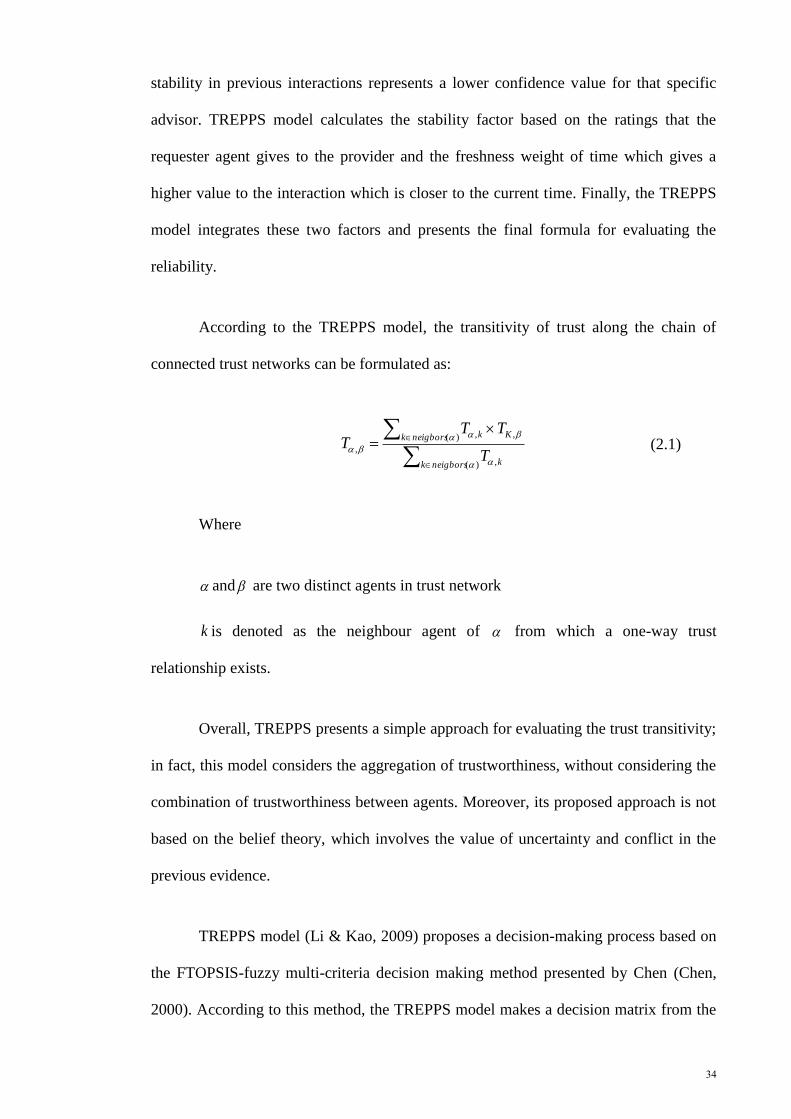
34
stability in previous interactions represents a lower confidence value for that specific
advisor. TREPPS model calculates the stability factor based on the ratings that the
requester agent gives to the provider and the freshness weight of time which gives a
higher value to the interaction which is closer to the current time. Finally, the TREPPS
model integrates these two factors and presents the final formula for evaluating the
reliability.
According to the TREPPS model, the transitivity of trust along the chain of
connected trust networks can be formulated as:
)( ,
)( ,,
,
neigborsk k
neigborsk Kk
T
TTT (2.1)
Where
and are two distinct agents in trust network
k is denoted as the neighbour agent of from which a one-way trust
relationship exists.
Overall, TREPPS presents a simple approach for evaluating the trust transitivity;
in fact, this model considers the aggregation of trustworthiness, without considering the
combination of trustworthiness between agents. Moreover, its proposed approach is not
based on the belief theory, which involves the value of uncertainty and conflict in the
previous evidence.
TREPPS model (Li & Kao, 2009) proposes a decision-making process based on
the FTOPSIS-fuzzy multi-criteria decision making method presented by Chen (Chen,
2000). According to this method, the TREPPS model makes a decision matrix from the

35
trust values of agents for each criterion and also constructs a weighted matrix according
to the importance of each criterion. Then it selects the most trustworthy agent in six
steps, as follows:
Step 1: Normalize the fuzzy decision matrix through the linear scale
transformation in order to transform the various criteria scales into a comparable scale.
Step 2: Construct the weighted normalized fuzzy decision matrix according to
the weight of each criterion.
Step 3: Determine the shortest distance from the positive ideal solution (PIS)
and the farthest from the negative ideal solution (NIS)
Step 4: Compute the distance of each alternative from FPIS and FNIS,
respectively.
Step 5: Compute the closeness coefficient of each alternative.
Step 6: The ranking order of all alternatives is determined at the final step
according to the closeness coefficient and the best service provider can be selected
accordingly.
It seems that TREPPS model (Li & Kao, 2009) proposed an appropriate
decision-making process by using one of the multi-criteria decision-making methods,
such as FTOPSIS. According to this method, the trustworthiness of each agent is
weighted, and then the agent with the maximum ranking can be selected. This method
seems more applicable to find the most trustworthy agent among all the evaluated
agents.
36
2.7.4 FIRE
FIRE model (Huynh et al., 2006; Huynha et al., 2004) considers the range of -1
to +1 for rating each provider agent after each interaction, where -1 means absolutely
negative, +1 means absolutely positive, and 0 means neutral.
FIRE model (Huynh et al., 2006; Huynha et al., 2004) presents two kinds of
reputation mechanism: witness reputation and certified reputation. The witness
reputation of the provider agent is built on observations about its behaviour by other
agents. In order to evaluate the witness reputation of provider, 𝑏, an agent, 𝑎, needs to
find the witnesses that have interacted with provider 𝑏. Then FIRE calculates the
witness reputation as the set of witness ratings that witness agent a gives to agent b .
The certified reputation is the ratings presented by the rated agent b about itself,
that have been obtained from its partners in past interactions (Keung & Griffiths, 2010).
These ratings are based on the certifications presented by agent b about its past
performances. The value of certified reputation is measured with the same method of
witness reputation, while the input is the set of ratings provided by the provider agent b
itself.
The FIRE model evaluates the overall reputation for each provider agent
identified by the others, without considering the ontological structure; however, this
model weights each rating by allocating more weight to more recent ratings.

37
2.7.5 SPORAS
Zacharia (1999)presented the SPORAS model to improve online reputation
models, such as those used in eBay and Amazon auctions. SPORAS (Zacharia, 1999;
Zacharia & Maes, 2000) is a reputation mechanism for a loosely connected environment
in which agents share the same interest. In this model, the reputation value is calculated
by aggregating the opinions of users. The reputation level of an individual is evaluated
after each transaction by collecting feedback ratings from another user involved in the
transaction. This model considered two most recent agents for gathering the rating
values. In addition the ratings applied to measure reputation are discounted over time,
so that recent ratings have more weight
The SPORAS has several limitations. It does not have a mechanism which an
agent can evaluate reputation from the agents that it has more trustworthy (Patel, 2006).
The presented formula by this model can only consider the most recent rating between
two agents without considering the rating from many other agents (Patel, 2006). More
specifically, in this model agents do not have an individual database of their own
ratings, since ratings are deposited centrally. This is not an appropriate method
especially in a dynamic multi-agent environment, in such cases if an agent requires
ratings from the database, it will not have an alternative source of data for those ratings
and the agent will be unable to calculate an effective level of reputation (Patel, 2006).
2.7.6 HISTOS
HISTOS (Zacharia & Maes, 2000) model, which was presented by the same
authors, provides a more personalized or endogenous reputation than SPORAS, which
provides a global reputation. The HISTOS (Zacharia & Maes, 2000) model is more

38
appropriate for highly connected communities by proposing a more personalized
reputation, in which it is based on the principle that an agent trusts its friends more than
strangers. HISTOS (Zacharia & Maes, 2000) applies a directed graph, which is used as
the pair-wise rating, as shown in Figure 2.4, in which the nodes represent the agents, the
weighted edges refer to the latest reputation values, and the direction of the edge shows
the rated agent (Medić, 2012).
Figure 2.4: HISTOS directed graph (Zacharia & Maes, 2000)
According to this model, the agent A0 computes reputation level of A1(3), if a
path exists from A0 to A1(3) and if the search to discover a path connections in the
algorithm fails, the SPORAS mechanism will be applied to evaluate the reputation level.
Applying HISTOS is not possible in a large-scale open system because it is
difficult to draw a global graph between agents. While many agents will have a local
view of the entire system and they may be able to construct a social graph by using this
local information, in this context, HISTOS algorithm will fail to deliver the desired
results (Patel, 2006).

39
2.7.7 TRR
An integrated reliability-reputation model for the agent societies (TRR) model
(Rosaci et al., 2011), combines the trustworthiness of the rater agent and reputation in a
synthetic trust model. This model considers one issue, which exists in measuring the
reputation of agents by evaluating the trustworthiness of an agent that rates the other
agents. In this model, the reputation of each agent is computed based on the ratings
given by other agents that have had previous interactions with it and the trustworthiness
of the rater agents. In this case, the ratings reported by highly trustworthy agents have
higher values than the ratings reported by agents with lower trust. Thereby, the rater
agents with less trustworthiness have less effect on the evaluation of reputation.
However, TRR considers the trustworthiness of the rater agent in its presented
formula for evaluating the reputation of the provider agent. It seems that this model
considers the satisfaction rate of each provider agent from the perspective of other
agents, without considering dissatisfaction rates. Moreover, this model did not consider
the ontological structure with different weights for different aspects of interaction.
2.7.8 REGRET
The REGRET model (Sabater & Sierra, 2001b) calculates the reputation in three
specialized types depending on the information source that is applied to compute
reputation, as:
– Witness reputation, which is calculated from the information coming from the
witness agents

40
– Neighbourhood reputation, which is measured using the information extracted
from the social relations between partners
– System reputation, which is based on the roles and general properties
Moreover, the REGRET model incorporates a credibility value that allows the
agent to measure the reliability of the witnesses.
The REGRET model has an ontological structure. In fact, this model considers
that reputation has no single and abstract concepts but rather multi-facet concepts. The
ontological interactions come from a combination of multiple aspects. REGRET
computes the ontological dimension through graph structures similar to the one shown
in Figure 2.5.
Figure 2.5: The ontological structure (Sabater & Sierra, 2001c)
The diagram illustrates that a good seller reputation value is related to the
reputation of a product quality, product delivery date and customer service, where agent
A gives distinct reputation values to each aspect of agent B as a seller. For instance,
Figure 2.5 shows that good (seller) has been given a high reputation value for product
quality, whereas low values are given for delivery date and product price.
Product Quality
Delivery Date 0.2
0.6
Good Seller
Product Price 0.2

41
Hence, the reputation value of each aspect should be evaluated separately using
the individual or social dimensions, and the values of these reputations are then
combined to constitute the ontological reputation
The advantage of the REGRET model is that it examines the reliability of the
computed reputation regarding the number of agents used to calculate the reputation of
provider agent and the interaction frequency of the rater agents. Finally, the REGRET
model presents a stronger reputation system by considering the ontological structure. In
this model, the reputation value has an associated reliability measure.
2.7.9 TNA-SL
The Trust Network Analysis with Subjective Logic (TNA-SL) model presented
by Jøsang et al. (2006) divides the outcomes of each interaction into a binary event,
satisfying and dissatisfying interactions. The TNA-SL measures the belief of each agent
as:
2
sr
rb (2.1)
Where:
b shows the belief value of a specific agent
r denotes the number of previous satisfying interactions
s represents the number of previous dissatisfying interactions
Moreover, the TNA-SL model calculates the disbelief of each agent as:

42
2
sr
sd (2.2)
Where:
d indicates the disbelief value of a specific agent
r shows the number of previous satisfying interactions
s represents the number of previous dissatisfying interactions
2.7.10 Probability Certainty Distribution Model
Probability Certainty Distribution Model (Wang & Singh, 2006a) places the
value of certainty on its proposed method, while the basis of its evaluation is the
subjective logic based on the numbers of satisfying and dissatisfying interactions, as
follows:
2
1
sr
rcb (2.3)
Where:
b indicates the belief value of a specific agent
c denotes the certainty value of an agent’s interaction outcomes
r denotes the number of previous satisfying interactions
s represents the number of previous dissatisfying interactions
In addition, this model computes the disbelief of each agent as:
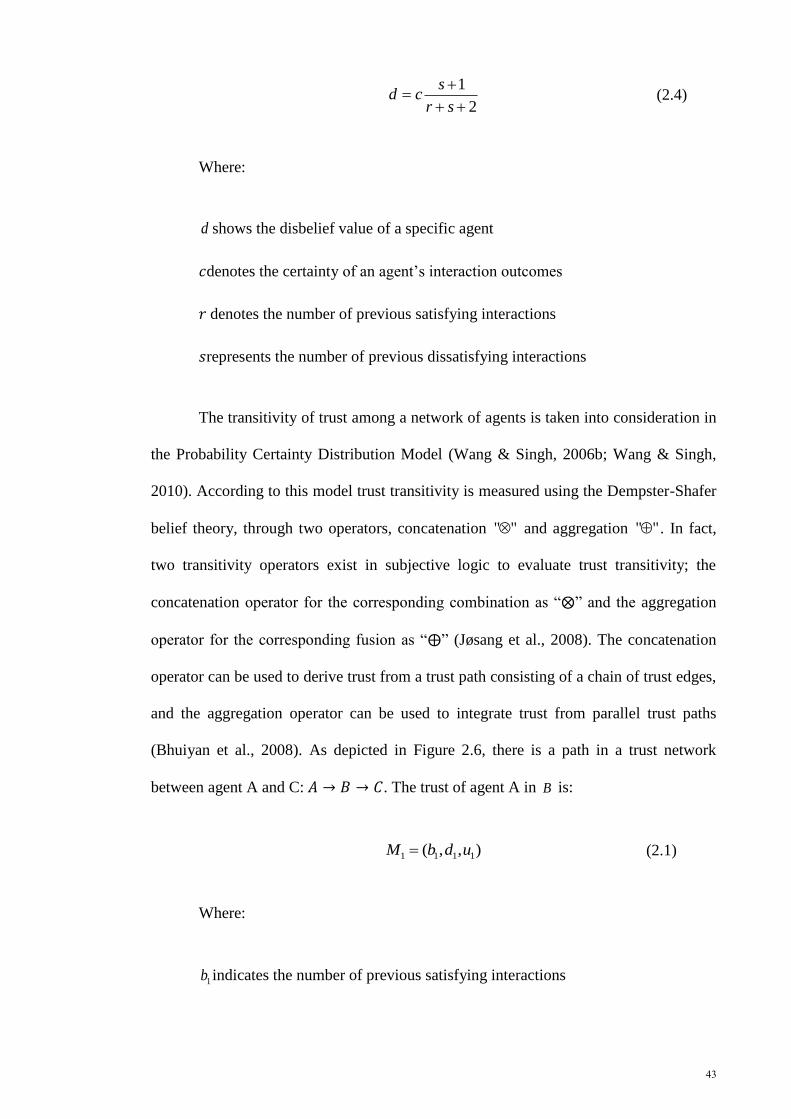
43
2
1
sr
scd (2.4)
Where:
d shows the disbelief value of a specific agent
𝑐denotes the certainty of an agent’s interaction outcomes
𝑟 denotes the number of previous satisfying interactions
𝑠represents the number of previous dissatisfying interactions
The transitivity of trust among a network of agents is taken into consideration in
the Probability Certainty Distribution Model (Wang & Singh, 2006b; Wang & Singh,
2010). According to this model trust transitivity is measured using the Dempster-Shafer
belief theory, through two operators, concatenation "" and aggregation "" . In fact,
two transitivity operators exist in subjective logic to evaluate trust transitivity; the
concatenation operator for the corresponding combination as “⨂” and the aggregation
operator for the corresponding fusion as “⨁” (Jøsang et al., 2008). The concatenation
operator can be used to derive trust from a trust path consisting of a chain of trust edges,
and the aggregation operator can be used to integrate trust from parallel trust paths
(Bhuiyan et al., 2008). As depicted in Figure 2.6, there is a path in a trust network
between agent A and C: 𝐴 → 𝐵 → 𝐶. The trust of agent A in B is:
),,( 1111 udbM (2.1)
Where:
1b indicates the number of previous satisfying interactions

44
1d shows the number of previous dissatisfying interactions
1u represents the amount of uncertainty
Figure 2.6: A multi-agent path between agent A and C
Similarly, the trust of B in C is 2M where ),,( 2222 udbM . Then the transitivity
of trust in this chain of agents is computed by the concatenation operator, as follows:
2121
21
21
21
1
),,(
dbbbu
ddd
bbb
udbMM (2.2)
Where:
b is the number of previous satisfying interactions
d is the number of previous dissatisfying interactions
u is the amount of uncertainty of agent’s interaction outcomes
On the other hand, Figure 2.7 illustrates the situation where agent A has more
than one neighbour.
Figure 2.7: Two multi-agent paths from agent A
b A
b b B C
M1 M2
b
b b C
A
B
1M
2M
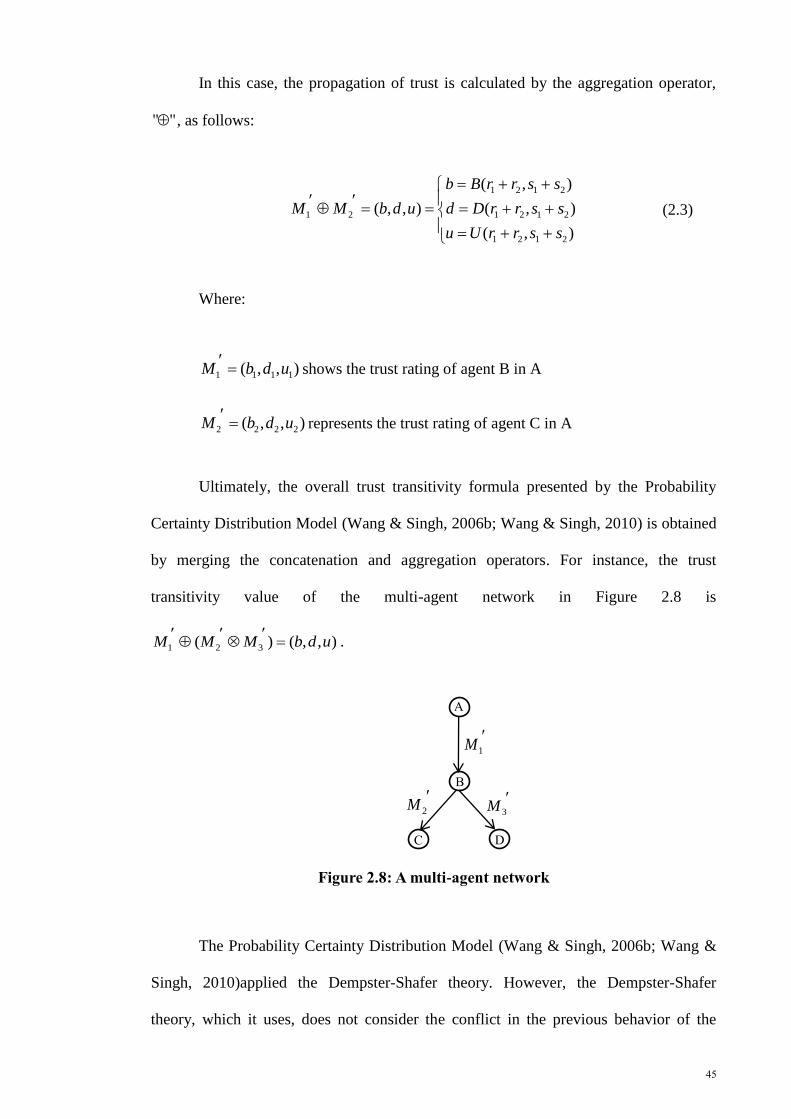
45
b
In this case, the propagation of trust is calculated by the aggregation operator,
"" , as follows:
),(
),(
),(
),,(
2121
2121
2121
21
ssrrUu
ssrrDd
ssrrBb
udbMM (2.3)
Where:
),,( 1111 udbM
shows the trust rating of agent B in A
),,( 2222 udbM
represents the trust rating of agent C in A
Ultimately, the overall trust transitivity formula presented by the Probability
Certainty Distribution Model (Wang & Singh, 2006b; Wang & Singh, 2010) is obtained
by merging the concatenation and aggregation operators. For instance, the trust
transitivity value of the multi-agent network in Figure 2.8 is
),,()( 321 udbMMM
.
Figure 2.8: A multi-agent network
The Probability Certainty Distribution Model (Wang & Singh, 2006b; Wang &
Singh, 2010)applied the Dempster-Shafer theory. However, the Dempster-Shafer
theory, which it uses, does not consider the conflict in the previous behavior of the
D C
A
b b
b B
1M
2M
3M

46
agents. Therefore, the extension method of the Dempster-Shafer theory, called the
Dezert-Smarandache Theory, is presented to measure the conflict in the previous
behaviour of the agents. In fact, the Dezert-Smarandache Theory was developed for
dealing with imprecise, uncertain and also paradoxical sources of information
(Smarandache & Dezert, 2006).
2.7.11 Evidence-based Trust Model
Evidence-based trust model (Wang & Singh, 2010) measures the probability of
uncertainty based on two elements, positive and negative outcomes (Hang et al., 2008;
Wang & Singh, 2010). In this model, the outcomes of the interactions are divided into
positive and negative, as 0,0|),( srsrE where the pair ),( sr shows the amount
of positive (satisfying) and negative (dissatisfying) outcomes of past interactions,
respectively.
This model presents the following formula for evaluating uncertainty based on
the probability theory as:
cu 1 (2.1)
Where:
u indicates the uncertainty of the agent’s interaction outcomes
dxxx
xxc
sr
sr
1
0 1
0
|1)1(
)1(|
2
1denotes the certainty of the agent’s interaction
outcomes
r represents the number of previous satisfying interactions

47
s shows the number of previous dissatisfying interactions
This model presents an applicable method for evaluating uncertainty based on
the posterior probability of a binary event, and positive and negative outcomes.
The Evidence-Based Trust Model (Wang & Singh, 2010) calculates the conflict
in previous behaviour of agents as follows:
2
1
t
s (2.1)
Where:
s represents the number of previous satisfying interactions
t is the total number of previous satisfying and dissatisfying interactions
While, )1,0( , if approaches to 0 or 1 means unanimity, otherwise, if
5.0 it means the number of satisfying interactions is equal to the number of
unsatisfying interactions, which indicates the maximum conflict in evidence.
2.7.12 New Evidential Trust Model
New Evidential Trust Model(Wang & Sun, 2009) used the Dezert-Smarandache
Theory for evaluating trust transitivity based on four variables – belief, disbelief,
uncertainty and conflict.This model is based on the set, , considering },{ TT
which is the general frame of discernment based on two hypotheses: T (agent, a, trusts
agent, b) and T (agent, a, distrusts agent, b). The set D is defined as
},,,,{ TTTT .

48
Moreover, a general basic belief assignment (gbba) is a function as follows:
]1,0[ Dm (2.4)
Where:
DAAm
m
1)(
0)(
Thus, 1})({})({})(})({ TTmmTmTm
Then, the New evidential trust model (Wang & Sun, 2009) describes the trust
evaluation of agent, A, to agent, B, by the gbba m(.) as:
})({Tm describes value of trust.
})( Tm represents the value of distrust.
})({m denotes the value of uncertainty, where the uncertainty here means a
lack of evidence. If A has no evidence at all, then 1})({ m , and if agent A gets more
evidence, 1})({ m .
})({ TTm is the value of conflict caused by paradoxical behaviour.
Suppose advisor, a, evaluates the trustworthiness of agent, b, as:
))(),(),(),(()( bababababa mTTmTmTmT (2.5)
This situation is shown in Figure 2.9.

49
Figure 2.9: Trust combination
andb's trust evaluation of agent, c, is as follows:
))(),(),(),(()( cbcbcbcbcb mTTmTmTmT (2.6)
Then the New evidential trust model (Wang & Sun, 2009) calculates the trust
combination through this referral chain as follows:
cbbaca TTT (2.7)
Where:
})({}))({})({(})({ TmTTmTmTm cbbabaca
})({}))({})({(})({ TmTTmTmTm cbbabaca
})({}))({})({(})({ TTmTTmTmTTm cbbabaca
})({})({})({(1})({ TTmTmTmm cacacaca
On the other hand, suppose 1m and 2m are two independent gbba over the same
general discernment frame Θ, as shown in Figure 2.10.
Figure 2.10: Trust aggregation
A
B C
b A
b A
b
B C

50
Then, New evidential trust model (Wang & Sun, 2009) computes the trust
aggregation as follows:
CBADBA
BmAmBmAmcm,
2121 )()()()()( (2.8)
Where:
))(),(),(),(()( acacacac mTTmTmTmAm
))(),(),(),(()( bcbcbcbc mTTmTmTmBm
Evidence-based trust model (Wang & Singh, 2010) considers three situations for
selecting the most trustworthy agent, as follows:
i. The agent is trustworthy if belief is high, disbelief is low and uncertainty is low.
ii. The agent is untrustworthy if belief is low, disbelief is high and uncertainty is
low.
iii. Moreover, a lack of trust is placed on an agent where belief is low, disbelief is
low and uncertainty is high.
It seems that this method can fail in a situation where the model uses other
components like conflict for evaluating the trustworthiness of agents. For instance, these
three conditions are not applicable in models, such as the New Evidential Trust Model,
which evaluate the trustworthiness of agents based on belief, disbelief, uncertainty and
the conflict of agents. If more than one agent has the belief value higher than disbelief
then selecting one of them as the most trustworthy one is not cleared. Unless the system
order the gents based on their belief values and selects the agent with the highest belief
value as the most trustworthy provider.

51
The comparative analysis of the existing trust models which were studied in this
research is described in Table. 2.2.

52
Table 2.2: Comparative analysis of related trust models
Models Author Similarity Satisfaction Reliability Reputation Belief &
Disbelief Uncertainty Conflict
Trust
Transitivity
Decision
-making Advantage Disadvantage
Dynamic
Trust
Model
Battiston
et al.
(2006)
Different
preference
s between
two agents
N/A N/A N/A N/A N/A N/A N/A N/A
Present a
simple
formula for
evaluating
similarity
N/A
PBTrust
Model
Su et al.
(2013)
Different
priorities
between
two agents
N/A N/A N/A N/A N/A N/A N/A N/A N/A
Present a
complicate
formula for
evaluating
similarity
TREPPS
Li and
Kao
(2009)
N/A
Using
Linguistic
numbers
Closeness
and
Stability
factor
based on
previous
satisfying
interaction
s
N/A N/A N/A N/A
Combination
trustworthin
ess between
agents
FTOPSI
S
method
- Closeness
and
stability
factor
- Using
multi
criteria
decision-
making
process
Combination
trustworthiness
between agents
FIRE Huynh et
al. (2006) N/A
Rage of -1
to +1
Closeness
and
Stability
factor
based on
previous
Witness
Reputation
that other
agents rate,
Certified
Reputation
N/A N/A N/A N/A N/A
- Closeness
and
Stability
factor
-
Calculating
N/A

53
Models Author Similarity Satisfaction Reliability Reputation Belief &
Disbelief Uncertainty Conflict
Trust
Transitivity
Decision
-making Advantage Disadvantage
satisfying
interaction
s
that each
agent
presents its
own rate
(Recent
rating have
more
weight)
reputation
considering
to the more
weight
recent
ratings
SPORAS Zacharia
(1999) N/A N/A N/A
Aggregating
the opinion
of other
agents
(Recent
rating have
more
weight)
N/A N/A N/A N/A N/A
-
Calculating
reputation
considering
to the more
weight
recent
ratings
N/A
HISTOS
Zacharia
and Maes
(2000)
N/A N/A N/A
Using a
directed
graph for
gathering
the opinion
of other
agents
N/A N/A N/A N/A N/A N/A
Using a
directed graph
for gathering
the opinion of
other agents
TRR Rosaci et
al. (2011) N/A N/A N/A
Aggregating
the opinion
of other
agents
(Reliability
of rater
agents are
considered)
N/A N/A N/A N/A N/A
- Reliability
of rater
agents are
considered
for
evaluating
the
reputation
N/A

54
Models Author Similarity Satisfaction Reliability Reputation Belief &
Disbelief Uncertainty Conflict
Trust
Transitivity
Decision
-making Advantage Disadvantage
REGRET
Sabater
and Sierra
(2001b)
N/A N/A N/A
Aggregating
the opinion
of other
agents
Considering
ontological
dimension
(Reliability
of rater
agent is
considered)
N/A N/A N/A N/A N/A
-
Considering
ontological
dimension
in
evaluating
the
reputation
- Reliability
of rater
agents are
considered
for
evaluating
the
reputation
N/A
TNA-SL Jøsang et
al. (2006) N/A N/A N/A N/A
Divide
each
interactio
n into
binary
events
(Satisfyin
g
interactio
ns as
belief
and
dissatisfy
ing
interactio
N/A N/A N/A N/A N/A
Combination
and
aggregation
between agents
by considering
3 variables as;
Belief,
Disbelief and
Uncertainty

55
Models Author Similarity Satisfaction Reliability Reputation Belief &
Disbelief Uncertainty Conflict
Trust
Transitivity
Decision
-making Advantage Disadvantage
ns as
disbelief)
Probability
Certainty
Distribution
Wang and
Singh
(2006a)
N/A N/A N/A N/A
Divide
each
interactio
n into
binary
events
(Satisfyin
g
interactio
ns as
belief
and
dissatisfy
ing
interactio
ns as
disbelief)
N/A N/A
Combination
and
aggregation
between
agents by
using Belief,
Disbelief
and
Uncertainty
N/A N/A
Combination
and
aggregation
between agents
by considering
3 variables as;
Belief,
Disbelief and
Uncertainty
Evidence-
based Trust
Model
Wang and
Singh
(2010)
N/A N/A N/A N/A
Divide
each
interactio
n into
binary
events
(Satisfyin
g
interactio
ns as
belief
and
Base on
certainty
value which
computes by
the posterior
probability
of previous
satisfying
and dis
satisfying
interactions
Minimu
m of the
proportio
n of
previous
satisfying
interactio
ns to the
total
number
of
previous
N/A N/A
-
Calculating
uncertainty
by the
posterior
probability
of previous
satisfying
and dis
satisfying
interactions
-
N/A

56
Models Author Similarity Satisfaction Reliability Reputation Belief &
Disbelief Uncertainty Conflict
Trust
Transitivity
Decision
-making Advantage Disadvantage
dissatisfy
ing
interactio
ns as
disbelief)
satisfying
and dis
satisfying
interactio
ns
Computing
conflict
considering
the
numbers of
previous
satisfying
and dis
satisfying
interaction
New
Evidential
Trust
Model
Wang
and Sun
(2009)
N/A N/A N/A N/A N/A N/A N/A
Combinatio
n and
aggregation
between
agents by
using
Belief,
Disbelief
and
Uncertainty
and
Conflict
N/A
Combinati
on and
aggregatio
n between
agents by
considerin
g 4
variables;
Belief,
Disbelief,
Uncertaint
y and
Conflict
N/A

57
2.8 Initial structure of TMAN
According to the analysis of the related trust models in the second part, this
analysis of the literature led to the forming of the initial structure of TMAN, as shown
in Figure 2.11

58
Figure 2.11 Required components for TMAN
Trust evaluation of similar advisor agent
Belief
Reliability
Reputation
Conflict Uncertainty Disbelief
Unreliability
Disrepute
Trust evaluation of suggested provider agent
Belief
Reliability
Reputation
Conflict Uncertainty Disbelief
Unreliability
Disrepute
Trust transitivity
Similarity
Satisfaction Dissatisfaction
Satisfaction Dissatisfaction
59
As shown in Figure 2.11, first the requester should check the similarity between
the agents and itself(Battiston et al., 2006; Su et al., 2013). Then, to evaluate the
trustworthiness of each similar agent and its suggested provider according to Dezert-
Smarandache Theory(Wang & Sun, 2009), four components should be considered –
belief, disbelief, uncertainty and conflict. To measure the belief value of each advisor
and provider(Jøsang et al., 2006; Wang & Singh, 2006a, 2010), the reliability (Huynh et
al., 2006; Li & Kao, 2009)and reputation of agents (Huynha et al., 2004; Rosaci et al.,
2011; Sabater & Sierra, 2001b; Zacharia & Maes, 2000)are calculated based on the
previous satisfying interactions, and, to compute the disbelief of agents, the unreliability
and disrepute of agents are calculated based on the previous dissatisfying interactions.
Then the uncertainty and conflict of each agent are evaluated based on both the
satisfying and dissatisfying interactions. This leads to obtaining the trustworthiness of
each advisor and its suggested provider based on belief, disbelief, uncertainty, and
conflict. Finally, the transitivity of trust from the advisor agents to its suggested
provider agent is evaluated based on the obtained trustworthiness of the advisor and the
suggested provider.
2.9 Summary
In this chapter, the literature was reviewed from the domains of trust models.
First, the concepts of multi-agent system, advisor agents and trust models in multi-agent
systems were described. Then, the main components presented by the most
representative trust models were introduced, along with a summary of several examples,
to address some of the requirements for designing a trust model.

60
According to the analysis of the most representative trust models, similarity,
satisfaction/dissatisfaction, reliability, reputation, belief/disbelief, uncertainty, conflict,
trust transitivity, and, finally, decision-making process were identified as essential
components for designing a trust model. However, two more components – unreliability
and disrepute – were introduced, which can be considered based on dissatisfying
interactions to evaluate the disbelief of how much an agent cannot be trusted. These
components cover the first objective of this research, which was identifying the main
components that can be used to present a trust model for advisor networks in a multi-
agent environment.

61
CHAPTER 3: RESEARCH METHODOLOGY
3.1 Introduction
This chapter starts by describing the research methodology employed in this
project, followed by the research methodology strategy used to present a mechanism to
detect the trustworthy provider according to advice of benevolent advisors in an advisor
network.
The methodology of this research consists of three main phases, where each
phase has its own activities as explained in the following sections. In the first part, the
methodology used to collect and select the necessary components for presenting TMAN
is described; this phase was used to determine the components of TMAN and how these
components can be measured. This phase also addresses the first objective of this
research by identifying the main components that can be used to present a trust model
for advisor networks in a multi-agent environment. In the second phase of this research
methodology, the performance of TMAN is explained based on components identified
in the first phase. In fact, this phase leads to the proposed TMAN and deals with the
second objective of this research by building a trust model based on the components
identified to recognize trustworthy provider according to advice of benevolent advisors.
The final phase involves evaluation of the performance of TMAN to investigate whether
TMAN can accurately select the most trustworthy provider according to advice of
benevolent advisors, in different multi-agent environments and with various numbers of
benevolent and malicious agents. This phase proved the accuracy of TMAN and
revealed that TMAN can be applied to an e-commerce multi-agent environment to

62
create a safe environment for transactions; this phase addresses the final objective of
this research by evaluating the accuracy of the proposed trust model for advisor
networks. Figure 3.1 shows the different phases of the research methodology in a flow
chart.
Figure 3.1: Research methodology phases
As shown in Figure 3.1, this research is based on three main phases to achieve
the objectives which are necessary to complete the project plan. Each of these phases
involves different steps as described in the following sections. The purpose of the first
Begin
Phase 1: Identify the components of TMAN
Phase 2: Propose TMAN
Phase 3: Testing and evaluation of
TMAN
Meet the objectives?
End
Yes
NO

63
phase is identifying the main components which can be applied for designing TMAN, to
accomplish this phase the most representative trust models were analyzed and the
components which they used and their proposed methods for evaluating each
component were compared. This phase helped to design TMAN according to the
identified components. In the next phase, TMAN was designed based on the
relationship between identified components using mathematical theory, Dezert-
Smarandache Theory (Wang & Sun, 2009), and a mathematical method for selection the
most trustworthy provider. This phase led to achieve the second objective of this study.
Finally, in the last phase of research methodology TMAN was evaluated, the purpose of
this phase was investigated the accuracy TMAN in different multi-agent environment.
This phase has two sub activities as: random selection and trade network game that are
two different methods used for evaluating the accuracy of TMAN. Each of these phases
is explained in more details in the following sections.
3.2 Phase 1: Identify the components of TMAN
In this step, many trust models were searched for and investigated in multi-agent
systems to collect the main components which should be considered when designing a
trust model. At the end of this step, based on the review of the related literature, the
main components of existing trust models in multi-agent systems were identified.
Chapter 2 has presented the results of analyzing the existing trust models and has
identified the main components which are essential for designing a trust model in a
multi-agent environment. This chapter also investigated different methods of computing
these identified components. According to Chapter 2, the identified components that are
important for proposing TMAN are:

64
Similarity, Satisfaction, Dissatisfaction, Reliability, Unreliability, Reputation,
Disrepute, Belief, Disbelief, Uncertainty, Conflict, and Trust Transitivity
The definition of each component has been discussed thoroughly in Chapter 2.
In addition, Chapter 2 presented different methods that the most representative trust
models provided for evaluating each component. In the next section of this chapter, the
methods selected by TMAN according to these models are explained.
According to analysis existing trust models, methods of computing each selected
components were collected, these methods applied different mathematical theory like
probability theory and subjective theory. To select the proper method for evaluating
each component the strong and weaknesses point of each method was investigated as
described in the following sections.
3.2.1 Computing Similarity
As described in chapter 2, Dynamic Trust Model (Battiston et al., 2006)
provides an applicable method in measuring the similarity between agents by computing
the differences between preferences of two agents. Hence, the method provided by the
Dynamic Trust Model in evaluating the similarity between requester and each advisor
are adopted by TMAN.
3.2.2 Computing Satisfaction/Dissatisfaction
According to linguistic terms, the behavior of an agent in each interaction can
have a different level of satisfaction or dissatisfaction, such as slightly good or slightly

65
bad like TREPPS model (Li & Kao, 2009). It seems that rating each interaction using
linguistic terms is meaningful according to the range of rating such as the rating
between 0 and 1. If this range is considered between 0 and 1, then it seems that
separating the range of dissatisfying interactions from neutral interactions and satisfying
interactions is difficult. The FIRE (Huynh et al., 2006; Huynha et al., 2004) and
REGRET (Sabater & Sierra, 2001a) models considered the range of rating between -1
and 1, the previous satisfying interactions is ranged in [1,0), and previous dissatisfying
interactions is ranged between (0,-1], and 0 represents the neutral behavior of agents. In
this case, presenting other computation formulas like reliability and unreliability that
use satisfying and dissatisfying rates of the agent, respectively, can be proposed easily.
Therefore, TMAN applies the range of [-1,1] for evaluating the rate of each interaction.
In fact, TMAN considered four linguistic terms and four ranges to evaluate each
linguistic term, as follows:
Linguistic term Range
Good [1,0.5)
Slightly good [0.5,0)
Neutral 0
Slightly bad (0,-0.5]
Bad (-0.5,1]
Table 3.1: Proposed satisfaction and dissatisfaction rates by TMAN
3.2.3 Computing Reliability/Unreliability
As described in Chapter 2, the most representative trust models evaluated the
reliability of each agent based on two factors; closeness and stability factors (Li & Kao,
2009). According to the definition of closeness factor, it is applied to examine the

66
frequency of previous interactions between the agents. While the FIRE model evaluated
the closeness factor based on a threshold, unfortunately it did not describe how to
measure that threshold clearly; meanwhile, TREPPS presented a more appropriate and
clear method, but its presented formula did not consider separate formulas for
evaluating reliability and unreliability. In the proposed model, TMAN, the closeness
factor is calculated based on the frequency of previous satisfying interactions; this is
because of considering two separate formulas for evaluating reliability and unreliability.
In fact, the closeness factor of reliability is measured based on the frequency of
satisfying previous interactions of an agent relative to the total number of previous
interactions.
Another factor is stability, which is used to define whether the result of
interaction between requester and provider is stable or not. FIRE measured the stability
factor based on the interaction rate in the range of [-1,1]; TREPPS proposed the same
method, but it is based on interaction rate in the range of [0,1]. Two separate formulas
were considered by TMAN; one formula evaluates reliability of agents based on its
previous satisfying interactions in the range of (0,1] and another formula evaluates the
unreliability based on previous dissatisfying interactions in the range of [-1,0), where 0
represents the neutral rates. Hence, for evaluating reliability, TMAN uses the method
presented by the TREPPS model, in the range of (0,1] stability factor.
On the other hand, the unreliability is measured by evaluating closeness and
stability factor. However, in this case, the closeness and stability factor are computed
based on the dissatisfaction rates of previous interactions in the range of [-1,0).

67
3.2.4 Computing Reputation/Disrepute
Various methods have been presented for evaluating reputation; in fact,
reputation is a component that has been considered more than other components by
existing trust models. Each method has used several variables. The main variables that
have been applied by the most representative models, as described in Chapter 2, are as
follows:
i. Trustworthiness of rater agent (Rosaci et al., 2011)
ii. The rates that other agents give to the rated agent (Huynha et al., 2004; Rosaci et
al., 2011; Sabater & Sierra, 2001b)
iii. The weight for each rating by assigning more weight to more recent interactions
(Huynha et al., 2004)
iv. The weight for each aspect of service as an importance of that aspect of service
(Sabater & Sierra, 2001b)
v. The interaction frequency of the rater agents with rated agent (Sabater & Sierra,
2001b)
vi. The number of rater agents (Sabater & Sierra, 2001b)
All above variables were applied by TMAN to evaluate the reputation of each
agent. According to TRR model (Rosaci et al., 2011), which considered the
trustworthiness of rater agents; TMAN used the reliability of rater agent instead of
trustworthiness of those agents. Like TRR model, the belief is that, if the rater is
reliable, the rate presented by that agent is considered as an accurate rate. Moreover, the
reputation formula, presented by TMAN, applied the satisfaction rates that advisors
gave to the rated agent, in the range of (0,1]; this includes the weight for each rating by
assigning more weight to more recent interactions that advisor had with the rated agent.

68
Moreover TMAN considered the weight for each aspect of service as an importance of
that service, and also the interaction frequency that rater advisors experienced with the
rated agent.
In addition, TMAN considered the number of advisors that rate the rated agent.
In fact, the belief is that the growth in the number of advisors that rated the specific
agent increases the reputation value of that rated agent.
On the other hand, disrepute value of each agent should be also calculated
together with reputation value. Therefore, disrepute of each advisor is computed by
using the variables which applied for evaluating reputation as; reliability of rater agents,
the rating that each rater advisor give to the rated agent, the weight for each rating by
assigning more weight to more recent interactions that advisor had with the rated agent,
the weight for each aspect of service as an importance of that service, the interaction
frequency that rater advisors experienced with the rated agent, and also the number of
advisors that rate the rated agent. But these variables are calculated based on the
previous dissatisfaction rates that advisors gave to the rated agents, in the range of [-
1,0).
3.2.5 Computing Belief/Disbelief
The existing trust models which used the belief theory to evaluate the
trustworthiness of agents, calculated the belief and disbelief of agents based on the
number of previous satisfying and dissatisfying interactions respectively. TMAN
evaluates the belief of agents, which shows how well that agent can be trusted by using
the weighted mean of the computed reliability and reputation value for that agent. On
the other hand, the TRR model presented the weighted mean for integrating reliability

69
and reputation of each agent to investigate how well that agent can be trusted. In fact,
TRR model evaluated the trustworthiness of each agent as a weighted mean between
reliability and reputation. This weighted mean is based on the number of previous
interactions between requester and provider, and also expertise level that requester has
in evaluating the specific service. TMAN calculates the belief of each agent based on
reliability and reputation of the agent and uses the weighted mean between reliability
and reputation of each agent. This weighted mean is based on the number of previous
interactions and the knowledge of requester about each agent.
TMAN also evaluates disbelief of each agent based on the weighted mean of the
computed unreliability and disrepute.
3.2.6 Computing Uncertainty
The trust models which used the Dempster-Shafer theory evaluated
trustworthiness of the agent based on belief, disbelief and uncertainty of that agent. This
means that these models evaluated the trustworthiness of agents based on three
variables: how well the agent can be trusted (belief), how well the agent cannot be
trusted (disbelief) and uncertainty in the agent’s outcomes. Based on these models, two
methods were presented for evaluating uncertainty; the first method uses the concept of
the set theory and considered the value of conflict is always zero. As described in
Chapter 2, this method seems not to be applicable in light of the new subjective logic
theory, the Dezert-Smarandache theory which is able to handle both uncertainty and
conflict. According to this theory, the value of conflict is not always zero. The other
kinds of models like the Evidence-based trust model (Wang & Singh, 2010) as
described in Chapter 2 presented an applicable method for evaluating uncertainty by

70
using the posterior probability theory. According to this method, the value of conflict is
not always zero.
Therefore, TMAN applies the method presented by Evidence-based trust model
for evaluating uncertainty by using the posterior probability as explained in Chapter 2.
3.2.7 Computing Conflict
According to analysis of the most representative trust models, conflict is a
concept which has been ignored by most of the existing trust models. Evidence-based
trust model (Wang & Singh, 2010)presented a simple formula to evaluate the conflict in
behaviors of agents. TMAN also uses the formula presented by Evidence-based trust
model for evaluating the conflict based on the number of previous satisfying and
dissatisfying interactions.
3.2.8 Computing Trust transitivity
As mentioned in Chapter 2, subjective logic defined two operators for
transitivity of trust, which are combination and aggregation operators. However, there
are two theories based on subjective logic that reflects trust transitivity based on those
operators: Dempster-Shafer theory and Dezert-Smarandache theory. Since the Dezert-
Smarandache theory is a new theory which can support conflict as well as uncertainty,
most of the existing models applied the Dempster-Shafer theory like Evidence-based
trust model (Wang & Singh, 2010). Nevertheless, there is a model known as New
evidential trust model (Wang & Sun, 2009), which identified the advantage of the
Dezert-Smarandache theory and also evaluated trust transitivity based on this theory.

71
Therefore,TMAN uses this new theory for evaluating trust transitivity based on belief,
disbelief, uncertainty and also conflic, because this method can support conflict as well
as uncertainty.
3.2.9 Computing Decision-making process
This concept has been investigated by a few existing trust models like
(TREPPS) (Li & Kao, 2009). The most representative trust models presented a
mechanism for evaluating the trustworthiness of agents; however, it did not indicate
how the requester can select the most trustworthy agent if there are several trustworthy
agents. It seems that TREPPS used a very applicable method. In fact, this model used
one of the existing methods of multi-criteria decision-making methods known as
FTOPSIS. In fact, this method is used specially for fuzzy numbers.
Thus, TMAN applies the TOPSIS method for normal numbers for selecting the
most trustworthy provider among all evaluated providers. However, the method
presented by TMAN is a little different from that of TREPPS. In fact, TREPPS
introduced the weighted matrix according to the weight of each criterion, while TMAN
used the entropy method to construct the weighted matrix.
At the end of this part of research methodology, the components involved in
designing TMAN and the methods of computing each component were identified
according to the most representative trust models that were described in Chapter 2. As
explained earlier, this part addresses the first objective of this research by identifying
the main components for designing TMAN based on the review of related literature.

72
In the next phase of research methodology, the structure of TMAN was
proposed by using the identified components and the method of computing these
components.
3.3 Phase 2: Design of TMAN
In the second phase, TMAN was designed based on the identified components.
The methods of computing each component achieved from analyzing the most
representative trust models in multi-agent environment as described in the first phase of
research methodology.
The relationship between the identified components led to design TMAN. To
create this relationship, the mathematical theories and also the relationship which
proposed by trust models were applied. According to the most representative trust
models like Dynamic Trust Model (Battiston et al., 2006) before evaluating
trustworthiness of agents, similar advisor agents should be selected which have similar
preferences with requester agents. Then, these models calculate the trustworthiness of
similar agents.
Relationship between the components which used for computing trustworthiness
of agents follows the Dezert-Smarandache Theory (Wang & Sun, 2009), Like New
Evidential Trust Model (Wang & Sun, 2009), which is based on four main components
belief, disbelief, uncertainty and conflict. Each of these components is consisted of
other components which used for evaluating it. For instance for measuring the belief of
each agent, the most representative trust models like TRR model (Rosaci et al., 2011)
calculates the belief of how well an agent can be trusted by using two components as
reliability and reputation. Thereby for computing trustworthiness of agents regarding

73
toDezert-Smarandache Theory (Wang & Sun, 2009), belief of agents is computed based
on reliability and reputation and disbelief is evaluated by using two components as
unreliability and disrepute.
On the other hand, according to the most representative trust model
likeEvidence-based trust model (Wang & Singh, 2010)uncertainty and conflict of agents
measures by using probability theory. So the relationship between the components
which used for evaluating trustworthiness of similar agents was based on Dezert-
Smarandache Theory (Wang & Sun, 2009)
After evaluating trustworthiness of similar agents, it is necessary to select the
most trustworthy one as TREPPS model(Li & Kao, 2009) used FTOPSIS method for
selecting the most trustworthy agent.
Thereby, by analyzing the most representative trust models, the relationship
between identified components were determined and TMAN designed in three stages;
first similar agents selects by evaluating similarity of agents and then trustworthiness of
agents evaluates based on Dezert-Smarandache Theory (Wang & Sun, 2009)and finally
decision making process for selecting the most trustworthy agent is carried out by using
TOPSIS method.
3.4 Phase 3: Test and evaluation of TMAN
By identifying the essential components, the advantages and disadvantages of
each of the different methods of computing these components were described in Chapter
2. Therefore, the method of computing each component was selected according to the
advantages of each method.

74
In the last phase of the research methodology, the effectiveness of TMAN was
evaluated using two methods. The first was the evaluation method presented by Zhang
and Cohen (2008) and Gorner et al. (2013) using random selection of benevolent and
malicious agents based on random rating of the previous satisfying and dissatisfying
interactions between benevolent and malicious agents. The second method was
presented by Gray (2008) using the trust network game to collect the previous satisfying
and dissatisfying rates of benevolent and malicious agents by simulating a simple
auction environment. Each method used a special approach to evaluate the performance
of TMAN. Figure 3.12 illustrates the methods of evaluation TMAN.
Figure 3.2: Phase 3 of research methodology
According to the random selection method, the average accuracy of TMAN in
computing the main components, namely belief, disbelief, uncertainty, conflict,
reliability, unreliability, reputation and also disrepute, were evaluated based on the
random selection. Moreover, the performance of TMAN was compared with other
existing models.
On the other hand, the trust network game method helped to simulate a simple
auction environment in which agents can have transactions with each other, and the
Phase 3: Evaluation of TMAN
Random selection Trust network game
(TNG)
75
observations collected from these auctions were used as satisfaction and dissatisfaction
rates for each agent and then the collected actual behaviors of agents from the trust
network game compared with the results obtained by using TMAN.
3.4.1 Random selection
According to the result of analysis many articles and dissertations in proposing a
trust model in multi-agent environments a method can be selected for evaluating
TMAN, to investigate whether the proposed method of evaluating components are
accurately, and whether TMAN can perform better than other trust models which used
similar components. This method proposed by Zhang and Cohen (2008) and Gorner et
al. (2013) and it is used the previous satisfying and dissatisfying interactions,
considering preferences of agents to evaluate trustworthiness of agents by using real
numbers, and the multi-agent environments consists of trustworthy and untrustworthy
agents, thereby this method was applicable for TMAN.
Regarding this method,the requester, advisors and providers are selected
randomly, the requester rated the advisors arbitrarily and also advisor agents rated the
other advisors and providers arbitrarily as satisfying and dissatisfying. Moreover the
random values are given to preferences of each agent. TMAN model defines the
satisfaction rate to be between 0 and 1 (like Fire and REGRET models), whereas the
dissatisfaction rate is between -1 to 0 (like Fire and REGRET models). In other words,
the dissatisfying rate is represented by a negative rate.
In the first stage of evaluation, the accuracy of identified components which
used for evaluating trustworthiness of agents was evaluated. According to (Li and Kao,
2009; Kaljahi et al., 2013) model the accuracy of the components investigated after 100

76
times of interactions between requester, advisors and providers agents. Then the average
value for each component after 100 interactions was recorded for trustworthy and
untrustworthy agents. Then the accuracy of each component was investigated based on
this fact that reliability and reputation of trustworthy agents should be higher that their
unreliability and disrepute, while the reliability and reputation of untrustworthy agent
should be less than their unreliability and disrepute.
In the second stage of evaluation, the performance of TMAN was compared
with other existing models as the most of articles and researches carried out the
comparison to evaluate whether their proposed model perform better that other models.
To compare the performance of TMAN against other existing trust models, additional
simulations were administered. To be precise, simulations were carried out for the four
models described in this study, namelyEvidence-based trust model (Wang & Singh,
2010), and TREPPS model (Li & Kao, 2009), in addition to a basic model. All the
models were tested using the same scenario.
The performance of models evaluated by using the method proposed by (Li and
Kao, 2009; Kaljahi et al., 2013). In this method accuracy in selecting the most
trustworthy provider was determined by counting the number of times the model selects
the most trustworthy provider in 100 times of interactions. As mentioned previously, the
iterations were repeated ten times for each scenario; therefore the accuracies were
averaged to produce the final.
3.4.2 Trade network game
In addition to evaluate the accuracy of each component and also comparing the
performance of TMAN with other existing models, the method used by Gorner et al.

77
(2013) for the proposed reputation model in multi-agent environment was considered.
This method is also applicable for the models which want to evaluate the performance
of the models in e-commerce multi-agent environment by simulating a simple auction in
a multi-agent environment. This simulator, named Trade Network Game (TNG), is a
framework for studying the information and evolution of trade among interacting
between agents as traders (requester, advisor, and providers). This simulator is based on
the game theory that agents choose and refuse to trade with the agent partners. The trade
outcomes to be presented in different levels: trader attributes, trade network formation it
means that who was trading with, whom and with what regularity, trade behavior it
means cooperative or cheating and individual and social welfare measures which should
the agent utility during the trade.
Considering the proposed method by Gorner et al. (2013), the number of
requester, advisors and providers, the type of multi-agent environment as consistent
environment which agents do not change their behaviors during a trade or oscillating
environment that agents can change their behavior, and the numbers of trades in each
time of running were selected by user. Then TNG identifies the result of trading in each
time of interactions. Thereby, this result can be used by TMAN to study whether
TMAN can predict the behavior of agents in the next interaction and whether TMAN
can selects the most trustworthy provider during the trades. Finally the obtained results
from TMAN were compared with re result that TNG reported after trading.
To study whether TMAN can perform accurately in different multi-agent
environments, TNG method was repeated for different number of agents in three
different multi-agent environments, first consistent environment, then mild oscillating
behavior, and finally oscillating environment.

78
3.5 Summary
In this chapter, the methodology of this research has been explained in three
main phases. The first phase starts by analyzing of previous trust models, the essential
components for designing TMAN were identified in this phase. In addition, the method
of computing these components was described according to the analyzed models in
chapter 2. In the second phase, TMAN was proposed using the selected components and
identified methods of computing. In the final phase, the methods of evaluating TMAN
were described by using two methods. First, TMAN was evaluated using the random
selection method; in this method, the average accuracy of TMAN components were
investigated, and the performance of TMAN in selecting the most trustworthy provider
was compared with that of other existing trust models. Second, TMAN was evaluated
by using the trade network game simulator. According to this method, the accuracy of
TMAN in evaluating the trustworthiness of agents presented by TMAN was compared
against the outcome scores of agents which presented by trade network game simulator,
and the accuracy of TMAN in selecting the most trustworthy provider was also
compared against the actual behavior of that provider.
79
CHAPTER 4: DESIGN AND IMPLEMENTATION OF TMAN
4.1 Introduction
This chapter describes the process of designing TMAN and then explains
implementation of TMAN in multi-agent environments. The section 4.2 shows the
TMAN mechanism consisting five main stages; selecting similar advisors which
described in section 4.31, evaluating trustworthiness of similar advisors (section 43.2),
calculating trustworthiness of suggested provides (section 4.3.3), computing trust
transitivity among requester, similar advisors and suggested providers (section 4.3.4),
decision-making process which led to select the most trustworthy suggested provider
(section 4.3.5), and finally reward and punishment mechanism is explained in section
4.3.6.
In section 4.3 the methods of testing and evaluation TMAN have been described
by using two methods of implementation. Each method evaluated first the accuracy of
TMAN components to investigate whether TMAN calculate each proposed component
accurately, then the performance of TMAN in selecting the most trustworthy agent was
studied. Section 4.3.6 explains the random selection method in details that the accuracy
of TMAN components in evaluating the trustworthiness of advisors and their suggested
providers is investigated with different number of agents and various numbers of
trustworthy and untrustworthy agents in a simulated multi-agent environment. Then the
method of comparing the performance of TMAN against other models is described by
using the random selection method in a simulated multi-agent environment. In section
4.4.2the method of testing the accuracy of TMAN components based on the trust

80
network game (TNG) as a simulator is explained in details. According to TNG method
the TNG outcomes after trades are compared with the results which obtained by using
TMAN in a simulated auction by using TNG as a simulator.
4.2Design of TMAN
According to the problem statement, the existing trust models used advisor agent
to select the trustworthy provider without considering that the advisors themselves can
be malicious, and they may suggest an untrustworthy provider due to lack of
information or for their own benefits. Hence, TMAN is a model proposed for evaluating
the trustworthiness of advisors in regard to their suggested provider. Then according to
the advisors’ reports about their suggested providers, TMAN measures the
trustworthiness of providers and finally selects the most trustworthy provider agent
among all the suggested providers.
Moreover, TMAN reinforces dissimilarity existing in most of the other existing
models by selecting similar advisors. TMAN also reduces the effect of uncertainty in
agent’s outcomes by evaluating uncertainty values of each advisor and its suggested
provider; then, attempting to select the agent with less uncertainty in its outcomes.
TMAN computes the conflict in previous interaction outcomes of each advisor
and its suggested provider and attempts to select the agent with less conflict, this leads
to reduce the effect of unstable agents which had very conflict behaviors, and finally
TMAN supports transitivity of trust between advisors and their suggested providers.
The remaining parts of this chapter provide a detailed description of how TMAN
enables a requester agent to select the most trustworthy service provider according to

81
the advice of benevolent advisors. Figure 4.1 illustrates a general flow chart of the
TMAN mechanism.According to Figure 4.1, first, the similar agents are selected by
TMAN, as advisors. The method of selecting the similar advisors is described in Section
4.3.1. Then the evaluation of trustworthiness of each advisor is explained in Section
4.3.2. In particular, within this section, the process of evaluating trustworthiness of each
advisor is explained based on four components, namely belief, disbelief, uncertainty and
conflict as shown in Figure 4.1. Section 4.3.3 explains the method of evaluating the
trustworthiness of each suggested provider according to the report of advisors. The trust
transitivity between advisors and their suggested provider is described in Section 4.3.4.
Finally, the method of decision-making process for selecting the most trustworthy
provider considering the evaluation of advisors in an advisor network is stated in
Section 4.3.5. Section 4.3.6 describes how the reward and punishment method can
encourage advisors to have a trustworthy behavior.
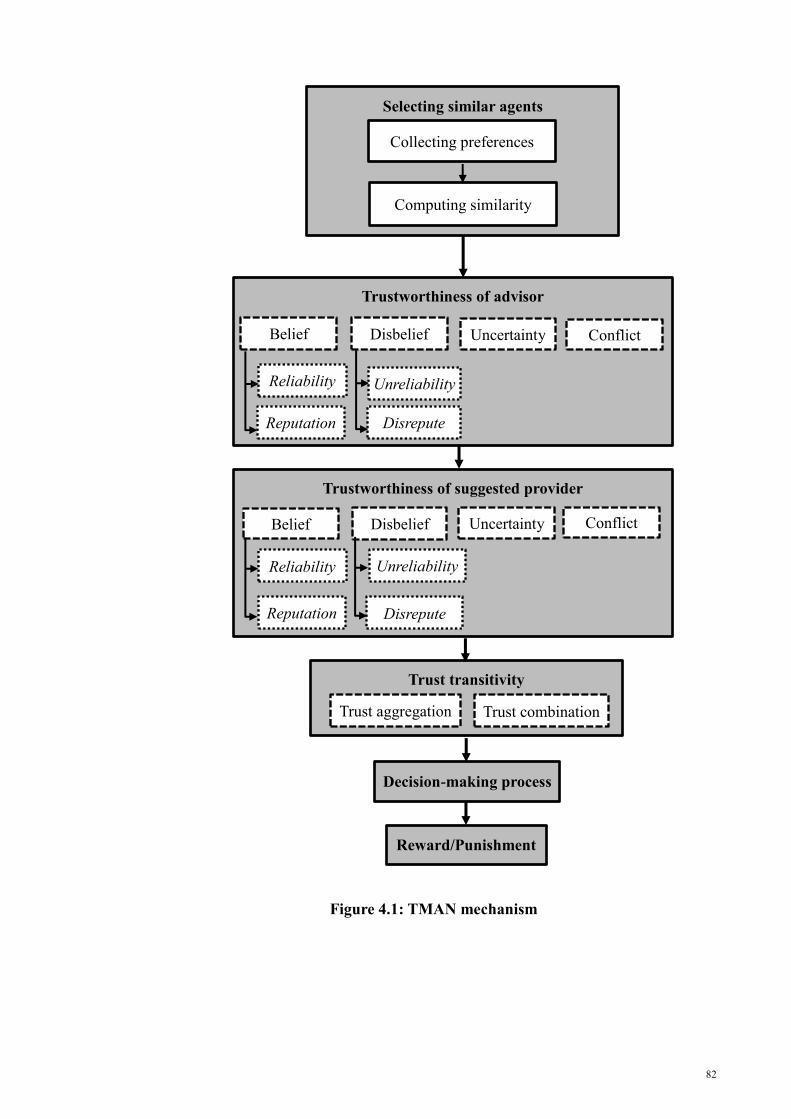
82
Figure 4.1: TMAN mechanism
Selecting similar agents
Trust transitivity
Trustworthiness of suggested provider
Collecting preferences
Computing similarity
Trust combination
Trustworthiness of advisor
Trust aggregation
Belief Disbelief Uncertainty Conflict
Decision-making process
Reward/Punishment
Belief Disbelief
Reliability
Reputation Disrepute
Uncertainty Conflict
Reliability
Reputation
Unreliability
Disrepute
Unreliability

83
4.2.1 Selecting similar agents
To select the similar agents and collect their suggestions about service providers,
the requester agent sends a query in random order to other agents who have had
previous interactions with them; the agents are asked to identify their preferences in
different criteria of a specific service that they wish to buy and suggest a trustworthy
service provider. The requester agent then receives a set of responses in return. The time
limitation for each advisor to respond to the query is based on the average delay time
that the advisor has had in its previous interactions with the requester agent. If the
advisor does not respond within the time frame given, it will be ignored. It is assumed
that each advisor suggests a provider, or if it cannot suggest any provider it will be
ignored by the requester. Moreover, there is at least one advisor that suggests a
trustworthy service provider.
For instance, the requester sends a query to its familiar agents and asks them to
rate each of the criteria, such as product quality and product price, according to their
preferences. After collecting all the responses, the requester calculates the similarity
between itself and the familiar agents; the familiar agents that have more similarities
with the requester are selected as a similar advisor. The query consists of the following:
1. The ID of the requester agent that has issued the query (Req).
2. The kind of service which the requester has chosen (S).
3. Preferences in different criteria of interaction on service (S).
4. The ID of all agents that were sent the query (Adv).

84
5. Ask the number of satisfying interactions, the total rating of previous
satisfying interactions and also the last time that the responder agent experienced a
satisfying interaction with other identified agents (only agents that have had previous
interactions with any of the other identified agents will respond).
6. Ask the number of dissatisfying interactions, the total rating of previous
dissatisfying interactions and also the last time that the responder agent experienced a
dissatisfying interaction with other identified agents (only agents that have had previous
interactions with any of the other identified agents will respond).
7. Ask the ID of a suggested trustworthy provider in providing the service (𝑆).
8. Ask the number of satisfying interactions, total rating of previous satisfying
interactions with suggested provider and also the last time that the responder agent
experienced a satisfying interaction.
9. Ask the number of dissatisfying interactions, total rating of previous
dissatisfying interactions with suggested provider and also the last time that the
responder agent experienced a dissatisfying interaction.
A sample query is shown as follows:
(ID: Req; Service: S; Preference of product quality:_, Preference of product
price:_, Preference of delivery time:_; Agents ID: A,B,C,D; No of satisfying
interactions:_ Rate of satisfying interaction:_; Last time of satisfying interactions:_; No
of dissatisfying interactions:_; Rate of dissatisfying interaction:_; Last time of
dissatisfying interaction:_; Suggested provider:_; No of satisfying interactions:_ Rate
of satisfying interactions:_; Last time of satisfying interaction:_; No of dissatisfying
85
interactions:_; Rate of dissatisfying interactions:_; Last time of dissatisfying
interaction:_)
The response to the query consists of:
1. The ID of the agent which responds (Res).
2. The rating of each criterion according to the responder’s preferences.
3. The number of satisfying interactions, the total rating of previous satisfying
interactions with other identified agents, and also the last time it experienced a
satisfying interaction (if it has had previous interactions with any of them).
4. The number of dissatisfying interactions, the total rating of previous
dissatisfying interactions with other identified agents and also the last time it
experienced a dissatisfying interaction (if it has had previous interactions with any of
them).
6. The ID of the suggested provider in providing the service (𝑆).
7. The number of satisfying interactions, total rating of previous satisfying
interactions with suggested provider and also the last time it experienced a satisfying
interaction.
8. The number of dissatisfying interactions, total rating of previous dissatisfying
interactions with suggested provider and also the last time it experienced a dissatisfying
interaction.

86
Query
Query
Reply
Reply
Reply
Query
Query
A sample reply is shown as follows:
(ID: A; Preference of product quality:0.8; Preference of product price:0.5;
Preference of delivery time:0.1; No of satisfying interactions: B=3,D=7; Rate of
satisfying interactions: A=0;, D=0.8; Last time of satisfying interaction: A= 10 days
ago, D=4 days ago; No of dissatisfying interactions: A=1, D=3; Rate of dissatisfying
interactions : A=-0.2, B=-0; Last time of dissatisfying interaction: A=7 days ago,
B=10 days ago; Suggested provider: X; No of satisfying interactions: 5; Rate of
satisfying interactions: 0.8; Last time of satisfyinginteraction:2 days ago; No of
dissatisfying interactions:1; Rate of dissatisfying interactions:-0.2; Last time of
dissatisfyinginteraction:9 days ago)
As a result, the requester agent receives a set of responses from agents. Then the
requester calculates the similarity between its preferences and the responder’s
preferences through their collected preferences as shown in Figure 4.2.
Figure 4.2: Sending query to familiar agents and collected the responses
D
E
C
B
A
R Reply
Reply

87
As shown in Figure 4.2, requester R sent a query for agents A,B,C, D and E, and
collected the responses which responded within the identified limitation of time. The
responder C is eliminated, because it did not respond within the time limitation.
With reference to the TREPPS model (Li & Kao, 2009), preferences setting was
assumed, as an importance weight of different criteria, which is expressed in seven
linguistic terms: extremely unimportant (EU), unimportant (U), slightly unimportant
(SU), average (A), slightly important (SI), important (I), extremely important (EI).
Table 3.2 shows the meanings of these linguistic values.
Table 4.1: Linguistic values for importance weight of preferences criteria (Li &
Kao, 2009)
Linguistic terms Range
Extremely Unimportant (EU) [0.0, 0.1]
Unimportant (U) (0.1, 0.2]
Slightly Unimportant (SU) (0.2, 0.4]
Average (A) (0.4, 0.6]
Slightly Important (SI) (0.6, 0.8]
Important (I) (0.8, 0.9]
Extremely Important (EI) (0.9, 1.0]
TMAN also used these seven linguistic terms as a preferences setting for
evaluating similarity between requester and each responder agent.

88
According to the dynamic trust model (Battiston et al., 2006), the similarity
between preferences of requester and each responder agent can be computed as follows:
|)|1(1
ReReReRe sq C
C
Csq ffc
Sim (4.1)
Where:
sqSim ReRe indicates the similarity between requester, Req, and responder, Res,
and ]1,0[ReRe sqSim
c shows the total number of criteria
qCf Redenotes the preference value of requester for criterion c which is
presented in Table 4.1
sCf Rerepresents the preference value of responder for criterion c which is
presented in Table 4.1
After calculating the similarity of each responder, TMAN proposed a method for
selecting the similar advisors, according to this method the requester takes into account
the average similarity of responders. The responders with similarity value higher than
the average value will be selected as a similar advisor as follows:
selectedbenotwillN
SimSimf
selectedbewillN
SimSimif
s sq
sq
s sq
sq
Re ReRe
ReRe
Re ReRe
ReRe
(4.2)
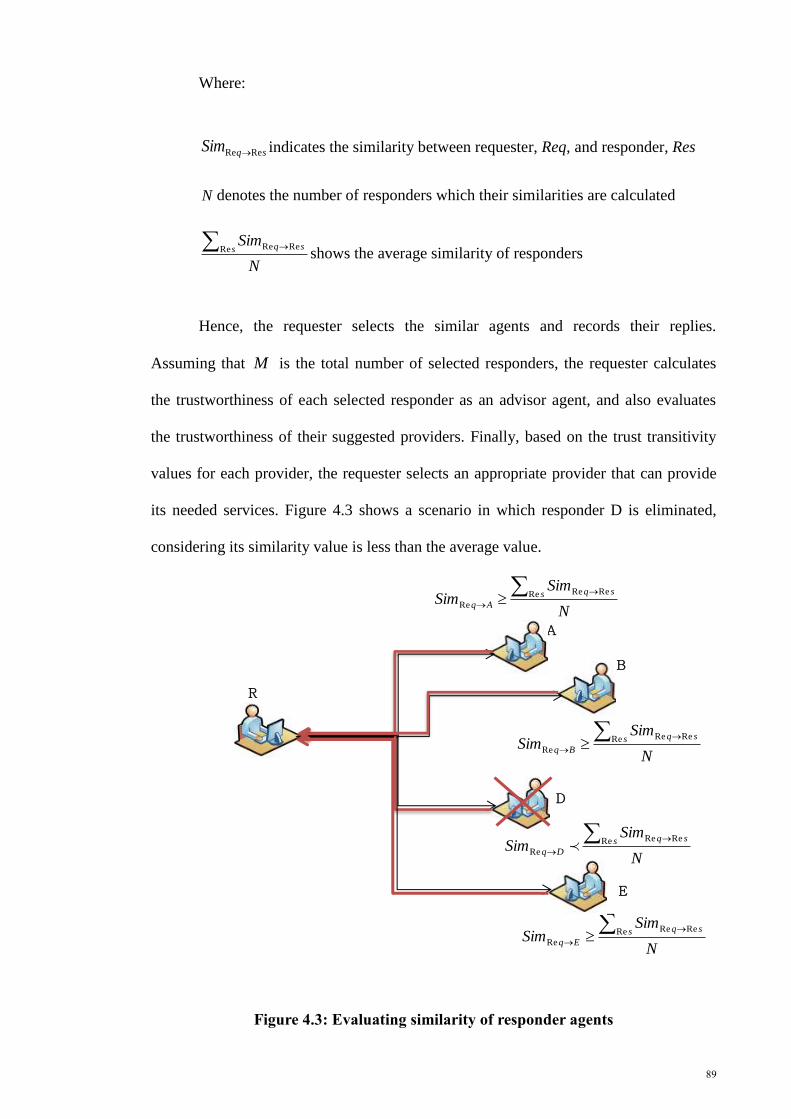
89
E
Where:
sqSim ReRe indicates the similarity between requester, Req, and responder, Res
N denotes the number of responders which their similarities are calculated
N
Sims sq Re ReRe
shows the average similarity of responders
Hence, the requester selects the similar agents and records their replies.
Assuming that M is the total number of selected responders, the requester calculates
the trustworthiness of each selected responder as an advisor agent, and also evaluates
the trustworthiness of their suggested providers. Finally, based on the trust transitivity
values for each provider, the requester selects an appropriate provider that can provide
its needed services. Figure 4.3 shows a scenario in which responder D is eliminated,
considering its similarity value is less than the average value.
Figure 4.3: Evaluating similarity of responder agents
E
D
B
A
R
N
SimSim s sq
Dq
Re ReRe
Re
N
SimSim s sq
Bq
Re ReRe
Re
N
SimSim s sq
Eq
Re ReRe
Re
N
SimSim s sq
Aq
Re ReRe
Re

90
4.2.2 Trustworthiness of advisors
After selecting the similar agents as advisors, and recording their responders, the
requester calculates the trustworthiness of these similar agents. The requester computes
the trustworthiness of each advisor agent according to the four components, namely
belief, disbelief, uncertainty, and conflict. The method of computing each of these
components is described in the following sections.
4.2.2.1 Belief of each advisor
To evaluate the belief of an advisor that shows how well that advisor can be
trusted, the requester computes a weighted mean between the reliability and reputation
of that advisor. It calculates the value of reliability of advisor according to the opinion
of the requester based on its previous interactions with that advisor. Meanwhile, the
value of reputation of advisor can be evaluated based on the opinion of other selected
advisors that have had any previous interaction with that advisor. Therefore, TMAN
evaluates the belief of each advisor as follows:
Belief= ( Reliability+ (1- ) Reputation) (4.3)
Where:
indicates the weighted mean between reliability and reputation
Computing reliability, reputation and the weighted mean of is based on the
satisfaction rates of previous interactions (Rosaci et al., 2011) between requester and
each advisor. This is explained in further detail in the following sections.

91
4.2.2.1.1 Reliability of each advisor
As described in Part 1 of research methodology, the reliability of each advisor is
measured by using two factors: closeness and stability factors. TMAN evaluates these
two factors based on previous satisfying direct interactions between requester and each
advisor.
The rating of satisfaction, as described in Part 1, is identified using two
linguistic terms: slightly good (SG) and good (G) in the range of zero to one. The value
of neutral interaction is 0. The meanings of these two linguistic variables are shown in
Table 4.2.
Table 4.2: Linguistic values for rating of service satisfaction in different criteria
Linguistic terms Numbers
Slightly good (SG) (0, 0.5]
Good (G) (0.5, 1]
Moreover, TMAN applies closeness factor to examine the frequency of previous
satisfying interactions between the requester and advisor. As the number of satisfying
interactions grows, the value of closeness factor increases; this relationship indicates the
confidence degree of an advisor. The closeness factor has a direct relationship with the
number of previous satisfying interactions between the requester and advisor. Thus, the
method is employed by TMAN to measure the closeness factor is based on the
proportion of the number of previous satisfying interactions between requester and
advisor to the total number of previous interactions, as follows:
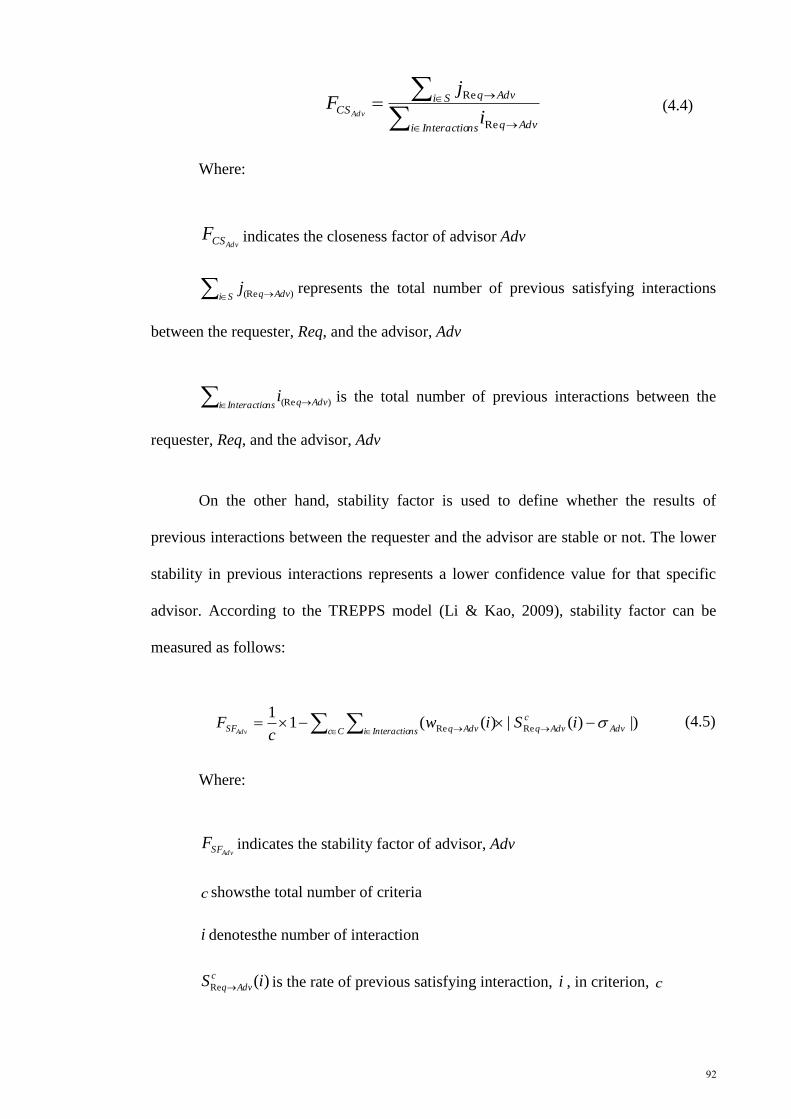
92
nsInteractioi Advq
Si Advq
CSi
jF
Adv
Re
Re
(4.4)
Where:
AdvCSF indicates the closeness factor of advisor Adv
Si Advqj )(Re represents the total number of previous satisfying interactions
between the requester, Req, and the advisor, Adv
nsInteractioi Advqi )(Re is the total number of previous interactions between the
requester, Req, and the advisor, Adv
On the other hand, stability factor is used to define whether the results of
previous interactions between the requester and the advisor are stable or not. The lower
stability in previous interactions represents a lower confidence value for that specific
advisor. According to the TREPPS model (Li & Kao, 2009), stability factor can be
measured as follows:
)|)(|)((11
ReRe Cc nsInteractioi Adv
c
AdvqAdvqSF iSiwc
FAdv
(4.5)
Where:
AdvSFF indicates the stability factor of advisor, Adv
c showsthe total number of criteria
i denotesthe number of interaction
)(Re iS c
Advq is the rate of previous satisfying interaction, i , in criterion, c

93
nsInteractioi i
iAdvq
time
timeiw )(Re represents the weight factor which denotes the
freshness weight of time. In fact, the weight factor of time places more value on
interaction, i , which is closer to current time
Adv is the initial reliability value calculated regarding to TREPPS model(Li &
Kao, 2009)as:
)()(1
ReRe iwiSc
AdvqCc nsInteractioi
c
AdvqAdv (4.6)
Where:
c shows the total number of criteria
i denotesthe number of interaction
)(Re iS c
Advq is the rate of previous satisfying interaction, i , in criterion, c
)(Re iw Advq represents the weight factor of time
By integrating the closeness and stability factors like TREPPS model(Li & Kao,
2009), the final formula for computing the overall reliability value of each advisor is:
AdvAdv SFCSAdv FF (4.7)
Where:
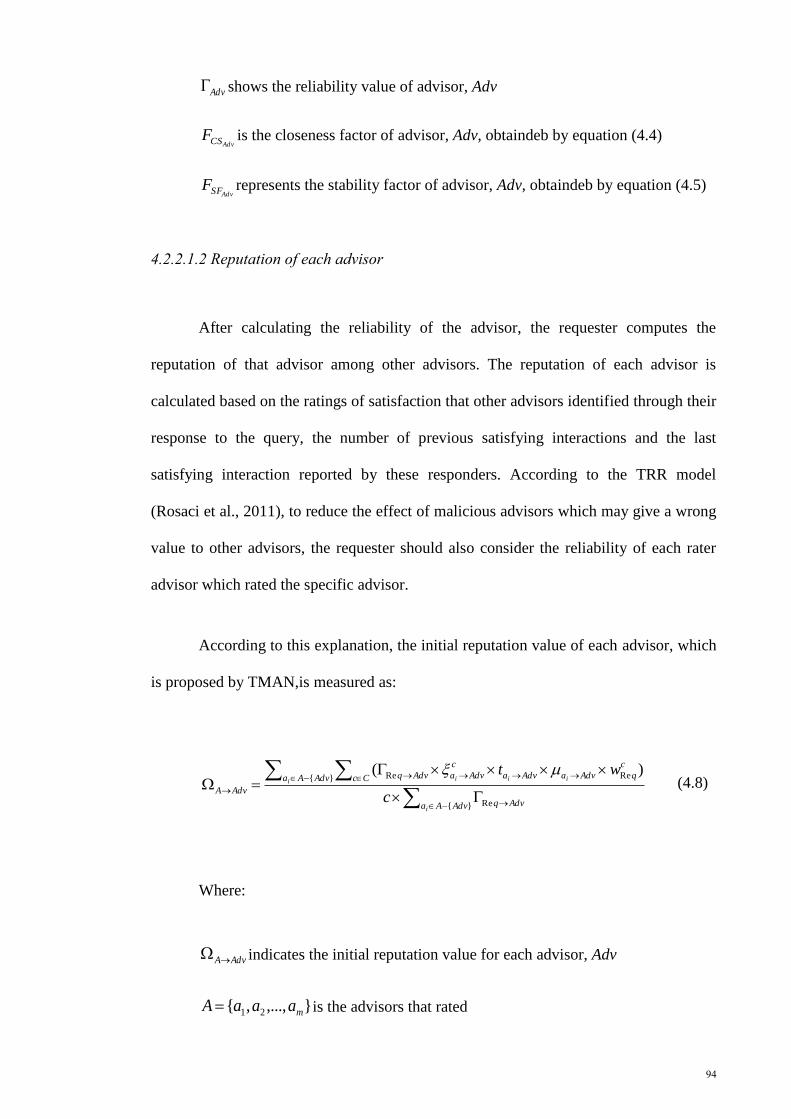
94
Adv shows the reliability value of advisor, Adv
AdvCSF is the closeness factor of advisor, Adv, obtaindeb by equation (4.4)
AdvSFF represents the stability factor of advisor, Adv, obtaindeb by equation (4.5)
4.2.2.1.2 Reputation of each advisor
After calculating the reliability of the advisor, the requester computes the
reputation of that advisor among other advisors. The reputation of each advisor is
calculated based on the ratings of satisfaction that other advisors identified through their
response to the query, the number of previous satisfying interactions and the last
satisfying interaction reported by these responders. According to the TRR model
(Rosaci et al., 2011), to reduce the effect of malicious advisors which may give a wrong
value to other advisors, the requester should also consider the reliability of each rater
advisor which rated the specific advisor.
According to this explanation, the initial reputation value of each advisor, which
is proposed by TMAN,is measured as:
}{ Re
}{ ReRe )(
AdvAa Advq
AdvAa Cc
c
qAdvaAdva
c
AdvaAdvq
AdvA
i
i iii
c
wt (4.8)
Where:
AdvA indicates the initial reputation value for each advisor, Adv
},...,,{ 21 maaaA is the advisors that rated

95
c shows the total number of criteria
AdvqRe is the reliability that requester considers for rated advisor agent, Adv
c
Advai is the total satisfaction rate which rater advisor agent, ai, gives according
to their previous interactions
Advait shows the weight for each rating by considering more weight to more
recent interaction by Adv
sIntractioni Adva
Si Adva
Adva
i
i
i i
j denotes the proportion of the number of previous
satisfying interactions to the total number of previous interactions between rater advisor,
ia , and rating advisor agent, Adv
c
qwRe is preferences of requester as an importance weight of each criterion, as
shown in Table 4.1.
Moreover, the number of advisors, N , which sent their ratings affects the
accuracy of the reputation value. As the number of advisors that participate in
computing reputation of a specific advisor grows, the reputation value becomes more
accurate.
Hence, the final formula is proposed by TMAN, for calculating the reputation of
each advisor is:
AdvA
MnAdv
M
n
1 (4.9)
Where:

96
Adv indicates the reputation of advisor, Adv
Mnn is the total number of advisors that rated advisor, Adv, and participated
in computing the reputation value of advisor, Adv
M is the total number of advisors
1M shows the total number of rater advisors minus the advisor that has been
rated by others
AdvA is the initial reputation value of a specific advisor, Adv, obtained by
equation (4.8).
In addition, according to TRR model (Rosaci et al., 2011)for integrating
reliability and reputation, a weighted mean is considered as the number of satisfying and
dissatisfying direct previous interactions between requester and each advisor, and also
the knowledge of the requester about the advisor. In fact, the knowledge of requester
about each advisor is taken into consideration according to the proportion of total
number of previous interactions between specific advisor and requester to the total
number of previous interactions that requester experienced with all advisors. The
growth in the number of previous interactions with a specific advisor rather than other
advisors illustrates that requester has more knowledge about that advisor through
previous interactions. Therefore, the proposed weighted mean, considering to the
presented method by TRR model(Rosaci et al., 2011), is measured as follows:
Adv
Adv
Adv
AdvAdv
Adv
Adv
Adv
Adv
Adv
AdvAdv
Adv
t
j
t
iif
K
n
t
j
t
iif
t
i
K
n
(4.10)

97
Where:
AdvqRe indicates the weighted mean of reliability and reputation of advisors
Advn denotes the total number of previous interactions with advisor, Adv
K is the total previous interactions that requester had with all advisors
Advi represents the total number of previous satisfying interactions between
advisor, Adv, and requester
Advj shows the total number of previous dissatisfying interactions between
advisor, Adv, and requester
AdvAdvAdv jit shows the total number of previous interactions between
requester and advisor, Adv.
According to the TRR model (Rosaci et al., 2011), if the average value of
previous satisfying interactions is higher than the average value of previous
dissatisfying interactions, the weighted mean is equal to the knowledge of requester
about advisor; otherwise, the weighted mean depends on the knowledge of requester
about advisor and also the average value of previous satisfying interactions.
By considering the presented weighted meanwhich is used by TRR
model(Rosaci et al., 2011), the final formula for evaluating the belief of each advisor by
considering a weighted mean for reliability and reputation values, is as follows:
AdvAdvAdvAdvAdv )1( (4.11)
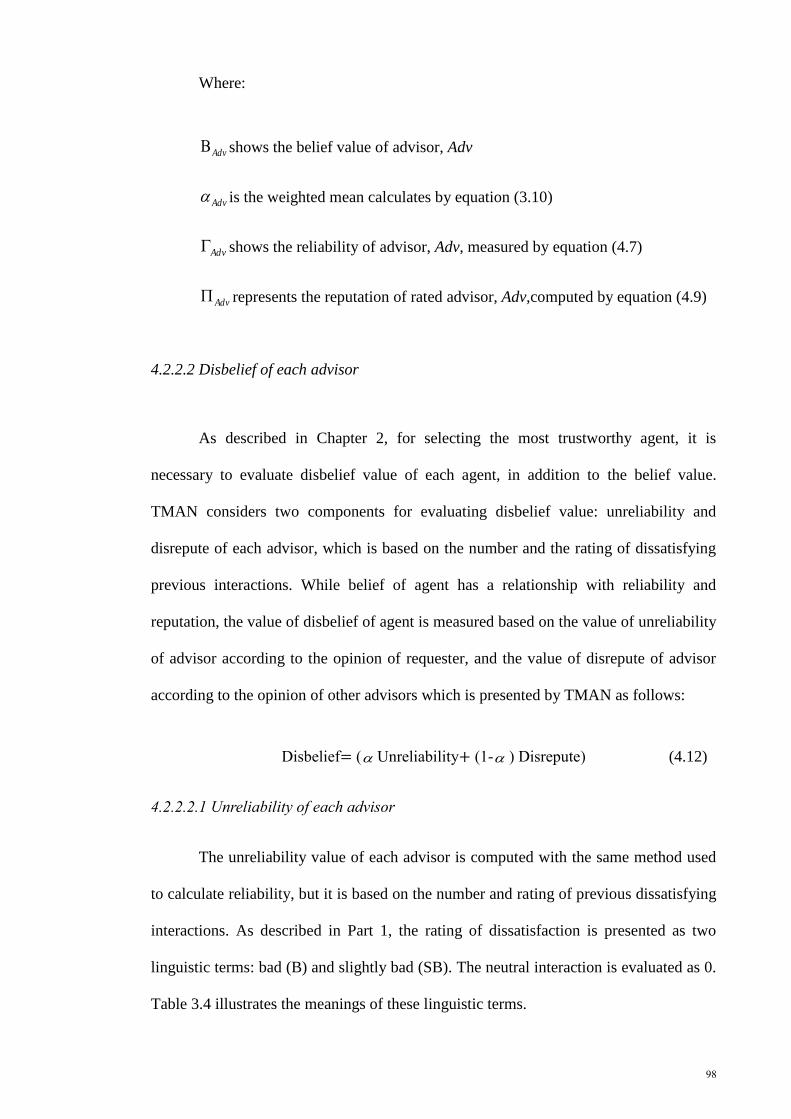
98
Where:
Adv shows the belief value of advisor, Adv
Adv is the weighted mean calculates by equation (3.10)
Adv shows the reliability of advisor, Adv, measured by equation (4.7)
Adv represents the reputation of rated advisor, Adv,computed by equation (4.9)
4.2.2.2 Disbelief of each advisor
As described in Chapter 2, for selecting the most trustworthy agent, it is
necessary to evaluate disbelief value of each agent, in addition to the belief value.
TMAN considers two components for evaluating disbelief value: unreliability and
disrepute of each advisor, which is based on the number and the rating of dissatisfying
previous interactions. While belief of agent has a relationship with reliability and
reputation, the value of disbelief of agent is measured based on the value of unreliability
of advisor according to the opinion of requester, and the value of disrepute of advisor
according to the opinion of other advisors which is presented by TMAN as follows:
Disbelief= ( Unreliability+ (1- ) Disrepute) (4.12)
4.2.2.2.1 Unreliability of each advisor
The unreliability value of each advisor is computed with the same method used
to calculate reliability, but it is based on the number and rating of previous dissatisfying
interactions. As described in Part 1, the rating of dissatisfaction is presented as two
linguistic terms: bad (B) and slightly bad (SB). The neutral interaction is evaluated as 0.
Table 3.4 illustrates the meanings of these linguistic terms.

99
Table 4.3: Linguistic values for rating of service dissatisfaction in different criteria
Linguistic terms Range
Slightly bad (SB) (0.0, -0.5]
Bad (B) (-0.5, -1]
According to the formula presented for reliability, the requester should also
consider two critical factors, closeness factor and stability factor, for evaluating the
unreliability of each advisor as follows:
nsInteractioi Advq
Si Advq
CSi
hdF
Adv
Re
Re (4.13)
Where:
AdvCSdF indicates the closeness factor of advisor,Adv
Si Advqh )(Re shows the total number of previous dissatisfying interactions
between the requester, Req, and the advisor, Adv
nsInteractioi Advqi )(Re is the total number of previous interactions between the
requester, Req, and the advisor, Adv
On the other hand, the stability factor is calculated as:

100
)||)(||)((11
ReRe Cc nsInteractioi Adv
c
AdvqAdvqSF didSiwc
dFAdv
(4.14)
Where:
AdvSFdF indicates the stability factor of advisor, Adv
C shows the total number of criteria
i denotesthe number of interaction
|)(| Re idS c
Advq is the positive value of previous dissatisfying interaction rate for
criterion, c
nsInteractioi i
iAdvq
time
timeiw )(Re represents the weight factor of time
Advd is the initial unreliability value calculated as:
)(|)(|
1ReRe iwidS
cd AdvqCc nsInteractioi
c
AdvqAdv
(4.15)
Where:
C shows the total number of criteria
i denotesthe number of interaction
|)(| Re idS c
Advq is the positive value of previous dissatisfying interaction rate for
criterion, c

101
)(Re iw Advq represents the weight factor of time
By incorporating closeness factors and stability factors, the final formula for
computing unreliability is:
AdvAdv SFCSAdv dFdFd (4.16)
Where:
Advd indicates the unreliability value of advisor, Adv
AdvCSdF represents the closeness factor of advisor, Adv, for previous dissatisfying
interactions, obtained from equation (3.13).
AdvSFdF is the stability factor of advisor, Adv, for previous dissatisfying
interactions, obtained from equation (3.14).
4.2.2.2.2 Disrepute of each advisor
The requester measures the disrepute value of each advisor agent according to
the ratings of previous dissatisfying interactions collected from other advisors about the
rated advisor, Adv. The presented method by TMAN for calculating disrepute of each
advisor is as follows:
}{ Re
}{ ReRe )||(
AdvAa Advq
AdvAa Cc
c
qAdvaAdva
c
AdvaAdvq
AdvA
i
i iii
c
wtd
(4.17)

102
Where:
AdvAd indicates the initial disrepute of advisor, Adv, according to the rater
advisors, A
},...,,{ 21 maaaA is the advisors that rated other advisors
C shows the total number of criteria
AdvqRe is the reliability that requester considers for rated advisor agent, Adv
c
Advai is the total dissatisfaction value which rated advisor agent, ai, gives to
rating advisor, Adv, according to their previous interactions
Advait shows the weight for each rating by considering more weight to more
recent interaction
nsInteractioi Adva
Si Adva
Adva
i
i
i i
j denotes the proportion of the number of previous
dissatisfying interactions to the total number of previous interactions between rater
advisor, ai, and rating advisor agent, Adv
c
qwRe is preferences of requester as an importance weight of each criterion, as
shown in Table 3.2.
Moreover, the number of agents that sent their ratings of dissatisfaction affects
the credibility of the disrepute value. As the number of advisors that participate in

103
computation of the disrepute grows, the disrepute value will be more accurate. Hence,
the final formula for calculating the disrepute of advisor, Adv, is:
AdvA
MmAdv d
M
md
1 (4.18)
Where:
Advd indicated disrepute of advisor, Adv
Mmm represents the total number of rater advisor, ai, which participated in
computing the disrepute value of advisor, Adv
M is the total number of advisors
1M shows the total number of rater advisors minus the advisors that has been
rated by others
AdvAd indicates the initial disrepute value of a specific advisor, Adv, obtained
by equation (3.17).
According to the identified weighted mean for evaluating belief value of each
advisor, to integrate unreliability and disrepute, a weighted mean is considered as the
number of satisfying and dissatisfying direct previous interactions between requester
and each advisor, in addition to the knowledge of the requester about the advisor.
The proposed weighted mean for evaluating disbelief is as follows:
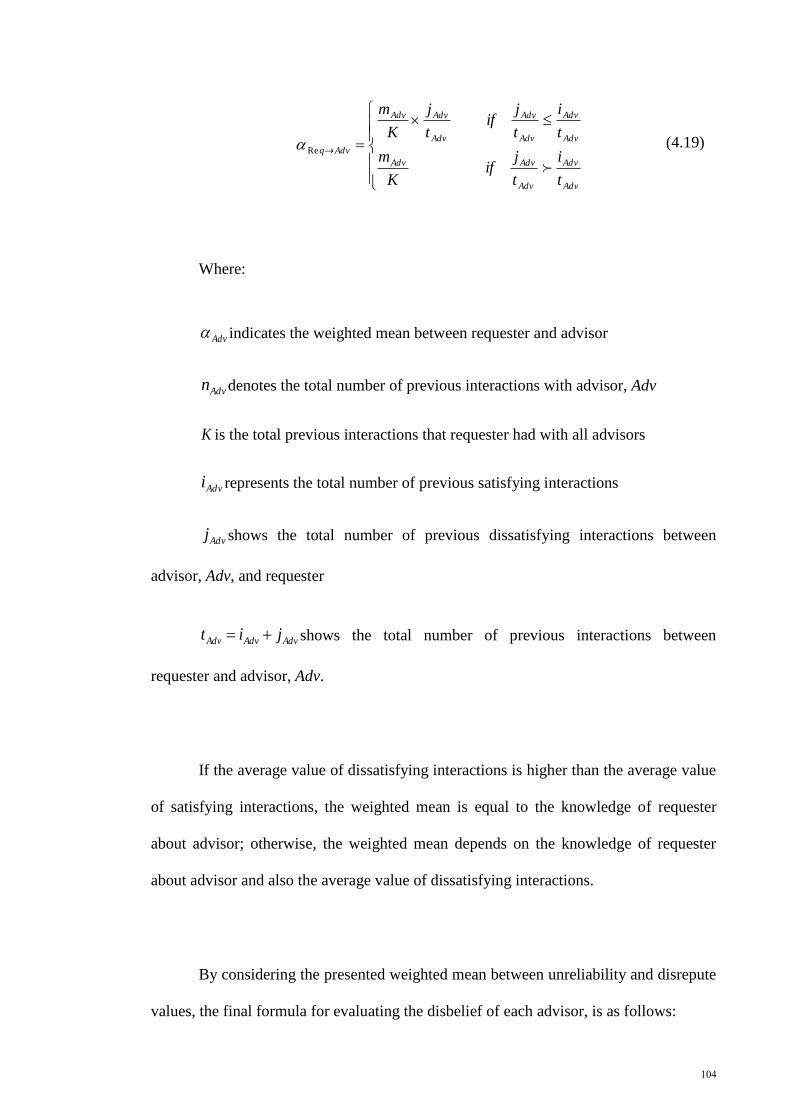
104
Adv
Adv
Adv
AdvAdv
Adv
Adv
Adv
Adv
Adv
AdvAdv
Advq
t
i
t
jif
K
m
t
i
t
jif
t
j
K
m
Re (4.19)
Where:
Adv indicates the weighted mean between requester and advisor
Advn denotes the total number of previous interactions with advisor, Adv
K is the total previous interactions that requester had with all advisors
Advi represents the total number of previous satisfying interactions
Advj shows the total number of previous dissatisfying interactions between
advisor, Adv, and requester
AdvAdvAdv jit shows the total number of previous interactions between
requester and advisor, Adv.
If the average value of dissatisfying interactions is higher than the average value
of satisfying interactions, the weighted mean is equal to the knowledge of requester
about advisor; otherwise, the weighted mean depends on the knowledge of requester
about advisor and also the average value of dissatisfying interactions.
By considering the presented weighted mean between unreliability and disrepute
values, the final formula for evaluating the disbelief of each advisor, is as follows:
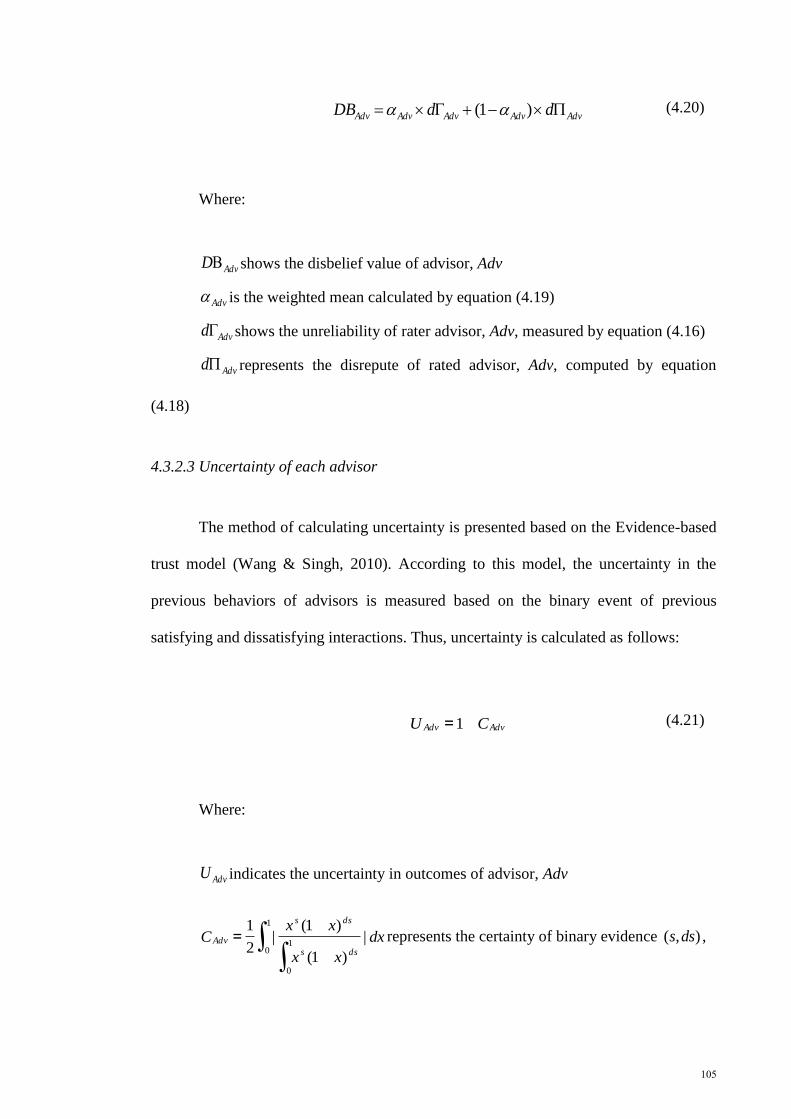
105
AdvAdvAdvAdvAdv ddDB )1( (4.20)
Where:
AdvD shows the disbelief value of advisor, Adv
Adv is the weighted mean calculated by equation (4.19)
Advd shows the unreliability of rater advisor, Adv, measured by equation (4.16)
Advd represents the disrepute of rated advisor, Adv, computed by equation
(4.18)
4.3.2.3 Uncertainty of each advisor
The method of calculating uncertainty is presented based on the Evidence-based
trust model (Wang & Singh, 2010). According to this model, the uncertainty in the
previous behaviors of advisors is measured based on the binary event of previous
satisfying and dissatisfying interactions. Thus, uncertainty is calculated as follows:
AdvAdv CU 1= (4.21)
Where:
AdvU indicates the uncertainty in outcomes of advisor, Adv
∫∫
=1
01
0
|
)1(
)1(|
2
1dx
xx
xxC
dss
dss
Adv represents the certainty of binary evidence ),( dss ,

106
Where:
s shows the total number of previous satisfying interactions between specific
advisor and requester and also other advisors
ds represents the total number of previous dissatisfying interactions between
specific advisor and requester and also other advisors.
4.2.2.4 Conflict of each advisor
Conflict in the evidence means that some evidences are positive (satisfying
interactions) and some are negative (dissatisfying interactions), which shows the
inconsistency in the previous behaviors of the agent. According to Evidence-based trust
model (Wang & Singh, 2010), the value of conflict for each advisor is evaluated as:
)1,min( t
sCAdv (4.22)
Where:
AdvC indicates the conflict in behaviors of advisor, Adv
s representsthe total previous satisfying interactions between specific advisor,
Adv, and requester and also other advisors
t isthe total previous interactions between specific advisor, Adv, and requester
and also other advisors
107
Finally, the trustworthiness of each advisor is evaluated, by using Dezert theory
(Wang & Singh, 2010), based on belief, disbelief, uncertainty and conflict value, as
explained in previous sections, as follows:
),,,( AdvAdvAdvAdvAdv CUDBBT (4.23)
Where:
AdvT indicates the trustworthiness of advisor, Adv, and ]1,0[AdvT .
AdvB represents the belief of advisor, Adv.
AdvDB shows the disbelief of advisor, Adv.
AdvU is uncertainty in outcomes of advisor, Adv.
AdvC denotes conflict in behaviors of advisor, Adv.
Figure 4.4 showshow belief, disbelief, uncertainty, and conflict are represented
for each advisor.

108
Figure 4.4: Evaluating trustworthiness of each advisor
4.2.3 Trustworthiness of each provider
After evaluation of trustworthiness for each advisor, the requester should
evaluate the trustworthiness of the suggested provider according to the information that
each advisor reported through the query. In fact, each advisor sent the numbers, rating
and also the last time of satisfying or dissatisfying interaction for its suggested provider.
Therefore, requester can evaluate the trustworthiness of each provider by considering
the recorded information collected from advisors. The trustworthiness of each provider
is also calculated based on belief, disbelief, uncertainty, and conflict.
The method of computing belief and disbelief of provider is different from
calculating the trustworthiness of advisors; as advisors have direct interaction with
requester, the requester can evaluate the reliability of the advisor according to its own
E
B
A
R
),,,( AAAA CUD
109
experiences. In the next sections, the method of computing each component of
trustworthiness of provider is explained.
4.2.3.1 Belief of each provider
After calculating the trustworthiness of each advisor, the belief of each
suggested provider should be calculated according to the responses collected from
advisors. Because the requester does not have any previous direct interactions with
providers, the reliability and unreliability values of the providers are zero; hence, the
belief value of each provider should be evaluated by reputation values which are
calculated based on the rates collected from the advisors. In regard to the sent query,
each advisor suggested a trustworthy provider and identified the number and the rating
of previous satisfying and dissatisfying interactions that it experienced with its
suggested provider. The reputation value of each suggested provider is calculated based
on the ratings of satisfaction that advisors identified through their response to the query,
the number of previous satisfying interactions and the last time of satisfying interaction
reported by advisors and the reliability of each advisor that suggested and rated the
provider. In addition to the number of advisors that suggested the specific provider, it
seems that the growth in the number of advisors that suggested the specific provider will
increase the confidence degree of selecting the provider. Thus, the reputation value of
each provider is computed as follows:
Aa oq
Aa Cc
c
qoaoa
c
oaAdvq
oA
i
i iii
c
wt
PrRe
RePrPrPrRe
Pr
)( (4.24)
110
Where:
},...,,{ 21 maaaA is the advisors that rated the suggested provider, Pro.
AdvA indicates the initial reputation value of provider, Pro, according to the
rates which reported by advisors, A.
AdvqRe is the reliability that requester evaluates for rater advisor agent, Adv.
C shows the total number of criteria.
c
oai Pr is the total satisfaction value which rater advisor agent, ia , gives to its
suggested provider, Pro, according to their previous interactions
Advait shows the weight for each rating by considering more weight to more
recent interaction with suggested provider, Pro
sIntractioni oa
Si oa
oa
i
i
i i
j
Pr
Pr
Pr denotes the proportion of the number of previous
satisfying interactions to the total number of previous interactions between rater advisor,
ia , and provider, Pro
c
qwRe isthe preferences of requester as an importance weight of each criterion, as
shown in Table 3.2.
The final formula for calculating the reputation of each provider is as follows:
oA
Mno
M
mPrPr
(4.25)

111
Where:
oPr indicated the reputation value of provider, Pro
m is the total number of advisors that rated provider, Pro
M is the total number of advisors
oA Pr is the initial reputation value of a specific provider, Pro, obtained by
equation (4.24).
4.2.3.2 Disbelief of each provider
Disbelief values of suggested providers are computed based on their disrepute
value; their unreliability is zero when they do not have any direct interaction with
requester. Thus, disbelief value of each provider is measured as:
}{ Re
RePrPrPrRe
Pr
)||(
AdvAa Advq
Aa Cc
c
qoaoa
c
oaAdvq
oA
i
i iii
c
wtd
(4.26)
Where:
},...,,{ 21 maaaA is the advisors that rated other advisors
AdvAd indicates the initial disrepute of provider, Pro, according to the rate of
advisors, A
AdvqRe is the reliability that requester evaluates for rater advisor agent, Adv
C shows the total number of criteria

112
c
oai Pr is the total dissatisfaction value which rater advisor agent, ia , gives to
provider, Pro, according to their previous interactions
oait Pr shows the weight for each rating by considering more weight to more
recent interaction with suggested provider, Pro
sIntractioni oa
Si oa
oa
i
i
i i
j
Pr
Pr
Pr denotes the proportion of the number of previous
dissatisfying interactions to the total number of previous interactions between rater
advisor, ia , and provider, Pro
c
qwRe isthe preferences of requester as an importance weight of each criterion, as
shown in Table 4.1.
Moreover, the number of agents that sent their ratings of dissatisfaction affects
the accuracy of the disrepute value. As the number of advisors that participate in
computation of the disrepute grows, the disrepute value will be more accurate. Hence,
the final formula for calculating the disrepute of advisor, Adv, is:
AdvA
MmAdv d
M
md
(4.27)
Where:
Advd indicates disrepute of advisor, Adv
Mmm is the total number of advisors that rated advisor, Adv, and participated
in computing the reputation value of advisor, Adv
M is the total number of advisors

113
AdvAd is the initial disrepute value of a specific advisor, Adv, obtained by
equation (4.26).
4.2.3.3 Uncertainty of each provider
Considering the Evidence-based trust model (Wang & Singh, 2010), the
uncertainty of each suggested provider is calculated based on the number of previous
satisfying and dissatisfying interactions between advisors and their suggested provider.
Therefore, the requester takes into account the uncertainty of predicting the future
behavior of each provider according to the rating reported by advisors as follows:
AdvAdv CU 1= (4.28)
Where:
AdvU indicates the uncertainty in outcomes of advisor, Adv
1
0 1
0
|)1(
)1(|
2
1dx
xx
xxC
dss
dss
Adv shows the certainty of binary evidence ),( dss .
Where:
s shows the total number of previous satisfying interactions between advisors
and providers
ds represents the total number of previous dissatisfying interactions between
advisors and providers.

114
4.2.3.4 Conflict of each provider
Moreover, conflict in previous behaviors of each provider, is computed with the
same formula as computing conflict in behaviors of advisors, as follows:
)1,min(Pr t
sC o (4.29)
Where:
oCPr indicates the conflict in behaviors of provider, Pro
s representsthe total previous satisfying interactions between advisors and an
specific suggested provider, Pro
t isthe total previous satisfying and also dissatisfying interactions between
advisors and an specific suggested provider, Pro
Ultimately the requester evaluates the trustworthiness of each provider as:
),,,( PrPrPrPrPr ooooo CUDBBT (4.30)
Where:
oTPrindicates the trustworthiness of provider, Pro, and ]1,0[AdvT
oBPrrepresents the belief of provider, Pro
oDBPrshows the disbelief of provider, Pro

115
),,,( EEEE CUD ),,,( BBBB CUD
oUPris uncertainty in outcomes of provider, Pro
oCPrdenotes conflict in behaviors of provider, Pro
Figure 4.5 represents that the requester R evaluated the trustworthiness of each
providera and b, based on the reports collected from advisors A, B, and E.
Figure 4.5: Evaluating trustworthiness of each provider
4.2.4 Trust transitivity
To select the trustworthy provider, the trust transitivity between each requester
and its suggested provider should be evaluated. For evaluating the trust transitivity in
the multi-agent environments, the Dezert-Smarandache theory (Wang & Sun, 2009) is
applied. According to the Dezert-Smarandache theory (Wang & Sun, 2009), the general
frame of discernment of the problem under consideration is },{ DBB , which is
b
a A
E
R
B
),,,( AAAA CUD
),,,( aaaa CUD
),,,( BBBB CUD

116
based on two hypotheses: B (agent, A, trusts agent, B) and DB (agent, A, distrusts
agent, B). In addition, the hyper-power set D is defined as:
},,,,{ DBBDBBDBBD (4.31)
Where:
B shows the belief value of the agent in the set, D .
DB represents the disbelief value of the agent in the set, D .
UDBB indicates the uncertainty value of the agent in the set, D .
CDBB denotes the conflict value of the agent in the set, D .
and a general basic belief assignment (gbba) is a function as:
]1,0[: Dm (4.32)
Where:
DAAm
m
1)(
0)(
In fact, the trust evaluation of one agent to another one can be described by the
gbba m(.) as:
})({Bm describes value of belief.
})({DBm represents the value of disbelief.

117
})({})({ UmDBBm identifies the value of uncertainty
})({})({ CmDBBm is the value of conflict caused by paradoxical behaviors
Then, the trust combination happens when one advisor suggested a specific
provider, Pro.
Suppose that the trust evaluation of requester, Req, to advisor agent, Adv, is:
}))({},({}),({}),({( ReReReReRe CmUmDBmBmT AdvqAdvqAdvqAdvqAdvq (4.33)
andAdv’s trust evaluation of provider, Pro is as follows:
}))({},({}),({}),({( PrPrPrPrPr CmUmDBmBmT oAdvoAdvoAdvoAdvoAdv (4.34)
Then the trust transitivity evaluation through this referral chain is calculated as:
oAdvAdvqoq TTT PrRePrRe (4.35)
Where:
}))({}))({})({(})({ PrReRePrRe BmCmBmBm oAdvAdvqAdvqoq (4.36)
}))({}))({})({(})({ PrReRePrRe DBmCmBmDBm oAdvAdvqAdvqoq (4.37)

118
}))({}))({})({(})({ PrReRePrRe CmCmBmCm oAdvAdvqAdvqoq (4.38)
})({})({})({1})({ PrRePrRePrRePrRe CmDBmBmUm oqoqoqoq
(4.39)
Another approach in transitivity of trust is trust aggregation, when more than
one advisor suggests the same provider.
Suppose 1m and 2m are two independent gbba then trust aggregation is
calculated as:
qAdvAdvqoq TTT ReRePrRe (4.40)
Where:
CBA
DBA BmAmBmAmCm , 2121 )()()()()( (4.41)
}))({}),({}),({}),({()( Pr1Pr1Pr1Pr11 CmUmDBmBmAm oAdvoAdvoAdvoAdv (4.42)
}))({}),({}),({}),({()( Pr2Pr2Pr2Pr22 CmUmDBmBmBm oAdvoAdvoAdvoAdv (4.43)
Therefore, trust transitivity of each chain is evaluated according to trust
combination and trust aggregation.
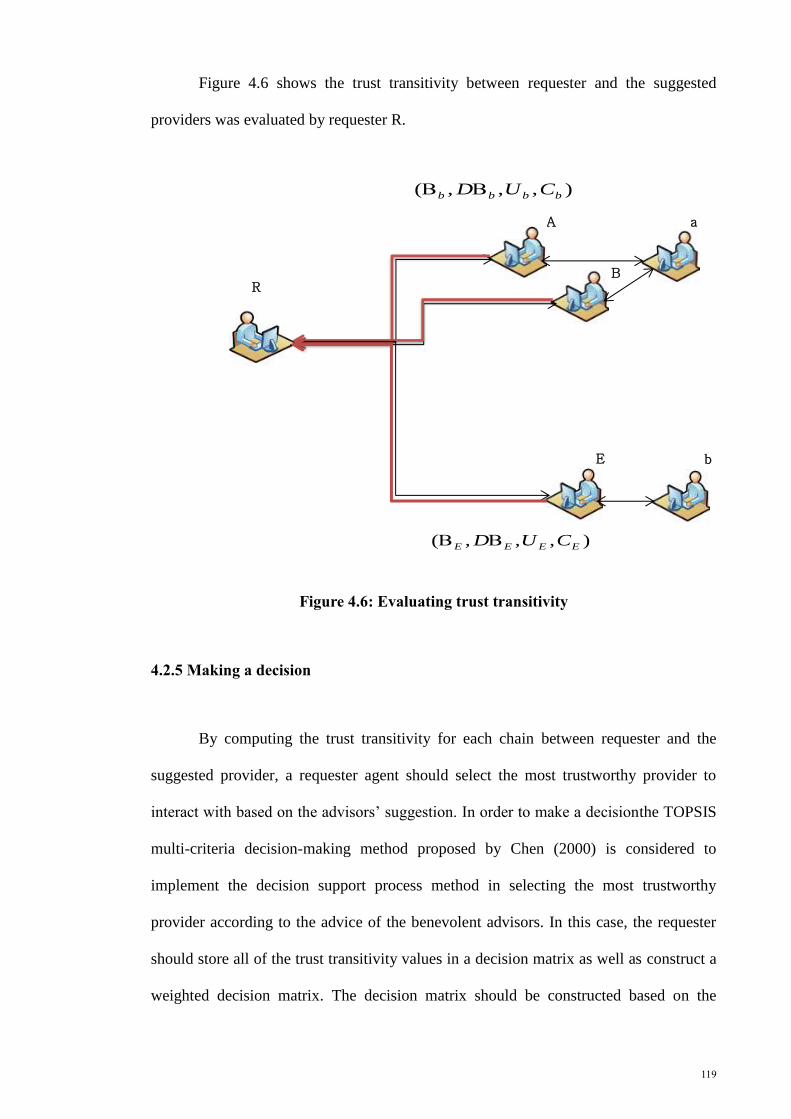
119
Figure 4.6 shows the trust transitivity between requester and the suggested
providers was evaluated by requester R.
Figure 4.6: Evaluating trust transitivity
4.2.5 Making a decision
By computing the trust transitivity for each chain between requester and the
suggested provider, a requester agent should select the most trustworthy provider to
interact with based on the advisors’ suggestion. In order to make a decisionthe TOPSIS
multi-criteria decision-making method proposed by Chen (2000) is considered to
implement the decision support process method in selecting the most trustworthy
provider according to the advice of the benevolent advisors. In this case, the requester
should store all of the trust transitivity values in a decision matrix as well as construct a
weighted decision matrix. The decision matrix should be constructed based on the
R B
A a
E b
),,,( EEEE CUD
),,,( bbbb CUD

120
belief, disbelief, uncertainty, and conflict obtained from evaluating the trust transitivity.
The decision matrix is formulated as follows:
D
C
B
A
D
C
B
A
DD
CC
BB
AA
o
o
o
o
o
o
o
o
oo
oo
oo
oo
D
C
B
A
C
C
C
C
U
U
U
U
DB
DB
DB
DB
o
o
o
o
D
ConflictyUncertaDisbeliefBelief
Pr
Pr
Pr
Pr
Pr
Pr
Pr
Pr
PrPr
PrPr
PrPr
PrPr
Pr
Pr
Pr
Pr
int
(4.44)
Hence to make a decision according toTOPSIS method, the following steps
should be carried out according to the constructed decision matrix.
Stage 1: Make a decision matrix from the trust transitivity values (D).
Stage 2: Normalize the decision matrix through inclusion of the trust transitivity.
Stage 3: Construct the weighted matrix by using entropy method.
Stage 4: Make the weighted normalized decision matrix using entropy method
Stage 5: Determine the shortest distance from the positive ideal rate (PIS) and
the farthest distance from the positive ideal rate (NIS), respectively.
Stage 6: Calculate the distance of each alternative from PIS and NIS,
respectively.
Stage 7: Calculate the closeness coefficient of each alternative.

121
A a
Stage 8: The ranking order of all alternatives is determined in the final stage
according to the closeness coefficient. The most trustworthy service provider can be
chosen accordingly.
The example in Figure 4.7 illustrates that requester R selects provider b based on
the decision-making process.
Figure 4.7: Decision-making process
B R
E b
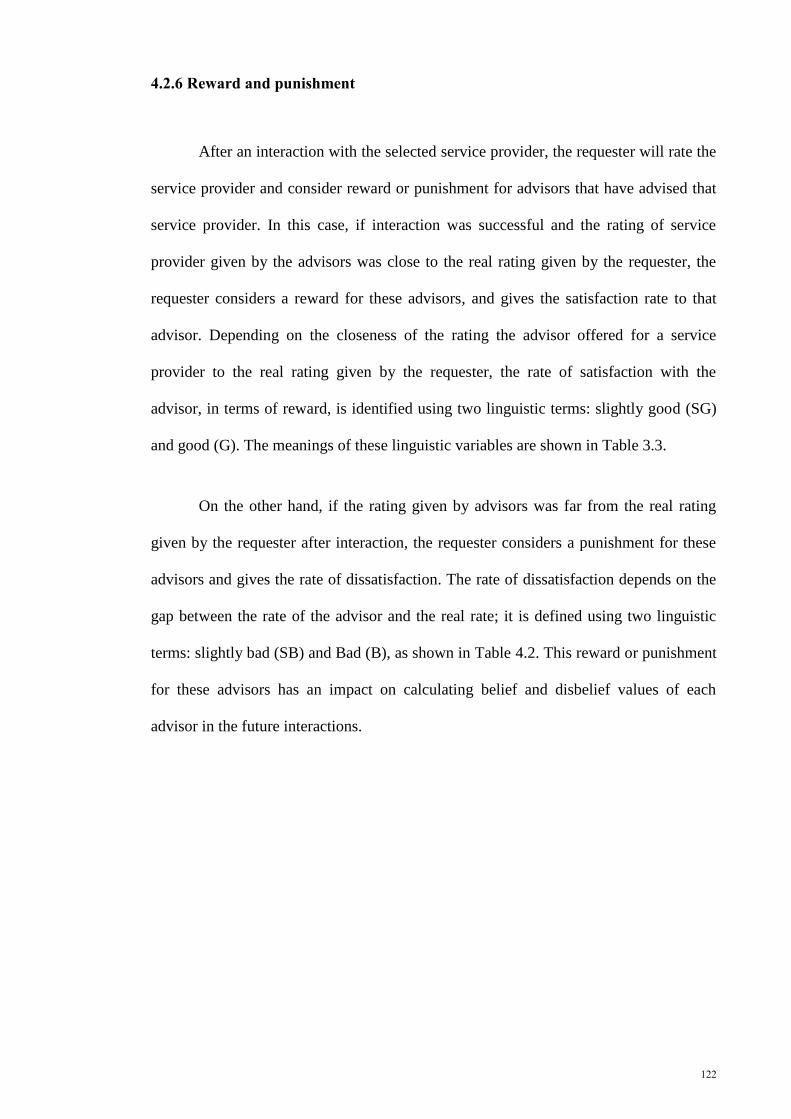
122
4.2.6 Reward and punishment
After an interaction with the selected service provider, the requester will rate the
service provider and consider reward or punishment for advisors that have advised that
service provider. In this case, if interaction was successful and the rating of service
provider given by the advisors was close to the real rating given by the requester, the
requester considers a reward for these advisors, and gives the satisfaction rate to that
advisor. Depending on the closeness of the rating the advisor offered for a service
provider to the real rating given by the requester, the rate of satisfaction with the
advisor, in terms of reward, is identified using two linguistic terms: slightly good (SG)
and good (G). The meanings of these linguistic variables are shown in Table 3.3.
On the other hand, if the rating given by advisors was far from the real rating
given by the requester after interaction, the requester considers a punishment for these
advisors and gives the rate of dissatisfaction. The rate of dissatisfaction depends on the
gap between the rate of the advisor and the real rate; it is defined using two linguistic
terms: slightly bad (SB) and Bad (B), as shown in Table 4.2. This reward or punishment
for these advisors has an impact on calculating belief and disbelief values of each
advisor in the future interactions.
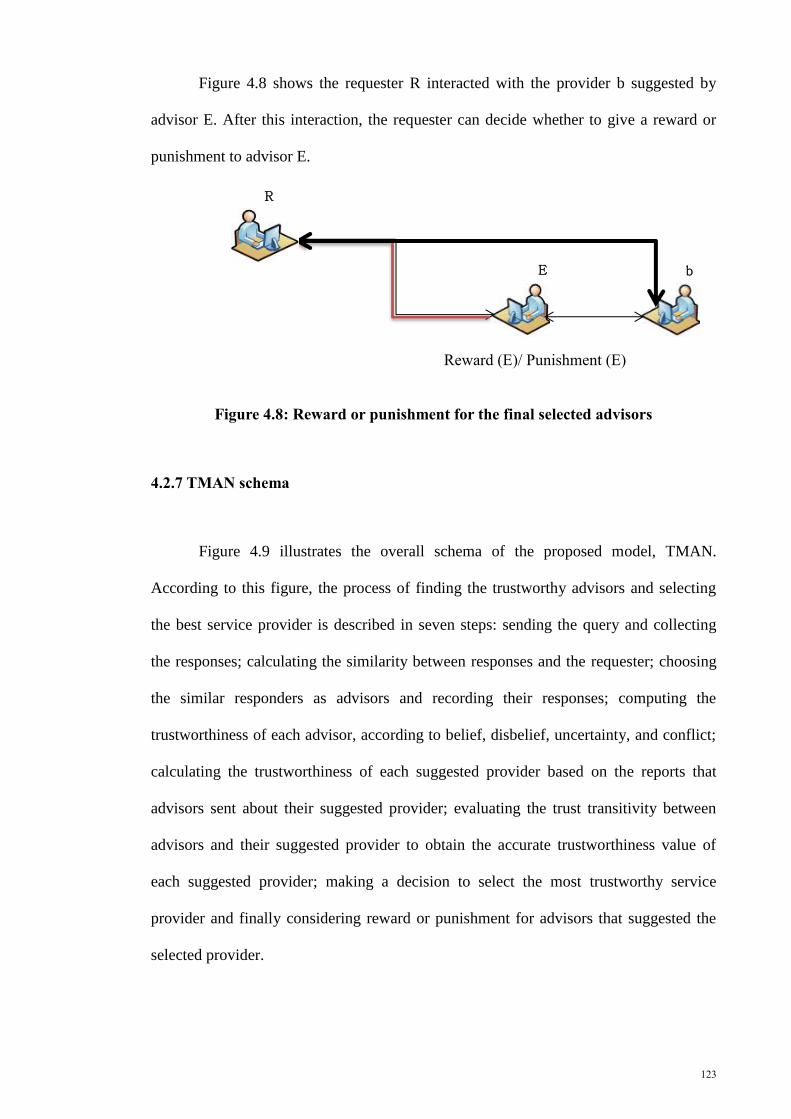
123
Reward (E)/ Punishment (E)
R
E b
Figure 4.8 shows the requester R interacted with the provider b suggested by
advisor E. After this interaction, the requester can decide whether to give a reward or
punishment to advisor E.
Figure 4.8: Reward or punishment for the final selected advisors
4.2.7 TMAN schema
Figure 4.9 illustrates the overall schema of the proposed model, TMAN.
According to this figure, the process of finding the trustworthy advisors and selecting
the best service provider is described in seven steps: sending the query and collecting
the responses; calculating the similarity between responses and the requester; choosing
the similar responders as advisors and recording their responses; computing the
trustworthiness of each advisor, according to belief, disbelief, uncertainty, and conflict;
calculating the trustworthiness of each suggested provider based on the reports that
advisors sent about their suggested provider; evaluating the trust transitivity between
advisors and their suggested provider to obtain the accurate trustworthiness value of
each suggested provider; making a decision to select the most trustworthy service
provider and finally considering reward or punishment for advisors that suggested the
selected provider.
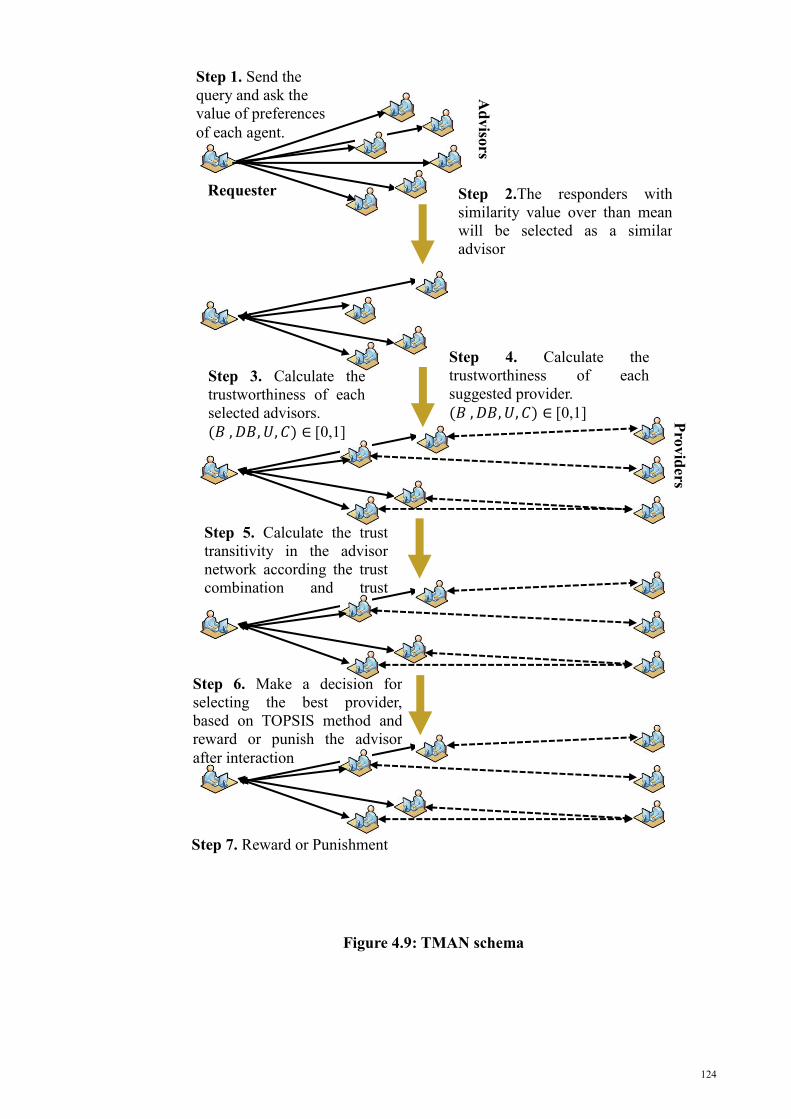
124
Figure 4.9: TMAN schema
Step 1. Send the
query and ask the
value of preferences
of each agent.
Ad
viso
rs
Step 3. Calculate the
trustworthiness of each
selected advisors.
(𝐵 , 𝐷𝐵, 𝑈, 𝐶) ∈ [0,1]
Step 4. Calculate the
trustworthiness of each
suggested provider.
(𝐵 , 𝐷𝐵, 𝑈, 𝐶) ∈ [0,1]
Step 5. Calculate the trust
transitivity in the advisor
network according the trust
combination and trust
aggregation.
Step 6. Make a decision for
selecting the best provider,
based on TOPSIS method and
reward or punish the advisor
after interaction
Step 2.The responders with
similarity value over than mean
will be selected as a similar
advisor
Requester
Pro
vid
ers
Step 7. Reward or Punishment

125
4.3Evaluation method of TMAN
After designing TMAN, the accuracy of TMAN was evaluated by using two
methods; random selection method and trade network game method. In the following
sections, each method is described in more details.
4.3.1 Random selection method
In this method, the requester, advisors, and providers were selected randomly
and also the agents rated the advisors arbitrarily using satisfying and dissatisfying
ratings, for each simulation. In this part of evaluation, the simulation environment was
constructed using the MATLAB (R2012a) simulator, according to the following
settings:
i) Composition: The analysis was performed for three distributions with two
different percentages of malicious advisors according to Gorner et al. (2013), in addition
to one more distribution in which the percentage of malicious and benevolent advisors
is equal, as shown in Table 3.5. Each analysis were repeated ten times for each group by
referring to the evaluation method presented by Gray (2008), to investigate whether
TMAN generally has the same results. Then the average results of ten times repeated for
each distribution were recorded.
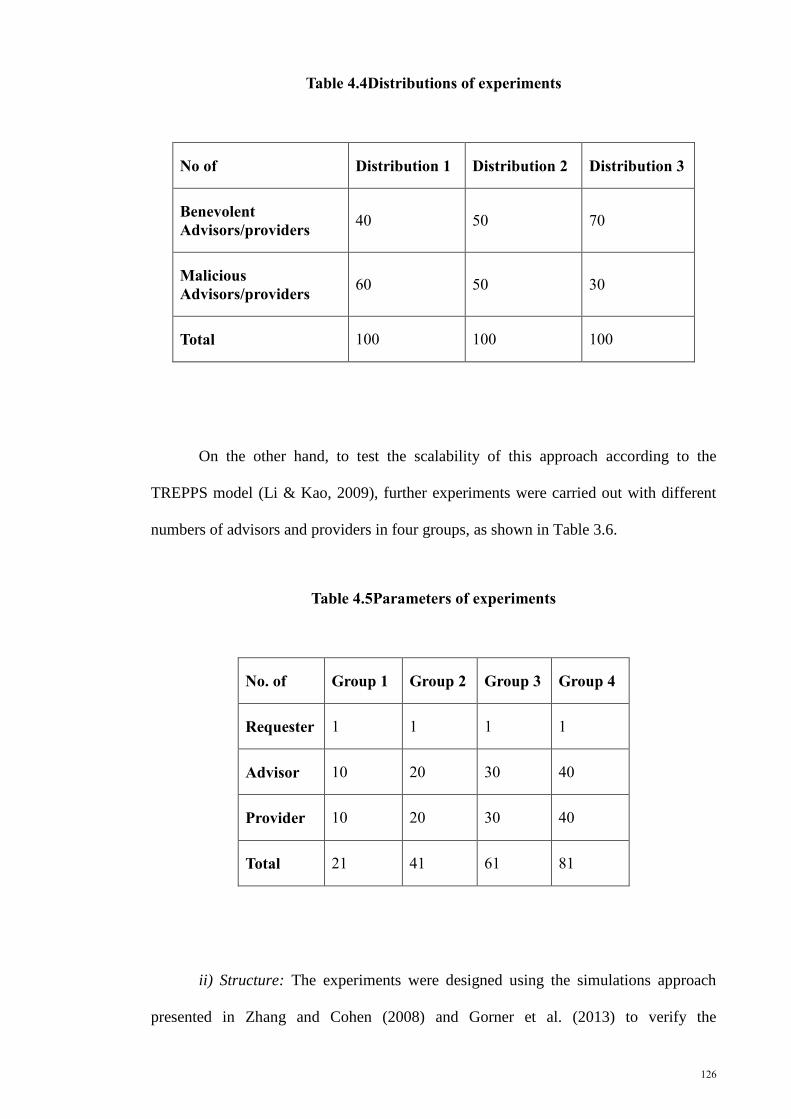
126
Table 4.4Distributions of experiments
No of Distribution 1 Distribution 2 Distribution 3
Benevolent
Advisors/providers 40 50 70
Malicious
Advisors/providers 60 50 30
Total 100 100 100
On the other hand, to test the scalability of this approach according to the
TREPPS model (Li & Kao, 2009), further experiments were carried out with different
numbers of advisors and providers in four groups, as shown in Table 3.6.
Table 4.5Parameters of experiments
No. of Group 1 Group 2 Group 3 Group 4
Requester 1 1 1 1
Advisor 10 20 30 40
Provider 10 20 30 40
Total 21 41 61 81
ii) Structure: The experiments were designed using the simulations approach
presented in Zhang and Cohen (2008) and Gorner et al. (2013) to verify the

127
performance of TMAN. According to this approach, the requester, advisors, and
providers were selected randomly and also the agents rate the advisors arbitrarily as
satisfying or dissatisfying. Each advisor and provider were selected as a benevolent one
if their random satisfying rating were in the range of (0,1], otherwise they were labeled
as a malicious one. Moreover, the preferences values of requester and advisors were
selected randomly. The total numbers of criteria, as described in Chapter 3, was
considered as four criteria consists of product quality, product price, customer service
and delivery time.
Moreover, the total times of interactions in this simulation was 100 with 10
iterations, where the results were recorded after each iteration like the evaluation
method used by Li and Kao (2009).
iii) Behavior: First, the requester agent sent a query randomly to its neighbors.
When the neighbors,whichwere the advisor agents received a query, they replied based
on the related providers which have had a relationship with them. Then, the requester
recorded the responses of the queries and evaluated the trustworthiness of each
responder. After each interaction between agents, the relationship between agents was
updated.
4.3.1.1 Average accuracy of TMAN
The average accuracy of TMAN was evaluated to calculate the performance of
TMAN. The aim of this step is to study the average accuracy of TMAN in determining
the trustworthiness of advisors and providers and also study the average accuracy of
TMAN in evaluating trust transitivity among agents. According to the evaluation
method used by Li and Kao (2009), the average accuracy can be calculated as the

128
average timesof calculating the belief, disbelief, reliability, unreliability, reputation and
disrepute of benevolent and malicious agent accurately in the iteration.
4.3.1.2 Comparing the performance of the TMAN with other existing models
In this step, we compared the performance of TMAN in comparison with the
approaches employed in other existing models: Evidence-based trust model (Wang &
Singh, 2010), and TREPPS model (Li & Kao, 2009), in addition to a basic model. The
performance of each trust model in this experiment was determined as the average times
of selecting a benevolent provider. Based on TREPPS model, the average accuracy was
calculated as the average times of choosing benevolent providers, as advised by the
selected benevolent advisors in the iteration. The expectation was that the average
accuracy of performance of TMAN in selecting the benevolent providers can be better
than that of other models in different iterations with various numbers of malicious and
benevolent advisors.
The performance of TMAN was compared to the models which used for
proposing it. Among all models were applied for computing Reliability and finally
integration these three components to select the most trustworthy agent, Evidence-based
Trust Model and TREPPS Model selected as a benchmark because these models have
more similarity with TMAN. The mathematical method of TMAN and Evidence-based
Trust Model are both based on subjective logic. Moreover Evidence-based Trust Model
considered three conditions, as a selection method, for selecting the most trustworthy
agent and TREPPS model applied FTOPSIS method to select the most trustworthy
provider. Whereas other models presented an evaluation method for trustworthiness of
agent but they did not propose the selection method to select the agent with highest
trustworthiness. Hence, to compare TMAN with other models and investigate whether

129
TMAN can select trustworthy agents in different multi-agent environments with various
numbers of agents, Evidence-based Trust Model and TREPPS can be used as
comparable models.
4.3.2 Evaluation plan with trust network game approach
In the second method of evaluation, the performance of TMAN was evaluated
by simulating an auction behavior,referring to Gray (2008). According to this method, a
series of experiments was carried out in which an auction behavior was simulated, using
a version of the trade network game simulator (McFadzean & Tesfatsion 1999) that has
been used to simulate a simple auction environment. However, this method did not
consider the similarity between agents because the preferences of advisors were not
clarified and the preference of agent was considered as one, in addition the advisors
could not rate each other so this is the specific case that the reputation of advisors is
zero. According to TNG method each advisor can suggest a similar provider; it means
that the advisor with consistent behavior suggests the provider with consistent behavior,
also the advisor with mild oscillating behaviors can suggest the provider with the mild
oscillating behaviors, because their profile settings are the same
Trade Network Game (TNG) is a framework for studying the formation and
evolution of trade among strategically interacting traders (buyers, sellers, and dealers)
operating under different specified market protocols. In this study, the buyer was
considered as requester agent, seller as provider agent and dealer as advisor agent.
TNG blends and extends the standard matching theory and sequential game
theory, where each trader must jointly determine over time whom to seek trades with
(partner selection) and how to behave in any trade interactions that take place (strategy
130
selection). Each TNG trader in a bilateral trade can either play the role of C (cooperate)
or D (defect). The TNG GUI screen permits the user to specify arbitrary payoffs for the
four situations that a trader could find itself in as a result of a bilateral trade: CC (both
cooperate); DD (both defect); DC (temptation, i.e. the trader defects against a
cooperating partner); and CD (sucker, i.e. the trader is cooperating but its partner
defects against it). Thereby, for evaluating the accuracy of TMAN by using TNG
method, the payoffs of each advisor and provider was set according to identified
satisfaction and dissatisfaction rates by TMAN, as described in Chapter 3. After running
TNG, observations of advisors and also provider’s auction behaviors in each interaction
were recorded.
In order to evaluate TMAN in relation to TNG, the following parameters were
specified in the TNG simulations. First, the number of interactions between requester,
provider and advisor was configurable. Next, the behavior profile of the agents was set.
When agent’s behavior profile was set, the agent acts randomly in each interaction
according to that profile.
Gray (2008)applied the TNG method for evaluating its proposed trust model
based on two cases, consistently behavior and oscillating behaviors. With reference to
Gray (2008), TMAN was evaluated based on three different cases; consistently
behavior, mild oscillating behavior, and strong oscillating behavior.
In this part of evaluation, the intent was to see how well TMAN performs in
each of the following three cases: case one, in which agents displayed consistently
behavior in simulated auction; case two, in which agents showed mild oscillating
behavior; case three, in which agents represented strong oscillating behaviors.

131
The purpose of this analysis was to evaluate how well TMAN calculates the
trustworthiness of advisors and providers based on the observation of their behaviors in
past interactions, which leads to selecting the most trustworthy provider.
The pattern that was applied for the evaluation of case one with consistently
normal behavior is as follows: This experiment simulates the case in which advisors’
and providers’ behaviors over time are consistent for theiteration. The parameters used
for this experiment are as follows.
Parameter specification:
Total number of interactions: 16
One Advisor, one provider, and one requester– each gent had the same role as
follows for all interactions.
Behavior setting of advisor A: {
𝐶𝑜𝑜𝑝𝑒𝑟𝑎𝑡𝑖𝑜𝑛: 1𝐷𝑒𝑓𝑒𝑐𝑡𝑖𝑜𝑛: −1
𝑇𝑒𝑚𝑝𝑡𝑎𝑡𝑖𝑜𝑛: 0.5𝑆𝑢𝑐𝑘𝑒𝑟: −0.5
Behavior setting of provider A: {
𝐶𝑜𝑜𝑝𝑒𝑟𝑎𝑡𝑖𝑜𝑛: 1𝐷𝑒𝑓𝑒𝑐𝑡𝑖𝑜𝑛: −1
𝑇𝑒𝑚𝑝𝑡𝑎𝑡𝑖𝑜𝑛: 0.5𝑆𝑢𝑐𝑘𝑒𝑟: −0.5
Agent’s behavior profile remains constant: mutation rate=0.
This parameter specification presents the payoffs for cooperation, defection,
temptation and sucker situations were determined considering the satisfaction and
dissatisfaction rates which identified in Chapter 3. According to this setting, if two
agents cooperated (Cooperation), then the scores presented by TNG were between 1

132
and 0.5. These scores were consideredas the satisfying interactions with the linguistic
term of good.If the trader agents defected against their cooperating partner
(Temptation), then the scores presented by TNG were between 0.5 and 0. These scores
were considered as the satisfying interactions with the linguistic term of slightly good. If
the trader agents cooperated but their partner defected against them (Sucker), then the
score presented by TNG were between 0 and -0.5. These scores were considered as the
dissatisfying interactions with the linguistic term of slightly bad; and finally if both
agents defected (Defection), then the score presented by TNG were between -0.5and -1.
This indicated the dissatisfying interactions with the linguistic term of bad.
Moreover, in this case mutation rate is zero which represents that the agents
displayed consistently normal behavior without any oscillating behavior.
The pattern that was used for the evaluation of case two with oscillating
behavior is the same as the pattern which used by case one but in this case the agents
can change their behaviors during the interactions. This pattern is explained as follows:
In this experiment, providers and advisors oscillate their behaviors during the
auction. This experiment was also based on one advisor and one provider as follows.
Parameter Specification:
Total number of interactions: 16
One Advisor, one provider, and one requester– each gent had the same role as
follows for all interactions.
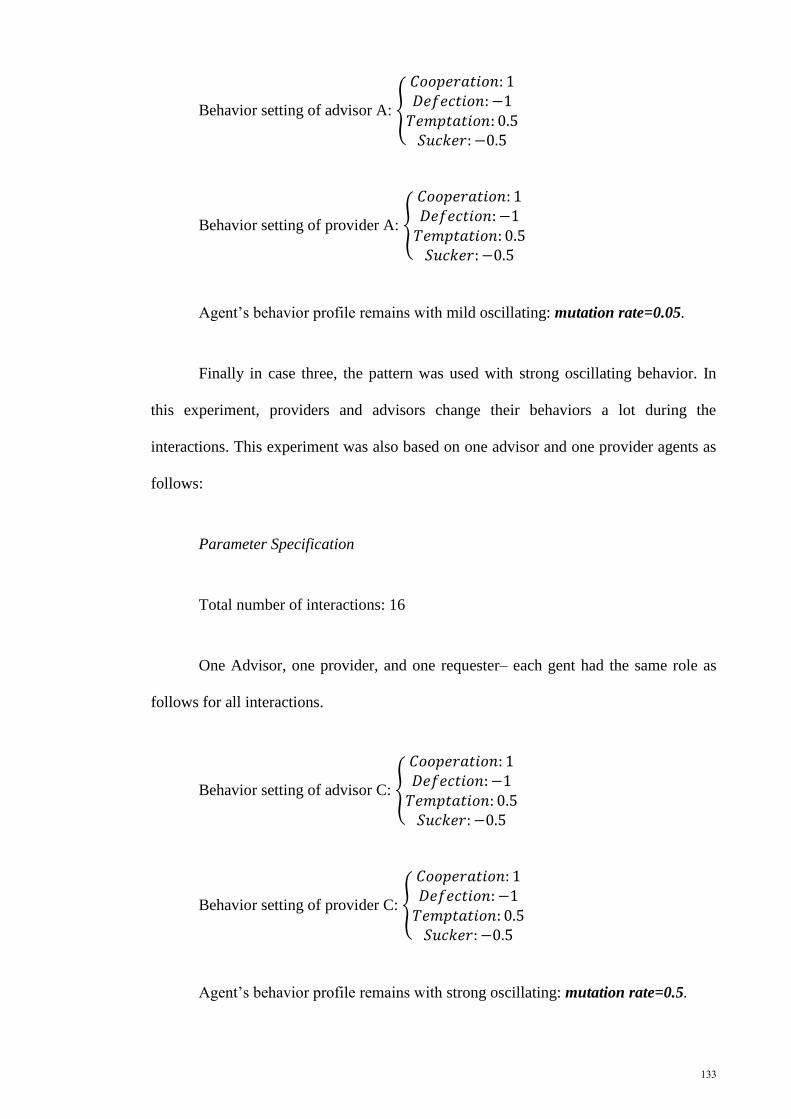
133
Behavior setting of advisor A: {
𝐶𝑜𝑜𝑝𝑒𝑟𝑎𝑡𝑖𝑜𝑛: 1𝐷𝑒𝑓𝑒𝑐𝑡𝑖𝑜𝑛: −1
𝑇𝑒𝑚𝑝𝑡𝑎𝑡𝑖𝑜𝑛: 0.5𝑆𝑢𝑐𝑘𝑒𝑟: −0.5
Behavior setting of provider A: {
𝐶𝑜𝑜𝑝𝑒𝑟𝑎𝑡𝑖𝑜𝑛: 1𝐷𝑒𝑓𝑒𝑐𝑡𝑖𝑜𝑛: −1
𝑇𝑒𝑚𝑝𝑡𝑎𝑡𝑖𝑜𝑛: 0.5𝑆𝑢𝑐𝑘𝑒𝑟: −0.5
Agent’s behavior profile remains with mild oscillating: mutation rate=0.05.
Finally in case three, the pattern was used with strong oscillating behavior. In
this experiment, providers and advisors change their behaviors a lot during the
interactions. This experiment was also based on one advisor and one provider agents as
follows:
Parameter Specification
Total number of interactions: 16
One Advisor, one provider, and one requester– each gent had the same role as
follows for all interactions.
Behavior setting of advisor C: {
𝐶𝑜𝑜𝑝𝑒𝑟𝑎𝑡𝑖𝑜𝑛: 1𝐷𝑒𝑓𝑒𝑐𝑡𝑖𝑜𝑛: −1
𝑇𝑒𝑚𝑝𝑡𝑎𝑡𝑖𝑜𝑛: 0.5𝑆𝑢𝑐𝑘𝑒𝑟: −0.5
Behavior setting of provider C: {
𝐶𝑜𝑜𝑝𝑒𝑟𝑎𝑡𝑖𝑜𝑛: 1𝐷𝑒𝑓𝑒𝑐𝑡𝑖𝑜𝑛: −1
𝑇𝑒𝑚𝑝𝑡𝑎𝑡𝑖𝑜𝑛: 0.5𝑆𝑢𝑐𝑘𝑒𝑟: −0.5
Agent’s behavior profile remains with strong oscillating: mutation rate=0.5.

134
4.3.2.1 Accuracy of TMAN components
In this step, the outcome scores for each advisor and provider collected from
TNG were usedby TMAN as the rate of previous satisfying or dissatisfying interactions.
By using these recorded ratings, the trustworthiness of advisors and providers were
computed for the first fifteen interactionsby applying TMAN. Finally, the outcome
scoresof advisors and providers, presented by TNG were compared with the
trustworthiness which calculated by TMAN.
4.3.2.2 Performance of TMAN in decision-making process
By running TNG and recording the outcome scores of advisors and providers, as
the rate of satisfaction or dissatisfaction for providers and advisors, the trustworthiness
of each advisor and provider was computed. Then, the trust transitivity between
requester and the suggested providers was calculated before selecting the most
trustworthy provider by TMAN. In this step, the most trustworthy provider selected by
TMAN was compared with the presented scores by TNG for each provider in the last
interaction, to illustrate that the suggested provider that TMAN selected according to
previous interactions had the best scores in the last interaction presented by TNG.
4.4 Summary
In this chapter the process of designing TMAN has been described based on the
identified components. The design of TMAN was based on six main stages. First the
similar advisor agents have been selected (stage one), then trustworthiness of each
similar advisor was evaluated (stage two), in the next step the trustworthiness of
suggested provider which suggested by advisors were computed according to the report

135
of advisors about their suggested provider (stage three). Next transitivity of trust
between requester, similar advisors and their suggested providers were measured (stage
four), then the most trustworthy provider was selected using TOPSIS method (stage
five). After description of TMAN design, the methods of evaluation of the accuracy of
TMAN in computing each component and also the performance of TMAN in multi-
agent environments have been explained in details. The first method of evaluation was
random selection in which the average accuracy of TMAN in computing the identified
components have been studied, then by using random selection the performance of
TMAN have been compared against three other models. Second the evaluation of
TMAN in computing the identified components have been investigated by using TNG
method and finally the performance of TMAN in different multi-agent environments
have been studied according to TNG method.
136
CHAPTER 5:RESULTS AND DISCUSSION
5.1 Introduction
This chapter describes the evaluation results of the proposed model, TMAN,
which was discussed in Chapter 3. This chapter consists of two parts. The first part
discusses the results collected from the random selection method of evaluation through
four experiments; first the average accuracy of the TMAN components in computing the
trustworthiness of each advisorisinvestigated based on the results of Experiment 1.1, in
Section 5.2.1.Second, the average accuracy of the TMAN components in computing the
trustworthiness of each provider is described, in Section 5.2.2 by using Experiment 1.2.
Then, the average accuracy of TMAN in evaluation of trust transitivityis discussed
based on the results of Experiment 1.3, in Section 5.2.3. On the other hand, the
performance of TMAN is compared with that of other existing models by using
Experiment 1.4, in Section 5.2.4.
Second part discusses the performance of TMAN based on the trust network
game (TNG) as a simulator. In this part the accuracy of TMAN components in
evaluating the trustworthiness of advisors and their suggested providers is investigated
by Experiment 2.1, in Section 4.3.1.Finally the accuracy of TMAN in selecting the most
trustworthy provider is described by Experiment 2.2, in Section 4.3.2.
5.2 Part 1: Evaluation of TMAN with random selection
The random selection method consists of four experiments as discussed in the
following sections. The experiments are:

137
I. Assessment of the main components used in computing the trustworthiness of
each advisor.
II. Assessment of the main components applied in calculating the trustworthiness of
each provider.
III. Evaluation of the trust transitivity between advisors and their suggested
provider.
IV. Comparison of the performance of TMAN with other existing trust models.
The evaluation setting and the simulation environment of TMAN was described
in Phase 3, which is part of the research methodology, in Chapter 3. According to this
setting, three distributions with different percentages of benevolent and malicious
agents in four different groups with different number of advisors were considered.
According to Evidence-based trust model, the belief of benevolent agents is
higher than their disbelief. Hence, the average accuracy of TMAN in evaluating its main
components was based on this expectation that reliability, reputation, and in overall
belief values of benevolent advisors should be higher than their unreliability, disrepute
and overall disbelief, respectively. Therefore, TMAN should accurately calculate these
components, and the results should denote reliability, reputation and belief values of
benevolent advisors that are calculated by TMAN are higher than their unreliability,
disrepute and disbelief values, respectively.
In contrast, according to Evidence-based trust model, the belief of malicious
agents islower than their disbelief. Thereby, the expectation was that reliability,
reputation and belief values of malicious advisors should be lower than their

138
unreliability, disrepute and also disbelief values, respectively. Hence, TMAN should
also compute these components accurately; this means that results reported by TMAN
should represent lower reliability, reputation and belief values of malicious advisors
than their unreliability, disrepute and disbelief values.
The results obtained from running TMAN for all the distributions and groups are
described and discussed as follows.
5.2.1. Experiment 1.1: Evaluation of the advisors’ trustworthiness
In this experiment, a requester sent a query to advisors in a
simulatedenvironment; then the trustworthiness of benevolent and malicious advisors
were calculated, as described in Chapter 4.
For instance, the distribution one,as shown in Table 4.4, consisted 40% of
trustworthy and 60% untrustworthy agents and the group one, as shown in Table 4.5,
involved 10 agents. Figure 5.1 shows a sample of simulated environment for
distribution one, group one.
Figure 5.1: An example for experiment 1.1
As shown in Figure 5.1, each agent labeled as R means requester, A means
Advisor, and P means Provider. According to Table 4.5, group one was consisted of
R
A2 A3
A1
P1 P3
A4 A5
P2 P4

139
1requester, 5 advisors and 4 providers. The relationship between requester, advisors and
providers were randomly, so the requester had randomly relationship with advisors
during the running program, advisors also had relationship with each other randomly,
and each advisor had randomly relationship with one provider which was its suggested
provider. By running the program, the satisfying, dissatisfying rates gave randomly to
each cycle as shown in Table 5.1.
Table 5.1: An example of experiment 1.1
Type of agent No of Interaction Rate of interaction
R-A1 1 0.875
R-A2 1 -0.523
R-A3 1 -0.637
R-A4 1 0.786
R-A5 1 0.515
A4-A5 1 0.489
Table 5.1 illustrates the first time of interaction that the rate of satisfying and
dissatisfying interactions were identified by the system. These random rates identified
the color of cycles. If the rate which gave to cycle was satisfying the color of that cycle
was white and if the rate was dissatisfying the color of that cycle was black. These
random ratesused by presented formulas for computing the trustworthiness of advisors.
In each time of running, this scenario repeated until 100 times, and each time, the
trustworthiness of advisors was evaluated according to random satisfying and
dissatisfying rates. The result of these 100 times of interactions was recorded. The
system revealed the average result as the average accuracy of TMAN after each ten
times of interactions.

140
This simulation experiment was run 10 times, for all the distributions and groups
as identified in Tables 4.3 and 4.4 of Chapter 4. The average aggregated results of 10
times running for calculating the reliability and unreliability values ofthe benevolent
and malicious advisors are illustrated in Figure 5.2 and Figure 5.3, respectively.
Figure 5.2: Average accuracy of reliability and unreliability values for benevolent
advisors across all groups and distributions
Figure 5.3: Average accuracy of reliability and unreliability values for malicious
advisors across in each group and distribution
Dis1 Dis2 Dis3 Dis1 Dis2 Dis3 Dis1 Dis2 Dis3 Dis1 Dis2 Dis3
Group 1 Group2 Group 3 Group4
Reliability 0.342 0.583 0.562 0.523 0.657 0.635 0.491 0.634 0.662 0.563 0.677 0.7
Unreliability 0.277 0.287 0.287 0.237 0.423 0.21 0.219 0.283 0.331 0.214 0.423 0.423
00.10.20.30.40.50.60.70.8
Av
era
ge
acc
ura
cy
Average accuracy of relaibility and unreliability of benevolent
advisors
Dis1 Dis2 Dis3 Dis1 Dis2 Dis3 Dis1 Dis2 Dis3 Dis1 Dis2 Dis3
Group 1 Group2 Group 3 Group4
Reliability 0.293 0.255 0.268 0.194 0.25 0.237 0.283 0.213 0.173 0.202 0.153 0.102
Unreliability 0.343 0.443 0.475 0.348 0.504 0.421 0.332 0.502 0.498 0.401 0.533 0.544
0
0.1
0.2
0.3
0.4
0.5
0.6
Aver
ag
e acc
ura
cy
Average accuracy of relaibility and unreliability of malicious
advisors

141
Figure 5.2 and Figure 5.3 show the average accuracy of TMAN in computing
reliability and unreliability for different categories of simulation, involving three
distributions of benevolent and malicious agents with four groups of agents. As shown
in Figure 5.2, the average accuracy of reliability for benevolent advisors is higher than
their unreliability,wherever Figure 5.3 illustrates that the average accuracy of reliability
for malicious advisors is lower than their unreliability across all groups.
Figures 5.4 and Figure 5.5show the average accuracy of reputation and disrepute
for benevolent and malicious advisors.
Figure 5.4: Average accuracy of reputation and disrepute values for benevolent
advisors in each group and distribution
Dis1 Dis2 Dis3 Dis1 Dis2 Dis3 Dis1 Dis2 Dis3 Dis1 Dis2 Dis3
Group 1 Group2 Group 3 Group4
Reputation 0.544 0.654 0.642 0.565 0.622 0.773 0.603 0.687 0.795 0.656 0.755 0.893
Disrepute 0.452 0.33 0.234 0.415 0.321 0.333 0.313 0.294 0.3 0.368 0.325 0.307
0
0.2
0.4
0.6
0.8
1
Aver
age
acc
ura
cy
Average accuracy of reputation and disrepute of benevolent
advisors

142
Figure 5.5: Average accuracy of reputation and disrepute values for malicious
advisors across in each group and distribution
Figure 5.4 denotes that the average accuracy of reputation of benevolent
advisors is higher than the average accuracy of their disrepute, while Figure 5.5 shows
that average accuracy of reputation of malicious advisors is lower than their average
accuracy of disrepute.
After investigating the simulation results for evaluating reliability, unreliability,
reputation and disrepute of advisor, the evaluation results for all distributions and
groups on average accuracy of the disbelief and belief of benevolent and malicious
advisors are examined as shown in Figure 5.6, and 5.7, respectively.
Dis1 Dis2 Dis3 Dis1 Dis2 Dis3 Dis1 Dis2 Dis3 Dis1 Dis2 Dis3
Group 1 Group2 Group 3 Group4
Reputation 0.231 0.256 0.298 0.168 0.203 0.176 0.22 0.288 0.268 0.206 0.186 0.198
Disrepute 0.541 0.472 0.422 0.656 0.617 0.6 0.711 0.698 0.635 0.701 0.674 0.625
00.10.20.30.40.50.60.70.8
Aver
age
acc
ura
cy
Average accuracy of reputation and disrepute of malicious
advisors

143
Figure 5.6: Average accuracy of belief and disbelief of benevolent advisors across
in each group and distribution
Figure 5.7: Average accuracy of belief and disbelief of malicious advisors in each
group and distribution
Dis1 Dis2 Dis3 Dis1 Dis2 Dis3 Dis1 Dis2 Dis3 Dis1 Dis2 Dis3
Group 1 Group2 Group 3 Group4
Belief 0.423 0.465 0.631 0.48 0.671 0.397 0.569 0.626 0.743 0.623 0.731 0.85
Disbelief 0.382 0.322 0.271 0.255 0.382 0.247 0.269 0.242 0.239 0.207 0.274 0.234
00.10.20.30.40.50.60.70.80.9
Av
era
ge
acc
ura
cy
Average accuracy of belief and disbelief of benevolent
advisosrs
Dis1 Dis2 Dis3 Dis1 Dis2 Dis3 Dis1 Dis2 Dis3 Dis1 Dis2 Dis3
Group 1 Group2 Group 3 Group4
Belief 0.281 0.255 0.289 0.18 0.212 0.194 0.202 0.196 0.187 0.204 0.151 0.103
Disbelief 0.422 0.394 0.454 0.368 0.513 0.45 0.56 0.561 0.566 0.491 0.561 0.577
0
0.1
0.2
0.3
0.4
0.5
0.6
0.7
Aver
age
acc
ura
cy
Average accuracy of belief and disbelief of malicous advisors

144
In fact, Figure 5.6 and Figure 5.7 show that TMAN can accurately evaluate the
belief and disbelief of advisors, since the average accuracy of belief value for
benevolent advisors is higher than their average accuracy of disbelief, as shown in
Figure 5.6. On the other hand, the average accuracy of belief for malicious advisors is
less than their average accuracy of disbelief, as shown in Figure 5.7.
Figure 5.8, Figure 5.9 and Figure 5.10 illustrate the total average accuracy of
TMAN in computing reliability, unreliability, reputation, disrepute, belief and disbelief
across all groups and distributions.
Figure 5.8: Average accuracy of reliability and unreliability for all groups and
distributions of benevolent and malicious advisors
Reliability Unrelaiability
Benevolent 0.565 0.277
Malicious 0.229 0.445
0.00
0.10
0.20
0.30
0.40
0.50
0.60
Aver
age
acc
ura
cy
Average accuracy for 100 iteration
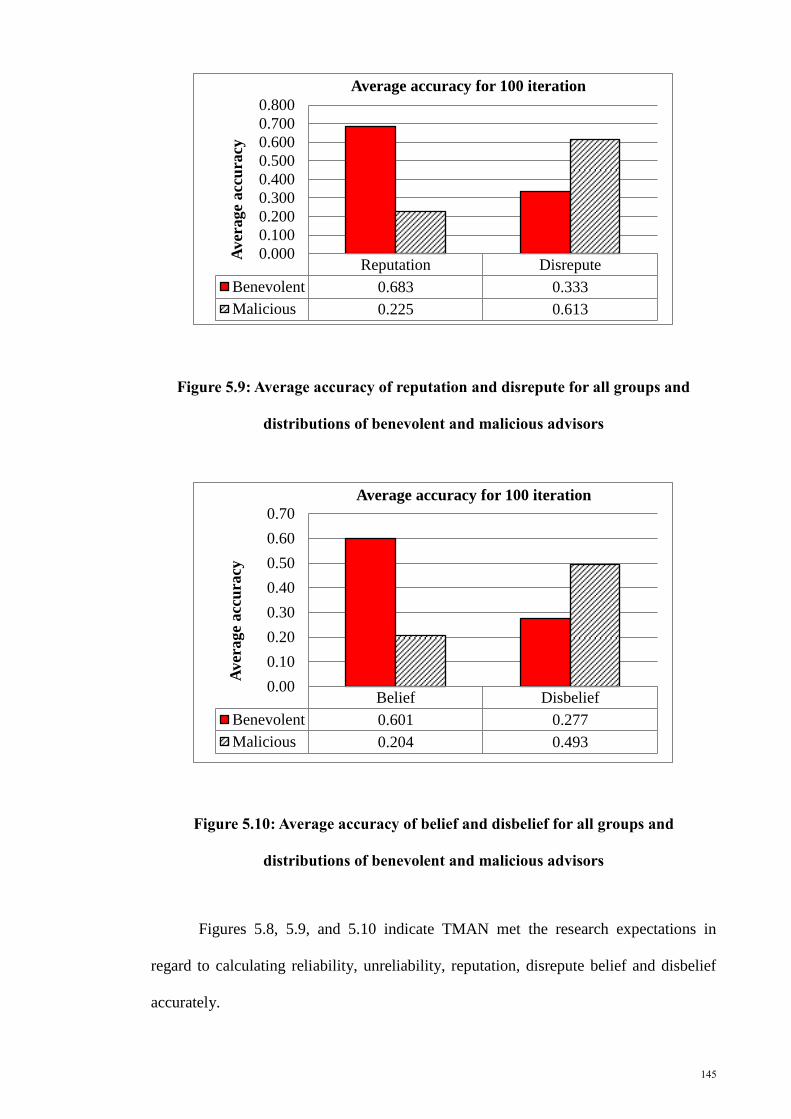
145
Figure 5.9: Average accuracy of reputation and disrepute for all groups and
distributions of benevolent and malicious advisors
Figure 5.10: Average accuracy of belief and disbelief for all groups and
distributions of benevolent and malicious advisors
Figures 5.8, 5.9, and 5.10 indicate TMAN met the research expectations in
regard to calculating reliability, unreliability, reputation, disrepute belief and disbelief
accurately.
Reputation Disrepute
Benevolent 0.683 0.333
Malicious 0.225 0.613
0.000
0.100
0.200
0.300
0.400
0.500
0.600
0.700
0.800
Aver
age
acc
ura
cy
Average accuracy for 100 iteration
Belief Disbelief
Benevolent 0.601 0.277
Malicious 0.204 0.493
0.00
0.10
0.20
0.30
0.40
0.50
0.60
0.70
Aver
age
acc
ura
cy
Average accuracy for 100 iteration

146
In fact, experiment one studied the average accuracy of the TMAN components
used in evaluating the trustworthiness of advisors. The results showed that TMAN can
manage the expectations of these components in computing the reliability, unreliability,
reputation, disrepute, belief and also disbelief of advisors. Thereby the proposed
formulas for evaluating belief and disbelief of advisors can accurately calculate the
trustworthiness of advisors
5.2.2 Experiment 1.2: Evaluation of the trustworthiness of providers
The trustworthiness of each provider is also based on belief, disbelief,
uncertainty, and conflict. According to TMAN, the reliability and unreliability values of
providers are zero, because the providers do not have any direct interactions with
requester. Therefore, the value of belief for provider is calculated solely based on
reputation, and disbelief is measured based on disrepute. In this experiment, the average
accuracy of TMAN in evaluating the belief and disbelief of providers was examined.
For instance, distribution two involved 50% trustworthy and 50% untrustworthy agents
and the group one had 10 agents. Figure 5.11 shows a sample of simulated environment
for distribution two, group one.
Figure 5.11:An example for experiment 1.1
A2 A3
A1
P1 P3
A4 A5
P2 P4
R

147
As shown in Figure 5.11 trustworthy agents shows by the cycle white color,
which selected randomly and untrustworthy agents selected by cycle black color. As
shown in Table 4.5, group one was consisted of 1 requester, 5 advisors and 4 providers
that was labeled in Figure 5.11. Requester had randomly relationship with advisors,
advisors also had relationship with each other randomly, and each advisor had randomly
relationship with one provider which was its suggested provider. By running the
program, the satisfying, dissatisfying rates were given to each cycle randomly as shown
in Table 5.2.
Table 5.2:An example of experimentation 1.1
Type of agent No of Interaction Rate of interaction
P1 1 0.675
P2 1 -0.432
P3 1 0.813
P4 1 -0.667
Table 5.2 shows random rate of satisfying and dissatisfying rates for providers
used by presented formulas for calculating the trustworthiness of providers. In each time
of running, this scenario was repeated 100 times, and the trustworthiness of providers
wascomputed according to random satisfying and dissatisfying rates. The system
proposed the average result after each ten times.
Similar to experiment one, the expectation in this evaluation is that the average
accuracy of belief of benevolent providers is higher than the average accuracy of their
disbelief. This experiment examined whether TMAN can address this expectation and

148
compute the average accuracy of belief and disbelief for both benevolent and malicious
providers accurately.
The evaluation result of belief and disbelief of benevolent providers is shown in
Figure 5.12.
Figure 5.12: Average accuracy of belief and disbelief of benevolent providers in
each group and distribution
Moreover, the summary of the average accuracy of belief and disbelief of
malicious agents is shown in Figure 5.13.
Dis1 Dis2 Dis3 Dis1 Dis2 Dis3 Dis1 Dis2 Dis3 Dis1 Dis2 Dis3
Group 1 Group2 Group 3 Group4
Belief 0.521 0.686 0.692 0.649 0.703 0.672 0.5 0.687 0.719 0.612 0.734 0.752
Disbelief 0.342 0.199 0.25 0.261 0.143 0.234 0.232 0.13 0.132 0.301 0.231 0.123
0
0.1
0.2
0.3
0.4
0.5
0.6
0.7
0.8
Aver
ag
e a
ccu
racy
Average accuracy of belief and disbelief of benevolent providers

149
Figure 5.13: Average accuracy of belief and disbelief of malicious providers in each
group and distribution
Considering the expectation that the average accuracy of belief for benevolent
providers should be higher than the average accuracy of disbelief, Figure 5.12 illustrates
that TMAN achieved the expectation for benevolent providers. While the average
accuracy of belief for malicious providers should be less than the average accuracy of
their disbelief, Figure 5.13 shows that TMAN also managed to meet the expectation for
malicious providers.
The total average accuracy of belief and disbelief for providers across all groups
and distributions is denoted in Figure 5.14.
Dis1 Dis2 Dis3 Dis1 Dis2 Dis3 Dis1 Dis2 Dis3 Dis1 Dis2 Dis3
Group 1 Group2 Group 3 Group4
Belief 0.314 0.333 0.325 0.278 0.224 0.173 0.146 0.241 0.202 0.193 0.243 0.271
Disbelief 0.501 0.443 0.401 0.616 0.457 0.516 0.59 0.618 0.516 0.638 0.651 0.688
0
0.1
0.2
0.3
0.4
0.5
0.6
0.7
0.8
Aver
age
acc
ura
cy
Average accuracy of reputation and disrepute of benevolent
providers

150
Figure 5.14: Total average accuracy of belief and disbelief across all groups
As shown in Figure 5.14, the total average accuracy of belief for benevolent
providers is higher. Moreover, Figure 5.14 indicates that the total average accuracy of
belief for malicious providers is less than the total average accuracy of their disbelief.
Thus, this figure verifies that TMAN also evaluated the belief and disbelief of providers
accurately.
5.2.3 Experiment 1.3: Trust transitivity between advisors and providers
Trust transitivity should evaluate the referral trust between advisors and their
suggested provider. As discussed in Chapters 2 and 4, trust transitivity can combine and
aggregate trustworthiness of advisors and providers. Thus, for assessing the average
accuracy of trust transitivity in an advisor network by using TMAN, the combination
and aggregation of advisors and their suggested provider were measured. The
expectation was that just like experiments one and two, after transitivity of trust, the
belief of benevolent providers should be higher than their disbelief, while the belief of
malicious providers should be less than their disbelief values.
Belief Disbelief
Benevolent 0.661 0.215
Malicious 0.245 0.553
0.000
0.100
0.200
0.300
0.400
0.500
0.600
0.700
Av
era
ge
acc
ura
cy
Average accuracy for 100 iteration

151
In this experiment, trust transitivity between advisors and providers was
evaluated based on the average accuracy of TMAN in calculating trust transitivity.
For instance, distribution three, as shown in Table 4.4, consisted 70% of
trustworthy agents, 30% untrustworthy ones and the group one involved 10 agents
including 1 requester, 5 advisors and 4 providers. Figure 5.15 shows a sample of this
simulated environment for distribution three, group one.
Figure 5.15: An example for experiment 1.3
As shown in Figure 5.15 trustworthy agents were selected randomly and the
system rated each cycle as satisfying and dissatisfying interactions which the white
cycles show the trustworthy agents with satisfying rates, while black cycles illustrate
dissatisfying interactions. Requester had randomly relationship with advisors, advisors
also had random relationship with each other, and each advisor had random relationship
with one provider which was its suggested provider. By running the program, the
satisfying, dissatisfying rates randomly give to each advisor and provider as shown in
Table 5.3.
A2 A3
A1
P1 P3
A4 A5
P2 P4
R

152
Table 5.3:An example of experimentation 1.1
Agent Interaction Trustworthiness Untrustworthiness Uncertainty Conflict
A1 1 0.865 0.342 0.216 0.853
A2 1 0.287 0.764 0.748 0.479
A3 1 0.765 0.354 0.248 0.736
A4 1 0.436 0.789 0.931 0.129
A5 1 0.783 0.327 0.878 0.256
P1 1 0.902 0.297 0.769 0.392
P2 1 0.459 0.643 0.527 0.748
P2 1 0.392 0.135 0.658 0.329
P3 1 0.482 0.768 0.842 0.118
P4 1 0.369 0.538 0.467 0.253
Table 5.3 shows trustworthiness, untrustworthiness, uncertainty and conflict of
each agentTMAN used byrandom rate of satisfying and dissatisfying for each agents as
were illustrated in Table 5.1 and 5.2. The calculated values for trustworthiness,
untrustworthiness, uncertainty and conflict of agents were applied by presented
formulas for calculating the trust transitivity of providers. This scenario was repeated
100 times. The result of trust transitivity of each provider in 100 times of
interactionswas recorded and the system presented the average result after each ten
times.

153
Figure 5.16 represents the average accuracy of belief and disbelief for
benevolent providers achieved by transitivity of trust between advisors and their
suggested providers.
Figure 5.16: Average accuracy of belief and disbelief of benevolent providers after
trust transitivity in each group and distribution
As shown in Figure 5.16, the average accuracy of belief for benevolent providers
is higher than the average accuracy of their disbelief after trust transitivity. On the other
hand, the average accuracy of belief and disbelief value for malicious providers after
trust transitivity is illustrated in Figure 5.17.
Dis1 Dis2 Dis3 Dis1 Dis2 Dis3 Dis1 Dis2 Dis3 Dis1 Dis2 Dis3
Group 1 Group2 Group 3 Group4
Belief 0.411 0.584 0.602 0.572 0.613 0.621 0.551 0.631 0.642 0.593 0.652 0.683
Disbelief 0.302 0.249 0.19 0.227 0.178 0.21 0.232 0.19 0.16 0.292 0.22 0.203
0
0.1
0.2
0.3
0.4
0.5
0.6
0.7
0.8
Av
era
ge
acc
ura
cy
Average accuracy of belief and disbelief of benevolent providers
after trust transitivity
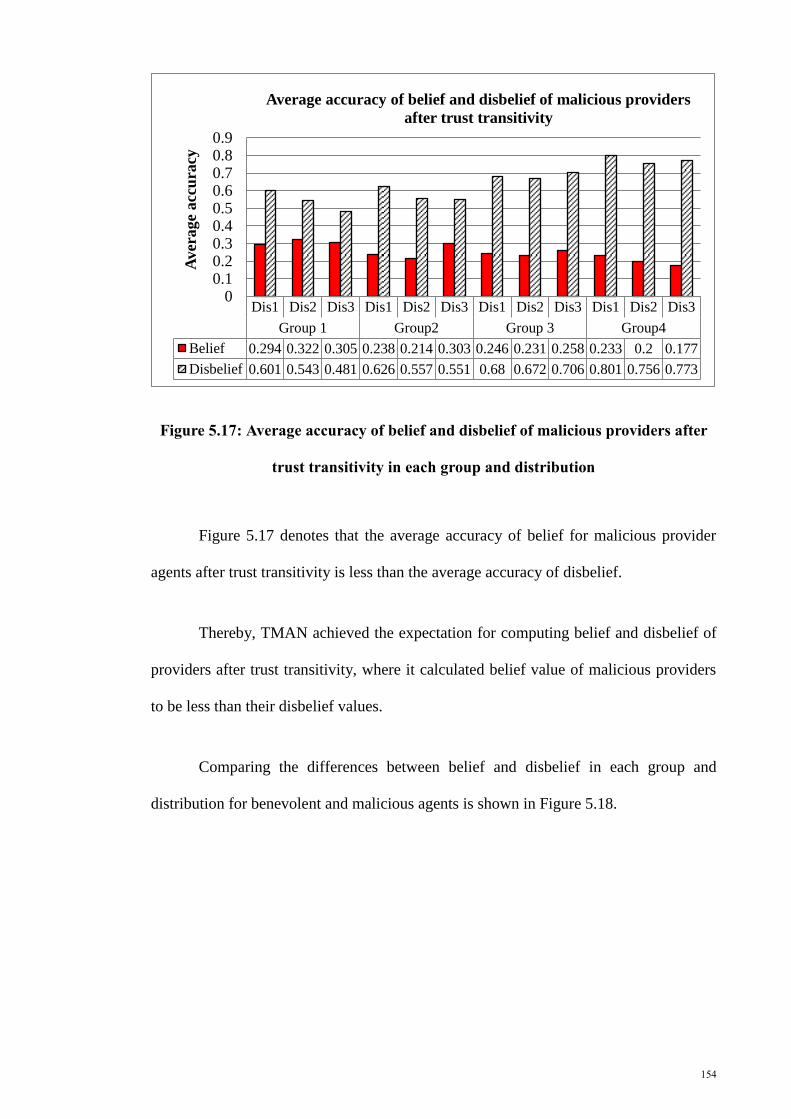
154
Figure 5.17: Average accuracy of belief and disbelief of malicious providers after
trust transitivity in each group and distribution
Figure 5.17 denotes that the average accuracy of belief for malicious provider
agents after trust transitivity is less than the average accuracy of disbelief.
Thereby, TMAN achieved the expectation for computing belief and disbelief of
providers after trust transitivity, where it calculated belief value of malicious providers
to be less than their disbelief values.
Comparing the differences between belief and disbelief in each group and
distribution for benevolent and malicious agents is shown in Figure 5.18.
Dis1 Dis2 Dis3 Dis1 Dis2 Dis3 Dis1 Dis2 Dis3 Dis1 Dis2 Dis3
Group 1 Group2 Group 3 Group4
Belief 0.294 0.322 0.305 0.238 0.214 0.303 0.246 0.231 0.258 0.233 0.2 0.177
Disbelief 0.601 0.543 0.481 0.626 0.557 0.551 0.68 0.672 0.706 0.801 0.756 0.773
00.10.20.30.40.50.60.70.80.9
Aver
age
acc
ura
cy
Average accuracy of belief and disbelief of malicious providers
after trust transitivity

155
Figure 5.18: Comparing the differences between belief and disbelief of benevolent
and malicious providers
As shown in Figure 5.18, the differences between belief and disbelief of
benevolent advisors increased by growing the number of agents; group 4 with 20
advisors shows the highest differences between belief and disbelief values. However
this increase is not steady. In fact, the peak points of this increase, which identified in
Figure 5.18, happened in distribution three and two for benevolent agents with the same
percentage of 50 percentages and 70 percentages benevolent, respectively, it is obvious
that in these two distributions the numbers of benevolent agents were more than
malicious ones, thereby the average accuracy of benevolent agents in these two groups
are higher. In contrast, the peak points of malicious advisors happened in distribution
one with 60 percentages malicious agents and 40 percentages benevolent, it is clear that
because the number of malicious agents in this distribution was more than benevolent
0.109
0.336 0.412
0.345
0.435 0.410
0.319
0.441 0.482
0.301
0.432 0.480
-0.307
-0.220
-0.176
-0.388 -0.343
-0.249
-0.435 -0.441 -0.448
-0.568 -0.556 -0.596 -0.70
-0.60
-0.50
-0.40
-0.30
-0.20
-0.10
0.00
0.10
0.20
0.30
0.40
0.50
0.60
0.70
Dis1 Dis2 Dis3 Dis1 Dis2 Dis3 Dis1 Dis2 Dis3 Dis1 Dis2 Dis3
Group 1 Group2 Group 3 Group4
Comparing the differences between belief and disbelief
Benevolent Malicious

156
ones, the average accuracy in these points is higher. On the other hand the differences
between belief and disbelief of malicious advisors increased by growing the number of
agents. Thereby TMAN represents better performance in bigger multi-agent systems. In
fact by increasing the number of agents in the simulated multi-agent environment, the
accuracy of TMAN was more significant.
Figure 5.19 shows the comparison between the total average accuracy of belief
and disbelief for benevolent providers and malicious ones across all groups and
distributions.
Figure 5.19: Total average accuracy of belief and disbelief after trust transitivity
across all groups and distributions
Figure 5.19 verifies that TMAN accurately evaluated the belief and also
disbelief of providers after trust transitivity. As shown in Figure 5.16, the average
accuracy of belief for trustworthy providers is higher than the average accuracy of their
disbelief, since the average accuracy of malicious providers is less than the average
accuracy of their belief in all groups and distributions after trust transitivity.
Benevolent Malicious
Belief 0.596 0.252
Disbelief 0.221 0.645
0.000
0.100
0.200
0.300
0.400
0.500
0.600
0.700
Aver
age
acc
ura
cy
Average accuracy for 100 iteration

157
Moreover, the differences between trustworthiness values of providers before
and after trust transitivity are illustrated in Figure 5.20.
Figure 5.20: Differences in trustworthiness of providers before and after trust
transitivity
Figure 5.20 illustrates that the trustworthiness of providers is affected by
transitivity of trust, and the level of belief increased for benevolent provider while the
level of disbelief increased for malicious provider agents. This result show that trust
transitivity led to better recognition of benevolent and malicious providers, because the
level of belief for benevolent providers increased while their level of belief for
malicious advisors decreased.
0.000
0.100
0.200
0.300
0.400
0.500
0.600
0.700
Benevolent (After
Trust Transitivity)
Malicious (After
Trust Transitivity)
Benevolent (Before
Trust Transitivity)
Malicious (Before
Trust Transitivity)

158
5.2.4 Experiment 1.4: Comparing the performance of TMAN with other existing
models
In the final part, the overall performance of TMAN was compared with the
performance of the basic model and two other alternative models: Evidence-based trust
model (Wang & Singh, 2010), and TREPPS (Li & Kao, 2009). The basic model is a
model without a specific trust mechanism. In this case, requester sends a query to
advisors; if an advisor has had previous interactions with providers, it will respond to
the requester and recommends a suitable provider. The basic model is the model that
does not apply any trust mechanism; the requester makes a decision based on the
number of recommendations for each provider and selects the provider which has the
most number of recommendations.
On the other hand, the Evidence-based trust model (Wang & Singh, 2010) and
TREPPS model (Li & Kao, 2009) are two selected models which were appropriate for
comparison with TMAN. The method of computing several identified components that
presented by these two models were described in Chapter 2.
5.2.4.1 Experiment 1.4.1: Comparing the performance of TMAN with other comparable
models according to group one
In this experiment, the aggregated results of comparing the performance of
TMAN with three other comparable models, namely the basic model, TREPPS model,
and Evidence-based trust model are presented for group one with five advisors, as
shown in Table 4.4.

159
For instance, for comparing TMAN against Evidence-based trust model (Wang
& Singh, 2010), TREPPS model(Li & Kao, 2009), and basic model in distribution one,
group one with 60% untrustworthy agents and 1 requester, 5 advisors, and 4 providers
the satisfying and dissatisfying rates, in addition to the preferences for agents were
given randomly by the system. Then these random values were used by TMAN,
Evidence-based trust model, TREPPS model, and basic model to select the most
trustworthy agents in 100 times of interaction. The average result of comparing in each
ten interactions was recorded and presented by system. Figure 5.21 shows a sample of
result for distribution one group one.
Figure 5.21 An example for experiment 1.4
As shown in Figure 5.21, TMAN had better performance than other compared
models. This scenario repeated ten times for distribution one group one and the average
of these results are revealed as the comparison of TMAN performance than other
compared models.
1 2 3 4 5 6 7 8 9
BASIC 0.501 0.531 0.555 0.542 0.509 0.543 0.521 0.487 0.491
Evidence-Based Trust 0.583 0.637 0.625 0.574 0.523 0.602 0.598 0.603 0.509
TREPPS 0.603 0.634 0.588 0.597 0.608 0.621 0.558 0.601 0.612
TMAN 0.662 0.701 0.668 0.71 0.633 0.639 0.619 0.634 0.651
0.45
0.5
0.55
0.6
0.65
0.7
0.75
Comparing the performance of TMAN with other models in
distribution one, group one

160
Table 5.4 illustrates the summary results that compare TMAN with other models
in group one with three different distributions.
Table 5.4: Results of comparing TMAN with other comparable models in group
one
Distribution one
Iteration
10 20 30 40 50 60 70 80 90 100
Models
Basic 0.411 0.522 0.481 0.573 0.585 0.498 0.479 0.51 0.511 0.586
TREPPS 0.621 0.59 0.632 0.587 0.603 0.591 0.623 0.578 0.582 0.614
Evidence-based trust 0.59 0.579 0.531 0.561 0.601 0.569 0.499 0.568 0.531 0.61
TMAN 0.63 0.588 0.671 0.645 0.62 0.635 0.641 0.634 0.621 0.61
Distribution two
Iteration
10 20 30 40 50 60 70 80 90 100
Models
Basic 0.531 0.456 0.487 0.528 0.501 0.505 0.547 0.581 0.493 0.517
TREPPS 0.589 0.613 0.643 0.59 0.641 0.564 0.598 0.61 0.645 0.61
Evidence-based trust 0.546 0.578 0.621 0.578 0.531 0.499 0.561 0.61 0.587 0.568
TMAN 0.61 0.624 0.64 0.593 0.672 0.598 0.614 0.658 0.672 0.689
Distribution three
Iteration
10 20 30 40 50 60 70 80 90 100
Models
Basic 0.514 0.498 0.417 0.531 0.587 0.521 0.601 0.571 0.521 0.49
TREPPS 0.607 0.651 0.598 0.61 0.674 0.631 0.647 0.603 0.631 0.598
Evidence-based trust 0.542 0.567 0.593 0.621 0.573 0.497 0.531 0.578 0.612 0.542
TMAN 0.631 0.678 0.613 0.687 0.704 0.638 0.653 0.614 0.678 0.702

161
As shown in Table 5.4, the average accuracy of TMAN in selecting the
trustworthy provider in almost all iterations is higher than that of other selected models.
Additionally, the analysis of variance (ANOVA) was applied for comparing the
performance of TMAN with that of the comparable models. Table 5.5 shows the results
of the ANOVA test for investigating the significant of the TMAN performance than the
performance of the other comparable models.
Table 5.5: The result of the ANOVA test in comparing the significance of TMAN
performance with the performance of other comparable models
Models F P-value
Basic model 140.5439 P<0.001
TREPPS model 15.53804 0.00022
Evidence-based trust model 75.02138 P<0.001
Table 5.5 denotes that the difference in P-value between the comparable models
and TMAN is less than 0.05. Overall, these results can verify that TMAN performed
significantly better than all comparable models across group one.
5.2.4.2 Experiment 1.4.2: Comparing the performance of TMAN with other comparable
models according to group two
In this experiment, the aggregated results of comparing the performance of
TMAN with that of three other models are examined using the three types of
distributions, For instance, for comparing TMAN against Evidence-based trust model

162
(Wang & Singh, 2010), TREPPS model, and basic model in distribution two, group two
with 50% untrustworthy agents and 1 requester, 10 advisors, and 9 providers the
satisfying and dissatisfying interactions as shown, in addition to the preferences for
agents selected randomly by the system. Then these random values used by the formulas
which presented by TMAN, Evidence-based trust model, TREPPS model, and basic
model to select the most trustworthy agents in 100 times of interactions result of
comparing TMAN against other models in each ten interactions recorded and presented
by system. Figure 5.22 shows a sample of result for distribution two, group two.
Figure 5.22 An example for experimentation
As shown in Figure 5.22, TMAN had better performance than other compared
models. This scenario repeated ten times for distribution one, group one and the average
of these results are revealed as the comparison result of TMAN performance than other
compared models.
The summary of results for each distribution in group two is shown in Table 5.6.
1 2 3 4 5 6 7 8 9
BASIC 0.546 0.574 0.48 0.54 0.573 0.506 0.494 0.563 0.512
Evidence-Based Trust 0.594 0.617 0.604 0.591 0.553 0.591 0.601 0.6180.5677
TREPPS 0.615 0.602 0.634 0.711 0.648 0.637 0.597 0.679 0.657
TMAN 0.725 0.661 0.712 0.753 0.766 0.672 0.711 0.771 0.634
0.4
0.45
0.5
0.55
0.6
0.65
0.7
0.75
0.8
Comparing the performance of TMAN with other models in
distribution two, group two

163
Table 5.6: Results of comparing TMAN with other comparable models in group
two
Distribution one
Iteration
10 20 30 40 50 60 70 80 90 100
Models
Basic 0.502 0.543 0.568 0.532 0.498 0.543 0.528 0.497 0.423 0.553
TREPPS 0.657 0.698 0.621 0.655 0.598 0.601 0.542 0.591 0.654 0.634
Evidence-based
trust 0.543 0.657 0.647 0.574 0.502 0.612 0.598 0.613 0.489 0.599
TMAN 0.672 0.721 0.671 0.71 0.653 0.62 0.61 0.634 0.671 0.632
Distribution two
Iteration 10 20 30 40 50 60 70 80 90 100
Models
Basic 0.557 0.546 0.574 0.476 0.54 0.593 0.432 0.498 0.563 0.512
TREPPS 0.675 0.642 0.671 0.654 0.587 0.675 0.613 0.597 0.632 0.629
Evidence-based
trust 0.568 0.589 0.568 0.498 0.597 0.61 0.587 0.547 0.598 0.549
TMAN 0.67 0.69 0.713 0.678 0.654 0.679 0.71 0.621 0.675 0.687
Distribution three
Iteration
10 20 30 40 50 60 70 80 90 100
Models
Basic 0.497 0.534 0.506 0.478 0.519 0.567 0.589 0.499 0.518 0.583
TREPPS 0.61 0.625 0.667 0.612 0.627 0.598 0.622 0.638 0.643 0.597
Evidence-based
trust 0.576 0.601 0.578 0.633 0.614 0.589 0.61 0.558 0.651 0.579
TMAN 0.621 0.631 0.685 0.619 0.622 0.637 0.681 0.714 0.698 0.61

164
Table 5.6 shows that the simulation results for ten advisors also revealed that
TMAN has better performance than other comparable models. Moreover, the ANOVA
test was done to discover the significance of TMAN performance in comparison with
other selected models. Tables 5.7 illustrate the results of the ANOVA test for TMAN
and three other comparable models.
Table 5.7: Results of the ANOVA test in comparing the performance of TMAN with
the other comparable models
Models F P-value
Basic model 189.3486 P<0.001
TREPPS model 15.04805 0.00027
Evidence-based trust model 62.75906 P<0.001
Table 5.7 shows that the difference in P-value between the significance of the
compared models and TMAN is less than 0.05; hence, TMAN also performed
significantly better than the other comparable models in group two.
5.2.4.3 Experiment 1.4.3: Comparing the performance of TMAN with other comparable
models according to group three
In experiment 1.4.3, the aggregated results of comparing the performance of
TMAN with that of three other comparable models in group three. For instance, for
comparing TMAN against Evidence-based trust model (Wang & Singh, 2010), TREPPS
model, and basic model in distribution one group one with 30% untrustworthy agents
and 1 requester, 15 advisors, and 14 providers the satisfying and dissatisfying
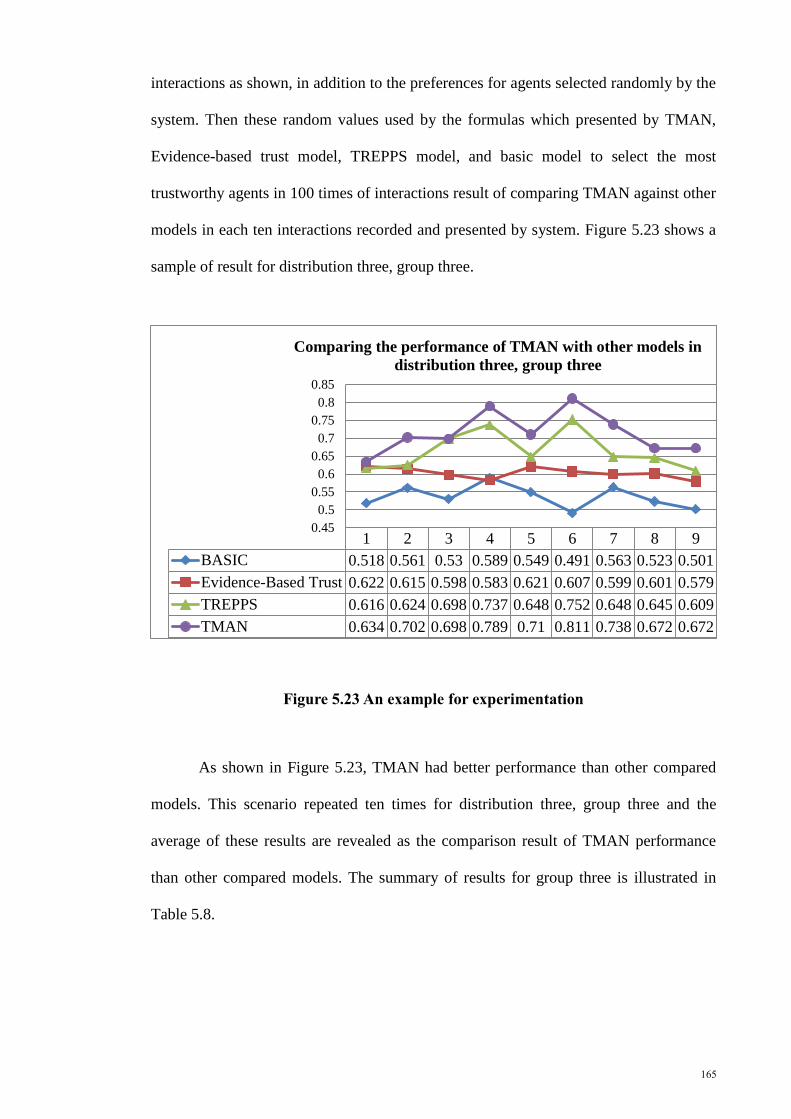
165
interactions as shown, in addition to the preferences for agents selected randomly by the
system. Then these random values used by the formulas which presented by TMAN,
Evidence-based trust model, TREPPS model, and basic model to select the most
trustworthy agents in 100 times of interactions result of comparing TMAN against other
models in each ten interactions recorded and presented by system. Figure 5.23 shows a
sample of result for distribution three, group three.
Figure 5.23 An example for experimentation
As shown in Figure 5.23, TMAN had better performance than other compared
models. This scenario repeated ten times for distribution three, group three and the
average of these results are revealed as the comparison result of TMAN performance
than other compared models. The summary of results for group three is illustrated in
Table 5.8.
1 2 3 4 5 6 7 8 9
BASIC 0.518 0.561 0.53 0.589 0.549 0.491 0.563 0.523 0.501
Evidence-Based Trust 0.622 0.615 0.598 0.583 0.621 0.607 0.599 0.601 0.579
TREPPS 0.616 0.624 0.698 0.737 0.648 0.752 0.648 0.645 0.609
TMAN 0.634 0.702 0.698 0.789 0.71 0.811 0.738 0.672 0.672
0.45
0.5
0.55
0.6
0.65
0.7
0.75
0.8
0.85
Comparing the performance of TMAN with other models in
distribution three, group three

166
Table 5.8: Results of comparing TMAN with other comparable models in group
three
Distribution one
Iteration
10 20 30 40 50 60 70 80 90 100
Models
Basic 0.452 0.561 0.558 0.469 0.561 0.601 0.519 0.589 0.567 0.504
TREPPS 0.593 0.572 0.587 0.595 0.57 0.597 0.579 0.601 0.595 0.6
Evidence-based trust 0.578 0.569 0.619 0.577 0.591 0.517 0.61 0.623 0.578 0.637
TMAN 0.631 0.657 0.761 0.701 0.721 0.711 0.742 0.719 0.802 0.761
Distribution two
Iteration
10 20 30 40 50 60 70 80 90 100
Models
Basic 0.541 0.587 0.501 0.453 0.531 0.546 0.511 0.471 0.423 0.538
TREPPS 0.554 0.589 0.601 0.536 0.52 0.501 0.55 0.547 0.571 0.543
Evidence-based trust 0.595 0.602 0.634 0.661 0.598 0.617 0.577 0.59 0.571 0.601
TMAN 0.615 0.713 0.765 0.81 0.792 0.783 0.795 0.681 0.71 0.801
Distribution three
Iteration
10 20 30 40 50 60 70 80 90 100
Models
Basic 0.517 0.568 0.537 0.593 0.517 0.498 0.565 0.541 0.502 0.481
TREPPS 0.59 0.542 0.602 0.537 0.531 0.598 0.604 0.597 0.611 0.572
Evidence-based trust 0.567 0.603 0.578 0.617 0.631 0.584 0.638 0.61 0.573 0.617
TMAN 0.634 0.702 0.698 0.791 0.71 0.811 0.748 0.672 0.63 0.698
This experiment was carried out for group three with fifteen advisors as shown
in Table 5.8. Similar to the results of experiments 1.4.1 and 1.4.2, the performance of
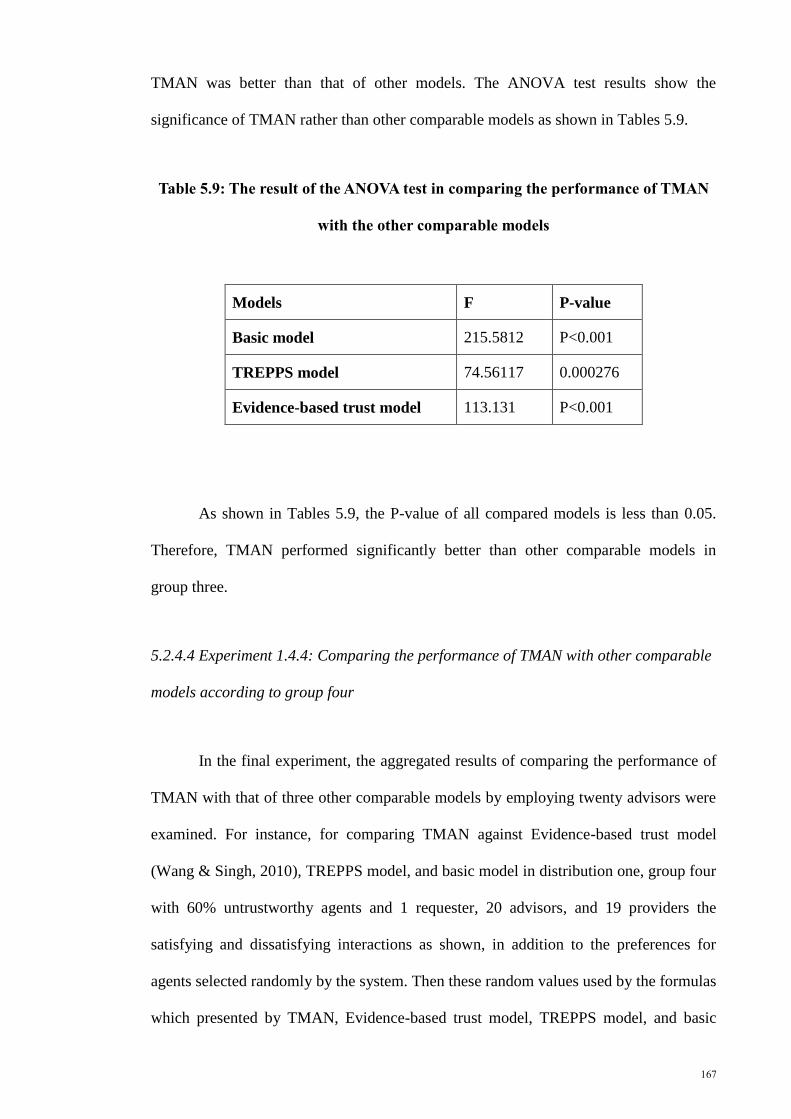
167
TMAN was better than that of other models. The ANOVA test results show the
significance of TMAN rather than other comparable models as shown in Tables 5.9.
Table 5.9: The result of the ANOVA test in comparing the performance of TMAN
with the other comparable models
Models F P-value
Basic model 215.5812 P<0.001
TREPPS model 74.56117 0.000276
Evidence-based trust model 113.131 P<0.001
As shown in Tables 5.9, the P-value of all compared models is less than 0.05.
Therefore, TMAN performed significantly better than other comparable models in
group three.
5.2.4.4 Experiment 1.4.4: Comparing the performance of TMAN with other comparable
models according to group four
In the final experiment, the aggregated results of comparing the performance of
TMAN with that of three other comparable models by employing twenty advisors were
examined. For instance, for comparing TMAN against Evidence-based trust model
(Wang & Singh, 2010), TREPPS model, and basic model in distribution one, group four
with 60% untrustworthy agents and 1 requester, 20 advisors, and 19 providers the
satisfying and dissatisfying interactions as shown, in addition to the preferences for
agents selected randomly by the system. Then these random values used by the formulas
which presented by TMAN, Evidence-based trust model, TREPPS model, and basic
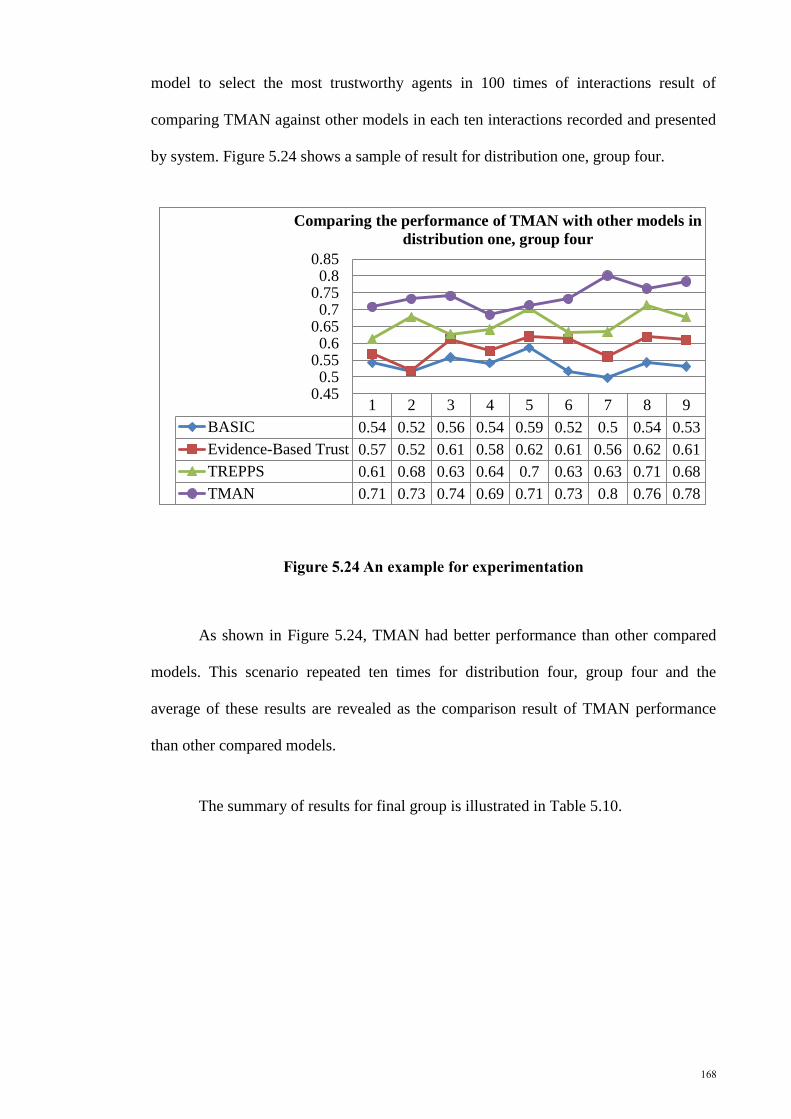
168
model to select the most trustworthy agents in 100 times of interactions result of
comparing TMAN against other models in each ten interactions recorded and presented
by system. Figure 5.24 shows a sample of result for distribution one, group four.
Figure 5.24 An example for experimentation
As shown in Figure 5.24, TMAN had better performance than other compared
models. This scenario repeated ten times for distribution four, group four and the
average of these results are revealed as the comparison result of TMAN performance
than other compared models.
The summary of results for final group is illustrated in Table 5.10.
1 2 3 4 5 6 7 8 9
BASIC 0.54 0.52 0.56 0.54 0.59 0.52 0.5 0.54 0.53
Evidence-Based Trust 0.57 0.52 0.61 0.58 0.62 0.61 0.56 0.62 0.61
TREPPS 0.61 0.68 0.63 0.64 0.7 0.63 0.63 0.71 0.68
TMAN 0.71 0.73 0.74 0.69 0.71 0.73 0.8 0.76 0.78
0.450.5
0.550.6
0.650.7
0.750.8
0.85
Comparing the performance of TMAN with other models in
distribution one, group four

169
Table 5.10: Results of comparing TMAN with other comparable models in group
four
Distribution one:
Iteration
10 20 30 40 50 60 70 80 90 100
Models
Basic 0.583 0.524 0.574 0.511 0.561 0.518 0.497 0.527 0.539 0.498
TREPPS 0.583 0.524 0.574 0.511 0.561 0.518 0.497 0.527 0.539 0.498
Evidence-based
trust 0.563 0.634 0.598 0.567 0.598 0.61 0.528 0.601 0.632 0.587
TMAN 0.702 0.721 0.692 0.689 0.718 0.729 0.776 0.738 0.8 0.797
Distribution two
Iteration
10 20 30 40 50 60 70 80 90 100
Models
Basic 0.501 0.498 0.509 0.542 0.511 0.579 0.551 0.491 0.589 0.505
TREPPS 0.501 0.498 0.509 0.542 0.511 0.579 0.551 0.491 0.589 0.505
Evidence-based trust 0.599 0.614 0.599 0.658 0.578 0.608 0.593 0.562 0.601 0.579
TMAN 0.689 0.731 0.703 0.678 0.684 0.679 0.71 0.621 0.675 0.752
Distribution three
Iteration 10 20 30 40 50 60 70 80 90 100
Models
Basic 0.409 0.581 0.552 0.538 0.586 0.487 0.54 0.527 0.587 0.409
TREPPS 0.409 0.581 0.552 0.538 0.586 0.487 0.54 0.527 0.587 0.409
Evidence-based trust 0.551 0.591 0.605 0.609 0.598 0.571 0.614 0.612 0.565 0.61
TMAN 0.678 0.721 0.755 0.801 0.778 0.693 0.653 0.705 0.789 0.725

170
In overall, TMAN shows better performance than the other comparable models
in almost all iterations. The results of the ANOVA test for the group four are illustrated
in Table 5.11.
Table 5.11: The result of the ANOVA test in comparing the performance of TMAN
with the other comparable models
Models F P-value
Basic model 290.8012 P<0.001
TREPPS model 165.3442 P<0.001
Evidence-based trust model 171.5978 P<0.001
Tables 5.11 denote that TMAN performed significantly better than other models
in group four, because the P-value of all compared models is less than 0.05.
In fact, the Basic model selected the trustworthy provider without considering
the following main components: similarity, trust transitivity as well as the belief and
disbelief of agents established based on satisfying and dissatisfying previous
interactions. Similarly, the performance of the Evidence-based trust model is also
significantly poorer than the performance of TMAN, in all distributions and groups. The
model presented a proper formula for evaluating the uncertainty and conflict in
behaviors of agents based on the satisfying and dissatisfying previous interactions of
each agent, and it also measured trust transitivity between agents; however, it did not
compute reliability, reputation, unreliability, and disrepute of agents established based
on satisfying and dissatisfying previous interactions. Moreover, Evidence-based trust
model ignored the similarity between two agents. In contrast, TREPPS computed

171
reliability, satisfaction, similarity and trust transitivity; however, the computations are
based on previous satisfying interactions only, and hence the unreliability, disrepute and
uncertainty of each agent were not evaluated. Moreover, it measured the similarity of
the recommendations of agents by computing the similarity between two fuzzy
variables, without noting the preferences between advisors and requester.
Therefore, the overall results indicated that TMAN model’s accuracy is
significantly better than that of the other comparable models, across all groups. This is
because the proposed model focus has been to propose a trust model for advisor agents.
In fact evaluates the trustworthiness of advisors and try to select the most trustworthy
provider according to advice of benevolent advisors, especially when the requester has
no relationship with providers. On the other hand, the proposed model evaluates vital
components, which are: i) similarity between agents based on the preferences of each
agent in different criteria; ii) trust transitivity between agents; iii) unreliability and
disrepute of agents based on dissatisfying previous interactions separating from the
formulas which used for evaluating reliability and reputation, respectively; and v)
incorporation of these components and selection of the most trustworthy provider by
using the TOPSIS method.
5.3 Part 2: Evaluation of TMAN with the trust network game method
As described in Section 4.4.2, TNG was run on different parameter settings. In
fact, the scores that TNG identified after each interaction for each agent were recorded
and used as satisfaction and dissatisfaction ratings for that agent. Then by running
TMAN, the trustworthiness of each advisor and provider was calculated, and the most
trustworthy provider was selected. The scores presented by TNG after iteration and the
trustworthiness computed by TMAN were compared to investigate how well TMAN

172
can calculate the trustworthiness of each advisor and also its suggested provider. As
described in Section 4.4.2, three different behaviors were considered for agents to
investigate the performance of TMAN. In fact, two agents, one advisor and its
suggested provider, behaved consistently during iteration and two agents behaved mild
oscillating and two others had strong oscillating behaviors.
5.3.1 Experiment 2.1: Accuracy of TMAN in evaluating the trustworthiness of
agents
As described in Section 4.4.2, TNG was run on different parameter settings. In
fact, the scores that TNG identified after each interaction for each agent were recorded
and used as satisfaction and dissatisfaction ratings for that agent. Then by running
TMAN, the trustworthiness of each advisor and provider was calculated, and the most
trustworthy provider was selected. The scores presented by TNG after iteration and the
trustworthiness computed by TMAN were compared to investigate how well TMAN
can calculate the trustworthiness of each advisor and also its suggested provider. As
described in Section 4.4.2, three different behaviors were considered for agents to
investigate the performance of TMAN. In fact, two agents, one advisor and its
suggested provider, behaved consistently during iteration and two agents behaved mild
oscillating and two others had strong oscillating behaviors.
5.3.1.1 Experiment 2.1.1: Consistent behaviors
In this experiment, the trustworthiness for one advisor and its suggested provider
are investigated in light of the results obtained from TNG and TMAN after iteration.
For instance the behavior of advisor in consistent environment presented by TNG, after
running it for fifteen trades between requester and advisor as shown in Table 5.12

173
Table 5.12: A sample of advisor behavior in consistent TNG environment
Number of interactions Actual behavior of advisor
Interaction 1 0.02
Interaction 2 0.02
Interaction 3 0.02
Interaction 4 0.02
Interaction 5 0.02
Interaction 6 0.02
Interaction 7 0.02
Interaction 8 0.02
Interaction 9 0.02
Interaction 10 0.02
Interaction 11 0.02
Interaction 12 0.02
Interaction 13 0.02
Interaction 14 0.02
Interaction 15 0.02
Table 5.12 illustrates that the advisor had satisfying interactions in all fifteen
trades because the presented results by TNG were positive. Since the experiment 2.1.1
was based on the consistent multi-agent environment, the advisor could not change its
behavior during fifteen trades. In fact,TNG outcomes showed that the actual behavior of
the advisor during these trades and TMAN used these outcomes, which presented in
Table 5.12, as satisfying rates, while dissatisfying rates were zero because advisor had
positive outcomes during all interactions, so the advisor traded without cheating. By
applying these outcomes through TMAN, the expectation was that TMAN can propose
the accurate results in calculated belief and disbelief of the advisor. Thereby the belief
value of this advisor which was computed by TMAN should be consistent during fifteen
interactions while disbelief valued of the advisor should be zero.
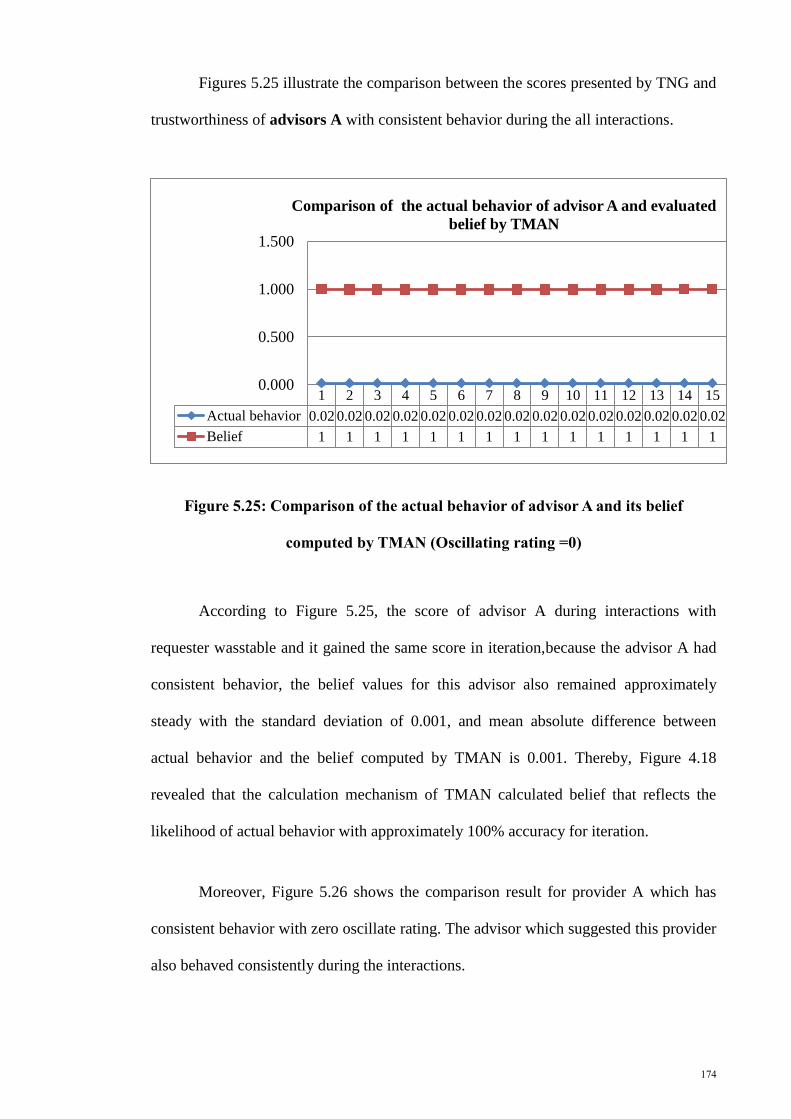
174
Figures 5.25 illustrate the comparison between the scores presented by TNG and
trustworthiness of advisors A with consistent behavior during the all interactions.
Figure 5.25: Comparison of the actual behavior of advisor A and its belief
computed by TMAN (Oscillating rating =0)
According to Figure 5.25, the score of advisor A during interactions with
requester wasstable and it gained the same score in iteration,because the advisor A had
consistent behavior, the belief values for this advisor also remained approximately
steady with the standard deviation of 0.001, and mean absolute difference between
actual behavior and the belief computed by TMAN is 0.001. Thereby, Figure 4.18
revealed that the calculation mechanism of TMAN calculated belief that reflects the
likelihood of actual behavior with approximately 100% accuracy for iteration.
Moreover, Figure 5.26 shows the comparison result for provider A which has
consistent behavior with zero oscillate rating. The advisor which suggested this provider
also behaved consistently during the interactions.
1 2 3 4 5 6 7 8 9 10 11 12 13 14 15
Actual behavior 0.02 0.02 0.02 0.02 0.02 0.02 0.02 0.02 0.02 0.02 0.02 0.02 0.02 0.02 0.02
Belief 1 1 1 1 1 1 1 1 1 1 1 1 1 1 1
0.000
0.500
1.000
1.500
Comparison of the actual behavior of advisor A and evaluated
belief by TMAN

175
Figure 5.26: Comparison of the actual behavior of advisor A and its belief
computed by TMAN (Oscillating rating =0)
Figure 5.26 also demonstrated that the calculation mechanism of TMAN
proposed belief that reflects the likelihood of actual behavior of 100% accuracy for
provider A. In fact the mean absolute difference between actual behavior and belief
calculated by TMAN is zero.
Moreover, because the advisor A and its suggested provider A displayed
satisfying behavior in all iterations, disbelief values of them are zero.
5.3.1.2 Experiment 2.1.2: Slightly oscillating behaviors
In this experiment, the trustworthiness for one advisor and its suggested provider
are examined in light of the results obtained from TNG and TMAN for mild oscillating
behaviors of agents.
1 2 3 4 5 6 7 8 9 10 11 12 13 14 15
Actual behavior 0.010.010.010.010.010.010.010.010.010.010.010.010.010.010.01
Belief 0.010.010.010.010.010.010.010.010.010.010.010.010.010.010.01
0.000
0.005
0.010
0.015
0.020
Comparison of actual behavior of provider A and belief
computed by TMAN

176
For instance the behavior of advisor in mild oscillating environment, which were
presented by TNG, for fifteen trades between requester and advisor had mildly changes,
as shown in Table 5.13
Table 5.13: A sample of advisor behavior in mild oscillating TNG environment
Number of interactions Actual behavior of advisor
Interaction 1 1
Interaction 2 1
Interaction 3 1
Interaction 4 1
Interaction 5 1
Interaction 6 1
Interaction 7 1
Interaction 8 1
Interaction 9 1
Interaction 10 1
Interaction 11 1
Interaction 12 0.099
Interaction 13 1
Interaction 14 -0.016
Interaction 15 -0.016
Table 5.13shows that the advisor had negative outcomesin thirteen trades. These
trades illustrate the satisfying interactions, then the advisor changed its behaviormildly
to negative outcomes means dissatisfying interactions in the last two trades. In fact,
TNG outcomes revealed the actual behavior of the advisor during the fifteen trades and
TMAN used these outcomes, which presented in Table 5.13, as satisfying and
dissatisfying rates for the advisor and calculated the belief and disbelief of that advisor
in each interaction.

177
Figure 5.27represents comparison of actual behavior of advisor B with mild
oscillating behavior with belief and disbelief computed by TMAN.
Figure 5.27: Comparison of the actual behavior of advisor B and its belief
computed by TMAN (Oscillating rating =0.05)
As shown in Figure 5.27advisor B had mild oscillating behaviors in iteration 14
and 15. This figure illustrated that the calculation mechanism of TMAN calculated
belief that reflects the likelihood of actual behavior with approximately 100% accuracy
for iteration with mean absolute difference of 0.001.
On the other hand, Figure 5.28 denotes the comparison of actual behavior of
advisor B and disbelief computed by TMAN
14 15
Actual behavior 0.016 0.016
Belief 0.998 1
0.985
0.99
0.995
1
1.005
1.01
1.015
1.02
Comparison of actual behavior of advisor B and evaluated
belief by TMAN

178
Figure 5.28: Comparison of the actual behavior of advisor B and its disbelief
computed by TMAN (Oscillating rating =0.05)
The mean absolute difference between actual behavior of advisor B and its
disbelief computed by TMAN is 0.004, which indicates that TMAN computed disbelief
reflects the likelihood of actual behavior with approximately 100% accuracy for
iteration.
Figure 5.29 shows the comparison for the suggested provider B with mild
oscillating behaviors.
1 2 3 4 5 6 7 8 9 10 11 12 13
Disbelief 1 1 1 1 1 1 1 1 1 1 1 0.99 1
Actual behavior 0.02 0.02 0.02 0.02 0.02 0.02 0.02 0.02 0.02 0.02 0.02 0.03 0.03
0
0.2
0.4
0.6
0.8
1
1.2
Comarison of actual behavior of advisor B and evaluated
Disbelief by TMAN

179
Figure 5.29: Comparison of the behavior of provider B and its belief computed by
TMAN (Oscillating rating =0.05)
As shown Figure 5.29, when the provider B changed its satisfying behavior
highly between interaction 12 and interaction 14, TMAN calculated the belief value
with approximately similar increasing and decreasing as the actual behavior of advisor
B between interaction 12 and interaction 14. In overall, the mean absolute difference
between actual behavior and belief computed by TMAN is 0.03. Thereby, in the case
that the agents oscillate their behavior TMAN can approximately calculate their belief
and disbelief similar to their actual behaviors.
5.3.1.3 Experiment 2.1.3: Oscillating behaviors
In this experiment, the actual behavior of one advisor and one provider with
oscillating behaviors is compared with the trustworthiness calculated by TMAN.
1 2 3 4 5 6 7 8 9 10 11 12 13 14 15
Actual behavior 0.02 0.02 0.02 0.02 0.02 0.02 0.02 0.02 0.02 0.08 0.08 0.08 0.41 0.01 0.25
Belief 0 0 0.01 0.01 0.01 0.01 0.01 0.02 0.02 0.1 0.11 0.12 0.68 0.03 0.47
0
0.1
0.2
0.3
0.4
0.5
0.6
0.7
0.8
Comparison of actual behavior of provider B and belief
computed by TMAN

180
For instance the behavior of advisor in oscillating environment changed rapidly,
Table 5.14 illustrates the behavior of the advisor in oscillating behavior
Table 5.14: A sample of advisor behavior in oscillating TNG environment
Number of interactions Actual behavior of advisor
Interaction 1 -1
Interaction 2 0.996
Interaction 3 -0.99
Interaction 4 -1
Interaction 5 0.996
Interaction 6 -0.99
Interaction 7 -0.99
Interaction 8 -0.99
Interaction 9 -0.99
Interaction 10 -0.99
Interaction 11 0.996
Interaction 12 -0.99
Interaction 13 -1
Interaction 14 0.0998
Interaction 15 -1
Table 5.13 shows that the advisor changed its behavior from negative outcomes
in trade number 1, 3, 4, 6, 7, 8, 9, 10, 12, 13, and 15 which means that these trades were
dissatisfying to positive outcomes in trade number 2, 5, 11, and 14 which determines
that the advisor had cooperative behavior in these trades, so these trade were satisfying.
TMAN used the actual behaviors of the advisors which presented by TNG, which
presented in Table 5.13, as satisfying and dissatisfying rates for that advisor and
computed belief and disbelief of the advisor in each interaction.

181
Figures 5.30 illustrate the result of comparison for advisor C that had strong
oscillating behavior rating.
Figure 5.30: Comparison of the behavior of advisor C and its belief computed by
TMAN (Oscillating rating =0.5)
Figure 5.30shows that advisor C had oscillating satisfying behavior in iterations
2, 5, 11, and 14. The mean absolute difference between actual behavior of advisor C and
the belief computed by TMAN is 0.008. Thereby, TMAN computed belief reflects the
likelihood of actual behavior with approximately 100% accuracy for iteration
2 5 11 14
Belief 0.996 0.996 0.996 0.998
Actual behavior 0.017 0.017 0.017 0.017
0.000
0.200
0.400
0.600
0.800
1.000
1.200
Comparison of actual behavior of advisor C and evaluated belief by
TMAN

182
Figure 5.31: Comparison of the behavior of advisor C and its disbelief computed
by TMAN (Oscillating rating =0.5)
Moreover as shown in Figure 5.31 TMAN calculated disbelief reflects the
likelihood of actual behavior with approximately 100% accuracy for iteration while the
mean absolute difference between actual behavior of advisor C and disbelief calculated
by TMAN is 0.009
Finally Figure 5.32 and Figure 5.33 illustrate the result of comparison for
provider C that had strong oscillating behavior rating of 0.5.
1 3 4 6 7 8 9 10 12 13 15
Disbelief 1 0.99 1 0.99 0.99 0.99 0.99 0.99 0.99 1 1
Actual behavior 0.02 0.03 0.02 0.03 0.03 0.03 0.03 0.03 0.03 0.02 0.02
0
0.2
0.4
0.6
0.8
1
1.2
Comparison of actual behavior of advisor C and evaluated disbelief
by TMAN
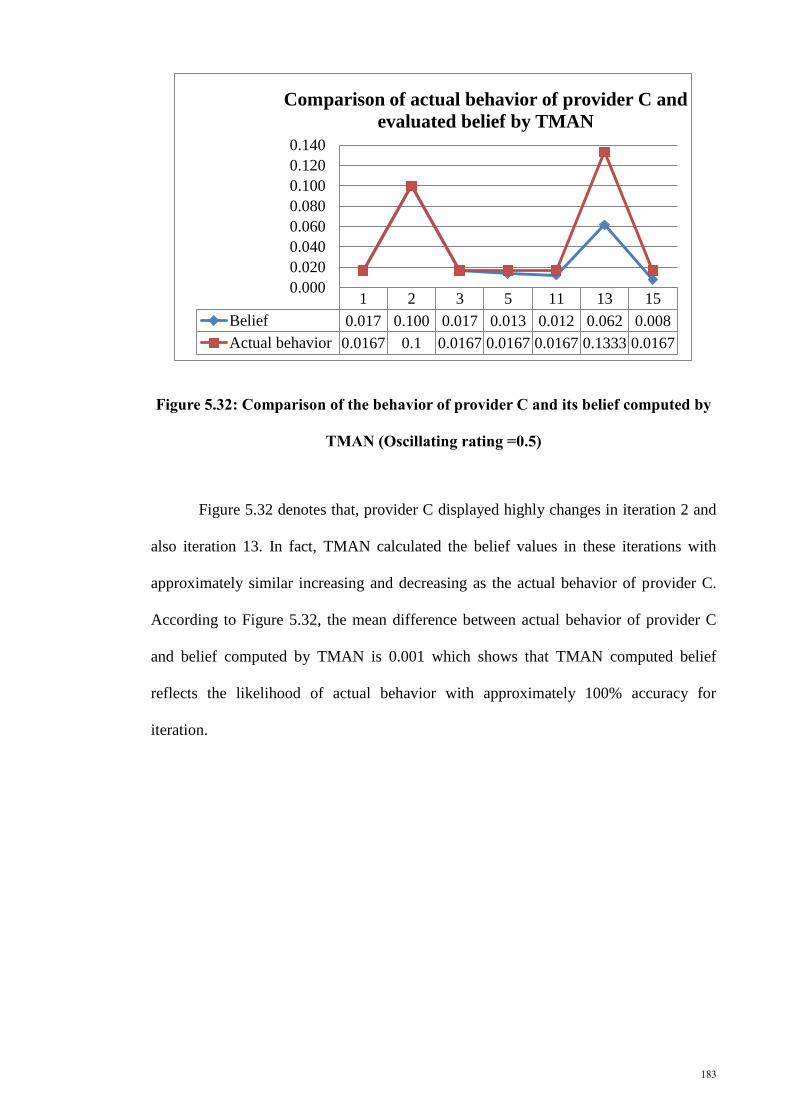
183
Figure 5.32: Comparison of the behavior of provider C and its belief computed by
TMAN (Oscillating rating =0.5)
Figure 5.32 denotes that, provider C displayed highly changes in iteration 2 and
also iteration 13. In fact, TMAN calculated the belief values in these iterations with
approximately similar increasing and decreasing as the actual behavior of provider C.
According to Figure 5.32, the mean difference between actual behavior of provider C
and belief computed by TMAN is 0.001 which shows that TMAN computed belief
reflects the likelihood of actual behavior with approximately 100% accuracy for
iteration.
1 2 3 5 11 13 15
Belief 0.017 0.100 0.017 0.013 0.012 0.062 0.008
Actual behavior 0.0167 0.1 0.0167 0.0167 0.0167 0.1333 0.0167
0.000
0.020
0.040
0.060
0.080
0.100
0.120
0.140
Comparison of actual behavior of provider C and
evaluated belief by TMAN

184
Figure 5.33: Comparison of the behavior of provider C and its disbelief computed
by TMAN (Oscillating rating =0.5)
As shown in Figures 5.33, the mean difference between actual behavior of
provider C and disbelief calculated by TMAN is 0.002 which reveals that the
calculation mechanism of TMAN also calculated disbelief of provider C that reflects the
likelihood of actual behavior with approximately 100% accuracy for strong oscillating
behaviors of provider C.
The experiment 1.1, 1.2 and 1.3 verified that the TMAN mechanism can produce
and evaluate the belief and disbelief of agents in different types of multi-agent
environment accurately.
5.3.2 Experiment 2.2: Performance of TMAN in selecting the provider
In this step, the most trustworthy provider selected after evaluating the trust
transitivity between each advisor and its suggested provider.
1 2 3 4 5 6 7 8
Disbelief 0.019 0.019 0.019 0.02 0.02 0.02 0.01 0.01
Actual behavior of
provider C0.033 0.033 0.033 0.033 0.033 0.033 0.017 0.017
00.0050.01
0.0150.02
0.0250.03
0.035
Rate
of
pro
vid
er b
ehavio
r
an
d v
alu
e of
dis
bel
ief
Comparison of actual behavior of provider C and disbelief
computed by TMAN

185
For instance, in oscillating TNG environment TMAN predicted the behavior of
provider C,according to the first fifteen trade outcomes, as shown in Table 5.13, will be
less than provider B from mild oscillating environment. In fact the first fifteen trades
outcomes which presented by TNG used by TMAN as previous satisfying and
dissatisfying interactions and TMAN applied TOPSIS method to select the most
trustworthy provider, then the selected provider compared by the TNG outcome for
sixteen interaction which showed the actual behaviors of providers.
Figure 5.34 shows the comparison of the rate of selected provider by TMAN
with actual behaviors of that provider as presented by TNG in the last iteration.
Figure 5.34: comparing the actual behavior of providers which presented by TNG
and the final rate of selected provider by TMAN
As shown in Figure 5.34, TMAN can accurately select the provider which has
better behavior than other providers, and the result of TOPSIS method for provider B is
Provider A
0.0167
Provider B
0.15 Provider C
-0.0167
Provider A
0.685
Provider B
0.987
Provider C
0.669
-0.02
0.18
0.38
0.58
0.78
0.98
1.18
0 0.5 1 1.5 2 2.5 3 3.5
Rate
of
pro
vid
ers
beh
avio
r
an
d t
he
valu
e of
FT
OP
SIS
Comparison the actual behavior of providers and the provider
that was selected by TMAN
Rate FTOPSIS resultTOPSIS result of TMAN

186
0.15. This result can also verify the accuracy of TMAN in computing the
trustworthiness of agents and selecting the most trustworthy provider.
5.4 Summary
By simulating the advisor network based on different numbers of agents and
different densities of benevolent and malicious advisors with the MATLAB (R2012a)
simulator, the mechanisms of TMAN were evaluated. Two different methods were used
to evaluate TMAN. They consist of the random selection method as described in
Section 5.2 and the TNG method as explained in Section 5.3.
In the random selection method, first, the accuracy of TMAN in evaluating the
main components of TMAN was examined. The results verified that TMAN can
accurately measure the reliability, unreliability, reputation, disrepute and also belief and
disbelief of advisors and the belief and disbelief of providers. Moreover the accuracy of
TMAN in evaluating trust transitivity between advisors and their suggested provider
was evaluated. In fact, the results showed that TMAN can accurately calculate belief
and disbelief of providers after trust transitivity.
Then, the performance of TMAN in decision-making process of selecting the
trustworthy provider was studied by comparing the performance of TMAN with that of
three other models: basic model, Evidence-based trust model, and TREPPS model. The
result of simulation showed that in different times of running, the performance of
TMAN in selecting the benevolent providers is better than that of other compared
models.
According to the TNG method, the accuracy of TMAN in computing the main
components has been evaluated by comparing the actual behaviors of agents collected

187
from a simulated auction environment based on multi-agents with the presented results
by TMAN. The results showed that TMAN can accurately evaluate the trustworthiness
of advisors and also providers in this method. In the final stage of experiment, the
performance of TMAN has been studied by using TNG outcomes. In this case TMAN
could identify the most trustworthy suggested provider among all other providers.

188
CHAPTER 6:CONCLUSIONS, LIMITATIONS AND FUTURE WORKS
6.1 Introduction
This chapter provides a summary of the research carried out and presents a
number of avenues for future research. In fact, this chapter discusses how to achieve the
research objectives, answer the research questions that have been formulated in Chapter
1 and enumerate the key research achievements. The chapter concludes with a number
of future research areas and addresses some of the main limitations of this research.
In this dissertation, the main focus has been to propose a trust model for advisor
agents which make up an advisor network in a multi-agent system especially in e-
commerce environment. TMAN is necessary because malicious advisors may take
advantage of others by behaving in an untrustworthy manner.Assume a B2B scenario
for a fictitious food manufacturer who has an online system. In an event where the
manufacturer is looking for a packaging supplier, he may perform a search via his
system which contains a potential list of suppliers (assumption). Additionally, assume
the manufacturer specifies his criteria, such as price of service (10%), quality of service
(30%) and response time (60%). The percentage indicates the weightage given for each
criterion. In this example, response time is highly important to him compared to the
price of service. When the manufacturer did not familiar with any supplier which can
provide his demanded services, he will ask other manufacturer that it may familiar with
those suppliers to advise him. In this case manufacturer should select the best supplier
among all advices which can provide his demanded service. So, the successful
interactions require selecting a trustworthy supplier agent according to advice of
benevolent advisors. Taking advisors into consideration is essential, especially when the

189
requester has had no previous interactions with providers, and it needs to find a
trustworthy provider according to the advice of other agents. In this case, the agents that
have had previous interactions with providers can play the role as an advisor to help the
requester select the most trustworthy provider. However, if these advisors act
maliciously, it will cause an unsuccessful interaction, especially in e-commerce areas,
where the safety of interaction is vital. Thus, this proposed model can help to enhance
the likelihood of a successful interaction in e-commerce-based multi-agent systems.
In the state-of-the-art concept of multi-agent systems, an advisor network and
trust in multi-agent systems have been discussed along with analysis of different related
work in Chapter 2.
The architecture of the proposed model, TMAN, has been clearly explained in
Chapter 3 according to the following steps: i) select agents that are similar to requester
as an advisor; ii) calculate the trustworthiness of advisors and suggested providers; iii)
evaluate the trust transitivity in the advisor network by measuring the transitivity of
trust between advisors and their suggested provider; and iv) the decision-making
process for selecting the most trustworthy provider.
TMAN was tested in each stage and compared with three other alternative
models with two different methods of evaluation: random selection and trust network
game, the results of these evaluations were discussed in Chapter 4.
6.2 Summary of findings and research objectives accomplished
The architecture of TMAN was based on six main stages as explained in Chapter
4, Section 4.2. First the similar advisor agents have been selected (stage one), then
trustworthiness of each similar advisor was evaluated (stage two), in the next step the

190
trustworthiness of suggested provider which suggested by advisors were computed
according to the report of advisors about their suggested provider (stage three). Next
transitivity of trust between requester, similar advisors and their suggested providers
were measured (stage four), then the most trustworthy provider was selected using
TOPSIS method (stage five). Finally the requester, after interacting with the suggested
provider, considers reward or punishment for the selected advisors (stage six).
The research objectives, as defined in Chapter 1, have been used as a guideline
throughout this dissertation and formed the basis of our research questions. The
summary of how these objectives have been achieved is summarized in the subsequent
subsections. The full details have been discussed in earlier chapters.
6.2.1 Summary of the first research objective
The first objective of this research is to identify the main components that can be
used to present a trust model for advisor networks in a multi-agent environment.
This objective was achieved in chapter 2, section 2.8 by analyzing the most
representative trust models,such as, TREPPS (Li & Kao, 2009), Evidence-based trust
model (Wang & Singh, 2010) and TRR model (Rosaci et al., 2011), and was explained
in more details in chapter 3, section 3.2. A total twelve components were identified,
namely: satisfaction, similarity, reliability, unreliability, disrepute, reputation, belief,
disbelief, uncertainty, conflict, trust transitivity, and decision-making process.

191
6.2.2 Summary of the second research objective
The second objective of this research is to build a trust model based on the
identified components to recognize a trustworthy provider agent which achieved in
chapter 3, section 3.3.
By identifying the main components, TMAN was proposed based on the
integration of the identified components to select a trustworthy provider according to
the advice of the benevolent advisors, which are as follows:
First, the requester selects the similar advisors that have similar preferences to
the requester. Then, the belief of how well the advisors can be trusted as well as
disbelief value that shows how much the advisors cannot be trusted is evaluated. After
that, the uncertainty in outcomes of each advisor and also conflict in previous behaviors
of each advisor are measured to define the level of trust for each one. Based on this
computation, the trustworthiness of malicious advisors should be less than that of the
benevolent ones. Moreover, the belief, disbelief, uncertainty and conflict in previous
behaviors of each suggested provider is evaluated based on the ratings reported by
advisors. To calculate the accurate value of trust for providers, trust transitivity should
be also evaluated in an advisor network. Then, the requester can make a decision based
on the evaluated trustworthiness of each provider after trust transitivity and selects the
most trustworthy one. Finally the requester considers reward or punishment for advisors
that suggested the trustworthy provider.

192
6.2.3 Summary of the third research objective
The final objective is the evaluation of the accuracy of the components of
TMAN and also performance of TMAN in a multi-environment. This objective
achieved in chapter 5, section 5.2 and 5.3.
To evaluate the accuracy of TMAN, two methods were applied: the random
election and also rust network game. According to the random selection, the average
accuracy of TMAN in calculating reliability, unreliability, reputation, disrepute, belief
and also disbeliefof agents were examined; then the average accuracy of TMAN in
computing these main components after trust transitivity were investigated; finally, the
performance of TMAN was compared with a basic model, which selects a suggested
provider without computing the trustworthiness of the agents. This research also took
into consideration two other representative trust models: the Evidence-based trust
model(Wang & Singh, 2010) and TREPPS model(Li & Kao, 2009). These two models
were selected to be compared with TMAN because they have many similarities to it.
Moreover, several methodspresented by these two models were used in proposing
TMAN.
6.3 Research Contributions
In this research,the major challenge is the malicious advisors, which affect the
decision of requester agents and cause them to interact with malicious provider agents.
To solve this problem, a trust model called TMAN is proposed. TMAN selected the
similar agents as an advisor and calculated the trustworthiness of each similar advisor as
well as computing the trustworthiness of their suggested provider, then the
trustworthiness of requester to each suggested provider was evaluated by transitivity of

193
trust, and the most trustworthy provider selected based on the computed trust transitivity
value of each suggested provider. Finally, rewardthe advisors hat it can lead to
increased reliability and reputation of those advisors, or punishmentthem that it can
cause to increase the level of unreliability and disrepute of those advisors.
The above steps show that the evaluation of trustworthiness of advisors and their
suggested provider can avoid the wrong decision made by requester agents about
advisors and help them to interact with trustworthy provider agents.
Moreover TMAN can overcome to the following problems which were indicted
in Chapter 1 as dissimilarity between requester and advisors, inaccurate trust value, the
effect of unpredictable behavior of agents, and transitivity of trust among agents.
In overall, TMAN reduces the risk of interaction with an untrustworthy provider,
and increases the accuracy of selecting an appropriate provider. On the whole, it
enriches the safety for business-to-business trade in e-commerce.
TMAN is able to limit the risk of interaction with malicious providers. It
provides a decision-making mechanism that is able to make an accurate decision of
which provider to interact with by selecting the most trustworthy suggested provider. In
fact, TMAN addresses each of the issues highlighted above. It selects the similar agent
for interaction, it presents a method for reducing the effect of uncertainty of future
behavior of agents on the decision-making process, it presents a method for decreasing
the chance of selecting agents which have high contradictory behaviors, and finally, it
considers a method for computing trust transitivity between agents. In summary, the
proposed model of this study is expected to benefit the academic and commercial
sectors that use e-commerce.

194
6.4 Research implications
This study has important implications for electronic business-to-business
commerce which is based on multi-agent systems. In a multi-agent environment, the
agents are autonomous and behave in a self-interested way towards one
another(Kyriakarakos et al., 2013). Such environments require the presence of a system
of trust and distrust in order to ensure the fulfilment of a contract(Hoogendoorn et al.,
2014), especially for commercial tasks which must be securely performed and where
vital information must be protected. More specifically, in the situation where the
requester agent has had no previous interactions with providers, it needs to seek the
advice of advisor agents. However, it is a challenge to find trustworthy advisors; if an
advisor provides exaggerated or wrong advice; this can lead to an unsuccessful
interaction and cause leakage of vital information(Zhang & Cohen, 2013). This issue
has motivated this research to find a computational trust model, TMAN, which can be
applied in multi-agent systems. In e-commerce multi-agent environments, TMAN
enables an agent to make effective and sound decisions in light of the uncertainty that
exists in multi-agent environments. TMAN calculates uncertainty and conflict of the
agent’s behavior to reduce the effect of unpredictable behaviors of agents.
The main benefit of using TMAN is that it provides a set of mechanisms, to
assess the trustworthiness of advisors (section 4.3.2 explained the trustworthiness of
advisors), in addition to the trustworthiness of the provider (section 4.3.3 explained the
trustworthiness of providers), and make a decision based on the advice of benevolent
advisors to select the most trustworthy provider (section 4.3.5 decision-making process
and selecting the most trustworthy provider).

195
6.5 Limitations and future research
The findings presented in this dissertation provide a basis for further research.
The following subsections discuss avenues for further research, in which TMAN can be
applied as the base trust model to explore other related areas. It is important to note that
this study has a number of limitations, and the results cannot be generalized to all other
situations. These limitations can be overcome in future studies.
6.5.1 Storage space limitation
The TMAN mechanism records all the ratings from previous interactions and all
the ratings reported by advisors; however, there is limited storage space for each agent.
This problem can be solved by proposing a method that uses an update function to store
the satisfaction and dissatisfaction ratings of previous interactions; this will reduce the
storage overhead and decrease the relative time to select a trustworthy provider.
6.5.2 Level of advisor in an advisor network
With regard to the TMAN referral mechanism, one level for advisor agents is
considered; it is assumed that each advisor suggests a provider, or if it cannot suggest
any provider it will be ignored by the requester. It may be better if the requester can ask
the advisor that cannot suggest any provider, to pass the query to another advisor which
it assumes can suggest a trustworthy provider. In this case, the level of advisors will
increase until the advisors which can suggest a trustworthy provider are found. The
researcher believes that the trustworthiness of other levels of advisors can also be
evaluated based on the formulas presented for evaluating the trustworthiness of the
provider agents. However, the number of levels can affect the level of trustworthiness of

196
agents. As the number of levels of advisors in an advisor network increases, the level of
trustworthiness also decreases.
6.5.3 Time consumed for calculation
TMAN is based on a different mathematical computation which takes time to be
calculated, and the time consumed for calculation can decrease the tendency to apply
this computational trust model. At present, other computational trust models also ignore
the time consumed for calculation. Hence, there is a need for a method that measures
the approximate time consumed for calculation of trustworthiness of agents and
selection of the most trustworthy provider.
6.5.4 Cost of agents
TMAN evaluates the trustworthiness of advisors and providers according to
previous satisfying and dissatisfying interactions; it makes a decision based on the level
of trust for each agent, without considering the transaction cost of wrong advice and
also transaction cost when dealing with each malicious provider. Evaluating the risk of
trust for an advisor or suggested provider in relation to the amount of cost that the
requester may pay for that transaction can enhance the accuracy of the decision-making
process for selecting the most appropriate provider. Future research can consider
proposing a method for evaluating the transaction cost of each agent.
6.5.5 Other components
TMAN proposed the trust model based on the main components collected from
the most representative models and the methods that those models presented for

197
computing each of those components. Future studies can improve on TMAN by
exploring other components to enhance the trustworthiness of agents and integrate them
with the approach presented in this study.
6.5.6 Other domains of application
Finally, TMAN is presented and evaluated in the context of an e-commerce
environment, especially electronic business-to-business commerce. It would be useful to
consider how application of TMAN in the domain under consideration can be extended
to different domains; an investigation can be done on the usefulness of the proposed
methods in different domains.
6.6 Summary
This chapter has provided a summary of all the key findings in this research. The
findings and research objectives, as identified in Chapter 1, have been summarized, and
the methods used to achieve the research objectives have been explained. This chapter
also recaps the proposed solutions to the problem statement,described in Chapter 1. The
chapter has also discussed contributions of this research, determination of the research
implications and identification of the research limitations. Finally, recommendations to
overcome these limitations have been presented, which can be explored by future
studies.

198
REFRENCES
Abedinzadeh, S., & Sadaoui, S. (2014). A trust-based service suggestion system using
human plausible reasoning. Applied Intelligence, 1-21.
Alani, H., Dasmahapatra, S., O’Hara, K., & Shadbolt, N. (2003). Identifying
communities of practice through ontology network analysis. IEEE Intelligent
Systems, 18(2), 18–25.
Alcalde, B., & Mauw, S. (2010). An algebra for trust dilution and trust fusion Formal
Aspects in Security and Trust (Vol. 5983, pp. 4-20). Berlin Heidelberg: Springer
Berlin Heidelberg.
Andreadis, G., Bouzakis, K., Klazoglou, P., & Niwtaki, K. (2014). Review of Agent-
Based Systems in the Manufacturing Section.
Andreadis, G., Klazoglou, P., Niotaki, K., & Bouzakis, K.-D. (2014). Classification and
Review of Multi-agents Systems in the Manufacturing Section. Procedia
Engineering, 69, 282-290.
Balakrishnan, V., & Majd, E. (2013). A Comparative Analysis of Trust Models for
Multi-Agent Systems. Lecture Notes on Software Engineering, 1(2).
Battiston, S., Walter, F. E., & Schweitzer, F. (2006). Impact of trust on the performance
of a recommendation system in a social network. Paper presented at the
Proceedings of the Workshop on Trust in Agent Societies at the Fifth
International Joint Conference on Autonomous Agents and Multi-Agent Systems
(AAMAS’06).
Bhuiyan, T., Josang, A., & Xu, Y. (2009). An analysis of trust transitivity taking base
rate into account. Paper presented at the Proceeding of the Sixth International
Conference on Ubiquitous Intelligence and Computing, Brisbane, Australia.
Bhuiyan, T., Xu, Y., & Josang, A. (2008). Integrating trust with public reputation in
location-based social networks for recommendation making. Paper presented at
the Web Intelligence and Intelligent Agent Technology, 2008. WI-IAT'08.
IEEE/WIC/ACM International Conference on, Sydney, Australia.
Biswas, S., Pattnaik, S. S., & Acharya, S. (2010). Improving DDM Performance By
Combining Distributed Data Mining And Multi-Agent System. International

199
Journal of Soft Computing and Engineering (IJSCE), 2(4), 216-221.
Bøegh, J. (2014). Trust and Trustworthiness in Human Behavior and IT Services-
Concepts, Definitions and Relations Trustworthy Computing and Services (pp.
235-251): Springer Berlin Heidelberg.
Botêlho, V., Enembreck, F., Ávila, B., De Azevedo, H., & Scalabrin, E. (2011). Using
asymmetric keys in a certified trust model for multiagent systems. Expert
systems with applications, 38(2), 1233-1240. doi: 10.1016/j.eswa.2010.05.016.
Brusilovsky, P., Corbett, A., & de Rosis, F. (2003). User Modeling 2003: 9th
International Conference, UM 2003, Johnstown, PA, USA, June 22-26, 2003,
Proceedings (Vol. 2702): Springer.
Bustos, F., López, J., Julián, V., & Rebollo, M. (2009). STRS: Social Network Based
Recommender System for Tourism Enhanced with Trust. Paper presented at the
International Symposium on Distributed Computing and Artificial Intelligence
2008 (DCAI 2008).
Chen, C.-T. (2000). Extensions of the TOPSIS for group decision-making under fuzzy
environment. Fuzzy sets and systems, 114(1), 1-9.
Conitzer, V. (2010). Making decisions based on the preferences of multiple agents.
Communications of the ACM, 53(3), 84-94.
Das, A., Islam, M. M., & Sorwar, G. (2011). Dynamic trust model for reliable
transactions in multi-agent systems. Paper presented at the Advanced
Communication Technology (ICACT), 2011 13th International Conference on.
Ding, Y., Liu, F., & Tang, B. (2012). Context-sensitive trust computing in distributed
environments. Knowledge-Based Systems, 28, 105-114. doi:
10.1016/j.knosys.2011.12.006.
Döbelt, S., Busch, M., & Hochleitner, C. (2012). Defining, Understanding, Explaining
TRUST within the uTRUSTit Project. White paper, to be published.
Dong, C., Russello, G., & Dulay, N. (2007). Trust transfer in distributed systems Trust
Management (Vol. 238, pp. 17-29). United States: Springer US.
Drumond, L., Girardi, R., & Leite, A. (2007). Architectural design of a multi-agent
recommender system for the legal domain. Paper presented at the Proceedings of
the 11th international conference on Artificial intelligence and law.

200
Etter, D. M., & Kuncicky, D. C. (2011). Introduction to MATLAB: Prentice Hall.
Garruzzo, S., & Rosaci, D. (2010). The roles of reliability and reputation in competitive
multi agent systems On the Move to Meaningful Internet Systems: OTM 2010
(pp. 326-339): Springer.
Gaur, V., Sharma, N. K., & Bedi, P. (2013). Evaluating reputation systems for agent
mediated e-commerce. arXiv preprint arXiv:1303.7377.
Gorner, J., Zhang, J., & Cohen, R. (2011). Improving the use of advisor networks for
multi-agent trust modelling. Paper presented at the Privacy, Security and Trust
(PST), 2011 Ninth Annual International Conference on.
Gorner, J., Zhang, J., & Cohen, R. (2013). Improving trust modeling through the limit of
advisor network size and use of referrals. Electronic Commerce Research and
Applications, 12(2), 112-123.
Gray, E. (2008). A trust-based reputation management system.
Grewal, R., Chakravarty, A., & Saini, A. (2010). Governance mechanisms in business-
to-business electronic markets. Journal of Marketing, 74(4), 45-62.
Griol, D., Carbó, J., & Molina, J. M. (2013). An Automatic Dialog Simulation
Technique to Develop and Evaluate Interactive Conversational Agents. Applied
Artificial Intelligence, 27(9), 759-780.
Hakansson, A., & Hartung, R. (2012). Agent and Multi-Agent Systems in Distributed
Systems-Digital Economy and E-Commerce: Springer Publishing Company,
Incorporated.
Hang, C. W., Wang, Y., & Singh, M. P. (2008). An adaptive probabilistic trust model
and its evaluation. Paper presented at the Proceedings of the 7th international
joint conference on Autonomous agents and multiagent systems-Volume 3,
Estoril, Portugal.
He, L., Huang, H., & Dong, X. (2011). GTrust: a distributed trust model in multi-agent
systems based on grey system theory Rough Sets and Knowledge Technology
(pp. 274-279). Canada: Springer.
Helbing, D. (2013). Globally networked risks and how to respond. Nature, 497(7447),
51-59.
Herzig, A., Lorini, E., Hübner, J. F., & Vercouter, L. (2010). A logic of trust and

201
reputation. Logic Journal of IGPL, 18(1), 214-244.
Hollander, C. D., & Wu, A. S. (2011). The current state of normative agent-based
systems. Journal of Artificial Societies and Social Simulation, 14(2), 6.
Hoogendoorn, M., Jaffry, S. W., Van Maanen, P.-P., & Treur, J. (2014). Design and
validation of a relative trust model. Knowledge-Based Systems, 57, 81-94.
Huynh, T. D., Jennings, N. R., & Shadbolt, N. R. (2006). An integrated trust and
reputation model for open multi-agent systems. Autonomous Agents and Multi-
Agent Systems, 13(2), 119-154.
Huynha, T. D., Jennings, N., & Shadbolt, N. (2004). FIRE: An integrated trust and
reputation model for open multi-agent systems. Paper presented at the 16th
European Conference on Artificial Intelligence, Valencia, Spain.
Iantovics, B. L. (2012). Agent-based medical diagnosis systems. Computing and
Informatics, 27(4), 593-625.
Jin, W., & Huai-Jiang, S. (2010). A novel subjective logic for trust management.
Journal of computer Research and Development, 47(1), 140-146.
Jing, P., & Ying, C. (2010, November). Theoretical and Empirical Study on Success
Factors to Enhance Customer Trust in E-commerce. Paper presented at the
International Conference on Information Management, Innovation Management
and Industrial Engineering (ICIII), 2010 Kunming.
Jøsang, A. (2011). Subjective logic. Book Draft.
Jøsang, A., Bhuiyan, T., Xu, Y., & Cox, C. (2008). Combining trust and reputation
management for web-based services Trust, Privacy and Security in Digital
Business (Vol. 5185, pp. 90-99). Berlin Heidelberg: Springer Berlin Heidelberg.
Jøsang, A., Hayward, R., & Pope, S. (2006). Trust network analysis with subjective
logic. Paper presented at the Proceedings of the 29th Australasian Computer
Science Conference-Volume 48.
Jung, Y., Kim, M., Masoumzadeh, A., & Joshi, J. B. (2012). A survey of security issue
in multi-agent systems. Artificial Intelligence Review, 37(3), 239-260. doi:
10.1007/s10462-011-9228-8
202
Kaljahi, A., Payandeh, A., & Ghoshchi, M. (2013). DTM: An Efficient and Dynamic
Trust and Reputation Model for E-commerce Agents. Journal of Basic and
Applied Scientific Research, 3(8), 300-310.
Keung, S. N. L. C., & Griffiths, N. (2010). Trust and reputation Agent-Based Service-
Oriented Computing (pp. 189-224): Springer.
Khanna, P., & Babu, B. (2012). Cloud Computing Brokering Service: A Trust
Framework. Paper presented at the The Third International Conference on Cloud
Computing, GRIDs, and Virtualization, France.
Khosravifar, B. (2012). Trust and Reputation in Multi-Agent Systems. Concordia
University.
Kyriakarakos, G., Piromalis, D. D., Dounis, A. I., Arvanitis, K. G., & Papadakis, G.
(2013). Intelligent demand side energy management system for autonomous
polygeneration microgrids. Applied Energy, 103, 39-51.
Lehtinen, L. (2012). Selling e-commerce innovations: How do CMOs and CIOs
describe their roles and relationships in the e-commerce adoption process?
Li, Y. M., & Kao, C. P. (2009). TREPPS: A trust-based recommender system for peer
production services. Expert systems with applications, 36(2), 3263-3277.
Lijian, H., Houkuan, H., & Wei, Z. (2008). A Survey of Trust and Reputation Systems in
Multi-Agent Systems. Journal of Computer Research and Development, 45(7),
1151-1160.
Logenthiran, T., Srinivasan, D., Khambadkone, A. M., & Aung, H. N. (2012).
Multiagent system for real-time operation of a microgrid in real-time digital
simulator. Smart Grid, IEEE Transactions on, 3(2), 925-933.
Lorenzi, F., Baldo, G., Costa, R., Abel, M., Bazzan, A., & Ricci, F. (2010). A Trust
Model for Multiagent Recommendations. Journal of Emerging Technologies in
Web Intelligence, 2(4), 310-318.
Majd, E., & Balakrishnan, V. (2014). Analysis of Trust Models to Improve E-Commerce
Multi-Agent Systems. Paper presented at the Proceedings of the First
International Conference on Advanced Data and Information Engineering
(DaEng-2013).

203
Marsh, S. P. (1994). Formalising trust as a computational concept.
Medić, A. (2012). Survey of Computer Trust and Reputation Models–The Literature
Overview. International Journal of Information and Communication Technology
Research, 2(3).
Moradian, E., & Håkansson, A. (2010). Controlling security of software development
with multi-agent system Knowledge-Based and Intelligent Information and
Engineering Systems (Vol. 6279, pp. 98-107): Springer.
Moyano, F., Baudry, B., & Lopez, J. (2013). Towards Trust-Aware and Self-Adaptive
Systems Trust Management VII (pp. 255-262): Springer.
Nedev, D., & Nedeva, V. (2008). Aspects of Multi-Agent System Application In E-
Learning. Paper presented at the International Scientific Conference Computer
Science.
Noorian, Z., & Ulieru, M. (2010). The state of the art in trust and reputation systems: a
framework for comparison. Journal of theoretical and applied electronic
commerce research, 5(2), 97-117.
Nusrat, S., & Vassileva, J. (2012). Recommending Services in a Trust-Based
Decentralized User Modeling System. Advances in User Modeling, 7138, 230-
242. doi: 10.1007/978-3-642-28509-7_22
O'Hara, K., Alani, H., Kalfoglou, Y., & Shadbolt, N. (2004). Trust strategies for the
semantic web. Paper presented at the Workshop on Trust, Security, and
Reputation on the Semantic Web, 3rd International (ISWC'04), Hiroshima,
Japan.
Oren, N., Norman, T. J., & Preece, A. (2007). Subjective logic and arguing with
evidence. Artificial Intelligence, 171(10), 838-854.
Patel, J. (2006). A trust and reputation model for agent-based virtual organisations.
University of Southampton.
Phulre, S., Gautam, P., & Mishra, S. K. (2013). Analysis of Trust and its effect on
Intrusion Detection system in MANET. International Journal of Advanced
Research in Computer Science and Electronics Engineering (IJARCSEE), 2(12),
pp: 786-792.
204
Pinyol, I., & Sabater-Mir, J. (2013). Computational trust and reputation models for open
multi-agent systems: a review. Artificial Intelligence Review, 40(1), 1-25. doi:
10.1007/s10462-011-9277-z
Prajapati, S. K., Changder, S., & Sarkar, A. (2013). Trust Management Model for Cloud
Computing Environment. arXiv preprint arXiv:1304.5313.
Resnick, P., & Zeckhauser, R. (2002). Trust among strangers in Internet transactions:
Empirical analysis of eBay's reputation system. 1(11), 127 - 157. doi:
10.1016/S0278-0984(02)11030-3
Rosaci, D., Sarnè, G. M., & Garruzzo, S. (2011). TRR: An integrated Reliability-
Reputation Model for Agent Societies. Paper presented at the WOA.
Sabater, J., & Sierra, C. (2001a). Regret: A reputation model for gregarious societies.
Paper presented at the Fourth workshop on deception fraud and trust in agent
societies.
Sabater, J., & Sierra, C. (2001b). REGRET: reputation in gregarious societies. Paper
presented at the Proceedings of the fifth international conference on
Autonomous agents.
Sabater, J., & Sierra, C. (2001c). REGRET: reputation in gregarious societies. Paper
presented at the Proceedings of the fifth international conference on
Autonomous agents, Montreal, Quebec, Canada.
Sanchez, N., & Molina, J. M. (2010). A multi-agent approach for provisioning of e-
services in u-commerce environments. Internet Research: Electronic Networking
Applications and Policy, 20(3), 276-295.
Sherchan, W., Nepal, S., & Paris, C. (2013). A survey of trust in social networks. ACM
Computing Surveys (CSUR), 45(4), 47.
Smarandache, F., & Dezert, J. (2006). An introduction to the dsm theory for the
combination of paradoxical, uncertain, and imprecise sources of information.
arXiv preprint cs/0608002.
Spinelli, G., & Basharat, A. (2011). Multi‐agent collaboration based on enhanced
cognitive awareness: an architecture for agents' profiling on the semantic web.
Expert Systems, 28(5), 461-487. doi: 10.1111/j.1468-0394.2011.00593.x

205
Steghöfer, J., Kiefhaber, R., Leichtenstern, K., Bernard, Y., Klejnowski, L., Reif, W.,.
Müller-Schloer, C. (2010). Trustworthy organic computing systems: Challenges
and perspectives Autonomic and Trusted Computing (pp. 62-76): Springer.
Su, X., Zhang, M., Mu, Y., & Bai, Q. (2013). A robust trust model for service-oriented
systems. Journal of Computer and System Sciences, 79(5), 596-608.
Sundresh, T. S. (2006). Semantic reliability of multi‐agent intelligent systems. Bell Labs
Technical Journal, 11(3), 225-236.
Suriyakala, C., Vedanarayanan, V., & Kumar, A. S. (2013, March). Intelligent satellite
image processing using ontology. Paper presented at the International
Conference on Circuits, Power and Computing Technologies (ICCPCT), 2013
Nagercoil, India.
Talib, A. M., & Elshaiekh, N. E. M. Multi Agent System-Based on Case Based
Reasoning for Cloud Computing System. APJ, 2, 33-37.
Tampitsikas, C., Bromuri, S., Fornara, N., & Schumacher, M. I. (2012). Interdependent
artificial institutions in agent environments. Applied Artificial Intelligence,
26(4), 398-427. doi: 10.1080/08839514.2012.653660.
Tang, Y., Cai, K., McBurney, P., Sklar, E., & Parsons, S. (2011). Using argumentation to
reason about trust and belief. Journal of Logic and Computation, exr038.
Teacy, W. T. L., Patel, J., Jennings, N. R., & Luck, M. (2006). Travos: Trust and
reputation in the context of inaccurate information sources. Autonomous Agents
and Multi-Agent Systems, 12(2), 183-198. doi: 10.1007/s10458-006-5952-x.
Thirunarayan, K., Anantharam, P., Henson, C., & Sheth, A. (2014). Comparative trust
management with applications: Bayesian approaches emphasis. Future
Generation Computer Systems, 31, 182-199.
Vassileva, J. (2012). Motivating participation in social computing applications: a user
modeling perspective. User Modeling and User-Adapted Interaction, 22(1-2),
177-201. doi: 10.1007/s11257-011-9109-5.
Walter, F. E., Battiston, S., & Schweitzer, F. (2008a). Coping with information overload
through trust-based networks Managing Complexity: Insights, Concepts,
Applications (pp. 273-300): Springer.
Walter, F. E., Battiston, S., & Schweitzer, F. (2008b). A model of a trust-based
recommendation system on a social network. Autonomous Agents and Multi-
Agent Systems, 16(1), 57-74.

206
Wang, d., & Sun, H.-J. (2009). A new evidential trust model for open communities.
Computer Standards & Interfaces, 31(5), 994-1001.
Wang, Y., Hang, C.-W., & Singh, M. P. (2011). A probabilistic approach for maintaining
trust based on evidence. Journal of Artificial Intelligence Research, 40(1), 221-
267.
Wang, Y., & Singh, M. P. (2006a). Trust representation and aggregation in a distributed
agent system. Paper presented at the AAAI.
Wang, Y., & Singh, M. P. (2006b). Trust representation and aggregation in a distributed
agent system. Paper presented at the Proceedings of the National Conference on
Artificial Intelligence, Boston, Massachusetts.
Wang, Y., & Singh, M. P. (2010). Evidence-based trust: A mathematical model geared
for multiagent systems. ACM Transactions on Autonomous and Adaptive
Systems (TAAS), 5(4), 14.
Wei, Y. Z., Jennings, N. R., Moreau, L., & Hall, W. (2008). User evaluation of a market-
based recommender system. Autonomous Agents and Multi-Agent Systems,
17(2), 251-269.
Wei, Z. (2007). A Novel Trust Model Based on Recommendation for E-commere. Paper
presented at the Service Systems and Service Management, 2007 International
Conference on.
Woo, J. W., Hwang, M. J., Lee, C. G., & Youn, H. Y. (2010). Dynamic role-based access
control with trust-satisfaction and reputation for multi-agent system. Paper
presented at the Advanced Information Networking and Applications Workshops
(WAINA), 2010 IEEE 24th International Conference on, Perth, Australia.
Xu, X. (2012). From cloud computing to cloud manufacturing. Robotics and computer-
integrated manufacturing, 28(1), 75-86. doi: 10.1016/j.rcim.2011.07.002.
Yosra, N., Raouf, K., Rym, Z., Mahmoud, H., & Mekki, K. (2013). A Fuzzy Multi agent
Architecture for Sensor based Automated Scene Surveillance. JMPT, 4(1), 1-13.
Yu, H., Shen, Z., Miao, C., Leung, C., & Niyato, D. (2010). A survey of trust and
reputation management systems in wireless communications. Proceedings of the
IEEE, 98(10), 1755-1772. doi: 10.1109/JPROC.2010.2059690.

207
Yuan, W., Guan, D., Lee, Y.-K., Lee, S., & Hur, S. J. (2010). Improved trust-aware
recommender system using small-worldness of trust networks. Knowledge-
Based Systems, 23(3), 232-238. doi: 10.1016/j.knosys.2009.12.004.
Zacharia, G. (1999). Collaborative reputation mechanisms for online communities.
Massachusetts Institute of Technology.
Zacharia, G., & Maes, P. (2000). Trust management through reputation mechanisms.
Applied Artificial Intelligence, 14(9), 881-907.
Zarandi, M. H. F., Mohammadhasan, N., & Bastani, S. (2012). A fuzzy rule-based
expert system for evaluating intellectual capital. Advances in Fuzzy Systems,
2012, 7.
Zhang, D., Simoff, S., Aciar, S., & Debenham, J. (2008). A multi agent recommender
system that utilises consumer reviews in its recommendations. International
Journal of Intelligent Information and Database Systems, 2(1), 69-81.
Zhang, J., & Cohen, R. (2008). Evaluating the trustworthiness of advice about seller
agents in e-marketplaces: A personalized approach. Electronic Commerce
Research and Applications, 7(3), 330-340.
Zhang, J., & Cohen, R. (2013). A framework for trust modeling in multiagent electronic
marketplaces with buying advisors to consider varying seller behavior and the
limiting of seller bids. ACM Transactions on Intelligent Systems and Technology
(TIST), 4(2), 24. doi: 10.1145/2438653.2438659.
Zhou, L. (2009, 21-22 May). Organizational Knowledge Management Based on Social
Network. Paper presented at the Second International Conference on Information
and Computing Science, 2009. ICIC'09. , Manchester.
208
LIST OF PUBLICATIONS AND PAPERS PRESENTED
Elham Majd and Vimala Balakrishnan, Selecting advisor agents using
reliability, reputation and risks, Journal of Intelligent and Fuzzy Systems, Journal of
Intelligent and Fuzzy Systems, (ISI-Cited), 2015.
Elham Majd, Vimala Balakrishnan and Vahid Godazgar, Selecting the Reliable
Supplier by Using the Advisor Agents, Journal of Business Industrial Marketing,
Accepted (ISI-Cited), 2015.
Elham Majd and Vimala Balakrishanan, Evaluating Reputation of Agents in
Ecommerce Multi-Agent Environments, Indian Journal of Science and Technology,
Accepted (ISI), 2015.
Elham Majd and Vimala Balakrishanan, Evaluating Reputation of Agents in
Ecommerce Multi-Agent Environments, The 4th International Conference onComputer
Science and Computational Mathematics (ICCSCM 2015), Langkawi,Malaysia 2015.
Elham Majd, Vimala Balakrishnan, Susan Gharib, Katayoon Pormahdi and Lei
li Shakeri, Calculating the Reliability and Reputation of Agents in E-CommerceMulti-
Agent Environments, Applied Mechanics and Materials (ISI-index), Vol. 548549, 2014.
Elham Majd and Vimala Balakrishnan , Analysis of Trust Models to Improve
Ecommerce Multi-Agent Systems, International Conference on Data
Engineering(DaEng 2013) , Kuala Lumpur, Malaysia, 2013 (ISI-index).
Vimala Balakrishnan and Elham Majd, A Comparative Analysis of Trust
Models for Multi-Agent Systems, Lecture Notes on Software Engineering (SCOPUS),
Vol.1(2), 2013.
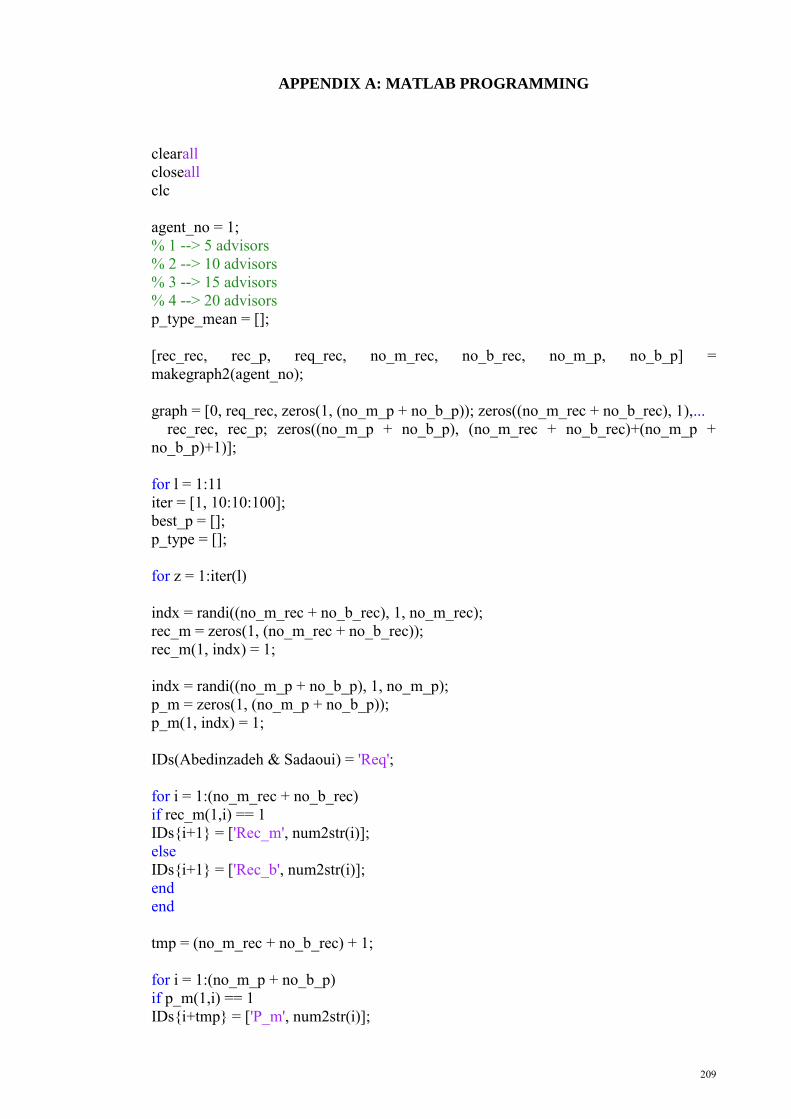
209
APPENDIX A: MATLAB PROGRAMMING
clearall
closeall
clc
agent_no = 1;
% 1 --> 5 advisors
% 2 --> 10 advisors
% 3 --> 15 advisors
% 4 --> 20 advisors
p_type_mean = [];
[rec_rec, rec_p, req_rec, no_m_rec, no_b_rec, no_m_p, no_b_p] =
makegraph2(agent_no);
graph = [0, req_rec, zeros(1, (no_m_p + no_b_p)); zeros((no_m_rec + no_b_rec), 1),...
rec_rec, rec_p; zeros((no_m_p + no_b_p), (no_m_rec + no_b_rec)+(no_m_p +
no_b_p)+1)];
for l = 1:11
iter = [1, 10:10:100];
best_p = [];
p_type = [];
for z = 1:iter(l)
indx = randi((no_m_rec + no_b_rec), 1, no_m_rec);
rec_m = zeros(1, (no_m_rec + no_b_rec));
rec_m(1, indx) = 1;
indx = randi((no_m_p + no_b_p), 1, no_m_p);
p_m = zeros(1, (no_m_p + no_b_p));
p_m(1, indx) = 1;
IDs(Abedinzadeh & Sadaoui) = 'Req';
for i = 1:(no_m_rec + no_b_rec)
if rec_m(1,i) == 1
IDs{i+1} = ['Rec_m', num2str(i)];
else
IDs{i+1} = ['Rec_b', num2str(i)];
end
end
tmp = (no_m_rec + no_b_rec) + 1;
for i = 1:(no_m_p + no_b_p)
if p_m(1,i) == 1
IDs{i+tmp} = ['P_m', num2str(i)];
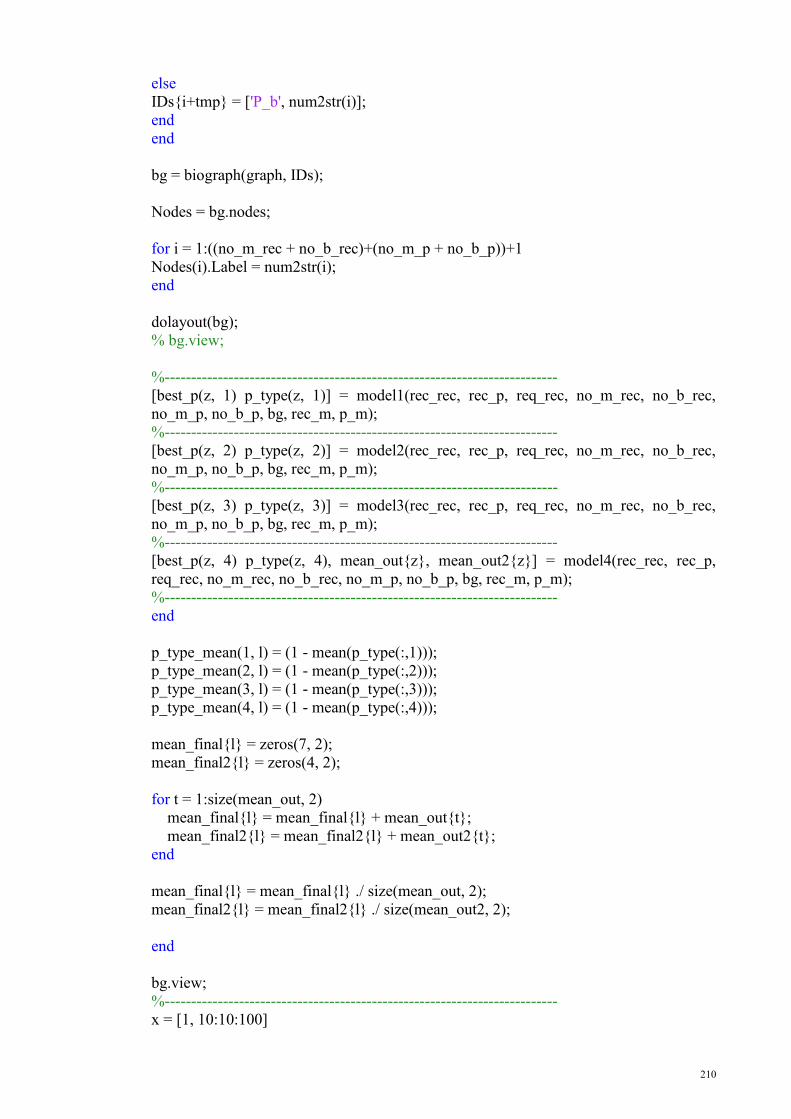
210
else
IDs{i+tmp} = ['P_b', num2str(i)];
end
end
bg = biograph(graph, IDs);
Nodes = bg.nodes;
for i = 1:((no_m_rec + no_b_rec)+(no_m_p + no_b_p))+1
Nodes(i).Label = num2str(i);
end
dolayout(bg);
% bg.view;
%--------------------------------------------------------------------------
[best_p(z, 1) p_type(z, 1)] = model1(rec_rec, rec_p, req_rec, no_m_rec, no_b_rec,
no_m_p, no_b_p, bg, rec_m, p_m);
%--------------------------------------------------------------------------
[best_p(z, 2) p_type(z, 2)] = model2(rec_rec, rec_p, req_rec, no_m_rec, no_b_rec,
no_m_p, no_b_p, bg, rec_m, p_m);
%--------------------------------------------------------------------------
[best_p(z, 3) p_type(z, 3)] = model3(rec_rec, rec_p, req_rec, no_m_rec, no_b_rec,
no_m_p, no_b_p, bg, rec_m, p_m);
%--------------------------------------------------------------------------
[best_p(z, 4) p_type(z, 4), mean_out{z}, mean_out2{z}] = model4(rec_rec, rec_p,
req_rec, no_m_rec, no_b_rec, no_m_p, no_b_p, bg, rec_m, p_m);
%--------------------------------------------------------------------------
end
p_type_mean(1, l) = (1 - mean(p_type(:,1)));
p_type_mean(2, l) = (1 - mean(p_type(:,2)));
p_type_mean(3, l) = (1 - mean(p_type(:,3)));
p_type_mean(4, l) = (1 - mean(p_type(:,4)));
mean_final{l} = zeros(7, 2);
mean_final2{l} = zeros(4, 2);
for t = 1:size(mean_out, 2)
mean_final{l} = mean_final{l} + mean_out{t};
mean_final2{l} = mean_final2{l} + mean_out2{t};
end
mean_final{l} = mean_final{l} ./ size(mean_out, 2);
mean_final2{l} = mean_final2{l} ./ size(mean_out2, 2);
end
bg.view;
%--------------------------------------------------------------------------
x = [1, 10:10:100]

211
y = p_type_mean
t = ['accuracy for 'num2str((no_m_rec + no_b_rec + no_m_p + no_b_p + 1)) ' agents'];
figure;
plot(x, y(1, :), '-^', x, y(2, :), '--*', x, y(3, :), ':+', x, y(4, :), '-.o', 'LineWidth', 2)
legend('Basic model', 'Evidence-based trust model', 'TREPPS model', 'TMAN');
xlabel('Iterations'); ylabel('Accuracy');
title(t);
%--------------------------------------------------------------------------
t = ['Before trust transitivity for advisor'num2str((no_m_rec + no_b_rec + no_m_p +
no_b_p + 1)) ' agents after 100 times run'];
y = mean_final{11}(1:4, :);
figure;
bar(y)
legend('Benevolent', 'Malicious');
set(gca, 'XTickLabel', {'Reliability', 'Unreliability', 'Reputation', 'Disrepute', 'Belief',
'Disbelief'});
ylabel('Mean');
title(t);
%--------------------------------------------------------------------------
t = ['Before trust transitivity for provider'num2str((no_m_rec + no_b_rec + no_m_p +
no_b_p + 1)) ' agents after 100 times run'];
y = mean_final{11}(5:end, :);
figure;
bar(y)
legend('Benevolent', 'Malicious');
set(gca, 'XTickLabel', {'Belief', 'Disbelief'});
ylabel('Mean');
title(t);
%--------------------------------------------------------------------------
t = ['After trust transitivity for 'num2str((no_m_rec + no_b_rec + no_m_p + no_b_p +
1)) ' agents after 100 times run'];
y = mean_final2{11};
figure;
bar(y)
legend('Benevolent', 'Malicious');
set(gca, 'XTickLabel', {'Belief', 'Disbelief'});
ylabel('Mean');
title(t);
%--------------------------------------------------------------------------


