
A STUDY ON THE ADSORPTION PROPERTIES OF QUATERNIZED CELLULOSE
Except where reference is made to the work of others, the work described in this dissertation is my own or was done in collaboration with my advisory committee. This
dissertation does not include proprietary or classified information.
____________________________________________
Weijun Wang
Certificate of Approval:
___________________________ ___________________________ Aliecia R. McClain, Co-Chair Roy M. Broughton, Co-Chair Assistant Professor Professor Textile Engineering Textile Engineering
___________________________ ___________________________ Peter Schwartz Ann Beth Jenkins Presley Professor Associate Professor Textile Engineering Consumer Affairs ___________________________ Stephen L. McFarland Dean Graduate School

A STUDY ON THE ADSORPTION PROPERTIES OF QUATERNIZED CELLULOSE
Weijun Wang
A Dissertation
Submitted to
the Graduate Faculty of
Auburn University
in Partial Fulfillment of the
Requirements for the
Degree of
Doctor of Philosophy
Auburn, Alabama December 16, 2005

iii
A STUDY ON THE ADSORPTION PROPERTIES OF QUATERNIZED CELLULOSE
Weijun Wang
Permission is granted to Auburn University to make copies of this thesis at its discretion, upon the request of individuals or institutions and at their expense. The author reserves
all publication rights.
Signature of Author
Date of Signature

iv
VITA
Weijun Wang, son of Panying Wang and Tianshen Zhou, was born on July 28,
1962, in Shanghai, People’s Republic of China. He was graduated from China Textile
University in Textile Chemistry Engineering Department in 1982. After working as a
textile research engineer in China Textile University’s Man-made Fiber Research
Institute, he was invited to Textile Engineering Department in Auburn University as a
visiting scholar in 1997. He entered the masters program in Integrated Textile and
Apparel Science at Auburn University in June 2000 and received the degree of Master of
Science in December 2002. He married Yiping Lu, daughter of Linhu Lu and Fengxiang
Wang, on April 28, 1992. They have a son, Di Wang.

v
DISSERTATION ABSTRACT
A STUDY ON THE ADSORPTION PROPERTIES OF QUATERNIZED CELLULOSE
Weijun Wang
Doctor of Philosophy, December 16, 2005 (M. S., Auburn University, 2002)
(Diploma, China Textile University, 1982)
110 Typed Pages
Directed by Roy M. Broughton and Aliecia R. McClain
The dissertation consists of four chapters: Literature Review, Anionic Dye
Decolorization from Textile Wastewater, the Characterization of the Surface
Thermodynamics of Quaternized Cellulose Fiber by Inverse Gas Chromatography, and
Study on the Correlations between the Surface Characteristics and Adsorption
Capabilities of Quaternized Cellulose Fiber.
In the first chapter, the resources of cellulose, chemical and physical properties of
cellulose, and functionlization methods of cellulose are reviewed. Recent studies are
summarized as well.
In the second chapter, an efficient way to remove the anionic dye for textile

vi
wastewater is presented. The results of the treatment of cellulose (recycled newsprint)
with 3-Chloro-2-Hydroxy-N,N,N-Trimethyl-1-Propanaminium Chloride (quaternary
ammonium) indicate that the nitrogen contents depend greatly on the pH. The optimum
pH is higher than 10 and less than 13. Increasing the amount of quaternary ammonium on
cellulose fiber increases the number of dye bonding sites and breaks up more hydrogen
bonds at the same time. Decreasing hydrogen bonding results in more swollen
macrostructures, which increases time to access to the dye bonding sites. Therefore the
dye removal kinetic is not only depended on the concentration of attached quaternary
ammonium groups but also on the surface of fibers. It is also controlled by the number of
dye sites inside the wall of the pores or the channels. The process of dye removal for
quaternized cellulose can be completed within seconds when the concentration of dye
less than 220 mg/l at room temperature. The saturation value of quaternized cellulose is
10 times higher than that of activated carbon and the quaternized cellulose exhibits an
extremely high capability for dye adsorption.
In the third chapter, the surface thermodynamics of quaternized cellulose fibers
are characterized by inverse gas chromatography (IGC) using specific gas probes over
different temperature. Surface energy characteristics (such as interaction enthalpy, the
dispersive component of the surface energy), and acid-base properties of the quaternized
cellulose surface have been quantified.
The data generated in this study is derived from the fundamental parameter in
IGC measurements, the specific retention volume by injecting neutral probes such as
saturated n-alkanes and by injecting amphoteric, acidic and basic probes such as acetone,
vii
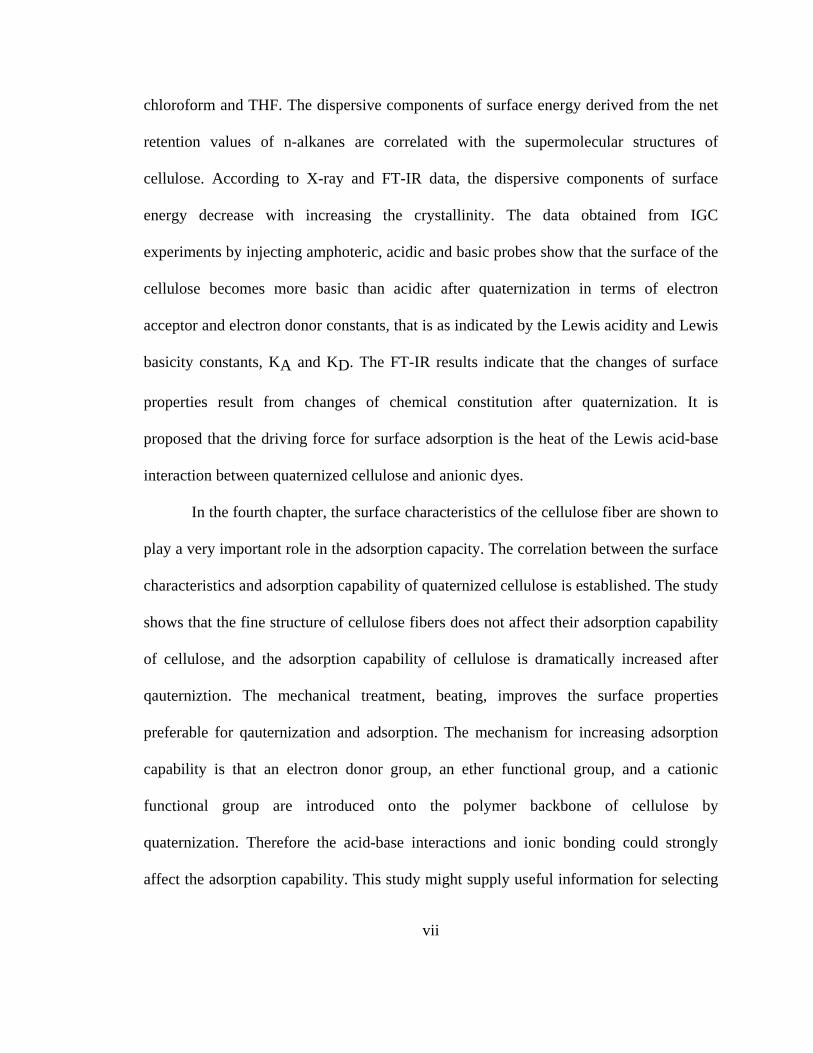
chloroform and THF. The dispersive components of surface energy derived from the net
retention values of n-alkanes are correlated with the supermolecular structures of
cellulose. According to X-ray and FT-IR data, the dispersive components of surface
energy decrease with increasing the crystallinity. The data obtained from IGC
experiments by injecting amphoteric, acidic and basic probes show that the surface of the
cellulose becomes more basic than acidic after quaternization in terms of electron
acceptor and electron donor constants, that is as indicated by the Lewis acidity and Lewis
basicity constants, KA and KD. The FT-IR results indicate that the changes of surface
properties result from changes of chemical constitution after quaternization. It is
proposed that the driving force for surface adsorption is the heat of the Lewis acid-base
interaction between quaternized cellulose and anionic dyes.
In the fourth chapter, the surface characteristics of the cellulose fiber are shown to
play a very important role in the adsorption capacity. The correlation between the surface
characteristics and adsorption capability of quaternized cellulose is established. The study
shows that the fine structure of cellulose fibers does not affect their adsorption capability
of cellulose, and the adsorption capability of cellulose is dramatically increased after
qauterniztion. The mechanical treatment, beating, improves the surface properties
preferable for qauternization and adsorption. The mechanism for increasing adsorption
capability is that an electron donor group, an ether functional group, and a cationic
functional group are introduced onto the polymer backbone of cellulose by
quaternization. Therefore the acid-base interactions and ionic bonding could strongly
affect the adsorption capability. This study might supply useful information for selecting

viii
the best adsorbates and adsorbents in terms of KA and KB, the electron donor and accepter
constants.

ix
ACKNOWLEDGMENTS
The author would like to express his utmost gratitude to his advisors, Dr. Roy M.
Broughton and Dr. Aliecia R. McClain, for always providing the patient guidance and
atmosphere of respect that made this work possible. The author also expresses his
gratitude to the other members of his advisory committee, Dr. Peter Schwarz, Dr. Ann
Beth Jenkins Presley, and outside reader, Dr. Mills for their interest, understanding and
timely invaluable advice.
The author’s appreciation from the bottom of his heart also goes to Dr. David M.
Hall for his generous chemical supplies and his valuable advices and to the head of the
Department of Textile Engineering, Dr. Schwartz, as well as the Department of Textile
Engineering for their financial supports.
Thanks are also due to his wife, Yiping Lu, and his son, Di Wang, for their
unwavering love and encouragement.

x
Style manual or journal used THE ACS STYLE GUIDE: A MANUAL FOR AUTHORS
AND EDITORS
Computer software used MICROSOFT WORD 2000

xi
TABLE OF CONTENTS
DISSERTATION ABSTRACT v
LIST OF FIGURES xvii
LIST OF TABLES xx
CHAPTER 1 LITERATURE REVIEW 1
1.1 Introduction 1
1.2 Sources of Cellulose 1
1.3 Chemical Structure and Composition of Cellulose 2
1.4 The Supermolecular Structures of cellulose 2
1.5 Hydrogen Bonding 6
1.6 Reactions of Cellulose 7
1.6.1 General Consideration 7
1.6.2 Esterification 8
1.6.2.1 Organic Esters 9
1.6.2.2 Inorganic Esters 10
1.6.3 New Cellulose Esters 11
1.7 Etherification 12
1.7.1 Carboxymethylcellulose 13

xii
1.7.2 Hydroxyethylcellulose and
hydroxypropycellulose
14
1.7.3 Alkyl ethers of cellulose 15
1.8 Grafting 16
1.9 Deoxyhalogenation 18
1.10 Oxidation 19
1.11 A example of Anionic Ion Exchanger from Cellulose 20
1.12 Two examples of Cationic Ion Exchanger from Cellulose 21
1.13 The research efforts of quaternized cellulose for color
removal during a decade
23
1.14 Summery 24
1.15 References 25
CHAPTER 2 ANIONIC DYE DECOLORIZATION FROM TEXTILE WASTE
WATER
29
2.1 Introduction 29
2.2 Experimental 30
2.2.1 Materials 30
2.2.2 Pretreatment of Recycled Newsprint (Mercerization) 30
2.2.3 Pretreatment of Recycled Newsprint (Water Swelled) 31
2.2.4 Cellulose Quaternization Reaction (Cationization) 31
2.2.5 Cationization: Method A 32

xiii
2.2.6 Cationization: Method B 33
2.2.7 Effect of Quat Concentrations on Nitrogen Contents 33
2.2.8 Effect of pH conditions on Nitrogen Contents 33
2.2.9 NNitrogen Analysis 34
2.2.10 Water Retention and Moisture Regain Tests 34
2.2.11 Precipitation Observation 34
2.2.12 Removal Dye Kinetics 34
2.2.13 Dye Adsorption Isotherm 35
2.3 Results and Discussion 36
2.3.1 Nitrogen Analysis 36
2.3.2 Effects of Quat Concentrations and pH conditions on
Nitrogen Contents
36
2.3.3 Water Retention and Moisture Regain 38
2.3.4 Precipitation Speed 40
2.3.5 The Removal Dye Kinetics 40
2.3.6 Dyeing Adsorption Isotherm 42
2.3.7 Relationship between Saturate Value and Nitrogen
Contents
48
2.4 Conclusions 49
2.5 References 51

xiv
CHAPTER 3 THE CHARACTERIZATION OF THE SURFACE
THERMODYNAMICS OF QUATERNIZED CELLULOSE FIBER BY
INVERSE GAS CHROMATOGRAPHY
52
3.1 Introduction 52
3.2 Experimental 58
3.2.1 Materials 58
3.2.2 Methods 59
3.2.2.1 Fiber Treatments 59
3.2.2.2 Inverse Gas Chromatography 59
3.2.2.3 Moisture Regains 60
3.2.2.4 Crystallinity 60
3.2.2.5 Analysis of Chemical Constitution 61
3.2.2.6 Scanning Electron Microscopy (SEM) 61
3.3 Results and Discussions 61
3.4 Conclusions 72
3.5 References 73
CHAPTER 4 STUDY ON THE CORRELATIONS BETWEEN THE
SURFACE CHARACTERISTICS AND ADSORPTION CAPABILITY OF
QUATERNIZED CELLULOSE FIBER
75
4.1 Introduction 75
4.2 Experimental 77

xv
4.2.1 Materials 77
4.2.2 Methods 77
4.2.2.1 Fiber Treatments 77
4.2.2.2 Measurements of Freeness 77
4.2.2.3 Qauternization of Beaten Fibers 77
4.2.2.4 Nitrogen Analysis 78
4.2.2.5 Chemical Constitute Analysis 78
4.2.2.6 Scanning Electron Microscopy (SEM) 78
4.2.2.7 Kinetic Dye Adsorption 78
4.2.2.8 Adsorption Isotherm 78
4.3 Results and Dissuasions 79
4.3.1 Fine Structures verse Base-Acid Interaction on Dye
Adsorption
79
4.3.2 Surface Areas verse Base-Acid Interaction on Dye
Adsorption
81
4.4 Conclusions 90
4.5 References 91

xvi
LIST OF FIGURES
Figure 1-1 Molecular structure of cellulose including numbering of C-atoms 3
Figure 1-2 Fine structure of cellulose fiber 4
Figure 1-3 Interconversion of the polymorphs of cellulose 4
Figure 1-4 Unit cell structure of native cellulose I and of mercerized cellulose II 6
Figure 1-5 Intramolecular hydrogen bonding 7
Figure 1-6 Intermolecular hydrogen bonding 7
Figure 1-7 Positions in cellulose structure for chemical modifications 8
Figure 1-8 Chemical structures of fluorine-containing cellulose esters 12
Figure 1-9 Chemical structures of new cellulose ethers 15
Figure 1-10 Cellulose fiber before grafting 17
Figure 1-11 Cellulose fiber after grafting 17
Figure 1-12 Deoxyhalogenation of cellulose 18
Figure 1-13 Oxidation of cellulose 19
Figure 1-14 A schematic depicting the special relationships of the functional
groups grafted onto the polysaccharide backbone
23
Figure 2-1 Conversion of the quat chlorohydrin to the epoxy form 31
Figure 2-2 Reaction of the quat epoxy with cellulose fiber 32
xvii
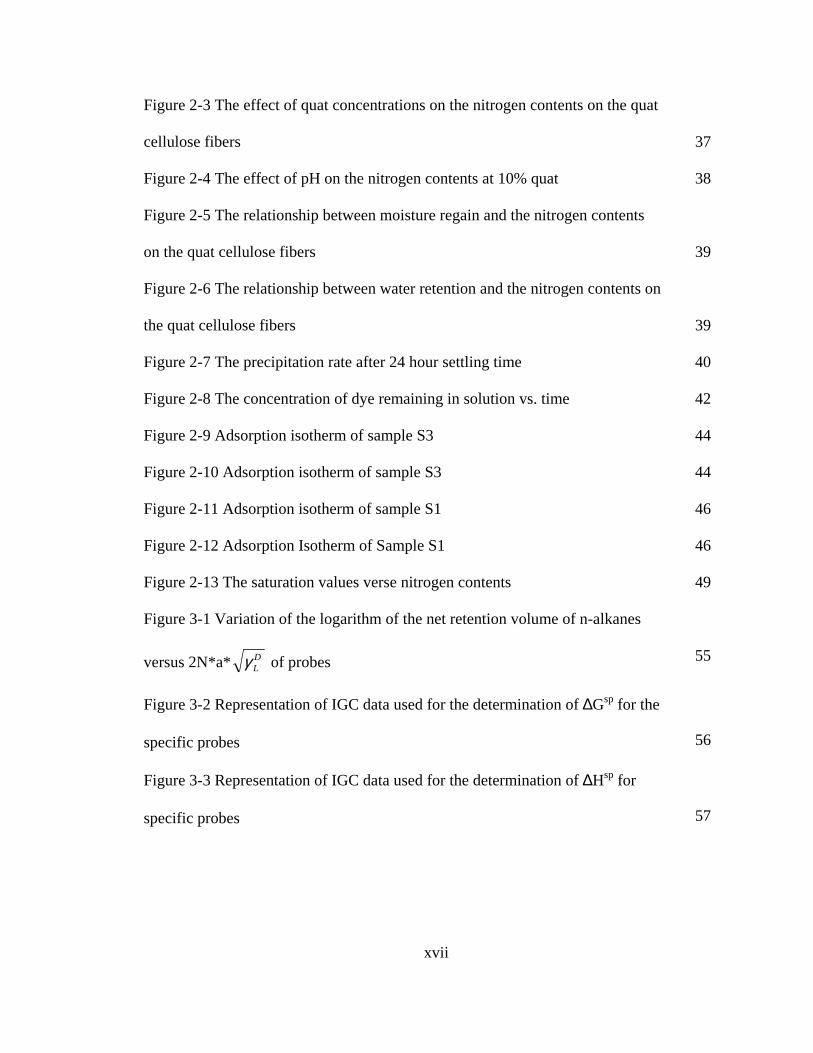
Figure 2-3 The effect of quat concentrations on the nitrogen contents on the quat
cellulose fibers
37
Figure 2-4 The effect of pH on the nitrogen contents at 10% quat 38
Figure 2-5 The relationship between moisture regain and the nitrogen contents
on the quat cellulose fibers
39
Figure 2-6 The relationship between water retention and the nitrogen contents on
the quat cellulose fibers
39
Figure 2-7 The precipitation rate after 24 hour settling time 40
Figure 2-8 The concentration of dye remaining in solution vs. time 42
Figure 2-9 Adsorption isotherm of sample S3 44
Figure 2-10 Adsorption isotherm of sample S3 44
Figure 2-11 Adsorption isotherm of sample S1 46
Figure 2-12 Adsorption Isotherm of Sample S1 46
Figure 2-13 The saturation values verse nitrogen contents 49
Figure 3-1 Variation of the logarithm of the net retention volume of n-alkanes
versus 2N*a* DLγ of probes
55
Figure 3-2 Representation of IGC data used for the determination of ∆Gsp for the
specific probes
56
Figure 3-3 Representation of IGC data used for the determination of ∆Hsp for
specific probes
57

xviii
Figure 3-4 Plot of ∆Hsp/AN as a function of DN/AN allowing the determination
of the acceptor constant KA and the donor constant KD
57
Figure 3-5 The net retention time of n-alkanes at different temperature for
Sample A (control sample)
62
Figure 3-6 The net retention time of n-alkanes at different temperature for
Sample B (mercerized sample)
62
Figure 3-7 The net retention time of n-alkanes at different temperature for
Sample D (quaternized sample)
63
Figure 3-8 The values of DSγ versus the temperature 64
Figure 3-9 Fine structure of cellulose fiber 65
Figure 3-10 FT-IR spectra for sample A, sample B, and sample D 67
Figure 3-11 Topological observation of sample A. (a) ×500, (b) ×2000 68
Figure 3-12 Topological observation of sample B. (a) ×500, (b) ×2000 69
Figure 3-13 Topological observation of sample D. (a) ×500, (b) ×2000 69
Figure 3-14 X-ray diffraction curves 70
Figure 4-1 Kinetic dye adsorption 80
Figure 4-2 The Morphology of Control Sample (a) ×500, (b) ×2000 83
Figure 4-3 The Morphology of Beaten Sample at 50 Min (a) ×500, (b) ×2000 83
Figure 4-4 The values of DSγ versus the temperature 84
Figure 4-5 FT-IR spectra for sample 0 and sample 50 84
Figure 4-6 Adsorption isotherm for samples 0 and 50 85

xix
Figure 4-7 Adsorption isotherm for samples 0-N and 50-N 86
Figure 4-8 Adsorption Isotherm for samples 50-N and 50-N-30 86
Figure 4-9 Chemical bonds and interactions between an anionic dye and the
quaternized cellulose
88
xx
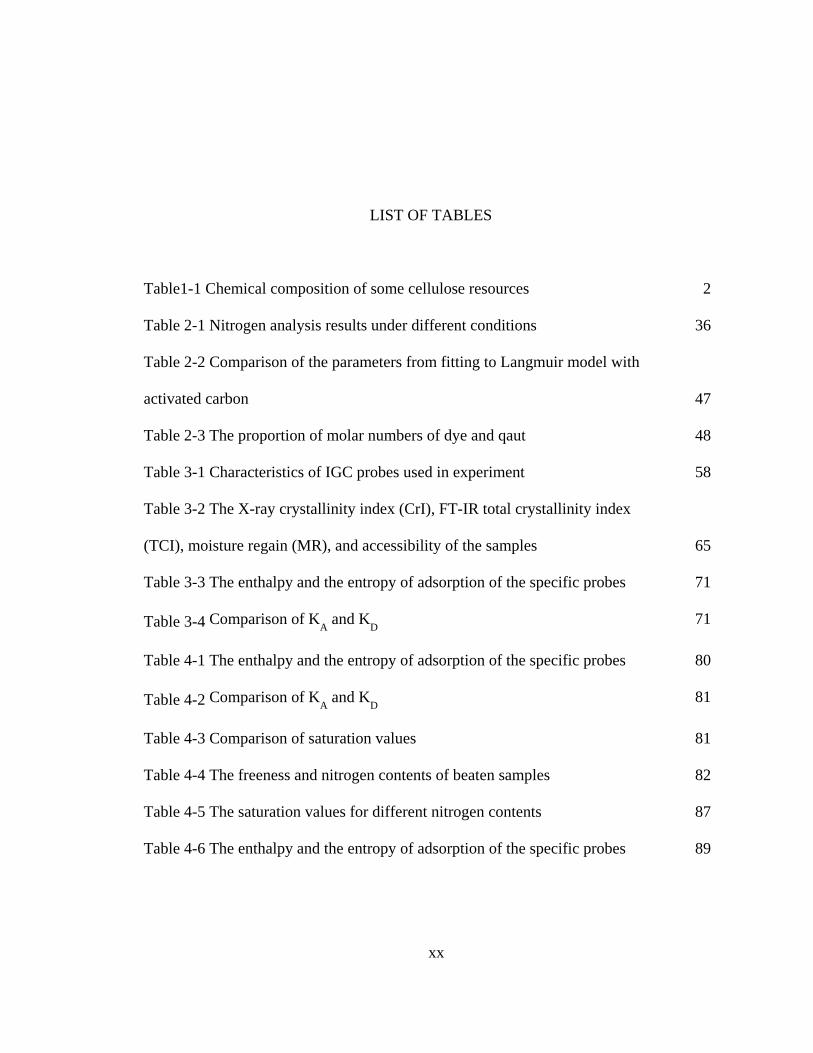
LIST OF TABLES
Table1-1 Chemical composition of some cellulose resources 2
Table 2-1 Nitrogen analysis results under different conditions 36
Table 2-2 Comparison of the parameters from fitting to Langmuir model with
activated carbon
47
Table 2-3 The proportion of molar numbers of dye and qaut 48
Table 3-1 Characteristics of IGC probes used in experiment 58
Table 3-2 The X-ray crystallinity index (CrI), FT-IR total crystallinity index
(TCI), moisture regain (MR), and accessibility of the samples
65
Table 3-3 The enthalpy and the entropy of adsorption of the specific probes 71
Table 3-4 Comparison of KA and K
D 71
Table 4-1 The enthalpy and the entropy of adsorption of the specific probes 80
Table 4-2 Comparison of KA and K
D 81
Table 4-3 Comparison of saturation values 81
Table 4-4 The freeness and nitrogen contents of beaten samples 82
Table 4-5 The saturation values for different nitrogen contents 87
Table 4-6 The enthalpy and the entropy of adsorption of the specific probes 89

xxi
Table 4-7 Comparison of the dye affinity and saturation values of quaternized
cellulose with different beating time reaction time samples
89
Table 4-8. The proportion of molar numbers of dye and quat 89

1
CHAPTER 1
LITERATURE REVIEW
1.1 Introduction
Cellulosic materials are reasonable strong, hydrophilic, insoluble in water,
insoluble in organic solvents, safe to living organisms, reproducible, recyclable, and
biodegradable. Many technologies have been applied to produce modified cellulosic
materials for our daily and industrial necessities.
Cellulosic materials are particularly attractive in this research because cellulose is
the most abundant resource of naturally occurring polymers on the earth. The chemical
structure and composition of cellulose determine its chemical and physical properties.
Cellulose has been used as a substrate for chemical modifications even before its
polymeric nature was recognized and well understood. In this review, the history of the
modification of cellulose is summarized and divided into three periods according to the
different market demands. The chemical modifications of cellulose involved
esterification, etherification, grafting, deoxyhalogenation, and oxidation.
1. 2 Sources of Cellulose
Cellulose is the most abundant natural polymer in the world. There are three
Types of Cellulosic Materials:
• Primary cellulosics: plant harvested for cellulose such as cotton, timber, hay, etc.
• Agricultural Waste Cellulosics: plant material remaining after harvesting such as
straw, corn stalks, rice hulls, sugar cane etc.

2
• Municipal Waste Cellulosics: cellulose containing waste from cities such as waste
paper, yard debris, etc.
Commercial cellulose production concentrates on easily harvested sources such as
wood or on the highly pure sources such as cotton. Table 1-1 gives us the composition of
different cellulose resources.
Table1-1. Chemical composition of some cellulose resources (Hon, 1996)
Composition (%) Source Cellulose Hemicellulose Lignin Extract
Wheat straw 30 50 15 5 Bagasse 40 30 20 10 Softwood 4-44 25-29 25-31 1-5 Hardwood 43-47 25-35 16-24 2-8 Flax (retted) 71.2 20.6 2.2 6.0 Jute 71.5 13.6 13.1 1.8 Henequen 77.6 4.8 13.1 3.6 Ramie 76.2 16.7 0.7 6.4 Cotton 95 2 0.9 0.4
1.3 Chemical Structure and Composition of Cellulose
Whereas hemicellulose has an extremely heterogeneous chemical composition,
cellulose is a chemically homogeneous linear polymer of up to 10,000 D-glucose
molecules, which are connected by β-1,4 bonds (see Figure 1-1) (Heinze, 2001). Because
each glucose residue is tilted by 180° towards its neighbor, the structural subunit of
cellulose is cellobiose. The chemical uniformity allows spontaneous crystallization of the
cellulose molecules. Hydrogen bonding within and between multiple layers of parallel
molecules results in the formation of tightly packed microfibrils.
1.4 The Supermolecular Structures of cellulose
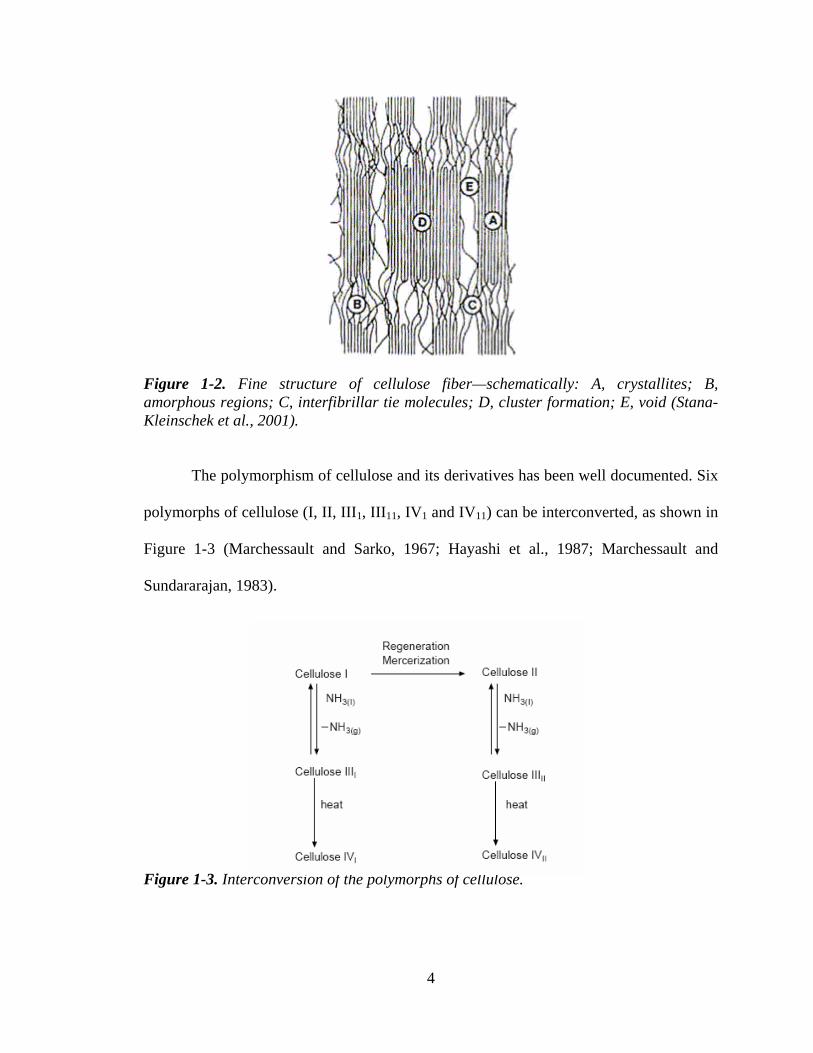
The cellulose fibers consist of elementary fibrils, which are a succession of

3
crystallites and intermediate less-ordered amorphous regions (Figure 1-2). The
crystallites (A) are characterized by their size and their orientation. Less-ordered
amorphous regions (B) connect successive crystallites length-wise; they are characterized
by their size, density, and orientation. Lateral tie molecules-region (C) connects laterally
adjacent amorphous regions. The cluster formations (D) are regions where crystallites are
fused to large aggregates and region (E) represents the voids (Stana-Kleinschek et al.,
2001). The amorphous regions and inner surface area of voids affect significantly the
accessibility, reactivity and adsorption properties of fibers.
Figure 1-1. Molecular structure of cellulose including numbering of C-atoms.
There are two main accessibilities. One is that of the low-ordered regions which
constitute the amorphous regions in the fringed micellar model, or the connecting chains
and disordered parts of the elementary fibrils in the fibrillar model, extending across the
fibrils periodically along their length. It would also include the lateral layers separating
the adjacent elementary fibrils from each other; the surfaces between consecutive crystal
blocks (see B, C, and E regions in Figure 1-2). The second accessibility is that of the
surfaces of the crystallites (see A and D regions in Figure 1- 2).
4
Figure 1-2. Fine structure of cellulose fiber—schematically: A, crystallites; B, amorphous regions; C, interfibrillar tie molecules; D, cluster formation; E, void (Stana-Kleinschek et al., 2001).
The polymorphism of cellulose and its derivatives has been well documented. Six
polymorphs of cellulose (I, II, III1, III 11, IV1 and IV11) can be interconverted, as shown in
Figure 1-3 (Marchessault and Sarko, 1967; Hayashi et al., 1987; Marchessault and
Sundararajan, 1983).
Figure 1-3. Interconversion of the polymorphs of cellulose.

5
More recently, evidence for two polymorphs of cellulose I has been offered
(VanderHart and Atalla, 1984; Sugiyama et al., 1991); that is to say what was previously
thought to be polymorph (I) has now been found to be a mixture of two polymorphs (Iα
and Iβ). Proof of the polymorphy of cellulose was obtained from nuclear magnetic
resonance (NMR), infrared and diffraction studies (Blackwell and Marchessault, 1971;
Blackwell, 1982). Cellulose I, or native cellulose, is the form found in nature. Cellulose
II, the second most extensively studied form, may be obtained from cellulose I by either
of two processes: a) regeneration, which is the solubilization of cellulose I in a solvent
followed by reprecipitation by dilution in water to give cellulose II, or b) mercerization,
which is the process of swelling native fibers in concentrated sodium hydroxide, to yield
cellulose II on removal of the swelling agent. Celluloses III1 and III11 (Marrinan and
Mann, 1956; Hayashi et al., 1975) are formed, in a reversible process, from celluloses I
and II, respectively, by treatment with liquid ammonia or some amines, and the
subsequent evaporation of excess ammonia (Davis et al., 1943; Sarko et al., 1976).
Polymorphs IV1 and IV11 (Hess and Kissig, 1941 and Sarko, 1987) may be prepared by
heating celluloses III1 and III11 respectively, to 206 oC, in glycerol (Wada et al., 2004).
Although cellulose forms some distinct crystalline structures, cellulose fibers in
nature are not purely crystalline, but with all degrees of order from crystalline to
amorphous. Regardless of their orientation, the chains are stiffened by both intrachain and
interchain hydrogen bonds. The crystalline nature of cellulose implies a structural order in
which all of the atoms are fixed in discrete positions with respect to one another. An
important feature of the crystalline array is that the component molecules of individual

6
microfibrils are packed sufficiently tightly to prevent penetration not only by dye
molecules but even by small molecules such as water. In addition to the crystalline and
amorphous regions, cellulose fibers contain various types of irregularities, such as kinks
or twists of the microfibrils, or voids such as surface micropores, large pits, and
capillaries. The total surface area of a cellulose fiber is, thus, much greater than the
surface area of an ideally smooth fiber of the same dimension. The net effect of structural
heterogeneity within the fiber is that the fibers are at least partially hydrated by water
when immersed in aqueous media, and some microspores and capillaries are sufficiently
spacious to permit penetration by relatively large molecules such as dyestuff molecules.
The dimensions of Meyer-Mark-Misch and Andress crystal lattice are shown in Figure 1-
4 (Kennedy et al., 1985).
Figure 1-4. Unit cell structure of native cellulose I (Meyer, Mark, and Misch) and of mercerized cellulose II (Andress).
1.5 Hydrogen Bonding
Each glucose of cellulose has three hydroxyl groups. Therefore, hydrogen
bonding plays a very important role in physical and chemical properties. The molecular
motion of cellulose is restricted by inter- and intra-molecular hydrogen bonding. Each
chain forms two intramolecular hydrogen bonds: O3’-H…O5’ as proposed by Hermans
7
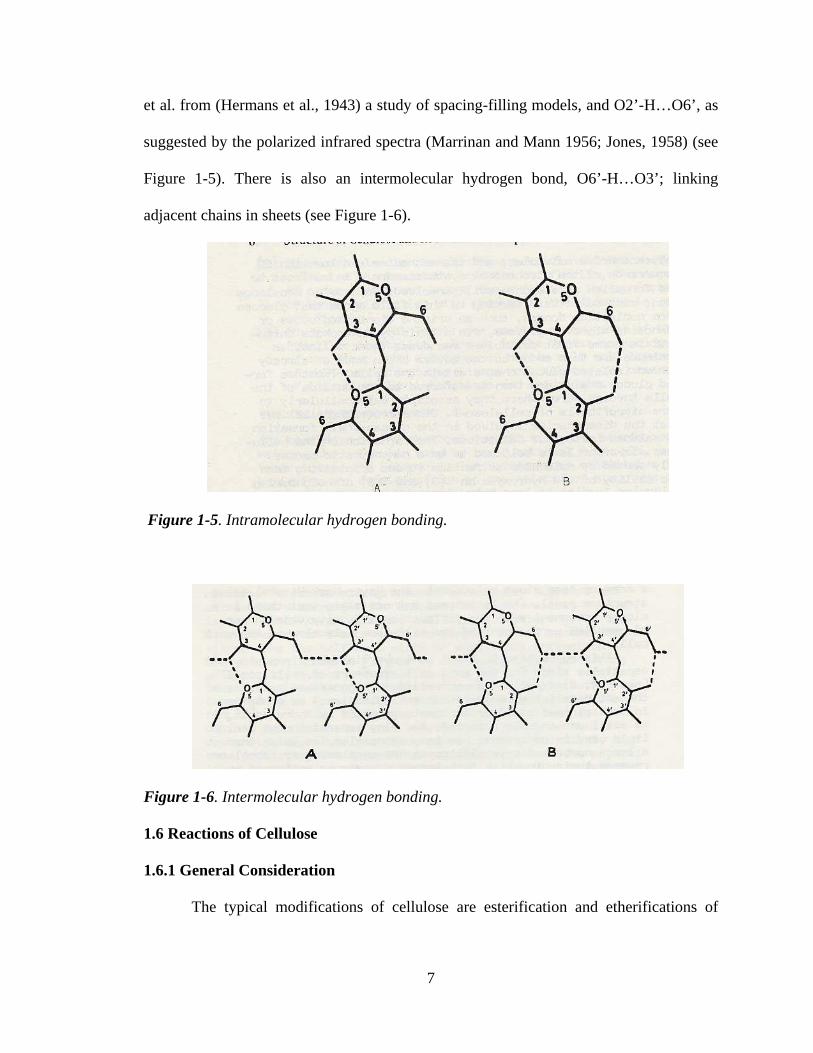
et al. from (Hermans et al., 1943) a study of spacing-filling models, and O2’-H…O6’, as
suggested by the polarized infrared spectra (Marrinan and Mann 1956; Jones, 1958) (see
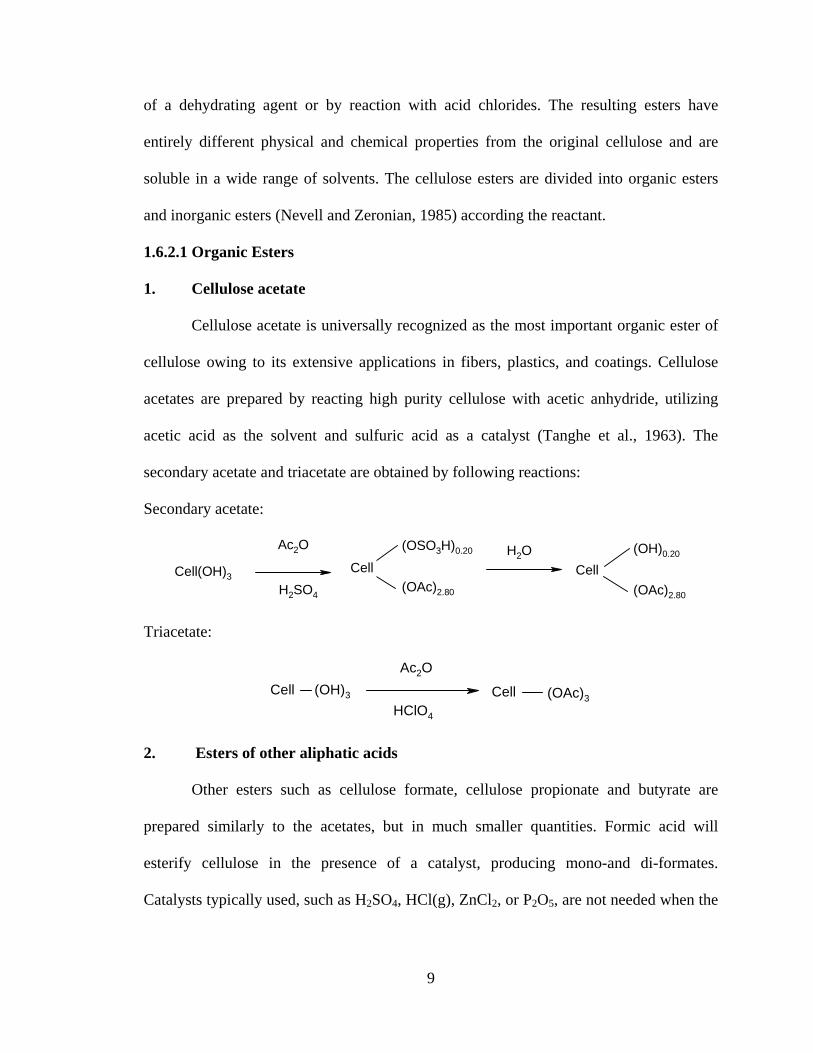
Figure 1-5). There is also an intermolecular hydrogen bond, O6’-H…O3’; linking
adjacent chains in sheets (see Figure 1-6).
Figure 1-5. Intramolecular hydrogen bonding.
Figure 1-6. Intermolecular hydrogen bonding.
1.6 Reactions of Cellulose
1.6.1 General Consideration
The typical modifications of cellulose are esterification and etherifications of

8
hydroxyl groups. Most soluble cellulose derivatives are prepared by these substitution
reactions which allow drastic changes in the original properties of cellulose to be
achieved. Others modifications include ionic and radical grafting, acetalation,
deoxyhalogenation, and oxidation. Since the usual cellulosic materials originating from
wood and cotton pulps have aldehyde and carboxyl groups in quite small quantities,
depending on the purity of the pulps, these minor groups are also target positions for
chemical modification. Figure 1-7 shows schematic representation of positions in the
cellulose structure for chemical modifications.
The relative reactivity of the hydroxyl groups varies from one reaction to another.
Usually the reaction varies in the order of OH-6 >> OH-2 > OH-3 (Nevell, 1985).
Figure 1-7. Positions in cellulose structure for chemical modifications.
1.6.2 Esterification
Since cellulose is an alcohol, it undergoes esterification with acids in the presence
9
of a dehydrating agent or by reaction with acid chlorides. The resulting esters have
entirely different physical and chemical properties from the original cellulose and are
soluble in a wide range of solvents. The cellulose esters are divided into organic esters
and inorganic esters (Nevell and Zeronian, 1985) according the reactant.
1.6.2.1 Organic Esters
1. Cellulose acetate
Cellulose acetate is universally recognized as the most important organic ester of
cellulose owing to its extensive applications in fibers, plastics, and coatings. Cellulose
acetates are prepared by reacting high purity cellulose with acetic anhydride, utilizing
acetic acid as the solvent and sulfuric acid as a catalyst (Tanghe et al., 1963). The
secondary acetate and triacetate are obtained by following reactions:
Secondary acetate:
Cell
(OSO3H)0.20
(OAc)2.80
Cell
(OH)0.20
(OAc)2.80
H2OAc2O
H2SO4
Cell(OH)3
Triacetate:
Cell (OH)3
Ac2O
HClO4
Cell (OAc)3
2. Esters of other aliphatic acids
Other esters such as cellulose formate, cellulose propionate and butyrate are
prepared similarly to the acetates, but in much smaller quantities. Formic acid will
esterify cellulose in the presence of a catalyst, producing mono-and di-formates.
Catalysts typically used, such as H2SO4, HCl(g), ZnCl2, or P2O5, are not needed when the

10
more reactive regenerated cellulose is the starting material (Novell, 1985).
3. Carbamate esters
Cellulose carbamates (urethanes) are prepared by the action of isocyanates on
anhydrous cellulose in the presence of tertiary amines. They have few commercial
applications; however, n-octadecyl and phenyl carbamates have been known for some
years, the former being used to improve water repellency of fabrics (Hamalainene et al.,
1954).
Cell(OH)3 + RNCO R'3N
Cell(OH)2(OCONR)
4. Sulfonates
Cellulose can be esterified with organic sulfonyl chlorides in the presence of
tertiary amines or alkali hydroxides (Fisher, 1959). Most of the work has been done using
p–toluenesulfonyl (tosyl) chloride, methane sulfonyl (mesyl) chloride, and benzene
sulfonyl chloride. A comparatively stable cellulose ester is formed which has no affinity
for direct dyes. Yarns treated in this manner remain white when dyed and when blended
with untreated cotton produce special effect yarn. The chemical properties of these esters
have considerable preparative utility because of the reactivity of the substituents.
Cell(OH)3 ++ RSO2ClBase
Cell(OH)2(OSO2R) + HCl
1.6.2.2 Inorganic Esters
1. Cellulose nitrate
Cellulose nitrate is the oldest cellulose derivative and the most important
inorganic ester of cellulose. It finds applications in plastics, coatings, and explosives. The
reaction (shown next page) is carried out by treating cellulose with nitric acid in the

11
presence of sulfuric acid and water (Green, 1963):
Cell (OH)3 + nHONO2 Cell(ONO2)
(OH)3-n
2. Cellulose sulfate
Sulfation of cellulose takes place by direct action of 70-75% aqueous sulfuric
acid, followed by neutralization with a mild base to obtain a salt (Whistler and Spencer,
1963):
Cell(OH)3 + nH2SO4 nH2O + Cell(OH)3-n(OSO3H)n
NaHCO3Cell(OH)3-n(OSO3Na)n
3. Phosphorous-containing cellulose derivatives
Cellulose phosphate esters of low phosphorus content can be prepared by the
reaction of wood pulp or cotton linters with phosphoric acid in molten urea. However,
higher phosphorus contents can be obtained with less degradation of the cellulose by
using excess urea and short reaction times (15min) at high temperatures (1400C).
Reaction of cellulose with a mixture of phosphoric acid, phosphorus pentoxide, and an
alcohol diluent has been shown to produce a stable, water-soluble cellulose phosphate
with high degree of substitution (Touey, 1956).
1.6.3 New Cellulose Esters
New cellulose esters were prepared using new reagents and /or organic cellulose
solvent systems. Cellulose esters containing relatively long aliphatic chains were
prepared with fatty acid chloride and pyridine under heterogeneous solid-liquid phase
conditions, and their liquid crystalline properties were studied (Itoh et al., 1992).
12
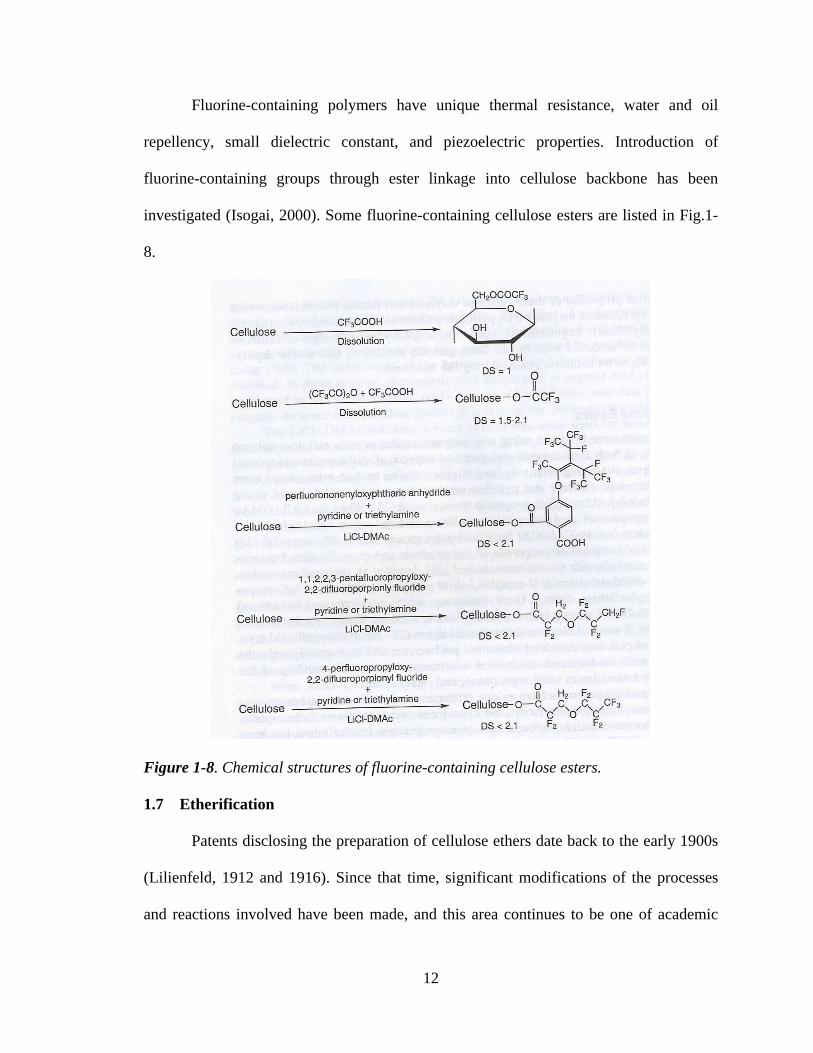
Fluorine-containing polymers have unique thermal resistance, water and oil
repellency, small dielectric constant, and piezoelectric properties. Introduction of
fluorine-containing groups through ester linkage into cellulose backbone has been
investigated (Isogai, 2000). Some fluorine-containing cellulose esters are listed in Fig.1-
8.
Figure 1-8. Chemical structures of fluorine-containing cellulose esters.
1.7 Etherification
Patents disclosing the preparation of cellulose ethers date back to the early 1900s
(Lilienfeld, 1912 and 1916). Since that time, significant modifications of the processes
and reactions involved have been made, and this area continues to be one of academic

13
and industrial research.
Two types of reaction are employed in the prepration of cellulose ethers. The
most common is nucleophilic substitution. Methylation of alkali cellulose with a methyl
halide (CH3X) is an example of this type (the equations are shown below):
Cell OH + NaOH Cell OH
NaO
HCellO- + Na+ + H2O
CellO- + CH3X CellOCH3 + X-
Preparation of hydrophobically modification water-soluble cellulose ether and
characterization of their solution properties are the current topics for cellulose ethers.
Some new cellulose ethers reported recently are illustrated in Figure 1-9 (Isogai, 2000).
1.7.1 Carboxymethylcellulose
Carboxymethylcellulose (CMC) is a polyelectrolyte with a pKa of approximately
4, thus approaching the acid strength of acetic acid. It is usually marketed as the sodium
salt, since its acid form has poor water solubility. Manufacturers are various and are
found in most technologically advanced countries. Preparation of CMC was first patented
in 1918(Jansen). Reactants have not changed significantly since then, although the
preparation processes have. The use of alkaline aqueous organic slurry preparation has in
many instances replaced the high-solids shredding procedures. Properly controlled slurry
etherification generally results in a more uniform product.
The three possible positions for chemical derivatization in cellulose are the
hydroxyl groups at C-2, C-3, and C-6. Experimentally determined molar distribution of
carboxymethyl groups in CMC has been reported to be 2:1:2.5 for C-2, C-3, and C-6

14
hydroxyls. While the C-6 primary hydroxyl is generally thought to be most reactive in
this particular system, this is not always so. There is considerable evidence that the C-2
hydroxyl group is the most acidic in cellulose. As a result, many equilibriums and rate-
controlled reactions that involve cellulosic alkoxide ions appear to favor this site;
exceptions are reactions in which steric hindrance is important. Recent NMR
spectroscopic studies of substitution distribution indicate the following order: C-2>C-
6>>C-3 (Parfondry and Perlin, 1977). The influence of reaction conditions on reactivity
has also been studied (Gelman, 1982).
1.7.2 Hydroxyethylcellulose and hydroxypropycellulose
Hydroxyethycellulose is an important commercial product manufactured all over
the word. Annual capacity had reached more than 85 million pounds by 1979 and was
still expanding. The hydroxyethyl group has the constitution –CH2.CH2OH
Hydroxypropylcellulose is manufactured on a much smaller scale, mainly in United
States. The hydroxypropyl group has the constitution –CH2.CH2.CH2OH (Nicholson and
Merritt, 1985):
x Cell O
H
NaO
H+ H2 CH2C
OCell O CH2 CH2
ONa
HOHx
x Cell O CH2 CH2
OH + Na+ + H2OH+

15
Figure 1-9. Chemical structures of new cellulose ethers.
1.7.3 Alkyl ethers of cellulose
The three most common and commercially important ethers in this class are
methylcelllose, ethylcellulose and the mixed ether, hydroxyproplmethlycellulose. Methyl
16
and ethyl ethers os cellulose are prepared by the reaction of methyl and ethyl halides with
alkali cellulose as described in section 15.1. Generally, commercial methylcellulose is
water-soluble, and commercial ethylcellulose soluble in organic solvents. As discussed
before, solubility varies with degree of substitution (DS).
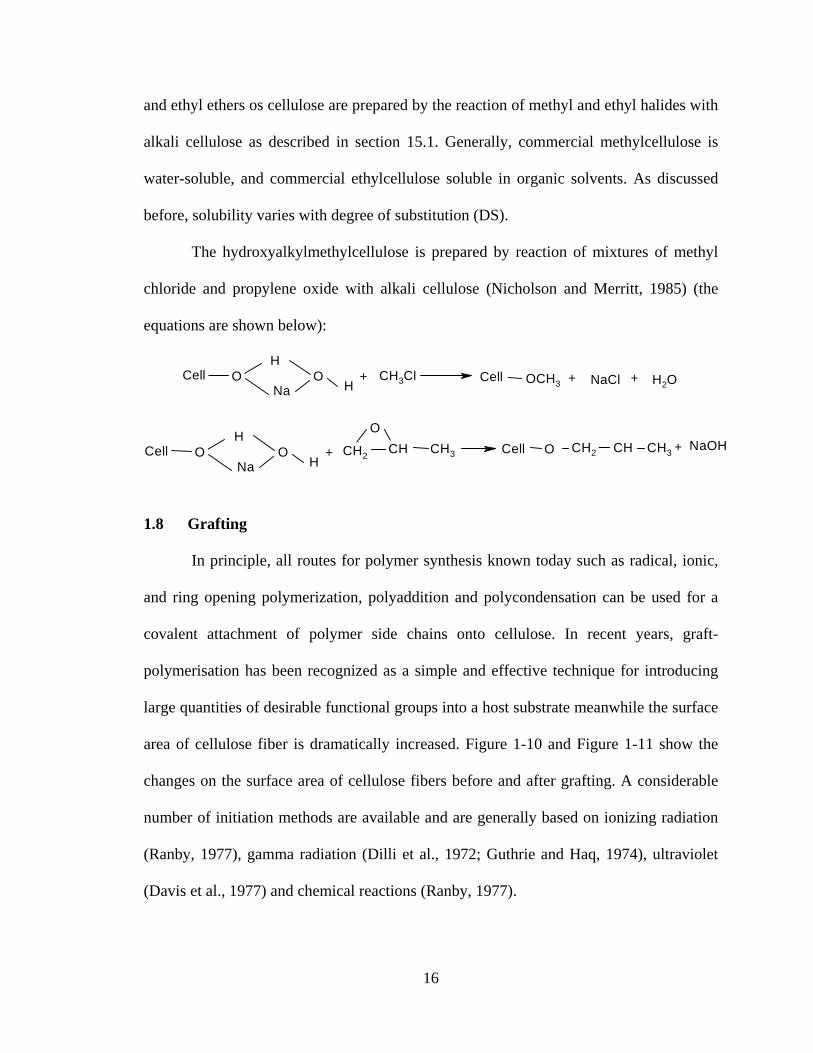
The hydroxyalkylmethylcellulose is prepared by reaction of mixtures of methyl
chloride and propylene oxide with alkali cellulose (Nicholson and Merritt, 1985) (the
equations are shown below):
Cell OH
NaO
H+ CH3Cl Cell OCH3 + NaCl + H2O
Cell OH
NaO
H+ CH2
CH CH3
O
Cell O CH2 CH CH3 + NaOH
1.8 Grafting
In principle, all routes for polymer synthesis known today such as radical, ionic,
and ring opening polymerization, polyaddition and polycondensation can be used for a
covalent attachment of polymer side chains onto cellulose. In recent years, graft-
polymerisation has been recognized as a simple and effective technique for introducing
large quantities of desirable functional groups into a host substrate meanwhile the surface
area of cellulose fiber is dramatically increased. Figure 1-10 and Figure 1-11 show the
changes on the surface area of cellulose fibers before and after grafting. A considerable
number of initiation methods are available and are generally based on ionizing radiation
(Ranby, 1977), gamma radiation (Dilli et al., 1972; Guthrie and Haq, 1974), ultraviolet
(Davis et al., 1977) and chemical reactions (Ranby, 1977).

17
In general, these have involved cationic or anionic grafts. These products have a
large number of uses. As ion exchange materials, they are used for cleaning up textile
waste water and for the recovery of precious metals and, in principle, for various air and
water filtration and cleanup operations. They also can be used for binding enzymes and
as bactericides when exchanged with certain metals or other entities (Stannett, 1985).
Figure 1-10. Cellulose fiber before grafting.
Figure 1-11. Cellulose fiber after grafting

18
1.9 Deoxyhalogenation
Preparation of cellulose derivatives that have C-X (X: halogen) groups have been
studied often using nonaqueous cellulose solvent systems (Figure 1-12), and in some
reports these deoxyhalogenated cellulose derivatives were further subjected to
substitution reactions to add functionalities to cellulose (Isogai, 2000; Furuhata et al.,
1992; Furuhata et al., 1995).
Figure 1-12. Deoxyhalogenation of cellulose.

19
1.10 Oxidation
Oxidation reactions applied to cellulose for chemical modifications in this decade
are summarized in Figure 1-13.
Figure 1-13. Oxidation of cellulose.
Some oxidation reactions occur on cellulose selectively at particular positions.
The periodate oxidation is typically involved in this category, and has been used to

20
prepare dialdahyde cellulose at laboratory levels. Generally, the oxidation requires
several days at room temperature in the dark to prepare dialdehyde cellulose from solid
cellulose samples, whose C2 – C3 bonds are mostly cleaved. Thus, degrade of polymer is
inevitable during the periodate oxidation (Morooka, et al., 1989; Varma and Chavan,
1995; Popa et al., 1996; Nevell and Zeronian, 1985).
1.11 An example of Anionic Ion Exchanger from Cellulose
Recently, researchers pay more attention to the application of sugarcane bagasse
(BG) and rice hull (RH) as a raw material for producing anion exchangers. Pure cellulose
(PC) and pure alkaline lignin (PL) were also used as reference materials to elucidate the
reactivity of lignocellulosic agricultural waste materials (LCM). Although a large number
of modification procedures for PL and PC have been reported in the literature, no
chemical procedure to produce anion exchangers effectively from both materials has been
developed (Funaoka et al., 1995; Hill and Mallon, 1998). The main objective of this study
was to develop a new synthetic procedure to produce anion exchanger from LCM.
Chemical modifications of BG, RH, PC and PL were conducted by reaction with
epichlorohydrin and dimethylamine using pyridine as catalyst and N,N-
dimethylformamide (DMF) as solvent.
Pyridine was used as a catalyst to open the strained three-membered ring of the
epoxide group in weakly basic conditions (Morrison and Boyd, 1992). The nitrogen
content of the final product was increased significantly from 0.6% to 4.80% by the
increase in the reaction time with pyridine from 30 to 60 min. However, the nitrogen
contents in the final product were almost the same (4.81%) between 60 and 120 min

21
showing that an hour of reaction was enough to expose all available hydroxyl groups in
cellulose and to attach epichlorohydrin and dimethylamine. At reaction times of 60 and
120 min and in the presence of excess water in the reaction mixture, the nitrogen content
was 0.3% and 0.35%, respectively. Nitrogen content was 0.36% in the absence of
pyridine. This suggested that the reactions proceeded more efficiently in an organic
medium. Hence, subsequent chemical treatment to convert LCM, PC and PL into anion
exchangers was carried out without water and in the presence of the weak-base catalyst
pyridine to increase the attachment of dimethylamine in the final products. Nitrogen
content in the PC exchanger is known to indicate total amount of reactive sites in the
exchanger (Ikeda et al., 1990).
Amino group incorporation into PC was decreased by the presence of water in the
reaction mixture and increased with the reaction time and presence of a catalyst, pyridine.
Bagasse and RH demonstrated maximum nitrate exchange capacities of 1.41 and 1.32
mmol/g, respectively, and yields of 412.5% and 180%, on the original material,
respectively. Both lignocellulosic agricultural waste materials appeared to be potential
materials to treat water contaminated with nitrate.
1.12 Two examples of Cationic Ion Exchanger from Cellulose
If negative charged functional groups are attached to the cellulose backbone, the
cellulose will show the properties of positive abstraction. Then the cellulose becomes a
cationic ion exchanger (Li, 2002 and Lehrfeld, 1996).
In the first case, Li and his colleagues propose the use of a commercially available, solid-
state ion exchange membrane as an alternative to the binding phases currently used with
22
diffusive gradients in thin films (DGT) for the measurement of trace metal species. There
are numerous such membranes currently available, made by the addition of electrophilic
functional groups, such as phosphoric acid, carboxyl, amidoxime, hydroxamic acid and
amidrazone hydrazide, to a backbone membrane structure, such as cellulose. Cellulose
phosphate membranes, in particular, have been used for binding metal ions and for
separation of trace metals. This material has excellent ion exchange properties combined
with a desired hydrophilic nature. The binding functional groups, which are chemically
immobilised on the cellulose backbone, provide good chemical stability and uniformity
of coverage on all surfaces of the membrane. The excellent mechanical strength and
flexibility of the material also makes it convenient for handling and preparation of the
DGT assembly. Furthermore, the ion exchange properties of the membrane can easily be
regenerated under acidic conditions to allow reuse of the material as a binding phase. The
new binding phase exhibited excellent mechanical properties and overcame many of the
problems of hydrogel-based binding phases including handling difficulty, fragility, ease
of assembly and uniformity of binding sites.
In the second case, Lehrfeld (1996) prepared a series of cationic exchange resins
from very low-value agricultural residues. In his investigation, carboxylate (maleate,
succinate, and phthalate), phosphate, and sulfate group were incorporated onto the
complex polysaccharide matrix of oat hulls, corn cobs, and sugar beet pulp (Figure 1-14).
The order of reactivity was sugar beet pulp > corn cob > oat hull. Calcium ion binding
capacities of these modified materials were measured, and some were additionally
evaluated for their ability to remove lead from a standard water solution.

23
1.13 Research efforts on quaternized cellulose for color removal
Early studies involving addition of quaternary ammonium hydroxides to cellulose
regarded quaternary ammonium as a swelling agent. This research did not continue
primarily due to the high cost of the reagents (Toth et al., 2003). Recently such research
has become popular again because the cost of tetramethylammonium hydroxide
decreased and the applications of quaternized cellulose may increase.
Many studies have focused on the harvest agricultural residues as the adsorbents
in order to reduce cost. A description of the performance characteristics of an ideal dye
adsorbent would be to have high capacity and rapid binding kinetics, to be easily and
inexpensively regenerated (Laszlo, 1994; Rock and Stevens, 1975).
Figure 1-14. A schematic depicting the special relationships of the functional groups grafted onto the polysaccharide backbone (Lehrfeld, 1996).

24
Low cost of adsorbents can be prepared by quaternization of agricultural residue
materials such as corn cob (Simkovic et al., 1992), surgarcane bagasse (Laszlo, 1996;
Simkovic and Laszlo, 1997), soybean hull and sugar beet fiber (Laszlo, 1994), and
sunflower stalk (Shi et al., 1999). The researches proved that quaterinized cellulose could
be applied as an adsorbent in removal of both anionic and cationic dyes (Shi et al., 1999).
Because the bonding between quaternized cellulose and dyes involves coloumbic
interactions, as well as inherent adsorption, the adsorbents can be regenerated by a simple
salt plus base treatment without using organic solvents (Laszlo, 1995 and 1997,
Jorgensen, 1979).
1.14 Summery
Due to the chemical and physical versatility of cellulose, many modification
methods have been applied since a peak appeared in early 1950’s (Rowell and Young).
Cellulose as a polymer has been paid more and more attention because the high prices of
oil based polymers. Research on the chemical modification of cellulose has been
successful in expanding and maintaining the use of cellulose on textile industry,
environmental industry, and biological industry.

25
1.15 References
Blackwell, J.; Marchessault, R. H. In Cellulose and cellulose derivatives; Bikales, N.; Segal L. E., Eds.; Wiley-Interscience: New York, 1971. Budd, J.; Herrington, T. M. Colloids and Surfaces 1989, 36, 273-288.
Campbell, W. H. http://www.bio.mtu.edu/campbell/482w61.htm, 1996.
Davis, N. P.; Garnett, J. L. Modified Cellulosics, Academic: London, 1977, p197. Davis, W. E.; Barry, A. J.; Peterson, F. C.; King, A. J. J. Am. Chem. Soc. 1943, 65, 1294-1300. Dilli, S.; Garnett, J. L.; Martin, E. C.; Phuoc, D. H. J. Polym. Sci. 1972, C37, 57.
Fardim, P.; Duran, N. Colloids and Surfaces, A: Physicochem. Eng. Aspects, 2003, 233, 263-276. Felix, J. M.; Gatenholm, P. Nordic Pulp and Paper Research Journal, 1993, 1, 200-203.
Fisher, J. W. in Recent Advances in the Chemistry of Cellulose and Starch, Honeyman, J. Ed.; Heywood: London, 1959, p188. Funaoka, M.; Matsubara, M.; Seki, N.; Fukatsu, S. Biotech. Bioeng. 1995, 46, 6.
Furuhata, K.; Chang, H. –S.; Aoki, N.; Sakamoto, M. Carbohydr. Res. 1992, 230, 151
Furuhata, K.; Aoki, N.; Suzuki, S.; Sakamoto, M. Carbohydr. Polym. 1995, 26, 25.
German, R. A. J. Appl. Polymer. Sci., 1982, 27, 2975.
Green, J. W. in Methods in Carbohydrate Chemistry; Whilster, R. L. Ed.; Academic:
New York and London, 1963; Vol. 3, pp 213-217.
Gurnagul, N.; Gray, D. G. Journal of Pulp and Paper Science 1985, 11 (4), 98-101.
Guthrie, J. T.; Haq, Z. Polymer 1974, 15, 133.
Hamalainen, C.; Reid, D.; Berard, N. Dyestuff Report 1954, 43, 457
Hayashi, J.; Kon, H.; Takai, M.; Hatano, M.; Nozawa, T. in The Structure of Cellulose,
Atalla, R. H. Ed.; American Chemical Society: Washington, DC, 1987, pp 135-150.

26
Hayashi, J.; Sufoka, A.; Ohkita, J.; Watanabe, S. J. Polymer Sci.: Polymer Letters Edition 1975, 13, 23-27. Heize, T.; Liebert, T. Progress in Polym. Sci. 2001, 26, 1689-1762.
Hermans, P. H.; de Booys, J.; Maan, J. Kolloid-Zt. 1943, 102, 169.
Hermans, P. H.; Weidinger, A. J. Appl. Polym. Sci. 1948, 11, 1027
Hermans, P. H.; Weidinger, A. J. Polym. Sci, 1949, 4, 709
Hill, C.; Mallon, S. Holzsforchung 1998, 52, 427.
Hon, DN-S. in Chemical modification of cellulose; Hon, DN-S., Ed.; Marcel Dekker: New York, Basel, Hong Kong, 1996; p 114 Ikeda, I.; Hitoshi, T.; Kamihiro, S. Sen‘I Gakkaishi 1990, 46 (2), 63–68.
Isogai, A. in Wood and Cellulose Chemistry. Hon, DN-S. Ed.; Marcel Dekker: New York, 2000; pp 599-625. Itoh, T.; Tsuji, T.; Suzuki, H.; Fukuda, T.; Miyamoto, T. Plymer J. 1992, 24, 641.
Jansen, E. German Patent 332,203, 1918.
Jeffries, R.; Roberts, J. G.; Robinson, R. M. Textile Res. J. 1968, 38, 234-224.
Jones, D. W. J. Polym. Sci. 1958, 32, 371.
Jorgensen, S. E. Water Res. 1979, 13, 1239-1247.
Kennedy, J. F.; Phillips, G. O.; Wedlock, D. J.; Williams, P. A. in Cellulose and Its Derivatives; Ellis Ed.; Horwood: England, 1985; p 12 Laszlo, J. A.; Dintzis, F. R. J. Appl. Polym. Sci. 1994, 52, 531-538.
Laszlo, J. A. Am. Dyest. Rep. 1994, 83 (3), 17-21.
Laszlo, J. A. Text. Chem. Colori. 1995, 21 (4), 25-27.
Laszlo, J. A. Text. Chem. Colori. 1996, 28 (5), 13-17.
Lehrfeld, J. J. Appl. Polym. Sci. 1996, 61 (12), 2099-2105.
Li, G.; Shen, J. J. Appl. Polym. Sci. 2000, 78, 676.

27
Lilienfield, L. British Patent 12,854, 1912.
Lilienfield, L. US Patent 1,188,376, 1916.
Marchessault, R. H.; Sarko, A. in Advanced Carbohydrate Chemistry 22; Wolfrom, M. L. Ed.; Academic: New York, 1967; pp 421-483. Marchessault, R. H. and Sundararajan, P. R. in Cellulose; Academic: New York, 1983; p
11.
Marrinan, M.; Mann, J. J. Polymer Sci. 1956, 21, 301-311.
Martin M. J.; Artola A.; Balaguer M. D.; Rigola M. Chem. Eng. J. 2003, 94, 231–239.
Morooka, T.; Norimoto, M.; Yamada, T. J. Appl. Polym. Sci. 1989, 38, 849.
Morrison, R. T.; Boyd, R. N. Organic Chemistry, 6th ed.; Prentice-Hall International Editions: New York University, 1992. Nicholson, M. D.; Merritt, F. M. in Cellulose Chemistry and Its Applications; Nevell, T. P.; Zeronian, S. H. Eds.; Ellis Horwood: Great Britain, 1985; pp 362-379.
Nevell T. P. and Zeronian, S.H. Cellulose Chemistry and Its Applications; Ellis Horwood: Great Britain, 1985; p 27 and pp 344-380. Nevell, T. P. Cellulose Chemistry and its Applications; Ellis Horwood: West Sussex, England, 1985; p 241. Odberg, L., Tanaka, T.; Swerin, A. Nord. Pulp Paper Res. J. 1993, 8 (1), 6.
O’sukkivan, A. C. Cellulose 1997, 4, 173-207.
Parfondry, A.; Perlin, A. S. Carbohydr. Res., 1977, 57, 39.
Popa, M. I.; Aelenei, N.; Ionescu, G. Cellulose Chem. Technol. 1996, 30, 33.
Ranby, B. Modified Cellulosics; Academic: London, 1977; p 171.
Ratte, I. D.; Breuer, M. M. The physical chemistry of dye adsorption; Academic: London and New York, 1974; pp 2-14. Rock, S. L.; Stevens, B. W. Text. Chem. Colori. 1975, 7 (9), 169. Rowland, S. P. in Modified Cellulose; Rowell Ed.; Academic: New York, 1978; pp 147-

28
170. Sarko, A. in Wood and Cellulosics: Industrial utilization, biotechnology, structure and properties; Kennedy, J. F. Ed.; Ellis Horwood: Manchester, UK 1987; pp 55-70. Shen, W.; Sheng, Y. J.; Parker, I. H. in Cellulosic Pulps, Fibers and Materials; Kennedy Ed. Woodhead: Cambridge, London, 2000; pp 181-196. Shi, W., Xu, X. and Sun, G. J. Appl. Polym. Sci. 1999, 71, 1841-1850
Simkovic, I.; Mlynar, J.; Alfoldi, J. Carbohydr. Polymer 1992, 17, 285-288.
Simkovic, I.; Laszlo, J. A. J. Appl. Polym. Sci. 1997, 64, 2561-2566.
Stana-Kleinschek, K.; Kreze, T.; Ribitsch, V.; Strnad, S. Colloids and Surfaces A:
Physicochemical and Engineering Aspects 2001, 195 (1-3), 275-284.
Stannett, V. T. Cellulose and Its Derivatives; John Wiley & Sons: New York, 1985; p 387. Sugiyama, J.; Vuong, R.; Chanzy, H. Macromolecules 1991, 24, 4168-4175
Tanghe, L. J.; Genung, L.B.; Mench, J. W. Methods in Carbohydrate Chemistry; Whilster Ed.; Academic: New York, 1963; Vol. 3, pp 193-198. Toth, T.; Brorsa, J.; Reicher, J. Text. Res. J. 2003, 73 (3), 273-278.
Touey, G. P. US Patent 2,759,924 to Eastman Co., 1956.
VanderHart, D. L.; Atalla, R. H. Macromolecules 1991, 24, 4168-4175.
Varma, A. J.; Chavan, V. B. Carbohydr. Polym. 1995, 27, 63.
Wada, M.; Heux, L.; Sugiyama, J. Biomacromolecules 2004, 5, 1385-1391.
Wadsworth, L. C.; Cuculo, J. A. in Modified Cellulose; Rowell Ed.; Academic: New York, 1978; pp 117-146. Whistler, R. L.; Spencer, W. W. Methods in Carbohydrate Chemistry; Whilster Ed.; Academic: New York, 1964; Vol. 3, p 265-267. Zeronian, S. H. in Cellulose Chemistry and Its Applications; Nevell, Ed.; Ellis Horwood: Great Britain, 1985; pp 138-180.
29
CHAPTER 2
ANIONIC DYE DECOLORIZATION FROM TEXTILE WASTEWATER
2.1 Introduction
The decolorization of textile wastewaters is a major concern to which many
diverse technologies have been applied with varying levels of success. Dyeing processes
are now under continuing scrutiny in order to prevent or minimize harmful effects that
may be attributed to any phase of wet textile processing. This is true in the case of
anionic dyes (reactive, vat, sulfur, acid, direct, and azoic) on cellulosic fibers, as well as
other fiber genera (nylon, etc.). There is a strong need for a “low cost” viable technology
that can decolorize textile effluent. The processes for color removal from textile dye
house effluents include technologies such as biological treatment (Fernando and Grant,
2003; Zissi et al., 2003), coagulation (Sanghi and Bhattacharya, 2003), adsorption
(Sakkayawong et al., 2002), oxidation (Michielsen et al., 2002), and hyperfiltration
(Gholami et al., 2003). Among these treatments, adsorption has attracted a considerable
interest as a feasible procedure for removing color from the effluents (Ho and McKay
1998; McKay et al. 1999; Khatri and Singh, 2000). Activated carbon is the adsorbent
most widely used for the removal of many organic contaminants which are biologically
resistant, but it suffers two major drawbacks: it is prohibitively expensive and there are
many technical problems connected with the regeneration of the polluted support. The
carbon adsorption is slow and may pose hydraulic problems when used in packed beds

30
and when suspended solids are present (Montgomery, 1985; Weber, 1972).
In order to remain competitive, textile mills must find a treatment method that is
very low cost in an environmentally benign manner. One discovery that offers significant
potential for improving the speed and yield of dye removal in a non-polluting manner is
the use of quaternary ammonium cellulose. Quaternary ammonium cellulose is made by
the addition of compounds containing a quaternary ammonium group capable forming an
ether linkage to the cellulose molecule. Quaternization of cellulose (recycled newsprint)
offers the potential of a large adsorption capacity and high speed for removing dye from
wastewater at a very low cost. The objective of this research was to prepare a quaternary
ammonium derivative of cellulose at room temperature using a no-salt, no-alkali dyeing
process. Dye adsorption studies of these quaternized cellulose fibers are reported.
2.2 Experimental
2.2.1 Materials
The cellulose used in the experiments was recycled newspaper. Dyes used in the
experiments were Direct Green 26 (C.I. 34045) from Organic Dyestuffs Corporation and
Congo Red (C.I. 22120; FW: 696.67; content: 54%) from SIGMA Chemical Co. The
quaternary ammonium compound, 3-chloro-2-hydroxy-N,N,N-trimethy-1-
propanaminium chloride was supplied by The Dow Chemical Company and was used
without further purification.
2.2.2 Pretreatment of Recycled Newsprint (Mercerized cellulose)
The recycled newsprint was treated with 18% sodium hydroxide (NaOH) at room
temperature with vigorous stirring. The swollen cellulosic fibers were filtered and washed
with distilled water until the pH was around 7.0. This product will serve as the treated

31
control sample designated as S1.
2.2.3 Pretreatment of Recycled Newsprint (Untreated cellulose)
Recycled newsprint was immersed in water for 24 hours, and then cut into very
small pieces using a blender. The product was then filtered. This product will serve as
the untreated control sample designated as S2.
2.2.4 Cellulose Quaternization Reaction (Cationization)
The cellulose quarenization reaction is divided into two steps. The first step of the
quaternization reactions with cellulose, involves the conversion of the chlorohydrin form
of the reagent into quaternary epoxy intermediate (2,3-epoxypropyltrimethyl-ammonium
chloride, FW: 188) shown in Figure 2-1.
ClCH2CH CH2N+ (CH3)3Cl- + NaOH
O
CH2 CHCH2N+ (CH3)3Cl-
OH
Figure 2-1. Conversion of the Quaternary Chlorohydrin to the Epoxy Form.
Next, the quaternary epoxy intermediate (FW: 151.5) reacts with the –OH group
on the cellulose polymer at the C-6 position to form the quaternized cellulose fiber shown
in Figure 2-2.
O
CH2 CHCH2N+(CH3)3Cl- + NaOH

32
OO
OH
CH2
OCH2CHCH2N+ (CH3)3Cl-
OH
OH
O
O
HO
HO
CH2
OCH2CHCH2N+ (CH3)3Cl-
OH
OO
OH
CH2
OCH2CHCH2N+ (CH3)3Cl-
OH
OH
O
Figure 2-2. Reaction of the Quaternary Epoxy with Cellulose fiber.
2.2.5 Cationization: Method A:
Solution A was obtained by mixing 1 M quaternary ammonium and 1.1 M NaOH
in order to convert the quaternary ammonium to the epoxy form at room temperature with
vigorous stirring. Then 70 g of the mercerized cellulose was reacted with 250 g of the
quaternary epoxy reactant (solution A) at room temperature with vigorous stirring,
followed by addition of a concentrated NaOH solution to reach 4% of NaOH . The
quaternized cellulose product (S3) was filtered and washed several times with distilled
water. The similar procedures were used for other reactions designated as S4, S5, and S6
with some experimental changes. In the case of S4, a concentrated NaOH solution was

33
added to produce the quaternized cellulose product and the final concentration of NaOH
was 6%. For S5 and S6, mercerized cellulose and untreated cellulose were reacted with
quaternary epoxy without adding NaOH solutions.
2.2.6 Cationization: Method B:
Solution B resulted from mixing 2 M quaternary ammonium and 2.2 M NaOH in
order to form an epoxy at room temperature under vigorous stirring. Then 70 g of the
filtered mercerized cellulose was reacted with 250 g of the quat epoxy reactant (Solution
B) at room temperature with vigorous stirring. Then, a concentrated NaOH solution was
added to produce the quaternized cellulose product at a final concentration of NaOH of
8%. The product (S7) was filtered and washed several times with distilled water. The
same procedures were used for other reaction designated as S8 with some experimental
changes. With S8, no additional NaOH solution was added to the reaction mixture.
2.2.7 Effect of Quaternary Ammonium Concentrations on Nitrogen Contents
A quantity of mercerized cellulose was slurried with water and 30% NaOH was
added to adjust pH to 12.5, then quaternary epoxy was added to the slurry in various
amount: 5, 10, 15, 20, and 25% based on the weight of slurries (liquor ratio: 20:1). The
epoxy quaternary was added drop wise to minimize hydrolysis. The reaction was allowed
to stir for 1 hour at room temperature. The product was filtered and washed with distilled
water several times until the pH was around 7. The names of samples are H1, H2, H3,
H4, and H5 corresponding 5, 10, 15, 20, and 25% concentrations of epoxy quaternary.
2.2.8 Effect of pH conditions on Nitrogen Contents
A quantity of mercerized cellulose was slurried with water and 30% NaOH was
added to adjust various pH, then quaternary epoxy was added to the slurry to form 10%
quaternary epoxy at the final step (liquor ratio: 20:1). The quaternary epoxy was added
34
drop wise to minimize hydrolysis. The reaction was allowed to stir for 1 hour at room
temperature. The product was filtered and washed with distilled water several times until
the pH was around 7.
2.2.9 Nitrogen Analysis
Samples were dried at 45 oC under vacuum in a vacuum oven. The nitrogen
contents were determined using a LECO CN-2000 instrument at 1050 oC. The analysis
was performed at the Soil Test Lab of Auburn University.
2.2.10 Water Retention and Moisture Regain Tests
The water retention for each sample was measured on washed and filtered
samples using the ASTM standard test method (Annual Book of ASTM Standards,
D2404-94, 1998). Moisture regain was measured after the samples were dried using the
ASTM standard test method (Annual Book of ASTM Standard, D4920-96b, 1998).
2.2.11 Precipitation Observation
Eight quaternized cellulose fiber samples were placed in eight 50 mL graduated
cylinders containing 0.1% (0.005 g) Direct Green 26 dye solution at room temperature.
The boundary between the dyed cellulose and the solution was observed. The scales of
the high dyed cellulose were recorded after 12 hours.
2.2.12 Dye Removal Kinetics
The quaternized cellulose fiber was placed into 200 ml of dye solution containing
25 mg/L of Direct Red dye (C.I. 22120) at room temperature and stirred vigorously. The
concentration of the dye in the solution at specific time intervals (every 1 minute for the
first five points and every 5 minutes thereafter) was measured using a GeneSys 6
spectrophotometer (λmax = 500 nm).

35
2.2.13 Dye Adsorption Isotherm
For the adsorption experiments, precisely weighed quaternized cellulose was
placed in 50 mL Direct Red dye solution (C.I. 22120). The equilibrium isotherm
experiments consisted of ten flasks containing the same amount of adsorbent, mixed with
different concentration of dye solution. The liquor ratio is approximately 1:285. The dye
solution concentration varied from 25 to 1000 mg/L of dye.
Each of the flasks containing quaternized cellulose fiber and dye solution was
agitated in a constant temperature water bath at 25 oC. After 24 hours, the solution
samples were filtered using a glass filter. The concentrations of the dye in the solutions
([D] s) was measured using a GeneSys 6 spectrophotometer (λmax = 500 nm) in order to
calculate the amount of dye on the cellulose fibers ([D] f). Then, the [D]s was plotted as a
function of [D]f.

36
2.3 Results and Discussion
2.3.1 Nitrogen Analysis
Table 2-1 summarizes the nitrogen analysis results under different reaction
conditions. For samples S3, S4, S5, S6, S7, and S8, our preliminary results show that the
percentage of nitrogen groups on the cellulose fibers overall depends on the concentration
of sodium hydroxide (pH) and the concentration of the quaternary ammonium group in
reaction solution (Rollins, 1997 and Hall 1996). However, the pretreatment does not
affect on the nitrogen contents on the cellulose fibers based on the results of sample S5
and S6.
Table 2-1. Nitrogen analysis results under different conditions.
Sample #
Mercerized (18% NaOH)
Concentration of Quat (mol/L)
%NaOH in
Reaction
% Nitrogen
Comments
S1 Yes 0 0.063 Control sample
S2 Water swelled only
0 0.075 Control sample
S3 Yes 1.0 4 1.33
S4 Yes 1.0 6 1.21
S5 Yes 1.0 0 0.26
S6 Water swelled only
1.0 0 0.27
S7 Yes 2.0 8 1.70
S8 Yes 2.0 0 0.19
2.3.2 Effects of Quaternary ammonium Concentrations and pH conditions on
Nitrogen Contents
In order to reduce any byproduct formation and enhance the efficiency of the

37
reaction, a series of quaternary ammonium concentrations were prepared to determine the
optimum reaction conditions. Figure 2-3 illustrates the effect of quaternary ammonium
concentrations on the nitrogen contents on the cellulose fibers at a pH 12.5. The result
shows that the percent nitrogen content on the cellulose fiber increased with increasing
quaternary ammonium concentration when the quaternary ammonium concentration is
less than 10%; but decreased beyond 10% oncetration, normally the hydrolysis process
should increases with increasing liquor ratio and pH. It has been determined that the
reaction of the quaternary ammonium with the cellulose does not occur until the pH is at
least 11.5 (optimum at pH 12) (Rollins, 1997). The results of effects of pH conditions on
the nitrogen contents shown in Figure 2-4 indicate that at a pH of 12.5, we were able to
optimize the reaction conditions at 10% quaternary ammonium concentration. This
concentration was calculated to be equivalent to the 1.0 mol/L of quaternary ammonium
solution shown in Table 2-1.
Figure 2-3. The effect of quaternary ammonium concentrations on the nitrogen contents on the quaternized cellulose fibers.
0.000
0.050
0.100
0.150
0.200
0.250
0.300
0.350
0.400
0.450
0 5 10 15 20 25 30
Concentration of Quat (%)
Nit
rog
en C
on
ten
ts (
%)
H1
H2 H3
H4
H5

38
2.3.3 Water Retention and Moisture Regain
Water retention and moisture regain data for each sample are shown in Figure 2-5
and 2-6. In the reaction mixtures, the sodium hydroxide solution added can only swell
the cellulose fibers in the amorphous regions but not in the crystalline regions. On the
other hand, the quaternization occurred not only inside amorphous regions but also on the
surfaces of the crystalline regions. The reaction resulted in increasing the polarity of
cellulose fibers because a quaternary ammonium salt had been introduced into the
chemical structures of cellulose fiber. This was proved by FT-IR data presented in the
next chapter. Thus, both of the water retention and the moisture regain increased with
increasing the percentage of nitrogen content in the fiber.
Figure 2-4. The Effect of pH on the nitrogen contents at 10% quaternary ammonium.
0
0.05
0.1
0.15
0.2
0.25
0.3
0.35
0.4
0 2 4 6 8 10 12 14
pH
Nit
rog
en C
on
ten
ts (
%)
N%

39
Figure 2-5. The relationship between moisture regain and the nitrogen contents on the quaternized cellulose fibers.
Figure 2-6. The relationship between water retention and the nitrogen contents on the quaternized cellulose fibers.
0
2
4
6
8
10
12
14
16
0 0.5 1 1.5 2
Nitrogen Content (%)
Mo
istu
re R
egai
n (
%)
0
1
2
3
4
5
6
7
8
0 0.5 1 1.5 2
Nitrogen Contents (%)
Wat
er R
eten
tio
n (
100*
%)
40
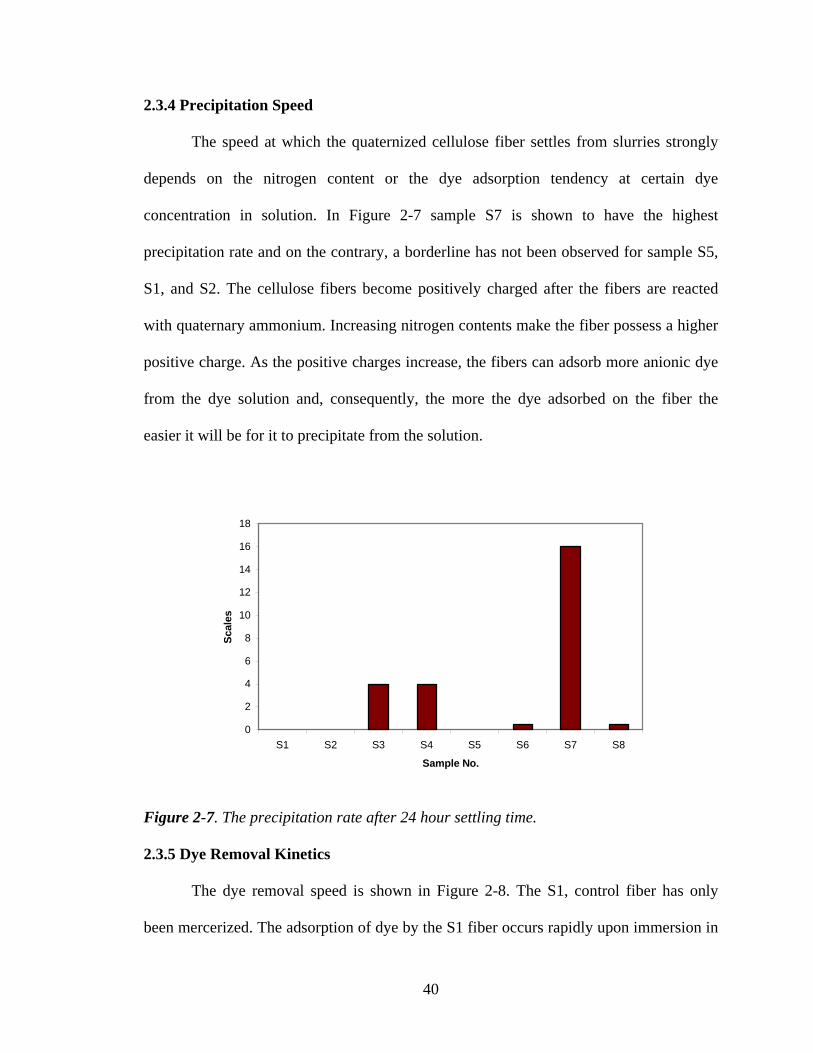
2.3.4 Precipitation Speed
The speed at which the quaternized cellulose fiber settles from slurries strongly
depends on the nitrogen content or the dye adsorption tendency at certain dye
concentration in solution. In Figure 2-7 sample S7 is shown to have the highest
precipitation rate and on the contrary, a borderline has not been observed for sample S5,
S1, and S2. The cellulose fibers become positively charged after the fibers are reacted
with quaternary ammonium. Increasing nitrogen contents make the fiber possess a higher
positive charge. As the positive charges increase, the fibers can adsorb more anionic dye
from the dye solution and, consequently, the more the dye adsorbed on the fiber the
easier it will be for it to precipitate from the solution.
0
2
4
6
8
10
12
14
16
18
S1 S2 S3 S4 S5 S6 S7 S8
Sample No.
Sca
les
Figure 2-7. The precipitation rate after 24 hour settling time.
2.3.5 Dye Removal Kinetics
The dye removal speed is shown in Figure 2-8. The S1, control fiber has only
been mercerized. The adsorption of dye by the S1 fiber occurs rapidly upon immersion in

41
the dye solution and reaches equilibrium within 3 min (dye concentration is 22 mg/L at
equilibrium). However the solution remained a dark red color without dye being fully
removed. The adsorption of dye solution for each of the S3 and S5 fibers occurred
quickly within the first 1 minute. Both of the fibers adsorbed the dye solution at a similar
rate, shown in Figure 2-8. Their rates remained constant for 25 min. There was a slight
difference in their initial adsorption rates with the S5 fiber adsorbing (dye concentration
is 2 mg/L at equilibrium) a little faster than the S3 fiber (dye concentration is 0 mg/l at
equilibrium). The solution treated with the S3 fiber became clear after 1 minute upon
immersion in the dye solution and the solution treated with the S5 fiber became a clear
faint pink color (almost colorless) after 1 minute upon immersion in the dye solution. The
adsorption of dye solution for the S7 fibers also occurred quickly within the first minute.
However, the dye solution treated with the S7 fiber was still reddish after 25 minutes (dye
concentration is 4 mg/L at equilibrium), even though the S7 fiber contained the highest
nitrogen content. This phenomenon can be explained by the pore or channel model that is
usually applied for natural fibers due to their fibrillar structures (Rattee and Breuer,
1974). Dye bonding sites are distributed on the surface of the pore or channel walls. The
higher nitrogen contents could break the more hydrogen bonds in cellulose. This causes
the cellulosic fibers to swell more (water retention can affect the structural changes) and
then the pores or channels start to collapse, and thus the dye sites are difficult to be
reached within a certain time. Therefore, the dye adsorption speed is controlled by a
kinetic process. The dye adsorption speed is not only affected by the nitrogen contents,
but also governed by the geometry of the pores and channels.

42
Figure 2-8. The concentration of dye remaining in solution vs. time.
2.3.6 Dyeing Adsorption Isotherm
The adsorption of concentrated dye solution in fibers with aqueous media, is a
heterogeneous process, the following fundamental processes have to be considered: (a)
diffusion of the dye into the polymer matrix; (b) adsorption on the surface; and (c) the
adsorption which may or may not be followed by desorption. In the case of adsorption,
there are two possible considerations: (1) adsorption without any interaction on with
neighbors - Langmuir isotherm type and (2) adsorption involving the interaction between
the neighbors – Freundlich and Temkin type or Brunauer, Emmett and Teller (BET)
isotherm type (Rattee and Breuer, 1974). Only the Langmuir type will be discussed here.
The Langmuir theory assumes that the adsorption happens in single layer and every
available adsorptive site gets one dye molecule without interaction with its neighbors.
The adsorption curves in Figure 2-9, 2-11, and 2-13 indicate that the results
obtained from the adsorption isotherm experiments can be explained using the Langmuir
0
5
10
15
20
25
30
0 5 10 15 20 25 30
Time (min)
Co
nce
ntr
atio
n o
f D
ye R
emai
nin
g (
mg
/ml)
S1,N%=0.063
S5, N%=0.26
H2, N%=0.42
S3,N%=1.33
S7,N%=1.70

43
isotherm models. This can be calculated using the following equation:
The rate of adsorption = Va = k1[D] s([S] – [D]f) (2-1)
In which k1 is the velocity constant of adsorption; [D]s is concentration of dye in solution
at equilibrium; [D]f is concentration of dye on the fiber; [S] is saturation value of dye on
fiber.
The rate of desorption = Vd = k2[D] f (2-2)
In which k2 is the velocity constant of desorption. At equilibrium the rates of absorption
and desorption are equal so that:
Va = Vd (2-3)
k1[D] s([S] – [D]f) = k2[D] f (2-4)
let K = k1/k2,
[D]f = K[D]s([S] – [D]f) (2-5)
or [D]f (1+K[D]s) = K[D]s[S] (2-6)
Thus
[D]
1
f
= [S]K[D]
1
s
+ [S]
1 (2-7)

44
Adsorption Isotherm (sample S3)
200
250
300
350
400
450
500
550
600
0 2 4 6 8 10
Residual dye at Equilibrium (mg/ml)
Am
ou
nt
of
Dye
Ad
sorb
ed o
n F
iber
s (m
g/g
)
Figure 2-9. Adsorption Isotherm of Sample S3.
Figure 2-10. Adsorption Isotherm of Sample S3.
The interaction of the quaternary cellulose fiber with the dye solution was
measured at 25oC with a definite amount of the quaternized cellulose and with varying
concentrations of dye solution from 25 up to 1000 mg/L until equilibrium was reached.
The model was successfully applied to the adsorption isotherm of dye molecules onto the
y = 0.4709x + 0.0016
R2 = 0.9568
0
0.0005
0.001
0.0015
0.002
0.0025
0.003
0.0035
0 0.0005 0.001 0.0015 0.002 0.0025 0.003
1/[D]s (l/mg)
1/[D
]f (
g/m
g)

45
quaternized cellulose fiber, where a Langmuir type of adsorption, involving saturation of
the active surface sites does quantify the isotherm.
One should note the initial value of dye adsorbed on quaternized cellulose fiber,
[D] f in Figure 2-9 and Figure 2-11. The values do not start at 0 mg/g of dye remaining in
solution, instead it starts over 220 (mg/g) of dye remaining in solution. The reason for
this is after 24 hrs of agitation, the amount of dye absorbed by the quaternized cellulose
fiber for the first five dye solutions (remaining dye concentrations was less than 220
mg/g) were clear. Therefore, data collection began at 220mg/g of dye remaining in
solution and higher. When the quaternized is reacted with the cellulose fiber, it becomes
very highly positively charged. The attraction between the positive charges in fibers and
negative charges in dye molecules makes the cellulose have a very high adsorption
affinity toward the dye molecule, resulting in relatively strong adsorbent–adsorbate
interactions. On the contrary, the untreated cellulose (Figure 2-11) and activated carbon
do not posses such a strong positive charge, therefore the [D]f values are started at 0
(mg/g) with increasing dye concentrations (Martin et al., 2003).
The plot of 1/[D]f vs. 1/[D]s is given in Figure 2-10 and Figure 2-12 and is shown
to be linear over the whole concentration range. The adsorption data yield a correlation
coefficient greater than 0.96, and 0.99, for S1 and S3 fibers respectively, confirming an
excellent fit to the Langmuir isotherm.

46
Figure 2-11. Adsorption Isotherm of Sample S1.
Figure 2-12. Adsorption Isotherm of Sample S1.
Adsorption Isotherm (sample S1)
0
20
40
60
80
100
120
140
0 2 4 6 8 10 12
Residual Dye at Equilibrium (mg/ml)
Am
ou
nt
of
Dye
Ad
sorb
ed o
n
Fib
ers
(mg
/g)
y = 14.315x + 0.007
R2 = 0.9945
0
0.02
0.04
0.06
0.08
0.1
0.12
0.14
0.16
0.18
0.2
0 0.002 0.004 0.006 0.008 0.01 0.012 0.014
1/[D]s (l/mg)
1/[D
]f (
g/m
g)

47
In the Table 2-2, the saturation values, [S], derived from the Langmuir isotherm
model, are compared to that of the powdered activated carbon (Martin et al., 2003). As
shown in Table 2-2, the sample of higher nitrogen content has a larger dye adsorption
capability. The saturation values, [S], of quaternized cellulose are almost 10 times as high
as that of the activated carbon. The greater dye adsorption capability is attributed to
higher nitrogen contents or higher positive charges on the fibers. As mentioned before,
the dye adsorptions of samples S1 and H2 are very fit the Langmuir model at lower
nitrogen contents because the linear regressions are 1.00 and 0.99 respectively. However,
the adsorption isotherm of sample S7 does not well fit the Langmuir model well because
the linear regression of sample S7 is 0.72.
Table 2-2. Comparison of the parameters from fitting to Langmuir model with activated carbon.
Sample [S] (mol/kg) N% R2
S1 0.22 0.06 1.00
H2 0.35 0.42 0.99
S3 0.90 1.33 0.96
S7 0.96 1.70 0.72
Activated carbon (Martin et al, 2003)
0.07 0.17 1.00
In order to investigate the adsorption behavior of quaternized cellulose fiber, the
molar numbers of adsorbed dye on the cellulose fiber and reacted quaternary group on the
fiber can be calculated from Table 2-2. The results of the calculation are listed in Table 2-
3. D and N represent the molar number of adsorbed dye on the fiber and the molar

48
number of quaternary group on the fiber respectively based on 1 kg of quaternized
cellulose fibers. The proportion of D/N has an approximate value to 1 for sample H2 and
sample S3 respectively. That means one molecule of quaternary group can bond one dye
molecule at relative high nitrogen contents. This meets the assumption of Langmuir
isotherm adsorption. On the other hand, the proportion of sample S7 is less than 1 and
indicates the adsorption is not a monolayer adsorption. This is the reason that causes a
poor linear regression of sample S7 shown in Table 2-2.
Table 2-3. The proportion of molar numbers of dye and nitrogen
Sample Dye moles/kg (D) Quat moles/kg (N) D/N
H2 0.35 0.30 1.17
S3 0.90 0.95 0.95
S7 0.96 1.21 0.79
2.3.7 Relationship between Saturate Values and Nitrogen Contents
The saturation values of quaternized cellulose increase with the nitrogen contents
due to the adsorption of the quaternized cellulose fits the Langmuir monolayer model at
lower nitrogen contents. However, the saturation value levels off after the nitrogen
content over is 1.5% shown in the Figure 2-13.

49
0
0.2
0.4
0.6
0.8
1
1.2
0 0.5 1 1.5 2
N%
Sat
ura
tio
n V
alu
e [S
] (m
ol/
kg)
[S]
Figure 2-13. The saturation values verse nitrogen contents.
2.4 Conclusions
Any cellulose resources including recycled newsprint, straw, cardboard, hay
(kudzu), and sawdust should posses an ability to act as a dye absorbent if they possess an
extremely high anion dye adsorption capability after the cellulose is quaternized. The
results of reacting cellulose (recycled newsprint) with quaternary ammonium groups
indicate that the nitrogen contents depend greatly on the pH. The optimum pH is around
12. The alkali pretreatment is not important for cellulose to react with the quaternary
epoxy. The quaternized cellulose of higher nitrogen contents possesses highest dye-
adsorption capacity.
Increasing the amount of quaternary ammonium that react with the cellulose
fibers, increases the number of dye bonding sites in the fiber. This is done by breaking up
the hydrogen bonds between the polymer chains. This result in a more swollen

50
macrostructures and thus the dye molecules is able to get to the other dyes site available
in the fiber. Therefore the dye removal kinetic does not only depend on the concentration
of attached quaternary groups, but also on the number of dye sites available. It is also
controlled by the number of dye site exposed to the dye molecular configuration inside
the wall of the pores or the channels. The process of dye removal for quaternized
cellulose can be completed within seconds when the concentration of the dye solution is
less than 220 mg/L. The process of dye absorption fits the Langmuir model extremely
well for S1 and S7 since the adsorption isotherm data according to Langmuir equation
gave a linear plot over the whole concentration range. Thus the homogeneous monolayer
adsorption process is significantly controlled by the dye bonding sites on the surfaces of
the fibers and the surfaces on the walls of pores and channels inside fibers. The
quaternized cellulose of higher nitrogen contents presents the higher saturation value of
the dye. The saturation value of quaternized cellulose is more than 10 times higher than
that of activated carbon. The quaternized cellulose fibers are shown to have an extremely
high affinity for dye adsorption. These results show that the quaternized cellulose
possesses very high capacity of dye adsorption in treating the textile dye wastewater.

51
2.5 References
Annual Book of ASTM Standards. Standard Test Method for Water Retention of Fibers (Centrifuge Method, D2402-94. 07.01), 1998; pp618-621. Annual Book of ASTM Standards. Standard Terminology Relating to Moisture in Textiles, (D4920-96b. 07.02), 1998; pp 619-621. Fernando, M. S; Grant, A. D. Water Res. 2003, 37(15), 3590-3601.
Garg, V. K.; Gupta, Renuka; B. Y. and Kumar, R. Bioresource Tech. 2003, 89(2), 121-124. Gholami, M.; Nasseri, S.; Alizadehfard, M.R.; Mesdaghinia, A. Water Quality Res. J. Can. 2003, 38(2), 379-391. Hall, D.M. US Patent 5,489,313, 1996.
Ho, Y. S.; McKay G. Process Safety Environ. Protect 1998, 76, 313-318. Khatri, S. D.; Dingh M. K. Water Air Soil Pollut. 2000, 114, 423-438.
Martin, M. J.; Artola, A.; Balaguer, M. D.; Rigola M. Chem. Eng. J. 2003, 94, 231–239
McKay, G.; Porter, J. F.; Prasad, G. R. Water Air Soil Pollut. 1999, 114, 423-438.
Michielsen, S.; Bottomley, L.; Stojiljkovic, I.; Thompson, K.; Montgomery, C.; Bozja, J. National Textile Center Annual Report M01-GT01; Willington, DE, November, 2002. Montgomery, J. Water treatment principles and design; J. Wiley and Sons: New York, 1985. Rattee, I. D.; Breuer M. M. The physical chemistry of dye adsorption; Academic: London and New York, 1974; p86-91. Rollins, C. K. Master of Science thesis, Auburn University, 1997.
Sakkayawong, N.; Thiravetyan, P.; Nakbanpote, W. Advances in Chitin Sci. 2002, 5, 568-575. Sanghi, R.; Bhattacharya, B. Water Quality Res. J. Can. 2003, 38(3), 553-562.
Weber, W. Physicochemical processes for water quality control; J. Wiley and Sons: New
York, 1972.
Zissi, L. S.; Kornaros, U.; Lyberatos, G. Chem. Eng. Commun. 2003, 190(5-8), 645-661.

52
CHAPTER 3
THE CHARACTERIZATION OF THE SURFACETHERMODYNAMICS OF
QUATERNIZED CELLULOSE FIBER BY INVERSE GAS CHROMATOGRAPHY
3.1 Introduction
Cellulosic materials, as an ionic exchange precursor, are particularly attractive
because cellulose is the richest resource of naturally occurring polymers on the earth. The
chemical structure, composition, and surpermolecular structures of cellulose determine its
chemical and physical properties. The surface properties of cellulose or chemically
modified cellulose used as an ionic exchanger are extremely important. Inverse gas
chromatography (IGC) as a very useful tool has frequently been applied for the evaluation
of surface characteristics of cellulose and modified cellulose (Gurnagul and Gray, 1985;
Felix and Gatenholm, 1993; Belgacem et al., 1996; Tshabalala, 1997; Papirer et al., 2000;
Santos et al., 2001; Voelkel, 2004). It has become an accurate, reliable and rapid method
for the physicochemical characterization of polymers and their blends, fibers, and other
surfaces or surfactants.
The surface energetics and acid-base characteristics of cellulose were investigated
according to Gutmann’s electron acceptor-donor approach (Felix and Gatenholm, 1993;
Shen and Parker, 2000). This method is a powerful tool to evaluate the filtration properties
of nonwoven fabrics because the filtration is related to the physicochemical phenomenon
on the surfaces of the fibers.
The work described in the previous chapter and the most of the researches on
quaternized cellulose have been done on a lab scale and none of these studies provide
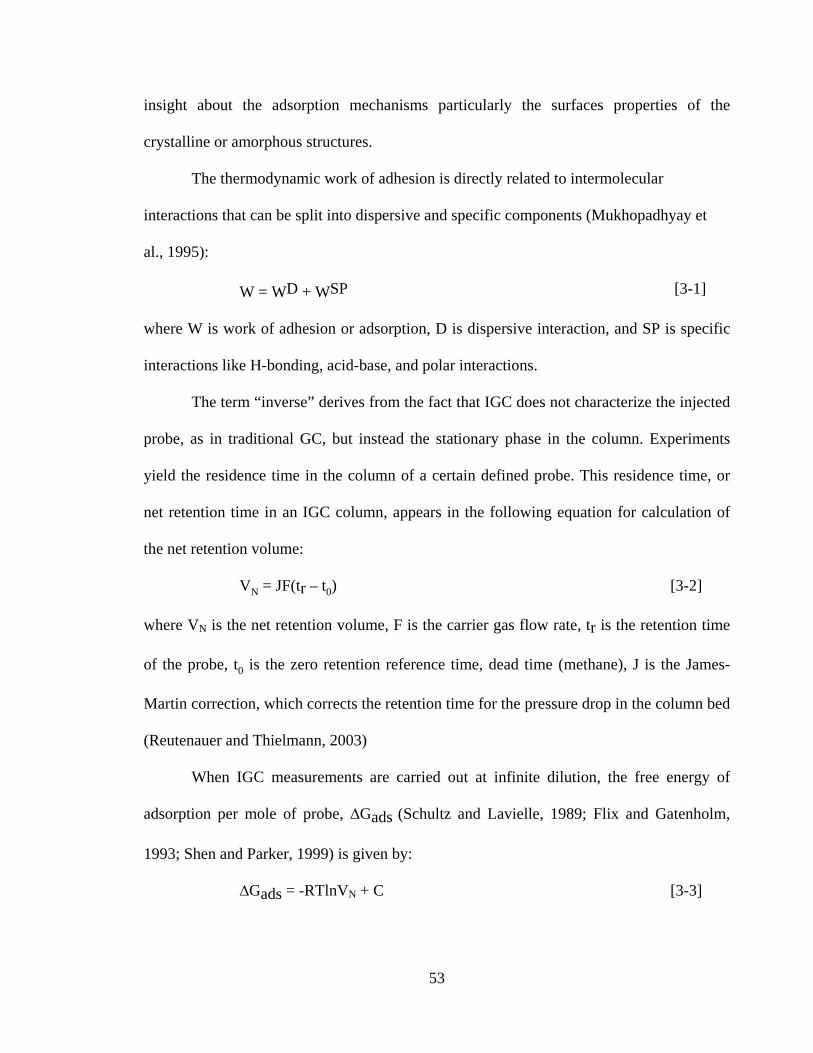
53
insight about the adsorption mechanisms particularly the surfaces properties of the
crystalline or amorphous structures.
The thermodynamic work of adhesion is directly related to intermolecular
interactions that can be split into dispersive and specific components (Mukhopadhyay et
al., 1995):
W = WD + WSP [3-1]
where W is work of adhesion or adsorption, D is dispersive interaction, and SP is specific
interactions like H-bonding, acid-base, and polar interactions.
The term “inverse” derives from the fact that IGC does not characterize the injected
probe, as in traditional GC, but instead the stationary phase in the column. Experiments
yield the residence time in the column of a certain defined probe. This residence time, or
net retention time in an IGC column, appears in the following equation for calculation of
the net retention volume:
VN = JF(tr – t0) [3-2]
where VN is the net retention volume, F is the carrier gas flow rate, tr is the retention time
of the probe, t0 is the zero retention reference time, dead time (methane), J is the James-
Martin correction, which corrects the retention time for the pressure drop in the column bed
(Reutenauer and Thielmann, 2003)
When IGC measurements are carried out at infinite dilution, the free energy of
adsorption per mole of probe, ∆Gads (Schultz and Lavielle, 1989; Flix and Gatenholm,
1993; Shen and Parker, 1999) is given by:
∆Gads = -RTlnVN + C [3-3]
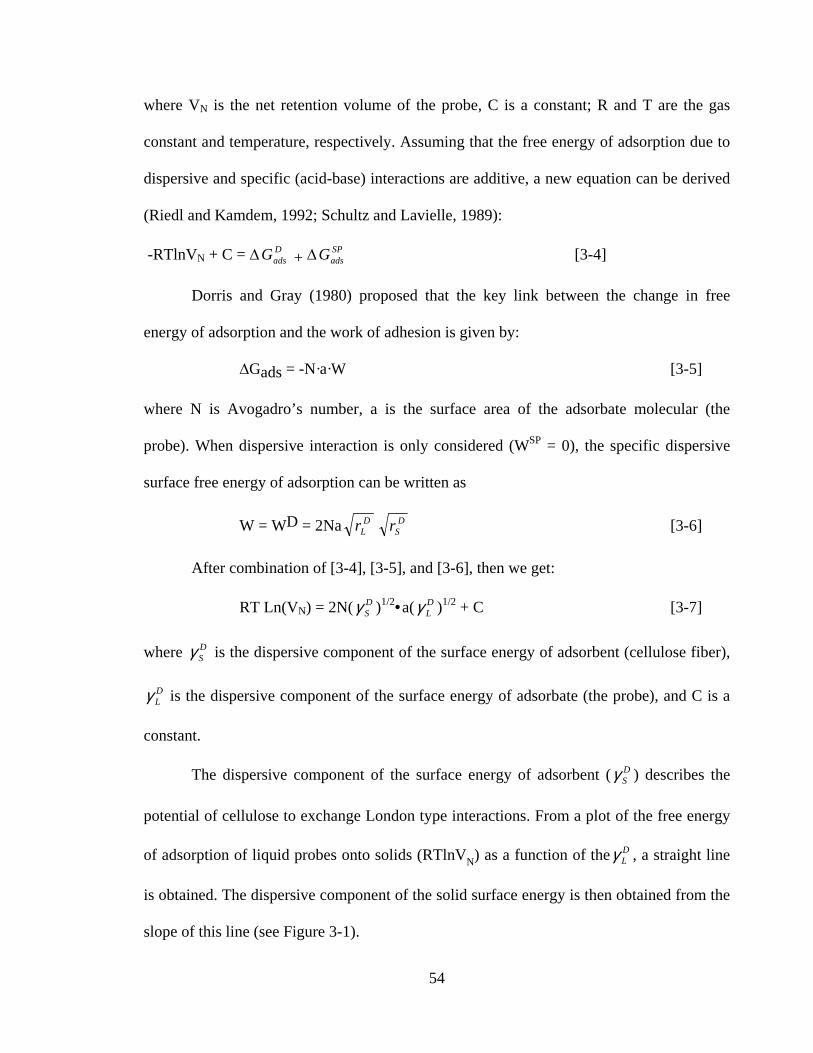
54
where VN is the net retention volume of the probe, C is a constant; R and T are the gas
constant and temperature, respectively. Assuming that the free energy of adsorption due to
dispersive and specific (acid-base) interactions are additive, a new equation can be derived
(Riedl and Kamdem, 1992; Schultz and Lavielle, 1989):
-RTlnVN + C = ∆ DadsG + ∆
SPadsG [3-4]
Dorris and Gray (1980) proposed that the key link between the change in free
energy of adsorption and the work of adhesion is given by:
∆Gads = -N·a·W [3-5]
where N is Avogadro’s number, a is the surface area of the adsorbate molecular (the
probe). When dispersive interaction is only considered (WSP = 0), the specific dispersive
surface free energy of adsorption can be written as
W = WD = 2Na DLr
DSr [3-6]
After combination of [3-4], [3-5], and [3-6], then we get:
RT Ln(VN) = 2N( DSγ )1/2•a( D
Lγ )1/2 + C [3-7]
where DSγ is the dispersive component of the surface energy of adsorbent (cellulose fiber),
DLγ is the dispersive component of the surface energy of adsorbate (the probe), and C is a
constant.
The dispersive component of the surface energy of adsorbent ( DSγ ) describes the
potential of cellulose to exchange London type interactions. From a plot of the free energy
of adsorption of liquid probes onto solids (RTlnVN) as a function of theDLγ , a straight line
is obtained. The dispersive component of the solid surface energy is then obtained from the
slope of this line (see Figure 3-1).
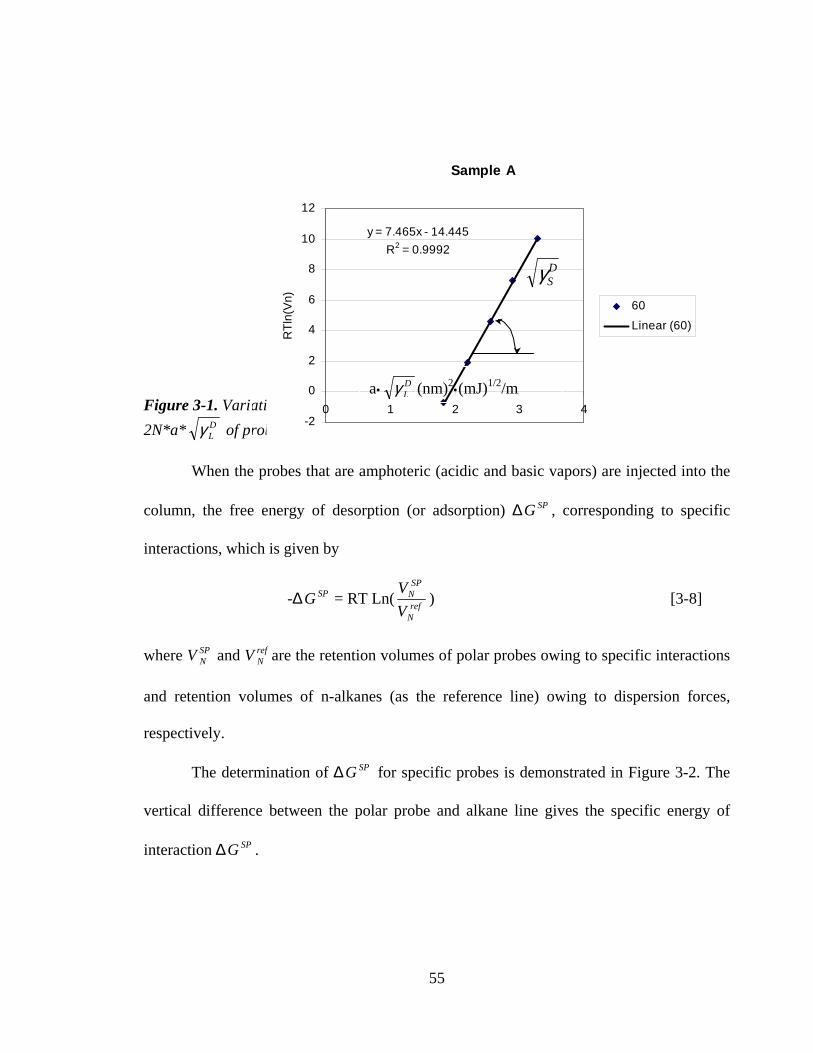
55
Figure 3-1. Variation of the logarithm of the net retention volume of n-alkanes versus
2N*a* DLγ of probes.
When the probes that are amphoteric (acidic and basic vapors) are injected into the
column, the free energy of desorption (or adsorption) ∆ SPG , corresponding to specific
interactions, which is given by
-∆ SPG = RT Ln(ref
N
SPN
V
V) [3-8]
where VSPN and V ref
N are the retention volumes of polar probes owing to specific interactions
and retention volumes of n-alkanes (as the reference line) owing to dispersion forces,
respectively.
The determination of ∆ SPG for specific probes is demonstrated in Figure 3-2. The
vertical difference between the polar probe and alkane line gives the specific energy of
interaction ∆ SPG .
Sample A
y = 7.465x - 14.445
R2 = 0.9992
-2
0
2
4
6
8
10
12
0 1 2 3 4
RT
ln(V
n)
60
Linear (60)
DSγ
a•DLγ (nm)2•(mJ)1/2/m

56
Figure 3-2. Representation of IGC data used for the determination of ∆Gsp for the specific probes.
In the same way, the calculation of the free enthalpy of desorption or adsorption,
∆ SPH , corresponding to specific interaction is given by
∆ SPG = ∆ SPH - T∆ SPS [3-9]
∆ SPH and ∆ SPS are determined as the slope and intercept of the plot of -
∆Gsp/T versus 1/T respectively (see Figure 3-3).
From the values of ∆Hsp, and from the AN and DN values of some specific
adsorbates, the acceptor and donor constants, KA and KD for the adsorbent can be obtained
using the expression (Shultz and Lavielle, 1989):
∆ SPH = KA • DN + KD • AN [3-10]
where DN and AN are the donor and acceptor numbers, respectively, of the acid-base prob.
AN and DN numbers for the probes were determined experimentally by NMR (Gutmann,
1978). The quantity of ∆ SPH /AN is linearly depended on DN/AN and thus KA is obtained
from the plot as the slope, while KD is obtained as the intercept.
Sample A
y = 7.465x - 14.445
R2 = 0.9992
-2
0
2
4
6
8
10
12
0 1 2 3 4
a¬¬¬¬1/2(nm2mJ1/2/m)
RTl
n(V N
) (kJ
/mol
)
60
Series2
Linear (60)
THF Acetone
CHCL3
-∆GSP = RT Ln(ref
N
SPN
V
V)

57
Figure 3-3. Representation of IGC data used for the determination of ∆Hsp for specific probes.
Figure 3-4. Plot of ∆Hsp/AN as a function of DN/AN allowing the determination of the acceptor constant KA and the donor constant KD.
3.2 Experimental
Sample A
y = 24.516x - 56.371R2 = 0.996
y = 23.434x - 46.905R2 = 0.9543
y = 7.8307x - 19.162R2 = 0.6591
0
5
10
15
20
25
30
2.8 2.9 3 3.1 3.2 3.31000/T (1/K)
ΠΓΠΓ ΠΓΠΓG
/T (
J/m
ol K
)
acetone
chloroform
thf
Sample A
y = 0.93x + 0.6959
R2 = 0.9941
0
0.5
1
1.5
2
2.5
3
3.5
0 0.5 1 1.5 2 2.5 3
DN/AN
H
/AN

58
3.2.1 Materials
Cellulose fiber: In all experiments, a bleached sulfite pulp obtained from East Texas
Pulp and Paper Company is used.
Adsorbates: Adsorbates representing vapors with only dispersion-force interaction
capabilities were n-pentane (n-C5), n-hexane (n-C6), n-heptane (n-C7), n-octane (n-C8),
and n-nonane (n-C9). Chloroform (CHCl3), acetone, and tetrahydrofuran (THF)
represented acidic, basic, and amphoteric vapors capable of interacting specifically. All
adsorbates were of analytical grade and were used as received.
Table 3-1. Characteristics of IGC probes used in experiment (Shen and parker, 1999; Coupas et al., 1998).
Probe molecule
A (Å)2
DLγ (mJ/ m2)
AN
DN
(kcal/mol)
Specific
characteristic
C5H12 45.55 16.1 0 0 neutral
C6H14 51.5 18.4 0 0 neutral
C7H16 57.0 20.3 0 0 neutral
C8H18 62.8 21.3 0 0 neutral
C9H20 68.9 22.7 0 0 neutral
Acetone 42.5 16.5 17 12.5 amphoteric
CHCl3 45.0 25.9 23.1 0 acidic
THF 45 19.2 8 20 basic
The characteristics of adsorbates are listed in Table 3-1. The A stands for the
molecular surface area of the probes.
3.2.2 Methods

59
3.2.2.1Fiber treatments:
The following samples were prepared in order to compare the surface properties of
fibers before, and after quaternization:
A – sample swelled in water 24 hours
B - mercerized sample for 24 hours
D - the sample B quaternized for 24 hours
All of samples were freeze dried, ground to passe #40 mesh and then dried under
vacuum at 45 oC for 12 hours before packing into a column.
3.2.2.2 Inverse gas chromatography:
A 0.5 m long stainless steel column of 0.635 cm o.d. was used. Between 1.98 g and
2.65 g of freeze-dried and ground cellulose was carefully packed into the column using a
handy massager.
Measurements performed on a HP 5790A Gas Chromatograph equipped with a
flame ioniztion detector. Helium at 15 ml/min was used as the carrier gas. Methane was
used as an inert marker for the dead volume of the column. To assure conditions near zero
coverage and no interactions between the injected probes and the cellulose, very small
quantities (0.5 µml) of probe vapor were injected. Injections were made from 1 microliter
Hamilton syringes, and each injection was repeated several times, showing that the elution
peaks were reproducible. The measurements were performed at five different temperatures
in the range 40 – 80 oC.
3.2.2.3 Moisture regains:

60
The freeze-dried samples were kept in a vacuum oven at 45 oC for 12 hours and
then samples conditioned at 65% RH and 20 oC for 24 hours. Moisture regain was
determined by
M.R. = dry
drywet
W
WW − % [3-10]
Where Wdry and Wwet are the weight of samples before and after the samples were put into
a conditioned room respectively.
The accessibility of a cellulose sample is derived assuming the maximum moisture
regain (MR) for completely accessible cellulose at 65% relative humidity is 17.0% (Jeffries
et al., 1968)
% Accessibility (AH2O vap) = 100MR/17.0 [3-11]
3.2.2.4 Crystallinity:
X-ray data were obtained in reflection mode by a Rigaku RU-200 BH with Ni-
filtered Cu-Kα radiation (λ = 1.54 Å) generated at 40 kV and 40 mA. The scanning was
performed through 2θ = 10o to 40o and the scanning speed was 2 degree/min at 0.05
sampling interval. The crystallinity index (CrI) was calculated as
CrI = 002
002
I
II am− [3-12]
Where I002 is the overall intensity of the peak at 2θ about 22o and Iam is the intensity of the
baseline at 2θ about 13o and 18o for mercerized and normal cellulose fiber respectively
(Segal et al., 1959).
The other way to measure crystallinity is carried out using a Perkin Elmer System
2000 FT-IR. Freeze-dried cellulose powder (1.5 mg) and KBr (200 mg) were homogenized
using a vibrator mixture for 30 second and thereafter pressed into an almost transparent

61
tablet at 167 MPa for 5 minutes. The pellets were analyzed in the absorbance mode with a
resolution of 2 cm-1 in the range 4000 – 370 cm-1. The total crystallinity index (TCI) is
calculated by (Colom and Carrillo, 2002):
TCI = 2902
1376
a
a [3-13]
Where 1376a and 2902a are the adsorption bands at 1376 and 2902 cm-1 respectively.
3.2.2.5 Analysis of Chemical Constitution:
The results were obtained by Perkin Elmer System 2000 FT-IR. The spectra were
compared before and after quaternization. The sample preparation and test conditions were
the same as mentioned above.
3.2.2.6 Scanning Electron Microscopy (SEM):
A Zeiss DSM 940 SEM made in Germany was used for observation of surface
characteristics. The images of each sample were obtained at 500 and 2000 magnification.
The samples of each freeze-dried cellulose fiber were mounted onto double-sided adhesive
tape over aluminum stubs and sputtered with gold under vacuum prior to the observation.
3.3 Results and Discussion
The dispersive interactions between non-polar probes and tested polymers are
discussed first. The net retention times of n-alkanes at different temperature fit an
exponential curve (see Figure 3-5, Figure 3-6 and Figure 3-7).
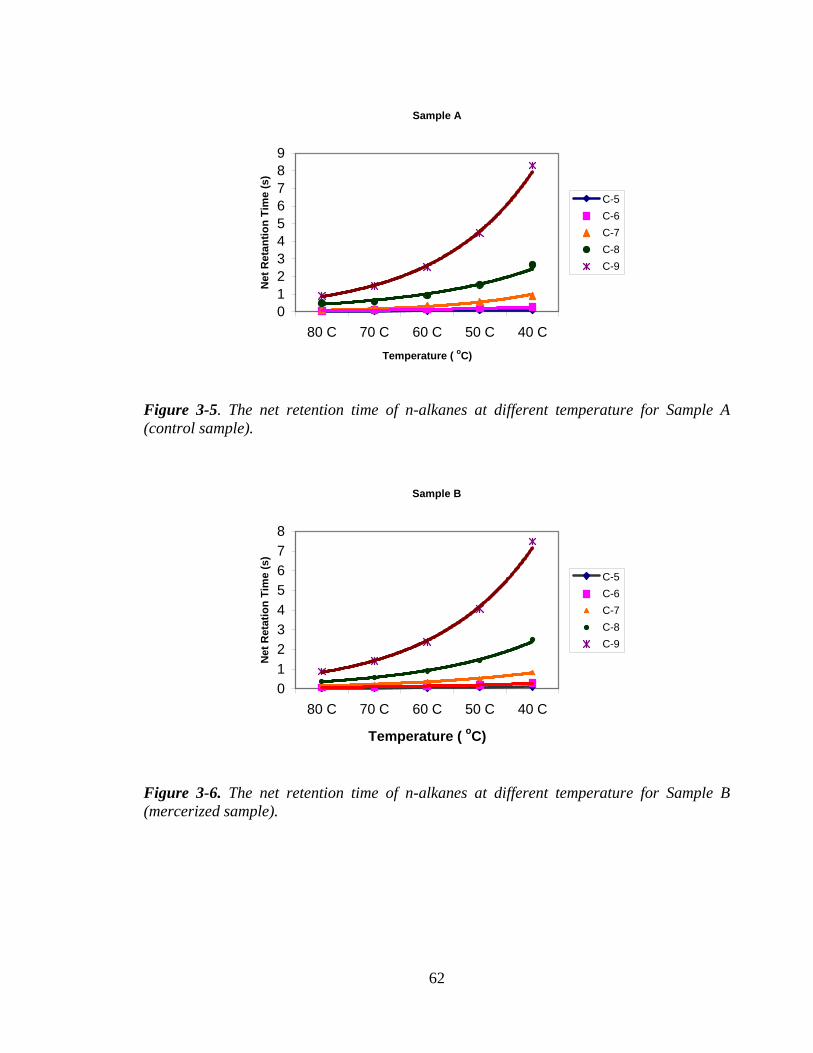
62
Sample A
0123456789
80 C 70 C 60 C 50 C 40 C
Temperature ( oC)
Net
Ret
anti
on
Tim
e (s
)
C-5
C-6
C-7
C-8
C-9
Figure 3-5. The net retention time of n-alkanes at different temperature for Sample A (control sample).
Sample B
012345678
80 C 70 C 60 C 50 C 40 C
Temperature ( oC)
Net
Ret
atio
n T
ime
(s)
C-5
C-6
C-7
C-8
C-9
Figure 3-6. The net retention time of n-alkanes at different temperature for Sample B (mercerized sample).

63
Sample D
0
0.5
1
1.5
2
2.5
3
80 C 70 C 60 C 50 C 40 C
Temperature ( oC)
Net
Ret
anti
on
Tim
e (s
)
C-5
C-6
C-7
C-8
C-9
Figure 3-7. The net retention time of n-alkanes at different temperature for Sample D (quaternized sample).
The net retention time may reflect the interaction such as London force or
dispersive force between n-alkanes and tested polymer powders. It seems that materials
with a smaller surface area of a probe are less sensitive to temperature changes; on the
contrary, samples with higher surface area of a probe are more sensitive to temperature. For
examples, the net retention times of n-pentane for sample A, sample B, and sample D are
recorded over the temperature from 40 – 80 oC. The net retention times of n- nonane was A
> B > D over the temperature from 40 – 80 oC:. From the data of the net retention time, we
can establish the relationship between the surface energy of tested polymer powder and the
surface energy of probes using equation [3-7] and equation [3-8]. Furthermore, the
dispersive components of surface energy can be obtained by the slope of the plot shown in
Figure 3-1. The dispersive components of surface energy ( DSγ ) of samples A, B, and D
obey a liner relationship over 40 – 80 oC and also follow the order: A > B > D (see
Figure3-8).

64
y = -0.3435x + 73.124
R2 = 0.9841y = -0.456x + 69.294
R2 = 0.9901
y = -0.4108x + 82.178
R2 = 0.8859
30
35
40
45
50
55
60
65
70
40 50 60 70 80
Temperature (oC)
Dis
per
sive
Co
mp
on
ent
of
Ser
face
E
ner
gy
(mJ/
m2 )
A
B
D
Figure 3-8. The values of DSγ versus the temperature.
The non-polar probes interact with a surface or an interface of polymers through
intermolecular forces: a dispersion force, and induced dipole-dipole force. Sample A and B
interact with non-polar probes through the dispersion force. Sample D interact with the
probes through two forces because the quaternization introduces an ammonium salt that
brings positive charges onto polymer chains. Those interactions can be very strong
depending on the topological properties of the fibers. The topological properties include the
surface areas of fiber and the surface areas of amorphous regions in the fiber.
The explanation of the phenomenon mentioned above can attribute to the
supermolecular structure of cellulose fiber. The cellulose fibers consist of elementary
fibrils, containing a succession of crystallites and intermediate less-ordered amorphous
regions. The crystallites (A) are characterized by their size and their orientation. Less-
ordered amorphous regions (B) connect successive crystallites length-wise; they are
characterized by their size, density, and orientation. Regions containing laterally bonded
molecules (C) connect to laterally adjacent amorphous regions. Cluster formations (D) are

65
regions where crystallites are fused to large aggregates and region (E) represents the voids
(Figure 3-9) (Stana-Kleinschek et al., 2001). The amorphous regions and inner surface area
of voids are decisive factors with regard to accessibility, reactivity and adsorption
properties of fibers.
Figure 3-9. Fine structure of cellulose fibers—schematically: A, crystallites; B, amorphous regions; C, interfibrillar tie molecules; D, cluster formation; E, void (Stana-Kleinschek et al., 2001).
Thus it is extremely important to explore the supermolecular structures of cellulose
fibers before and after quaternization. The crystallinity as determined by X-ray and FT-IR
is listed in Table 3-2.
Table 3-2. The X-ray crystallinity index (CrI), FT-IR total crystallinity index (TCI), moisture regain (MR), and accessibility of the samples
Sample X-Ray CrI TCI Moisture Regain (%)
Accessibility (%)
A 0.43 0.73 8.58 50.49
B 0.59 0.78 6.99 41.10
D 0.72 0.84 10.61 62.40
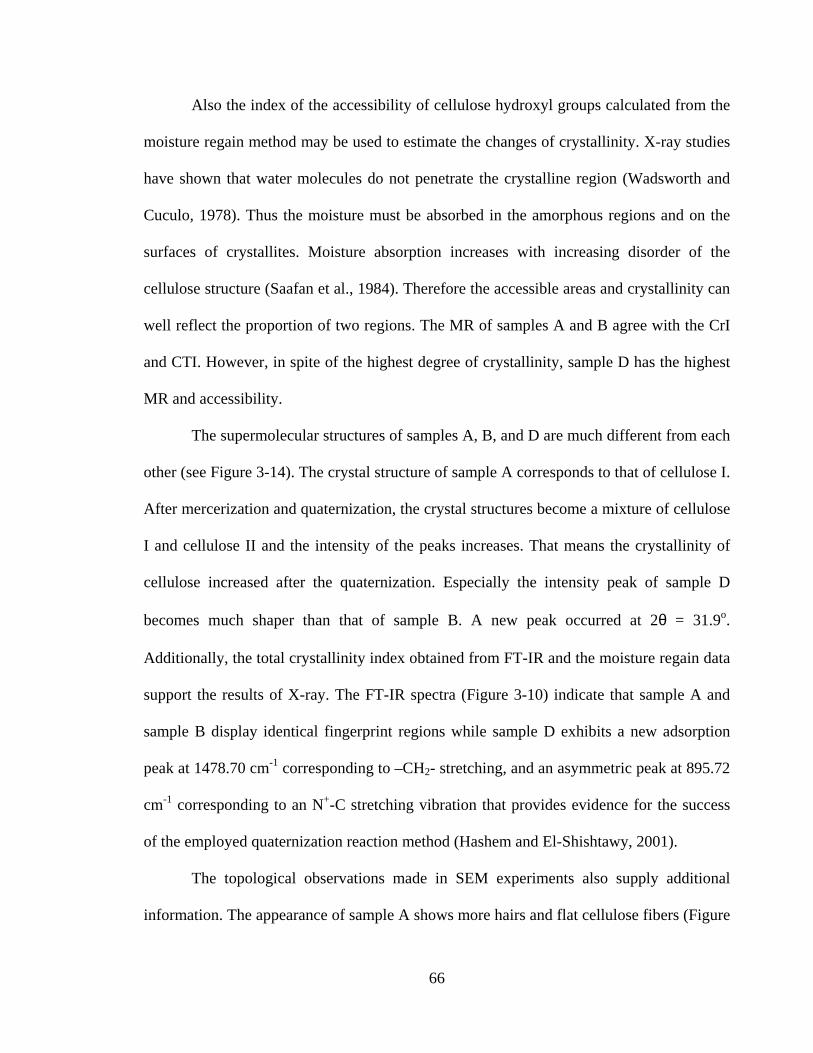
66
Also the index of the accessibility of cellulose hydroxyl groups calculated from the
moisture regain method may be used to estimate the changes of crystallinity. X-ray studies
have shown that water molecules do not penetrate the crystalline region (Wadsworth and
Cuculo, 1978). Thus the moisture must be absorbed in the amorphous regions and on the
surfaces of crystallites. Moisture absorption increases with increasing disorder of the
cellulose structure (Saafan et al., 1984). Therefore the accessible areas and crystallinity can
well reflect the proportion of two regions. The MR of samples A and B agree with the CrI
and CTI. However, in spite of the highest degree of crystallinity, sample D has the highest
MR and accessibility.
The supermolecular structures of samples A, B, and D are much different from each
other (see Figure 3-14). The crystal structure of sample A corresponds to that of cellulose I.
After mercerization and quaternization, the crystal structures become a mixture of cellulose
I and cellulose II and the intensity of the peaks increases. That means the crystallinity of
cellulose increased after the quaternization. Especially the intensity peak of sample D
becomes much shaper than that of sample B. A new peak occurred at 2θ = 31.9o.
Additionally, the total crystallinity index obtained from FT-IR and the moisture regain data
support the results of X-ray. The FT-IR spectra (Figure 3-10) indicate that sample A and
sample B display identical fingerprint regions while sample D exhibits a new adsorption
peak at 1478.70 cm-1 corresponding to –CH2- stretching, and an asymmetric peak at 895.72
cm-1 corresponding to an N+-C stretching vibration that provides evidence for the success
of the employed quaternization reaction method (Hashem and El-Shishtawy, 2001).
The topological observations made in SEM experiments also supply additional
information. The appearance of sample A shows more hairs and flat cellulose fibers (Figure

67
3-11 ) compared with sample B that the appearance becomes round and has more groves on
the surface of the fibers (Figure 3-12 ).
Figure 3-10. FT-IR spectra for sample A, sample B, and sample D.
As Table 1-1 indicates that wood pulp contains 40-47% cellulose and 25-35%
hemicellulose (Hon, 1996), the hemicellulose can be dissolved in concentrated alkaline
solution during the mercerization. The groves that are the evidence of recrystalization and
the loss of hemicellulose during mercerization result in increased crystallinity. After
quaternization, more deep groves and holes are observed (Figure 3-13). Because
quaternization happened at the C-6 position of a cellulose-repeating unit, the quaternary
group attached at this position breaks up the intermolecular hydrogen bonding swells
cellulose or partially dissolves the cellulose within the amorphous areas in the aquatic
solution. The increasing crystallinity of sample D results from the new crystalline formed.
The X-ray diffraction signal provides the evidence of new crystals formed at 2θ = 31.9o.
The partially dissolved cellulose precipitated from the solution and the new crystals were
4000.0 3600 3200 2800 2400 2000 1800 1600 1400 1200 1000 800 600 370.0cm-1
%T
sample Asample Bsample D
3444.76
2892.061644.35
1376.31
1160.36
1065.34
895.35
670.43609.95
1309.511425.53
2368.272368.27
3391.54
2892.111644.42
1478.701419.10
1374.65
1316.041159.94
1063.09 895.72
611.28
2356.94
669.96
3369.22
2899.55
2359.75
1642.82
1430.371372.45
1319.31
1163.191059.97
897.19
559.99669.96
A
B
D

68
formed after the quaternized cellulose was washed with distilled water and dried. Cellulose
dissolved in solution mixtures of urea and lithium chloride also exhibits same peak at 2θ =
31.9o (Figure 3-14). This is the evidence that recrystallization of quaterinzed cellulose
occurs due to the dissolution or partial dissolution after precipitation.
The X-ray, FT-IR, and moisture regain data agree with the results of DSγ from
Figure 3- 8 for sample A and B. On the other hand, the X-ray and FT-IR data fit the results
of SDγ , but the moisture regain does not fit due to the change of chemical constituents after
quaternization shown above in Figure 3-10. Therefore, the properties of surface and the
adsorption behaviors have been totally changed. This change will be discussed below.
Figure 3-11. Topological observation of sample A. (a) ×500, (b) ×2000.
1 µm 1 µm

69
Figure 3-12. Topological observation of sample B. (a) ×500, (b) ×2000.
The enthalpy and the entropy of adsorption of the specific probes or polar probes
were calculated from the slope and intercept of -∆Gsp/T versus 1/T, respectively, according
to Equation [3-5] and Figure 3-3. The results of enthalpy and entropy of adsorption for
sample A, sample B and sample D are listed in Table 3-3.
Figure 3-13. Topological observation of sample D. (a) ×500, (b) ×2000.
1 µm 1 µm
1 µm 1 µm
1 µm
1 µm

70
0
1000
2000
3000
4000
5000
6000
10 15 20 25 30 35 40
2
Inte
sity A
B
D
Figure 3-14. X-ray diffraction curves.
In the view of thermodynamics, the greater the value of enthalpy, the greater is the
reaction or interaction intensity (Santos et al., 2001). Bearing in mind that chloroform
(CHCl3), acetone, and tetrahydrofuran (THF) represented acidic, basic, and amphoteric
vapors, these compounds are capable of interacting specifically: -∆HsP of THF is greater
than that of CHCl3 before quaternization for sample A and B while -∆H of THF is less than
that of CHCl3 after quaternization for sample D.
From the values of ∆Hsp and from the AN and DN values of the specific adsorbates,
the acceptor and donor constants, KA and KD for the adsorbents can be obtained using
equation [3-6] and Figure 3-4. The KA and KD constants of sample A, B and D are shown
in the Table 3-4. The KA constants are greater than the KD constants of samples A and B.
On the contrary, the KD constants are greater than the KA constants of sample D.
θ

71
Table 3-3. The enthalpy and the entropy of adsorption of the specific probes
-∆H (J/mol) ∆S (J/mol*K) Sample
Chloroform Acetone THF Chloroform Acetone THF
A 14.69 25.96 26.04 -39.20 -54.28 -60.83
B 3.99 24.45 19.5 -7.93 -50.89 -42.77
D 34.45 47.72 30.74 -105.31 -55.28 -94.09
Compared KA and KD before and after quaternization, the surface nature of
cellulose become more basic than acidic after quaternization. The attached quaternary
ammonium salt on the polymer back bone plays a critical role on the properties of surface
adsorption.
Table 3-4. Comparison of KA and K
D
Sample KA KD
A 0.93 0.66
B 0.8 0.41
D 0.97 1.23

72
3.4 Conclusions
1. The net retention time of neutral probes with large molecular size is more sensitive
to temperature while that of neutral probes with smaller molecular size is less sensitive to
temperature. The net retention time is correlated to the fraction of amorphous areas present
in the cellulose materials.
2. The dispersive components of surface energy derived from the net retention time
increase with increasing the amorphous areas. That is because the non-polar probes can
penetrate the amorphous areas of fibers.
3. The surface characteristics of cellulose become more basic than acidic after
quaternization in terms of KA and KD. Therefore the driving force of adsorption is the heat
of Lewis acid-base interaction.
3.5 References
Belgacem, M. N.; Blayo, A.; Gandini, A. J. Colloid Interface Sci. 1996,182, 431-436. Colom, X.; Carrillo, F. European Polym. J. 2002, 38, 2225- 2230. Coupas, A. C.; Gauthier, H.; Gauthier, R. Polym. Composites 1998, 19(3), 280-286.

73
Dorris, G. M.; Gray, D. G. J. Colloid Interface Sci. 1980, 77, 35. Felix, J. M.; Gatenholm, P. Nordic Pulp Paper Res. J. 1993, 1, 200-203. Fowkes, F. M. J. Adhesion Sci. Technol. 1987,1, 7 – 27. Gurnagul, N.; Gray, D. G. J. Pulp Paper Sci. 1985, 11(4), 98-101. Gutmann, V. The donor-acceptor approach to molecular interaction; Plenum: New York, 1978; p 204. Hashem, A.; El-Shishtawy, R. Adsorption Sci. Technol. 2001, 19(3), 197- 210. Hegedus, C. R.; I. L. Kamel. J. Coatings Technol. 1993, 65, 23-29. Hon, DN-S. in Chemical modification of lignocellulosic materials. Hon DN-S, Ed.; Marcel Dekker: New York, Basel, Hong Kong, 1996; p114. Jeffries, R.; Roberts, J. G.; Robinson, R. M. Text. Res. J. 1968, 38, 234-224.
Laszlo, J. A.; Dintzis, F. R. J. Appl. Polym. Sci. 1994, 52, 531-538. Laszlo, J. A. Am. Dyest. Rep. 1994, 83(3), 17-21. Laszlo, J. A. Text. Chem. Colori. 1996, 28(5), 13-17. McClain, M. A.; Wang, W. J.; Hall, D. Journal of Environmental Monitoring and Restoration, proceeding, Georgia, 2003. Mukhopadhyay, P.; Schreiber, H. P. Colloid Surf. A: Physicochem. Eng. Aspects 1995, 100, 47. Papirer, E.; Brendle, E.; Balard, H.; Vergelati, C. J. Adhes. Sci. Technol. 2000, 14(3), 321-337. Reidl, B.; Kamdem, P. D. J. Adhes. Sci. Technol. 1992, 6, 1053. Reutenauer, S.; Thielmann, F. J. Mat. Sci. 2003, 38, 2205-2208.
Saafan, A. A.; Kandil, S. H.; Habib, A. M. Text. Res. Insti. 1984, 863 – 867. Santos, J. M. R. C. A.; Gil, M. H.; Portugal, A.; Guthrie, J. T. Cellulose 2001, 8, 217-224. Schultz, J. and Lavielle, J. in Inverse Gas Chromatography; Lioyd, D. R.; Ward, T. C.; Schreiber, H. P. Eds; ACS Symposium Series, 391. Am. Chem. Soc., Washington DC, 1989; pp. 185.

74
Shi, W.; Xu, X.; Sun, G. J. Appl. Polym. Sci. 1999, 71, 1841-1850. Schultz, J. L.; Lavielle; C. Martin. J. Adhes. 1987, 23, 45 – 60. Shen, W.; Parker, I. H. Cellulose 1999, 6, 41-55. Simkovic, I.; Mlynar; J.; Alfoldi, J. Carbohydr. Polym. 1992, 17, 285-288. Simkovic, I.; Laszlo, J. A. J. Appl. Polym. Sci. 1997, 64, 2561-2566. Stana-Kleinschek, K.; Kreze, T.; Ribitsch, V.; Strnad, S. Colloid Surf. A: Physicochem. Eng. Aspects 2001, 195(1-3), 275-284. Tshabalala, M. A. J. Appl. Polym. Sci. 1997, 65, 1013-1020. Tze, W. T., Gardner D. J. J. Adhes. Sci. Technol. 2001, 15(2), 223-341. Voelkel, A. Chemometrics and Intelligent Lab. Syst. 2004, 72, 205-207. Wadsworth, L. C.; Cuculo, J. A. In Modified Cellulose, Rowell Ed.; Academic Press, Inc.: New York, 1978; pp117-146.

75
CHAPTER 4
STUDY ON THE CORRELATION BETWEEN THE SURFACE
CHARACTERISTICS AND ADSORPTION CAPABILITY OF QUATERNIZED
CELLULOSE FIBER
4.1 Introduction
Very high dye adsorption capability of quaternized cellulose has been
demonstrated in Chapter 2. Much less is known about the correlation between the surface
characteristics and the adsorption capabilities of quaternizaed cellulose fiber. Therefore, it
is very important to understand the driving force for the interactions between the dye
molecule and the polymer adsorbent.
According to modern chemistry, a Lewis base is any substance that has electron
density that can be shared with another substance in a chemical reaction, and a Lewis acid
is any substance capable of accepting electron density from a Lewis base. The Lewis acid-
base concept and its more modern generalizations give a comprehensive description of a
large class of interactions between organic molecules. This concept has been successfully
applied to predict solubility, solvent effects on chemical reactions and many other
solvation phenomena. The acid-base concept was also introduced in the theory of
adhesion. The results showed that basic polymers interact strongly with acidic surfaces
and vice-versa, giving rise to high adhesion strength.

76
Fowkes (1987) discussed the role of acid-base interactions in term of contact force.
All polymers except saturated hydrocarbons have acidic or basic sites according to the
modern Lewis acid-base theory. Electrons of oxygen, nitrogen, sulfur and similar
elements, as well as π-electrons of polystyrene and other polymers containing aromatic
groups are basic sites (electron donors, following the Lewis theory). On the other hand,
halogenated hydrocarbons, nitro groups and, in general, all electrophilic sites are electron
acceptor; and thus are Lewis acids. The acid-base interaction between polymers and their
surroundings (other polymers, solvents, plastizer, filler, etc.) control the strength of the
contact interaction, whose enthalpy can be described by the four-constant Drago’s
equation (Drago, 1994; Mukhopadhyay and Schreiber, 1995):
-∆Hab = CaCb + EaEb [4-1]
where the E terms relate to the electrostatic contributions, the C terms involve covalent
contributions to the overall acid-base interactions, and the subscripts a and b denote acid
and base. The two constants for the base (subscript b) and two (subscript a) for the acid
emphasize that the strength of the acid-base interaction depends not only the ability to
donate or accept electrons but also on the polarizability. As Fowkes points out, hydrogen
bonding can be considered a subset of acid-base interactions, since its enthalpy can be
accurately described by the Drago equation [4-1]. Energy contributions that vary with the
strength of the donor-acceptor interaction will be incorporated into the E and/or C
parameters obtained from fitting the experimental data (Drago, 1994).
In this chapter, the interactions between the surfaces of the quaternized cellulose
fibers and dyes are predicted by acid-base parameters obtained from inverse gas
chromatography (IGC). A correlation between the acid-basic characteristics and
adsorption capability of quaternized cellulose fiber has been established by IGC.

77
4.2 Experimental
4.2.1 Materials
Samples A, B and D are described in Chapter 3 and the bleached wood pulp for
beating experiments was supplied by the Chemical Engineering Department of Auburn
University. The adsorbates for IGC are the same as used in Chapter 3.
The dye for adsorption experiments, Acid Blue (C.I. 42755; FW 737.71), was
purchased from Acros Organics and was dried in a vacuum oven at 45 oC for 24 hours.
Then the dried dye was stored in a desiccator.
4.2.2 Methods
4.2.2.1 Fiber Treatments
The bleached wood pulp was blended for 5 minutes in a certain amount of distilled
water. The blended wood pulp was used as an unbeaten fiber (sample 0). Then the blended
wood pulp was beaten using VOITH Beater at 10 and 50 minutes (samples 10 and 50).
4.2.2.2 Measurements of Freeness
The freeness of pulp is designed to give a measure of the rate at which a dilute
suspension of pulp (3g of pulp in 1 L of water) may be drained (according to TAPPI T227
om-92). Since the measurement was carried out in solution at 30 oC, we have to correct
the number to 20 oC using the chart of freeness corrections.
4.2.2.3 Quaternization of Beaten Fibers
In order to study the surface increase after beating, samples 0 and 50 were reacted
with quaternary ammonium under the same conditions (Method A mentioned in Chapter
2) for 1 hour, resulting in samples 0-N and 50-N respectively. Another sample, 50-N-30H,
was reacted with quaternary ammonium for 30 hours under the same reaction conditions
previously used.

78
4.2.2.4 Nitrogen Analysis
The samples were freeze dried for 24 hours and then dried at 45oC under vacuum
in a vacuum oven for another 12 hours. The nitrogen contents were determined using a
LECO CN-2000 instrument at 1050oC. The analysis was performed at the Soil Test Lab of
Auburn University.
4.2.2.5 Analysis of Chemical Constitution
The data were obtained from Perkin Elmer System 2000 FT-IR and spectra were
compared before and after quaternization. Sample preparation and test conditions were the
same as mentioned in Chapter 2.
4.2.2.6 Scanning Electron Microscopy (SEM)
Sample preparation and instrumentation are the same as described in Chapter 2.
4.2.2.7 Kinetic Dye Adsorption
Quaternized cellulose fibers (400 mg dried fiber) were placed into 200 mL of dye
solution containing 1.6 g/L of Acid Blue 22 (C.I. 42755) at room temperature with vigorous
stirring. The concentrations of the dye in the solution at specific time intervals (1 min, 5
min, 30 min, 1 hour, 8 hours, and up to 24 hours) were detected using a GeneSys 6
spectrophotometer (λmax = 559 nm). Then the saturation value, [S] was determined when
the curve is leveling off as the [D]s (mol/kg) versus time (hour) curve is plotted.
4.2.2.8 Adsorption isotherm
For the adsorption experiments, precisely weighed quaternized cellulose was
placed in 50 ml of solutions containing various dye concentrations. The equilibrium
isotherm was determined from experiments using ten flasks containing the same amount
of adsorbent, mixed with different concentration of dye. The liquor ratio is approximately
1:300, and the dye concentrations varied from 50 mg/L to 2.5 g/L of dye.
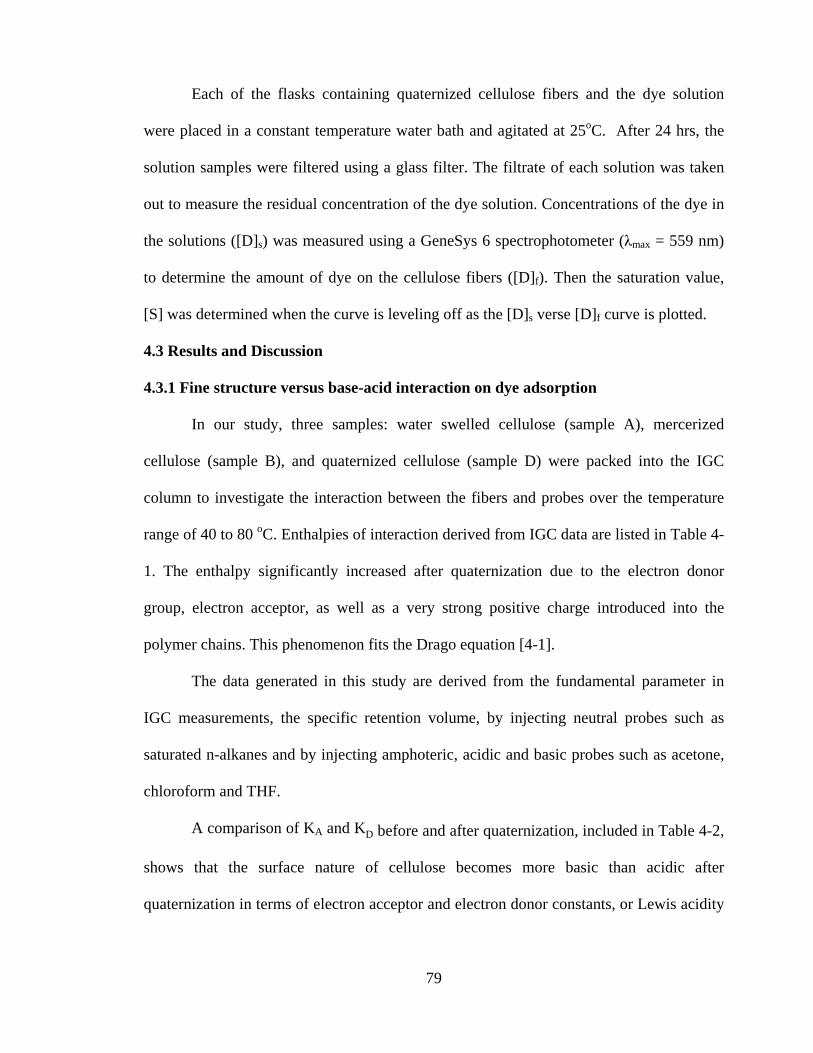
79
Each of the flasks containing quaternized cellulose fibers and the dye solution
were placed in a constant temperature water bath and agitated at 25oC. After 24 hrs, the
solution samples were filtered using a glass filter. The filtrate of each solution was taken
out to measure the residual concentration of the dye solution. Concentrations of the dye in
the solutions ([D]s) was measured using a GeneSys 6 spectrophotometer (λmax = 559 nm)
to determine the amount of dye on the cellulose fibers ([D]f). Then the saturation value,
[S] was determined when the curve is leveling off as the [D]s verse [D]f curve is plotted.
4.3 Results and Discussion
4.3.1 Fine structure versus base-acid interaction on dye adsorption
In our study, three samples: water swelled cellulose (sample A), mercerized
cellulose (sample B), and quaternized cellulose (sample D) were packed into the IGC
column to investigate the interaction between the fibers and probes over the temperature
range of 40 to 80 oC. Enthalpies of interaction derived from IGC data are listed in Table 4-
1. The enthalpy significantly increased after quaternization due to the electron donor
group, electron acceptor, as well as a very strong positive charge introduced into the
polymer chains. This phenomenon fits the Drago equation [4-1].
The data generated in this study are derived from the fundamental parameter in
IGC measurements, the specific retention volume, by injecting neutral probes such as
saturated n-alkanes and by injecting amphoteric, acidic and basic probes such as acetone,
chloroform and THF.
A comparison of KA and KD before and after quaternization, included in Table 4-2,
shows that the surface nature of cellulose becomes more basic than acidic after
quaternization in terms of electron acceptor and electron donor constants, or Lewis acidity

80
and Lewis bacicity constants. The changes of surface properties result from the changes of
chemical constituents revealed by FT-IR (see Figure 3-10).
Table 4-1. The enthalpy and the entropy of adsorption of the specific probes
0
0.1
0.2
0.3
0.4
0.5
0.6
0.7
0.8
0 0.017 0.083 0.5 1 8 18 21 24
Time (hour)
Ad
sorp
tio
n o
f D
ye o
n t
he
Fib
er
(mo
l/kg
) A
B
D
Figure 4-1. Kinetic dye adsorption.
Presented in Table 4-3 are data of dye adsorption capability obtained from Figure
4-1. These results show that the saturation value [S] of quaternized cellulose is much
higher than that of water swollen and mercerized cellulose. Also Table 4-3 shows that the
-∆H (kJ/mol)
∆S (J/mol*K)
Sample
Chloroform
Acetone
THF
Chloroform
Acetone
THF
A
14.69
25.96
26.04
-39.20
-54.28
-60.83
B
3.99
24.45
19.50
-7.926
-50.89
-42.77
D
34.45
47.72
30.74
-105.31
-55.28
-94.09

81
surpermolecular structures do not much affect the saturation values since the Samples A
and B have different crystallinity indices.
Table 4-2. Comparison of KA and K
D
Sample
Ka
Kd
R2
A
0.93
0.66
0.99
B
0.80
0.41
0.89
D
0.96
1.23
0.88
Table 4-3. Comparison of saturation values
Sample
[S] (mol/kg)
N%
A
0.23
0
B
0.14
0
D
0.71
1.5
In all, the high dye adsorption capability of quaternized cellulose mainly depends
on the acid-base interaction and the high polarity of the quaternary ammonium salt
introduced by the reaction, and the influence of the crystallinity, crystallite size and its
orientation on the adsorption character is less important (Kreze et al., 2002).
4.3.2 Surface areas verse base-acid interaction on dye adsorption
The surface area is very important for any kind of adsorptions, no mater which
kind of adsorption, either monolayer adsorption (Langmuir model) or multiplayer
adsorption. Therefore, beating might be a good way to increase the surface area of the

82
fibers so as to increase the adsorption capacity. Freeness measures how fast a volume of
water can be drained at a specific volume of the mixed solution of water and fibers. The
freeness can reflect the surface area and bonding properties (TAPPI, 1992). Table 4-4
shows that the freeness is increased with increasing beating time. Also, the nitrogen
content of cellulose after the quaternization under some reaction conditions can reflect the
surface areas. On the other hand, the TCI of three samples do not change much. The
pictures of SEM can provide a direct way to observe the surface changes before and after
beating. The pictures of SEM indicate that cracks and fibrils in wood pulps become more
frequent with increasing beating time (see Figure 4-2 and 4-3).
Table 4-4 and the SEM pictures show that the surface area dramatically increased
with beating time. However, the IGC data do not show (Figure 4-4) any increase of
dispersive components of surface energy, DSγ . As mentioned in Chapter 3, DSγ is related to
the amount of amorphous area. Interestingly the beating does not increase the amount of
amorphous area, it is speculated that the crystal is too hard to be broken by the beater and
the breaking points are located in the amorphous regions. Therefore, the dispersive
components of surface energy do not vary before and after beating because the amorphous
regions were not affected by beating.
Table 4-4. The freeness and nitrogen contents of samples
Beaten Time (min)
0
10
50
Freeness (mL)
737
658
38
Nitrogen Contents (%)
0.54
0.66
0.72
TCI* 0.85 0.86 0.88
* Total Crystallinity Index

83
Figure 4-2. The Morphology of Control Sample (a) ×500, (b) ×2000.
Figure 4-3. The Morphology of Beaten Sample at 50 Min (a) ×500, (b) ×2000.
As discussed above, the influence of surpermolecular structures on the adsorption
character is less important, and also the mechanical method does not change the
crystallinity of beaten fiber, therefore the beaten fiber does not increase the adsorption
capacity. Figure 4-5 indicates the dye adsorptions of sample 0 and 50 have exactly same
saturation values ([Ds] = 0.11 mol/kg) after 24 hours at equilibrium states. This is because
beating does not affect the surface chemical composition (Fardim and Duran, 2003). Also
a b
1 µm 1 µm
a b
1 µm 1 µm

84
an FT-IR spectrum does not show any differences between sample 0 and sample 50
(Figure 4- 6).
y = -0.3681x + 68.568
R2 = 0.8876
y = -0.3872x + 70.618
R2 = 0.9588
30
35
40
45
50
55
60
40 50 60 70 80
Temperature (oC)
Dis
per
sive
Co
mp
on
ent
of
Su
rfac
e E
ner
gy
(mJ/
M2 )
0-N
50-N
Linear (0-N)
Linear (50-N)
Figure 4-4. The values of DSγ versus the temperature.
0
0.02
0.04
0.06
0.08
0.1
0.12
0 0.5 1 1.5 2 2.5
Residual Dye at Equilibrium (g/L)
Ad
sorp
tio
n o
f D
ye o
n t
he
Fib
er
(mo
l/kg
)
0
50
Figure 4-5. Adsorption isotherm for samples 0 and 50 at 24 hours.

85
Figure 4-6. FT-IR spectra for sample 0 and sample 50.
Compared the dye adsorption capacities after quaternization shown in Figure 4-7
with that of unquaternized cellulose, the saturation values of the quaternized cellulose
([Ds] = 0.57 mol/kg and 0.66 mol/kg) are almost 5-6 times higher those of unquaternized
cellulose shown in Figure 4-5. With increasing the reaction time from 1 hour to 30 hours
in Figure 4-8, the saturation value of sample 50-N-30H ([Ds] = 1.07 mol/kg) is increased
by almost 60% as compared with sample 50-N. The Table 4-5 listed the saturation values
compared with nitrogen contents.
4000.0 3600 3200 2800 2400 2000 1800 1600 1400 1200 1000 800 600 370.0cm-1
%T
sample 0sample 50
559.60667.13667.13
817.11
899.18
1066.141117.08
1162.36
1315.171377.431434.02
1637.77
2124.64
2895.18
3371.10
559.60667.13667.13
817.11
899.18
1066.141117.08
1162.36
1315.171377.431434.02
1637.77
2124.64
2895.183371.10

86
0
0.1
0.2
0.3
0.4
0.5
0.6
0.7
0 0.5 1 1.5 2 2.5
Residual Dye at Equilibrium (g/L)
Ad
sorp
tio
n o
f D
ye o
n t
he
Fib
er
(mo
l/kg
)0-N
50-N
Figure 4-7. Adsorption isotherm for samples 0-N and 50-N at 24 hours.
0
0.2
0.4
0.6
0.8
1
1.2
0 0.5 1 1.5 2 2.5
Residual Dye at Equilibrium (g/L)
Ad
sorp
tio
n o
f D
ye o
n t
he
Fib
er
(mo
l/kg
)
50-N
50-N-30
Figure 4-8. Adsorption Isotherm for samples 50-N and 50-N-30 at 24 hours.

87
Table 4-5. The saturation values for different nitrogen contents
Sample No.
[S] (mol/kg)
N%
0
0.11
0
50
0.11
0
0-N
0.57
0.54
50-N
0.66
0.72
50-N-30H
1.07
1.0
The dye affinities of quaternized cellulose fibers increased significantly after
quaternization (Giles, 1989). The saturation values and the dye affinities of quaternized
cellulose increased because the reaction introduced an electron donor site (-O- group) and
a positive charge group (quaternary ammonium). The Figure 4-9 illustrates the
interactions between quaternized cellulose and an anionic dye as an example (Rivlin,
1992). The acid-basic interaction takes place between the electron donor (-O-) group and
electron acceptor (-N=N-) where a very strong ionic bond is formed between (-N+-) and
(SO3-). Furthermore, another form of hydrogen bonding is one in which the delocalized
electrons of a conjugated ring system provide an electronegative center for involvement in
a bond (Rattee and Breuer, 1974). In this case, the benzene groups of dye molecular
interact with proton donor or electron acceptor, –OH to form a hydrogen bond.
According to physical chemistry, the higher enthalpy of interaction results in the
strong interactions or bonding. The enthalpy between quaternized cellulose fibers and
acid/basic probes increases with the nitrogen contents (Table 4-6). The strength of the
electrostatic interaction or ionic bonding also increases with nitrogen contents. Thus, the
enthalpy of acid-base interaction and ionic bonding (electrostatic interaction) is increased

88
with increasing nitrogen contents according to the equation [4-1]. Then, the dye
adsorption behavior of the quaternized cellulose fibers with different nitrogen contents is
able to be predicted by the enthalpy of interactions. The dye affinity and saturation values
increase with nitrogen content as shown in Figure 4-7 and Figure 4-8, and the dye affinity
and saturation values are summarized in Table 4-7.
N N
CH2 CH2 CH2O N
CH3
CH3
CH3
ionic bond
acid-basic interaction
O
H
OH
hydrogen bond
Van der Waals force
Cellulose
SO3-
OH
hydrogen bond
Figure 4-9. Chemical bonds and interactions between an anionic dye and the quaternized cellulose.
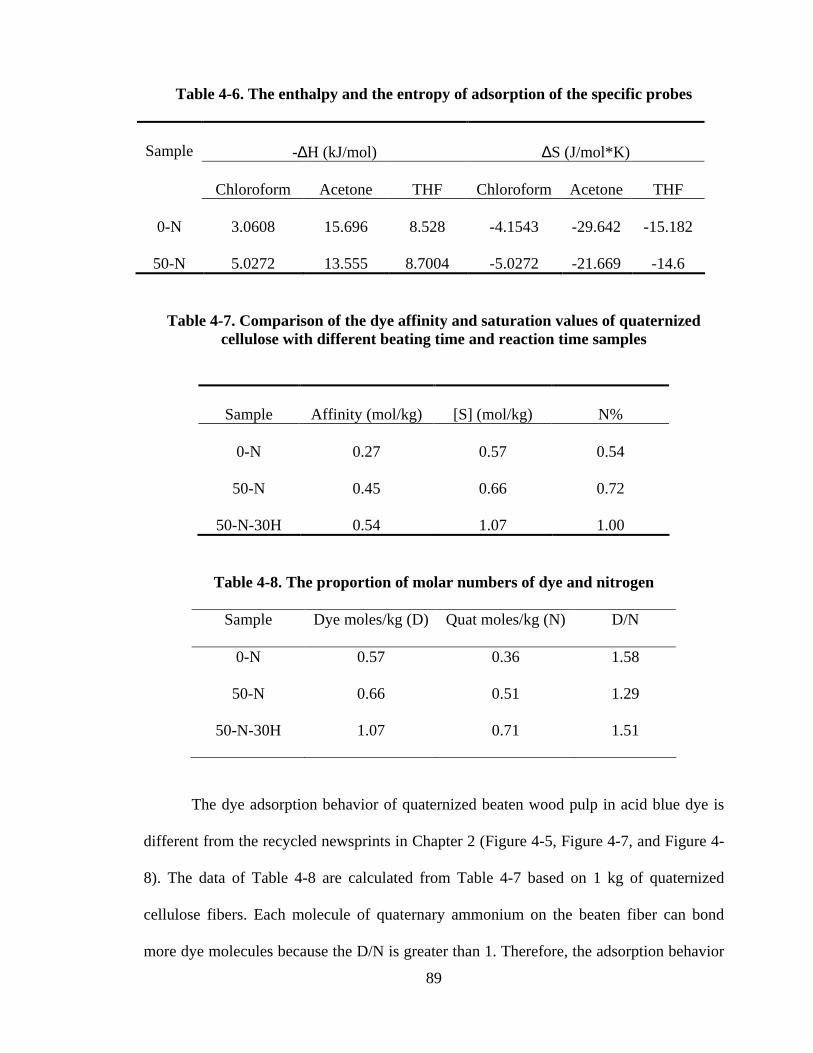
89
Table 4-6. The enthalpy and the entropy of adsorption of the specific probes
-∆H (kJ/mol)
∆S (J/mol*K)
Sample
Chloroform
Acetone
THF
Chloroform
Acetone
THF
0-N
3.0608
15.696
8.528
-4.1543
-29.642
-15.182
50-N
5.0272
13.555
8.7004
-5.0272
-21.669
-14.6
Table 4-7. Comparison of the dye affinity and saturation values of quaternized cellulose with different beating time and reaction time samples
Sample
Affinity (mol/kg)
[S] (mol/kg)
N%
0-N
0.27
0.57
0.54
50-N
0.45
0.66
0.72
50-N-30H
0.54
1.07
1.00
Table 4-8. The proportion of molar numbers of dye and nitrogen
Sample Dye moles/kg (D) Quat moles/kg (N) D/N
0-N 0.57 0.36 1.58
50-N 0.66 0.51 1.29
50-N-30H 1.07 0.71 1.51
The dye adsorption behavior of quaternized beaten wood pulp in acid blue dye is
different from the recycled newsprints in Chapter 2 (Figure 4-5, Figure 4-7, and Figure 4-
8). The data of Table 4-8 are calculated from Table 4-7 based on 1 kg of quaternized
cellulose fibers. Each molecule of quaternary ammonium on the beaten fiber can bond
more dye molecules because the D/N is greater than 1. Therefore, the adsorption behavior

90
does not fit Langmuir isotherm model when the quaternized cellulose reacts with the acid
dye.
4.4 Conclusions
The supermolecular structure and surface areas do not affect the capability of
adsorption of cellulose because the saturation values of dye adsorption are almost same
before and after beating. But the saturation value of dye adsorption is dramatically
increased after quaternization because the chemical composition was changed. The
increases of the enthalpy of adsorption result from acid-basic interactions and the polarity
of cellulose after quaternization.
The chemical constitution plays a critical role for adsorption capabilities. The
interactions between dye and quaternized cellulose increase significantly due to the fact
that quaternization introduced more acid-base and ion-ion interaction sites. With
increasing beating time, the increasing of the surfaces of cellulose fiber results in
increasing the reaction probability between cellulose fiber and quaternary ammonium
chloride. At the same time, more quaternary ammonium salts are introduced onto the
polymer chains with longer reaction time. And the dye adsorption behavior does not fit
Langmuir isotherm when the quaternized cellulose react with the acid dye.

91
4.5 References
Drago, R. S.; Matwiyoff, N. A. Topics in Modern Chemistry: Acids and Bases; Raytheon Education Company: Lexington, Massachusetts, 1968. Drago, R. S. Applications of Electrosatatic-Covalent Models in Chemistry; Surfside Scientific Publishers: Florida, 1994; p183. Fardim, P.; Duran, N. Colloid and Surf. A: Physicochem. Eng. Aspects, 2003, 223, 263-276. Finston, H. L.; Rychtman, A. C. A New View of Current Acid-Base Theories; John Wiley & Sons: New York, 1982; p70. Fowkes, F. M. J. Adhes. Sci. Technol. 1987, 1, 7 – 27. Freeness of pulp; Tappi, T 227 om-92, 1992.
Giles, C. H. in The theory of coloration of textile, 2nd ed.; Johnson, A., Ed.; Society of Dyers and Colourists: England, 1989; p 120 Garbassi, F., Morre, M.; Occhiello, E. Polymer Surfaces From Physics to Technology. John Wiley & Sons: Chichester, England, 1995; P 332. Kreze, T.; Jeler S.; Strand, S. Mat. Res. Innovat. 2002, 5, 227-283. Larsson, A.; Stenium, P. Acid-Bade Interactions between Cellulose and Organic Molecules. International Symposium on Wood Pulping Chemistry. Technical paper; 1985, p27-28. Mukhopadhyay, P.; Schreiber, H. P. Colloids Surf. A: Physicochem. Eng. Apects 1995, 100, 47-71. Rattee, I. D.; Breuer, M. M. The physical chemistry of dye adsorption; Academic Press: London and New York, 1974; p 19.
Rivlin, J. The Dyeing of Textile Fibers: Theory and Practice; Pennsylvania, 1992.

92


