1
EVALUATION OF STATE FINANACES
A STUDY OF RAJASTHAN
SURJIT SINGH
MOTILAL MAHAMALLIK
SPONSORD BY
14TH
FINANCE COMMISSION,
GOVERNMENT OF INDIA
Submitted by
INSTITUTE OF DEVELOPMENT STUDIES, JAIPUR-
November, 2014

2
Dedicated to
Professor Surjit Singh

3
PREFACE AND ACKNOWLEDGEMENT
The task of undertaking a study on Evaluation of State Finances of Rajasthan was assigned to
the Institute of Development Studies, Jaipur in connection of the fourteenth finance
commission report.
In a developing country, states government has to make a balance between social
welfare schemes and economic growth. Economic growth is essential to economic
development and distributive justice. But vice versa may not be possible all time. However,
spending on development proramme may be appreciated to meet the growth target in the long
long run. In other words, it is also well recognized that more spending on social welfare
programme at present may be a hurdle to maintain fiscal balance even if it pave the way for
future development. Therefore, states are making a balance between development and growth.
With the increase in prices of commodities, salaries and pension, burden on states is mounting.
As a result state expenditure is rising sharply. To meet these expenses state has to come with a
large tax base and more tax effort. As a result of increase in population, urbanization, needs
and price rise, state are become more dependent on central devolution. There is increasing
fiscal imbalances observed in last three decades. This fiscal imbalance is reflected in both
deficits indicators and revenue and expenditure indicators. In order to meet the deficits, and
put the fiscal situation in order central government has introduced MTFRP and brought FRBM
Act. With this background, it is necessary to understand the fiscal health of the state at the
beginning o the fourteenth finance commission which will help the center to make necessary
changes in devolution.
This study was initiated by the then Director IDSJ, Professor Surjit Singh. After sudden
demises of Professor Singh on 4th
December, 2013, the work was assigned to me in the
month of February 2014. I am grateful to Prof Naresh Dadhich, Officiating Director, IDSJ for
assigning me the responsibility of completing the study. I am deeply indebted to him for his
kind support and cooperation during the study.
I am indebted to Kanchan Mathur (Professor, IDSJ), Dr Shobhita Rajagopal (Faculty
IDSJ), Dr Varsha Joshi (Faculty IDSJ), Dr Mohanakumar S. (Faculty, IDSJ), and Dr Varinder
Jain (Faculty IDSJ) for their encouragement during writing the report. We are also thankful to all
Research and administrative Staff IDSJ for their encouragement during the preparation of the
report.
We are deeply indebted to Mr Navin Mahajan, IAS, who took special interest on this
report and assign the task to Mr Anjan Juneja and Shanti Lal Jain to give their valuable
comments on it. Mr Sudhir Sharma, Director Budget, Government of Rajasthan deserves
special thanks for his dedicated and valuable help during the tenure of the research.
This voluminous work would not have been possible without the dedicated effort our
Research Assistants, Mr Somoti Lal and Ramesh Chand. We would like to acknowledge with
great appreciation the dedicated, untiring and valuable support of Mr. Somoti Lal Kumhar,
throughout the course of the study. He shouldered the responsibility of data entry and
estimation for the study.
Surjit Singh
Motilal Mahamallik
Jaipur
4
CONTENTS
Chapter 1 Introduction-----------------------------------------------------------10-14
1.1 Background
1.2 Comparison with all India and non-special category States 1.3 Objectives
1.4 Chapter Design
Chapter 2 Revenue Capacities of Rajasthan and
Measures to Improve the Tax-GSDP Ratio----------------------15-34
2.1 Revenue Capacities of Rajasthan
2.1.1 Taxable Capacity and Tax-effort
2.2 Structure of Revenue Receipts in Rajasthan
2.2.1 Tax Revenue in Rajasthan
2.2.2 Non-Tax Revenue
2.2.3 Revenue Transfers from Centre to Rajasthan
2.3 Tax-GSDP Ratio
2.3.1 Measures to Improve the Tax-GSDP Ratio
2.4 Suggestions for Enhancing the Revenue Productivity
of the Tax System
Chapter 3 Analysis of Rajasthan’s Own Non-Tax Revenue---------------35-41
3.1 Analysis of Own Non-Tax Revenue
3.2 Suggestions to Enhance Revenue from User Charges and
Profits from Departmental Enterprises and Dividends from
Non-Departmental Commercial Enterprises
Chapter 4 Trend in Expenditure Pattern in Rajasthan----------------------42-48
4.1 Introduction
4.2 Expenditure Pattern
4.2.1 Revenue Expenditures
4.2.2 Capital Expenditure
4.2.2.1 Capital Outlay
4.2.3 Plan and Non- Plan Expenditure
4.2.4 Developmental and Non-Developmental Expenditure
4.3 Suggestions for improvement in the composition of expenditure pattern
Chapter 5 Analysis of Deficits in Rajasthan--------------------------------49-55
5.1 Introduction
5.2 Analysis of Revenue and Fiscal Deficits
5.3 Trend in Deficit
5.4 Balance of Current Revenues for Plan Financing
5.5 Conclusion
Chapter 6 Debt-GSDP Ratio in Rajasthan----------------------------------56-64
6.1 Introduction
6.2 Composition of the State's Debt
6.2.1 Debt Relief
6.3 Level of Debt- GSDP Ratio 6.4 Suggestions to improve the Debt- GSDP Ratio Chapter 7 State's Transfer to Local Bodies in Rajasthan-----------------65-96
7.1 Urban Local Bodies in Rajasthan
7.1.1 Municipal Finances
7.1.1.1 Inter governmental Transfers
7.1.1.1.1 First State Finance Commission
5
7.1.1.1.2 Second State Finance Commission
7.1.1.1.3 Third State Finance Commission
7.2 Panchayati Raj Institutions
7.2.1 Central Level Provisions
7.2.2 State Level Provisions
7.2.3 Fiscal Position of PRI’s in Rajasthan
7.3 Views on Own Efforts of Urban Local Bodies
7.4 Status of Activities
7.5 Reforms Agenda undertaken by Rajasthan
7.6 Conclusion
Chapter 8 Impact of Power Sector Reforms on
Rajasthan’s Fiscal Health------------------------------------97-101
8.1 Introduction
8.2 Policy Initiatives undertaken by Rajasthan Government
8.3 Conclusion
Chapter 9 Rajasthan State Government Subsidies
Targeting and Evaluation------------------------------------102-106
9.1 Rationale of Subsidy
9.1.1 Types of Subsidy
9.1.1.1 Direct Subsidies
9.1.1.2 Indirect Subsidies
9.2 Subsidy by Rajasthan Government
9.3 Conclusion
Chapter 10 FRBM Act and Rajasthan: A Performance---------------107-110
10.1 Introduction
10.2 FRBM Act in Rajasthan
10.3 Conclusion
Chapter 11 Analysis of Contingent Liabilities in Rajasthan---------111-116
11.1 Contingent Liabilities in the Emerging Economy Context
11.2 Contingent Liabilities in Rajasthan
11.2.1 Guarantee Redemption Fund:
11.2.2 Reserve Fund of the State
11.2.3 Rajasthan State Investment Fund:
11.2.4 Other Funds
11.3 Conclusion
Chapter 12 Public Expenditures and Financial
Management Reforms in Rajasthan--------------------117-119
12.1 Introduction
12.2 Public Expenditures Management in Rajasthan
12.3 Reforms in PEM:
12.4 Conclusion
Chapter 13 Measure taken to improve the Performance of
Public Sector Enterprises in Rajasthan ---------------120-121
13.1 Public Sector Enterprises in Rajasthan
13.2 Measures undertaken to improve the performance of PSEs in
Rajasthan:
Chapter 14 Conclusions----------------------------------------------222-123

6
LIST OF TABLES
1.1 Comparison of Rajasthan
2.1 Sources of State Tax and Non-Tax Revenue
2.2 Total Revenue Receipts, Own Tax Revenue and Non-tax Revenue (Rs. crores)
2.3 Annual Percentage Growth (%)
2.4 Share in Receipts (%)
2.5 Own Revenue Receipts
2.6 Composition of Revenue Receipt in Rajasthan (Rs. lakhs)
2.7 Annual Growth Rates (%) Revenue Receipt in Rajasthan
2.8 Components of Own Revenue (Rs. lakhs)
2.9 Composition of State’s Own Tax Revenue
2.10 Tax -GSDP Ratio, Rajasthan
3.1 Components of Non-Tax Revenue in Rajasthan
3.2 Major Sources of Non-Tax Revenue of Rajasthan (Rs. lakhs)
3.3 Proportion of Non-Tax Revenue from Total Own- Tax and Total Revenue Receipts
3.4 Major Components of Non-Tax Revenue: Rajasthan (%)
3.5 Non-tax Revenue, Rajasthan (Rs. lakhs)
3.6 Non-tax Revenue, Rajasthan (% increase over the previous year)
4.1 Total Revenue and Capital Expenditure (Rs. lakhs)
4.2 Total Revenue Expenditure (Rs. lakhs)
4.3 Total Capital Expenditure
4.4 Annual Compound Growth Rate of Major Heads of Revenue Expenditure
(2002-03 to 2011-12)
4.5 Annual Compound Growth Rate of Major Heads of Capital Expenditure
(2002-03/2011-12)
5.1 Deficit Indicators of Rajasthan (Rs. crores)
5.2 Per Capita Revenue and Fiscal Deficit (Rs.)
5.3 Fiscal Variables
5.4 Revenue Receipts, Revenue Expenditure and Revenue Deficits
6.1 Composition of Total Debts
6.2 Components of total Debts in Rajasthan (Rs. lakhs)
6.3 Distribution of Total Debt (%)
6.4 Annual Growth Rate of Components of Total Debts in Rajasthan
6.5 Major Components of Total Debt and its Contribution
6.6 Annual Compound Growth Rate of different Components of Total Debt
6.7 Capital Outlay as Percent of Net Borrowings (%)
7.1 Transfers to Urban Local Bodies in Rajasthan (Rs. crores)
7.2 Percentage of ULBs Transfers to Total (Rs. crores)
7.3 Transfers to PRIs in Rajasthan (Rs. crores)
7.4 Percentage of PRIs Transfers to Total
7.5 Functional Domain of Urban Local Bodies as per the 12th
Schedule
9.1 Composition of Subsidy
9.2 Subsidies in Rajasthan (Rs. lakhs)
9.3 Subsidies Released by the State Government of Rajasthan (Rs. lakhs)
9.4 Subsidies Released by the State Government of Rajasthan (%)
7
9.5 Annual Growth Rate of Subsidy (to different departments) in Rajasthan
10.1 Revenue Deficit –GSDP Ratio of India and Rajasthan (Rs. lakhs)
10.2 Target and Achievement of FRBM and MTFP: Rajasthan
10.3 Own Revenue Receipts (own-tax and own non-tax revenue)
as percentage of GSDP (2004-05 current price)

8
LIST OF FIGURES
1.1 Per Capita NSDP Rajasthan at 2004-05 Price
1.2 Per-Capita NSDP States and UTs 2011-12
2.1 Total Revenue Receipts, Own Tax Revenue and Non-tax Revenue (Rs. crores)
3.1 Per- Capita Non-Tax Revenue of Rajasthan
5.1 Trends in Revenue Receipts and Revenue Expenditure in Rajasthan (Rs. lakhs)
5.2 Revenue Deficit of Rajasthan (Rs. lakhs)
5.3 Fiscal Deficit of Rajasthan (Rs. lakhs)
5.4 Revenue and Fiscal Deficit as % of GSDP of Rajasthan (in %)
5.5 Per-Capita Revenue and Fiscal-Deficit in Rajasthan
6.1 Debt-GSDP Ratio of Rajasthan

9
LIST OF APENDIX
1.1 Key Indicators of the State VIS-a-VIS India
2.1 The heads of account under which there was substantial increase in revenue receipts
during 2006-2007 as compared to those of 2005-06
2.2 The heads of account under which there was substantial increase/ decrease in
revenue receipts during 2008-09 as compared to those of 2007-08
2.3 The heads of account under which there was substantial increase/ decrease in
revenue receipts during the year as compared to those of previous year
2.4 Own Revenue of Rajasthan
2.5 Composition of State own tax revenue
2.6 Annual Change in different Components of State own Tax Revenue
2.7 Receipt on Revenue Account (The revenue raised by the state government during
2010-11)
2.8 Steps taken by the state government to address the fiscal health
3.1 Share of Non Tax Revenue
7.1 Rajasthan Municipal Act, 2009
7.2 Revenue of ULBs in Rajasthan by Sources (Rs. lakhs)

10
Chapter 1
Introduction
1.1 Background
Rajasthan is located in the northwest part of India. It is the largest state in terms of
area (342.24 thousand sq km) but ranks 8th
position in terms of population. Rajasthan came
into existence in 1956. It started its quest for development with several handicaps and few
advantages. It is a land locked state. Nearly two-third of its area is arid or semi-arid1. Weak
economic base of the state makes the task of resource mobilization extremely difficult. In
addition to this, its high population growth exerts pressure on fragile ecosystem.
Rajasthan’s population density is 201 compared to 382 for India in 2011. It has
districts which have much lower population density compared to many states in the country.
The cost of providing basic infrastructure for social and economic growth of such a state is
undoubtedly high. The rate of urbanization in Rajasthan is lower compared to the national
level (24.9% vs 31.2%).
Rajasthan's development since independence presents a mixed picture. On the one hand, the
state has made significant progress in development of basic infrastructure like irrigation, and
industrial production has not only increased but has also diversified over the years. On the
other hand, the Gross State Domestic Product (GSDP) has grown only at 3.3 % per annum
during the last three decades. The state is being ranked as the 10th
least developed states in
India2. In terms of major socio-economic indicators Rajasthan is far behind the national
average (see Appendix 1). Comparison of Rajasthan with the all India average and the
highest level achieved among the non-special category States clearly indicates the alarming
gap between the level of development in the State and rest of the country.
1 In these areas, rainfall is very low and the droughts, which are common features year after year, threaten the
existence of not only crops and vegetation but also of livestock and human beings. The state is required to allocate substantial resources to mitigate the miseries of the people arising out of frequent droughts in several parts of the state.
2 Government of India (2013) Report of the Committee for Evolving a Composite Development Index of States, Ministry of Finance (Chairman: Dr. Raghuram G Rajan).

11
Table 1.1
Comparison of Rajasthan with all India and highest level among Non-special Category States
Indicator Unit Year Rajasthan All
India
Highest
among non-
special
category
State
Rank among
non-special
category
States
Per Capita Income at Current
Prices
Rs. 2011-12 53735 61564 167838 13
Per Capita consumption of
power
KWH 2010-11 843.75 818.75 2060.65 13
Per hectare consumption of
fertilizes
Kg. 2009-10 48.33 135.27 237.05 17
Per Capita consumption of
petroleum products
Kg. 2011-12 126.3 116.3 724.3 9
Per Capita credit by scheduled
commercial banks
Rs. 31.03.2012 19886 39909 121543 10
Road length/100 sq.km. Km. 31.03.2011 70.51 115.30 517.77 16
Railway route/1000 sq.km. Km. 2011 17 20 44 13
Population Served per Govt.
Hospital.
No. 2010-11 83076 98970 451325 10
Population Served per Bed No. 2010-11 2640 1512
5606 15
Source: Memorandum to the Fourteenth Finance Commission, February 2014, Government of Rajasthan
It is after 2005 that the economy has shown a healthy growth path when the
GSDP (at current prices) almost doubled from Rs. 127746 crores in 2004-05 to Rs. 323682
crores in 2010-11. This has made Rajasthan one of India’s faster growing states with the
average growth rate of around 7.43 % (real GSDP) during 2004-05 and 2010-11. As a result
of this the per capita net state domestic product during 2010-11 is estimated as Rs 26436.
The per capita NSDP has increased from Rs 18565 to Rs 26436 during 2004-05 to 2010-11.
Apart from it the head-count ratio of poverty is comparatively high in Rajasthan, though it
has observed declining over the decades, especially rural poverty.
Figure 1.1
Per-Capita NSDP of Rajasthan at 2004-05 Price
12
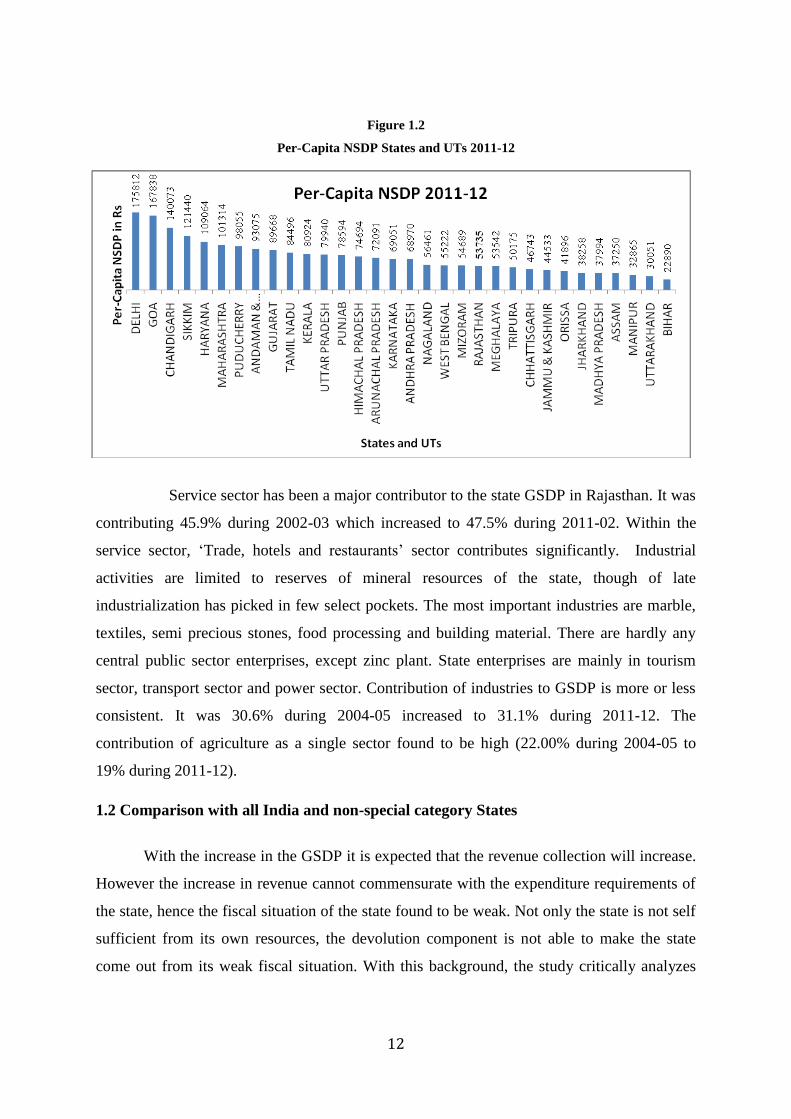
Figure 1.2
Per-Capita NSDP States and UTs 2011-12
Service sector has been a major contributor to the state GSDP in Rajasthan. It was
contributing 45.9% during 2002-03 which increased to 47.5% during 2011-02. Within the
service sector, ‘Trade, hotels and restaurants’ sector contributes significantly. Industrial
activities are limited to reserves of mineral resources of the state, though of late
industrialization has picked in few select pockets. The most important industries are marble,
textiles, semi precious stones, food processing and building material. There are hardly any
central public sector enterprises, except zinc plant. State enterprises are mainly in tourism
sector, transport sector and power sector. Contribution of industries to GSDP is more or less
consistent. It was 30.6% during 2004-05 increased to 31.1% during 2011-12. The
contribution of agriculture as a single sector found to be high (22.00% during 2004-05 to
19% during 2011-12).
1.2 Comparison with all India and non-special category States
With the increase in the GSDP it is expected that the revenue collection will increase.
However the increase in revenue cannot commensurate with the expenditure requirements of
the state, hence the fiscal situation of the state found to be weak. Not only the state is not self
sufficient from its own resources, the devolution component is not able to make the state
come out from its weak fiscal situation. With this background, the study critically analyzes
13
the overall state finances of Rajasthan over the ten years period (2002-03 through 2011-12).
In the above context, the present study has attempted to look at the following:
1.3 Objectives:
1. Estimation of revenue capacities of Rajasthan and measures undertaken to
improve the tax- GSDP ratio during last five years. Suggestions for enhancing
the revenue productivity of the tax system in Rajasthan.
2. Analysis of the Rajasthan’s own non-tax revenues and suggestions to enhance
revenues from user charges and profits from departmental enterprises and
dividends from non-departmental commercial enterprises.
3. Expenditure pattern and trends separately for non-plan and plan, revenue and
capital, and major components of expenditure there under. Measures to
enhance allocative and technical efficiency in expenditures during the last 5
years. Suggestions for improving efficiency in public spending.
4. Analysis of deficits- fiscal and revenue along with balance of current revenues
for plan financing.
5. The level of debt- GSDP ratio and the use of debt (i.e. whether it has been
used for capital expenditure or otherwise). Composition of the Rajasthan’s
debt in terms of market borrowing, central government debt (including those
from bilateral/multilateral lending agencies routed through the central
government), liabilities in public account (small savings, provident funds etc.)
and borrowings from agencies such as NABARD, LIC etc.
6. Analysis of the Rajasthan’s transfers to urban and rural local bodies. Major
decentralization initiatives. Reforms undertaken under JNNURM
conditionality.
7. Impact of Power Sector Reforms on Rajasthan’s fiscal health. In case reforms
have not been implemented, the likely outcome on the Rajasthan’s fiscal
health.
8. Subsidies given by Rajasthan (other than central subsidies), its targeting and
evaluation.
9. Implementation of FRBM Act and commitment towards targets. Analysis of
MTFP of various departments and aggregate.
10. Analysis of Contingent Liabilities of Rajasthan.
11. Public Expenditure and Financial Management (PEFM) Reforms implemented
in Rajasthan.
12. Impact of State Public Enterprises finances on the Rajasthan- financial health
and measures taken to improve their performance and/or alternatives of
closure, disinvestment etc.
1.4 Chapter Design:
The structure of the report is divided into eleven chapters besides the introduction.
The chapter 2 analyses the Revenue Capacities of Rajasthan and measures to improve the
Tax-GSDP Ratio. The own non-tax revenue has been examined as well as suggested
measures are given to increase the user charges in chapter 3. In the chapter 4 the trends of

14
expenditure pattern in Rajasthan have been presented. An analysis of deficits in Rajasthan
with remedial measures has been presented in chapter 5. In chapter 6 debt-GSDP ratio and
the composition of debt in Rajasthan has been examined. The transfers from state government
to local bodies - urban and rural in Rajasthan along with the fiscal position of local bodies
have been analyzed in chapter 7. The Chapter 8 explores the impact of power sector reforms
on Rajasthan’s fiscal health. In Chapter 9 Rajasthan state government subsidies has been
evaluated over the time. The fiscal restructuring programme particularly FRBM Act has been
examined in chapter 10. Chapter 11 gives an analysis of contingent liabilities in Rajasthan.
Lastly, the conclusions with some policy suggestions have been presented in chapter 12.
Appendix: 1.1
Key Indicators of the State VIS-a-VIS India
Indicators Year Unit Rajasthan India
Geographical Area 2011 Lakh Sq. Km. 3.42 32.87 Population 2011 In crore 6.85 121.06 Decadal Growth 2011 Percentage 21.3 17.7
Density of Population 2011 Per Sq. Km. 200 382
Urban Population to total Population 2011 Percentage 24.9 31.2 Sex Ratio 2011 Per '000 Male 928 943
SC Population to total Population 2011 Percentage 17.8 16.6 ST Population to total Population 2011 Percentage 13.5 8.6 Human Development Index 2011 Value 0.537 0.653 Literacy 2011 Percentage 66.1 73.0 - Female 2011 Percentage 52.1 64.6 - Male 2011 Percentage 79.2 80.9
Birth Rate 2011 Per '000 Population 26.2 21.8
Infant Mortality rate 2012 Per '000 Live Birth 49 42
Maternal Mortality Rate 2007-09 Per Lakh 318 212
Life expectancy at Birth — - Male
- Female
2006-10(P) Years 66.1
69.2 65.8
68.1
Gross Domestic Product at constant prices (base year 2004-05) (A)
2012-13 Rs.in crore 239913 5503476
Per-capita income at constant prices
(base year 2004-2005) (A)
2012-13 Rs. 29917 39143
Road Length per 100 Sq. Km. of Area March, 2011 Km. 71 115 Railway Route Length per
1000 Sq Km. of Area
March, 2011 Km. 16.90 19.61
Percentage of Forest Area to Reporting Area 2008-09 Percentage 7.96 22.8
Source: Memorandum to the Fourteenth Finance Commission, February 2014, Government of Rajasthan
Note: (A) Denotes Advanced Estimates , (P) Denotes Projected.

15
Chapter 2
Revenue Capacities of Rajasthan and
Measures to Improve the Tax-GSDP Ratio
In this chapter we discuss on estimation of revenue capacities of Rajasthan state and
measures to improve the tax- GSDP ratio during last five years and provide suggestions for
enhancing the revenue productivity of the tax system in the state.
2.1 Revenue Capacities of Rajasthan
Revenue capacity of a state under a federal structure of government basically
depends on (1) it resources endowment and economic growth, and (2) tax efforts of the
government. In other words, revenue capacity of any unit is a function of tax base and tax-
efforts of that unit. When, gross state domestic product (GSDP) is used as the crude variable
for the tax base (with all criticisms), tax effort of the unit solely depends upon the efficiency
of tax mobilization and political will of the government. Revenue capacity is assessed
through a relative as well an absolute measure. Revenue capacity of a unit as compared to its
own expenditure requirement is one way to assess the capacity. However, the absolute
revenue capacity can be measured through the amount of revenue generated by the unit
within a stipulated financial year from its own sources. This basically depends upon the tax
base (taxable capacity), tax effort and other possible sources of non-tax revenue of the unit.
2.1.1 Taxable Capacity and Tax-effort
According to Mathew and Sweeney "A fiscal unit's taxable capacity in particular
to a revenue source may be defined as the amount of tax the unit can raise by applying a
standard rate schedule to its own revenue base. A fiscal unit's severity of taxation in relation
to the revenue source (or its tax effort) may be defined as the ratio of the revenue it actually
collects from that source to its taxable capacity"3. Advisory Commission on
Intergovernmental Relations (ACIR) gives a simple and lucid definition of the term fiscal
capacity or taxable capacity. According to the Commission, "fiscal capacity is a quantitative
3 R.L. Mathew and T.A. Sweeney (1977), "Concepts and Measures of Taxable Capacity and Tax Efforts" in R.L.
Mathews (ed.) State and Local Taxation, Australian National University Press, Canberra: pp.94-124.

16
measure intended to reflect the resources which a taxing jurisdiction can tax to raise revenue
for public purposes. According to this definition, available taxable resources would indicate
the taxable capacity or potential. Defining 'tax-efforts' ACIR expressed, "Tax-effort is a
closely related measure quantifying the extent to which a government actually uses its
capacity to raise revenue through taxation”4. If two states are having equal fiscal capacity but
state ‘x’ collects more tax revenue than state ‘y’, then the former is said to be making higher
tax-effort. For purposes of this definition it is not important that ‘x’ is able to export a large
portion of its tax to other states. All taxes paid to state ‘x’ are counted as part of ‘x’s tax effort
since they represent utilization of its tax potential. The non-tax capacity has been explained in
details in chapter 3.
2.2 Structure of Revenue Receipts in Rajasthan
Total revenue receipt is a combination of hare in central taxes, state tax revenue,
total non-tax revenue, and grant-in-aid from central government. But as discussed above
revenue capacity is assessed from state own revenue receipt, which is a combination of state
tax revenue, and non-tax revenue. The sources from which Rajasthan government has been
generating revenue from own sources are listed in table 2.1.
Table 2.1
Sources of State Tax and Non-Tax Revenue
S.No. Total state tax revenue Total non -tax revenue
1 Land revenue Interest, receipts dividends & profits
2 Stamps and registration fee General services
3 State excise Education, arts & culture (social services)
4 Sales tax Medical health & family welfare (social services)
5 Tax on vehicles Water supply, urban development (social services)
6 Taxes on goods and passengers Other (social services)
7 Taxes and duties on electricity Minor irrigation (economic services)
8 Other tax on income and
expenditure
Forestry and wildlife (economic services)
9 Taxes on goods and services Industries village and small industries (economic services)
10 Tax on immovable property Major and medium irrigation projects (economic services)
11
Tax on agricultural income
Non- ferrous mining & metallurgical industries (economic
services)
12 Service tax Others (economic services)
13 Other taxes Petroleum (economic services) Source: Budget Study (2004-05, 2006-07, 2007-08, 2009-10, 2012-13, 2013-14), (p-10 &16 of all Budget Studies), Government of
Rajasthan.
4 Advisory Commission on Inter-governmental Relations– ACIR (1962) Measures of State and Local Fiscal Capacity
and Tax Efforts Washington D.C.

17
Table 2.2
Total Revenue Receipts, Own Tax Revenue and Non-tax Revenue (Rs. crores)
Years Own tax
revenue
Non-tax
revenue
Share in
central
taxes
Grants-
in-aid
Total
revenue
receipts
Non-debt
capital
receipts
Total
receipts
1 2 3 4 5 6=2+3+4+5 7 8 = 6+7
2002-03 6253 1569 3063 2196 13081 125 13206
2003-04 7246 2072 3602 2504 15424 164 15588
2004-05 8415 2146 4305 2897 17763 125 17888
2005-06 9880 2738 5300 2921 20839 238 21077
2006-07 11608 3431 6760 3793 25592 514 26106
2007-08 13275 4054 8528 4924 30781 1782 32563
2008-09 14944 3888 8999 5638 33469 93 33562
2009-10 16414 4558 9258 5155 35385 121 35506
2010-11 20758 6294 12856 6020 45928 332 46260
2011-12 25377 9175 14977 7482 57011 1245 58256
ACGR % 17.20 16.20 19.18 14.48 17.06 15.70 17.12 Source: Budget Study (2004-05, 2006-07, 2007-08, 2009-10, 2012-13, 2013-14; p-10 &16), Government of Rajasthan
Figure 2.1
Total Revenue Receipts, Own Tax Revenue and Non-tax Revenue (Rs. crores)
Total revenue receipts constitute the major component of total receipts (ranged
between 94.53% and 99.72%, table 2.4). It increased from Rs.13081 crores in 2002-03 to
Rs.57011 crores in 2011-12, recording a growth rate of 17.06 % per annum during this period
(table 2.2). In absolute terms, the total revenue receipts have continuously increased and
witnessed 4.35 times jump in 2011-12 over 2002-03. However, maximum annual increase
was observed in 2010-11 over 2009-10 (29.8%) while the lowest increase was in 2009-10
over 2008-09 (5.72%). The total revenue receipts, however, observed a significant decline in
growth in 2008-09 over 2007-08. Non-debt capital receipt, on the other hand, constituted a
marginal component, though in two years 2007-08 (Rs.1782 crores) and 2011-12 (Rs.1245
crores) has significant contribution. Overall, the share of non-debt capital receipts ranged
between 0.34 % (2009-10) and 5.47 % in 2007-08. Non-debt capital receipts were Rs.125
18
crores in 2002-03 but increased to Rs.1245 crores in 2011-12. The sudden changes in non-
debt capital receipts are due to recovery of loans and advances especially from power
projects.
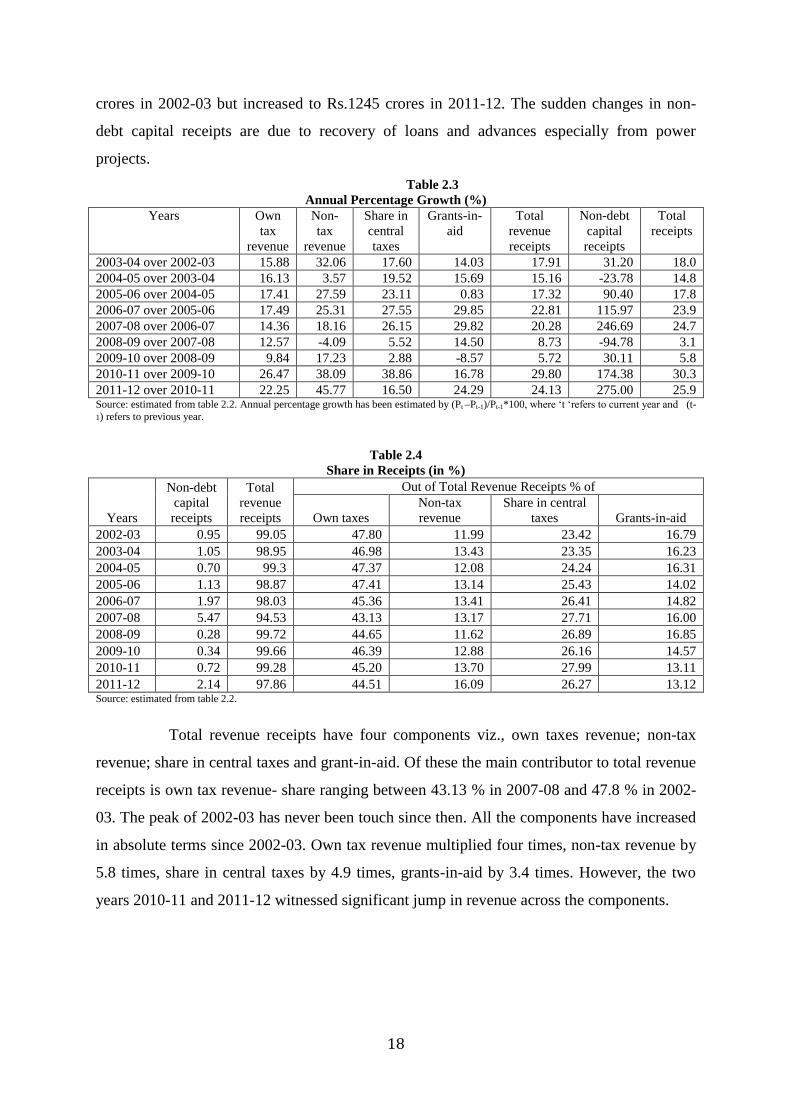
Table 2.3
Annual Percentage Growth (%)
Years Own
tax
revenue
Non-
tax
revenue
Share in
central
taxes
Grants-in-
aid
Total
revenue
receipts
Non-debt
capital
receipts
Total
receipts
2003-04 over 2002-03 15.88 32.06 17.60 14.03 17.91 31.20 18.0
2004-05 over 2003-04 16.13 3.57 19.52 15.69 15.16 -23.78 14.8
2005-06 over 2004-05 17.41 27.59 23.11 0.83 17.32 90.40 17.8
2006-07 over 2005-06 17.49 25.31 27.55 29.85 22.81 115.97 23.9
2007-08 over 2006-07 14.36 18.16 26.15 29.82 20.28 246.69 24.7
2008-09 over 2007-08 12.57 -4.09 5.52 14.50 8.73 -94.78 3.1
2009-10 over 2008-09 9.84 17.23 2.88 -8.57 5.72 30.11 5.8
2010-11 over 2009-10 26.47 38.09 38.86 16.78 29.80 174.38 30.3
2011-12 over 2010-11 22.25 45.77 16.50 24.29 24.13 275.00 25.9 Source: estimated from table 2.2. Annual percentage growth has been estimated by (Pt –Pt-1)/Pt-1*100, where ‘t ‘refers to current year and (t-
1) refers to previous year.
Table 2.4
Share in Receipts (in %)
Years
Non-debt
capital
receipts
Total
revenue
receipts
Out of Total Revenue Receipts % of
Own taxes
Non-tax
revenue
Share in central
taxes Grants-in-aid
2002-03 0.95 99.05 47.80 11.99 23.42 16.79
2003-04 1.05 98.95 46.98 13.43 23.35 16.23
2004-05 0.70 99.3 47.37 12.08 24.24 16.31
2005-06 1.13 98.87 47.41 13.14 25.43 14.02
2006-07 1.97 98.03 45.36 13.41 26.41 14.82
2007-08 5.47 94.53 43.13 13.17 27.71 16.00
2008-09 0.28 99.72 44.65 11.62 26.89 16.85
2009-10 0.34 99.66 46.39 12.88 26.16 14.57
2010-11 0.72 99.28 45.20 13.70 27.99 13.11
2011-12 2.14 97.86 44.51 16.09 26.27 13.12 Source: estimated from table 2.2.
Total revenue receipts have four components viz., own taxes revenue; non-tax
revenue; share in central taxes and grant-in-aid. Of these the main contributor to total revenue
receipts is own tax revenue- share ranging between 43.13 % in 2007-08 and 47.8 % in 2002-
03. The peak of 2002-03 has never been touch since then. All the components have increased
in absolute terms since 2002-03. Own tax revenue multiplied four times, non-tax revenue by
5.8 times, share in central taxes by 4.9 times, grants-in-aid by 3.4 times. However, the two
years 2010-11 and 2011-12 witnessed significant jump in revenue across the components.
19
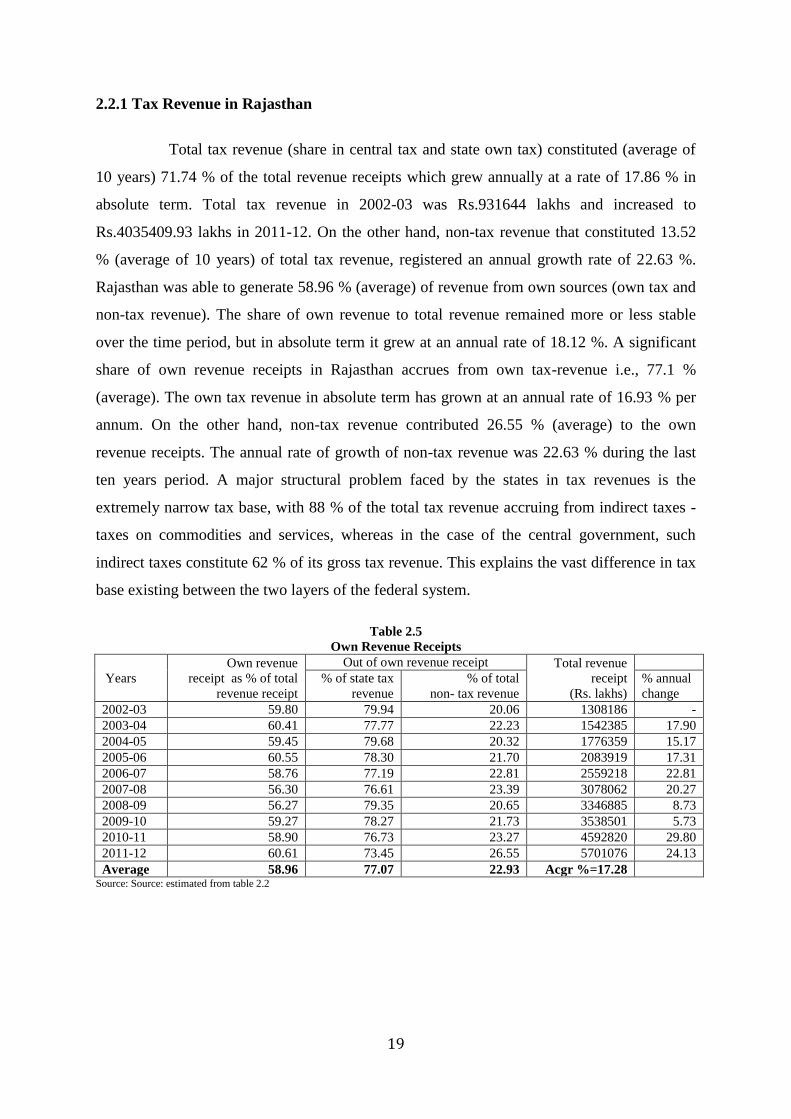
2.2.1 Tax Revenue in Rajasthan
Total tax revenue (share in central tax and state own tax) constituted (average of
10 years) 71.74 % of the total revenue receipts which grew annually at a rate of 17.86 % in
absolute term. Total tax revenue in 2002-03 was Rs.931644 lakhs and increased to
Rs.4035409.93 lakhs in 2011-12. On the other hand, non-tax revenue that constituted 13.52
% (average of 10 years) of total tax revenue, registered an annual growth rate of 22.63 %.
Rajasthan was able to generate 58.96 % (average) of revenue from own sources (own tax and
non-tax revenue). The share of own revenue to total revenue remained more or less stable
over the time period, but in absolute term it grew at an annual rate of 18.12 %. A significant
share of own revenue receipts in Rajasthan accrues from own tax-revenue i.e., 77.1 %
(average). The own tax revenue in absolute term has grown at an annual rate of 16.93 % per
annum. On the other hand, non-tax revenue contributed 26.55 % (average) to the own
revenue receipts. The annual rate of growth of non-tax revenue was 22.63 % during the last
ten years period. A major structural problem faced by the states in tax revenues is the
extremely narrow tax base, with 88 % of the total tax revenue accruing from indirect taxes -
taxes on commodities and services, whereas in the case of the central government, such
indirect taxes constitute 62 % of its gross tax revenue. This explains the vast difference in tax
base existing between the two layers of the federal system.
Table 2.5
Own Revenue Receipts
Years
Own revenue
receipt as % of total
revenue receipt
Out of own revenue receipt Total revenue
receipt
(Rs. lakhs)
% of state tax
revenue
% of total
non- tax revenue
% annual
change
2002-03 59.80 79.94 20.06 1308186 -
2003-04 60.41 77.77 22.23 1542385 17.90
2004-05 59.45 79.68 20.32 1776359 15.17
2005-06 60.55 78.30 21.70 2083919 17.31
2006-07 58.76 77.19 22.81 2559218 22.81
2007-08 56.30 76.61 23.39 3078062 20.27
2008-09 56.27 79.35 20.65 3346885 8.73
2009-10 59.27 78.27 21.73 3538501 5.73
2010-11 58.90 76.73 23.27 4592820 29.80
2011-12 60.61 73.45 26.55 5701076 24.13
Average 58.96 77.07 22.93 Acgr %=17.28 Source: Source: estimated from table 2.2

20
Table 2.6
Composition of Revenue Receipt in Rajasthan (Rs. lakhs)
Years
Total tax
revenue
Share in
central taxes
State tax
revenue
Total non-
tax revenue
Own
revenue
Grants-
in- aid
Total Revenue
receipt
1= (2+3) 2 3 4 5= (3+4) 6 7= (1+4+6)
2002-03 931644 306310 625334 156900 782234 219642 1308186
2003-04 1084840 360221 724619 207164 931784 250380 1542385
2004-05 1272043 430561 841482 214615 1056097 289701 1776359
2005-06 1518031 530008 988023 273767 1261790 292121 2083919
2006-07 1836861 676037 1160824 343061 1503885 379296 2559218
2007-08 2180233 852760 1327473 405393 1732866 492436 3078062
2008-09 2394222 899872 1494350 388846 1883196 563817 3346885
2009-10 2567241 925813 1641427 455822 2097249 515439 3538501
2010-11 3361375 1285562 2075813 629412 2705226 602033 4592820
2011-12 4035410 1497704 2537706 917510 3455216 748156 5701076 Source: Budget Study (2004-05, 2006-07, 2007-08, 2009-10, 2012-13, 2013-14; p-10 &16), Government of Rajasthan
Own tax of Rajasthan in 2002-03 was Rs.6253.34 crores, which increased to
Rs.25377.06 crores by 2011-12. Own tax revenue constituted 77 % of the own revenue of
Rajasthan. Due to the narrow tax base, Rajasthan has not been able to mobilize the required
amount of revenue and thereby observing a revenue deficit. Although there 13 different
sources of tax revenue in Rajasthan, around 92 % of it accrues from sales tax; state excise
duty5; stamps and registration fee
6; tax on vehicles
7; taxes and duties on electricity
8. Sales tax
contributes a major share (59.44% average of ten years) to the tax revenue, though its share in
total tax over the time period just grew at an annual rate of 1.46 %. The second major
contributor to tax revenue in Rajasthan is excise duty (14.25%- average). However the share
of excise duty over the period has shown a declining trend. Stamp and registration fee, which
constitutes 9.78 % of the own tax revenue in Rajasthan, has increased at an annual rate of 1.1
%. Tax on vehicles is another major source of revenue in Rajasthan contributing around 8.64
% during the last ten years. However, the proportion of tax on vehicle to total own tax has
been declining at an annual rate of 4.29 %.
The own revenue has increased continuously in Rajasthan since 2002-03. It was
Rs.7822.34 crores in 2002-03 and stood at Rs.34552.16 crores in 2011-12. The annual rate of
growth varies between 8.68 % and 29 %. Phenomenal growth is observed in 2010-11 over
2009-10 (29%). The own revenue mobilized by the state government in 2006-07
(Rs.15038.85 crores) was higher by Rs.2420.95 crores over the previous year (Rs.12617.90
5 Largely due to more receipt from sale of malt liquor, foreign liquor and spirits. 6 Sale of non-judicial stamp papers. 7 Increase in collection of receipts under state motor vehicle taxation act. 8 Receipts of taxes on consumption and sale of electricity.
21
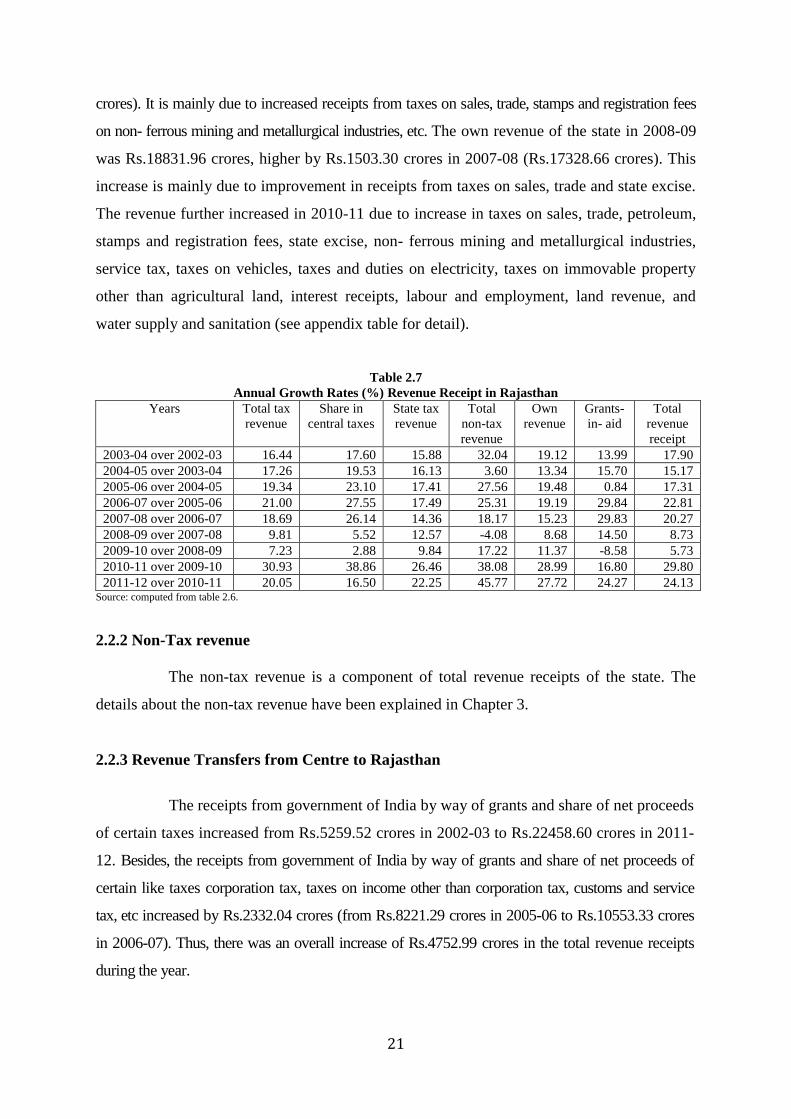
crores). It is mainly due to increased receipts from taxes on sales, trade, stamps and registration fees
on non- ferrous mining and metallurgical industries, etc. The own revenue of the state in 2008-09
was Rs.18831.96 crores, higher by Rs.1503.30 crores in 2007-08 (Rs.17328.66 crores). This
increase is mainly due to improvement in receipts from taxes on sales, trade and state excise.
The revenue further increased in 2010-11 due to increase in taxes on sales, trade, petroleum,
stamps and registration fees, state excise, non- ferrous mining and metallurgical industries,
service tax, taxes on vehicles, taxes and duties on electricity, taxes on immovable property
other than agricultural land, interest receipts, labour and employment, land revenue, and
water supply and sanitation (see appendix table for detail).
Table 2.7
Annual Growth Rates (%) Revenue Receipt in Rajasthan
Years Total tax
revenue
Share in
central taxes
State tax
revenue
Total
non-tax
revenue
Own
revenue
Grants-
in- aid
Total
revenue
receipt
2003-04 over 2002-03 16.44 17.60 15.88 32.04 19.12 13.99 17.90
2004-05 over 2003-04 17.26 19.53 16.13 3.60 13.34 15.70 15.17
2005-06 over 2004-05 19.34 23.10 17.41 27.56 19.48 0.84 17.31
2006-07 over 2005-06 21.00 27.55 17.49 25.31 19.19 29.84 22.81
2007-08 over 2006-07 18.69 26.14 14.36 18.17 15.23 29.83 20.27
2008-09 over 2007-08 9.81 5.52 12.57 -4.08 8.68 14.50 8.73
2009-10 over 2008-09 7.23 2.88 9.84 17.22 11.37 -8.58 5.73
2010-11 over 2009-10 30.93 38.86 26.46 38.08 28.99 16.80 29.80
2011-12 over 2010-11 20.05 16.50 22.25 45.77 27.72 24.27 24.13 Source: computed from table 2.6.
2.2.2 Non-Tax revenue
The non-tax revenue is a component of total revenue receipts of the state. The
details about the non-tax revenue have been explained in Chapter 3.
2.2.3 Revenue Transfers from Centre to Rajasthan
The receipts from government of India by way of grants and share of net proceeds
of certain taxes increased from Rs.5259.52 crores in 2002-03 to Rs.22458.60 crores in 2011-
12. Besides, the receipts from government of India by way of grants and share of net proceeds of
certain like taxes corporation tax, taxes on income other than corporation tax, customs and service
tax, etc increased by Rs.2332.04 crores (from Rs.8221.29 crores in 2005-06 to Rs.10553.33 crores
in 2006-07). Thus, there was an overall increase of Rs.4752.99 crores in the total revenue receipts
during the year.

22
The annual rate of growth of share in central tax and grant-in-aid has remained
more or less constant till 2007-08. However, a decline in the rate of growth occurred in 2009-
10 over 2008-09. After 2009-10, it increased significantly. The grants and share of net
proceeds of certain taxes increase by Rs.1184.93 crores from Rs.13451.96 crores in 2007-08
to Rs.14636.89 crores in 2008-09. This happened because grants from central government
increased and also the share of net proceeds of corporation tax, customs and service tax, etc.
There was an overall increase of Rs.2688.23 crores in the total revenue receipts during 2008-
09 and a significant increase in receipts during 2010-11 to Rs.10543.19 crores then to
Rs.11082.56 crores during 2011-12. The increase in the grants and share of net proceeds of
corporation tax, customs and service tax was by Rs.4463.43 crores and Rs.3582.65 crores in
the same period.
Table 2.8
Components of Own Revenue (Rs. lakhs)
Years State tax
revenue
%
change
annual
Land
revenue
%
change
annual
Stamps and
registration
fee
%
change
annual
State excise %
change
annual
2002-03 625334.0 5797.91 51573.33 114233.8
2003-04 724619.2 15.88 7143.59 23.21 61176.77 18.62 116315.5 1.82
2004-05 841482.1 16.13 6886.11 -3.60 81782.65 33.68 127607.2 9.71
2005-06 988022.7 17.41 8430.37 22.43 103179.40 26.16 152180.4 19.26
2006-07 1160824.0 17.49 11671.04 38.44 129368.30 25.38 159109.3 4.55
2007-08 1327473.0 14.36 15529.23 33.06 154435.20 19.38 180511.9 13.45
2008-09 1494350.0 12.57 16252.05 4.65 135663.20 -12.16 216989.5 20.21
2009-10 1641427.0 9.84 14765.95 -9.14 136293.60 0.46 230047.6 6.02
2010-11 2075813.0 26.46 22216.59 50.46 194104.50 42.42 286140.9 24.38
2011-12 2537706.0 22.25 20900.94 -5.92 265137.60 36.60 328704.8 14.88
ACGR % 16.2 16.8 17.4 12.8 Source: Budget Study (2004-05, 2006-07, 2007-08, 2009-10, 2012-13, 2013-14; p-10), Government of Rajasthan. Annual percentage growth
has been estimated by (Pt –Pt-1)/Pt-1*100, where ‘t ‘refers to current year and (t-1) refers to previous year.
Table 2.8
Contd.
Years Sales tax %
change
annual
Tax on
vehicles
%
change
annual
Taxes on
goods and
passengers
%
change
annual
Taxes and
duties on
electricity
%
change
annual
2002-03 343789.9 64613.93 13043.65 23984.99
2003-04 398543.3 15.93 90430.68 39.96 15050.29 15.38 28028.65 16.86
2004-05 479753.5 20.38 81720.68 -9.63 14401.34 -4.31 44276.25 57.97
2005-06 559363.9 16.59 90818.22 11.13 23671.08 64.37 47135.30 6.46
2006-07 672070.5 20.15 102360.70 12.71 24759.65 4.60 51588.30 9.45
2007-08 775073.5 15.33 116439.80 13.75 16060.63 -35.13 58423.43 13.25
2008-09 890450.2 14.89 121355.90 4.22 18986.43 18.22 65404.49 11.95
2009-10 1016353.0 14.14 137287.10 13.13 17610.46 -7.25 69998.85 7.02
2010-11 1262959.0 24.26 161224.60 17.44 23068.81 30.99 90580.75 29.40
2011-12 1576643.0 24.84 192705.00 19.53 22012.73 -4.58 109447.80 20.83
ACGR % 17.8 11.2 4.7 16.5
23
Table 2.8 (Contd.) Years Other tax
on income
and expend
-iture
%
change
annual
Taxes on
goods
and
services
%
change
annual
Tax on
Immovable
property
%
change
annual
Tax on
agricult
-ural
income
Service
tax
Other
Taxes
2002-03 1722.81 4712.05 - 1858.94 - - 2.63
2003-04 2012.27 16.80 4684.77 -0.58 1199.04 -35.50 - 34.34
2004-05 184.74 -90.82 4755.72 1.51 115.11 -90.40 - -1.18
2005-06 25.13 -86.40 3170.01 -33.34 48.17 -58.15 0.13 0.65
2006-07 6.21 -75.29 4603.60 45.22 5286.57 10874.82 0.13 -
2007-08 4.06 -34.62 5890.62 27.96 5103.41 -3.46 0.72 -
2008-09 4.49 10.59 6452.29 9.53 22791.36 346.59 0.06 -
2009-10 4.39 -2.23 5852.00 -9.30 13214.06 -42.02 0.07 0.07 0.24
2010-11 1.86 -57.63 6444.53 10.13 29071.25 120.00 0.01 0.01 0.05
2011-12 6.11 228.49 4344.76 -32.58 17802.82 -38.76 0.01 0.01 0.35
ACGR % -52.8 - 3.0 - 67.2 - -41.8 -54.9 20.9
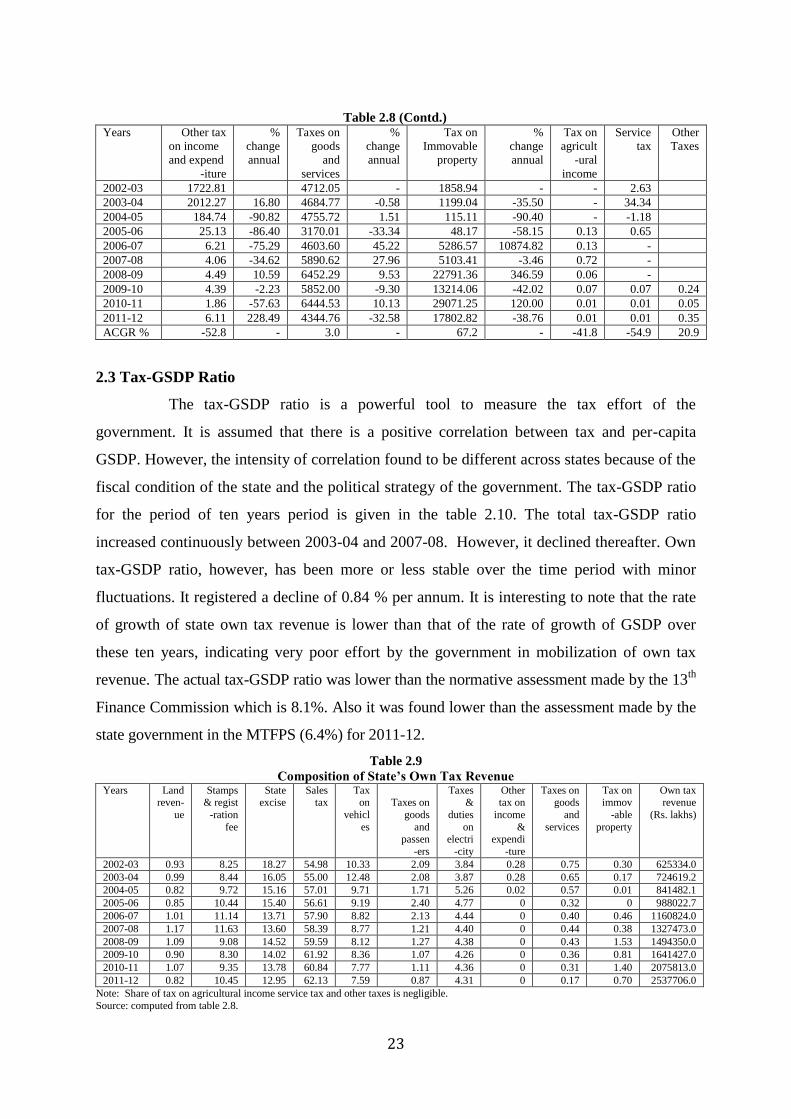
2.3 Tax-GSDP Ratio
The tax-GSDP ratio is a powerful tool to measure the tax effort of the
government. It is assumed that there is a positive correlation between tax and per-capita
GSDP. However, the intensity of correlation found to be different across states because of the
fiscal condition of the state and the political strategy of the government. The tax-GSDP ratio
for the period of ten years period is given in the table 2.10. The total tax-GSDP ratio
increased continuously between 2003-04 and 2007-08. However, it declined thereafter. Own
tax-GSDP ratio, however, has been more or less stable over the time period with minor
fluctuations. It registered a decline of 0.84 % per annum. It is interesting to note that the rate
of growth of state own tax revenue is lower than that of the rate of growth of GSDP over
these ten years, indicating very poor effort by the government in mobilization of own tax
revenue. The actual tax-GSDP ratio was lower than the normative assessment made by the 13th
Finance Commission which is 8.1%. Also it was found lower than the assessment made by the
state government in the MTFPS (6.4%) for 2011-12.
Table 2.9
Composition of State’s Own Tax Revenue Years Land
reven-
ue
Stamps & regist
-ration
fee
State excise
Sales tax
Tax on
vehicl
es
Taxes on
goods
and passen
-ers
Taxes &
duties
on electri
-city
Other tax on
income
& expendi
-ture
Taxes on goods
and
services
Tax on immov
-able
property
Own tax revenue
(Rs. lakhs)
2002-03 0.93 8.25 18.27 54.98 10.33 2.09 3.84 0.28 0.75 0.30 625334.0
2003-04 0.99 8.44 16.05 55.00 12.48 2.08 3.87 0.28 0.65 0.17 724619.2
2004-05 0.82 9.72 15.16 57.01 9.71 1.71 5.26 0.02 0.57 0.01 841482.1
2005-06 0.85 10.44 15.40 56.61 9.19 2.40 4.77 0 0.32 0 988022.7
2006-07 1.01 11.14 13.71 57.90 8.82 2.13 4.44 0 0.40 0.46 1160824.0
2007-08 1.17 11.63 13.60 58.39 8.77 1.21 4.40 0 0.44 0.38 1327473.0
2008-09 1.09 9.08 14.52 59.59 8.12 1.27 4.38 0 0.43 1.53 1494350.0
2009-10 0.90 8.30 14.02 61.92 8.36 1.07 4.26 0 0.36 0.81 1641427.0
2010-11 1.07 9.35 13.78 60.84 7.77 1.11 4.36 0 0.31 1.40 2075813.0
2011-12 0.82 10.45 12.95 62.13 7.59 0.87 4.31 0 0.17 0.70 2537706.0
Note: Share of tax on agricultural income service tax and other taxes is negligible.
Source: computed from table 2.8.

24
Table 2.10
Tax -GSDP Ratio, Rajasthan
Year
Tax -GSDP ratio
Total tax State own tax
2002-03 9.66 6.48
2003-04 8.92 5.96
2004-05 9.96 6.59
2005-06 10.67 6.95
2006-07 10.74 6.79
2007-08 11.19 6.81
2008-09 10.37 6.47
2009-10 9.66 6.17
2010-11 9.83 6.07
2011-12 9.68 6.09 Source: Budget Study (2004-05, 2006-07, 2007-08, 2009-10, 2012-13, 2013-14; p 8 & 10), Government of Rajasthan and
Economic Review, 2012-13, (p 2-4, tables of economic situation), Directorate of Economics and Statistics, Rajasthan, Jaipur.
In 2002-03 the tax-GSDP ratio was 9.66 %, which after declining in 2003-04
peaked at 11.19 % in 2007-08. It however, has fluctuated during the next three years and
stood at 9.68 % in 2011-12. The own tax-GSDP ratio has been hovering around 6 plus %
throughout. It was the lowest in 2003-04 at 5.96 and the maximum in 2005-06 at 6.95 %.
2.3.1 Measures to Improve the Tax-GSDP Ratio
During last five years state government took few steps to raise its tax-GSDP ratio.
The foremost is the introduction of VAT. There has been higher collection of tax under state
sales tax act, sale of foreign liquor and spirits, service fees, higher land tax from various
mining units, greater adjustment of notional interest on departmental commercial
undertakings and higher interest received on investment of cash balances, higher receipts on
taxes on consumption and sale of electricity, higher receipts under state motor vehicles
taxation acts, higher receipts of cess from RSMM rock phosphate, accrual of outstanding rent
from Rajasthan Vidyut Vitran Nigam Limited for last many years and higher recovery of
percentage charges, receipt of higher dividends from RIICO and Rajasthan State Mines and
Minerals Limited, higher receipts of royalty, higher sale of non-judicial stamps, fees for
registering documents, court fee and increase in DLC rates, receipts due to concession fees,
rents and royalties, recovery of old dues, receipt of cess from contractors, higher receipts
from sale of government assets and sale proceeds of waste land, higher receipts from various
water supply schemes and so on.

25
2.4 Suggestions for Enhancing the Revenue Productivity of the Tax System
Tax productivity can be raised mainly in three ways, (1) increase in tax base (2)
increase in tax efforts and (3) adoption of scientific tax collection procedure. In addition to
these administrative efficiency, control of tax evasion and tax exemption are important
measures for raising the share of tax revenue.
There are a number of reasons for the poor revenue productivity of the tax in
developing countries and also in Rajasthan, these include (i) ambiguity in ownership and poor
information and records about the properties: (ii) predominance of the informal sector in the
market for immovable properties and poor information system; (iii) low capacity, lack of
interest in reforms and high cost of tax administration in developing and transitional countries
to design and enforce the tax; (iv) Visibility of the tax and its unpopularity with the voters as
the benefits received are generally not commensurate with the tax paid, and other forms of
properties do not attract a similar tax; (v) predominance of vested interests and large scale
exemptions and concessions; (vi) arbitrary, uncertain and mysterious ways of determining the
tax base; (vii) static nature of the tax base and political difficulties in undertaking periodic
valuations; (viii) Wide discretion to the tax officers and high compliance cost associated with
the tax; (ix) to add the values of additions and improvements to properties to make the tax
base responsive to changes in the values of property in the tax base. Not surprisingly, the
actual revenue realization has not been commensurate with the potential (Rao, M.G, 2013).
The power to fix royalty on major minerals is vested with the Central Government.
The Central Government does not enhance the royalty periodically. Royalties have not been
revised for many minerals, more than three years. The Sarkaria Commission9 had
recommended revision of royalty rates at an interval of every two years. The Punchhi
Commission on Centre-State relations has also recommended that the royalty rates on major
minerals should be revised at least every three years without any delay. The Commission
has also recommended that the States should be properly compensated for any delay in the
revision of royalty beyond three years. The central government should compensate in case
revision is delayed beyond three years. This will imencely helps in revenue generation of
the state.
9 The reason often cited by the Centre that the revision is not being done on account of macroeconomic
reasons. These arguments are not tenable and the states should not be made to suffer revenue loss on
account of these considerations. As a result of undue delays in the revision of the rates at periodic
intervals, deprives the States of potential revenue.

26
Conclusion:
In conclusion, the targets laid down in the enacted state FRBM require both
increased revenue effort and expenditure control. The recent good performance of sales tax
collections and the revenue generation possibilities from oil indicate a prospect for future
revenue generation. However, in order to unleash the potential of revenue generation from
oil, the state government must encourage the establishment of the oil refinery and
petrochemical industries. The revenue potential from processed oil and its by-products is
much greater than that from simple crude oil generation. These industries will require very
large investment and special interest, which may be a great source of revenue in future.
Appendix 2.1
The heads of account under which there was substantial increase in revenue receipts during 2006-2007 as compared to
those of 2005-06 are:
Major head of account Rs.
crores
Remarks
Increase
Corporation tax 646.58 Receipt of more share of net proceeds from the
government of India
Taxes on income other than corporation
tax
249.70 Receipt of more shares of net proceeds from the
Government of India
Stamps and registration fees
261.89 The increase is due to enforcement of collection of stamp
duties
Customs 285.29 Receipt of more share of net proceeds from the government of
India
Taxes on sales, trade etc. 1127.07 The increase is due to effective enforcement of collection of
taxes
Service tax 257.73 Receipt of more share of net proceeds from the government of
India
Miscellaneous general services 222.41 Mainly due to write off the loans as per the recommendation
of XII Finance Commission
Non-ferrous mining and metallurgical
industries
382.44 Due mainly to more collection of mineral concession fees,
tents and royalties
Grants-in-aid from central
Government
871.74 Receipt of more grants from the government of India
Taxation Changes during 2006-2007: The following changes were proposed in the taxation measures in the
budget proposal.
Different sales tax laws were replaced by new VAT Act
Rakhi, kripan, puja article, chak, takhti, mudde, murmure, pattal- done, kite, handmade agarbatti, blue
pottery, puppet etc. remained outside the purview of VAT
Motor parts and its accessories, electrical and electronic goods and its accessories, tilli exempted from
entry tax
Curtailment in following taxes:
Central sales tax in auto parts and ancillaries,
Mandi tax on oilseeds,
Purchase tax on purchased of mustard by non SSI oil mills,
Central sales tax on mustard oil on sales outside to state
Purchase tax on tilli.
Increased in following taxes:

27
Entry tax on cigarettes, chirut, sugar, gutaka, pan masala, tobacco pan masala,
Tax on windmill and its accessories, optical fibre cable, polyethylene insulated jelly filled
Telecommunication cables, ceramic and glazed tiles, glass and glass sheet, all type of sanitary
goods and its fittings, pipe and pipe fittings.
Expenditure on revenue account:
Revenue expenditure during the year (Rs.24953.80 crores) as compared to that of the previous year (Rs.21499.20
crores) increased by Rs.3454.60 crores. The increase was mainly under the following heads:
Major head of Account (increase in) Rs. crores Remarks
Taxes on sales, trade etc. 68.66 Due mainly to payment of interest grant for Rajasthan
Investment Promotion Policy and upfront subsidies.
Appropriation for reduction or avoidance of
debt
350.00 Due to transfer of funds of Sinking Fund
Interest payments 491.62 Due mainly to increased payment of interest on internal
debts.
Pensions and other retirement benefits 465.61 Due mainly to more pension cases finalized
General education 263.19 Due to increased expenditure on formal education and
government secondary schools.
Medical and public health 100.34 Due mainly to increased expenditure on prevention and
control of diseases and more central assistance for
necessary medicines
Welfare of scheduled castes, scheduled
tribes and other backward classes
70.27 Due to increased expenditure on welfare of
scheduled castes and scheduled tribes
Social security and welfare 114.83 Due to increased payment of pension under social
security schemes and more expenditure for welfare
of aged, infirm and destitute.
Relief on account of natural calamities 302.05 Due to increased expenditure on relief works under flood
affected areas
Power 542.69 Due to more grants to power companies
Roads and bridges 182.74 Due to increased expenditure on maintenance of state
highways, district and other roads.
Secretariat– economic services 1109.36 Due mainly to transfer to Rajasthan Development and
Poverty Eradication Fund
Appendix 2.2
The heads of account under which there was substantial increase/ decrease in revenue receipts during 2008-09
as compared to those of 2007-08 are mentioned below:
Major head of account Increase Amount Rs. crores
Remarks
Taxes on sales, trade etc. 1153.77 More collection of tax under state sales tax Act
Grants in aid from central
government
713.81 Receipt of more non-plan grants, grant for state/ union
territory plan schemes and grants for centrally sponsored
plan schemes
State excise 364.78 More receipt from sale of foreign liquor and spirits, receipts
of more service fees
Corporation tax 244.40 More receipt under `share of net proceeds assigned to State’
Taxes on immovable property
other than agricultural land
176.88 Due to receipt of more land tax from various mining units of
Udaipur
Service tax 120.67 Due to more receipt under `share of net proceeds assigned to
state’.
Customs 108.33 More receipt under `share of net
Interest receipts 83.53 Due to more adjustment of notional interest on departmental
commercial undertakings and more interest received on
investment of cash balances.

28
Taxes on duties and electricity 69.81 Due to receipt of more taxes on consumption and sale of
electricity
Taxes on vehicles 49.16 Due to more receipt under state motor vehicles taxation Acts
Non-ferrous mining and
metallurgical industries
48.98 Due to receipt of cess from RSMM rock phosphate
Public works 40.02 Due to receipt of outstanding rent from Rajasthan Vidyut
Vitran Nigam Limited for last many years and more
recovery of percentage charges
Taxes on income other than
corporation tax
36.39 More receipt under `share of net proceeds assigned to state’.
Dividends and profits 30.72 Due to receipt of more dividends from RIICO and Rajasthan
State Mines and Minerals Limited
Major head of Account Decrease Amount Rs. crores
Remarks
Miscellaneous General Services 339.39 Decrease is because of during 2007-08 the State
Government had winded up the Sinking Fund and amount of
fund transferred to this head
Stamps and Registration Fees 187.72 Due to decrease in duty on impression of documents
Taxation Changes 2008-09: The following changes were proposed in the taxation measures in the budget
proposal:
Proposed for tax free:
Wooden hand blocks used in dying and printing; wick stove and kerosene stove; gobar gas plant and its parts;
solar stoves; karni, gurmala, sanwal, gunia, randa, coal press etc. (non electrically operated hand tool); papad
khar; kangani used in fast; stamp duty on sale of television and fridge
Curtailment in following taxes:
ACSR conductor; all types of marble and finished kota stone; entertainment tax; aviation tax; aviation spirit
(ATF); penalty on registered vehicle of outside state; stamp duty on registration of land which is more than DLC
rate; prorata tax on contract carriage vehicle permit; provision for deposit of disputed amount by the appellant in
the cases of registration and free medical facility to indoor and outdoor patient.
Increased in following tax:
Environment and health cess on royalty right; revision in minimum wages rates and sale of fruits and vegetables
by various companies.
Expenditure on revenue account: Revenue expenditure during 2008-09 (Rs.34295.60 crores) as compared to
that of 2007-08 (Rs.29127.64 crores) increased by Rs.5167.96 crores. The increased decrease was mainly under
the following heads:
Major head of account Increase Amount Rs.
crores
Remarks
General education 2212.64 Due to payment of arrears and increased pay and allowances as per
the recommendations of Sixty Pay Commission and more grant
released to Local Bodies for elementary education
Pensions and other retirement benefits 757.91 Due mainly to payment of arrears and increased pensionary
benefits
Medical and public health 504.19 Due to payment of arrears and increased pay and allowances as per
the recommendations of Sixty Pay Commission
Police 478.16 Due to payment of arrears and increased pay and allowances as
per the recommendations of Sixty Pay Commission
Water supply and sanitation 360.80 Due mainly to payment of arrears and increased pay and
allowances as per the recommendations of Sixty Pay Commission
and more expenditure on maintenance of various water supply
schemes
Other rural development programmes 314.74 Due mainly to release of more grants to gram panchayats on the
recommendation of State Finance Commission and XII Finance
Commission and more expenditure on midday meal scheme
Rural employment 310.99 Due mainly to release of more funds under National Rural
Employment Guarantee Scheme
Interest payments 281.26 Due mainly to payment of interest on internal debt and provident

29
fund as per the actual balance
Roads and bridges 217.75 Due mainly to receipt of more funds from government of India for
border road development board and execution of more
maintenance work on roads
Urban development 167.35 Due mainly to release of more grants to municipal corporations,
municipalities/municipal councils
Welfare of scheduled castes,
scheduled tribes and other backward
classes
136.45 Due to release of more funds for special component plan for
scheduled castes and payment of scholarships for welfare of
scheduled tribes as receipt of more funds from the government of
India.
Crop husbandry 134.00 Due mainly to payment of arrears and increased pay and
allowances as per the recommendations of Sixth Pay Commission
Nutrition 111.24 Due to release of more funds for nutrition as received from the
government of India
Forestry and wild life 110.52 Due mainly to payment of arrears and increased pay and
allowances as per the recommendations of Sixth Pay Commission
Relief on account of natural
calamities
110.27 Due mainly to more expenditure on flood relief works
Family welfare 93.35 Due to payment of arrears and increased pay and allowances as per
the recommendations of Sixty Pay Commission and more
expenditure on rural family welfare services
Land revenue 89.48 Due to payment of arrears and increased pay and allowances as per
the recommendations of Sixth Pay Commission
Administration of justice 84.68 Due to payment of arrears and increased pay and allowances as per
the recommendations of Sixth Pay Commission
Social security and welfare 75.48 Due mainly to payment of increased pensions under social security
schemes
District administration 74.60 Due to payment of arrears and increased pay and allowances as per
the recommendations of Sixth Pay Commission
Elections 70.79 Due to increased expenditure for conduct of elections to state and
union government
Major irrigation 65.49 Due to payment of arrears and increased pay and allowances as per
the recommendations of Sixth Pay Commission
Animal husbandry 60.96 Due to payment of arrears and increased pay and allowances as per
the recommendations of Sixth Pay Commission
Public works 46.08 Due to payment of arrears and increased pay and allowances as per
the recommendations of Sixth Pay Commission
Labour and employment 33.48 Due mainly to payment of arrears and increased pay and
allowances as per the recommendations of Sixth Pay Commission
Secretariat– general services 30.94 Due to payment of arrears and increased pay and allowances as per
the recommendations of Sixth Pay Commission
Special programmes for rural
development
29.79 Due to release of more grants to zila parishads and district level
panchayats
Minor irrigation 28.92 Due mainly to payment of arrears and increased pay and
allowances as per the recommendations of Sixth Pay Commission
Other administrative services 25.05 Due to payment of arrears and increased pay and allowances as per
the recommendations of Sixth Pay Commission
Treasury and accounts 24.72 Due to payment of arrears and increased pay and allowances as per
the recommendations of Sixth Pay Commission
Medium irrigation 22.38 Due mainly to payment of arrears and increased pay and
allowances as per the recommendations of Sixth Pay Commission
Power Decrease 1680.52 Due to less release of grants to power companies. However, during
2007-08 the state government had written off the outstanding loans
of erstwhile RSEB
Secretariat- economic services 380.05 Decrease is due to less transfer of fund to Rajasthan Development
and Poverty Eradication Fund in comparison to previous year
There is no departmentally run electricity undertaking.
Arrears in collection of water rates: As per various departments, Rs.8778.86 lakhs were pending recovery at the
end of March 2009 on account of water rates.

30
Year-wise details of arrears in following projects are (Rs. lakhs):
Projects Up to 2004-05 2005-06 2006-07 2007-08 2008-09 Total
Bhakra Nangal Project 633.57 457.96 407.19 335.84 325.33 2159.89
Indira Gandhi Nahar
Project (including CAD)
668.50 662.33 456.74 652.65 568.17 3008.39
Gang Canal 467.83 469.62 304.62 303.58 231.70 1777.3
Jawai River Project 8.25 -- 0.20 2.18 17.03 27.66
Chambal Project 868.21 125,22 127.68 131.12 110.54 1362.77
Parbati Project 25.35 2.45 0.22 -- -- 28.02
Meja Project 0.50 -- -- -- 0.10 0.60
Gudha Project 6.81 1.30 5.50 1.23 0.55 15.39
Alnia Project 2.78 -- 0.10 -- -- 2.88
Morel Project 1.90 0.42 0.70 -- 0.41 3.43
Mahi Project 307.28 42.13 43.07 -- -- 392.48
TOTAL 2990.98 1761.43 1346.02 1426.60 1253.83 8778.86
Appendix 2.3
The heads of account under which there was substantial increase/ decrease in revenue receipts during the year as
compared to those of previous year are mentioned below:
Major head of account Increase Amount
Rs. crores
Remarks
Taxes on sales, trade etc. 1153.77 More collection of tax under state sales tax act
Grants-in-aid from central
government
713.81 Receipt of more non-plan grants, grant for state plan schemes and
grants for centrally sponsored plan schemes
State excise 364.78 More receipt from sale of foreign liquor and spirits, receipts of
more service fees
Corporation tax 244.40 More receipt under share of net proceeds assigned to state
Taxes on immovable property
other than agricultural land
176.88 Due to receipt of more land tax from various mining units of
Udaipur
Service tax 120.67 Due to more receipt under share of net proceeds assigned to state
Customs 108.33 More receipt under share of net
Interest receipts 83.53 Due to more adjustment of notional interest on departmental
commercial undertakings and more interest received on
investment of cash balances
Taxes on duties and electricity 69.81 Due to receipt of more taxes on consumption and sale of
electricity
Taxes on vehicles 49.16 Due to more receipt under state motor vehicles taxation acts
Non-ferrous mining and
metallurgical industries
48.98 Due to receipt of cess from RSMM rock phosphate
Public works 40.02 Due to receipt of outstanding rent from Rajasthan Vidyut Vitran
Nigam Limited for last many years and more recovery of
percentage charges
Taxes on income other than
corporation tax
36.39 More receipt under share of net proceeds assigned to state
Dividends and profits 30.72 Due to receipt of more dividends from RIICO and Rajasthan State
Mines and Minerals Limited

31
Appendix 2.4
Own Revenue of Rajasthan (Rs in Lakh)
2002-03 2003-04 2004-05 2005-06 2006-07 2007-08 2008-09 2009-10 2010-11 2011-12
State Tax Revenue 625334 724619.2 841482.1 988022.7 1160824 1327473 1494350 1641427 2075813 2537706
Land Revenue 5797.91 7143.59 6886.11 8430.37 11671.04 15529.23 16252.05 14765.95 22216.59 20900.94
Stamps and Registration Fee 51573.33 61176.77 81782.65 103179.4 129368.3 154435.2 135663.2 136293.6 194104.5 265137.6
State Excise 114233.8 116315.5 127607.2 152180.4 159109.3 180511.9 216989.5 230047.6 286140.9 328704.8
Sales Tax 343789.9 398543.3 479753.5 559363.9 672070.5 775073.5 890450.2 1016353 1262959 1576643
Tax on Vehicles 64613.93 90430.68 81720.68 90818.22 102360.7 116439.8 121355.9 137287.1 161224.6 192705
Taxes on Goods and
Passengers 13043.65 15050.29 14401.34 23671.08 24759.65 16060.63 18986.43 17610.46 23068.81 22012.73
Taxes and Duties on Electricity 23984.99 28028.65 44276.25 47135.3 51588.3 58423.43 65404.49 69998.85 90580.75 109447.8
Other Tax on Income and Expenditure 1722.81 2012.27 184.74 25.13 6.21 4.06 4.49 4.39 1.86 6.11
Taxes on Goods and Services 4712.05 4684.77 4755.72 3170.01 4603.6 5890.62 6452.29 5852 6444.53 4344.76
Tax on Immovable Property 1858.94 1199.04 115.11 48.17 5286.57 5103.41 22791.36 13214.06 29071.25 17802.82
Tax on Agricultural Income 0 0 0 0.13 0.13 0.72 0.06 0.07 0.01 0.01
Service Tax 2.63 34.34 -1.18 0.65 0 0 0 0.07 0.01 0.01
Oher Taxes 0 0 0 0 0 0 0 0.24 0.05 0.35
Sources: Estimated from Budget Study (2004-05, 2006-07, 2007-08, 2009-10, 2012-13, 2013-14, p-10 of all
Budget Studies), Government of Rajasthan.
Appendix 2.5
Composition of State own tax revenue
As a Percentage of State
Own Tax Revenue 2002-03 2003-04 2004-05 2005-06 2006-07 2007-08 2008-09 2009-10 2010-11 2011-12
Annual
Compound
Growth Rate of proportion
Land Revenue 0.93 0.99 0.82 0.85 1.01 1.17 1.09 0.90 1.07 0.82 0.54
Stamps and Registration
Fee 8.25 8.44 9.72 10.44 11.14 11.63 9.08 8.30 9.35 10.45 1.10
State Excise 18.27 16.05 15.16 15.40 13.71 13.60 14.52 14.02 13.78 12.95 -2.88
Sales Tax 54.98 55.00 57.01 56.61 57.90 58.39 59.59 61.92 60.84 62.13 1.46
Tax on Vehicles 10.33 12.48 9.71 9.19 8.82 8.77 8.12 8.36 7.77 7.59 -4.29
Taxes on Goods and
Passengers 2.09 2.08 1.71 2.40 2.13 1.21 1.27 1.07 1.11 0.87 -9.83
Taxes and Duties on
Electricity 3.84 3.87 5.26 4.77 4.44 4.40 4.38 4.26 4.36 4.31 0.38
Other Tax on Income and
Expenditure 0.28 0.28 0.02 0.00 0.00 0.00 0.00 0.00 0.00 0.00 -59.38
Taxes on Goods and
Services 0.75 0.65 0.57 0.32 0.40 0.44 0.43 0.36 0.31 0.17 -11.26
Tax on Immovable
Property 0.30 0.17 0.01 0.00 0.46 0.38 1.53 0.81 1.40 0.70 43.96
Tax on Agricultural
Income 0.00 0.00 0.00 0.00 0.00 0.00 0.00 0.00 0.00 0.00 -49.95
Service Tax 0.00 0.00 0.00 0.00 0.00 0.00 0.00 0.00 0.00 0.00 -61.16
Other Taxes 0.00 0.00 0.00 0.00 0.00 0.00 0.00 0.00 0.00 0.00 -2.96
State Own Tax Revenue 625334 724619.2 841482.1 988022.7 1160824 1327473 1494350 1641427 2075813 2537706
Sources: Estimated from Budget Study (2004-05, 2006-07, 2007-08, 2009-10, 2012-13, 2013-14, p-10 of all Budget Studies), Government
of Rajasthan. Note: Figures in the last row is in absolute number (Rs in Lakh) which is equivalent to hundred % of the other rows of the respective
column.

32
Appendix 2.6
Annual Change in different components of State own Tax Revenue
2003-04 over
2002-03
2004-05 over
2003-04
2005-06 over
2004-05
2006-07 over
2005-06
2007-08
over 2006-07
2008-09 over
2007-08
2009-10 over
2008-09
2010-11 over
2009-10
2011-12 over
2010--11
Annual
Compound Growth Rate
of absolute
figure
State Tax Revenue 15.9 16.1 17.4 17.5 14.4 12.6 9.8 26.5 22.3 16.2
Land Revenue 23.2 -3.6 22.4 38.4 33.1 4.7 -9.1 50.5 -5.9 16.8 Stamps and Registration Fee 18.6 33.7 26.2 25.4 19.4 -12.2 0.5 42.4 36.6 17.4
State Excise 1.8 9.7 19.3 4.6 13.5 20.2 6.0 24.4 14.9 12.8
Sales Tax 15.9 20.4 16.6 20.1 15.3 14.9 14.1 24.3 24.8 17.8
Tax on Vehicles 40.0 -9.6 11.1 12.7 13.8 4.2 13.1 17.4 19.5 11.2 Taxes on Goods and Passengers 15.4 -4.3 64.4 4.6 -35.1 18.2 -7.2 31.0 -4.6 4.7 Taxes and Duties on
Electricity 16.9 58.0 6.5 9.4 13.2 11.9 7.0 29.4 20.8 16.5 Other Tax on Income
and Expenditure 16.8 -90.8 -86.4 -75.3 -34.6 10.6 -2.2 -57.6 228.5 -52.8 Taxes on Goods and Services -0.6 1.5 -33.3 45.2 28.0 9.5 -9.3 10.1 -32.6 3.0 Tax on Immovable Property -35.5 -90.4 -58.2 10874.8 -3.5 346.6 -42.0 120.0 -38.8 67.2 Tax on Agricultural
Income - - - 0.0 453.8 -91.7 16.7 -85.7 0.0 -41.8
Service Tax 1205.7 -103.4 -155.1 -100.0 - - - -85.7 0.0 -54.9
Other Taxes
-79.2 600.0 20.9
Sources: Estimated from Budget Study (2004-05, 2006-07, 2007-08, 2009-10, 2012-13, 2013-14, p-10 of all
Budget Studies), Government of Rajasthan.
Appendix 2.7
Receipt on Revenue Account (The revenue raised by the state government during 2010-11)
Major head of account- Increase Amount
Rs. crores
Remarks
Taxes on sales, trade etc. 246606.16 Due to more receipt of tax under state sales tax act and
central sales tax act
Petroleum 151979.00 Due to more receipt of royalty
Corporation tax 121477.00 Due to more receipt under share of net proceeds
assigned to state
Customs 95224.98 Due to more receipt under share of net proceeds
assigned to state
Grants- in- aid from centre 86594.13 Due to more receipt of grants from the government of
India under the state plan schemes and grants for central
plan schemes
Union excise duties 59160.00 Due to more receipt under share of net proceeds
assigned to state
Stamps and registration fees 57810.96 Due to sale of non-judicial stamps, fees for registering
documents, court fee and increase in DLC rates
State excise 56093.33 Due to more receipt from sale of foreign liquor and
spirits
Taxes on income other than
corporation tax
53297.00 Due to more receipt under share of net proceeds
assigned to state
Non- ferrous mining and
metallurgical industries
31731.91 Due to more receipt mineral, concession fees, rents and
royalties
Service tax 30421.81 Due to more receipt under share of net proceeds
assigned to state
Taxes on vehicles 23937.46 Due to increase in collection of receipts under state

33
motor vehicle taxation act
Taxes and duties on electricity 20581.90 Due to more receipt of taxes on consumption and sale of
electricity
Taxes on immovable property
other than agricultural land
15857.19 Due to old recovery of Rs.109.31 crores in 2010-11
Interest receipts 9124.32 Due to more receipt of interest from departmental
commercial undertakings and interest on investment of
cash balance
Labour and employment 8522.67 Due to receipt of cess from contractors
Land revenue 7450.64 Due to more receipt from sale of government assets and
sale proceeds of waste land
Water supply and sanitation 7258.70 Due to more receipt from various water supply schemes
Appendix: 2.8 Steps taken by the state government to address the fiscal health
2002-03 The commercial taxes department commenced computerization of its check posts.
Arrangements made for transmission of data regarding export and imports of goods from
the state to the assessing authorities through Internet. This was to help in final assessment
of tax liabilities of an assessee and prevention of revenue leakage.
Streamlining of working of registration and stamps department- a time limit for
registration of documents within 7 days of presentation was fixed. Certain documents
registered within 24 hours.
For regularization of colonies in urban areas by JDA instead of charging stamp duty on the
basis of market value for issuance of Patta (by JDA), the patttas are now being charged a
stamp duty of Rs.100 (in case of registration done prior to 31 March 2002) or on the basis
of the rental value, conversion charges, interest and penalty
A scheme for waiver of stamp duty for disposing off the pending disputed cases.
A liberal amnesty scheme announced by the state government for old recovery from excise
contractors.
Burden of RSRTC reduced by Rs.18.50 crores in 2002-03.
2003-04 With a view to address development effectiveness of all government expenditure, an
Expenditure Reforms Commission was set up and it submitted it’s in 2005.
New contributory pension introduced for employees joining service after January 1, 2004.
These employees would be provided medical insurance cover instead of reimbursement
and the long term advances for house building and conveyance would be arranged at
competitive rates through financial institutions/ banks.
The Rajasthan government passed VAT legislation and took steps to introduce it.
The commercial taxes department introduced a system of self-assessment for its dealers.
Dealers were to be categorized under the new system.
Applied unified floor rates decided by empowered committee of the state finance
ministers.
TIN issued to all registered dealers of the state.
Tax on professions, trade and callings were abolished from April 1, 2004.
50 % concession provided in stamp duty on transfer of agricultural land in favour of
women.
28 types of documents standardized for stamp duty.
A scheme of partial waiver of stamps duty and penal interest introduced to dispose of
pending disputed cases.
Entertainment tax reduced from 70 % to 50 % wef April 1, 2004.
A new composition scheme under the land and building tax act launched for better
realization of the arrears of land and building tax.
Exemption to double decker vehicles for 5 years to such vehicles registered from January
6, 2003 for one year and used for tourist purpose.
50 % rebate in road tax granted to vehicles with air conditioners and heaters.
Motor vehicle tax reduced by 1.25 % of vehicles costs subject to maximum limit of

34
Rs.25000 for loaders, dumpers, rig machines, cranes, compressors etc. used in mining
trade and industrial institutions.
2004-05 State government approached financial institutions from which it had borrowed Rs.1500
crores in the past for debt swap. The borrowed cost of capital was very high (up to 17%)
and it was crucial in the interests of prudent fiscal management to retire/ replace high cost
borrowings.
Borrowings from HDFC for on-lending for house building advances were re-priced from
weighted average cost @ 13 % to a low of 7.75 % wef March 1, 2004 and 7.5 % wef July
1, 2004. The consequential savings on the borrowing were passed on to the employees
facilitating a transition from the regime of government sponsored lending for HBA to
market linked pricing mechanism. Similar process was undertaken for LIC loans and loans
from NABARD, NCDC and HUDCO (Rs.893.90 crores). State government prepaid loans
amounting to Rs.91.61 crores to HUDCO, Rs.12.26 crores to NCDC and Rs.787.67 crores
to NABARD.
Debt swap undertaken of Rs.5798.37 crores during period commencing from 2002-03 to
2004-05 to retire borrowings @ 15 % to 12.5 % rate of interest with cheaper additional
market borrowings/ small savings loans.
Gold card scheme implemented for traders in respect of whom neither any tax nor any
case of tax evasion is pending or also deposit of at least 16 % tax more than last year.
Provisions made to expedite pending appeals.
The interest on late tax deposit reduced to 12 % from 18 %. Interest rate on refund to
traders reduced to 6 % from 8 %.
To promote registration of property through sale, donation, exchange, lease transfer and
lease for the period more than 20 days, stamp duty reduced to 8 % from 11 %.
Stamp duty reduced to 8 % from 11 % for purchase of a storey or flat in a 3 or more storied
building on first transfer or purchase from a builder or owner of the property.
2005-06
2006-07
2007-08 The expenditure on salary and wages was 43 % in 2006-07 down from 51.5 % in 2001-
02 of revenue expenditure net of interest and pension payment. It is above 35 %
recommended by 12th
Finance Commission.
Created Rajasthan Development and Poverty Alleviation Fund (Rs.100 crores).
Rajasthan Social Sector Viability Gap Fund Scheme launched.
RSEB restructured on functional lines into one generation, one transmission and three
regional distribution companies. A state Electricity Regulatory Commission was set up.
2008-09
References:
Rao, M.G, (2013): Property Tax System in India: Problems and Prospects of Reform,
Working Paper No. 2013-114 , NIPFP.
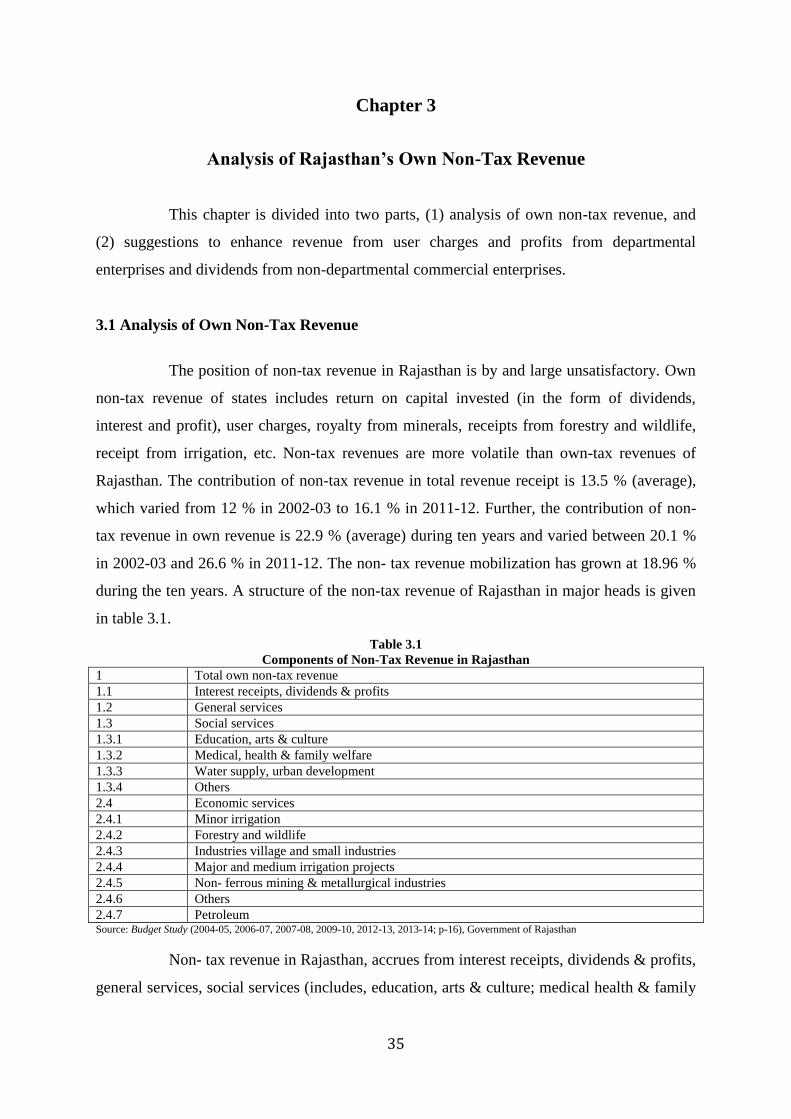
35
Chapter 3
Analysis of Rajasthan’s Own Non-Tax Revenue
This chapter is divided into two parts, (1) analysis of own non-tax revenue, and
(2) suggestions to enhance revenue from user charges and profits from departmental
enterprises and dividends from non-departmental commercial enterprises.
3.1 Analysis of Own Non-Tax Revenue
The position of non-tax revenue in Rajasthan is by and large unsatisfactory. Own
non-tax revenue of states includes return on capital invested (in the form of dividends,
interest and profit), user charges, royalty from minerals, receipts from forestry and wildlife,
receipt from irrigation, etc. Non-tax revenues are more volatile than own-tax revenues of
Rajasthan. The contribution of non-tax revenue in total revenue receipt is 13.5 % (average),
which varied from 12 % in 2002-03 to 16.1 % in 2011-12. Further, the contribution of non-
tax revenue in own revenue is 22.9 % (average) during ten years and varied between 20.1 %
in 2002-03 and 26.6 % in 2011-12. The non- tax revenue mobilization has grown at 18.96 %
during the ten years. A structure of the non-tax revenue of Rajasthan in major heads is given
in table 3.1.
Table 3.1
Components of Non-Tax Revenue in Rajasthan
1 Total own non-tax revenue
1.1 Interest receipts, dividends & profits
1.2 General services
1.3 Social services
1.3.1 Education, arts & culture
1.3.2 Medical, health & family welfare
1.3.3 Water supply, urban development
1.3.4 Others
2.4 Economic services
2.4.1 Minor irrigation
2.4.2 Forestry and wildlife
2.4.3 Industries village and small industries
2.4.4 Major and medium irrigation projects
2.4.5 Non- ferrous mining & metallurgical industries
2.4.6 Others
2.4.7 Petroleum Source: Budget Study (2004-05, 2006-07, 2007-08, 2009-10, 2012-13, 2013-14; p-16), Government of Rajasthan
Non- tax revenue in Rajasthan, accrues from interest receipts, dividends & profits,
general services, social services (includes, education, arts & culture; medical health & family

36
welfare; water supply; urban development, and other economic services), and economic
services (includes minor irrigation, forestry and wildlife, village and small industries, major
and medium irrigation projects, non- ferrous mining & metallurgical industries, petroleum
and other economic services).
Non-tax revenue constitutes 22.93 % (average of 10 years) of the total own
revenue receipts of Rajasthan. The proportion of non- tax revenue to the total own revenue
receipts has been increasing over the years. The proportion of non-tax revenue to total own
revenue receipt has increased from 20.06 % in 2002-03 to 26.55 % in 2011-12. In absolute
term, the non-tax revenue in 2002-03 was Rs.156899.78 lakhs that increased to Rs.917510.25
lakhs in 2011-12, registering an annual growth rate of 18.97 % during ten years. The
proportion of non-tax revenue to total revenue receipts in 2002-03 was 12 % in 2002-03 and
it increased to 16.09 % in 2011-12. The increase in proportion of non-tax revenue to total
own revenue receipts as well as total revenue receipts clearly shows that decline in proportion
of own tax revenue and other components of total revenue receipts.
Table 3.2
Major Sources of Non-Tax Revenue of Rajasthan (Rs. lakhs)
Year Total non-tax
revenue
Interest receipts,
dividends &
profits
General
services
Social
services
Economic
services
2002-03 156899.8 61529.2 17608.6 19552.4 58209.7
2003-04 207164.4 68755.6 47096.2 25299.5 66013.2
2004-05 214614.8 79213.0 27537.8 23429.4 84434.6
2005-06 273766.9 101278.1 48528.9 23386.6 100573.3
2006-07 343061.2 108234.4 69322.3 25535.5 139969.1
2007-08 405393.4 112509.8 115300.2 28508.4 149075.0
2008-09 388845.9 123934.5 83770.5 31304.8 149836.1
2009-10 455821.8 122271.8 101571.3 35568.9 196409.8
2010-11 629412.4 129745.7 59456.6 52549.2 387660.9
2011-12 917510.3 177211.0 73070.4 56783.6 610445.3
ACGR% Source: Budget Study (2004-05, 2006-07, 2007-08, 2009-10, 2012-13, 2013-14; p-16), Government of Rajasthan
A major share of non-tax revenue accrues from economic services. It was
Rs.582.10 crores in 2002-03 and stood at Rs.6104.45 crores in 2011-12. The share of
economic services to the non- tax revenue fluctuated between 2002-03 and 2008-09.
However, it started rising after 2009-10 at a significant rate due to increase in the production
of crude oil which was added as an additional source of revenue. The per capita non-tax
revenue in Rajasthan is expected to grow over time. The per-capita figure, increased from
Rs.268.3 in 2002-03 to Rs.1315.7 in 2011-12.
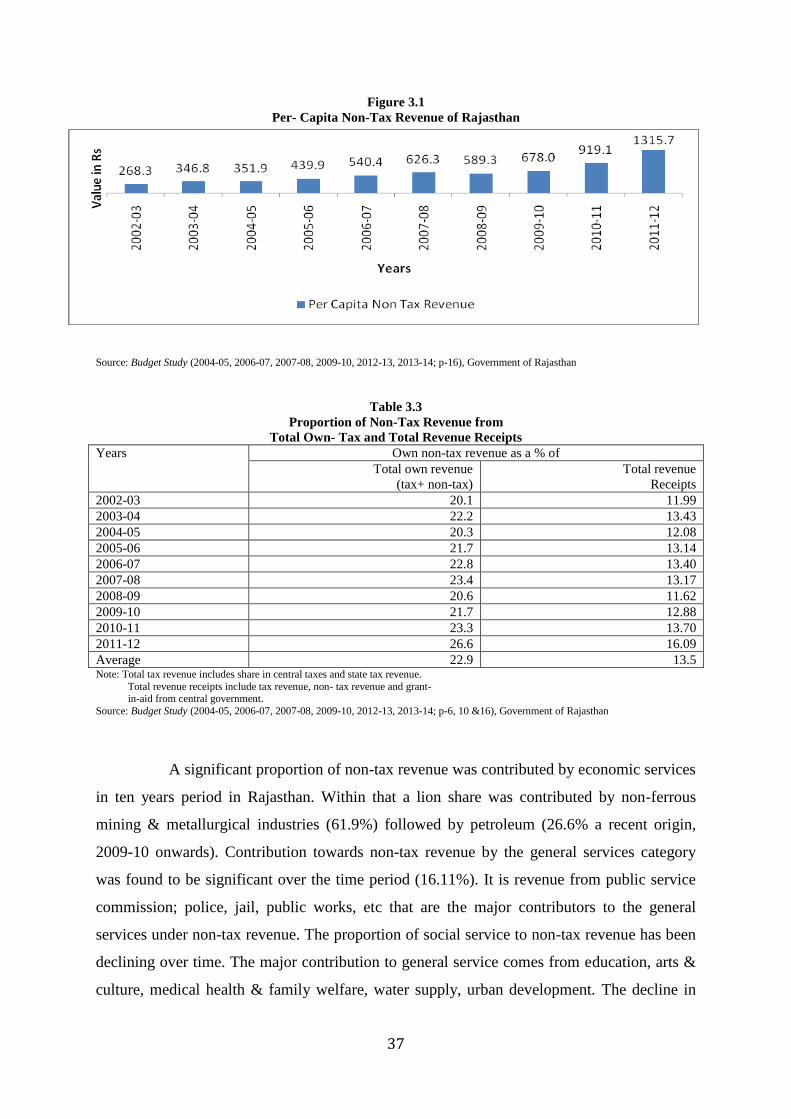
37
Figure 3.1
Per- Capita Non-Tax Revenue of Rajasthan
Source: Budget Study (2004-05, 2006-07, 2007-08, 2009-10, 2012-13, 2013-14; p-16), Government of Rajasthan
Table 3.3
Proportion of Non-Tax Revenue from
Total Own- Tax and Total Revenue Receipts
Years Own non-tax revenue as a % of
Total own revenue
(tax+ non-tax)
Total revenue
Receipts
2002-03 20.1 11.99
2003-04 22.2 13.43
2004-05 20.3 12.08
2005-06 21.7 13.14
2006-07 22.8 13.40
2007-08 23.4 13.17
2008-09 20.6 11.62
2009-10 21.7 12.88
2010-11 23.3 13.70
2011-12 26.6 16.09
Average 22.9 13.5 Note: Total tax revenue includes share in central taxes and state tax revenue.
Total revenue receipts include tax revenue, non- tax revenue and grant- in-aid from central government.
Source: Budget Study (2004-05, 2006-07, 2007-08, 2009-10, 2012-13, 2013-14; p-6, 10 &16), Government of Rajasthan
A significant proportion of non-tax revenue was contributed by economic services
in ten years period in Rajasthan. Within that a lion share was contributed by non-ferrous
mining & metallurgical industries (61.9%) followed by petroleum (26.6% a recent origin,
2009-10 onwards). Contribution towards non-tax revenue by the general services category
was found to be significant over the time period (16.11%). It is revenue from public service
commission; police, jail, public works, etc that are the major contributors to the general
services under non-tax revenue. The proportion of social service to non-tax revenue has been
declining over time. The major contribution to general service comes from education, arts &
culture, medical health & family welfare, water supply, urban development. The decline in

38
the share of social services over the time period in the non-tax revenue of Rajasthan is due to
decline in the contribution of water supply and urban development sector, which had been the
major source of revenue generation of the social services. The state has not shown much
interest in levying house tax, a main urban tax. It had abolished octroi.
Table 3.4
Major Components of Non-Tax Revenue: Rajasthan (%)
Year
Interest receipts,
dividends & profits
General
services
Social
services
Economic
Services
2002-03 39.22 11.22 12.46 37.10
2003-04 33.19 22.73 12.21 31.87
2004-05 36.91 12.83 10.92 39.34
2005-06 36.99 17.73 8.54 36.74
2006-07 31.55 20.21 7.44 40.80
2007-08 27.75 28.44 7.03 36.77
2008-09 31.87 21.54 8.05 38.53
2009-10 26.82 22.28 7.80 43.09
2010-11 20.61 9.45 8.35 61.59
2011-12 19.31 7.96 6.19 66.53
Average 27.17 16.11 8.06 48.66 Source: Budget Study (2004-05, 2006-07, 2007-08, 2009-10, 2012-13, 2013-14; p-16), Government of Rajasthan
Revenue generation under different heads of non-tax revenue in Rajasthan has
shown a positive growth except one indicator (minor irrigation). The receipts from interest,
dividend and profit have increased from Rs.61529.17 lakhs in 2002-03 to Rs.177211 lakhs in
2011-12. Revenue generation under all the components of non- tax revenue has increased.

39
Table:3.5
Non-tax Revenue: Rajasthan (Rs in Lakh)
Interest receipts,
dividends
&Profits
General
Services
Education,
Arts
&culture
Medical Health
&Family
Welfare
Water supply,
Urban
Development
other_
social
services
Minor
irrigation
Forestry
and wildlife
Industries village
and small
industries
Major and medium
irrigation
Projects
Non – Ferrous
Mining
& Metallurgic
al
industries
Others_
economic
Services Petroleum
2002-03 61529.17 17608.57 1732.84 2269.01 14958.78 591.72 2672.83 4163.02 76.97 2074.03 44937.67 4285.17 0
2003-04 68755.56 47096.15 7881.14 1639.92 15140.98 637.44 1823.15 3953.29 112.14 4323.38 51369.59 4431.69 0
2004-05 79212.97 27537.75 2899.31 3002.69 16976.3 551.13 2606.73 3941.08 63.86 5649.81 64534.63 7638.49 0
2005-06 101278.1 48528.85 2461.92 1703.18 18454.43 767.09 1842.11 4007.08 96.59 4679.18 81408.07 8540.28 0
2006-07 108234.4 69322.26 3170.8 3087.47 18575.26 701.96 1537.27 4523.98 300.4 6056.26 119651.7 7899.49 0
2007-08 112509.8 115300.2 2722.88 3969.02 20790.59 1025.95 1360.65 5829.98 467.87 5791.7 122661.3 12963.67 0
2008-09 123934.5 83770.5 4452.31 3715.78 22072.99 1063.73 1735.91 5773.63 139.44 5415.78 127559.5 9211.88 0
2009-10 122271.8 101571.3 3911.88 5683.29 24581.81 1391.91 2261.55 5635.42 760.39 4883.27 161225.9 11049.73 10593.58
2010-11 129745.7 59456.64 5914.98 4568.67 31768.29 10297.25 1786.72 9320.07 487.66 8604.3 192957.8 11475.63 163028.7
2011-12 177211 73070.36 5926.49 5956.73 27755.13 17145.26 1804.08 7494.92 437.41 9182.93 236631.9 11332.91 343561.2
Growth Rate 10.68 15.03 7.69 14.01 8.37 40.25 -2.81 9.16 27.32 11.45 20.06 11.57 469.73
Sources: Estimated from Budget Study (2004-05, 2006-07, 2007-08, 2009-10, 2012-13, 2013-14, p-16 of all Budget Studies), Government of Rajasthan

40
Table 3.6
Non-tax Revenue, Rajasthan (% increase over the previous year) Sources 2003-04 2004-05 2005-06 2006-07 2007-08 2008-09 2009-10 2010-11 2011-12
Interest receipts,
dividends & profits 11.74 15.21 27.86 6.87 3.95 10.15 -1.34 6.11 36.58
General services 167.46 -41.53 76.23 42.85 66.32 -27.35 21.25 -41.46 22.90
Education, arts & culture 354.81 -63.21 -15.09 28.79 -14.13 63.51 -12.14 51.21 0.19
Medical health
& family welfare -27.73 83.10 -43.28 81.28 28.55 -6.38 52.95 -19.61 30.38
Water supply,
urban development 1.22 12.12 8.71 0.65 11.93 6.17 11.37 29.23 -12.63
Other social
Services 7.73 -13.54 39.18 -8.49 46.16 3.68 30.85 639.79 66.50
Minor irrigation -31.79 42.98 -29.33 -16.55 -11.49 27.58 30.28 -21.00 0.97
Forestry and wildlife -5.04 -0.31 1.67 12.90 28.87 -0.97 -2.39 65.38 -19.58
Village and small
industries 45.69 -43.05 51.25 211.01 55.75 -70.20 445.32 -35.87 -10.30
Major and medium
irrigation projects 108.45 30.68 -17.18 29.43 -4.37 -6.49 -9.83 76.20 6.72
Non- ferrous mining
& metallurgical
Industries 14.31 25.63 26.15 46.98 2.52 3.99 26.39 19.68 22.63
Other economic services 3.42 72.36 11.81 -7.50 64.11 -28.94 19.95 3.85 -1.24 Petroleum 1438.94 110.74
Sources: Estimated from Budget Study (2004-05, 2006-07, 2007-08, 2009-10, 2012-13, 2013-14, p-16 of all Budget Studies), Government
of Rajasthan
3.2 Suggestions to Enhance Revenue from User Charges and Profits from
Departmental Enterprises and Dividends from Non-Departmental Commercial
Enterprises
User charges in irrigation are based on recommended/ desirable quantity of water
by crop type per unit of area cultivated. There is reason to believe that water drawn exceeds
recommended levels. Most irrigated farms utilize the flooding technique that fosters overuse
of water. Wherever feasible, adoption of improved methods of irrigation must be encouraged.
Assessment of water charges must also acknowledge irrigation techniques adopted.
Feasibility study of extending capital subsidy to switch to water-conserving methods must be
done.
Of the components of non-tax revenue, ‘interest receipts, dividends & profits’
accounts for the largest share i.e. 7.9 % during 2002-03. This has declined to 5.1% during
2011-12 due to inefficiency in commercial enterprises. The interest, dividends and profits
can be increased by increasing the efficiency of the administration of the commercial
enterprises.
Royalty rates on some minerals are determined by the Centre, not by state
governments. However, a number of revenue-generating measures are possible at state level.
Control of unauthorized mining would not only yield higher revenues with the current tariff

41
structure, but would help conserve mineral resources of the state. The scope for non-tax
revenue from oil and gas is enormous but may not be realized in the next five years because
of long gestation period of this Industry. There are some issues with respect to equal
treatment of NELP and Joint Venture blocks, which fall within the discretionary jurisdiction
of the Central government, and have important implications for the non-tax revenues of a
state like Rajasthan.
Appendix 3.1
Share of Non-Tax Revenue
2002-
03
2003-
04
2004-
05
2005-
06
2006-
07
2007-
08
2008-
09
2009-
10
2010-
11
2011-
12
% of Non -Tax Revenue to own
revenue 20.1 22.2 20.3 21.7 22.8 23.4 20.6 21.7 23.3 26.6
Share of components of Non-Tax Revenue to own revenue
Interest receipts dividends
&Profits 7.9 7.4 7.5 8.0 7.2 6.5 6.6 5.8 4.8 5.1
General Services 2.3 5.1 2.6 3.8 4.6 6.7 4.4 4.8 2.2 2.1
Social Services 2.5 2.7 2.2 1.9 1.7 1.6 1.7 1.7 1.9 1.6
Education, Arts &culture 0.2 0.8 0.3 0.2 0.2 0.2 0.2 0.2 0.2 0.2
Medical Health &Family Welfare 0.3 0.2 0.3 0.1 0.2 0.2 0.2 0.3 0.2 0.2
Water supply,Urban Development 1.9 1.6 1.6 1.5 1.2 1.2 1.2 1.2 1.2 0.8
other 0.1 0.1 0.1 0.1 0.0 0.1 0.1 0.1 0.4 0.5
Economic services 7.4 7.1 8.0 8.0 9.3 8.6 8.0 9.4
14.
3
17.
7
Minor irrigation 0.3 0.2 0.2 0.1 0.1 0.1 0.1 0.1 0.1 0.1
Forestry and wildlife 0.5 0.4 0.4 0.3 0.3 0.3 0.3 0.3 0.3 0.2
Industries village and small
industries 0.0 0.0 0.0 0.0 0.0 0.0 0.0 0.0 0.0 0.0
Major and medium irrigation
Projects 0.3 0.5 0.5 0.4 0.4 0.3 0.3 0.2 0.3 0.3
Non - Ferrous Mining &
Metallurgical industries 5.7 5.5 6.1 6.5 8.0 7.1 6.8 7.7 7.1 6.8
Others 0.5 0.5 0.7 0.7 0.5 0.7 0.5 0.5 0.4 0.3
Petroleum 0.0 0.0 0.0 0.0 0.0 0.0 0.0 0.5 6.0 9.9 Source: Budget Study (2004-05, 2006-07, 2007-08, 2009-10, 2012-13, 2013-14; p-10 &16), Government of Rajasthan.

42
Chapter 4
Trend in Expenditure Pattern in Rajasthan
4.1 Introduction
Expenditure plays an important role for the economic development of the country.
It is because the revenue generation depends on the investment through the multiplier effect.
However the pattern of investment should be productive. In this context this chapter analyses
the expenditure pattern in Rajasthan.
4.2 Expenditure Pattern
In 2002-03, 67.7 % of total state expenditure was met out from revenue receipts,
which increased to 91.2 % in 2011-12. This indicates the increasing strength of the state’s
fiscal health. Rajasthan is slowly becoming less dependent on borrowed funds. Further,
Rajasthan in 2002-03 met 76.9 % of the basic needs from its own capacity has registered
herself a revenue surplus state by 20011-12. This indicates that the fiscal status of the state
has been improving and is in a stable state now. Total expenditure of Rajasthan has grown as
an annual rate of 13.39 %. In 2002-03 the total expenditure was Rs.19321.12 crores that
increased to Rs.61881.66 crores in 2011-12.
A further look at the expenditure gives some interesting features as per the
composition of expenditure pattern is concerned. The total expenditure has been decomposed
into revenue and capital account expenditures. Each component is further subdivided into
developmental and non-developmental expenditures. Further each component of
developmental and non-developmental expenditures is sub-divided into plan and non-plan
expenditures. The revenue account expenditures indicate the consumption expenditures of the
government while the capital account expenditures include the investment expenditures as
well as the repayment of loans. The developmental expenditures include the expenditures for
the developmental programmmes. The expenditures on the maintenance of law and order and
other administrative expenditures and fiscal services, interest payment and pension are non –
developmental expenditures. The plan expenditures are expenditures for the plan projects

43
while the expenditures on the maintenance of completed plan projects are non-plan
expenditures.
4.2.1 Revenue Expenditures
The revenue expenditures consist of expenditures on social, economic services,
organ of state, interest payment and debt services, administrative services, pension,
miscellaneous general services and contributions to the local governments. The revenue
expenditure has grown at a faster rate (13.95%) than the capital expenditure (10.29%) during
2002-03 and 2011-12. The proportion of revenue expenditure to total expenditure was 88.07
% in 2002-03 and it declined to 82.11 % in 2003-04 and continued to remain above 81 % till
2007-08. However, it further increased to 86.7 % in 2011-12 with fluctuations in between
(see Table 4.1). Overall the proportion of revenue expenditure to total expenditure registered
an annual rate of growth of 0.42 % over the ten years period. On the other hand, the
proportion of capital expenditure to the total expenditure has declined at an annual rate of
2.63 %.
Table 4.1
Total Revenue and Capital Expenditure (Rs. lakhs)
Total Revenue and Capital Expenditure Out of total expenditure
% of
Year Total
revenue
expend
-iture
%
annual
change
Total
capital
expend
-iture
%
annual
change
Total
expend
-iture
%
annual
change
Revenue
expend
-iture
Capital
expend
-iture
2002-03 1701578 - 230534 - 1932112 - 88.07 11.93
2003-04 1884829 10.77 410635 78.12 2295464 18.81 82.11 17.89
2004-05 1990618 5.61 412803 0.53 2403421 4.70 82.82 17.18
2005-06 2149921 8.00 472866 14.55 2622787 9.13 81.97 18.03
2006-07 2495379 16.07 512202 8.32 3007581 14.67 82.97 17.03
2007-08 2912765 16.73 684324 33.60 3597089 19.60 80.98 19.02
2008-09 3429560 17.74 624001 -8.81 4053561 12.69 84.61 15.39
2009-10 4013220 17.02 567254 -9.09 4580474 13.00 87.62 12.38
2010-11 4487335 11.81 551273 -2.82 5038608 10.00 89.06 10.94
2011-12 5365331 19.57 822835 49.26 6188166 22.81 86.70 13.30
ACGR % 13.95 10.29 13.39 0.42 -2.63 Source: Estimated from www.rbi.org.in Dated-30-10-2013), [Occasional Publication, Handbook of Statistics on State Government Finances,
2010 (2002-03 to 2007-08) and Annual Publication, State Finances: A Study of Budgets (2008-09, 2009-10 & 2010-11), and Finance
Accounts, Government of Rajasthan, Comptroller and Auditor General of India (2011-12).
4.2.2 Capital Expenditure
Capital expenditure is a combination of (1) total capital outlay (2) loan and
advances by state government (3) discharge of internal debt as well as central loans (4)
contingency fund and (5) public account. It has grown at an annual rate of 10.29 % during the
ten-year period. Capital expenditure was Rs.2305.34 crores in 2002-03 and it stood at
44
Rs.8228.35 crores in 2011-12. The increase in capital expenditure was contributed by
increase in expenditure on (1) different heads of capital outlay and (2) loans and advances by
state governments. Expenditure on capital outlay constituted around 90 % (average) of the
total capital expenditure and it has grown an annual rate of 11.6 %. On the other hand, the
loans and advances by state government have grown at the rate of 0.94 %.
4.2.2.1 Capital Outlay
The increasing expenditure on capital outlay has been mostly contributed by
expenditure on development heads, which is a significant proportion (97.71%) of capital
outlay. The proportion of developmental expenditure to total capital outlay has been more or
less constant over the ten years with little fluctuation (it was 84.98% in 2007-08).
Expenditure on development heads constitutes (1) expenditure on social services and (2)
expenditure on economic services. Over the year, on an average, the state has spent 42.78 %
of the developmental expenditure on social services and 57.22 % on economic services.
However, in absolute terms the expenditure on economic services has grown at an annual rate
of 13.04 % and social services at 9.68 % rate. This implies an effort was towards providing a
boost for the growth of the GSDP of the state.
It is interesting to note that over the period, 99.7% of the loans and advances by
state government have been earmarked for developmental purpose.
4.2.3 Plan and Non- Plan Expenditure
As discussed above the revenue expenditure, which is a major share of total
expenditure, has grown at an annual rate of 13.95%. The plan and non-plan revenue
expenditure have registered an annual rate of growth of 20.63% and 12.63% respectively.
The proportion of plan revenue expenditure to total revenue expenditure, which was 13.35%
during 2002-03, has increased to 22.64% during 2011-12. It grew at an annual rate of 5.92 %.
The non-plan expenditure, which is a major share of the total expenditure, has declined at an
annual rate of 1.14% over the period.

45
Table 4.2
Total Revenue Expenditure (Rs. lakhs)
Years Revenue expenditure Out of total revenue
expenditure % of
Plan %
annual
change
Non-plan %
annual
change
Total
%
annual
change
Plan
Revenue
expend
-iture
Non-plan
revenue
expend
-iture
2002-03 227215 - 1474363 - 1701578 - 13.35 86.65
2003-04 223119 -1.80 1661710 12.71 1884829 10.77 11.84 88.16
2004-05 274195 22.89 1716423 3.29 1990618 5.61 13.77 86.23
2005-06 313153 14.21 1836767 7.01 2149921 8.00 14.57 85.43
2006-07 380012 21.35 2115367 15.17 2495379 16.07 15.23 84.77
2007-08 513367 35.09 2399398 13.43 2912765 16.73 17.62 82.38
2008-09 577061 12.41 2852499 18.88 3429560 17.74 16.83 83.17
2009-10 628689 8.95 3384530 18.65 4013220 17.02 15.67 84.33
2010-11 875266 39.22 3612068 6.72 4487335 11.81 19.51 80.49
2011-12 1214883 38.20 4150448 14.91 5365331 19.57 22.64 77.36
ACGR % 20.63 12.63 13.95 5.92 -1.14 Source: same as table 4.1.
The plan capital expenditure in 2002-03 was Rs.2145.25 crores and stood at
Rs.7153.96 crores in 2011-12, recording a growth rate of 10.41 %. On the other hand, the
non-plan capital expenditure has grown at an annual rate of 16.88 %. The proportion of plan
capital expenditure to capital expenditure, which is a significant proportion, recorded a
growth rate of 0.15 % whereas the proportion of non-plan capital expenditure to total capital
expenditure, which varied between 2 and 13 % during the ten years, registered an annual rate
of growth of 5.58 %.
Table: 4.3
Total Capital Expenditure (Rs. lakhs) Years Capital expenditure Out of total capital
expenditure % of Plan %
annual
change
Non-
Plan
% annual
change
Total
%
annual
change
Plan
capital
expendi
-ture
Non-plan
capital
expend
-iture 2002-03 214525 - 16009 - 230534 - 93.06 6.94 2003-04 398041 85.55 12594 -21.33 410635 78.12 96.93 3.07 2004-05 402108 1.02 10695 -15.08 412803 0.53 97.41 2.59 2005-06 463609 15.29 9257 -13.45 472866 14.55 98.04 1.96 2006-07 496525 7.10 15677 69.35 512202 8.32 96.94 3.06 2007-08 585370 17.89 98954 531.20 684324 33.60 85.54 14.46 2008-09 641950 9.67 -17949 -118.14 624001 -8.81 102.88 -2.88 2009-10 628183 -2.14 -60928 -239.45 567254 -9.09 110.74 -10.74 2010-11 541980 -13.72 9294 -115.25 551273 -2.82 98.31 1.69
2011-12 715396 32.00 107439 1056.00 822835 49.26 86.94 13.06 ACGR % 10.41 16.88 10.29 0.15 5.58
Source: same as table 4.1.

46
Table 4.4
Annual Compound Growth Rate of Major Heads of Capital Expenditure (2002-03/2011-12)
Items Plan Non-plan Total
Capital expenditure (total capital outlay + loan and advances by state
govt) 10.41 16.88 10.29
I. Total capital outlay 12.32 -12.07 11.60
1. Developmental 12.18 -15.40 11.92
(a) Social services 10.44 -15.40 9.68
(b) Economic services 13.04 -5.79 13.04
2. Non-developmental (general services) 18.59 -4.28 20.59
II. Loans and advances by state governments -13.85 14.35 0.94
1. Developmental purposes -13.85 15.48 1.15
a) Social services 49.52 -4.38 6.47
b) Economic services -22.30 36.41 -1.98
2. Non-developmental purposes - -71.47 -71.47
a) Government servants (other than housing) - -71.47 -71.47 Source: same as table 4.1.
The increase in total revenue expenditure is contributed by the increase or
decrease in (1) developmental expenditure, (2) non- developmental expenditure and, (3)
grant-in-aid contribution.
4.2.4 Developmental and Non-Developmental Expenditure
Developmental expenditure is a major component (60.8%) of total revenue
expenditure and has grown at an annual rate of 15.99 %. It has significant bearing on the
increase in the revenue expenditure of the state. Expenditure on social services and economic
services, two components of developmental expenditure have grown at the annual rate of
15.16 % and 17.56 % respectively during this period. More significantly the 15.16 % rate of
growth of expenditure on social service10
, which is a significant component (63.97% average)
of the developmental expenditure, pushed the revenue developmental expenditure to grow
faster. Higher expenditure on social front clearly indicates the welfare nature of the state. On
the other hand, expenditure on economic services11
, which has direct bearing on the GSDP,
which is 36.03 % of developmental expenditure, has been grown at an annual rate of 17.56
%.
10 Expenditure on social service includes expenditure on (1) education, sports, art and culture, (2) medical and
public health, (3) family welfare, (4) water supply and sanitation, (5) housing, (6) urban development, (7) welfare of scheduled castes, scheduled tribes and other backward classes, (8) labour and labour welfare, (9) social security and welfare, (10) nutrition, (11) relief on account of natural calamities and (12) others.
11 (1) agriculture and allied activities, (2) rural development, (3) special area programmes, (4) irrigation and flood control, (5) energy, (6) industry and minerals, (7) transport and communications, (8) science, technology and environment, (9) general economic services.

47
The expenditure under the head of non-developmental expenditure has been
growing at an annual rate of 10.79 %. The non-developmental expenditure was Rs.7645.49
crores in 2002-03 and it went up to Rs.18708.51 crores in 2011-12. However, the proportion
of non-developmental expenditure to total expenditure has reduced from 44.93 % in 2002-03
to 34.87 % in 2011-12, implying transferring of share towards developmental expenditure12
.
The 10.79 % annual rate of growth of non- developmental expenditure has significantly
contributed by the increase in expenditure on interest payments and servicing of debt’. No
doubt this component has registered a growth rate of 6.49 %, which is low as compared to
other components under the non- developmental expenditure but the proportion (50.23%) of
this component is significant. In addition to it, the increasing non- developmental expenditure
contributed by increasing expenditure on administrative services and pensions services.
These components of non-developmental expenditure are 15.93 % and 25.88 % of non-
developmental expenditure have increased at an annual rate of 14.64 % and 17.31 %
respectively.
Table 4.5
Annual Compound Growth Rate of Major Heads of Revenue Expenditure (2002-03 to 2011-12)
Items Plan Non-plan Total
Total revenue expenditure (I+II+III) 20.63 12.63 13.95
I. Developmental expenditure 20.47 14.32 15.99
A. Social services 20.77 13.75 15.16
B. Economic services 20.45 15.54 17.56
II. Non-developmental expenditure (general services) 25.63 10.73 10.79
A. Organs of state 18.92 14.88 15.16
B. Fiscal services 68.60 5.96 9.44
C. Interest payments and servicing of debt - 6.49 6.49
D. Administrative services -0.44 14.97 14.64
E. Pensions - 17.31 17.31
F. Miscellaneous general services - 51.07 51.07
III. Grants-in-aid and contributions - 85.80 85.80 Source: same as table 4.1.
4.3 Suggestions for improvement in the composition of expenditures pattern:
(1) It has been observed that the share of revenue expenditure is significant proportion of
total expenditure of the state. Apart from this it has reported a higher rate of growth
than that of capital expenditure. This indicates limited possibilities for future revenue
generation and further capital investment. In this juncture the state should either
increase its own revenue potential to cover the increased revenue expenditures
12 The share of expenditure on grants-in-aid and contributions is very low (varied between 0.001% in 2002-03 to
0.51% in 2011-12).

48
through measures as mentioned in earlier chapter or control the wasteful revenue
expenditures or the combination of both.
(2) The generated revenue surplus should be invested in those projects which would
inject income into the state through multiplier effect.
(3) The non-plan expenditures have increased at lower pace than the plan expenditures. It
will lead to maintenance of the same level of output in the state. To increase the level
of output both the plan and non-plan expenditures should be increased at more or less
same rate.
(4) Developmental expenditures should be given more priority than the non-
developmental expenditures.

49
Chapter 5
Analysis of Deficits in Rajasthan
5.1 Introduction
This chapter is divided into two parts, (1) analysis of deficits both revenue and
fiscal, and (2) balance of current revenues for plan financing. It is well accepted that by the end
of the last century, fiscal balances and indicators thereof in most of the Indian states had
reached disturbing levels. In order to restore fiscal discipline both at central and state
governments agreed to abide by fiscal rules. As a result, the Fiscal Responsibility and Budget
Management Act (FRBMA) were passed in parliament in 2003. It was observed that few states
immediately started following the readymade Act immediately after its commencement.
However, a group of other states came up with their own version of FRBM Act soon after the
incentive declaration by the 12th
Union Finance Commission. The main objectives of the
legislations were to eliminate revenue deficits and reduce fiscal deficit to or below 3 % of GDP.
5.2 Analysis of Revenue and Fiscal Deficits
Revenue deficit is the difference between the total revenue receipts and total
revenue expenditures per time period. It indicates the lack of revenue generation capacity of the
government. Fiscal deficit is the sum of indebtness of the government during a particular period
of time. Primary deficit is defined as the non-interest deficit i.e., gross fiscal deficit net of
interest payments. The significance of primary deficit is that it indicates the extent of
discretionary fiscal changes. Persistence of a higher level of primary deficit has implications for
future growth in debt ratio and debt burden of states. A down ward trend in primary deficit
signifies move towards sustainable fiscal balance. Governments at the provincial level are
faced with mounting difficulties in curtailing expenditure, especially, states like Rajasthan. In
terms of geographical area, Rajasthan is the largest among 28 states and union 7 territories in
India and faces severe cost disabilities in provisioning for minimum (desirable) public
services13
. Figure 5.1 depicts the narrow gap between own revenue and expenditure, which is
13 Rajasthan has 5.5% India’s population and the state covers 10.41 percent of the total land area of the country. The
density of population (as per 2001 census) is 165 and is the lowest among all non-special category states.
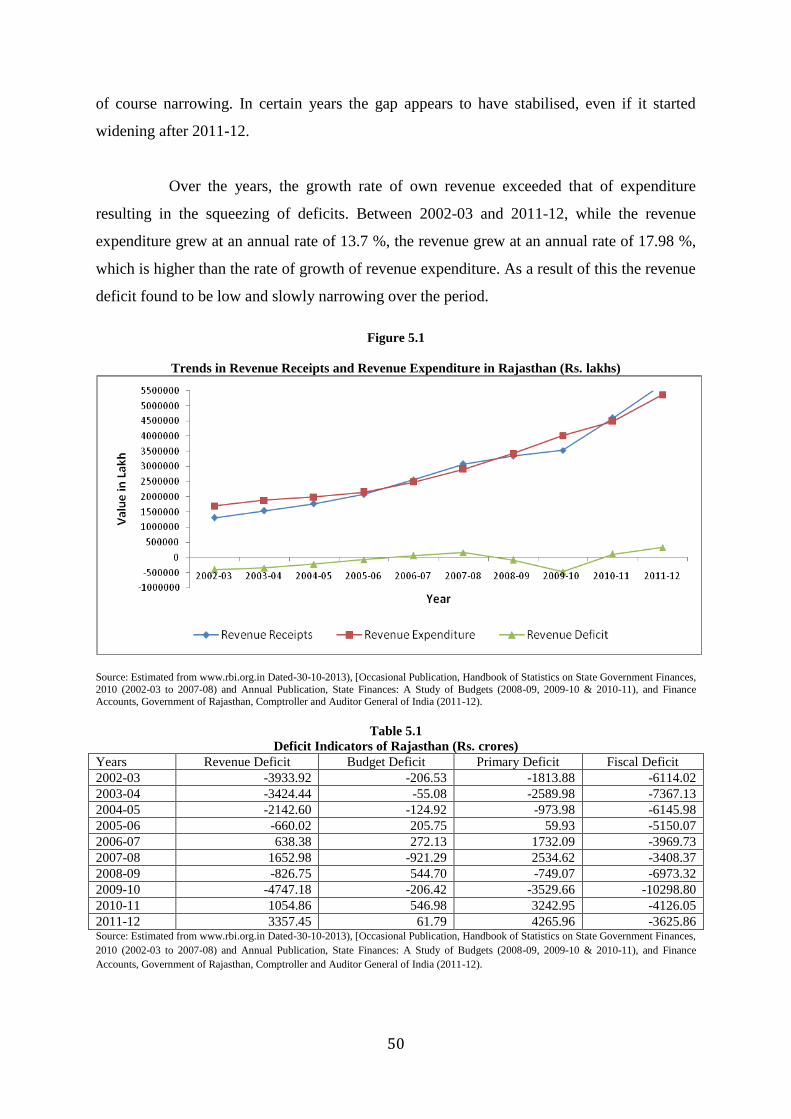
50
of course narrowing. In certain years the gap appears to have stabilised, even if it started
widening after 2011-12.
Over the years, the growth rate of own revenue exceeded that of expenditure
resulting in the squeezing of deficits. Between 2002-03 and 2011-12, while the revenue
expenditure grew at an annual rate of 13.7 %, the revenue grew at an annual rate of 17.98 %,
which is higher than the rate of growth of revenue expenditure. As a result of this the revenue
deficit found to be low and slowly narrowing over the period.
Figure 5.1
Trends in Revenue Receipts and Revenue Expenditure in Rajasthan (Rs. lakhs)
Source: Estimated from www.rbi.org.in Dated-30-10-2013), [Occasional Publication, Handbook of Statistics on State Government Finances,
2010 (2002-03 to 2007-08) and Annual Publication, State Finances: A Study of Budgets (2008-09, 2009-10 & 2010-11), and Finance Accounts, Government of Rajasthan, Comptroller and Auditor General of India (2011-12).
Table 5.1
Deficit Indicators of Rajasthan (Rs. crores)
Years Revenue Deficit Budget Deficit Primary Deficit Fiscal Deficit
2002-03 -3933.92 -206.53 -1813.88 -6114.02
2003-04 -3424.44 -55.08 -2589.98 -7367.13
2004-05 -2142.60 -124.92 -973.98 -6145.98
2005-06 -660.02 205.75 59.93 -5150.07
2006-07 638.38 272.13 1732.09 -3969.73
2007-08 1652.98 -921.29 2534.62 -3408.37
2008-09 -826.75 544.70 -749.07 -6973.32
2009-10 -4747.18 -206.42 -3529.66 -10298.80
2010-11 1054.86 546.98 3242.95 -4126.05
2011-12 3357.45 61.79 4265.96 -3625.86 Source: Estimated from www.rbi.org.in Dated-30-10-2013), [Occasional Publication, Handbook of Statistics on State Government Finances,
2010 (2002-03 to 2007-08) and Annual Publication, State Finances: A Study of Budgets (2008-09, 2009-10 & 2010-11), and Finance
Accounts, Government of Rajasthan, Comptroller and Auditor General of India (2011-12).
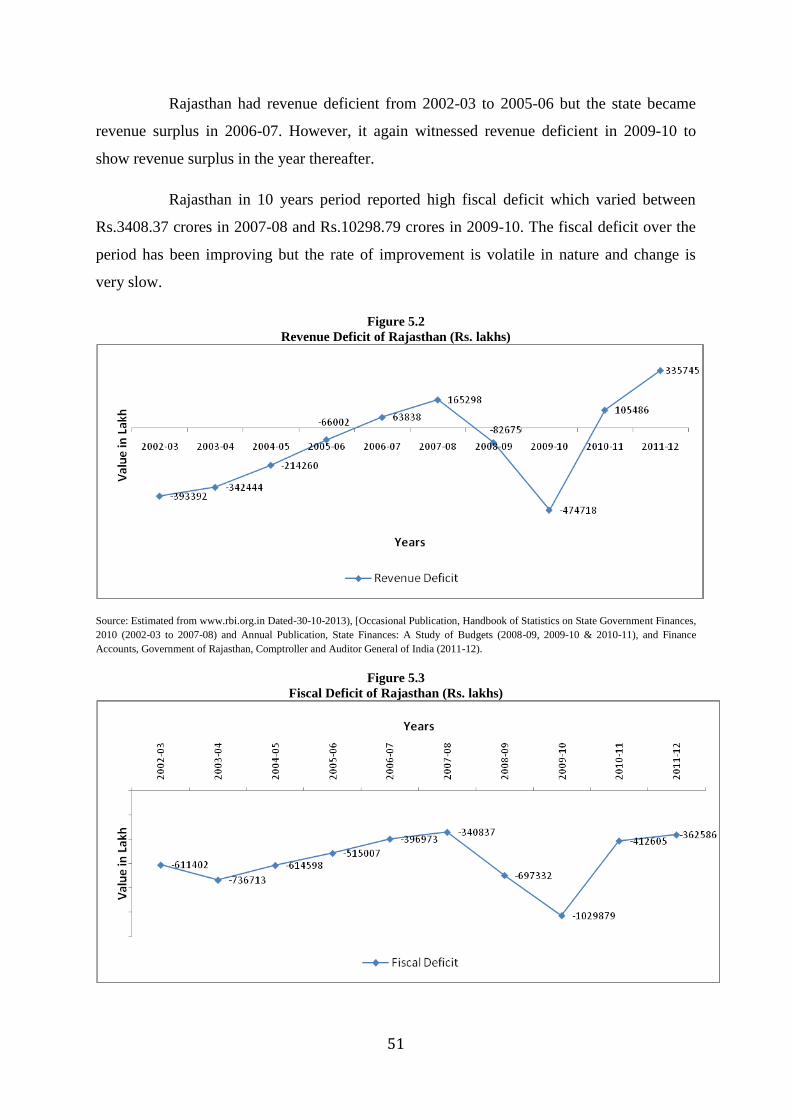
51
Rajasthan had revenue deficient from 2002-03 to 2005-06 but the state became
revenue surplus in 2006-07. However, it again witnessed revenue deficient in 2009-10 to
show revenue surplus in the year thereafter.
Rajasthan in 10 years period reported high fiscal deficit which varied between
Rs.3408.37 crores in 2007-08 and Rs.10298.79 crores in 2009-10. The fiscal deficit over the
period has been improving but the rate of improvement is volatile in nature and change is
very slow.
Figure 5.2
Revenue Deficit of Rajasthan (Rs. lakhs)
Source: Estimated from www.rbi.org.in Dated-30-10-2013), [Occasional Publication, Handbook of Statistics on State Government Finances,
2010 (2002-03 to 2007-08) and Annual Publication, State Finances: A Study of Budgets (2008-09, 2009-10 & 2010-11), and Finance
Accounts, Government of Rajasthan, Comptroller and Auditor General of India (2011-12).
Figure 5.3
Fiscal Deficit of Rajasthan (Rs. lakhs)

52
Source: Estimated from www.rbi.org.in Dated-30-10-2013), [Occasional Publication, Handbook of Statistics on State Government Finances,
2010 (2002-03 to 2007-08) and Annual Publication, State Finances: A Study of Budgets (2008-09, 2009-10 & 2010-11), and Finance
Accounts, Government of Rajasthan, Comptroller and Auditor General of India (2011-12).
The target of all state after the implementation of FRBM Act is to reduce the
revenue deficit to zero and fiscal deficit to less than 3 % of GSDP. The revenue deficit-GSDP
ratio of Rajasthan in 2002-03 was 4.08 % and was reduced to 0.46 % at the time of
implementation of FRBM Act in May 2005. Soon after implementation of the Act, the
government brought into control the revenue deficit-GSDP ratio successfully by keeping the
rate of growth of revenue receipts much higher than the rate of growth of revenue
expenditure. The annual rate of growth of revenue receipt was 17.9 % as against the rate of
growth of revenue expenditure (10.77 %). In other words, till 2005-06, the rate of growth
revenue was always higher than the rate of growth of expenditure. In other words,
government took necessary steps to mobilize more revenue to meet the revenue requirements
and did not even thought to make any types of compromise to reduce the revenue
expenditure, which is meant for the basic need of the state. However, there is a sudden jump
in the revenue expenditure after 2005-06. It registered a growth rate of 16 % to 19 % in all
the year except in 2010-11. This significant rate of growth of revenue expenditure in
Rajasthan after a point of time could not be compensated by the rate of growth of revenue
receipt in all the years. As a result of this in 2008-09 and 2009-10, Rajasthan again realize
revenue deficit of Rs.826.80 crores and Rs.4747.19 crores respectively.
The target to reduce the fiscal Deficit-GSDP ratio to below 3 % level has been a
hard task for almost all the states. Rajasthan, which comes under non-special category state,
is successfully able to reduce the ratio to 0.87 % by 2011-12. The ratio was 6.34 % in 2002-
03 for Rajasthan. It achieved the target by bringing down the figure to 2.32 % in 2006-07 and
further to 1.75 % in 2007-08. The figure again increased to 3.02 % and 3.87 % in 2008-09
and 2009-10 respectively. After that Rajasthan again successfully able to bring down the
figure to 1.21 % and 0.87 % in the years 2010-11 and 2011-12 respectively and has kept it
below 3 %.
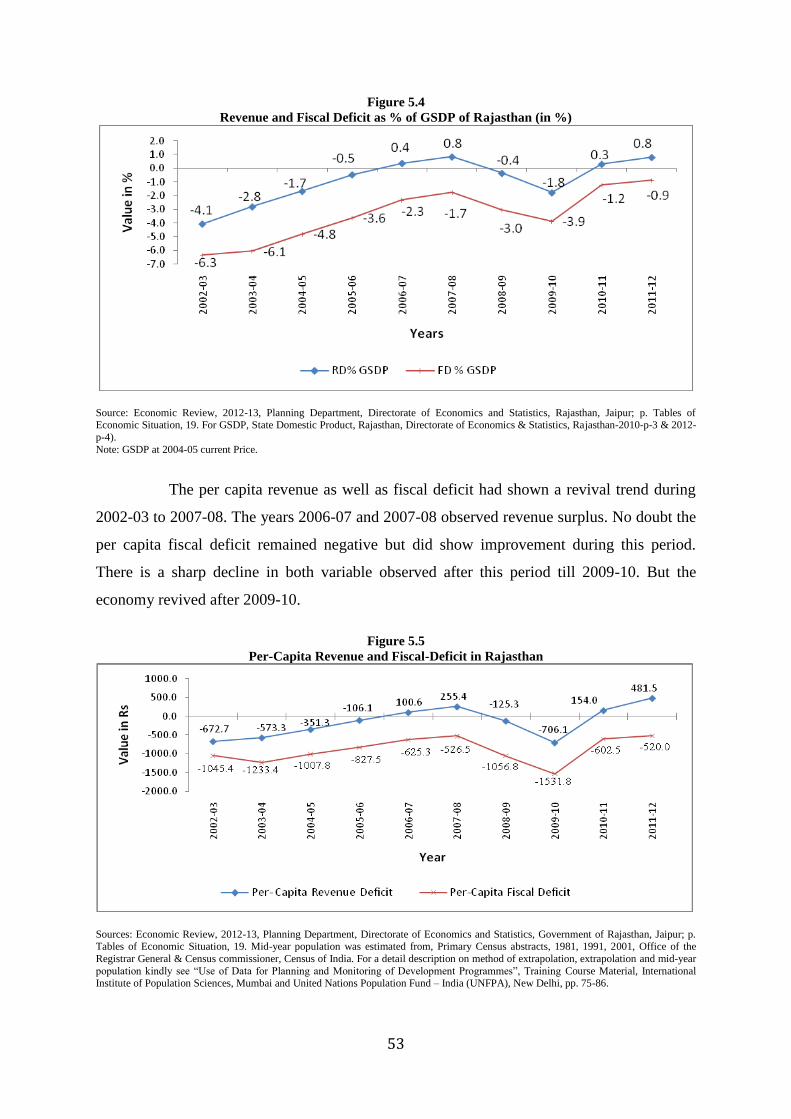
53
Figure 5.4
Revenue and Fiscal Deficit as % of GSDP of Rajasthan (in %)
Source: Economic Review, 2012-13, Planning Department, Directorate of Economics and Statistics, Rajasthan, Jaipur; p. Tables of Economic Situation, 19. For GSDP, State Domestic Product, Rajasthan, Directorate of Economics & Statistics, Rajasthan-2010-p-3 & 2012-
p-4).
Note: GSDP at 2004-05 current Price.
The per capita revenue as well as fiscal deficit had shown a revival trend during
2002-03 to 2007-08. The years 2006-07 and 2007-08 observed revenue surplus. No doubt the
per capita fiscal deficit remained negative but did show improvement during this period.
There is a sharp decline in both variable observed after this period till 2009-10. But the
economy revived after 2009-10.
Figure 5.5
Per-Capita Revenue and Fiscal-Deficit in Rajasthan
Sources: Economic Review, 2012-13, Planning Department, Directorate of Economics and Statistics, Government of Rajasthan, Jaipur; p. Tables of Economic Situation, 19. Mid-year population was estimated from, Primary Census abstracts, 1981, 1991, 2001, Office of the
Registrar General & Census commissioner, Census of India. For a detail description on method of extrapolation, extrapolation and mid-year
population kindly see “Use of Data for Planning and Monitoring of Development Programmes”, Training Course Material, International
Institute of Population Sciences, Mumbai and United Nations Population Fund – India (UNFPA), New Delhi, pp. 75-86.

54
Both revenue as well as fiscal deficit as percentage of GSDP over the period
showed an improvement. The deficits showed an increasing trend until 2007-08, but
thereafter have shown a sharp decline till 2009-10. Both the indicators showed an increasing
trend 2009-10 onwards.
Table 5.2
Per Capita Revenue and Fiscal Deficit (Rs.)
Years
Per capita % of GSDP (2004-05 current price)
Revenue deficit Fiscal deficit Revenue deficit Fiscal deficit
2002-03 -672.7 -1045.4 -4.08 -6.34
2003-04 -573.3 -1233.4 -2.82 -6.06
2004-05 -351.3 -1007.8 -1.68 -4.81
2005-06 -106.1 -827.5 -0.46 -3.62
2006-07 100.6 -625.3 0.37 -2.32
2007-08 255.4 -526.5 0.85 -1.75
2008-09 -125.3 -1056.8 -0.36 -3.02
2009-10 -706.1 -1531.8 -1.79 -3.87
2010-11 154.0 -602.5 0.31 -1.21
2011-12 481.5 -520.0 0.81 -0.87 Source: Estimates from www.rbi.org.in (Occasional Publication-Handbook of Statistics on State Government Finances-2010 (2002-03 to 2010-11, Dated-30-10-2013) and Finance Accounts ( 2003-04, 2004-05, 2006-07, 2007-08, 2008-09, 2009-10, 2010-11, 2011-12)
Government of Rajasthan, Published by: Comptroller and Auditor General of India. Economic Review, 2012-13, Directorate of Economic
and Statistics,Rajasthan, Jaipur, pp. Tables of Economic situation, 2,3&4.
With continuous effort and coupled with appropriate measures, the government
succeeded in eliminating revenue deficit in 2010-11 and 2011-12 and building revenue
surplus and containing fiscal deficit below 3 % of the GSDP. During the year 2011-12, fiscal
deficit was 0.87 % of GSDP well below the target of 3.0 % fixed under FRBM Act.
5.3 Trend in Deficit
The fiscal deficit, which represents the need of total net borrowings of the state,
was Rs.3626 crores in the year 2011-12, as against Rs.7687 crores as per the revised
estimates of 2011-12. Fiscal Deficit to Gross State Domestic Product ratio was 0.87 % in
2011-12 against 2.1 % as per the revised estimates 2011-12.
Table 5.3
Fiscal Variables
Fiscal variables As per TFC/FRBM Act As per MTFPS (revised) Actual
Revenue deficit(-)/surplus (+)
(Rs. crores)
Revenue deficit to zero
(31.03.2012)
+443 (+)3357
Revenue surplus/ revenue receipt ratio
(%)
- 0.8 5.9
Fiscal deficit (Rs. crores) - (-) 7687 (-)3626
FD/GSDP ratio 3.0% or below *(-)2.1% *(-)0.9%
Outstanding debt as % to GSDP 39.3 29.06 25.6 Sources: Quoted from, Economic Review, 2012-13, p 12.
Note: *With reference to quick estimates of GSDP.

55
5.4 Balance of Current Revenues for Plan Financing
Rajashan has been able to reduce the revenue deficit and generate revenue surpluses
to finance for investment. As a result income could flow into the economy through multiplier
effect which in turn led to the reduction of fiscal deficit.
Table 5.4
Revenue Receipts, Revenue Expenditure and Revenue Deficits (Rs. lakhs)
Years Revenue receipts
% annual
growth
Revenue
expenditure
% annual
growth
Revenue
deficits
% annual
growth
2002-03 1308186 - 1701578 - -393392 -
2003-04 1542385 17.90 1884829 10.77 -342444 -12.95
2004-05 1776359 15.17 1990618 5.61 -214259 -37.43
2005-06 2083919 17.31 2149921 8.00 -66002 -69.20
2006-07 2559218 22.81 2495379 16.07 63839 -
2007-08 3078062 20.27 2912765 16.73 165297 158.93
2008-09 3346885 8.73 3429560 17.74 -82675 -150.02
2009-10 3538501 5.73 4013220 17.02 -474719 474.20
2010-11 4592820 29.80 4487335 11.81 105485 -
2011-12 5701076 24.13 5365331 19.57 335745 218.29 Source: Estimated from www.rbi.org.in Dated-30-10-2013), [Occasional Publication, Handbook of Statistics on State Government Finances,
2010 (2002-03 to 2007-08) and Annual Publication, State Finances: A Study of Budgets (2008-09, 2009-10 & 2010-11), and Finance
Accounts, Government of Rajasthan, Comptroller and Auditor General of India (2011-12).
5.5 Conclusion
The Government of Rajasthan has been making sustained efforts towards increasing its
expenditure on developmental activities and improving its physical infrastructure in an effort to
break out of the vicious cycle of low growth. The proportion of Non-Plan expenditure in total
expenditure has reduced from 69.93% in 2008-09 to 63.84% in 2012-13 while the share of Plan
expenditure has increased from 30.07% to 36.16% in the corresponding years. The proportion of
developmental expenditure within revenue expenditure head has been in the range of 63 to 68
percent during recent years. Consequently the non-developmental expenditure comprising of mainly
interest payments, pensions and administrative services has been declining.
It has been observed that over the period of time Rajasthan could be able to
maintain fiscal discipline. It is the reflection of the elimination of the revenue deficit and
reduction of fiscal deficit to less than 3 per cent of GSDP. However the maintenance of fiscal
discipline can not sustain for a long period of time. It is because there is absence of strategic
prioritization and technical efficiency in the delivery of public goods. Rajasthan has to make
investment in the income generating sectors on the basis of prioritization as well as achieving
efficiency, economy and effectiveness in the delivery of public goods.

56
Chapter 6
Debt-GSDP Ratio in Rajasthan
6.1 Introduction
This chapter is divided into three parts viz.
(1) The composition of the state's debt in terms of market borrowing, central government debt
(including those from bilateral/ multilateral lending agencies routed through the central
government), liabilities in public account (small savings, provident funds etc) and borrowings
from agencies such as NABARD, LIC etc.
(2) The use of debt (i.e. whether it has been used for investment expenditure or otherwise) and
(3) The level of debt- GSDP ratio
6.2 Composition of the State's Debt
Total debt is a combination of internal debt of the state government, loan and advances
incurred by the central government, and liabilities coming under public account. Internal debt of the
state government again constitute of: (1) market loan, (2) compensation and other bonds, (3) loans
from financial institution, (4) special securities issued to National Small Saving Funds and other
loan. Loans and advances from the central government constitute of (1) non- plan loans, (2)
loan for state plan schemes, (3) loan for central plan schemes, (4) loan for centrally sponsored
plan schemes, (5) pre- 1984-85 loans. Other liabilities under public account constitutes (1)
small savings, provident fund etc, (2) reserve funds bearing interest, (3) reserve funds not
bearing interest, (4) deposits bearing interest, and (5) deposits not bearing interest.
Table 6.1
Composition of Total Debts
A Public Debt (I+II)
I Internal Debt of the State Government
i Market Loans
ii Compensation and other Bonds
iii Loans from Financial Institutions
iv Special Securities issued to National Small Saving Fund
v Other Loans
II Loans and Advances from the Central Government
i Non-plan Loans
ii Loan for State/Union Territory Plan Schemes
iii Loan for Central Plan Schemes
iv Loan for Centrally Sponsored Plan Schemes
v Pre 1984-85 Loans

57
B Public Account _Other Liabilities
i Small Savings, Provident Fund etc
ii Reserve funds bearing interest
iii Reserve funds not bearing interest
iv Deposits bearing interest
v Deposits not bearing interest
A+B Grand Total (A+B) Source: Finance Accounts (2003-04, p.37,38 & statement 16&17 p 230-244), (2004-05 p.35,36 & statement 16&17 p 236-250), (2006-07
p.35-37 & statement 16&17 p 246-260), (2007-08 p.37,39 & statement 16&17 p 306-320), (2008-09 p.37-39 & statement 16&17 p 292-306), (2009-10 statement 6 p 50-51), (2010-11 statement 6 p 52-53), 2011-12 statement 6 p 55-56) Government of Rajasthan, Published by:
Comptroller and Auditor General of India.
Total debt is composed of (1) public debt and (2) other liabilities. Further public
debt is decomposed of internal debt of the state government and loans and advances from the
central government. It is well recognized that the total debt of Rajasthan has been increasing
over the time. In 2002-03, the total debt was Rs.45871.40 crores which increased to
Rs.106560.16 crores in 2011-12, recording a growth of 9.36 % per annum. The amount of
debt has increased continuously over the time. For the 10 years period it averaged 70 % of the
total debt and more than double between 2002-03 and 2011-12. Public debt in 2002-03 was
Rs.32573.99 crores which increased to Rs.71705.66 crores in 2011-12. In proportionate
terms, other liabilities and public debt to total debt has been more or less stable.
In Rajasthan, there is a change in composition of the total debt over the time.
Public debt as a percentage of total debt was 71.01 % in 2002-03, which declined to 67.29 %
in 2011-12. This in turn increased the proportion of other liabilities from 29 % in 2002-03 to
32.71 % in 2011-12. The public debt has increased from Rs.32573.99 crores in 2002-03 to
Rs.71705.66 crores in 2011-12. The share of public debt to total debt has been declining over
the time. It implies that the rate of growth of public debt is lower than that of the rate of
growth of the other liabilities during this period. In absolute term public debt has grown
annually at a rate of 8.76 %. On the other hand, other liabilities whose share is increasing
over time have grown at an annual rate of 10.86 %.
If we look into the major components of public debt, Rajasthan has substantially
reduces the borrowing from central government. The proportion of loans and advances from
the central government to public debt in 2002-03 stood at 63.54 % but reduced to 10.11 % in
2011-12. On the other hand, loans and advances from the central government have declined
an annual rate of 13.68 %. The state appeared to have mobilized fund from the sources of
internal debt. The proportion of internal debt to public debt in 2002-03 was 36.46 % and it

58
increased to 89.89 % in 2011-12. However, the internal debt grew at a rate of 21.66 %
annually.
Table 6.2
Components of total Debts in Rajasthan (value in Lakh)
Years 2002-03 2003-04 2004-05 2005-06 2006-07 2007-08 2008-09 2009-10 2010-11 2011-12
Public Debt (I+II) 3257399.28 3844908 4355892.9 4806174.28 5050346 5372099 5876622 6461757 6927767 7170566
Internal Debt of the State Government 1187713.39 1449695 1661535.2 4013062.14 4286690 4603812 5114946 5714308 6189728 6445643
Market Loans 982546.63 1228724 1436339.2 1500663.84 1607143 1930423 2449958 3061098 3544819 3855140
Compensation and other Bonds 32 36910.2 36910.2 36910.2 22158.92 18471.1 14783.28 11063.46 7375.64 5531.73
Loans from Financial Institutions 137485.7 118692.5 139577.48 170114.51 192065.4 214949.8 256160.1 306526.4 359720.6 423477.5
Special Securities issued
to National Small Saving
Fund - - - 2268096.3 2442562 2420294 2376890 2320946 2265616 2151785
Other Loans 67649.06 65368.74 48708.25 37277.29 22761.03 19674.21 17154.49 14674.48 12196.62 9709.71
Loans and Advances from the Central Government 2069685.89 2395213 2694357.7 793112.14 763656.5 768287 761676.4 747448.6 738039.6 724922.7
Non-plan Loans 1466956.36 1600145 1985169 9795.88 9173.71 8541.03 7909.76 7280.67 6655.19 6035.12
Loan for State/Union Territory Plan Schemes 535797.97 732903.3 650525.81 764890.2 735619.8 740576.7 735905.5 723655.1 716280.9 705222.3
Loan for Central Plan Schemes 95.14 91.19 87.11 83.38 79.91 75.41 72.99 71.4 69.72 68.46
Loan for Centrally Sponsored Plan Schemes 16106.14 16255.03 17653.45 17802.64 18243.05 18553.82 17248.12 15901.38 14493.74 13056.81
Pre 1984-85 Loans 50730.28 45818.68 40922.3 540.04 540.04 540.04 540.04 540.04 540.04 540.04
Other Liabilities 1329740.26 1491213 1657547.4 1834500.41 2064219 2341689 2525657 2691536 3000733 3485450
Small Savings, Provident Fund etc 956843.87 1051565 1168144.6 1305849.87 1430359 1542201 1682723 1897246 2181344 2458058
Reserve funds bearing interest 19927.57 21194.33 23119.68 23310.79 23500.88 23690.75 22151.05 22160.71 -3293.85 79123.72
Reserve funds not bearing interest 21756.71 36884.95 68460.97 64625.84 110433.8 220172.4 230496 54383.86 16429.16 32299.24
Deposits bearing interest 144721.85 203556.1 176688.75 186177.45 203590.9 213200.7 216433.9 245671.2 270462.2 280985.1
Deposits not bearing interest 186490.26 178012.7 221133.42 254536.46 296335.3 342424.3 373853.3 472074.2 535791 634983.9
Total Debt 4587139.54 5336121 6013440.3 6640674.69 7114566 7713788 8402279 9153293 9928500 10656016
Source: Finance Accounts (2003-04, p.37,38 & statement 16&17 p 230-244), (2004-05 p.35,36 & statement 16&17 p 236-250), (2006-07
p.35-37 & statement 16&17 p 246-260), (2007-08 p.37,39 & statement 16&17 p 306-320), (2008-09 p.37-39 & statement 16&17 p 292-
306), (2009-10 statement 6 p 50-51), (2010-11 statement 6 p 52-53), 2011-12 statement 6 p 55-56) Government of Rajasthan, Published by: Comptroller and Auditor General of India.

59
Table 6.3
Distribution of Total Debt (%)
Items 2002-03 2003-04 2004-05 2005-06 2006-07 2007-08 2008-09 2009-10 2010-11 2011-12
Public debt 71.0 72.1 72.4 72.4 71.0 69.6 69.9 70.6 69.8 67.3
Internal debt of the state government 36.5 37.7 38.1 83.5 84.9 85.7 87.0 88.4 89.3 89.9
Market loans 82.7 84.8 86.4 37.4 37.5 41.9 47.9 53.6 57.3 59.8
Compensation and other bonds 0.0 2.5 2.2 0.9 0.5 0.4 0.3 0.2 0.1 0.1
Loans from financial institutions 11.6 8.2 8.4 4.2 4.5 4.7 5.0 5.4 5.8 6.6
Special securities issued to national small saving fund 0.0 0.0 0.0 56.5 57.0 52.6 46.5 40.6 36.6 33.4
Other loans 5.7 4.5 2.9 0.9 0.5 0.4 0.3 0.3 0.2 0.2
Loans and advances from the central government 63.5 62.3 61.9 16.5 15.1 14.3 13.0 11.6 10.7 10.1
Non-plan loans 70.9 66.8 73.7 1.2 1.2 1.1 1.0 1.0 0.9 0.8
Loan for state plan schemes 25.9 30.6 24.1 96.4 96.3 96.4 96.6 96.8 97.1 97.3
Loan for central plan schemes 0.0 0.0 0.0 0.0 0.0 0.0 0.0 0.0 0.0 0.0
Loan for centrally sponsored plan schemes 0.8 0.7 0.7 2.2 2.4 2.4 2.3 2.1 2.0 1.8
Pre 1984-85 loans 2.5 1.9 1.5 0.1 0.1 0.1 0.1 0.1 0.1 0.1
Other liabilities (public account) 29.0 27.9 27.6 27.6 29.0 30.4 30.1 29.4 30.2 32.7
Small savings, provident fund etc 72.0 70.5 70.5 71.2 69.3 65.9 66.6 70.5 72.7 70.5
Reserve funds bearing interest 1.5 1.4 1.4 1.3 1.1 1.0 0.9 0.8 -0.1 2.3
Reserve funds not bearing interest 1.6 2.5 4.1 3.5 5.3 9.4 9.1 2.0 0.5 0.9
Deposits bearing interest 10.9 13.7 10.7 10.1 9.9 9.1 8.6 9.1 9.0 8.1
Deposits not bearing interest 14.0 11.9 13.3 13.9 14.4 14.6 14.8 17.5 17.9 18.2
Grand Total (A+B) 4587139.5 5336121.3 6013440.3 6640674.7 7114565.6 7713788.0 8402279.5 9153292.6 9928500.2 10656015.7
Source: Estimated from table 6.2.
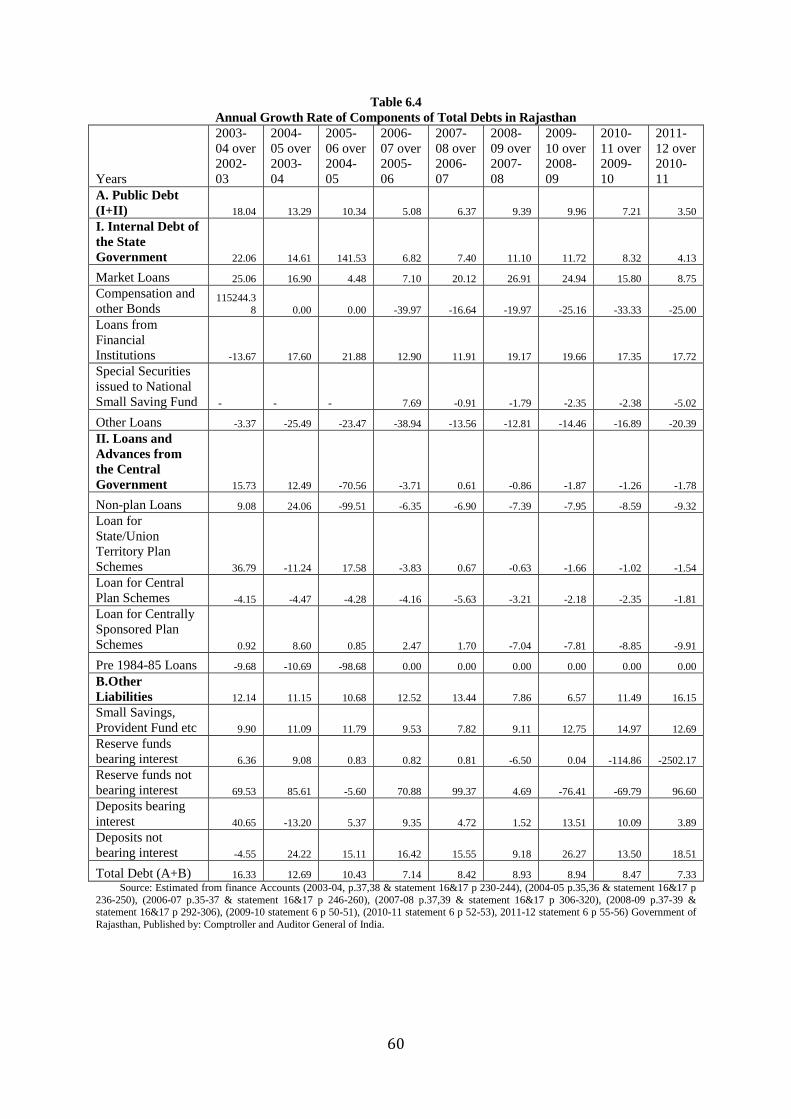
60
Table 6.4
Annual Growth Rate of Components of Total Debts in Rajasthan
Years
2003-
04 over
2002-
03
2004-
05 over
2003-
04
2005-
06 over
2004-
05
2006-
07 over
2005-
06
2007-
08 over
2006-
07
2008-
09 over
2007-
08
2009-
10 over
2008-
09
2010-
11 over
2009-
10
2011-
12 over
2010-
11
A. Public Debt
(I+II) 18.04 13.29 10.34 5.08 6.37 9.39 9.96 7.21 3.50
I. Internal Debt of
the State
Government 22.06 14.61 141.53 6.82 7.40 11.10 11.72 8.32 4.13
Market Loans 25.06 16.90 4.48 7.10 20.12 26.91 24.94 15.80 8.75
Compensation and
other Bonds 115244.3
8 0.00 0.00 -39.97 -16.64 -19.97 -25.16 -33.33 -25.00
Loans from
Financial
Institutions -13.67 17.60 21.88 12.90 11.91 19.17 19.66 17.35 17.72
Special Securities
issued to National
Small Saving Fund - - - 7.69 -0.91 -1.79 -2.35 -2.38 -5.02
Other Loans -3.37 -25.49 -23.47 -38.94 -13.56 -12.81 -14.46 -16.89 -20.39
II. Loans and
Advances from
the Central
Government 15.73 12.49 -70.56 -3.71 0.61 -0.86 -1.87 -1.26 -1.78
Non-plan Loans 9.08 24.06 -99.51 -6.35 -6.90 -7.39 -7.95 -8.59 -9.32
Loan for
State/Union
Territory Plan
Schemes 36.79 -11.24 17.58 -3.83 0.67 -0.63 -1.66 -1.02 -1.54
Loan for Central
Plan Schemes -4.15 -4.47 -4.28 -4.16 -5.63 -3.21 -2.18 -2.35 -1.81
Loan for Centrally
Sponsored Plan
Schemes 0.92 8.60 0.85 2.47 1.70 -7.04 -7.81 -8.85 -9.91
Pre 1984-85 Loans -9.68 -10.69 -98.68 0.00 0.00 0.00 0.00 0.00 0.00
B.Other
Liabilities 12.14 11.15 10.68 12.52 13.44 7.86 6.57 11.49 16.15
Small Savings,
Provident Fund etc 9.90 11.09 11.79 9.53 7.82 9.11 12.75 14.97 12.69
Reserve funds
bearing interest 6.36 9.08 0.83 0.82 0.81 -6.50 0.04 -114.86 -2502.17
Reserve funds not
bearing interest 69.53 85.61 -5.60 70.88 99.37 4.69 -76.41 -69.79 96.60
Deposits bearing
interest 40.65 -13.20 5.37 9.35 4.72 1.52 13.51 10.09 3.89
Deposits not
bearing interest -4.55 24.22 15.11 16.42 15.55 9.18 26.27 13.50 18.51
Total Debt (A+B) 16.33 12.69 10.43 7.14 8.42 8.93 8.94 8.47 7.33
Source: Estimated from finance Accounts (2003-04, p.37,38 & statement 16&17 p 230-244), (2004-05 p.35,36 & statement 16&17 p
236-250), (2006-07 p.35-37 & statement 16&17 p 246-260), (2007-08 p.37,39 & statement 16&17 p 306-320), (2008-09 p.37-39 & statement 16&17 p 292-306), (2009-10 statement 6 p 50-51), (2010-11 statement 6 p 52-53), 2011-12 statement 6 p 55-56) Government of
Rajasthan, Published by: Comptroller and Auditor General of India.

61
Table 6.5
Major Components of Total Debt and its Contribution
Years Total debt
(Rs. lakhs)
% Other
liabilities to
total debt
% Public
debt to
total debt
Public debt
(Rs. lakhs)
Out of public debt % of
Internal debt of
the state
government
Loans and
advances from the
central
government
2002-03 4587140 28.99 71.01 3257399 36.46 63.54
2003-04 5336121 27.95 72.05 3844908 37.70 62.30
2004-05 6013440 27.56 72.44 4355893 38.14 61.86
2005-06 6640675 27.63 72.37 4806174 83.50 16.50
2006-07 7114566 29.01 70.99 5050346 84.88 15.12
2007-08 7713788 30.36 69.64 5372099 85.70 14.30
2008-09 8402279 30.06 69.94 5876622 87.04 12.96
2009-10 9153293 29.41 70.59 6461757 88.43 11.57
2010-11 9928500 30.22 69.78 6927767 89.35 10.65
2011-12 10656016 32.71 67.29 7170566 89.89 10.11 Source: Finance Accounts (2003-04, p.37,38 & statement 16&17 p 230-244), (2004-05 p.35,36 & statement 16&17 p 236-250), (2006-07 p.35-37 & statement 16&17 p 246-260), (2007-08 p.37,39 & statement 16&17 p 306-320), (2008-09 p.37-39 & statement 16&17 p 292-
306), (2009-10 statement 6 p 50-51), (2010-11 statement 6 p 52-53), 2011-12 statement 6 p 55-56) Government of Rajasthan, Published by:
Comptroller and Auditor General of India.
Table: 6.6
Annual Compound Growth rate of different components of Total Debt
A (I+II) Public Debt (I+II) 8.76
I Internal Debt of the State Government 21.66
I(i) Market Loans 16.40
I(ii) Compensation and other Bonds 17.12
I(iii) Loans from Financial Institutions 15.08
I(iv) Special Securities issued to National Small Saving Fund -1.24
I(v) Other Loans -20.43
II Loans and Advances from the Central Government -13.68
II(i) Non-plan Loans -50.67
II(ii) Loan for State/Union Territory Plan Schemes 1.69
II(iii) Loan for Central Plan Schemes -3.75
II(iv) Loan for Centrally Sponsored Plan Schemes -2.01
II(v) Pre 1984-85 Loans -43.29
B Other Liabilities 10.86
B(i) Small Savings, Provident Fund etc 10.77
B(ii) Reserve funds bearing interest 10.25
B(iii) Reserve funds not bearing interest 0.72
B(iv) Deposits bearing interest 6.40
B(v) Deposits not bearing interest 15.45
A+B Grand Total (A+B) 9.36
Sources: Estimated from the Finance Accounts, Government of Rajasthan.
6.2.1 Debt Relief
In order to maintain the fiscal discipline required for macro- economic
stability, the government of India, on the recommendations of the Twelfth Finance

62
Commission and as per the guidelines of the Debt Consolidation and Relief Facility (DCRF)
decided to reschedule the repayment of total outstanding central loans into 20 annual
installments. It was further announced that debt waiver of such installment would be
sanctioned if the state government maintained its fiscal deficit up to 3 % of Gross State
Domestic Product (GSDP). Consequently, the state government also introduced the
FRBM Act, 2005 wef. 03-05-2005 and the government of India consolidated the entire
central loan of Rs.6174.08 crores outstanding in the account of Rajasthan as on 31-03-2004 and
rescheduled the repayment of such loan into 20 installments of Rs.308.70 crores each. The
government of India further relaxed the above condition and allowed the state to keep its
fiscal deficit up to 3.5 % and 4 % during the years 2008-09 and 2009-10 respectively. In view
of fiscal deficit being maintained earlier, the government of India provisionally released the
debt relief for the year 2008-09, but due to inability of the state government in covering the
fiscal deficit within 3.5 % of GSDP in 2008-09 the government of India directed the RBI to
recover the installment of Rs.308.70 crores from the state account in 2009-10. Further, in
2009-10 also the debt relief was not sanctioned by the government of India as the state
government once again failed to maintain the fiscal deficit within 4 % of GSDP due to
which the state government had to make a payment of its debt installment. Therefore, due to
non-fulfillment of above conditions by the state government for two years consecutively they
had to suffer an additional overburden of Rs.617.40 crores.
6.3 Level of Debt- GSDP Ratio
The debt-GSDP ratio is an indicator of the sustainability of the fiscal position
of the state government. A higher debt-GSDP ratio indicates weakening stability of the
states’ fiscal position, as the growth rate of debt is more than that of GSDP. The debt-
GSDP ratio was 47.56 % in 2002-03 and it came down to 25.57 % in 2011-12. The ratio
remains more or less constant between the years 2002-03 to 2005-06 with a minor
fluctuation. However, after 2005-06 it registered a sharp decline. The debt-GSDP ratio is
lower than the ceiling of 39.3 % as recommended by 13th
Finance commission for
Rajasthan. It is interesting to note that the decline in debt-GSDP ratio is more contributed
by the rate of growth of GSDP. The rate of growth of GSDP (16.01%) is much higher than
that of the rate of growth of the total debt (9.36%).

63
Figure 6.1
Debt-GSDP Ratio of Rajasthan
Source: Same as table 6.1 and Economic Review, 2012-13, (pp, Tables of Economic Situations -2-4) Directorate of Economics and
Statistics, Rajasthan, Jaipur
Table 6.7
Capital Outlay as Percent of Net Borrowings (%)
Years
Capital Outlay (Rs.
crores)
Net increase
in debt
(Rs. crores)
Capital outlay as %
of net increases in debt 2002-03 2027.54 5901.48 34.36 2003-04 3180.99 7489.82 42.47 2004-05 3488.30 6773.19 51.50 2005-06 4294.49 6272.35 68.47 2006-07 4809.37 4738.91 101.49 2007-08 6555.55 5992.22 109.40 2008-09 5900.00 6860.47 86.00 2009-10 5175.00 7510.89 68.90 2010-11 5251.00 7756.28 67.70
2011-12 7119.00 7274.68 97.86 Source: Government of Rajasthan Economic Review various years.
6.4 Suggestions for improvement in Debt-GSDP ratio.
The Debt –GSDP ratio can be decrease by raising the level of GSDP as well as
reducing the proportion of loans which in turn can be done through:
(1) Control the revenue expenditures by controlling non-developmental expenditures like
abolition vacant posts which are not necessary, convergence of department with similar
objectives, Ensuring sufficient work for each employees etc.
(2) Increasing the own tax and non-tax revenue
(3) In order to reduce the impact of natural calamities, state has to generate a sinking fund which
can be strengthen by increasing own tax and non-tax revenue. State should not heavily
dependent upon external sources, like debt to meet natural calamities.
64
(4) The biggest concern of the State Government in management of borrowings and debt is the
liabilities building up in the Power Sector. While the State Government's public debt
(inclusive of public account liabilities) is expected to be Rs. 1,30,000 crore at the
end of FY 2013-14, the debt liabilities of the Power Sector would be around 1,00,000 crore.
These debts are not only guaranteed by the State Governments, but the States are time and
again forced to take over the liabilities of the power sector. The Commission is aware that
under the Scheme for Financial Restructuring of State Distribution Companies issued by GoI
has been implemented for a number of the States, including by the DISCOMs of the State.
As per this scheme, the State Government is required to takeover 50 percent of the short-term
liabilities of the DISCOMs at end-March 2012 through issuance of special securities in favour of
participating lenders in a phased manner over a time frame of 2-5 years. The door to door
maturity, as per the scheme, would not be more than 15 years with a moratorium of 3-5 years, on
the principal repayment. The State Government has agreed to take over special securities of the
order of Rs. 18000 crore under this Scheme. As the State takes-over this liability, State's
borrowing limits get reduced to the same extent. Besides, limiting the borrowing of the State
Government, there would also be further increase in repayment liability on account of taking
over of these securities. The State Government strongly urges the Finance Commission to take
into account the liabilities of the Power Sector while assessing the indebtedness of the State, its
repayment and servicing obligations and also while recommending any debt restructuring
package. The State Government would suggest that Finance Commission also places a
condition for restricting power sector loans to a percentage of GSDP as a monitorable
indicator for any fiscal incentive package. The Central Government as a part of the
package of restructuring short term liabilities of the power sector is assuming a very small
part of the liabilities which is limited to providing incentive equal to 114th of the bonds at the
time of retirement of the special securities so taken. The Central Government should be asked to
take over a part of interest servicing liability as well.

65
Chapter 7
State's Transfer to Local Bodies in Rajasthan
The transfers to local bodies in Rajasthan have historically been in an
unsatisfactory state. Because of asymmetry between revenue capacity and expenditure
responsibilities at different local governments and states in India, the fiscal position of a
majority of local bodies became vulnerable. In order to rectify the situations, measures have
been taken to provide substantial autonomy to local bodies through 73rd
and 74th
amendment
acts of the Indian constitution. However, these measures do not appear to have made any
noticeable impact on their finances.
7.1 Urban Local Bodies in Rajasthan
The local bodies consist of urban and rural local self governments. At the urban
level there are corporations, municipalities and notified area council whereas at the rural level
there is three tiers panchayati raj. The three tiers pachayats are zilla parishad at the district
level, pachayat samiti at the intermediate level and gram pachayat at the bottom. For efficient
functioning of these bodies the powers of raising and spending revenue have assigned
through the above mentioned amendments. Apart from this provisions have been made to
make revenue transfers from the state as well as central government.
7.1.1 Municipal Finances:
Sources of Finance: The revenue sources of Municipalities can be broadly
classified into: tax and non-tax revenue. The tax revenue is from taxes levied and collected
by the municipal bodies, whereas the non-tax revenue is from fees, charges, penalties, sale
of land, income from property, loans, assistances etc. The tax revenue can further be classified
into obligatory taxes and discretionary taxes revenue and non-tax revenue into revenue
from internal sources and external sources.
Municipal Taxes: Section 104 and 105 of the Rajasthan Municipalities Act,
1959 provided for levy of obligatory and discretionary taxes similar to the two categories of
functions that these municipal bodies are expected to discharge. The obligatory taxes that are
66
to be levied by the urban local bodies are:
Obligatory Taxes: Every board shall levy at such rate and from such date as the
state government may in each case direct by notification in the official gazette and in such
manner as is laid down in this Act and as may be provided in the rules made by the state
government in this behalf, the following taxes, namely
(1) A tax on annual letting value of buildings or lands or both,
situated within the municipality ;
(2) An octroi on goods and animals brought within the limits of municipality for consumption or
use or sale therein.
(3) A tax on professions and vocations.
Proviso to this section mentions that the land and building tax shall not be levied on
kham houses or on buildings and lands or both of which annual letting value is less than one
hundred and eighty rupees. Similarly, octroi shall not be levied on motor vehicles and
profession/vocation tax shall not be levied on artisans.
The state government framed Rajasthan Municipalities (land & building tax) Rules,
1961 to provide for imposition, assessment and recovery of land & building or "house tax" as
it is popularly known. Notification imposing house tax was also issued in respect of
majority of the municipalities and rates of tax were also laid down. However, as per
information provided to the Commission by the Local Bodies Department out of 183
municipalities in the State 117 municipalities were recovering house tax but the amount of
recovery has not been very encouraging as would be evident from the figures reported. Only in
municipal corporation, Jaipur and to some extent Jodhpur and municipal council, Ajmer
some efforts were made to recover house tax.
Octroi has hitherto been a major source of municipal revenue till its withdrawal
by the state government wef 1st August 1998. To make good the loss of octroi income of
urban local bodies the state government is giving grant in aid every month based on actual
octroi income for the year 1997-98. This grant is increased by 10 % every year.
The state government had, however, imposed profession tax wef April 2000
67
on certain categories of professions14
.
Discretionary Taxes: Section 105 of the Rajasthan Municipalities Act,
1959 provided for discretionary taxes that may be imposed. The section provided that
subject to any general or special orders of the state government, a board may impose
and levy in the whole or any part of the municipality for which it is established all or any
of the following taxes, namely:
a tax on vehicle and other conveyance plying for hire or kept within the municipality;
a tax on dogs kept within the municipality;
a tax on animals used for riding, driving, draught or burden when kept within the
municipality;
a toll on vehicles and other conveyances and on animals entering the municipality;
a tax on boats moored within the municipality;
a scavenging tax
a tax for the cleansing of private latrines or privies;
a general sanitary tax for the construction or maintenance or both of public latrines
and for the removal and disposal of refuse;
a lighting tax;
a water tax for water supplied by the board, which may be imposed in the form of a
rate assessed on the annual letting value of building or lands or both or in any other
form;
a tax on trades and callings carried on within the municipality and driving special
advantages, from or imposing special burdens on municipal services;
a tax on artisans; and
Any other tax which the state legislature has power to impose under the Constitution.
The Act further laid down the usual procedure to be followed for levy of any of
these taxes, e.g. resolution to be passed in the general meeting, selection of any one or the
other taxes, preparation of draft rules, persons or property or both to be covered, the amount
or rate of tax and notification to be issued. However, in view of the lengthy procedure
involved in imposition of taxes and the general reluctance of the elected representatives at the
local level to levy taxes either the taxes provided in section 105 were not levied at all or
levied by very few municipalities with the result that revenues from these taxes has been
negligible. Even with the assignment of the above taxes due to excessive functions assigned
to municipal bodies there is deficiency in capacity to meet the needs.
14 As per the budget speech of Finance Minister of Rajasthan for budget 2000-01, this tax was levied on only other
notified category individuals paying income tax and has annual income of more Rs.1.5 lakh. Individuals employed with defense forces, freedom fighters, war widows, and handicaps, parents of children with disabilities and central government and state non-gazetted employees. In that year expected income was Rs.14 crore.
68
7.1.1.1 Inter governmental Transfers
Intergovernmental transfers have a vital role in meeting the financial needs of
municipalities. Apart from the Union Finance Commission the State Finance Commission has
been constituted from time to time to mediate the revenue transfers from state to local bodies
which have been mentioned later on. These transfers to municipalities fall into several
categories comprising general-purpose grants, compensatory grants from octroi, share of
entertainment tax, and grants under the state finance commission, grants under the central
finance commission, and special dispensations. The general-purpose grant is given on a per-
capita basis, which is in an inverse proportion to the size of the municipality (in terms of
population)- i.e., high for a small–sized municipality and low for a larger–sized one. The state
government extends grants for specific purposes like construction of roads, drains, and the
like; then, there are octroi compensations, which are the single most important grant for
municipalities in Rajasthan. In the case of municipalities in Rajasthan, transfers are their
lifeline, accounting for 85 % of their revenues and covering 76 % of their revenue account
expenditures. Over 75 % of the state transfers are grants compensating municipalities for the
loss of revenues from octroi abolition. Octroi compensation is one of the major sources of the
ULBs. It is coming as compensation. State is not following the agreed norm for the
devolution of octroi to ULBs in Rajasthan. As per the agreement made with the state during
the abolition of the octroi, state has to compensate with a 10 % increase in the octroi amount
every year on the amount collected during 1997-98 as the base year. However during the
years 2004 and 2005, state broke her promise by devolving the amount based on a 5 %
increase of the previous years’ received amount. As a result ULBs have been bearing the
cumulative loss of the deviation till dates.
General-purpose grants were constant at Rs.21.06 crores over 1999-00 to 2001-
02, while other grants concurrently showed a dramatic increase. Municipalities claim that
octroi compensations are insufficient and do not represent the buoyancy that revenues from
Octroi had prior to its abolition in 1998.
Total transfer to ULBs in Rajasthan during 2002-03 was Rs.483.67 lakhs, which
increased to Rs.1146.63 lakhs during 2010-11. There is continuous increase in the transfer to
ULBs in last ten years period. In the total transfer it is the proportion of special assistance and
loan to total transfer has increased over the time. In absolute terms it has increased from

69
Rs.143.36 lakhs during 2005-06 to Rs.351.67 lakhs during 2010-11. ULBs of Rajasthan have
been getting a substantial amount from grant in lieu of octroi (also see appendix 7.2). It was
Rs.494.97 lakhs during 2005-06, which increased to Rs.754.09 lakhs during 2010-11.
Table 7.1
Transfers to Urban Local Bodies in Rajasthan (Rs. crores)
Years
General and special
grants
Grant in lieu of
octroi Special assistance and loans Total
2002-03 - - - 483.67
2003-04 - - - 530.31
2004-05 - - - 602.61
2005-06 27.91 494.97 143.36 666.24
2006-07 44.80 544.46 160.35 749.61
2007-08 41.93 566.64 254.68 863.25
2008-09 65.27 627.65 417.37 1110.29
2009-10 51.91 747.70 484.79 1284.40
2010-11 40.87 754.09 351.67 1146.63
ACGR* 8.30 9.61 26.55 13.95 (13.48) Note: *ACGR from 2005-06 to 2010-11 and mentioned in bracket from 2002-03 to 2010-11.
Source: Audit Reports (Civil Local Bodies) for the year ended 31st March, 2004-05 to 2011-12 (Chapter-III: An Overview of Accounts and Finances of Urban Local Bodies) (CAG-www.cag.gov.in)
Table 7.2
Percentage of ULBs Transfers to Total (Rs. in crores)
Years Total % out of total
General and special
grants
Grant in lieu of
octroi
Special assistance
and loans
2005-06 666.24 4.2 74.3 21.5
2006-07 749.61 6 72.6 21.4
2007-08 863.25 4.9 65.6 29.5
2008-09 1110.29 5.9 56.5 37.6
2009-10 1284.4 4 58.2 37.7
2010-11 1146.63 3.6 65.8 30.7 Source: Audit Reports (Civil Local Bodies) for the year ended 31st March, 2004-05 to 2011-12
(Chapter-III: An Overview of Accounts and Finances of Urban Local Bodies) (CAG-www.cag.gov.in)
7.1.1.1.1 The First State Finance Commission
The First State Finance Commission (FSFC) constituted under Article 276–A of
the Rajasthan Municipalities Act, 1959 (as amended vide Rajasthan Municipalities
Amendment Act, 1994), for instance, observed that “it is a matter of common knowledge that
most of the municipalities in Rajasthan are financially weak and not in a position to meet the
rising demand for municipal services”. The Second State Finance Commission (SSFC) made
identical observations: “the financial position of the majority of the urban local bodies is not
satisfactory, with the result that they are not in a position to meet the rising demand for
municipal services. The municipalities are unable to discharge their obligatory functions,
leave aside the discretionary functions. Rapid growth of cities and towns is not matched by a
corresponding increase in their revenues”. The Second State Finance Commission (SSFC)

70
further observed that the abolition of octroi in the state has seriously eroded the financial
autonomy of urban local bodies, and taken away the initiative and discretion which was
available to them for expanding the scope of octroi on goods or revising the rates, so as to
mobilize additional resources. Abolition of octroi, the Commission noted, has increased the
financial dependence of municipalities on state government resources.
There is also a growing concern about the impact of the abolition of octroi on the
state resources. The historical imbalances between revenue resources and expenditure
responsibilities and their impact on state resources are well understood, but the imbalances
owing to the abolition of octroi carry important implications for state resources and deserve
special attention. Likewise, the emerging context of the urban sector reforms as embodied in
the National Urban Renewal Mission (NURM) throws up fresh challenges for Municipalities
and the state government in term of their readiness to be able to undertake urban sector
reforms and access funds for infrastructure development.
Considered from the angle of geographical area in the country, Rajasthan is the
largest among Indian States covering 3.42 lakhs sq kms. As the population in urban areas is
growing very fast, therefore, long- term planning is required to be formulated to reduce the
pressure of population in urban areas.
The previous State Finance Commissions have adequately looked at the issues
concerning municipal finances in Rajasthan. In the ensuing discussion, brief presentation of
the views expressed by the Second and Third State Finance Commissions are made.
7.1.1.1.2 Second Finance Commission15
The financial position of majority of the urban local bodies is not
satisfactory with the result that they are not in a position to meet the rising demand for
municipal services. The Municipalities16
are unable to discharge their obligatory functions
15 As reported by the Commission in its report. 16 The first Municipality in Rajasthan was set up in Ajmer in 1866. By the end of 19th century there
were 16 Municipalities in Rajputana States. In early 20th century the number of Municipalities was around 100. After independence many more Municipalities were set up and in early 1970s, the number grew to 145. The number of Municipalities was 196 in 1986 which was subsequently reduced to 182 owing to the recommendations of the Mukherjee Committee. In 2013, the number stands at 184. In 2011, urban population is 170.48 lakh. The variation in number of urban areas/towns and population varies because of different criteria adopted by Census Authorities for classification of towns/urban areas and that adopted by State

71
leaving aside the discretionary functions. Rapid growth of cities and towns is not matched by
a corresponding increase in their revenues. While the functional responsibilities of Municipal
bodies increased several times inflating their resource needs, their performance has been
dismal on augmentation of resources to carry out these functions. Even the statutory avenues
of raising resources remained unexploited or under exploited, because the elected bodies do
not muster courage to levy taxes under their powers, which may be commensurate with the
level of services they wish to provide. Inadequate taxation and inefficient
management both together render the municipal services far from satisfactory. The
smaller municipalities have hardly any funds to meet their day-to-day requirements and
have no capabilities to take measures for improving the level of services. Growing costs,
shortage of funds, indiscipline among the work force etc. is making the situation worse with
passage of time. In big cities, the situation is rather complicated and difficult. The
infrastructure development is not in a position to keep pace with the population growth of
such cities resulting in serious inadequacies in services. The abolition of octroi has further
aggravated the situation.
The Commission noted that the representatives of the municipal bodies
irrespective of their political affiliations, voice strong resentment and grievances over the octroi
issue on various accounts. The main grievances were as follows:
that octroi was the main source of revenues of municipalities, that octroi was a buoyant
source of municipal revenue, that withdrawal of octroi has crippled the municipalities
financially
that after abolition of octroi the municipalities have become almost totally dependent
on the state government financially, that the state government is giving only 10 %
increase in grant in aid in lieu of octroi whereas the growth in octroi revenue was about
20 %
that even the 10 % annual increase being given has been reduced to 5 % during the
financial year 2001-02
that even the grant- in- aid amount of octroi is not released on time
that the nakedars and other staff who were earlier engaged in octroi collection are be
paid salaries without work. They have become liability on the municipalities.
Based on the above grounds it appears that withdrawal of octroi was not a
sound decision and the state government should reconsider it. Commission did not
Government for classification of urban local bodies and their population.

72
specifically recommended re-imposition of octroi or otherwise but did felt that the abolition
of octroi has seriously eroded the financial autonomy of urban local bodies and has taken
away the initiative and discretion which was available to the municipalities to extend the
scope of octroi on goods not covered and revise the rates so as to raise more resources.
The decision of the state government to lower down the rate of annual increase in grant-in-
aid amount from 10 % to 5 %, Commission felt had further created financial problems for
the municipalities’ particularly small and financially weak municipalities which are
dependent on octroi grant only for meeting their committed expenditure. The Commission did
urge the state government to restore the annual increase in octroi grant to 10 % if not
increase it to 15-20 % as demanded by the elected representatives, ensure release of the due
amount of grant- in- aid in lieu of octroi to the municipalities on 1st of every month so that
these bodies could meet their committed expenditure on time17
. Apart from land &
building tax, another tax, which is obligatory for the municipalities to levy, is tax on
professions and vocations. However, municipalities in the state have reportedly not
imposed this tax.
7.1.1.1.3 Third Finance Commission18
Obligatory Taxes: The provisions regarding obligatory taxes are contained in
Section 104 of the Rajasthan Municipalities Act, which is as under:
Every municipal board shall, levy at such rate, and from such date, as the state government
may in each case direct by notification in the official gazette and in such manner as is
laid down in this Act, and as may be provided in the rules made by the state
government in this behalf, the following taxes, namely:
(1) a tax on annual letting value of buildings or lands or both situated within the
municipality;
(2) an octroi on goods and animals brought within the limits of municipality for
consumption or use or sale therein; and
(3) A tax on professions and vocations.
Proviso to this section mentions that the land and building tax shall not be levied
17 Moreover, once the amount is released there should be no restriction on its withdrawal from the
treasuries/PD account of the respective municipalities. 18 As reported by the Commission in its report.
73
on "Kham Houses". Similarly, octroi shall not be levied on motor vehicles and
profession/vocation tax shall not be levied on artisans. Thus, there are three obligatory
taxes envisaged in the Act. Out of the three obligatory taxes, namely, land and building
tax, octroi and profession tax, the profession tax has not been levied by any of the urban local
bodies due to administrative directive of the state government.
The land and building tax (popularly known as house tax) has a chequered history
in Rajasthan. Land and building tax was abolished by the state government vide its
notification dated 24.2.2007. Even prior to its abolition, this tax was not levied and recovered
by as many as 60 urban local bodies. It is, indeed, strange that even large urban local bodies
like Kota Municipal Corporation & Udaipur and Sikar municipal councils did not exploit this
important source of revenue generation. The situation even prior to abolition of house tax was
not at all satisfactory in Rajasthan. The urban local bodies either did not recover house tax or
recovered it with great reluctance. As a result the recovery even against assessed tax did not
go beyond 40 %. Having remained abolished from 24.2.2007 to 28.8.2007, this tax was re-
imposed under the nomenclature of urban development tax with effect from 29.8.2007 with
reduced revenue potential. House tax/ property tax are a major tax being levied by the urban
local bodies across the country. The income from this tax to the municipalities in the country
is sizeable. Unfortunately in Rajasthan, the full potential of this tax has never been exploited
so far. This tax has not emerged as an alternative source of revenue after the abolition of
octroi. It is a matter of serious concern that with respect to per capita house tax revenue of
municipalities; the state of Rajasthan is far behind as compared to other major states19
.
The Commission had serious concern over the non-recovery of massive
arrears of the assessed tax. The records of arrear amount were not complete in some of
the urban local bodies and no reason for it was available. The Commission had
recommended that the outstanding amount should be recovered expeditiously by
incentivizing the staff. The state government had already clarified that the quashing of the
house tax rules 2003, on 24.2.2007, has no retrospective effect and the dues under the Rules
are to be recovered. The Commission suggested that Director, Local Bodies should draw out
19 This comparison is self -explanatory and indicates the lackluster attitude of urban local bodies of
Rajasthan towards exploiting this important source of revenue generation. As against the target of Rs.150 crore set for house tax for the year 2005-06, by Director, Local Bodies, a paltry sum of Rs.43 crore was only been recovered, constituting 28% of the targeted amount. The prime reason for this abysmall y/ abnormally low recovery appears to be the indifferent attitude of the urban local bodies, coupled with the uncertainty on the part of state government, of whether to retain or abolish the tax.

74
an incentive scheme giving higher incentive for recovery of older outstanding dues and the
targets for recovery of this amount may be fixed and rigorously monitored. The Commission
made adequate provisions in the devolution for the incentive on this account.
Thus, there is only one obligatory tax imposed and levied by the urban local
bodies which has come into force by government notification dated 29.8.2007, namely,
urban development tax. The obligatory taxes assigned to the urban local bodies are only
obligatory in name- urban local bodies are obliged to levy and recover the obligatory tax.
But the power to impose tax and decide the rate as well as the date from which the tax is to
be recovered is decided by the state government. The Commission opinioned that the power
of the state government to ordain the extent of the obligatory tax does not financially helps
the urban local bodies. Far from strengthening the constitutional status of the urban local
bodies, conferred by 74th
Amendment of the Constitution, such developments only reinforce
the perception that urban local bodies are subordinate entities in the day to day control of the
state government, beholden to them not only for the development of the city but often for
their very survival. Even for revision for rates, urban local bodies are required to approach
the state government resulting in inordinate delay. Therefore, Commission argued that it
would be meaningful in keeping with the spirit of 74th
Constitutional Amendment, if power
of revision of rates are decentralized and conferred on the urban local bodies by Act and/ or
by Rules.
Octroi was a major and buoyant source of municipal revenue till its withdrawal
by the state government wef 1st August 1998. Since then the government of Rajasthan
gives grant-in-aid to compensate the loss of Octroi income of urban local bodies. It was also
assured that this compensation grant would be increased by 10 % every year. Third Finance
Commission in this regards found also strong resentment and grievances over the octroi on the
following counts:
that octroi was the main source of revenue of the municipalities;
that octroi was a buoyant source of municipal revenue;
that withdrawal of octroi has crippled the municipalities financially;
that after abolition of octroi the municipalities have become totally dependent on the
state government financially;
that the state government is giving only 10 % increase in grant-in-aid in lieu of octroi
whereas the growth of octroi in state government, revenue is much more;

75
that even the 10 % annual increase has been reduced to 5 % from the financial year
2001-02 to 2003-04 and restored to 10 % in the year 2004-05 ignoring the impact of
the decrease during the three years of 2001-02 to 2003-04 and ignoring the actual
amount of octroi which would have been paid had the 5 % decrease not taken place at
the whim of the state government;
that even the grant in aid amount of octroi is not being released in time, regularly.
The decision of the state government to reduce the rate of annual increase in
grant-in-aid from 10 % to 5 % during 2001-02 to 2003-04 was against the assurance given by
the government. It further worsened the financial position of municipalities, particularly,
small and financially weak municipalities, which are completely dependent on octroi grant
for meeting their committed establishment expenditure. Therefore, the Commission
recommended restoration of commitment made the government of 10 % annual increase
from 2008-09.
Discretionary Taxes: Section 105 of the Rajasthan Municipalities Act, 1959,
provided for a long list of discretionary taxes that may be imposed. This section provided that
subject to any general or special orders of the state government on this behalf, a municipal
board may impose and levy, in the whole or any part of the municipality for which it is
established, all or any of the following taxes, namely :
(i) a tax on vehicle and other conveyance plying for hire or kept within the municipality;
(ii) a tax on dogs kept within the municipality;
(iii) a tax on animals used for riding, driving, draught or burden when kept within the
municipality;
(iv) a toll on vehicles and other conveyances and on animals entering the municipality;
(v) a tax on boats moored within the municipality;
(vi) a scavenging tax; a tax for the cleansing of private latrines or privies;
(vii i) a general sanitary tax for the construction or maintenance or both of public latrines
and for the removal and disposal of refuse,
(ix) a lighting tax;
(x) a water tax for water supplied by the board, which may be imposed in the form of a
rate assessed on the annual letting value of building or lands or both or in any other
form;
(xi) a tax on trades and callings carried on within the municipality and driving special
advantages from, or imposing special burdens on municipal services;
(xii) a tax on artisans; and any other tax which the state legislature has power to impose
under the Constitution.

76
The Act further stipulated the usual procedure to be followed for levy of any of
these discretionary taxes, e.g. resolution to be passed in the general meeting, selection of any
one or the other taxes, preparation of draft rules, persons or property or both to be covered,
the amount or rate of tax and notification to be issued. The cumbersome procedure prescribed
for imposition of these taxes coupled with the lack of awareness and apathy of elected
representatives to discharge their public duty towards the residents of the town, who have
elected them, accounts for non levy of these taxes. The taxes provided in Section 105 have
not been levied at all or levied by a very few municipalities20
.
7.2 Panchayati Raj Institutions
The central and the state governments have provided for statutory fiscal powers
and transfers considering the importance of adequate resources for the effective functioning
of PRIs. The provisions relating to these are as follows.
7.2.1 Central Level Provisions
Specifies broad directions on the types and methods of fiscal powers (at the
central level) provided to the PRIs is mentioned in the Articles 243(H) and 243(I) of the 73rd
Constitutional Amendment Act (CAA). Article 243(H) States that the legislature of a state
made by law:
authorize a panchayat to levy, collect and appropriate such taxes, duties, tolls and fees
in accordance with such procedure and subject to such limits;
Assign to a panchayat such taxes, duties, tolls and fees levied and collected by the
state government for such purposes and subject to such conditions and limits;
Provide for making such grants-in-aid to the panchayats from the Consolidated Fund
of the state; and
Provide for the constitution of such funds for crediting all moneys received
respectively, by or on behalf of the panchayats, and also, for the withdrawal of such
moneys there from, as may be specified in the law.
20 It is strange to observe that no municipal corporation is collecting discretionary tax. Some of the
urban local bodies have levied discretionary taxes, like, tax on vehicles, terminal tax, passenger tax, etc. but the
total revenue from all these taxes was only Rs.4.76 crore, contributing 0.56 % in total revenue in the year
2004-05.

77
Article 243(I) provides for the appointment of a ‘Finance Commission’ by the
states once in five years. The broad responsibilities of the State Finance Commission (SFC)
are to:
Distribute the state’s resources between the state and the local bodies;
Assign any of the state’s taxes, duties and fees to these bodies; and
Recommend grants-in-aid for the purpose of providing services.
Besides, Articles 280(bb) and 280(c) of the Constitution place additional
responsibility on the Central Finance Commission (CFC) to look into the resources of the
local bodies. The former Article relates to PRIs and the latter to ULBs. As per Article
280(bb), the CFC has to recommend measures needed to augment the Consolidated Fund of a
state to supplement the resources of the panchayats in the state on the basis of the
recommendations made by the Finance Commission of the state.
7.2.2 State Level Provisions
With regard to financial powers of the PRIs, the states in their Panchayat Raj (PR)
Acts have made various provisions. Broadly, the states have accorded taxation powers to the
grama/ village panchayats. One can see the long list of tax sources vested with them21
. The
Ministry of Panchayat Raj (MoPR), government of India, has listed 24 taxes and duties
entrusted to village/grama panchayats by various states22
. The most important among these
are property/building tax, vacant land (other than agriculture land) tax, “kolagaram” (tax on
the village produce sold in the village by weight, measurement or number) mainly in Andhra
Pradesh, tax on advertisements and hoardings, profession and entertainment tax, factory tax
and various cesses. In a few states, powers have been given to intermediate and district level
panchayats to raise revenues and these are mainly in the nature of assigned revenues such as
mineral cess, land/local cess, surcharge on stamp duty, entertainment tax etc23
. Yet, in a few
21 See, O.P. Bohra (1996) “Financial Resources of Panchayats in India” in conference on Emerging Trends in State-
Local Fiscal Relations in India, organized by National Institute of Rural Development, Hyderabad, December 18-19; I. Rajaraman (2003) A Fiscal Domain for Panchayats Oxford University Press, New Delhi (Reports of the Second State Finance Commission); H. D. Dwaraknath (2008) “Finances of Panchayati Raj Institutions in Andhra Pradesh” in M R Biju (ed), Financial Management of Panchayati Raj System Kanishka, New Delhi; K. Rajasekharan (2008) Local Government Finance in Kerala in M. R. Biju (ed.) Financial Management of Panchayati Raj System, New Delhi: Kanishka, 2008.
22 See, Ministry of Panchayat Raj (2004) Fifth Round Table of Ministry in- Charge of Panchayat Raj, Srinagar, October: 28-29.
23 See, S. P. Ranga Rao and P Syam Sundar Reddy (1996) “State-Local Financial Relations in Andhra Pradesh” conference on Emerging Trends in State-Local Fiscal Relations in India, organised by National Institute of Rural Development, Hyderabad, December 18-19; Abdul Aziz, N Sivanna, M Devendra Babu, Madhushree Sekher and C. Charles Nelson (2002) Decentralized Governance and Planning: A Comparative Study in Three South Indian States Macmillan, New Delhi.

78
other states, certain taxes such as motor vehicle tax, entertainment tax, and profession tax and
stamp duty are shared with different tiers of PRIs. Further, the panchayats are empowered to
raise non-tax revenues from their own properties and assets such as rent from shops and
buildings, auction of trees and fruits, sale of assets, fee on pilgrims and fairs, grazing lands
and mandies (markets) and licence fee etc24
. Apart from these, provisions for statutory and
discretionary transfers and borrowings have been provided. Another important provision
made in almost all the state PR Acts is constitution of a Finance Commission by the states
once in five years in conformity with Article 243(I) of the Constitution. The above legislative
measures both at the Central and state levels contemplates bestowing a variety of revenue
sources to PRIs: own revenue raising powers, assignments, tax sharing, grant-in-aid and
borrowing powers.
7.2.3 Fiscal Position of PRI’s in Rajasthan
Three main sources of revenue of PRI’s in Rajasthan are: (1) own income from
tax (2) own non-tax and (3) The transfer from center as well as state government. Apart from
this the PRIs also perform agency functions to implement various rural development
programmes for which funds are channelized through Zila Parishads and some funds are
made available to PRIs directly by government of India and Rajasthan government25
. It is
interesting to note that own income of PRIs constitutes negligible (1% to 2%) proportion of
total funds available to these PRIs in Rajasthan. Receipts from transfers from the higher level
of governments’ form the major chunk. Own income of PRIs in Rajasthan was 20.09 %
during 2000-01 (of the total fund) and it reduced to 0.04 % during 2004-05. Fund receipts
from state government have increased from 17.91 % during 2000-01 to 44.75 % during 2004-
05. It is understood that the PRIs are mostly depending on the funds from different levels of
governments.
It is evident that around Rs.336.12 lakhs was transferred to PRIs in Rajasthan
during 2004-05, which increased to Rs.2806.61 lakhs during 2011-12. As mentioned earlier
the transfer is a combination of (1) grants–in-aid from state government, and (2) grants from
11th
/12th
/13th
Union Finance Commission. It is observed that grant-in-aid from state
24 I. Rajaraman (2003) A Fiscal Domain for Panchayats Oxford University Press, New Delhi (Reports of the Second
State Finance Commission). 25 For a detail discussion on the power of PRIs in Rajasthan, see Report of the Third Finance Commission of
Rajasthan pp 159-160 and Rajasthan Panchayati Raj Act, 2009.

79
government has increased continuously. It was found to be more than double between 2010-
11 and 2011-12. Over the years the proportion of grants-in-aid from state government has
increased. When the proportion was 33.21 % during 2004-05, it has reached to 78.29 %
during 2011-12.
Table 7.3
Transfers to PRIs in Rajasthan (Rs. crores)
Years
Grants-in-aid from state
government
EFC/12th/13th Finance
Commission grants Total
2004-05 111.83 224.89 336.72
2005-06 128.72 245.99 374.71
2006-07 125.37 222.97 348.34
2007-08 166.27 146.04 312.31
2008-09 540.40 369.00 909.40
2009-10 853.21 246.00 1099.21
2010-11 1051.77 370.10 1421.87
2011-12 2197.21 609.40 2806.61
ACGR 57.64 12.86 36.29 Source: Audit Reports (Civil Local Bodies) for the year ended 31st March, 2004-05 to 2011-12
(Chapter-I: An Overview of Accounts and Finances of Panchayati Raj Institutions) (CAG-www.cag.gov.in)
Table 7.4
Percentage of PRIs Transfers to Total
Years
% out of total
Total
(Rs crores)
Grants-in-aid from state
government
EFC/12th/13th Finance Commission
grants
2004-05 33.21 66.79 336.72
2005-06 34.35 65.65 374.71
2006-07 35.99 64.01 348.34
2007-08 53.24 46.76 312.31
2008-09 59.42 40.58 909.40
2009-10 77.62 22.38 1099.21
2010-11 73.97 26.03 1421.87
2011-12 78.29 21.71 2806.61 Source: Audit Reports (Civil Local Bodies) for the year ended 31st March, 2004-05 to 2011-12
(Chapter-I: An Overview of Accounts and Finances of Panchayati Raj Institutions) (CAG-www.cag.gov.in)
Table 7.5
Functional Domain of Urban Local Bodies as per the 12th
Schedule Domains
Urban planning including town planning N
Regulation of land-use and construction of buildings Y
Planning for economic and social development Y
Roads and bridges Y
Water supply for domestic, industrial and commercial purposes N
Public health, sanitation conservancy and solid waste management Y
Fire services Y
Urban forestry, protection of the environment and promotion of ecological aspects Y
Safeguarding the interest of weaker sections of society, including the handicapped and mentally
retarded Y
Slum improvement and up-gradation Y
Urban poverty alleviation Y
Provision of urban amenities and facilities such as parks, gardens, playgrounds Y
Promotion of cultural, educational and aesthetic aspects Y
Burials and burial grounds, cremations, cremation grounds and electric crematoriums N
80
Cattle pounds, prevention of cruelty to animals Y
Vital statistics including registration of births and deaths Y
Public amenities including street lightening, parking lots, bus stops and public conveniences Y
Regulation of slaughterhouses and tanneries Y Sources:
Note: Y- assigned to municipalities.
7.3 Views on Own Efforts of Urban Local Bodies26
Most urban local bodies including corporations are significantly dependent on external
resources and effort to generate internal resources through tax effort is limited.
All most all urban local bodies have not fully implemented/ utilized the provisions of the
Rajasthan Municipal Act, 2009 for resource mobilization. There is very limited
diversification in taxes being levied.
Most urban local bodies have either not passed byelaws or have enacted just a few
byelaws, which have limited the scope for additional tax mobilization effort.
There is increased interference by the state in reducing the scope for taxes by urban local
bodies. The discussion revealed that state inference has put on the back foot the efforts
that were being made by urban local bodies. The biggest tax source, octroi, was abolished
without consulting the local bodies. The state government is compensating urban local
bodies, but quantum of compensation has been fixed at 1997 base with 5 % annual
increase, 10 % annual increase was promised27
. The restoration to 10 % annual increase is
vehemently called for by urban local bodies. The regular circulars issued by Directorate
of Local Self Government further are reducing area of operation of urban local bodies.
The most recent case is the mobile towers case.
Within urban local bodies there is an increasing conflict between the CEO and elected
representatives. It hinders the administration and enacting of byelaws. For better local
administration, area of functioning needs to be demarcated and clearly defined.
26 These are based on Surjit Singh, Motilal Mahamallik and Variender Jain (2013), Assessment of Revenue Potential
of Urban Local Bodies in Rajasthan a report submitted to 4th State Finance Commission, Rajasthan. 27 Studies have shown that alternatives to octroi, say VAT, the best rate is 10-12 %. However, if options like
property tax are to be used as alternative to octroi, the much greater efforts would be required (see, Report of
the Study Group for Devising Alternatives to Octroi, May 20, 2006). Also see, Anita Rath (2009) “Octroi: A Tax in
a Time Warp: What does its removal Imply for Greater Mumbai” Economic and Political Weekly, Vol. 44, No. 25.

81
Among the obligatory taxes only house tax and urban development tax are mainly
imposed. In large number of local bodies even these are not levied. Upper end local
bodies have huge arrears on this count. Even marginal increase in rates and better tax
administration would raise the revenue of the urban local bodies. The scope of house tax
needs to be widened from exiting 300 square yards. The property prices are going up
significantly and urban local bodies should use this as a major source of revenue. No
other obligatory taxes are levied across the urban local bodies. There are a few exceptions
in case of class IV municipalities.
Urban local bodies should use discretionary taxes to mobilize resources. For instance,
even the biggest Municipal Corporation in the state, Jaipur is not levying any
discretionary tax. Except for a few municipal boars, discretionary tax is not levied.
Discretionary taxes are levied at all or are minimal. It is observed that discretionary taxes
like vehicle tax, electricity tax, development tax, animal tax, advertisement tax and Path
Kar are being levied by class IV municipal boards. Other urban local bodies can learn
from these boards to raise their revenue potentials.
There are four sub components through which urban local bodies are raising their revenue
under development charges, (1) betterment charges, (2) development charges, (3) internal
development charges, and (4) external development charges. It is observed that, all
corporations are not collecting revenue through development charges. Out of total 184,
urban local bodies only two urban local bodies are collecting betterment charges, 45
urban local bodies collecting development charges, 8 and 73 urban local bodies each
collecting revenue through internal and external development charges respectively.
User charges are not uniform across municipal bodies. It is reasonable that uniformity
cannot be achieved but certain levies like road cutting charges can be imposed. One need
to go beyond this, regular rent is required to be charged for using local body’s pipes and
poles. Here, telephone companies and cable operators need to be brought under the net.
There is hardly any transaction cost involved in tax collection. The onus of this levy can
be put on the service provider and the basis could be cess on connections.
82
Entertainment tax has been abolished by the state. However, urban local bodies can
charge per show a certain amount (as suggested) from cinema halls for using urban
facilities.
Not all urban local bodies are charging sewerage maintenance/ gutter clearing charges. It
is because not all have this facility and also it is not thought to be important. Presently, 33
% is charged as sewerage charges of the water supply bill and if this rate is enhanced to
40 % significant revenue can accrue to the local bodies.
House to house garbage collection can raise resources of the local bodies.
Vehicle registration tax collected needs to be shared by the state with local bodies as road
maintenance is undertaken by local bodies.
Few class II and Class IV municipal boards are levying pollution tax, for instance, public
polluting business tax. Very few corporations and councils have taken initiative to levy
these taxes.
Entry tax is another major source of revenue which, at least corporations can impose
initially.
Establishment tax is another source to raise revenue of municipalities.
Many new potential areas are emerging like commercial centres (malls), professions,
tourism, hotels/ restaurants, many modern service sector activities which should be under
the ambit of various taxes. Green tax is new concept which can be tried by corporations.
Many cities in the countries are levying these taxes.
Tax administration has to improve. The lethargy in collecting house tax/ property taxes is
the most talked about case. The study found that penalties hardly collected across the
local bodies and if collected, the amount is too meagre. The personal relations and
pressure of vested interest hinders collection of penalties. Non-compliance is not
penalized.
83
The budget exercise is found to be just for sake of it. Every year, there are wide
differences in budgeted and actual figures. This difference in itself is the potential not
realized. Budget preparation training is required and budgets should be properly passed in
the meetings of the elected bodies. The devolution of funds/ grants from the state should
be incentive based.
Human resources are another hindrance. Efforts are required to provide for adequate and
qualified manpower to local bodies. There can be a cadre of municipal bodies’ staff.
There is hardly any information base with the local bodies that is readily available. Sound
tax base can emerge if systematic information base exists. Regular surveys should be
conducted. New taxes can be levied only if data bases are strong and updated. There
should be a separate statistic wing in municipalities. There should be transparency in
functioning of urban local bodies.
Balance sheets are not properly prepared and are not uniform. The nomenclature used
varies significantly. Many municipalities prepare balance sheets just to pass on
information to the Directorate. Balance sheets along with budget should be printed.
Besides, standardization is required in reporting systems. It is quite interesting that even
the annual report of Directorate of Local Self Government do not provide details on taxes
collected; only aggregates are provided. There are variations in what is reported. Capacity
building is required.
Coordination of various departments would help reduction in expenditure of
municipalities and help them provide better services to citizens. It is suggested that all
urban local bodies should have medium term expenditure framework. Planning for
minimum of three years is necessary in budget proposals. It could even be five years as
the term of the elected representatives is five years. In Rajasthan, an attempt is being
made to have sector medium term expenditure framework.
Finally, the present level of decentralization is insignificant. The first thing that can
be done is to force local bodies to implement Rajasthan Municipal Act 2009. The previous
two finance commissions have recommended significant decentralization but not much has

84
been achieved. Political interference should be minimal. Potential exist for resource
mobilization but for state intervention, best foot is not put forward.
JNNURM
Assistance available under JNNURM the following activities are required to be carried out:
Constitution of State Level Steering Committee (SLSC)
Identification of State Level Nodal Agency (SLNA) for the purpose of
implementation of the mission by the state government.
Formulation of a medium term City Development Plan (CDP) and Detailed Project
Report (DPR).
Drawing up timelines for Implementation of Urban Sector Reforms and Signing of
Tripartite Memorandum of Agreement by the state government, concerned urban
local bodies/ para statal Agencies with government of India
7.4 Status of Activities
The proposal to formulate State Level Steering Committee along with the
proposed composition was submitted to government of Rajasthan and approved. The
Rajasthan Urban Infrastructure Financing and Development Corporation (RUIFDCO) has
been formed and appointed as the State Level Nodal Agency (SLNA) for JNNURM. The
Urban Reform Agenda as per the issued guidelines were prepared and approved to implement
over the mission period. City Development Plans for Jaipur, Ajmer and Pushkar were
prepared.
7.5 Reform Agenda undertaken by Rajasthan
Rajasthan government undertook reforms as follows:
Financial Reforms: House tax collection has been simplified i.e. annual rental
value to area based collection.
Rationalization of stamp duty– reduced from 11 % to 3 %
Land and Building Department abolished to avoid multiple taxation
Urban Land Ceiling and Rent Control Act (ULCRA) has been repealed
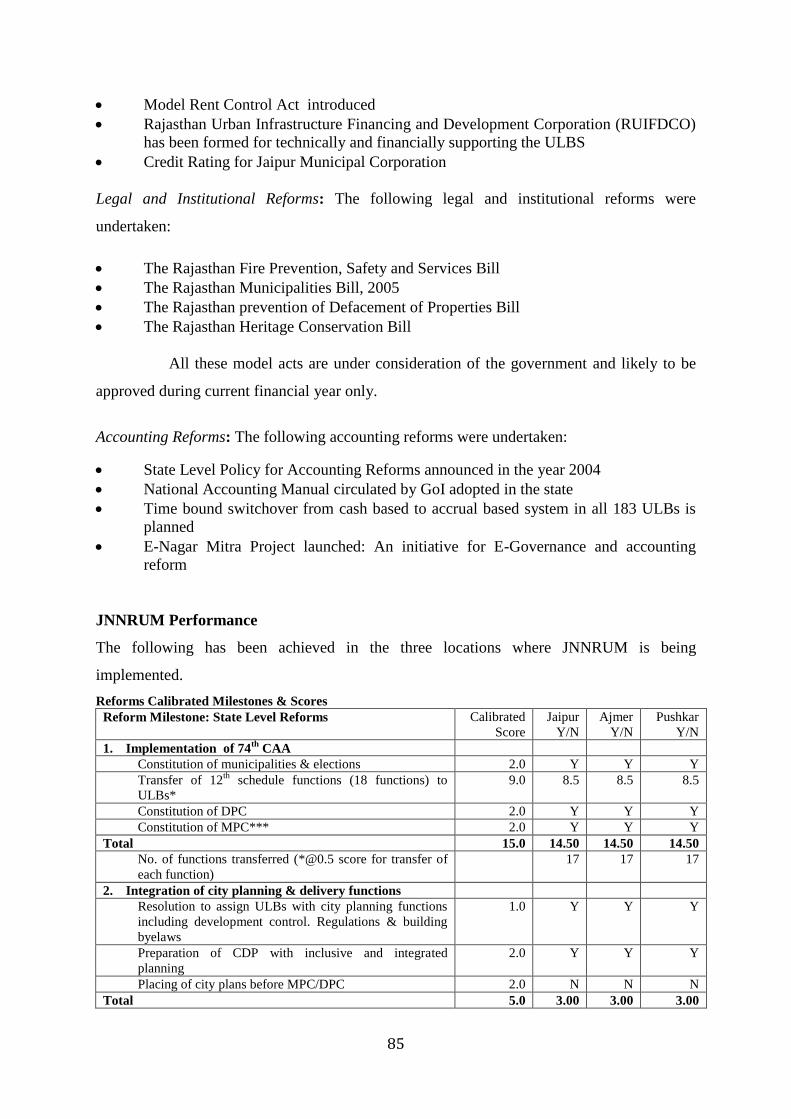
85
Model Rent Control Act introduced
Rajasthan Urban Infrastructure Financing and Development Corporation (RUIFDCO)
has been formed for technically and financially supporting the ULBS
Credit Rating for Jaipur Municipal Corporation
Legal and Institutional Reforms: The following legal and institutional reforms were
undertaken:
The Rajasthan Fire Prevention, Safety and Services Bill
The Rajasthan Municipalities Bill, 2005
The Rajasthan prevention of Defacement of Properties Bill
The Rajasthan Heritage Conservation Bill
All these model acts are under consideration of the government and likely to be
approved during current financial year only.
Accounting Reforms: The following accounting reforms were undertaken:
State Level Policy for Accounting Reforms announced in the year 2004
National Accounting Manual circulated by GoI adopted in the state
Time bound switchover from cash based to accrual based system in all 183 ULBs is
planned
E-Nagar Mitra Project launched: An initiative for E-Governance and accounting
reform
JNNRUM Performance
The following has been achieved in the three locations where JNNRUM is being
implemented.
Reforms Calibrated Milestones & Scores
Reform Milestone: State Level Reforms Calibrated
Score
Jaipur
Y/N
Ajmer
Y/N
Pushkar
Y/N
1. Implementation of 74th
CAA
Constitution of municipalities & elections 2.0 Y Y Y
Transfer of 12th
schedule functions (18 functions) to
ULBs*
9.0 8.5 8.5 8.5
Constitution of DPC 2.0 Y Y Y
Constitution of MPC*** 2.0 Y Y Y
Total 15.0 14.50 14.50 14.50
No. of functions transferred (*@0.5 score for transfer of
each function)
17 17 17
2. Integration of city planning & delivery functions
Resolution to assign ULBs with city planning functions
including development control. Regulations & building
byelaws
1.0 Y Y Y
Preparation of CDP with inclusive and integrated
planning
2.0 Y Y Y
Placing of city plans before MPC/DPC 2.0 N N N
Total 5.0 3.00 3.00 3.00

86
3. Reform in rent control
Availability of rent control Act 2.0 Y Y Y
Provision of fixation of standard rent 2.0 Y Y Y
Provision of revising rent periodically 2.0 Y Y Y
Balancing obligations of landlords and tenants 2.0 Y Y Y
Establish adjudication system for resolving disputes 2.0 Y Y Y
Total 10.0 10.00 10.00 10.00
4. Stamp duty rationalization to 5%
Reduce stamp duty to 5% (including surcharges) 5.0 Y Y Y
Preparation of guidance values/circle rates 2.5 Y Y Y
Annual revision of guidance values 2.5 Y Y Y
Total 10.0 10.00 10.00 10.00
5. Repeal of ULCRA
State legislature to pass a resolution in compliance with
the repeal of ULCRA passed by Parliament in 1999
7.0 Y Y Y
State government to issue notification in this regard 3.0 Y Y Y
Total 10.0 10.00 10.00 10.00
6. Enactment of community participation law
Notification of legislation for ensuring community
participation
2.5 Y Y Y
Constitution of ward committees 2.5 Y Y Y
Citizen charter with timelines 2.5 Y Y Y
Any additional provision/ instrument for citizen
participation
2.5 N N N
Total 10.0 7.50 7.50 7.50
7. Enactment of public disclosure law
Legislation of RTI Act 2.5 Y Y Y
Implementation of RTI Act 2.5 Y Y Y
Preparation of citizen charter 2.5 Y Y Y
Disclose through a website 2.5 Y Y Y
Total 10.0 10.00 10.00 10.00
Total state level score 70.0 65.00 65.00 65.00
Optional reforms (state level/ULB level)
1. Introduction of property title certification system in
ULBs
Arrangement for reflecting property titles in a legal
framework
2.5 N N N
Arrangement for adjudication for property title dispute 2.5 N N N
Notification of rules for smooth implementation 2.5 N N N
Setting up administrative system/process 2.5 N N N
Total 10.0 0.0 0.0 0.0
2. Revision of building byelaws– streamlining the approval
process
Notification of building byelaws in public domain 5.0 Y Y Y
Establish adjudication system for resolving disputes 2.5 Y Y N
Time frame for approval process 2.5 Y Y N
Total 10.0 10.0 10.0 5.0
3. Revision of building byelaws– to make rainwater
harvesting mandatory
Building byelaws of mandatorily provide for rainwater
harvesting
5.0 Y Y Y
Dissemination of such byelaws through website 2.0 Y Y Y
Start of approval as per the new building byelaws 3.0 Y Y Y
Total 10.0 10.0 10.0 10.0
4. Earmarking 25% developed land in all housing projects
for EWS/LIG
Notify the reservation of land between 20 and 25% in
housing projects (public/private)
5.0 Y Y Y

87
Review and revise building byelaws to reflect to
earmarked land to EWS/LIG
2.5 Y Y Y
Engaging with state departments for implementing
EDL (earmarking developed land)
2.5 Y Y Y
Total 10.0 10.0 10.0 10.0
5. Simplification of legal and procedural framework for
conversion of agricultural land for-non-agricultural
purposes
Availability of legal framework for conversion of
agricultural land for non-agricultural purposes
5.0 Y Y Y
Notification of rules and processes 2.5 Y Y Y
Establish adjudication system for resolving disputes 2.5 Y Y Y
Total 10.0 10.0 10.0 10.0
6. Introduction of computerized process of registration of
land and property
Computerized registration of land and properties 5.0 Y Y Y
Capturing of photo of seller & buyer 2.0 Y Y Y
Creation of database system 3.0 Y Y N
Total 10.0 10.0 10.0 7.0
7. Byelaws of reuse of recycled water
Building byelaws to mandatorily reflect reuse or
recycled water
8.0 Y Y Y
Dissemination of new building byelaws through
websites
2.0 Y Y Y
Total 10.0 10.0 10.0 10.0
8. Administrative reforms
Rules notified for personnel management systems in
local bodies
2.0 N N N
Grievance management system 2.0 Y Y Y
Computerization of administrative activities 2.0 Y Y N
Training and skill building initiatives 2.0 Y Y N
Encourage outsourcing of municipal activities 2.0 Y Y Y
Total 10.0 8.0 8.0 4.0
9. Structural reforms
Creation of municipal cadre 5.0 Y Y Y
Standing committee for municipal matters
(engineering, accounts, health, welfare etc.)
2.5 Y Y Y
Involvement of elected representatives in decision
making process
1.5 Y Y Y
Dispute resolution mechanism 1.0 N N N
Total 10.0 9 9 9
10. Encouraging public private participation
Project initiatives planned through PPP 6.0 Y Y Y
Setting up of PPP cell at state level 2.0 Y Y Y
Formulation of PPP policies and governance
framework
2.0 Y Y Y
Total 10.0 10.0 10.0 10.0
Total optional reforms score 100.0 87.0 87.0 75.0
Total score (23 reforms) 230.0 200.0 198.0 176.0 Note: Property ax: * 25%-50%: 1, above 50% to less than 85%: 2, 85% and above: 3, **Collection: 25%-50%: 1, above 50% to less than 75%: 1.5, Above 75% to less than 90%: 2.5, 90% and above:3
WS & SWM: *Collection of user charges will be considered as part of property tax if accounted under a separate head of account.
Score: 15 to 25%:1, 25 to 50%:2, Above 50% to 75%: 3, Above 75% to less than 100%: 3.5, 100% and above: 4 74th CAA: ***States exempted under 6th schedule of Constitution will be considered as having achieved this module. Also, in States
having no region eligible to be declared as metropolitan region, these 2 marks will be assigned pro-rata to their items.
Source:

88
ULB level Reforms Jaipur Ajmer Pushkar
1 e-Governance
Property tax 1.25 Y Y Y
Accounting 1.25 Y Y N
Water supply & other utilities 1.25 Y Y N
Birth & death registration and health programmes 1.25 Y Y Y
Citizens’ grievance monitoring 1.25 Y Y Y
Personnel management system 1.25 Y Y Y
Building plan approval 1.25 Y Y Y
e-procurement 1.25 Y Y Y
Total 10.0 10.00 10.00 7.50
2. Shift to actual based double entry accounting
Preparation of State municipal accounting manual 1.5 Y Y Y
Manual approval & adoption by the local body 1.5 Y Y N
Listing the Assets and liabilities at ULB level 1.0 Y Y N
Valuation of assets 1.0 Y Y N
Preparation of opening balance sheet 1.0 Y Y N
Migration to DEAS 1.5 Y Y N
Appointment of Audit officers/CA/cadre 2.5 Y Y N
Total 10.0 10.00 10.00 1.50
3. Property tax ( 85% Coverage)
Notification/amendment of Act on collection of property tax 1.0 Y Y Y
Extending of property tax to all properties 1.0 Y Y Y
Posting of tax details in the public domain & migration to
standardized self-assessment system of property taxation on the
basis of periodic revisions and review of rates
1.0 Y Y Y
Setting up non-discretionary method for determination of
property tax (unit area method or capital value method)
1.0 N N N
Coverage (85%) 3.0 1.0 1.0 1.0
Collection efficiency (90%) 3.0 1.0 1.0 1.0
Total 10.0 5.00 5.00 5.00
4. 100% O&M cost recovery in water supply & SWM
Formulate & adopt a policy on user charges 1.0 Y Y Y
Separate accounting system for user charges- water supply 0.5 N N N
Separate accounting system for user charges- SWM 0.5 N N N
Collection O&M charges (WS) 4.0 2.0 2.0 2.0
Collection O&M charges (SWM) 4.0 1.0 1.0 2.0
Total 10.0 4.00 4.00 5.00
5. Internal earmarking of fund for services to urban poor
Formulate & adopt a policy on earmarking funds for urban poor 2.5 Y Y Y
Creation of separate municipal budget for “services to the urban
poor”
2.5 Y Y Y
Targeted expenditure (20-25%) 2.5 Y Y Y
Actual spent as % of budgeted 2.5 Y Y Y
Total 10.0 10.00 10.00 10.00
6. Provision of basic services to urban poor
1. Creation of database of Households 1.5 Y Y Y
2. Whether municipal budget has provided any funds to achieve 7
point charter services listed below
Housing 1.0 Y Y Y
Water supply 1.5 Y Y Y
Sanitation 1.5 Y Y Y
SWM 1.5 Y Y Y
Primary education 1.0 N N N
Healthcare 1.0 Y N N
Social security 1.0 Y N N
Total 10.0 9.00 7.00 7.00

89
Total ULB level score 60.0 48.00 46.00 36.00
Jaipur Ajmer Pushkar
e- governance 10.0 10.0 10.0 7.5
Shift to actual based double entry accounting 10.0 10.0 10.0 1.5
Property tax ( 85% coverage & 90% collection efficiency) 10.0 5.0 5.0 5.0
100% O&M cost recovery in water supply & SWM 10.0 4.0 4.0 5.0
Internal earmarking of fund for services to urban poor 10.0 10.0 10.0 10.0
Provision of basic services to urban poor 10.0 9.0 7.0 7.0
Total ULB level score 60.0 48.0 46.0 36.0
State level reforms
Implementation of 74th
CAA 15.0 14.5 14.5 14.5
Integration of city planning & delivery function 5.0 3.0 3.0 3.0
Reforms in rent control 10.0 10.0 10.0 10.0
Stamp duty rationalization to 5% 10.0 10.0 10.0 10.0
Repeal of ULCRA 10.0 10.0 10.0 10.0
Enactment of community participation law 10.0 7.5 7.5 7.5
Enactment of public disclosure law 10.0 10.0 10.0 10.0
Total state level reforms 70.0 65.0 65.0 65.0
Optional reforms (state level/ULB level)
Introduction of property title certification system in ULBs 10.0 0.0 0.0 0.0
Revision of building byelaws– streamlining the approval process 10.0 10.0 10.0 5.0
Revision of building byelaws– to make rainwater harvesting
mandatory
10.0 10.0 10.0 10.0
Earmarking 25% developed land in all housing projects for
EWS/LIG
10.0 10.0 10.0 10.0
Simplification of legal and procedural framework for conversion of
agricultural land for-non-agricultural purposes
10.0 10.0 10.0 10.0
Introduction of computerized process of registration of land and
property
10.0 10.0 10.0 7.0
Byelaws of reuse of recycled water 10.0 10.0 10.0 10.0
Administrative reforms 10.0 8.0 8.0 4.0
Structural reforms 10.0 9.0 9.0 9.0
Encouraging public private participation 10.0 10.0 10.0 10.0
Total optional reforms score 100.0 87.0 87.0 75.0
Total score (23 reforms) 230.0 200.0 198.0 176.0
% of reforms achievement 87% 86% 77%
7.6: Conclusion
The local bodies have been assigned the powers of taxation and expenditure
responsibilities since the inception of the federal structure of governance in India. In order to
increase the autonomy of these bodies further the constitutional sanctity have been assigned
to them under the 73rd
and 74th
amendment act. In addition to this, the central and state
government transferred revenues to strengthen their revenue capacity. However larger
asymmetry was observed between their revenue capacity and expenditures responsibilities
which deteriorated the financial position of these bodies. To make the fiscal health of these
bodies strong State Finance Commissions have been appointed which consider about the
financial position of the bodies and recommends required amount of revenue transfers from
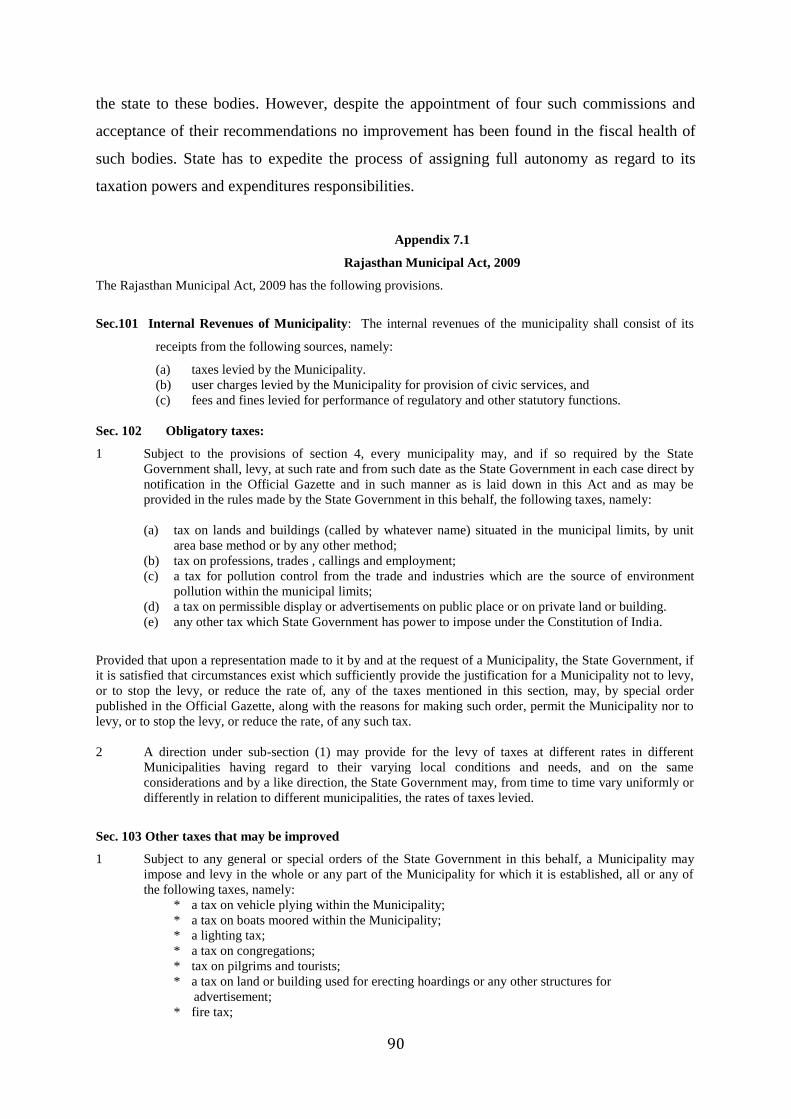
90
the state to these bodies. However, despite the appointment of four such commissions and
acceptance of their recommendations no improvement has been found in the fiscal health of
such bodies. State has to expedite the process of assigning full autonomy as regard to its
taxation powers and expenditures responsibilities.
Appendix 7.1
Rajasthan Municipal Act, 2009
The Rajasthan Municipal Act, 2009 has the following provisions.
Sec.101 Internal Revenues of Municipality: The internal revenues of the municipality shall consist of its
receipts from the following sources, namely:
(a) taxes levied by the Municipality.
(b) user charges levied by the Municipality for provision of civic services, and
(c) fees and fines levied for performance of regulatory and other statutory functions.
Sec. 102 Obligatory taxes:
1 Subject to the provisions of section 4, every municipality may, and if so required by the State
Government shall, levy, at such rate and from such date as the State Government in each case direct by
notification in the Official Gazette and in such manner as is laid down in this Act and as may be
provided in the rules made by the State Government in this behalf, the following taxes, namely:
(a) tax on lands and buildings (called by whatever name) situated in the municipal limits, by unit
area base method or by any other method;
(b) tax on professions, trades , callings and employment;
(c) a tax for pollution control from the trade and industries which are the source of environment
pollution within the municipal limits;
(d) a tax on permissible display or advertisements on public place or on private land or building.
(e) any other tax which State Government has power to impose under the Constitution of India.
Provided that upon a representation made to it by and at the request of a Municipality, the State Government, if
it is satisfied that circumstances exist which sufficiently provide the justification for a Municipality not to levy,
or to stop the levy, or reduce the rate of, any of the taxes mentioned in this section, may, by special order
published in the Official Gazette, along with the reasons for making such order, permit the Municipality nor to
levy, or to stop the levy, or reduce the rate, of any such tax.
2 A direction under sub-section (1) may provide for the levy of taxes at different rates in different
Municipalities having regard to their varying local conditions and needs, and on the same
considerations and by a like direction, the State Government may, from time to time vary uniformly or
differently in relation to different municipalities, the rates of taxes levied.
Sec. 103 Other taxes that may be improved
1 Subject to any general or special orders of the State Government in this behalf, a Municipality may
impose and levy in the whole or any part of the Municipality for which it is established, all or any of
the following taxes, namely:
* a tax on vehicle plying within the Municipality;
* a tax on boats moored within the Municipality;
* a lighting tax;
* a tax on congregations;
* tax on pilgrims and tourists;
* a tax on land or building used for erecting hoardings or any other structures for
advertisement;
* fire tax;

91
* a tax on deficit in parking spaces in any non-residential building;
* a surcharge on stamp duty at the rate not exceeding (10%) of the stamp duty;
* any other tax which the State Government has power to impose under the Constitution.
2 Nothing in this section shall authorize or be deemed to authorize the imposition or levy of any tax,
which the State Government has no power under the Constitution to impose or levy in the State.
3 The levy, assessment and collection of taxes under this section shall be in accordance with the
provisions of this Act and the rules and the byelaws made there under.
Sec. 104 Power to levy user charges: The Municipality may levy user charges for
(a) provision of drainage and sewerage,
(ii) solid waste management
(iii) Parking of different types of vehicles in different areas and for different periods,
(iv) stacking of materials or rubbish on public streets for construction, alteration, repair or demolition
work of any type; and
(v) any other civic service, in such manner, and at such rates as may be determined by it from time to
time with prior approval of the State Government;
Provided that the State Government may direct the Municipality to levy any of the user charges as aforesaid,
which the Municipality has not levied or has postponed.
Sec. 105 Power to levy fees and fines
The Municipality shall have the power to levy fees and fines in exercise of the regulatory powers vested in it by
or under this Act or the rules or the bye-laws made there under for
(a) sanction of building plans and issue of completion certificates,
(b) issue of municipal licenses for various, non-residential uses of lands and buildings,
(c) licensing of
(i) various categories of professionals such as plumbers and surveyors,
(ii) various activities such as sinking of tube-wells, sale of meat, fish or poultry, or hawking
of articles,
(iii) sites used for advertisements or premises used for private markets, slaughterhouses,
hospitals, nursing homes, clinics, factories, warehouses, godowns, goods transport
depots, eating-houses, lodging-houses, hotels, theatres, cinema-houses, lodging-houses,
hotels, theatres, cinema-houses and places of public amusement and for other non-
residential uses.
(iv) animals.
(v) carts or carriages, and
(vi) such other activities as require a license or permission under the provisions of this Act,
and
(d) issue of birth and death certificates, in accordance with the provision of this Act, and the rules or
bye-laws made there under.
Sec. 106 Power to levy development charge:
1 The Municipality may levy such development charge as may be determined by byelaws, from time to
time
(a) on any residential building with a height of more than fourteen meters, or any non-residential
building, having regard to its location along a particular category of street, its use
characteristics, and sanctioned built up area, and
(b) for development or redevelopment of any existing area, in accordance with any development
plan or while approving any sub division plan of that area.
2 Any such development charge shall be paid in advance by the developer before commencing any
activity on the approved plan or sub-division.
3 In case of redevelopment of the area, the charge shall be payable by all the residents and beneficiaries
of the development.
4 The Municipality shall keep a separate account of such development charge and shall not divert it for
any other use.

92
Appendix 7.2
Revenue of ULBs in Rajasthan by Sources (Rs. lakhs)
Sources 1994-95 1995-96 1996-97 1997-98 1998-99 1999-00 2000-01
Tax Revenue 17478.79 23493.79 25580.92 26811.64 10935.94 4246.02 2092.42
Octroi 16395.31 22156.76 23972.09 25122.65 9507.94 2812.31 17.33
Land & Building
tax 719.10 802.16 1065.62 1076.90 1094.01 1254.64 1872.61
Obligatory
taxes 17114.41 22958.92 25037.71 26199.55 10601.95 4066.95 1889.94
Tax on Vehicles 30.20 38.58 39.42 25.68 8.92 9.04 7.52
Tools 116.93 145.30 146.31 221.90 78.34 8.36 8.23
Terminal tax 16.22 22.23 18.73 16.78 10.99 6.63 22.84
Passenger tax 84.96 98.53 103.81 104.18 111.18 112.57 100.85
Other taxes 116.07 230.23 234.94 243.55 124.56 42.47 63.04
Discretionary
Taxes 364.38 534.87 543.21 612.09 333.99 179.07 202.48
Non Tax
Revenue
Bye laws 905.28 665.65 1987.94 1202.42 1326.50 1071.27 2150.80
Properties 401.90 459.82 530.22 565.60 611.38 647.96 843.75
Act 65.14 63.99 76.61 80.81 58.31 95.87 188.56
Fines &
Penalties 91.26 128.76 140.88 127.84 108.07 136.15 212.64
Water Works 8.92 56.30 63.87 40.67 29.81 72.36 26.66
Interest 232.26 293.51 458.55 446.75 583.46 523.96 272.84
Sales of Land 1768.34 1911.96 2983.13 2686.63 2664.79 3151.03 3892.42
Miscellaneous 1017.17 1386.06 1660.24 2227.79 2122.40 1993.81 1553.19
Total Internal
Income 4490.27 4966.05 7901.44 7378.51 7504.72 7692.41 9140.86
General Purpose
Grant 1061.81 1381.82 1635.24 2268.48 2459.41 2174.98 2019.51
Special Grants
(RD&DR) 511.50 1661.62 1219.43 1245.08 1877.80 890.97 1220.40
Compensation
for Octroi 35.70 64.26 57.24 800.04 18705.92 28670.38 35004.53
Grant under SFC 123.07 726.60 630.20 1185.57 1848.51 1303.49 593.22
Grant under TFC 200.61 479.02 186.00 1250.11 1162.82 596.30 1720.93
Special
Assistance 708.82 1612.12 2104.78 1711.46 2407.57 1421.49 934.63
Share of entry
tax 33.32 29.46 38.73 112.60 1052.89 23.79 22.85
Loans 270.01 569.68 562.25 791.88 1601.72 680.55 557.50
Miscellaneous 2539.34 3247.79 4190.38 5002.70 5594.86 4124.98 6005.52
Total External
Income 5484.18 9772.37 10624.25 14367.92 36711.50 39886.93 48079.09
Total Non tax
revenue 9974.45 14738.42 18525.69 21746.43 44216.22 47579.34 57219.95
Grand Total 27453.24 38232.21 44106.61 48558.07 55152.16 51825.36 59312.37 Source: Reports of State Finance Commissions and Directorate of Local Self Government, Rajasthan Annual Reports.
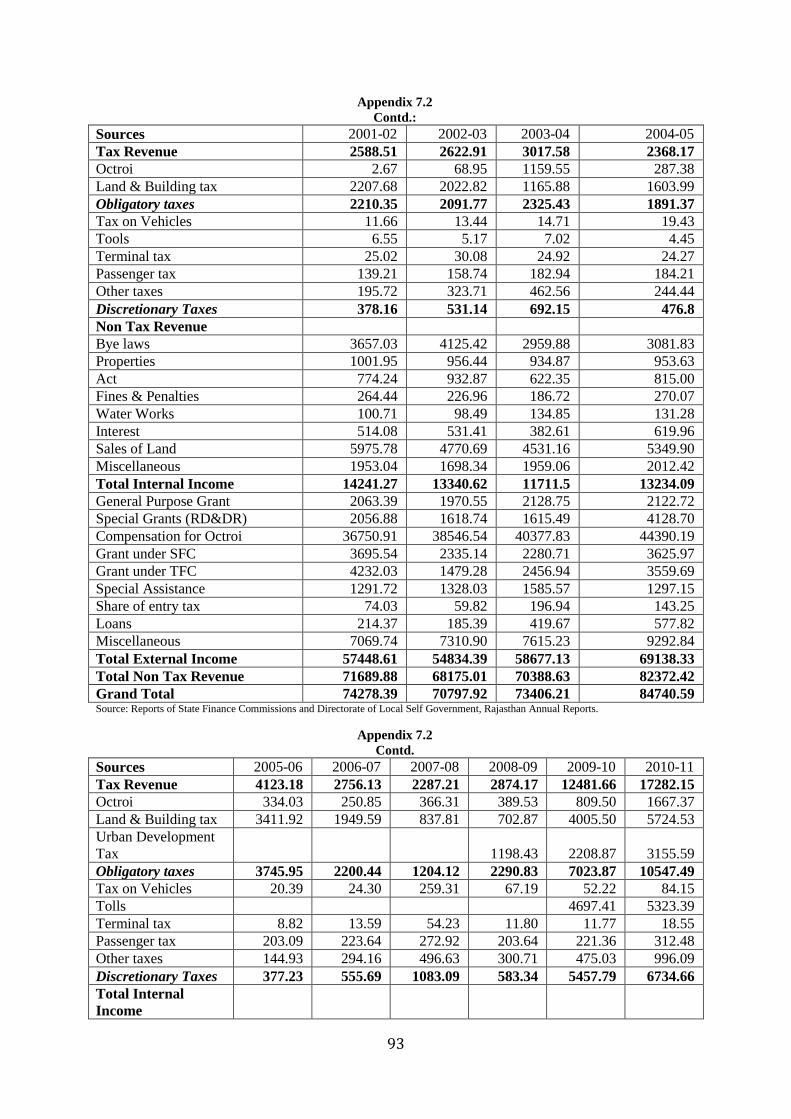
93
Appendix 7.2
Contd.:
Sources 2001-02 2002-03 2003-04 2004-05
Tax Revenue 2588.51 2622.91 3017.58 2368.17
Octroi 2.67 68.95 1159.55 287.38
Land & Building tax 2207.68 2022.82 1165.88 1603.99
Obligatory taxes 2210.35 2091.77 2325.43 1891.37
Tax on Vehicles 11.66 13.44 14.71 19.43
Tools 6.55 5.17 7.02 4.45
Terminal tax 25.02 30.08 24.92 24.27
Passenger tax 139.21 158.74 182.94 184.21
Other taxes 195.72 323.71 462.56 244.44
Discretionary Taxes 378.16 531.14 692.15 476.8
Non Tax Revenue
Bye laws 3657.03 4125.42 2959.88 3081.83
Properties 1001.95 956.44 934.87 953.63
Act 774.24 932.87 622.35 815.00
Fines & Penalties 264.44 226.96 186.72 270.07
Water Works 100.71 98.49 134.85 131.28
Interest 514.08 531.41 382.61 619.96
Sales of Land 5975.78 4770.69 4531.16 5349.90
Miscellaneous 1953.04 1698.34 1959.06 2012.42
Total Internal Income 14241.27 13340.62 11711.5 13234.09
General Purpose Grant 2063.39 1970.55 2128.75 2122.72
Special Grants (RD&DR) 2056.88 1618.74 1615.49 4128.70
Compensation for Octroi 36750.91 38546.54 40377.83 44390.19
Grant under SFC 3695.54 2335.14 2280.71 3625.97
Grant under TFC 4232.03 1479.28 2456.94 3559.69
Special Assistance 1291.72 1328.03 1585.57 1297.15
Share of entry tax 74.03 59.82 196.94 143.25
Loans 214.37 185.39 419.67 577.82
Miscellaneous 7069.74 7310.90 7615.23 9292.84
Total External Income 57448.61 54834.39 58677.13 69138.33
Total Non Tax Revenue 71689.88 68175.01 70388.63 82372.42
Grand Total 74278.39 70797.92 73406.21 84740.59 Source: Reports of State Finance Commissions and Directorate of Local Self Government, Rajasthan Annual Reports.
Appendix 7.2
Contd.
Sources 2005-06 2006-07 2007-08 2008-09 2009-10 2010-11
Tax Revenue 4123.18 2756.13 2287.21 2874.17 12481.66 17282.15
Octroi 334.03 250.85 366.31 389.53 809.50 1667.37
Land & Building tax 3411.92 1949.59 837.81 702.87 4005.50 5724.53
Urban Development
Tax 1198.43 2208.87 3155.59
Obligatory taxes 3745.95 2200.44 1204.12 2290.83 7023.87 10547.49
Tax on Vehicles 20.39 24.30 259.31 67.19 52.22 84.15
Tolls 4697.41 5323.39
Terminal tax 8.82 13.59 54.23 11.80 11.77 18.55
Passenger tax 203.09 223.64 272.92 203.64 221.36 312.48
Other taxes 144.93 294.16 496.63 300.71 475.03 996.09
Discretionary Taxes 377.23 555.69 1083.09 583.34 5457.79 6734.66
Total Internal
Income
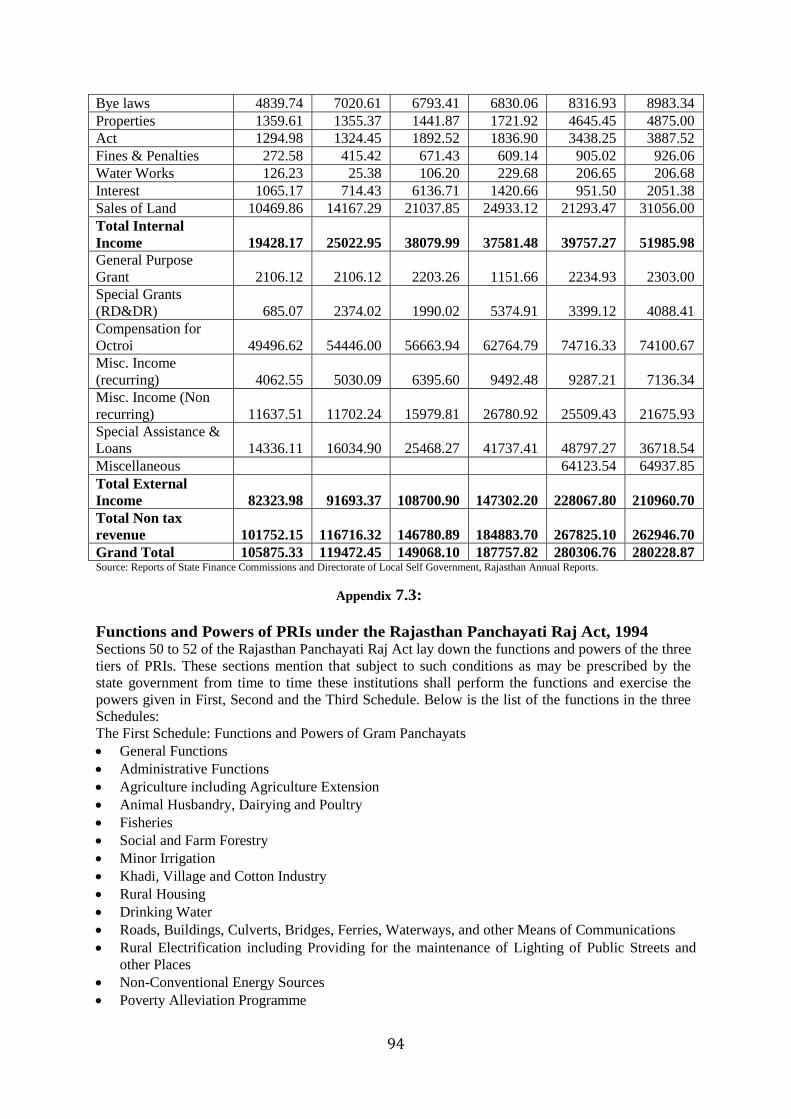
94
Bye laws 4839.74 7020.61 6793.41 6830.06 8316.93 8983.34
Properties 1359.61 1355.37 1441.87 1721.92 4645.45 4875.00
Act 1294.98 1324.45 1892.52 1836.90 3438.25 3887.52
Fines & Penalties 272.58 415.42 671.43 609.14 905.02 926.06
Water Works 126.23 25.38 106.20 229.68 206.65 206.68
Interest 1065.17 714.43 6136.71 1420.66 951.50 2051.38
Sales of Land 10469.86 14167.29 21037.85 24933.12 21293.47 31056.00
Total Internal
Income 19428.17 25022.95 38079.99 37581.48 39757.27 51985.98
General Purpose
Grant 2106.12 2106.12 2203.26 1151.66 2234.93 2303.00
Special Grants
(RD&DR) 685.07 2374.02 1990.02 5374.91 3399.12 4088.41
Compensation for
Octroi 49496.62 54446.00 56663.94 62764.79 74716.33 74100.67
Misc. Income
(recurring) 4062.55 5030.09 6395.60 9492.48 9287.21 7136.34
Misc. Income (Non
recurring) 11637.51 11702.24 15979.81 26780.92 25509.43 21675.93
Special Assistance &
Loans 14336.11 16034.90 25468.27 41737.41 48797.27 36718.54
Miscellaneous 64123.54 64937.85
Total External
Income 82323.98 91693.37 108700.90 147302.20 228067.80 210960.70
Total Non tax
revenue 101752.15 116716.32 146780.89 184883.70 267825.10 262946.70
Grand Total 105875.33 119472.45 149068.10 187757.82 280306.76 280228.87 Source: Reports of State Finance Commissions and Directorate of Local Self Government, Rajasthan Annual Reports.
Appendix 7.3:
Functions and Powers of PRIs under the Rajasthan Panchayati Raj Act, 1994 Sections 50 to 52 of the Rajasthan Panchayati Raj Act lay down the functions and powers of the three
tiers of PRIs. These sections mention that subject to such conditions as may be prescribed by the
state government from time to time these institutions shall perform the functions and exercise the
powers given in First, Second and the Third Schedule. Below is the list of the functions in the three
Schedules:
The First Schedule: Functions and Powers of Gram Panchayats
General Functions
Administrative Functions
Agriculture including Agriculture Extension
Animal Husbandry, Dairying and Poultry
Fisheries
Social and Farm Forestry
Minor Irrigation
Khadi, Village and Cotton Industry
Rural Housing
Drinking Water
Roads, Buildings, Culverts, Bridges, Ferries, Waterways, and other Means of Communications
Rural Electrification including Providing for the maintenance of Lighting of Public Streets and
other Places
Non-Conventional Energy Sources
Poverty Alleviation Programme

95
Education (Primary)
Adult and Non-Formal Education
Libraries
Cultural Activities
Markets and Fairs
Rural Sanitation
Public Health and Family Welfare
Women and Child Development
Social Welfare including Welfare of the Handicapped and Mentally Retarded
Welfare of the Weaker Sections and in particular the Schedule Castes and Schedule Tribes
Public Distribution System
Maintenance of Community Assets
Constructions and Maintenance of Dhramshalas and similar Institutions
Construction and Maintenance of Cattle Shades, Ponds, and Cart Stands
Construction and Maintenance of Slaughter Houses
Maintenance of Public Parks, Playgrounds etc.
Regulation of Manure Pits and Public Places
Regulation of Liquor Shops
General Powers of the Panchayats
The Second Schedule: Functions and Powers of Panchayat Samitis
1 . General Functions
2 . Agriculture including Agriculture Extension
3 . Land Improvement and Soil Conservation
4 . Minor Irrigation, Water Management and Watershed Development
5 . Poverty Alleviation Programme
6 . Animal Husbandry, Dairying and Poultry
7 . Fisheries
8 . Khadi, Village and Cotton Industries
9 . Rural Housing
1 0 . Drinking Water
1 1 . Social and farm Forestry, Fuel and Fodder
1 2 . Roads, Buildings, Culverts, Bridges, Ferries, Waterways, and other Means of Communications
1 3 . Non-Conventional Energy Sources
1 4 . Education including Primary Schools
1 5 . Technical Training and Vocational Training
1 6 . Adult and Non-Formal Education
1 7 . Cultural Activities
1 8 . Markets and Fairs
1 9 . Health and Family Welfare
2 0 . Women and Child Development
2 1 . Social Welfare including Welfare of the Handicapped and Mentally Retarded
2 2 . Welfare of the Weaker Sections and in particular the Schedule Castes and Schedule Tribes
2 3 . Maintenance of Community Assets
2 4 . Statistics
2 5 . Emergency Relief
2 6 . Co-operation
2 7 . Libraries
2 8 . Supervision of and Guidance to the Panchayats in all their Activities and Formulation of
Village and Panchayat Plans
2 9 . Miscellaneous
3 0 . General Powers of the Panchayat Samiti
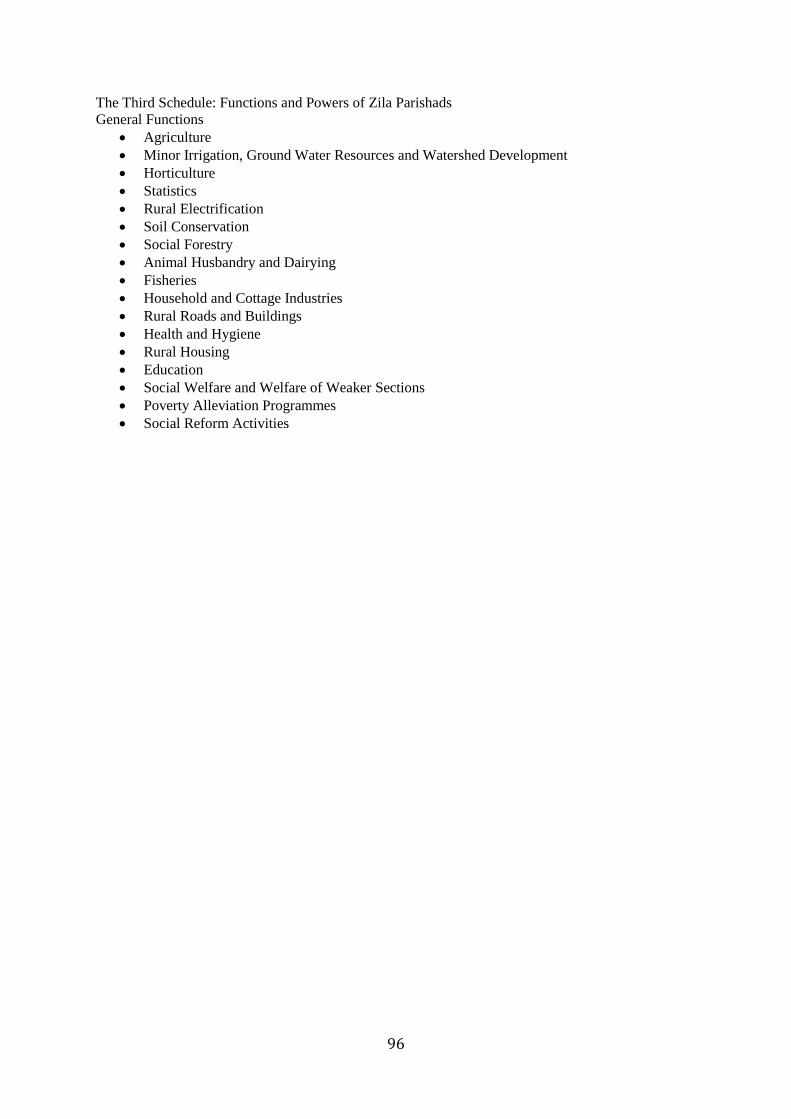
96
The Third Schedule: Functions and Powers of Zila Parishads
General Functions
Agriculture
Minor Irrigation, Ground Water Resources and Watershed Development
Horticulture
Statistics
Rural Electrification
Soil Conservation
Social Forestry
Animal Husbandry and Dairying
Fisheries
Household and Cottage Industries
Rural Roads and Buildings
Health and Hygiene
Rural Housing
Education
Social Welfare and Welfare of Weaker Sections
Poverty Alleviation Programmes
Social Reform Activities

97
Chapter 8
Impact of Power Sector Reforms on
Rajasthan’s Fiscal Health 8.1 Introduction
Power sector in most states of India has become a fiscal drag. Several state
governments have therefore initiated measures to contain its perverse influence. On March
21, 2000, the Government of Rajasthan approved a provisional Financial Restructuring Plan
of the state power sector and drafted a provisional transfer scheme. On July 19, 2000, GoR
accomplished the first major reform milestone by notifying “Rajasthan Power Sector
Reforms Transfer Scheme 2000” and thereby restructured its vertically integrated Electricity
Board (RSEB) to form 5 successor companies namely (see Rajasthan Power Sector, 2005):
* Rajasthan Rajya Vidyut Utpadan Nigam Limited (RVUN) to manage the electricity
generation business of erstwhile RSEB.
* Rajasthan Rajya Vidyut Prasaran Nigam Limited (RVPN) to manage the electricity
transmission and bulk supply business of erstwhile RSEB. In addition, RVPN owns
Rajasthan’s capacity share in the shared power stations of BBMB, Chambal Complex,
and Satpura.
* Jaipur Vidyut Vitran Nigam Limited (Jaipur DISCOM) to manage the electricity
distribution and retail supply business of erstwhile RSEB in Alwar, Bharatpur, Jaipur
city, Jaipur district, Dausa, Kota, Jhalawar, and Sawai Madhopur circles.
* Ajmer Vidyut Vitran Nigam Limited (Ajmer DISCOM) to manage the electricity
distribution and retail supply business of erstwhile RSEB in Banswara, Udaipur,
Chittorgarh, Bhilwara, Ajmer, Nagaur, Sikar, and Jhunjhunu circles.
* Jodhpur Vidyut Vitran Nigam Limited (Jodhpur DISCOM) to manage the electricity
distribution and retail business of erstwhile RSEB in Sriganganagar, Hanumangarh,
Churu, Bikaner, Barmer, Jodhpur city, Jodhpur district, and Pali circles.
8.2 Policy initiatives undertaken by the Government of Rajasthan
In 1991, Government of India opened the power generation industry to private
sector investment in an effort to mobilise resources for power generation. In 1993,
Government of Rajasthan decided to reform its power sector with the objective of creating
conditions for sustainable development of the power sector and improving efficiency and
quality of service to the consumers by allowing private participation in the State power
sector, particularly in generation. This was followed by a Broad Reform Policy Statement,
issued in September 1995, with the aim of attracting private investment and expertise to

98
expand and improve electricity services in the State and to enable the sector to gain access to
capital markets and commercial financing.
In the past almost exclusive reliance was placed on facilitating private power
generation through Independent Power Producers (IPP’s) and transfer of selected existing
generating stations to the private sector adopting the international competitive bidding route.
Letters of intent were issued for liquid fuel based power plants of smaller capacity ranging
between 50 MW to 166 MW having low gestation period and Power Purchase Agreements
(PPA’s) were signed for 2646 MW capacity. PPA’s were also signed for 702 MW naptha
based and 500 MW lignite based projects. Though these two projects received the techno-
economic clearance of Central Electricity Authority (CEA), yet in neither case financial
closure has been attained. Thus there has been virtually no progress in regard to
implementation of these projects. Slow progress of private sector projects have given rise to
the need to pursue the power generation projects in the State sector with greater vigor, while
continuing to support private sector initiatives in generation.
With this end, the State Government has decided to take up the 2x250 MW
Suratgarh Thermal Power Station Stage II in the State sector. Simultaneously, on the basis of
the recommendations of a Cabinet Sub Committee, especially set up for this purpose, some of
the PPA’s, previously signed, have been reviewed with a view to increase the prospects of
their achieving quick financial closure.
Government of Rajasthan has also announced a policy to encourage generation
based on non-conventional energy sources, on 11th
March 99, in which a number of
concessions have been offered.
Presently the agricultural sector, and to a lesser extent the domestic sector, are
highly subsidized, resulting in annual revenue deficit. This shortfall is compensated by
subsidies from the State Government and long term borrowings from the open market and
financial institutions. The reforms programme aims to eliminate need for any State subsidies
in a phased manner and make the power sector not only self-reliant but a net generator of
resources for the State’s economy over a period of time. . In case of Rajasthan, the
government has a huge contingent liability on PSUs in general and DISCOM in particular.

99
To meet the growing requirements of investment in power sector for improved
availability of power, the State Government undertakes that the resources generated as a
result of the divestitures of the existing entities shall be ploughed back specifically for the
development of the power sector.
The State has added significantly to power generation capacity. However, much of
State's power generation is based on coal which requires to be transported from long distances adding
to cost of power generation. The State has virtually no natural resource for generation of power, except
abundance of sun shine. However, solar power is still quite costly. Owing to its natural disadvantages
in power generation, the State has to depend on inter-State and Central sector power generating units for
meeting its requirements. For transmitting power from distant sources, mostly located outside the State
or at the south-eastern and southern peripheries of the State, huge investments in the distribution
system (both transmission and sub-transmission) are required to be made. Long distance leads to
larger transmission losses, which ultimately affect the revenues of the Power Companies for
which adequate compensation in the form of subsidies has to be provided by the State Government.
While the State charges 90 paise per unit of power supplied to agriculture, and there are virtually
no subsidy for other classes of the electricity consumers, the higher cost of power generation and
transmission losses has forced the State to recover only about 60 percent of the cost of power
generation requiring massive support from the State exchequer to the power sector.
8.3 Conclusion:
Power sector plays a vital role in shaping the fiscal health of the state through the
revenue generation with the provision of power supply to different investment sectors which
in turn further the flow of income to the state. However it has been observed that despite the
various remedial measures undertaken by Rajasthan government the power sector has not
been self sufficient. In addition to it, it has withdrawn a large amount of money from the state
exchequer in the form of subsidies. This has adversely affected the fiscal health of the state.
The summary of recommendations made by the Fourth SFC in Interim Reports for the year 2010-11 to
2012-13 with respect to fmancial devolution to the local bodies is as under:
In the first Interim Report which pertains to the years 2010-11 and 2011-12, the following
recommendations were made: (a) 3 Percent of State's net own tax revenue to be devolved to the local
bodies and (b) The distribution of funds between PRIs and ULBs be made in ratio of 75.7:24.3 based

100
on projected population as on 1st March, 2005. Accordingly the SFC worked out the share of these
bodies as indicated below:-
Rs. in crore
Institutions 2010-11 2011-12
Panchayati Raj Institutions 420.15 460.90 Urban Local Bodies 134.87 147.95
Total 555.02 608.85
(i) The Interim Report—II for the year 2012-13, contained the following recommendations:
(a) Percent of State's net own tax revenue to be devolved to the
local bodies.
(b) The distribution of funds between PRIs and ULBs be made in ratio of 75.1:24.9 based on
population of rural and urban areas as per Census 2011. Accordingly the SFC worked out the
share of these bodies as indicated below:-
Rs. in crore)
Institutions 2012-13
Panchayati Raj Institutions 980.47
Urban Local Bodies 325.08
Total 1305.55
Besides, the Commission also recommended for transfer of 3% amount of royalty on minerals,
100% Land Revenue to Gram Panchayats and devolution of 25% of Entry Tax, 3% of Royalty
on Petroleum, 2% cess on Excise Duty and 10% surcharge on Stamp duty to PRIs and ULBs.
The norms of Zakaria Committee are very old and do not have much relevance in the
present day scenario. Since 1963 significant changes have occurred in the life style of the
citizens and their livelihood. In view of this, the Fourth State Finance commission got a study
conducted for assessment of physical and financial norms of core civic functions as laid
down in the Rajasthan Municipalities Act, 2009. According to the Study Report, per capita
norms for core functions separately for capital and maintenance under different categories work
out as follows:
Functions Municipal Corporation
Municipal
Council
Mun.
II Mun.
III
Mun.
IV
Solid Waste Management
Total 356.91 346.37 338.85 317.81 315.00
Operational 356.91 346.37 338.85 317.81 315.00
Capital - -
Street Lighting

101
Total 225.08 215.76 218.79 209.10 211.03
Operational 76.81 67.45 68.40 58.83 59.35
Capital 148.27 148.31 150.39 150.27 151.68
Public Toilet
Total 1.63 7.60 7.54 6.77 17.40
Operational 1.63 7.60 7.54 6.77 17.40
Capital - -
Public Health
Total 6.92 7.10 8.31 5.25 5.48
Operational 6.92 7.10 8.31 5.25 5.48
Capital - -
Public Park
Total 45.18 58.34 57.54 13.54 14.81
Operational 32.51 41.77 41.59 9.81 11.61
Capital 12.67 16.57 15.95 3.73 3.20
Community Hall
Total 1.33 11.31 10.41 14.53 10.67
Operational 1.33 11.31 10.41 14.53 10.67
Capital - - -
Grand Total 637.05 646.48 641.44 567.00 574.39
Operational 476.11 481.60 475.10 413.00 419.51
Capital 160.94 164.88 166.34 154.00 154.88
Keeping in view the spirit of the 7311
and 74th
amendments and the need to provide
an impetus to the decentralisation process, the Thirteenth Finance Commission
recommended a sum of Rs.87519 crore for the period 2010-15 as grants-in-aid to augment
the consolidated fund of the States to supplement the resources of the Municipalities and
Panchayats. This amount was equivalent to 1.93 percent of the shareable tax revenues
receipts of the centre as estimated by the Commission during the period 2010-15. It would
be appreciated that in view of the economic slowdown and increased burden of pay and
allowances, the local bodies would also face problem of resources. For maintaining the
adequate level of civic amenities and to shoulder the responsibilities bestowed upon them
under the Constitution, there is a need to strengthen the local bodies financially and,
therefore, the devolution amount for the local bodies should be enhanced.

102
Chapter 9
Rajasthan State Government Subsidies Targeting and Evaluation
9.1 Rationale of Subsidy:
Subsidy refers to grant by a government to a private person or company to assist
an enterprise deemed advantageous to the public. The economic rationale behind subsidy in
basically a welfare state is to keep price of output (commodity or service) low. “Subsidies are
used to modify market outcomes, especially to take account of positive externalities, and,
sometimes, to sub-serve certain well-defined redistributive objectives”28
. In other words,
subsidies, as reverse of an indirect tax, constitute an important fiscal instrument for
modifying market-determined outcomes. While taxes reduce disposable income, subsidies
inject money into circulation. While taxes appear on the revenue side of government budgets,
subsidies appear on the expenditure side.
It is often argued that a subsidy arises when a government programme benefits
private actors. Thus, tax concessions are also a form of subsidization. Some opine that import
tariffs may be construed as subsidization of import competing sectors.29
Therefore defining
subsidies only in terms of government transfers or fiscal expenditure may not yield the true
picture. Depending on the context, a large number of government programmes may results in
subsidies:
* First, the government may transfer funds to producers or consumers, that is, direct
payment in cash or kind.
* Second, the government may provide goods or services for free or below market price
and conversely, goods and services may be purchased by government at above market
price.
28 D.K. Srivastava, C Bhujanga Rao, Pinaki Chakraborty and T.S Rangamannar (2003) Budgetary Subsidies in India:
Subsidising Social and Economic Services, NIPFP, New Delhi. 29 Subsidy may arise due to government actions that limit competition or raise prices at which producers could sell
their products. While, a subsidy may introduce certain market distortions and/ or cause production inefficiencies, there often are situations when subsidies induce an efficient solution. Again, subsidies could be inefficient, but often less so than other policy tools used to benefit certain groups. Next, direct subsidies may be preferable to other forms of support, such as hidden subsidies or trade barriers; just as direct taxes maybe more desirable if there was no information asymmetry. Moreover, direct subsidies may be more transparent and allow the political process wider opportunity to eliminate wasteful hidden subsidies. The issue, that hidden subsidies are relatively inefficient (economically speaking), but often favoured as they are non-transparent, is central to the political economy of subsidies. Examples of industries or sectors where subsidies often abound include utilities and farm subsidies.
103
* Third regulatory policies like, tax concessions may be seen as subsidies, if they create
transfers from one group to another
For completeness of subsidy analysis, one should be able to refer to the following:
* Form of subsidies;
* Beneficiaries of subsidies
* Objectives and their effect - more specifically designed a programme, more likely that
the intended beneficiary (objective) and the actual recipient (effect) coincide.
As far as the level of subsidies is concerned, the Finance Commission is aware that the level of
subsidies provided by the Government of India is extremely
excessive. The Food Subsidies, Oil Sector Subsidies and the Fertiliser Subsidies are
humungous. Not only have these subsidies placed central government finances out of shape,
but these have distorted markets and the economy. The Central Government excessively subsidises the
urea, which have contributed to lopsided and excessive use of urea at the expense of phosphatic fertilisers
leading to extensive soil health problem. Similarly, the markets in wheat and rice have been totally
destroyed because of the food subsidy. Now, there is another big dimension added to the
whole issue of subsidies. Increasingly, these subsidies are being turned into legal entitlements.
Food Subsidy is a case in point. It would not have surprised the State if the petroleum products
consumption was also turned into legal entitlements and subsidies thereon built into statutes. The
State Government of Rajasthan has also gone over-board during the financial year prior to the
elections 2013 in proliferating subsidy based, and in many cases, purely free of cost, populist
programmes. There are large subsidies in the power sector also. The Finance Commission may
need to fine tune its relief programmes to the specific subsidies this time, much as the way overall
level of deficits have been controlled over the years.
9.1.1 Types of Subsidy
The simplest classification of subsidies is analogous to that of taxes, and one that
is also amenable to incidence analysis. Thus we may have (a) direct; and (b) indirect
subsidies.
9.1.1.1 Direct Subsidies

104
Direct subsidies are perhaps the simplest to identify, but utilized less frequently.
They involve a direct cash transfer to the recipient, for example, unemployment benefit. As
income supplement to identifiable entities, such interventions are expected to induce
minimum distortions in consumption and production decisions, but may likely impact the
incentives towards labour and effort (and/ or factor utilization). These suffer from
implementation difficulties due to incomplete and/ or asymmetric information (or insufficient
tools to elicit true (individual) characteristics).
9.1.1.2 Indirect Subsidies
Indirect subsidy is a broad terminology covering most other forms of subsidy. The
term covers transfers intended to alter consumption or production characteristics. For
example, the union government expends on food and fertilizer subsidies. It also administers a
cooking fuel subsidy (coal, cooking gas, kerosene). Several state governments also extend
specific subsidies in the agricultural sector like in procurement of sugar, onions and cotton,
ostensibly targeted to ensure (certain minimum) availability and provisioning.
Table 9.1
Composition of Subsidy
Explicit subsidy
Finance department (mostly on power) Other expenditure
Animal husbandry department Direction and administration
Veterinary services and animal health
Horticulture department Horticulture and vegetable crops
Special component plan for SC
Tribal area sub- plan
Industry department Village and small industry
Rural development Assistance to zilla parisads/ district level panchayat
Implicit subsidy
Food, civil supply and consumer department Civil supply schemes Source: Finance Accounts, different volumes, Controller and Auditor General of India.
9.2 Subsidy by Rajasthan Government
In Rajasthan, as read from the data (2007-08 to 2011-12), Expenditure subsidy is
divided in to two components, (1) explicit, (2) implicit. While implicit subsidy is given to one
department i.e., food, civil supply and consumer department, explicit subsidy is given to
finance department (mostly on power), animal husbandry department, horticulture
department, industry department, and rural development. A significant amount of subsidies in
Rajasthan are explicit subsidies. Total subsidies declined from Rs.3105.13 crores in 2007-08
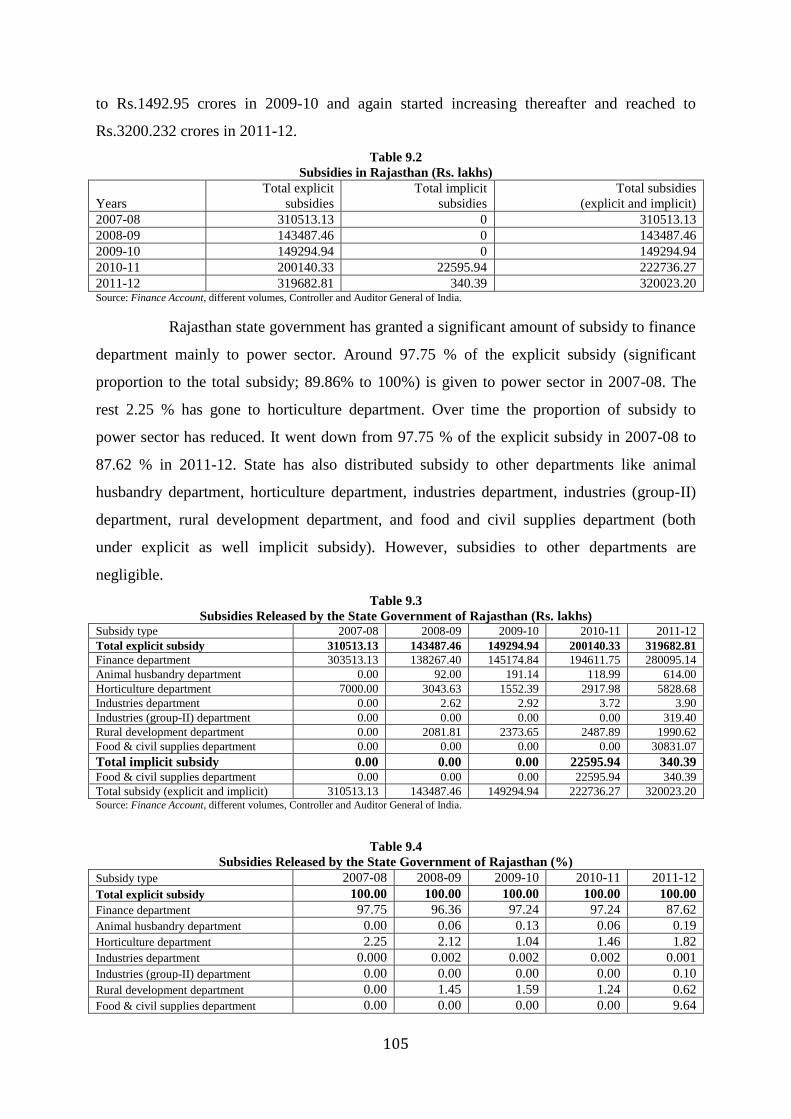
105
to Rs.1492.95 crores in 2009-10 and again started increasing thereafter and reached to
Rs.3200.232 crores in 2011-12.
Table 9.2
Subsidies in Rajasthan (Rs. lakhs)
Years
Total explicit
subsidies
Total implicit
subsidies
Total subsidies
(explicit and implicit)
2007-08 310513.13 0 310513.13
2008-09 143487.46 0 143487.46
2009-10 149294.94 0 149294.94
2010-11 200140.33 22595.94 222736.27
2011-12 319682.81 340.39 320023.20 Source: Finance Account, different volumes, Controller and Auditor General of India.
Rajasthan state government has granted a significant amount of subsidy to finance
department mainly to power sector. Around 97.75 % of the explicit subsidy (significant
proportion to the total subsidy; 89.86% to 100%) is given to power sector in 2007-08. The
rest 2.25 % has gone to horticulture department. Over time the proportion of subsidy to
power sector has reduced. It went down from 97.75 % of the explicit subsidy in 2007-08 to
87.62 % in 2011-12. State has also distributed subsidy to other departments like animal
husbandry department, horticulture department, industries department, industries (group-II)
department, rural development department, and food and civil supplies department (both
under explicit as well implicit subsidy). However, subsidies to other departments are
negligible.
Table 9.3
Subsidies Released by the State Government of Rajasthan (Rs. lakhs) Subsidy type 2007-08 2008-09 2009-10 2010-11 2011-12
Total explicit subsidy 310513.13 143487.46 149294.94 200140.33 319682.81
Finance department 303513.13 138267.40 145174.84 194611.75 280095.14
Animal husbandry department 0.00 92.00 191.14 118.99 614.00
Horticulture department 7000.00 3043.63 1552.39 2917.98 5828.68
Industries department 0.00 2.62 2.92 3.72 3.90
Industries (group-II) department 0.00 0.00 0.00 0.00 319.40
Rural development department 0.00 2081.81 2373.65 2487.89 1990.62
Food & civil supplies department 0.00 0.00 0.00 0.00 30831.07
Total implicit subsidy 0.00 0.00 0.00 22595.94 340.39 Food & civil supplies department 0.00 0.00 0.00 22595.94 340.39
Total subsidy (explicit and implicit) 310513.13 143487.46 149294.94 222736.27 320023.20 Source: Finance Account, different volumes, Controller and Auditor General of India.
Table 9.4
Subsidies Released by the State Government of Rajasthan (%)
Subsidy type 2007-08 2008-09 2009-10 2010-11 2011-12
Total explicit subsidy 100.00 100.00 100.00 100.00 100.00
Finance department 97.75 96.36 97.24 97.24 87.62
Animal husbandry department 0.00 0.06 0.13 0.06 0.19
Horticulture department 2.25 2.12 1.04 1.46 1.82
Industries department 0.000 0.002 0.002 0.002 0.001
Industries (group-II) department 0.00 0.00 0.00 0.00 0.10
Rural development department 0.00 1.45 1.59 1.24 0.62
Food & civil supplies department 0.00 0.00 0.00 0.00 9.64

106
Total implicit subsidy 0.00 0.00 0.00 10.14 0.11
Food & civil supplies department 0.00 0.00 0.00 100.00 100.00 Source: Computed from table 9.3
Table 9.5
Annual Growth Rate of Subsidy (to different departments) in Rajasthan
2008-09 over
2007-08
2009-10 over
2008-09
2010-11 over
2009-10
2011-12 over
2010-11
Total explicit subsidy -53.79 4.05 34.06 59.73
Director, finance department -54.44 5.00 34.05 43.93
Director, animal husbandry - 107.76 -37.75 416.01
Director, horticulture department -56.52 -49.00 87.97 99.75
Director, industries department - 11.45 27.40 4.84
Deputy secretary, industries (group-II)
department - - - -
Secretary to the government, rural
development department - 14.02 4.81 -19.99
Commissioner, food and civil supplies
department - - - -
Total implicit subsidy - - - -98.49
Commissioner, food and civil supplies
department - - - -98.49
Total Subsidy (Explicit and Implicit) -53.79 4.05 49.19 43.68 Source: Computed from table 9.3
9.3 Conclusion
Subsidies are used to modify market outcomes, especially to take account of
positive externalities, and, sometimes, to sub-serve certain well-defined redistributive
objectives. However if the subsidies are not designed properly they adversely affect the
economy. In Rajasthan significant amount of subsidy goes to the power sector. Apart from
this over the time period it is growing significantly. The excessive subsidy will not only
curtail the revenue capacity but also incur heavy expenditures on the part of the state leading
to revenue deficit.

107
Chapter 10
FRBM Act and Rajasthan: A Performance
10.1 Introduction
India has faced persistent fiscal problems for over the decades. The revenue
expenditure of government has lagged behind the revenue receipts, giving large revenue
deficits. The revenue deficit had worsened over the period for India as well as most of the
states in India. Despite all efforts by the central government, the revenue deficit worsened
from 3.3 % of GDP in 1990-91 to 4.4 % of GDP in 2002-03. For a period of time, it had
reduced from 4.4 % in 2002-03 to 1.05 % in 2007-08. However, it further peaked at 5.25 %
in 2009-10 and 4.46 % in 2011-12. The positions of almost all states are more or less same in
this regard. There was a sharp run up of the deficit in the late 1980s,. This was followed by
efforts at fiscal caution until 1997, after which the central revenue deficit deteriorated
sharply. Similarly, the consolidated gross fiscal deficit of the centre and the states had
significantly increased in the late 1990’s.
The Rajasthan state is also no exception to the increased revenue and fiscal deficit
during this time period. It is observed that during 2002-03 the revenue deficit is 4.08 per cent
of the GSDP (See Table 10.1).
Table 10.1
Revenue Deficit –GSDP Ratio of India and Rajasthan (Rs. lakhs)
years India Rajasthan
Revenue
Deficit
GDP
(2004-05)
Revenue
Deficit/GSDP
Revenue
Deficit
GSDP
(2004-05)
Revenue
Deficit/GSDP
2002-03 -1078790 25306630 -4.26 -393392 9645700 -4.08
2003-04 -982610 28379000 -3.46 -342444 12157200 -2.82
2004-05 -783380 32422090 -2.42 -214260 12774600 -1.68
2005-06 -922990 36933690 -2.50 -66002 14223600 -0.46
2006-07 -802220 42947060 -1.87 63838 17104300 0.37
2007-08 -525690 49870900 -1.05 165298 19482200 0.85
2008-09 -2535390 56300630 -4.50 -82675 23094900 -0.36
2009-10 -3389980 64573530 -5.25 -474718 26582500 -1.79
2010-11 -2522520 76741480 -3.29 105486 34186500 0.31
2011-12 -3949510 88557970 -4.46 335745 41675500 0.81 Source: Handbook of Statistics on the Indian Economy, Reserve Bank of India, 2011-12, pp 15 and 174;.

108
10.2 FRBM Act and Rajasthan
The FRBMA acts as an incentive for the state to restructure its fiscal health.
According to this act debt relives are provided to states conditions to elimination of revenue
deficit by 2008-09 and reduction of fiscal deficit below 3 per cent of GSDP as stated earlier
in Chapter 5.
Looking at the gravity of the fiscal situation of government, all political parties
voted in favour of the Fiscal Responsibility and Budgetary Management Act, 2003. Initially
as per the Act the revenue deficit should be eliminated by 2007-08. An amendment to this
Act, which is part of the Finance Bill laid in Parliament on 8 July 2004, proposes to shift this
date to 2008-09.
Table 10.2
Target and Achievement of FRBM and MTFP: Rajasthan
Revenue
deficits/
surplus
(Rs.
crores)
Revenue
surplus or
deficit/
revenue
receipts
ratio (Rs. core)
Fiscal
deficit
(Rs
crores)
FD/GSDP
Ratio
%
Outstan
-ding
debt as
% to
GSDP
Ratio of
outstanding
public debt
and
outstanding
risk
weighted
guarantees
to total
receipts of
consolidated
fund of
the state (%)
2011-12
As per TFC/
FRBM Act
Revenue
deficit to
zero$
- - 3.00 or
below
39.3
As per MTFPS
(revised)
443 0.8 -7687 -2.10 29.06
Actual 3357 5.9 -3626 -0.90 25.6
2010-11
As per TFC/
FRBM Act
No target@ 0.00@
- 3.22 or
below
(2010-11)
Not exceed
200
As per MTFPS
(revised)
-888.95 -1.93 -7553.01 -2.33 156.00
Actual 1054.85 2.3 -4126.06 -1.27 153.02
2009-10
As per TFC/
FRBM Act
0.00# 0.00#
- 4.00 or
below
(2009-10)
Not to exceed
200
FCP 959.05 2.98 -5957.08 3.00 -
As per MTFPS
(revised)
-3992.87 -10.73 -9900.12 3.50 165
Actual 4747 -13.42 -10299 -4.03 155
2008-09

109
As per TFC/
FRBM Act
0.00*
0.00* - 3.00 or
below
(2008-09)
Not to exceed
200
FCP 0.01 2.87 -5281 3.00 -
As per MTFPS
(revised)
-283 -0.82 -6714 3.50 158
Actual -827 -2.47 -6973 -3.46 162
2007-08
As per TFC/
FRBM Act
0.0*
0.00*
- 3.00 or
below
(2008-09)
Not to exceed
200
FCP -736 2.87 -6146 3.90 -
As per MTFPS
(revised)
215 - -5322 3.50 173
Actual 1653 - -3408 2.00 158
2006-07
As per TFC/
FRBM Act
0.0*
0.00*
- 3.00 or
below
(2008-09)
Not exceeded
200
FCP -1035 4.51 -6146 4.40 -
As per MTFPS
(revised)
-43 0.18 -5141 3.82 -
Actual 638 State had
revenue surplus
in 2006-07
-3970 2.80 181
Note: FCP- no estimates for the years 2011-12, 2010-11. *- end March 2009. #- end March 2010. $-
end March 2012. @- end March 2011
Source: GoR, Economic Review, various years.
Table 10.3
Own Revenue Receipts(own-tax and own non-tax revenue) as percentage of GSDP(2004-05 current price)
States 2005-06 Order 1 2010-11 Order 2
Andhra Pradesh 9.34 9 9.78 8
Arunachal Pradesh 7.03 22 8.21 14
Assam 7.90 17 7.38 21
Bihar 4.95 27 5.31 26
Chhattisgarh 9.89 8 10.89 4
Goa 12.96 2 13.14 3
Gujarat 7.78 19 7.78 19
Haryana 10.60 6 7.68 20
Himachal Pradesh 8.06 16 9.48 9
Jammu and Kashmir 8.07 15 7.87 18
Jharkhand 7.03 23 7.15 22
Karnataka 11.49 5 10.18 6
Kerala 7.83 18 8.78 11
Madhya Pradesh 9.11 10 10.43 5
Maharashtra 8.11 14 8.04 15
Manipur 2.99 30 5.82 25
Meghalaya 5.49 25 5.99 24
Mizoram 5.89 24 4.62 28
Nagaland 3.08 29 3.62 30
NCT Delhi 8.96 11 7.91 17
Orissa 7.68 20 8.21 13
Pondicherry 12.41 4 17.11 2
Punjab 12.45 3 9.80 7
Rajasthan 8.87 12 7.91 16
Sikkim 57.05 1 19.16 1

110
Tamil Nadu 10.06 7 8.96 10
Tripura 3.66 28 4.27 29
Uttar Pradesh 7.43 21 8.75 12
Uttarakhand 8.13 13 6.06 23
West Bengal 4.95 26 5.09 27 Note: Order 1: ordering of state based on 2005-06 ratio and Order 2: ordering of state based on 2010-11 ratio.
Sources: www.rbi.org.in, Occasional Publication, 2002-03 to 2007-08; and Annual Publication, 2008-09 to 2010-11. For GSDP, www.maospi.org , 14/11/2013.
10.3 Conclusions
Rajasthan has been able to fulfill the targets of FRBMA over the time. However,
the structure of expenditure reflects that the revenue deficit has been eliminated through the
contraction of social and economic expenditures which in turn adversely affect the revenue
generation over time. Even if the state has been able to maintain fiscal discipline it may not
sustain for a long period time due to lack of strategic prioritization and technical efficiency.

111
Chapter 11
Analysis of Contingent Liabilities in Rajasthan
Contingent liabilities are defined as contractual financial arrangements that give
rise to conditional requirements, either to make payments or to provide objects of value
(System of National Accounts, 1993). For the financial transaction to take place, one or more
conditions must be fulfilled. A key characteristic that makes such liabilities different from
normal financial transactions is that they are uncertain. Contingent liabilities are not easy to
quantify and standards to measure them are evolving. Furthermore, in cash-based systems of
accounts they are not always fully covered, as no transactions are associated with the creation
of these obligations.
It is perhaps expedient to begin with the conventional framework for analyzing
contingent liabilities of the government in the form of a fiscal risk matrix. Liabilities may be
classified as “direct”, i.e. those that would arise in any event and are therefore certain and
predictable, or contingent, i.e. those that may or may not be incurred, depending on the
occurrence of a particular event. For instance, the timing and amount of the contractual
obligation is fixed on the date of issue of a government loan (i.e. a direct liability), whereas
the obligation in the case of a government guarantee (i.e. a contingent liability) would depend
on the time and magnitude of default by the borrower. In general, contingent liabilities refer
to obligations to provide for a possible default by a borrower on the principal and/or interest
of the loan.
Contingent liabilities may be funded, i.e. matched by a reserve or charge against
profits equal to the actuarial (present discounted) value of expected “payouts”, or unfunded.
Both direct and contingent liabilities may, in turn, be classified as “explicit” i.e. those that are
defined by law or contract or “implicit” i.e. those that are incurred on “moral” grounds or as a
result of public and interest group pressures. Direct contingent liabilities include deposit
insurance as well as official guarantees for private/public sector borrowings, wherein the
maximum possible liability on the guarantor is clearly defined ex ante. Implicit contingent
liabilities, on the other hand, are not officially recognized until the “default” occurs and
therefore, the amount of expenditure that would ultimately be required is uncertain.

112
Government support (beyond deposit insurance) for failed financial institutions, particularly
when such failure is systemic, is generally the most serious form of contingent implicit
liability.
11.1 Contingent Liabilities in the Emerging Economy Context
The World Bank has identified three areas that can give rise to particularly large
contingent liabilities30
. These are as follows:
(1) Many governments are in the process of privatizing their infrastructure and are
seeking private sector participants in new infrastructure development. These policy
goals have frequently been accompanied by requests from the private sector for
guarantees or, in the case of privatization, for the government to assume the debts of
the state-owned enterprise prior to its sale.
(2) The nature of the financial sector regulatory and supervisory framework in emerging
markets can lead to excessive risk-taking by private sector financial intermediaries,
especially as new opportunities arise with financial sector deregulation and capital
account liberalization. The added systemic risk can substantially increase a
government’s implicit contingent obligations.
(3) Macro-economic policy imbalances, often in conjunction with inefficient regulatory
policies, have often led to overvalued real exchange rates and governments have
sometimes incurred substantial losses in endeavoring to defend a fixed exchange rate
anchor.
11.2 Contingent liabilities in Rajasthan
Analysis shows that there has been a severe deterioration in fiscal health at the
state level. Both revenue and fiscal deficits have increased sharply, particularly after 1997-98.
Fiscal stress on the one hand has increased the states’ indebtedness including contingent
30 World Bank (2000), Sound Practices in Sovereign Debt Management Washington D.C: March.

113
liabilities31
and on the other, caused severe cut back in infrastructure spending. The states
have also found a variety of ways to soften their budget constraints. There has been
considerable growth in the contingent liabilities of states in the past few years, and to the
extent that these form an indirect burden on the state’s finances. There are significant
contingent liabilities arising from the state government’s guarantees and indemnities given to
urban local bodies, public enterprises and autonomous institutions. In case of Rajasthan, the
government has a huge contingent liability on PSUs in general and DISCOM in particular.
It is noted that the maximum amount guaranteed (total amount) of contingent
liability by the state during 2003-04 Rs.24584.95 crores which has increased to Rs.97585.85
crores during 2011-12. However the outstanding at the end of 2003-04, which was
Rs.17238.88 crores, has increased to Rs.60711.08 crores during 2011-12. It is observed that
government has taken a significant contingent liability for government companies during
2003-04 to 2008-09. However, in later phase state has taken it for power sector during 2009-
10 to 2011-12.
The total outstanding guarantees of the State Government as on 31.03.2013 were Rs.
75546.00 crore. Out of this, guarantees of Rs. 70114.00 crore were given in favour of power
companies. The quantum of guarantees is increasing every year mainly on account of insistence of State
Government guarantees by GoI lending institutions, like HUDCO, PFC, REC etc. Besides this, other
than the power companies as on 31.03.2013 the government guarantees of Rs. 5432.00 crore
were outstanding. A substantial portion of these government guarantees related to such borrowings by the
parastatals, whose repayments are funded by the State Government. The outstanding debt of the
State Government does not capture these liabilities and their servicing burden.
11.2.1 Guarantee Redemption Fund:
The state government set up the Guarantee Redemption Fund in 1999-2000 by
transferring the guarantee fees to this fund every year. During 2009-10 the state
government received Rs.36.94 crores as guarantee fees. Besides, a balance of Rs.11 crores
pertaining to the previous years was also lying there. Therefore, the total amount of
guarantee fees i.e. Rs.47.94 crores (Rs.36.94 crores plus Rs.11 crores) had to be transferred to
the fund during 2009-10, but the state government transferred only Rs.11 crores during 2009-
31 State government is the real authority for issue of guarantees. The guarantees constitute contingent liability on the
revenues of the state. In case of any contingency arising on account of discharge of the state's obligation on invoking of guarantees the same has to be met out of the Guarantee Redemption Fund.
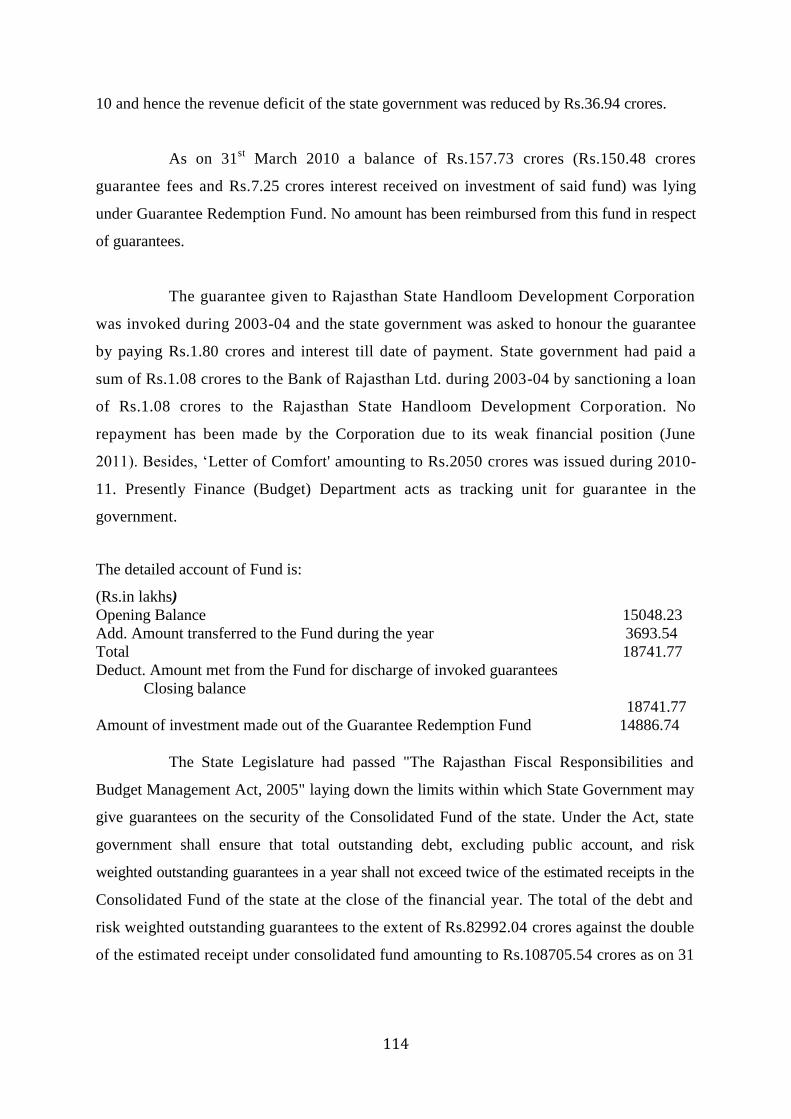
114
10 and hence the revenue deficit of the state government was reduced by Rs.36.94 crores.
As on 31st March 2010 a balance of Rs.157.73 crores (Rs.150.48 crores
guarantee fees and Rs.7.25 crores interest received on investment of said fund) was lying
under Guarantee Redemption Fund. No amount has been reimbursed from this fund in respect
of guarantees.
The guarantee given to Rajasthan State Handloom Development Corporation
was invoked during 2003-04 and the state government was asked to honour the guarantee
by paying Rs.1.80 crores and interest till date of payment. State government had paid a
sum of Rs.1.08 crores to the Bank of Rajasthan Ltd. during 2003-04 by sanctioning a loan
of Rs.1.08 crores to the Rajasthan State Handloom Development Corporation. No
repayment has been made by the Corporation due to its weak financial position (June
2011). Besides, ‘Letter of Comfort' amounting to Rs.2050 crores was issued during 2010-
11. Presently Finance (Budget) Department acts as tracking unit for guarantee in the
government.
The detailed account of Fund is:
(Rs.in lakhs)
Opening Balance 15048.23
Add. Amount transferred to the Fund during the year 3693.54
Total 18741.77
Deduct. Amount met from the Fund for discharge of invoked guarantees
Closing balance
18741.77
Amount of investment made out of the Guarantee Redemption Fund 14886.74
The State Legislature had passed "The Rajasthan Fiscal Responsibilities and
Budget Management Act, 2005" laying down the limits within which State Government may
give guarantees on the security of the Consolidated Fund of the state. Under the Act, state
government shall ensure that total outstanding debt, excluding public account, and risk
weighted outstanding guarantees in a year shall not exceed twice of the estimated receipts in the
Consolidated Fund of the state at the close of the financial year. The total of the debt and
risk weighted outstanding guarantees to the extent of Rs.82992.04 crores against the double
of the estimated receipt under consolidated fund amounting to Rs.108705.54 crores as on 31

115
March 2011 was within limit. No guarantee was invoked during the year 2010-1132
.
11.2.2 Reserve Funds of the State
Rajasthan Development and Poverty Alleviation Fund:
The government of Rajasthan, created the "Rajasthan Development and Poverty
Alleviation Fund" in 2007 by amending the Rajasthan Fiscal Responsibility and Budget
Management Act, 2005 with an object of using such accumulations in the years of fiscal
distress and for poverty alleviation and development purposes. In this, fund the tax receipts
of the state government comprising of its own taxes and share in central taxes in any year in
excess of 17.5 % over the previous year was to be credited in the ensuing year. This fund was
to be utilized by the state government (i) for meeting revenue and capital expenditure if the
growth of revenue collection is less than 10 % over the previous year and (ii) to meet the
expenditure incurred on development programmes or for poverty alleviation programme. The
state government transferred Rs.850.96 crores to the fund i.e. Rs.100 crores in 2006-07,
Rs.531.75 crores in 2007-08 and Rs.219.21 crores in 2008-09 by debiting to major head
3451. However, in 2009-10, the state government had written back the entire accumulated
amount of three years totaling to Rs.850.96 crores from fund and deposited to revenue
receipt.
32 The guarantee given to M/s Jaipur Udyog Ltd., Sawai Madhopur was invoked on 30th June 1988 and the state
government was asked to honour the guarantee by paying Rs.274.14 lakh and interest @ 16.5 % per annum till
the date of payment. Accordingly State Government has paid to the Bank a sum of Rs.29605871 on March 31,
1995. The company is under liquidation and the case is pending in Court of Law (June 2011). The guarantee given
to M/s Jaipur Spinning and Weaving Mills Ltd. Jaipur was invoked on February 23, 1984 and the government was
asked to honour the guarantee by paying Rs.504.76 lakh and interest @ 18 % per annum till the date of
payment. The case is under trial in Rajasthan High Court. As per court orders an amount of Rs.504.76 lakh was
deposited with Debts Recovery Tribunal. To recover amount from the guarantor, case was filed in Jaipur District
Court in April 2003 (June 2011). Against guarantee for Rs.38500000 given to various financial institutions/
banks in favour of M/s Mewar Textiles Mills Ltd., Bhilwara, the state government had sanctioned a loan of
Rs.37241451 on January 28, 2002 to honour the guarantee from which a sum of Rs.20741461 had been paid to
four financial institutions during the year 2001-02. However, banks (The Bank of Rajasthan Limited, Oriental
Bank of Commerce and Union Bank of India) have not accepted the amount and consent given by Finance
Department for recovery. The case of liquidation of the company is subjudice in Hon’ble High Court, Jodhpur. The
appointment of liquidator is yet to be made (June 2011).

116
11.2.3 Rajasthan State Investment Fund:
The Rajasthan State Investment Fund was constituted by the Rajasthan government
w.e.f. 26-02-2007 with an initial corpus of Rs.77.65 crores with the object of buy back and
resale of Rajasthan State Development Bonds. During 2007-08 the state government
transferred a huge amount of Rs.900 crores from the state consolidated fund by debiting to
major head 4047 (capital outlay on fiscal services) in view of better financial position and to
avoid the lapse of funds as conveyed by the state government. However, the fund was not
utilized for buy back and resale of Rajasthan State Development Bonds. Subsequently, the
state government transferred Rs.212 crores and Rs.688 crores in 2008-09 and 2009-10
respectively to the Consolidated Fund (capital head) to meet the additional financial burden
due to application of recommendations of Sixth Pay Commission and impact of continuous
recession on the state fiscal position.
11.2.4 Other Funds:
In addition to above there are 25 other funds out of which 16 are active. The total
accumulated balance as at the end of March 31, 2010 in these funds was Rs 779.79 crores.
During the year an amount of Rs.1261.15 crores was transferred as contribution to these
funds. The total expenditure shown as met out from these funds was Rs.1494.22 crores.
11.3 Conclusions:
The contingent liabilities of the state have increased to a larger extent over time. .
They have arisen from the state government’s guarantees and indemnities given to urban
local bodies, public enterprises and autonomous institutions. Rajasthan government has set up
funds to incur the expenses of the liabilities. However, they are not sufficient to meet it.

117
Chapter 12:
Public Expenditures and Financial Management Reforms in Rajasthan
12.1 Introduction
Public expenditure management (PEM) has recently drawn the attention of almost all
the developed and developing countries in the world due to the financial crisis. The financial
crisis is due to resource constraints, inadequacy of needed skills and information, heavy
pressure to spend more than they can afford on unmet needs, and meager reserves to ride out
shocks or unexpected difficulties. PEM is the allocation and use of resources responsively,
efficiently and effectively. It is the key instrument of the government policy. It operates
through budget decisions. However it is different from conventional budgeting on ground of
achievement of desired outcomes and coverage of wide range of institutional and
management arrangements.
12.2 Public Expenditures Management in Rajasthan
The PEM system of Rajasthan is similar to that of India. It has been argued earlier
that since the PEM operates through budget, the characteristics of budget have to be
examined. The budget is conventional one and the approach of its preparation is bottom up
which consists of formulating and costing sectoral spending programs for the planned period
within the given sectoral spending limits. Since the budget is conventional input based more
concerned is given to basic financial compliance which is achieved through budgetary
specification of inputs and detailed procedures designed for expenditure control. The
expenditures are listed according to objects of expenditures and often the amounts to be spent
on line items are specified in detail. It fails to provide any information on performance in
terms of efficiency and effectiveness of the programme. The accounting system is cash based.
It does reflect the total outlays of a programme.
Multi-year perspective in expenditures was absent. A single year budget planning is
not always sufficient to complete any particular project which spreads over to future years.
12.3 Reforms in PEM:
Recently some reforms have been undertaken to strengthen the PEM system in the state.
(1) The implementation of Fiscal Responsibility and Budget Management of Act (FRBMA)
in 2005 opened a way to improve transparency and medium term planning. The major

118
objective of this Act is to ensure prudence in fiscal management and fiscal stability by
(1) Eliminating Revenue Deficit10 (RD) (2) Prudent debt management consistent with
fiscal sustainability (3) Greater transparency in fiscal operations of Government and (4)
Conduct of fiscal policy in a Medium Term Fiscal Framework
(2) The recommendations of 13th
Finance Commission which called for the improvement in
the quality of expenditures and making the MTFP a statement of commitment rather than
intent is improvement compared to the earlier practices. It helps the state to present the
fiscal stance in a more transparent manner.
(3) The Government of Rajasthan has taken an important step to make the state budget more
performance oriented by introducing the outcome/performance budget in 2010-11. The
main features of outcome budget are (1) definition of measureable outcomes (2)
standardization of unit cost of delivery (3) benchmarking standard (4) capacity building
for attaining the requisite administrative capacity ensuring necessary funding (5)
effective monitoring and evaluation (6) community and stakeholder’s participation. The
Performance Budget presents the aims and objectives of the department/ organization for
which the funds are appropriated, the cost of the programme proposed for achieving
these objectives and the quantitative data measuring the accomplishments and works
performed under each programme. The main objective is to co‐relate the physical and
financial aspects of the programmes and their activities. It sets out in terms of physical
targets the programmes that have to be executed by the Government along with an
indication of their cost‐performance. Performance Budget contains the revised
estimates for the ongoing financial year and budget estimates for the next financial year.
Performance Budgeting is a supplementary exercise to the existing budget, and should be
prepared simultaneously with the financial budget, and submitted to the Legislative
Assembly by the administrative department concerned as soon as possible after the
budget has been presented but, in any case, not later than seven days after the
presentation of the budget. It is also to be ensured that performance budget is made
available to the members of the Legislative Assembly at least three days before
discussions on the Demands pertaining to the department. Three hundred copies of the
Performance Budget are to be made available to the Legislative Assembly by each
department.
119
(4) Steps have been undertaken to enhance accountability and transparency in financial
administration
(5) The treasury system has been computerized.
12.4 Conclusion
The Rajasthan government has taken several steps to improve the PEM system in the
state through the introduction of medium term expenditure frame work, outcome budget and
internal audit and control. However the achievement of the objectives of PEM system in
terms of fiscal discipline, strategic prioritization and operational efficiency needs to be
examined.

120
Chapter 13
Measures Taken to Improve the Performance of Public Sector Enterprises in Rajasthan
13.2 Public Sector Enterprises in Rajasthan
The public sector enterprises are the arms of state government for economic and social
development. The main objectives of the PSEs included facilitation of rapid economic
growth, earning a reasonable rate of return, creation of employment opportunities and
development of small-scale and ancillary industries. The PSEs are expected to be run on
commercial basis so as to contribute to the State resources for a quicker development. Any
public enterprise, to attain a state of maturity, passes through three stages of growth taking
greater responsibilities towards the fulfillment of political goals than the economic objectives
balance the political objectives with the economic objectives and overcome the constraints
imposed by the socio-political goals and manage its affairs on commercial lines in each stage
respectively.
The state has 26 government companies (22 working and 4 nonworking)
and 3 statutory corporations (all working).
The total investment in the working PSEs was Rs.16471.83 crore (Equity
Rs.5088.95 crore, Loans Rs.11373.10 crore and share application money of
Rs.9.78 crore).
The total investment in the 4 non-working PSEs is Rs.13.58 crore.
The sector wise investment (equity and long term loans) in the working PSEs is
as follows (Amount Rs in Crores.):
Power 14780.65(89.73)
Industry 1054.56(6.40)
Transport 383.73(2.33)
Construction 72.05(0.44)
Mining 115.70(0.70)
Agriculture 16.70(0.10)
Other 48.44(0.30)
Note: (Figures in brackets indicate percentage of investment)
The total investment in working government companies comprised 31.37% equity and
68.63% loans. For statutory corporations the ratio is 25.69:74.31.
As per the latest finalized accounts, 9 government companies and 2 statutory
corporations earned aggregate profit of Rs.300.39 crore. 4 companies and 1

121
corporation incurred aggregate loss of Rs.31.62 crore. Thus the overall aggregate
profit was Rs.268.77 crore.
13.2 Measures undertaken to improve the performance of PSEs in Rajasthan:
Few measure initiatives to improve the performance of PSEs in Rajasthan are:
A Committee set up on “Reorganisation, Strengthening and Disinvestment of Public
Sector Undertakings and Industrial Development” recommended partial disinvestment
of 11 PSEs, full disinvestment of 3 PSEs and winding up of 7 PSEs.
As on date, 1 PSE is under liquidation while 2 have been closed. 2 PSE have also been
merged.
VRS was implemented in the state PSEs. As on date 1457 employees have availed of
this scheme with a total expenditure of 19.69 crore.

122
Chapter 14
Conclusions
The revenue capacity of Rajasthan over the period of time has increased due to rise
in intergovernmental revenue transfers. The share of own revenue to total revenue has
remained more or less stable over the time period. A significant share (77.1 % average) of
own revenue receipts in Rajasthan accrues from own tax-revenue although during last five
years state government took few steps to raise its tax-GSDP ratio through introduction of VAT,
rationalization of taxation, expansion of base and control of exemptions and evasion. On the
other hand, non-tax revenue contributed 23 % (average) to the own revenue receipts.
However the own revenue is not able to meet its revenue expenditures only. The revenue
expenditures have increased at a slower pace.
As a result the revenue deficit as well as the fiscal deficit of the state has become
lower over time. It could be able to maintain fiscal discipline in the state. However the
maintenance of fiscal discipline can not sustain for a long period of time. It is because there is
absence of strategic prioritization and technical efficiency in the delivery of public goods.
Rajasthan has to make investment in the income generating sectors on the basis of
prioritization as well as achieving efficiency, economy and effectiveness in the delivery of
public goods.
The debt-GSDP ratio of the state has declined over the time. The debt-GSDP
ratio was 47.56 % in 2002-03 and it came down to 25.57 % in 2011-12. The ratio remains
more or less constant between the years 2002-03 to 2005-06 with a minor fluctuation.
However, after 2005-06 it registered a sharp decline. The debt-GSDP ratio is lower than
the ceiling of 39.3 % as recommended by 13th
Finance commission for Rajasthan.
Rajasthan had witnessed significant deterioration in various fiscal indicators towards the end
of 1990s and the early years of the current century, including large revenue and fiscal deficit relative
to GSDP. With a view to overcome these, a number of initiatives were taken by the State
Government. The State enacted the Rajasthan Fiscal Responsibility and Budget Management Act, 2005
which came into force from 3rd May, 2005. The Act provided for reducing revenue deficit to zero
and fiscal deficit to 3 percent of GSDP within a period of four years commencing from 01.04.2005
by following a path of average annual reduction. The Act also prescribed limits for outstanding
debt and guarantees of the State Government. The high levels of revenue deficit and fiscal deficit
of the years upto 2003-04 were controlled with better fiscal management and the State started the

123
process of spectacular turnaround from financial year 2005-06. The State achieved revenue surplus and
brought fiscal deficit below the prudential level of 3 percent of GSDP in the year 2006-07.
Despite the constitutional 73rd and 74th
amendment act the local bodies have not
been able to utilize their full autonomy as regard to the powers of taxation and expenditure
responsibilities. Apart from this the state is reluctance to hear the words of the State Finance
Commission. As a consequence the fiscal health of the local bodies has been in hue and cry
situation.
So far as the impact of Power sector is concerned, the fiscal health of state is
adversely affected. In addition it has taken away a large amount of money from the state
exchequer in the form of subsidies. As a result the share of subsidies in the revenue receipts
has increased adversely affecting the fiscal health.
As per the Rangrajan Committee33
(2011) government should consider the
distinction between plan and non-plan in India is unique and makes an artificial distinction
between the assets / programme under use and the assets / programme to create new. A
school is equally desirable whether this is an already existing school (non-plan) or a new
school (plan) being created. The odium attached to non-plan expenditure makes non-plan
development undesirable and social assets get less attention. Their maintenance and upkeep
gets neglected. Moreover, in last many years, the country has made the original distinction
between new development expenditure being classified non- development and old
development expenditure being classified as non-plan largely disappear. The expenditure on
assets creation in the non-development sector, like police, jails etc., are also being classified
as plan expenditure now. We also note that lot of maintenance expenditure is also being
classified as plan. Therefore, in practice the distinction between plan and non-plan has
actually withered away. There is lot of unnecessary complications associated with the
division of expenditures in plan and non-plan. The State Government would like the Finance
Commission to take initiative and recommend doing away of the distinction between plan
and non-plan. This will also help bring to the Finance Commission its complete scope of
work also as the Constitution makes no distinction between plan and non-plan expenditure as
far as the Terms of Reference of the Finance Commission is concerned.
However, during the years 2008-09 and 2009-10, the State again went into revenue deficit because
of poor macroeconomic and fiscal management of the Central Government and the then State
Government.
33
Expert Committee on Efficient Management of Public Expenditure headed by Dr. C. Rangrajan has
submitted its report to Government of India in July 2011.

124
INSTITUTE OF DEVELOPMENT STUDIES,
8-B, JHALANA INSTITUTIONAL AREA,
JAIPUR-302004 (RAJASTHAN)


