
Southern Illinois University CarbondaleOpenSIUC
Dissertations Theses and Dissertations
5-1-2018
A STUDY OF PRESERVICE TEACHERS’MENTAL COMPUTATION ATTITUDES,KNOWLEDGE, AND FLEXIBILITY INTHINKING FOR TEACHINGMATHEMATICSEunmi JoungSouthern Illinois University Carbondale, [email protected]
Follow this and additional works at: https://opensiuc.lib.siu.edu/dissertations
This Open Access Dissertation is brought to you for free and open access by the Theses and Dissertations at OpenSIUC. It has been accepted forinclusion in Dissertations by an authorized administrator of OpenSIUC. For more information, please contact [email protected].
Recommended CitationJoung, Eunmi, "A STUDY OF PRESERVICE TEACHERS’ MENTAL COMPUTATION ATTITUDES, KNOWLEDGE, ANDFLEXIBILITY IN THINKING FOR TEACHING MATHEMATICS" (2018). Dissertations. 1514.https://opensiuc.lib.siu.edu/dissertations/1514

A STUDY OF PRESERVICE TEACHERS’ MENTAL COMPUTATION ATTITUDES, KNOWLEDGE, AND FLEXIBILITY IN THINKING FOR TEACHING MATHEMATICS
by
Eunmi Joung
B.A., Chosun University, South Korea, 1999 M.A., Southern Illinois University Carbondale, Carbondale, 2003
M.S.Ed, Southern Illinois University Carbondale, Carbondale, 2013
A Dissertation
Submitted in Partial Fulfillment of the Requirements for the Doctor of Philosophy Degree in Education and Human Services
Department of Curriculum and Instruction
In the Graduate School Southern Illinois University Carbondale
May 2018

Copyright by Eunmi Joung, 2018 All Rights Reserved

DISSERTATION APPROVAL
A STUDY OF PRESERVICE TEACHERS’ MENTAL COMPUTATION ATTITUDES, KNOWLEDGE, AND FLEXIBILITY IN THINKING FOR TEACHING MAHTEMATICS
By
Eunmi Joung
A Dissertation Submitted in Partial
Fulfillment of the Requirements
for the Degree of
Doctor of Philosophy
in the field of Education and Human Services
Approved by:
Dr. Jerry P. Becker, Chair
Dr. Cheng-Yao Lin
Dr. Peter Fadde
Dr. Yanyan Sheng
Dr. Mary Wright
Graduate School Southern Illinois University Carbondale
February 23, 2018
i
AN ABSTRACT OF THE DISSERTATION OF
Eunmi Joung, for the Doctor of Philosophy degree in Education degree with concentration in Curriculum and Instruction, presented on February 23, 2018 at Southern Illinois University Carbondale. TITLE: A STUDY OF PRESERVICE TEACHERS’ MENTAL COMPUTATION ATTITUDES, KNOWLEDGE, AND FLEXIBILITY IN THINKING FOR TEACHING MATHEMATICS MAJOR PROFESSOR: Dr. Jerry P. Becker
The purpose of this research is to explore preservice teachers’ attitudes and
beliefs towards mathematics, mental and written computations, and mental computation
anxiety, to investigate their use of different mental computation strategies using
different approaches (i.e., Direct Teaching (DT) and Open-Approach (OA)) among the
three different groups, and to identify how the use of preservice teachers’ mental
computation strategies affects their flexibility regarding mental computation.
The participants were preservice teachers (PTS). Three classes were used for
this study: two classes in a mathematics class (Course A) for experimental groups and
one class for the control group. One class from professional education courses was
selected. A mixed methods design was used, more specifically, the Mathematics
Attitude Survey (MAS) was administrated before and after intervention to examine PTS’
attitudes towards mathematics, mental and written computation, and mental
computation anxiety. In addition, to determine whether there is any statistically
significant difference among the three groups, the one-way analysis of variance
(ANOVA) was used. Then, the MAS was analyzed descriptively. Next, a pre-and post-
Mental Computation Test (MCT) was given to investigate PTS’ mental computation
knowledge in relation to whole numbers, integers, and rational numbers (i.e., fractions,
decimals, and percentages). A one-way analysis of covariance (ANCOVA) was
ii
conducted to determine if there were significant differences in mental computation
performance among the three groups (i.e., DT, OA, and Control) with different
instructions. Further, before and after intervention, face-to-face interviews were given to
both the experimental and control groups to identify how they arrived at their answers.
During interviews, 38 interviewees in the pre-interviews and 36 in the post-interviews for
all groups participated. The interview items were selected from the pre-and post-MCT
problems. Three levels of problems (i.e., high, medium, and low difficulty) for each
operation were selected.
The results of the MAS showed that with respect to the attitudes towards
mathematics, PTS were generally shown positive attitudes towards learning
mathematics and were aware of the importance of learning mathematics; however, in
reality, about half of them did not want to spend time on learning or studying
mathematics. In terms of PTS’ attitudes towards mental and written computation, PTS
were aware that learning mental computation is more useful in real life situations and
provides benefits in their mathematics learning. However, they do not feel comfortable
and safe when using mental computation because of their lack of confidence and
teaching abilities. For the mental computation, PTS showed slightly higher anxiety
levels from pre-to post-tests.
The findings of Mental Computation Test (MCT) revealed that there was a
statistically significant difference in post-MCT scores between the different instructional
groups when adjusted for pre-MCT scores. In particular, PTS using Open-Approach
(OA) performed better than the PTS in the group using Direct Teaching (DT). The PTS
in the control group performed worst. Significant differences between pre-and post-

iii
MCT performance were found among the three groups in solving multiplication, fraction,
and decimal operations.
The results of interviews suggest that there was an association between each
interviewee’s quintile level and their flexibility in the use of the mental computation
strategies. Regarding the whole number operation strategies, the results revealed that
the interviewees in the middle and upper quintiles in both DT and OA used more than
two different strategies with higher accuracy and were more likely to use the strategies.
Interviewees in the middle and upper quintiles for the DT and OA groups were more
likely to use the strategies that reflect efficient number facts or number-sense (e.g.,
Adding by place, Decomposing, & Compensation). The mental image of the Traditional
method was frequently observed in the OA group. In contrast, for the lower quintiles,
alternative strategies were not provided for both groups. The interviewees in the control
group offered the smallest range of strategies. For the integer and rational operations,
the interviewees in the DT group showed strategies that focused more on conceptual
understanding. Surprisingly, the interviewees in the OA group were more likely to apply
teacher-taught methods, including the Traditional method. The control group was not
able to provide any alternative strategies.
Plans for future research are set forth to add to the body of knowledge that exists
regarding mental computation.

iv
ACKNOWLEDGMENTS
I would like to express my gratitude to all those who have helped and supported
in carrying out my dissertation research. Without their continuous support, it would not
have been possible to make this happen.
First of all, I would like to express my deepest gratitude to my advisor, Dr. Jerry
P. Becker. I am so blessed to have him as my advisor. He is ethical, knowledgeable,
reliable, and has an open mind. His endless encouragement, guidance, and advice
helped me complete this long journey. Also, I would like to thank Dr. Cheng-Yao Lin for
his continuous support, advice, and feedback for not only dissertation research but also
other research related to mathematics education.
To my committee members, Dr. Peter Fadde, Dr. Mary Wright, and Dr. Yanyan
Sheng, I would like to thank them for their hard work during the completion of the
dissertation. Their expertise, positive comments, and recommendations helped me
develop and complete my dissertation.
I also would like to express special thanks to my dear friend, Mel Watkin, for her
guidance on the teaching of writing skills. She is always with me when I need her
assistance.
I would like to extend my heartiest thanks to my beloved husband, Sangpill Han,
my daughter, Esther Han, and my two sons, Samuel and Daniel Han, for their constant
love, support, endurance, and prayers.
Finally, I deeply appreciate my parents’ and friends’ prayers for me and my
family. I am truly blessed to have all of those supportive people in my lives.

v
TABLE OF CONTENTS
CHAPTER PAGE
ABSTRACT…………………………………………………………………………………….... i
ACKNOWLEDGMENTS………………………………………………………………………. iv
LIST OF TABLES…………………………………………………………………………….. xiii
LIST OF FIGURES..................................................................................................…...xiv
CHAPTERS
CHAPTER 1 – Introduction ……………………………………………………… ……1
Statement of the Problem ………………………………………………… ... 10
Significance of the Study ......................................................................... 12
Research Purpose …………………………………………………………… 13
Research Questions ………………………………………………………… . 14
Operational Definitions …………………………………………………........ 17
Organization of the Study …………………………………………………… 18
CHAPTER 2 – Literature Review ………………………………………………….. . 19
Teachers’ Attitudes and Beliefs in Mathematics …………………………. 19
Mental Computation ……………………………………………………....... . 28
Conclusion …………………………………………………………………… . 48
CHAPTER 3 – Methodology ............................................................................... 50
Participants ……………………………………………………………………. 51
Data-Gathering Procedures …………………………………………………. 55
Procedures …………………………………………………………………… 61
Data Analysis .......................................................................................... 74
vi
CHAPTER 4 – Results ………………………………………………………………. 78
Research Findings .................................................................................. 78
PTS’ Mathematics Attitudes, Mental and Written Computation,
and Mental Computation Anxiety ................................................. 79
Correlation between MCT Performance and Attitudes ................ 101
Mental Computation Performance ............................................. 102
Comparison of Differences in the Use of Mental Computation
Strategies between the Experimental Groups …………………… 119
The Relationship between the Uses of PTS’ Mental Computation
Strategies and Their Flexibility …………………………………… . 140
CHAPTER 5 – Conclusion…………………………………………………………. 240
Summary and Discussion … ................................................................. 240
Limitations of the Study .. ...................................................................... 304
Implications for Mathematics Education ………………………………… . 306
Recommendations for Future Study ……………………………………… 310
REFERENCES ........................................................................................................... 313
APPENDICES
Appendix A – Informed-Consent Letter…………………………………………… 323
Appendix B – Preservice Teachers’ Demographic Information ........................ 325
Appendix C – Mathematics Attitude Survey……………………………………….327
Appendix D – Unit Lesson Plan …………………………………………………… 333
Appendix E – Mental Computation Test (MCT)
PRETEST………………………………………………...............................359

vii
POSTTEST……………………………………………………………………364
Appendix F – Comparison of Different Ways of Mental Computation Strategies
Between Experimental Groups ……………....... ....................... 369
VITA ......................................................................................................................... 384

viii
LIST OF TABLES
TABLE PAGE
Table 1. Mental Computation Strategies for Two Digit by Two Digit Addition and
Subtraction ...................................................................................................... 35
Table 2. Mental Strategies for Two Digits Addition and Subtraction ............................. 36
Table 3. Preservice Teachers’ Demographic Information ............................................. 53
Table 4. The Research Design ………………………. ................................................... 57
Table 5. The Timeline for Intervention Sessions ………………………………………… 68
Table 6. The Pre-Interview Problems Selected from Pre-MCT ………………………… 72
Table 7. The Post-Interview Problems Selected from Post-MCT .................................. 73
Table 8. Descriptive Statistics for Mathematics Attitudes, Mental and Written
Computation, and Mental Computation Anxiety .............................................. 79
Table 9. Percentages of Responses of Attitudes towards Mathematics ...................... 81
Table 10. Percentages of Responses of Mathematics Teachers Behavior…... ........... 83
Table 11. Percentages of Responses to Mathematics Teachers’ Instruction…............. 84
Table 12. Percentages of Responses of Beliefs about Mental and Written
Computation ………………………………………………………. .................... 86
Table 13. Percentages of Responses of Instruction between Mental and Written
Computation …... ......................................................................................... 88
Table 14. Mental Computation Anxiety….......................................................................90
Table 15. Pre-Attitudinal Survey Mean Scores of Attitudes towards Mathematics …… 92
Table 16. Pre-Attitudinal Survey Mean Scores of Attitudes towards Mental and
Written Computation....................................................................................... 93
Table 17. Pre-Attitudinal Survey Mean Scores of Mental Computation Anxiety …... ... 94
ix
Table 18. Descriptive Data for Differences towards Mental and Written Computation.. 95
Table 19. Mean Changes in Belief towards Mental and Written Computation …... ..... 96
Table 20. Mean Changes in Instruction towards Mental and Written Computation…... 98
Table 21. Descriptive Data for Anxiety Changes towards Mental Computation………. 99
Table 22. Mean Changes in Mental and Written Computation ………………………... 100
Table 23. Overall Descriptive Statistics Comparison between Experimental Groups
and the Control Group on the Pre-and Post-MCT …………………………...103
Table 24. ANCOVA Results and Descriptive Statistics for Post-MCT by Instructional
Condition and Pre-MCT Scores……………………………………………..... . 104
Table 25. Multiple Comparisons and Mean Differences in Post-MCT Scores by
Instruction Type Controlling for Pre-MCT Scores ………………………..….. 105
Table 26. Comparison of Type of Instruction for Each Operation between Pre-and
Post-MCT scores using ANCOVA …………………………………………… . 106
Table 27. The Results of Addition Performance among Groups on Pre-and
Post-MCT…………….………………………………………………………….. 108
Table 28. The Results of Subtraction Performance among Groups on Pre-and
Post-MCT ……………………………………………………………………..… 109
Table 29. The Results of Multiplication Performance among Groups on Pre-and
Post-MCT ……………………………………………………………………….. 110
Table 30. The Results of Division Performance among Groups on Pre-and
Post-MCT ……………………………………………………………………..… 112
Table 31. The Results of Integer Performance among Groups on Pre-and
Post-MCT ……………………………………………………………………….. 112

x
Table 32. The Results of Fraction Performance among Groups on Pre-and
Post-MCT …... ........................................................................................... 113
Table 33. The Results of Decimal Performance among Groups on Pre-and
Post-MCT ……………………………………………………………………… .. 115
Table 34. The Results of Percent Performance among Groups on Pre-and
Post-MCT …... .......................................................................................... .117
Table 35. T-test Comparing Performance of Whole numbers on Pre-and Post-MCT
by Mode of Presentation …......................................................................... 118
Table 36. The Comparison of Mental Computation Addition Strategies of 25 + 99 ... 120
Table 37. The Comparison of Mental Computation Subtraction Strategies of 48 – 24
and 123 – 45 ….......................................................................................... .123
Table 38. Comparison of Different Ways of Mental Computation Division Strategies
of 300 ÷ 6…................................................................................................ .130
Table 39. Comparison of the different ways of strategies in the item
0. 25 + ¾ – 75%…………………………………….. ..................................... .140
Table 40. Summary of the Number of Participants in the Quintiles between Pre-
and Post-Interviews …... ............................................................................ 141
Table 41. The Results of Pre-Interviews on Addition Operations …... ........................ 143
Table 42. The Results of Pre-Interviews on Subtraction Operations …………………. 145
Table 43. The Results of Pre-Interviews on Multiplication Operations ……. ............... 148
Table 44. The Results of Pre-Interviews on Division Operations …... ......................... 150
Table 45. The Results of Pre-Interviews on Integer Operations …………………..…... 151
Table 46. The Results of Pre-Interviews on Fraction Operations …... ........................ 152

xi
Table 47. The Results of Pre-Interviews on Decimal Operations …... ........................ 154
Table 48. The Results of Pre-Interviews on Percent Operations ……………………… 157
Table 49. The Results of Post-Interviews on Addition Operations ….......................... 160
Table 50. The Results of Post-Interviews on Subtraction Operations …... ................. 162
Table 51. The Results of Post-Interviews on Multiplication Operations ……. ............. 166
Table 52. The Results of Post-Interviews on Division Operations …... ....................... 169
Table 53. The Results of Post-Interviews on Integer Operations …………………..… .171
Table 54. The Results of Post-Interviews on Fraction Operations ............................. 173
Table 55. The Results of Post-Interviews on Decimal Operations …... ...................... 176
Table 56. The Results of Post-Interviews on Percent Operations …………………….. 179
Table 57. A Comparison of Addition Strategy Used on Mental Computation Pre- &
Post-Interviews ………………………………………………………………….. 182
Table 58. A Comparison of Subtraction Strategy Used in Mental Computation Pre-
& Post-Interviews…... ................................................................................... 183
Table 59. A Comparison of Multiplication Strategy Used in Mental Computation Pre-
& Post-Interviews …………………….………………………………………….. 184
Table 60. A Comparison of Division Strategy Used in Mental Computation Pre-&
Post-Interviews …... ................................................................................... 185
Table 61. A Comparison of Integer Strategy Used in Mental Computation Pre-&
Post-Interviews…... .................................................................................... 186
Table 62. A Comparison of Fraction Strategy Used in Mental Computation Pre-&
Post-Interviews……………………………………………………………………187
Table 63. A Comparison of Decimal Strategy Used on Mental Computation Pre-&

xii
Post-Interviews …... ................................................................................... 189
Table 64. A Comparison of Percent Strategy Used on Mental Computation Pre-&
Post-Interviews …... .................................................................................... 190
Table 65. Strategies used on Mental Addition Computation Item: 143 + 59 ……….. . 193
Table 66. Strategies used on Mental Addition Computation Item: 18 + 27 + 37 …... 195
Table 67. Strategies used in Mental Subtraction Computation Item: 36 – 8 ……….. . 197
Table 68. Strategies used in Mental Subtraction Computation Item: 95 – 37….......... 199
Table 69. Strategies used in Mental Subtraction Computation Item: 807 – 399 …….. 200
Table 70. Strategies used in Mental Multiplication Computation Item: 7 × 16 ……… . 202
Table 71. Strategies used in Mental Multiplication Computation Item: 24 × 30 …... ... 204
Table 72. Strategies used in Mental Multiplication Computation Item: 99 ×180……... 206
Table 73. Strategies used in Mental Division Computation Item: 56 ÷ 7 …... ............. 209
Table 74. Strategies used in Mental Division Computation Item: 80 ÷ 16…... ............ 210
Table 75. Strategies used in Mental Division Computation Item: 468 ÷ 18 ………….. 212
Table 76. Strategies used on Mental Integer Computation Item: (25 × 4 ×0)/4... ...... 214
Table 77. Strategies used on Mental Integer Computation Item: -13 – (-37) + 20.….. 216
Table 78. Strategies Used on Mental Integer Computation Item: 24 × 4 ÷ (-6) ……… 217
Table 79. Strategies used on Mental Fraction Computation Item: 2/3 × 18 …………. 219
Table 80. Strategies used on Mental Fraction Computation Item: 4 ½ + 1 ¾ …….… 222
Table 81. Strategies used on Mental Fraction Computation Item: 1/3 × 4 1/5 ……... 224
Table 82. Strategies used on Mental Decimal Computation Item: 5.8 + 2.6…………227
Table 83. Strategies used on Mental Decimal Computation Item:
100 × 0.05 ÷ 1000 …................................................................................... 229

xiii
Table 84. Strategies used in Mental Decimal Computation Item: 0.2 × 75…………… 231
Table 85. Strategies used on Mental Percent Computation Item: 1% of 175 ……….. 234
Table 86. Strategies used on Mental Percent Computation Item: 75% × 120 …......... 236
Table 87. Strategies used on Mental Percent Computation Item: 38% × 60………… 238

xiv
LIST OF FIGURES
FIGURE PAGE
Figure 1. The example of multiplicative thinking ........................................................... 36
Figure 2. One-by one and two-by one digit array model multiplication .......................... 37
Figure 3. Digit array model multiplication ...................................................................... 38
Figure 4. Distributive property of multiplication…………………………………………... .38
Figure 5. The table of multiplying 7 × 9 …... ................................................................ 39
Figure 6. The table of multiplying 97 × 92………………………………………………. ... 39
Figure 7. The Vedic method of vertical multiplication …... ........................................... 39
Figure 8. The examples of long division approaches ……………………………………. 41
Figure 9. Scatter plot of pre-and post-MCT scores with regression slopes and
predicted means …... ............................................................................... 105
Figure 10. Addition frequency of strategies described for interviews item: 143 + 59... 191
Figure 11. Addition frequency of strategies described for interview item:
18 + 27 + 37…... ........................................................................................ 194
Figure 12. Subtraction frequency of strategies described for interview item:
36 – 8... ...................................................................................................... 196
Figure 13. Subtraction frequency of strategies described for interview item:
95 – 37 ....................................................................................................... 198
Figure 14. Subtraction frequency of strategies described for interview item:
807 – 399…................................................................................................ 199
Figure 15. Multiplication frequency of strategies described for interview item:
7 × 16. ........................................................................................................ .201

xv
Figure 16. Multiplication frequency of strategies described for interview item:
24 × 30 …... ............................................................................................... 203
Figure 17. Multiplication frequency of strategies described for interviews item:
99 × 180 …... ............................................................................................. 205
Figure 18. Division frequency of strategies described for interview item: 56 ÷ 7 …... . 207
Figure 19. Division frequency of strategies described for interview item: 80 ÷ 16 …... 209
Figure 20. Division frequency of strategies described for interview item:
468 ÷ 18…... ............................................................................................... 211
Figure 21. Integer frequency of strategies described for interview item:
(25 ×4 ×0)/4... ............................................................................................. 213
Figure 22. Integer frequency of strategies described for interview item:
-13 – (- 37) + 20…………………………………………………………………..215
Figure 23. Integer frequency of strategies described for interview item:
24 × 4 ÷ (-6)…... ........................................................................................ 217
Figure 24. Fraction frequency of strategies described for interview item: 2/3 × 18….. 219
Figure 25. Fraction frequency of strategies described for interview item:
4 1/2 + 1 3/4 …... ....................................................................................... 221
Figure 26. Fraction frequency of strategies described for interviews item:
1/3 × 4 1/5 …... .......................................................................................... 223
Figure 27. Decimal frequency of strategies described for interview item: 5.8 + 2.6…. 225
Figure 28. Decimal frequency of strategies described for interview item:
100 × 0.05 ÷ 1000 …... .............................................................................. 228
Figure 29. Decimal frequency of strategies described for interviews item:

xvi
0.2 × 75 ..................................................................................................... 230
Figure 30. Percent frequency of strategies described for interview item:
1% of 175…………………………………………………………………………. 233
Figure 31. Percent frequency of strategies described for interview item:
75% × 120... ............................................................................................... 235
Figure 32. Percent frequency of strategies described for interview item:
38% × 60…... ............................................................................................. 237

1
CHAPTER 1
INTRODUCTION
Traditionally, mathematics computation has been taught to students based on
pencil-and-paper algorithms. However, today, more studies pay attention to success
using mental computation and try to determine its influences on students’ achievement
in and out of school (Reys, Reys, Nohda, & Emori, 1995; Olsen, 2015; Varol & Farran,
2007; Yang & Huang, 2014). The importance of mental computation has been
emphasized in the mathematics standards; e.g., the Curriculum and Evaluation
Standards for School Mathematics emphasized the significance of mental calculation
(NCTM, 1989, 2000). The Process Standards highlighted in Principles and Standards
for School Mathematics (NCTM 2000) and the National Research Council’s Strands of
Mathematical Proficiency discussed in Adding It Up have encouraged that mathematics
instruction should move beyond rote procedural knowledge, since using memorized
rules and computational procedures have been problematic for students’ mathematics
learning (Kilpatrick, Swafford, & Findell, 2001; Parrish, 2011).
In addition, recent initiatives in mathematics curriculum reform have heightened
interest in mental computation. For instance, the Common Core State Standards for
Mathematics (CCSSM) continue to build on these processes and proficiencies for
deeper understanding, coherence, number sense and fluency and call for increased
attention to mental mathematics instruction (Lui & Bonner, 2016; Olsen, 2015; Parrish,
2011). In addition, the Partnership for Assessment of Readiness for College and
Careers (PARCC) has distinct assessment policies regarding calculator use. Actually,
the PARCC has been given in more than 35 states in 2014-2015. The assessments for
2
grade 6 through grade 12 can be divided into the calculator and no calculator sessions
(Olsen, 2015). This means that the importance of mental mathematics is an essential
key concept for developing students’ mathematics proficiency and learning.
The Meaning of Mental Computation
While memorizing basic facts makes mental computation easier, doing
mathematics mentally requires both memorized, automated facts and strategies of
number operations in order to solve problems that are much more complex than the
simple number facts people can memorize. Specifically, mathematics computation
consists of both written algorithms and mental computation. A difference between
written algorithms and mental computation is that the use of written algorithms may
encourage students to follow specific different steps without thinking about what they
are doing (Yang & Huang, 2014). On the other hand, mental computation provides a
valuable and useful connection between problem solving and mathematical concepts,
allows children to be involved with the process to determine what the numbers in the
problem represent, needs for some application of a deeper knowledge of how numbers
work and can be effectively used to check the reasonableness of written computations
(Hartnett 2007; Mardjetko & Macpherson, 2007; Varol & Farran 2007; Yang & Huang,
2014).
In line with this, Thompson (1999) distinguishes between the definition of mental
calculation and mental arithmetic. Mental arithmetic refers to mental recall only, while
mental calculation involves mental strategies (figuring out) as well as recall and is
defined as “more about the application of known or quickly calculated number facts in
combination with specific properties of the number system to find the solution of a
3
calculation whose answer is not known” (Thompson, 1999. p.2). In addition, Linsen,
Verschaffel, Reynvoet, & De Smedt (2015) stress that mental computation differs from
algorithmic computation in that “1) the problem is solved by operating on numbers
rather than on the digits; 2) there is no single correct solution path to be followed; 3) the
numbers are typically presented horizontally rather than vertically; and 4) there is less or
even no reliance on written notations” (p. 43). According to Hartnett (2007), the key
difference between mental computation and written algorithms is that mental
computation requires “some application of a deeper knowledge of how numbers work”
(p.345). In sum, in many studies mental computation is defined as the process of
calculating an exact arithmetic result without using external devices such as pencil, pen,
paper or calculators (Hartnett, 2007; Linsen et al., 2015; Reys et al., 1995; Threlfall,
2002; Varol & Farran, 2007; Yang & Huang, 2014).
The Importance of Mental Computation
The importance of mental computation is emphasized widely in the literature.
There are at least eleven reasons why mental computational mathematics plays a vital
role in mathematics education. First, mental computation helps students understand
mathematical concepts such as place value (Baroody & Coslick, 1998; Carroll, 1996;
Olsen, 2015; Parrish, 2011). Second, it is included in standardized tests (e.g., PARCC)
(Olsen, 2015). Third, the mental computation may lead to fluency and confidence
(Heirdsfield, 2002; Olsen, 2015). Fourth, it is useful for checking or estimating an
answer obtained from the calculator or computer (Baroody & Coslick, 1998; Olsen,
2015; Reys, 1984). In line with this, Kilpatrick et al. (2001) stress that “whether or not
students are performing a written algorithm, they can use mental computation to simplify

4
certain operations within the algorithms. Techniques of estimation and of mental
arithmetic are particularly important when students are checking results obtained using
a calculator or computer” (p. 415). Fifth, it is useful in real life situations (Baroody &
Coslick, 1998; McIntosh, Nohda, Reys, and Reys, 1995; NCTM, 2000; Olsen, 2015).
Sixth, it encourages learners to be efficient when operating on the numbers and is faster
than technology if one is trained with strategies (Baroody & Coslick, 1998; Olsen, 2015;
Parrish, 2011; Threlfall, 2002). Seventh, it provides essential prerequisites for doing and
developing computational estimation (Baroody & Coslick, 1998; Carroll, 1996; McIntosh
et al., 1995; McIntosh, Reys, 1984; Reys, & Reys, 1997). Eighth, it also provides
opportunities to engage in mathematical thinking (McIntosh et al., 1995, Reys, 1984;
Reys, Reys, Nohda, & Emori, 1995). Ninth, it contributes to developing and
understanding number sense (Baroody & Coslick, 1998; Carroll, 1996; Heirdsfield,
2002; McIntosh et al., 1995; Threlfall, 2002). Tenth, it develops problem-solving skills
(Baroody & Coslick, 1998; Carroll, 1996; Chesney, 2013; McIntosh et al., 1995; Reys,
1984; Threlfall, 2002). Finally, it develops not only procedural knowledge but also
conceptual understanding (McIntosh et al., 1995). Accordingly, McIntosh et al. (1995)
emphasize that mental computation can be used as a vehicle for promoting thinking,
conjecturing, and generalizing.
Two Frames of Mental Computation: A behavioral and constructivist view
Mental computation can be seen in two different frames: behavioral and
constructivist (Reys et al., 1995). A behavioral view stresses mental computation as a
basic skill and a prerequisite for paper and pencil computation or estimation, in which
proficiency is acquired by direct teaching and practice. According to Varol and Farran

5
(2007), if classroom instruction emphasizes only pencil and paper algorithms, then
procedural skills without mathematical understanding will more likely to be developed. In
this regard, the Principles and Standards for School Mathematics (NCTM, 2000)
emphasizes that procedural fluency should include conceptual understanding along with
skilled written computation (Yang & Huang, 2014).
On the other hand, a constructivist view asserts that mental computation can be
seen as higher-order thinking, where instruction must be learner-centered (Carroll,
1996; Reys et al., 1995) so that students can come up with a variety of creative mental
computation strategies on their own. In other words, mental computation is closely
related to the association between conceptual understanding and procedural skills that
are critical to mathematical understanding (Wearne & Hiebert, 1988). In line with this,
Heirdsfield and Cooper (2004b) examined two types of mental computations (flexible &
inflexible). Their study points out that students who benefit from effective mental
computation skills have an ability to use various strategies in different situations. This
means that students who use flexible mental computation strategies can select more
efficient ways to solve addition and subtraction problems (Bobis, 2006; Heirdsfield &
Cooper, 2004b). For instance, a student flexible in thinking can efficiently employ
number fact strategies (e.g., 9+7; add 1 to 9, take 1 from 7, so 10+6=16; 148+99 is the
same as 147+100) and confidently use their own self-developed strategies. In contrast,
students who are inflexible in thinking possess less efficient number fact strategies and
may resort to counting if the number fact is not known by the recall, and will resort to the
use of teacher-taught algorithms. Many flexible thinkers in their mental computation
procedures may develop a good conceptual understanding of the interrelations between

6
numbers and procedures (Blöte et al., 2000). Moreover, the mental image of a pencil
and paper algorithm is used by inflexible thinker, which is also considered an inefficient
strategy (Varol & Farran, 2007). Therefore, flexibility in thinking can be considered as a
key factor in the use of effective mental calculation strategies (Threlfall, 2002).
Two Major Mental Computation Approaches
Learning and development of strategies for mental computation play a crucial
role for primary school students (Mardjectko& Macpherson, 2007; Varol & Farran,
2007). Two different instructional approaches are as follows: 1) should teachers directly
teach students those skills, or 2) should teachers encourage students to develop their
own skills? The first approach may imply that teachers should teach a specific strategy
in a particular lesson. According to Swan and Sparrow (2001), it is easier for teachers to
teach a specific strategy of mental computation to students, but then flexibility that is
key for developing students’ proficiency may be lost.
In this regard, strategies for two-digit mental addition and subtraction are
examined in many studies (Blöte, Klein, & Beishuizen, 2000; Reys et al., 1995; Varol &
Farran, 2007). Specifically, Blöte et al. (2000) conducted a study with Dutch second-
grade students in order to determine which mental strategies students preferred while
solving addition and subtraction problems. In the study, Blöte et al., (2000) categorized
three main strategies: the 1010 strategy, separation, (e.g., 45 + 27; 40 + 20 = 60; 5 + 7
= 12; 60 + 12 = 72); the N10 strategy, aggregation, (e.g., 45 + 27; 45+20 = 65; 65 + 7 =
72); and the ‘short jump’ procedure (e.g., 65-59; 59 ∩ 60 ∩ 65 = 1 + 5 = 6, ∩ =
difference). Blöte et al. (2000) reported that at the beginning of the study children used
the N10 strategy, but after the teaching of the 1010 strategy, the use of the 1010
7
strategy increased. Interestingly, in interviews, Reys et al. (1995) found that students
who used a mental image of a soroban were generally very quick to get correct
answers. This implies that implementation of direct instruction of computation strategies
may enhance students’ understanding of mental calculation knowledge.
Since the 1980s, the Dutch Realistic Mathematics Education (RME) and the
program of England, the National Numeracy Strategy (NNS) have introduced important
reforms and claims that a constructive mathematics education should provide an
environment where students can construct their own concrete and informal problem
solution strategies by exploring mathematically real context problems. These two
curricula highlight the importance of explicit instruction of mental computation strategies,
the use of informal strategies, and more emphasis is given to the development of
mental computation prior to the teaching of standard written algorithms (Murphy, 2003).
The second approach involves a constructivist approach. Here, students may
develop their own skilled and efficient strategies spontaneously without direct instruction
(Swan & Sparrow, 2001; Varol & Farran, 2007). Students should explore and discuss a
variety of strategies and adopt those that are suited to their interests at that particular
time, according to the research; this approach is designed to develop mental
computation strategies, to allow students to develop flexibility in thinking, and to gain an
insight into the structure and properties of number and number operations. For instance,
Heirdsfield (2000) conducted in-depth interviews with thirteen third-grade students in
order to identify factors that influence their proficiency in mental addition and
subtraction. The results revealed that students who build their own strategies were more
accurate and showed number sense. The implication is that students should be given
8
opportunities and experience to develop their own strategies for mental computation in
their classrooms.
The Factors Affecting Mental Computation Performance
There are several factors involved in incorporating students’ own mental
computation into mathematics lessons (Mardjetko & Macpherson, 2007; McIntosh,
Nohda, Reys & Reys, 1995; Reys et al., 1995). Mathematics problems can be
demonstrated orally and written algorithms vertically and horizontally (Linsen et al.,
2015; Mardjetko & Macpherson, 2007; Reys et al., 1995). Mardjetko & Macpherson
(2007) emphasized the importance of mode of presentation when presenting
mathematical problems because it significantly affects both student performance on
mental computation and the choice of mental computation strategy. In addition, they
stress that visualizing written algorithms impacts students’ development of mental
computation strategies in that students heavily rely on routine pencil and paper
algorithms as they solve problems mentally. In their study, they presented a two-digit
addition problem “46 + 39” three different ways: orally, horizontally, and vertically. When
presenting the problem orally, most students visualized the problem vertically and
solved problems from right to left. On the other hand, the flexible and efficient thinkers
visualized the problem horizontally and solved the problem from left to right. The results
of the study revealed that students who performed higher on orally presented items can
apply more flexible mental strategies (Mardjetko & Macpherson 2007; McIntosh, et al.,
1995). These results were opposite to the Reys et al.’s (1995) findings in that problem
presented visually generally produced higher performance levels.
9
Individual assessment is another important factor that may impact students’
mental computation performance (Heirdsfield & Cooper, 2004; Mardjetko &
Macpherson, 2007; Murphy 2004)). In particular, teacher-student interviews are needed
to elicit students’ mental computation knowledge. In this regard, Heirdsfield and Cooper
(2004) conducted in-depth interviews with sixty grade 3 students to identify factors
associated with mental computation. Students’ responses were analyzed to reveal the
following individual factors: strategy choice, flexibility, accuracy, access to alternative
strategies, number facts knowledge, and computational estimation.
The role of the teacher is crucial in promoting students’ mental computation
performance. Accordingly, Mardjetko & Macpherson (2007) suggested six principles for
teacher use in developing mental computation. First, teachers should encourage
students to share and model a variety of their strategies for mental computation in order
to develop confidence through class discussion. Second, teachers should delay formal
teaching of pencil and paper algorithms until students have flexible mental computation
strategies. Third, teachers should accept the variety of students’ creative strategies.
Fourth, teachers should promote the importance of mental computation by
demonstrating how to check the reasonableness of answers. Fifth, teachers should ask
questions that related to real life experiences. Finally, teachers should present
questions verbally and write algorithms horizontally and/or vertically.
Summary
The importance of mental computation strategies has been emphasized in
students’ mathematics learning for many decades. Teachers’ attitudes and beliefs in
mathematics teaching and learning may play a vital role in students’ understanding of

10
mental computation. Teachers with behavioristic beliefs think that students can acquire
mental computation knowledge through explicit or direct teaching methods. Teachers
with constructivist beliefs may believe that students can construct their own knowledge
through active social interaction such as hands-on activities, discovery learning, small
group activities, and classroom discussion. These two different teaching approaches
may affect students’ mathematics performance and attitudes towards mathematics
learning but the comparative effect of mental computation strategies with respect to
these two different approaches has not been adequately studied and reported. Thus,
this study may help mathematics educators in this regard.
Statement of the Problem
Mental computation provides a valuable and useful connection between problem-
solving and developing mathematical concepts; however, the main focus of
mathematical computation in the primary school has been placed on written pencil and
paper algorithms. Since many classroom teachers have been educated in ways that
focus on the rote memorization of basic facts, and the development of procedures for
completion of traditional written algorithms, their teaching strategies are accordingly
influenced by their previous learning experiences. Although these teachers can see
benefits for using mental computation strategies in their classrooms, their lack of related
knowledge has led to a lack of confidence and teaching skills (Hartnett, 2007). It is even
more doubtful how effectively the preservice teachers (PTS) can use the strategies they
have developed (Carroll, 1996). To succeed in learning and in teaching mental
computation to students, it is important that PTS be prepared to teach effectively prior to

11
classroom teaching. Teachers and students have frequently confused mental
computation with mental arithmetic that is heavily focused on the memorization of basic
math facts such as knowing the times-tables. Teachers need to know what mental
computation actually means, why it needs to be used for students’ mathematics
learning, and how students effectively and efficiently develop their mental computation
strategies.
In this regard, just as inservice classroom teachers play a significant role in
making use of mental computation strategies in their classrooms, so might preservice
teachers. However, PTS must be adequately equipped with knowledge in order to
respond to a wide range of different students’ questions and ideas regarding operations
on the various sets of numbers – whole numbers, integers, rational numbers (decimals,
fractions, and percentages) and solving such problems mentally. Moreover, studies
(Blöte et al., 2000; Heirsfield, 2000; Varol & Farran, 2007) found that students who
show inaccuracies in mental computation, and an inability to use alternative strategies,
have indicated a lack of conceptual understanding with respect to mental computation
strategies. Although some students are able to use written algorithms successfully, in
thinking about the time spent learning these procedures, it would seem necessary for
PTSto spend time learning how to develop students’ mental computation strategies.
Moreover, though many researchers acknowledge the importance of mental
computation strategies and the relationship between conceptual understanding and
procedural skills, there are few empirical studies that investigate how to help students
develop these strategies (Varol & Farran, 2007).

12
Significance of the Study
For many decades, drill and practice of mathematics procedures have been a
teaching method in mathematics worldwide. In order to change students’ views of the
importance of mental computation, the attitudes of PTS towards mental computation
should be further studied to determine whether they think mental calculation plays an
important role or not in mathematics teaching. A positive attitude and open mind
towards students’ different strategies in computation could lead a student to be a
successful critical thinker.
Currently, some studies pay particular attention to the success of students’
mental calculation and attempt to assess the influence on students’ achievement (Blöte
et al., 2000; Heirdsfield & Cooper, 2004; Reys et al,1995; Swan & Sparrow, 2001; Varol
& Farran, 2007). Although there is an increased awareness of the importance of mental
computation, a focus on basic fact worksheet problems is the norm in the mathematics
classrooms. Finding effective and efficient mental computation strategies that are more
focused on conceptual understanding should be emphasized.
The significance of this study is two-fold. First, it contributes to the research
base that is related to PTS’ knowledge of mental computation. In other words, if the
mental computation is an ability students should develop and improve, what classroom
instruction works best to encourage PTS’ mental computation ability should be analyzed
(Carroll, 1996). More specifically, knowing and experiencing mental computation as a
basic skill may allow PTS to directly teach mental computation strategies. Viewing
mental computation as higher-order thinking requires PTS to learn relevant instructional
techniques. For example, the use of class discussion. Second, mathematics educators

13
in preservice, inservice, and professional development programs may apply what
mental computation strategies and processes work best for both flexible and inflexible
learners. Thus, this study also provides useful information to both preservice teacher
education programs and inservice teachers’ professional development.
Research Purpose
The purpose of this research is to explore PTS’ attitudes and beliefs towards
mathematics, mental and written computations, and mental computation anxiety, to
identify differences in mental computation performance and investigate their use of
different mental computation strategies using different approaches among the three
different groups (e.g., DT, OA, & control groups), and to identify how the use of PTS’
mental computation strategies affects their flexibility regarding mental computation
ability. More specifically, the research is designed to provide several different
perspectives on the use of mental computation strategies. First, attitudes of PTS
towards mathematics, mental and written computations, and students’ anxiety in mental
computation were assessed. Second, the differences between experimental and control
groups’ performances on mental computation before and after instruction were
assessed. Third, the different mental strategies used by PTS between experimental
groups before and after instruction were assessed and characterized. Lastly, in order to
distinguish the characteristics of flexible and inflexible learners, the use of PTS’ mental
computation strategies was analyzed through interviewing to determine their effect on
flexibility regarding mental computation.

14
Research Questions
To explore these issues, there are five research questions aimed at examining
PTS’ attitudes towards mathematics teaching and learning and the use of different
mental computation strategies with respect to operations on whole numbers, integers,
and rational numbers with respect to fractions, decimals, and percentages, in using two
different teaching approaches.
1. To what extent do PTS’ believe that mathematics attitudes, mental and written
computation, and anxiety changes regarding mental computation are
important?
2. Is there a significant correlation between PTS’ mental computation
performance and their attitudes towards mathematics, written and mental
computations, and mental computation anxiety?
3. Are there significant differences in mental computation performance between
the experimental groups (i.e., the Direct Teaching (DT) and the Open
Approach (OA)) and the control group before and after instruction?
4. What are the differences in the use of mental computation strategies between
the experimental groups? For each group and among individuals, what mental
computation strategies work best for solving addition, subtraction,
multiplication, division, integer, fraction, decimal, and percentage problems?
5. How does the use of PTS’ mental computation strategies affect students’
flexibility regarding mental computation?
The first question is appropriate because although the importance of
implementing mental computations has been strongly stressed in the literature, the

15
behaviorist teaching approach (e.g., only written computation) is still predominantly
practiced in the U.S. mathematics classroom (Lui & Bonner, 2016; Varol & Farran,
2007). Just as teachers’ attitudes and beliefs in mathematics significantly affect
students’ attitudes towards mathematics and achievement in mathematics, PTS’
positive attitudes towards mathematics, in particular, mental computation strategies,
should be developed. Thus, this question will be used as a measure of PTS’ attitudes
towards mathematics, and mental and written computation and mental computation
anxiety.
The second question is appropriate since teachers’ negative past experiences
with mathematics along with a low level of their content knowledge and conceptual
understanding may prevent both preservice and inservice teachers from teaching
mathematics (Bekdemir, 2010; Jong & Hodges, 2015; Swars, et al., 2006; White, Way,
Perry, & Southwell, 2005/2006) using mental computation strategies. In two different
approaches, PTS will be provided a positive learning environment that enhances
stronger mental computation knowledge using not only their procedural knowledge but
also their conceptual understanding. As a result, this question will be used as a
measure of how PTS’ attitudes changed after instruction using two different mental
computation approaches.
The third and fourth questions are appropriate because mathematics educators
acknowledge that although the direct teaching approach comes from a behaviorist view,
they can foster students’ understanding with explicit teaching procedures using various
arithmetic properties such as the commutative, distributive, associative properties
(Bobis, 2006; Days & Hurrell. 2015). Developing students’ own strategies comes from a

16
constructivist view where students can come up with a variety of mental computation
strategies of their own (Blöte et al., 2000; Bobis, 2007; Day & Hurrell, 2015; Hartnett,
2007; Linsen et al., 2015; Murphy, 2004; Olsen, 2015; Parrish, 2011; Reys et al., 1995;
Yang & Huang, 2014). In particular, Reys et al. (1995) emphasize that students who are
encouraged to “develop, use, and discuss their own mental strategies are just as
accurate and successful as students who are provided with direct instruction” (Yang &
Huang, 2014, p. 13). In addition, Heirdsfield (2003) points out that “whether students
should be encouraged to develop their own mental strategies or be taught specific
strategies is not clear” (Heirdsfield, 2003, p.421). Therefore, in implementing these two
different approaches in the experimental group, along with control group, this study will
identify significant differences between two different groups on their mental computation
performance and their use of mental computation strategies that work best for each
problem.
The last question is appropriate because verbalizing and discussing alternative
mental computation procedures along with recording the procedural steps of number
operations can help students construct their own strategies in a flexible way (Heirdsfiled
& Cooper, 2004). Through interviews with students for both the experimental and
control groups, how students’ flexibility can be developed will be identified in detail. This
question will be also used for measuring the relationship between PTS’ mental
mathematics test performance and their flexibility using alternative solutions.
17
Operational Definitions
1. Preservice Teachers (PTS): those students who enroll and study in a teacher
education program in order to gain certification to teach in the future. In this
study, “preservice teachers,” “student teachers,” and “prospective teachers” are
used interchangeably.
2. Mental Computation: the process of calculating an exact arithmetic result without
using external devices such as pens, papers, or calculators (Linsen et al., 2015;
Reys et al., 1995; Varol & Farran, 2007; Yang & Huang, 2014). In this study,
“mental computation,” “mental mathematics,” “mental calculation,” and “mental
arithmetic” are used interchangeably.
3. Direct Teaching (DT): an approach by which students are taught a mental
calculation strategy in the classroom (Murphy, 2004). In lessons in this study,
after generating students’ methods of mental computation, the commonly used
mental computation strategies from a variety of reviewed literature are introduced
and examined. However, lessons using a direct teaching approach will be more
focused on ways of analyzing and thinking about numbers.
4. Open or Open-ended Approach (OA): a teaching method that presents an open-
ended problem first, produces multiple correct answers to the given problem and
formulates something new by comparing and discussing solutions (Becker &
Epstein, 2007; Becker & Shimada, 1997; Hashimoto & Becker, 1999). During
lessons, students are asked to communicate their thinking when presenting and
justifying their own mental computation strategies to problems they solve
mentally. Then students can share their findings with the class and make a group
18
or individual decision on whether each strategy is mathematically logical, is able
to be generalized, and can be applied in other situations.
Organization of the Study
In chapter 1, the introduction, statement of the problem, research questions,
significance of the study, and definition of terms of the study are presented. Chapter 2
provides a review of the related literature regarding PTS’ attitudes towards mathematics
and mental computation and research related to the use of PTS’ mental computation
strategies and its relationship to flexibility. The methodology and procedures used to
gather data for the study are presented in Chapter 3. Chapter 4 presents the findings of
the study using the pre-and post-Mathematics Attitudinal Surveys (MAS), pre-and post-
Mental Computation Test (MCT) and pre-and post-interviews with three groups of
preservice teachers. Finally, in chapter 5, a summary and discussion of the study,
limitations of the study, other implications for mathematics education, and
recommendations for future research are discussed.
19
CHAPTER 2
LITERATURE REVIEW
Teachers’ Attitudes and Beliefs in Mathematics
A variety of researchers who conducted studies related to attitudes towards
mathematics compared its definition to other affective domains, such as belief, self-
efficacy, and mathematics anxiety that influenced students’ mathematics learning (e.g.,
Berwick, 2006; Heirdsfield & Cooper, 2004; Jong & Hodges, 2015; White, Way, Perry, &
Southwell, 2006). Much research in the affective domain has not clearly distinguished a
definition between belief and attitude. In this regard, Berwick (2006) compared the
definition of attitudes with that of beliefs. Attitude has a greater affective and lesser
cognitive component than does belief. Attitude can be either a positive or negative
assessment of a psychological object, while beliefs have nothing to do with any
evaluation. Therefore, attitudes may be considered as the result of all of the relevant
beliefs each individual holds. Specifically, White et al. (2006) compared the definition of
attitudes with that of behavioral attitude. Attitudes can be considered as “having been
learnt” and “they predispose an individual to action that has some degree of
consistency” (p. 34). Behavioral attitude is closely related to a person’s judgment of
performing the behavior as good or bad. In other words, the person could be in favor or
against performing certain behavior.
Teachers’ Attitudes and Beliefs in Mathematics Teaching Practice
During the past several decades, it is evident that pre-and in-service teachers’
attitudes, including self-efficacy and mathematics anxiety, play an important role in
20
teaching and learning mathematics (e.g., Berwick, 2006; Heirdsfield & Cooper, 2004;
Jong & Hodges, 2015; Vinson, 2001; White, et al., 2006). This is because both
preservice and inservice teachers’ attitudes and beliefs have an impact on their
teaching practice (Jong & Hodges, 2015; White et al., 2006) and students’ mathematics
learning and performance (Lui & Bonner, 2016; Vinson, 2001; White, et al., 2006). With
respect to teaching practice, Jong and Hodges (2015) investigated the attitudes towards
mathematics among preservice elementary teachers in relation to their experiences with
K-12 learners of mathematics and experiences in a teacher education program. The
result showed that developing positive attitudes was an important aspect of teacher
education as attitudes influence the instructional practices preservice teachers use with
students. More specifically, mathematics methods courses that focus on pedagogical
strategies using multiple representations, varied instructional strategies, and
assessments of students’ conceptual understanding of mathematics, along with
intensive field experience that provides them with valuable opportunities, can result in
positively changed preservice teachers’ attitudes towards mathematics (Jong & Hodges,
2015).
Mathematics anxiety is another affective domain that affects preservice teachers’
teaching practice (Bekdemir, 2010; Swan & Sparrow, 2001; Swars et al., 2006; Vinson,
2001). Bekdemir (2010) examined causes of the preserive elementary teachers’ anxiety
in relation to their previous experiences. Their mathematics anxiety was significantly
caused by their previous teachers’ negative behavior and traditional teaching approach
that emphasized rote memorization and meaningless practice.

21
As for students’ mathematics performance, White et al. (2006) examined how
preservice teachers’ attitudes affect students’ attitudes and achievement towards
mathematics. The result found that negative attitudes and beliefs can contribute to
negative students’ beliefs, attitudes, and performance outcomes. Thus, positive
preservice teachers’ attitudes are necessary to contribute to success in teaching. In line
with mathematics anxiety, Swars, Daane, & Giesen (2006) described the relationship
between self-efficacy and mathematics anxiety. Mathematics anxiety refers to the
feeling of tension, helplessness or mental disorganization a student has when he or she
is required to manipulate numbers and shapes. Teachers with high mathematics anxiety
tend to avoid teaching mathematics through which this negative attitude may be passed
to their students. Such negative attitudes significantly affect students’ mathematics
performance. This implies that those negative past experiences with mathematics along
with the low level of teachers’ content knowledge and conceptual understanding can be
causes of preventing both preservice and inservice teachers from teaching mathematics
effectively (Bekdemir, 2010; Jong & Hodges, 2015; Swars, et al., 2006; Vinson, 2001;
White et al., 2006).
Therefore, it is imperative for preservice and inservice teachers to build upon
positive attitudes towards mathematics and mathematics teaching and learning
(Berwick, 2006; Jong & Hodges, 2015). If necessary, teachers should improve
themselves professionally and personally to maintain students’ positive attitudes
towards mathematics by encouraging their students, using effective teaching methods
including various manipulatives, and accepting students’ different responses concerning
alternative problem-solving techniques (Berwick, 2006). In doing so, students may build
22
positive attitudes in mathematics learning. Also, this may be enhanced by a
constructivist view of instructional practice.
Instructional Practice in Mathematics
During the last several decades, elementary mathematics teachers’ teaching
strategies have heavily relied on behaviorist approaches such as rote memorization of
basic facts and the development of procedural skills without mathematical
understanding (e.g., Lui & Bonner, 2016; Varol & Farran, 2007). Teachers who prefer
teaching using a behaviorist approach believe that they should provide students with
information in the form of facts, rules, and laws based on the textbooks that foster
learning through memorization of procedures (Bobis, 2007; Reys et al., 1995; Swan &
Sparrow 2001). In this approach, teachers are expected to become deliverers of
concepts, facts, and skills and have an authority to control the class (Lui & Bonner,
2016).
With respect to effective mathematics instruction, a new mathematics reform
movement, constructivism, occurred in the U.S several decades ago (e.g., Ertmer &
Newby, 1993; Lui & Bonner, 2016). According to Ertmer and Newby (1993),
constructivists stressed the flexible use of preexisting knowledge rather than the recall
of prepackaged knowledge. In addition, constructivists emphasize that learning occurs
in realistic settings, so the selected learning task must be relevant to students’ real life
experiences. The goal of constructivism is not to retrieve intact knowledge but to
provide students with the best environment for learning. In the constructivist classroom,
the teacher’s role is to become a facilitator, guide, and supporter to develop students’
higher-order thinking and mathematical ideas and thoughts (Clements & Battista, 1990).

23
In other words, the teacher does not provide the answers but proficiently guides the
students to construct desired knowledge by asking the appropriate questions to
motivate students’ learning and providing well-designed activities.
More specifically, there are differences between teachers with constructivist and
behaviorist beliefs. Teachers with a constructivist tendency consider that students can
actively construct their own knowledge (Becker & Epstein, 2007; Becker & Shimada,
1997; Hashimoto & Becker, 1999; Blöte, Klein, & Beishuizen, 2000; Bobis, 2007;
Hartnett, 2007; Heirdsfield & Cooper, 2004; Parrish, 2011; Reys et al.,1995; Swan &
Sparrow 2001; Yang & Huang, 2014), so these teachers organize their instructions
based on students’ development of ideas or thoughts to enhance understanding and
problem solving skills through teacher and student interaction in discussion (Becker &
Epstein, 2007; Becker & Shimada, 1997; Hashimoto & Becker, 1999; Heirdsfield &
Cooper, 2004; Parrish, 2011; Yang & Huang, 2014) and in written form (Bobis, 2007;
Parrish, 2011). In this approach, teachers are expected to become facilitators, guides,
and supporters to develop students’ mathematical ideas and thoughts (Lui & Bonner,
2016). For instance, Parrish (2011) examined the discussion solution for 16 × 25 in a
fourth grade classroom. The classroom teacher encouraged students to create their
own methods mentally as they discuss their solution methods in groups and with a
whole class. The class tried several students’ mental strategies to see if they would
work for any multiplication problems. Then students could share their findings with the
class through discussing their ideas with different solution methods in written forms as
well and making a group decision on whether the strategy is mathematically logical and
could be applied in all situations.
24
In addition, Becker and Shimada (1997) described how to use the open-ended
approach with constructivist instructional benefits to deepen students’ mathematics
understanding and content knowledge. Open end or open-ended problems are those for
which there are multiple correct answers or ways of solving the problems. In line with
this, Hashimoto and Becker (1999) presented the following three types of open-ended
problems: finding rules and relations, classifying, and measuring. The purpose of finding
rules and relations is to have students find as many different rules and relations as
possible from each student’s point of view. When given a classifying problem, students
are exposed to a problem that shares the same characteristics among various figures.
Then, students find and write down the many different characteristics. When given a
measuring problem, students can determine multiple methods for measuring the
scattering of marbles on a board, for example. Thus, teachers should be aware and
discuss the different methods and advantages and disadvantages of each.
As for the open problem formulation, Hashimoto and Becker (1999) stressed that
students should formulate or pose new problems from a given problem through
generalization, analogy, and other ways. This means that students formulate their own
problems by changing conditions based on the original problem (Becker & Epstein,
2007). For example, students solve a given problem and then compare and discuss
their findings. Then the students can change one or more condition in order to formulate
a new problem (Becker & Epstein, 2007). In this research, students have an opportunity
to be more actively involved in lessons, to have more opportunities to make use of their
mathematical knowledge and skills, to deepen their mathematics learning, and to enjoy
their experiences in problem solving.

25
Although there is an increased awareness of the benefits of a constructivist
teaching approach, the behaviorist approach is still predominantly practiced in many
U.S. mathematics classrooms (Lui & Bonner, 2016; Varol & Farran, 2007). However, it
should not be overlooked that implementation of direct instruction of computation
strategies may enhance students’ understanding of mental computation knowledge
(Blöte et al., 2000; Reys et al., 1995; Yang & Huang, 2014).
In sum, the findings of this study may provide useful information to U.S.
mathematics teacher educators and educational policy makers, which may enhance
existing teacher preparation programs and preservice teachers’ attitudes toward
mathematics teaching and learning.
Mathematical Knowledge: Conceptual and Procedural Knowledge
Several studies have found that both preservice and inservice teachers do not
have sufficient subject-matter content knowledge in mathematics (e.g., Berwick, 2006;
Hartnett 2007; Lui & Bonner, 2016; Ma, 1999). To show this, Ma (1999) investigated
elementary teachers’ mathematical knowledge in teaching by comparing American and
Chinese teachers of mathematics with emphasis on teachers’ subject-matter
knowledge. She found that Chinese teachers had a “Profound Understanding of
Fundamental Mathematics (PUFM)” (p.21). Ma (1999) asked, “What kind of ‘teaching
for understanding’ can we expect from teachers who do not have a ‘profound
understanding of fundamental mathematics’ themselves” (p. 34)? Ma (1999) stressed
that a teacher with profound understanding of mathematics should be able to make
connections between conceptual and procedural knowledge, provide a variety of
teaching approaches with multiple perspectives to foster students’ flexible and deeper

26
understanding of mathematics, be aware of the conceptual structure - simple but
powerful basic concepts - and have a fundamental understanding of elementary
mathematics curricula in order to bridge previous and future learning.
Conceptual understanding and procedural fluency are considered important
mathematics proficiencies teachers need to possess (Blöte et al, 2000; Kilpatirck,
Swafford, & Findell, 2001; Lui & Bonner, 2016; Ma 1999). The National Council of
Teachers of Mathematics (NCTM, 2000) put an emphasis on students’ understanding of
underlying conceptual knowledge that is linked to factual knowledge and procedural
fluency. At the same time, teachers’ professional practice is expected to rise to the
challenge of new standards such as the Common Core, which emphasizes both
conceptual understanding and procedural fluency (Lui & Bonner, 2016). Several studies
(e.g., Kilpatirck et al., 2001; Lui & Bonner, 2016; Ma, 1999) defined conceptual
understanding as an understanding of concepts in terms of relationships and systems,
and the ability to generate representations of them. Students who have conceptual
knowledge can understand why a mathematical idea is important and this enables them
to learn new ideas by connecting those ideas to their previous knowledge. Procedural
fluency involves application of specific algorithms and when and how to use them
appropriately to solve particular problems. Without sufficient procedural fluency,
students are not able to deepen their understanding of mathematical ideas or solving
mathematics problems and there may be a danger of practicing incorrect procedures
and forgetting the steps easily (Kilpatirck et al., 2001). According to Lui and Bonner
(2016), constructivist instructional approaches are closely related to the development of
conceptual knowledge, whereas traditional instructional approaches can be more

27
applied to develop procedural knowledge. Unfortunately, many elementary school
teachers in the United States rely less on conceptual knowledge and more on
procedural knowledge, even as they acknowledge that a deep understanding of
mathematics requires conceptual knowledge (Lui & Bonner, 2016; Ma, 1999)
As a result, it is important for both teacher education programs and teachers’
professional development to find an effective and efficient mathematical instructional
approach that is focused more on the development of conceptual understanding than
procedural fluency. In other words, preservice teachers’ attitudes towards mathematics
and the attitudes they are developing towards teaching mathematics play an important
part in teacher education programs. If this applies to preservice teachers’ content
knowledge, the effect of preservice teachers’ teaching practice would be heightened.
This limitation leads to the introduction of the second part of this study; namely mental
computation as content knowledge
Several shortcomings in relation to teachers’ attitudes and beliefs in mathematics
teaching and learning are shown in the literature reviewed. First, the majority of studies
reviewed have addressed how preservice teachers’ attitudes affect students’ attitudes
and performance towards mathematics (Berkdemir, 2010; Beswick, 2006; Jong &
Hodges, 2015; Lui & Boner, 2016; Swan & Sparrow, 2001; White et al., 2006). Only two
studies (Jong & Hodges, 2015; White et al., 2006) described the assessment of
preservice teachers’ content knowledge by observing changes in attitude toward
mathematics. Thus, more empirical studies should be done to assess the relationship
between preservice teachers’ attitudes and content knowledge in mathematics. Second,
the major instrument used by preservice teachers is survey (Berkdemir, 2010; Beswick,
28
2006; Jong & Hodges, 2015; Lui & Boner, 2016; White et al., 2006). Similarly as above,
very few studies have been conducted to measure mathematics content knowledge
using surveys. Third, all of the researchers in the literature reviewed made connections
between teaching practice and attitudes including anxiety, self-efficacy, and beliefs
towards mathematics; however, few or no studies have been conducted concerning
attitudes towards constructivist and/or behaviorist approaches to mathematics learning
and teaching.
Mental Computation
Studies define mental computation as the process of calculating an exact
arithmetic result without using external aids such as pencils, papers, or calculators
(Hartnett, 2007; Kilpatric et al., 2001; Linsen et al., 2015; Reys et al., 1995; Threlfall,
2002; Varol & Farran, 2007). Recent studies define mental computation as a thinking
process that combines the understanding of numbers and operations in the human
brain without the aids of external devices (Yang & Huang, 2014).
The Uses of Mental Computation and Written Computation
In line with these definitions of mental computation, many studies have used
different terms for mental computation (e.g., Bobis, 2007; Kilpatrick et al., 2001; Linsen
et al., 2015; Murphy, 2004; Yang & Huang, 2014). Some used mental computation as
mental arithmetic (Kilpatrick et al., 2001; Swan & Sparrow; 2001) and mental algorithms
(Reys et al., 1995). Some studies used the term written computation (Reys et al., 1995;
Yang & Hwang, 2014) as standard algorithm (Bobis, 2007) or algorithm computation
(Linsen et al., 2015). In other words, written computation refers to strategies which are
deeply based on symbolic knowledge or complicated algorithms that are explicitly
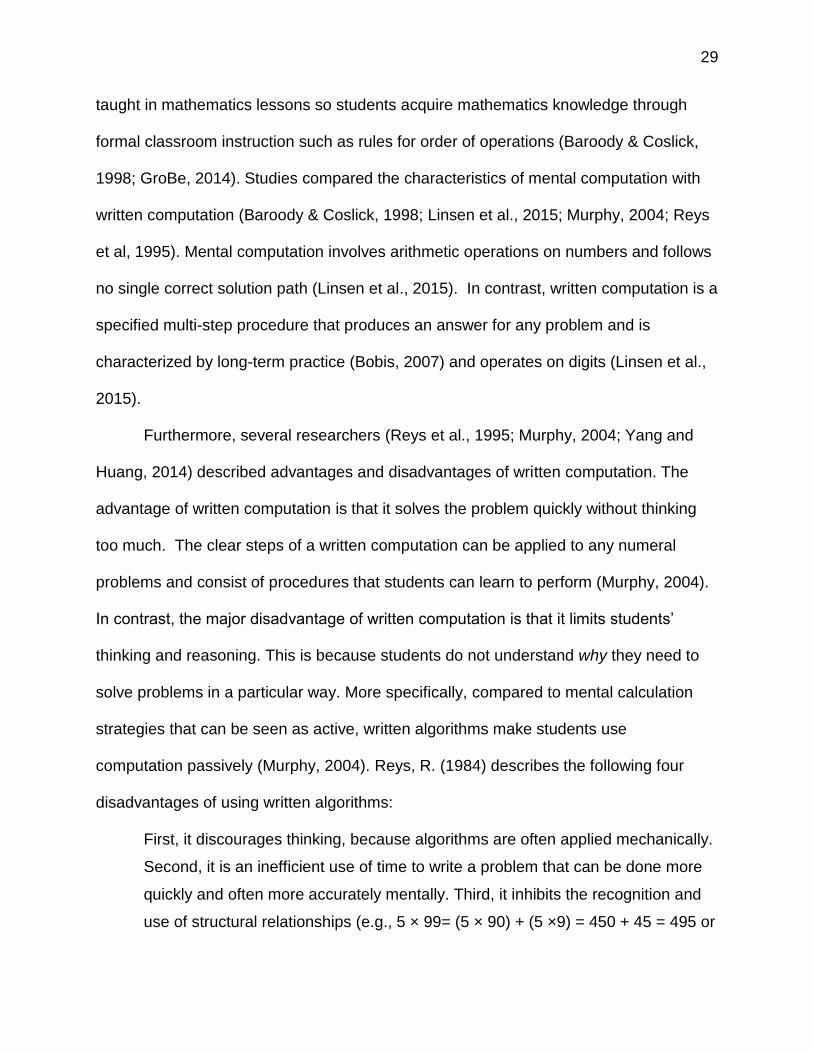
29
taught in mathematics lessons so students acquire mathematics knowledge through
formal classroom instruction such as rules for order of operations (Baroody & Coslick,
1998; GroBe, 2014). Studies compared the characteristics of mental computation with
written computation (Baroody & Coslick, 1998; Linsen et al., 2015; Murphy, 2004; Reys
et al, 1995). Mental computation involves arithmetic operations on numbers and follows
no single correct solution path (Linsen et al., 2015). In contrast, written computation is a
specified multi-step procedure that produces an answer for any problem and is
characterized by long-term practice (Bobis, 2007) and operates on digits (Linsen et al.,
2015).
Furthermore, several researchers (Reys et al., 1995; Murphy, 2004; Yang and
Huang, 2014) described advantages and disadvantages of written computation. The
advantage of written computation is that it solves the problem quickly without thinking
too much. The clear steps of a written computation can be applied to any numeral
problems and consist of procedures that students can learn to perform (Murphy, 2004).
In contrast, the major disadvantage of written computation is that it limits students’
thinking and reasoning. This is because students do not understand why they need to
solve problems in a particular way. More specifically, compared to mental calculation
strategies that can be seen as active, written algorithms make students use
computation passively (Murphy, 2004). Reys, R. (1984) describes the following four
disadvantages of using written algorithms:
First, it discourages thinking, because algorithms are often applied mechanically.
Second, it is an inefficient use of time to write a problem that can be done more
quickly and often more accurately mentally. Third, it inhibits the recognition and
use of structural relationships (e.g., 5 × 99= (5 × 90) + (5 ×9) = 450 + 45 = 495 or
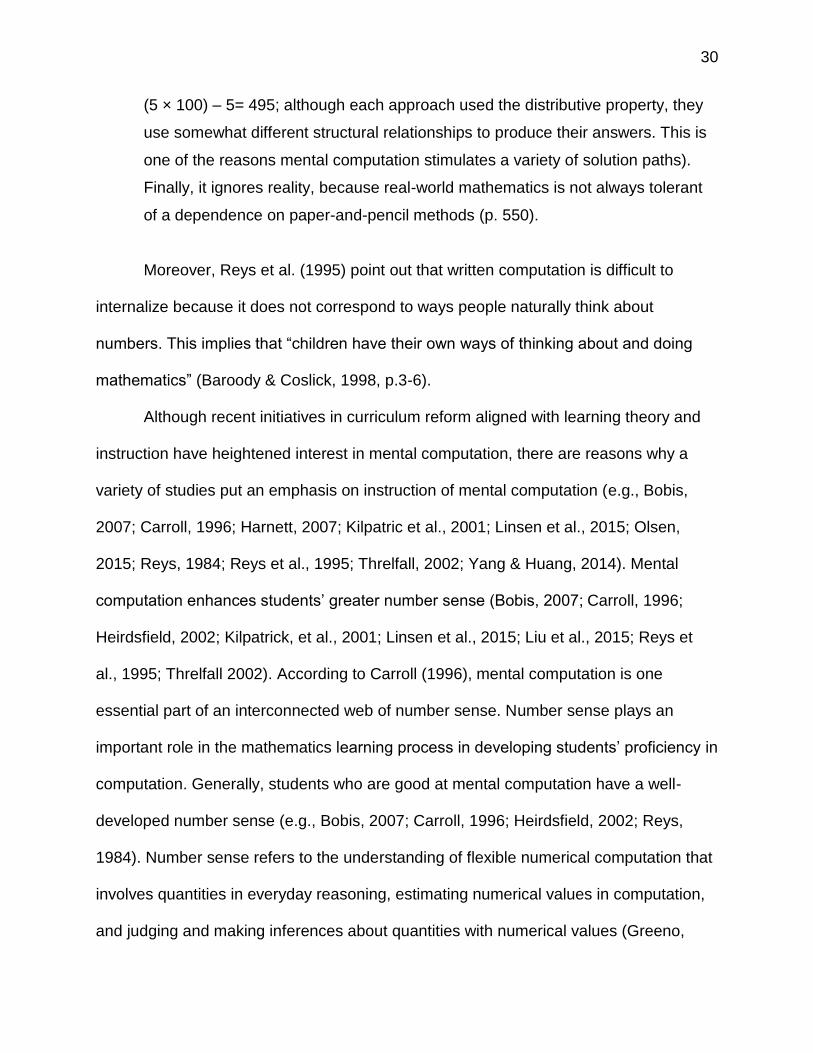
30
(5 × 100) – 5= 495; although each approach used the distributive property, they
use somewhat different structural relationships to produce their answers. This is
one of the reasons mental computation stimulates a variety of solution paths).
Finally, it ignores reality, because real-world mathematics is not always tolerant
of a dependence on paper-and-pencil methods (p. 550).
Moreover, Reys et al. (1995) point out that written computation is difficult to
internalize because it does not correspond to ways people naturally think about
numbers. This implies that “children have their own ways of thinking about and doing
mathematics” (Baroody & Coslick, 1998, p.3-6).
Although recent initiatives in curriculum reform aligned with learning theory and
instruction have heightened interest in mental computation, there are reasons why a
variety of studies put an emphasis on instruction of mental computation (e.g., Bobis,
2007; Carroll, 1996; Harnett, 2007; Kilpatric et al., 2001; Linsen et al., 2015; Olsen,
2015; Reys, 1984; Reys et al., 1995; Threlfall, 2002; Yang & Huang, 2014). Mental
computation enhances students’ greater number sense (Bobis, 2007; Carroll, 1996;
Heirdsfield, 2002; Kilpatrick, et al., 2001; Linsen et al., 2015; Liu et al., 2015; Reys et
al., 1995; Threlfall 2002). According to Carroll (1996), mental computation is one
essential part of an interconnected web of number sense. Number sense plays an
important role in the mathematics learning process in developing students’ proficiency in
computation. Generally, students who are good at mental computation have a well-
developed number sense (e.g., Bobis, 2007; Carroll, 1996; Heirdsfield, 2002; Reys,
1984). Number sense refers to the understanding of flexible numerical computation that
involves quantities in everyday reasoning, estimating numerical values in computation,
and judging and making inferences about quantities with numerical values (Greeno,

31
1991). In other words, it is a person’s understanding of numbers and operations. A
person can demonstrate his or her number sense in many different ways. According to
Kilpatrick et al. (2001), mental computation can lead students to have deeper insights
into number systems in ways that promote making sense of the mathematics and reveal
insight into the properties of numbers and operations. However, students who are highly
skilled in written computation do not necessarily develop their number sense (Linsen et
al., 2015). It also promotes the understanding of number and operation (Bobis, 2007;
Olsen, 2015; Yang & Huang, 2014), encourages students to be efficient with the
numbers (Baroody & Coslick, 1998; Olsen, 2015; Parrish, 2011; Threlfall, 2002), helps
strengthen students’ understanding of place value (Baroody & Coslick, 1998; Carroll,
1996; Olsen, 2015; Parrish, 2011), provides opportunities to engage in mathematical
thinking and development (McIntosh et al., 1995, Reys, 1984; Reys et al., 1995;
Threlfall, 2002), develops problem solving skills (Baroody & Coslick, 1998; Carroll,
1996; Chesney, 2013; McIntosh et al., 1995; Reys, 1984; Threlfall, 2002), and
computational estimation skills (Baroody & Coslick, 1998; Carroll, 1996; McIntosh et al.,
1995; McIntosh, Reys, 1984). With respect to computational estimation, Reys (1984)
distinguished it into four characteristics: first, “it is performed mentally, generally without
paper and pencil;” second, “it is done quickly;” third, “it produces answers that are not
exact but are adequate for making necessary decisions;” finally, “it often reflects
individual approaches and produces various estimates as answers” (p. 551). Also, Reys
(1984) points out that estimation is a necessity of mental computation in that “It is
possible to be simultaneously competent at mental computation and very poor at
estimation. However, the converse is not true; that is, people who are good at
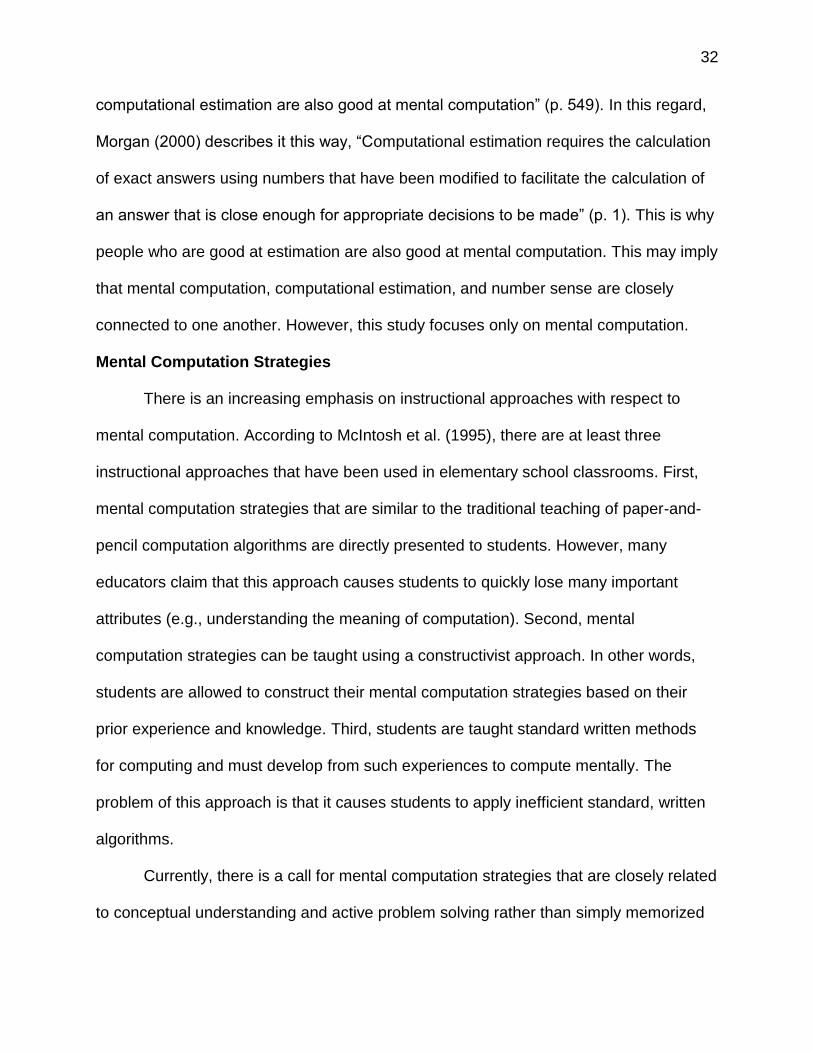
32
computational estimation are also good at mental computation” (p. 549). In this regard,
Morgan (2000) describes it this way, “Computational estimation requires the calculation
of exact answers using numbers that have been modified to facilitate the calculation of
an answer that is close enough for appropriate decisions to be made” (p. 1). This is why
people who are good at estimation are also good at mental computation. This may imply
that mental computation, computational estimation, and number sense are closely
connected to one another. However, this study focuses only on mental computation.
Mental Computation Strategies
There is an increasing emphasis on instructional approaches with respect to
mental computation. According to McIntosh et al. (1995), there are at least three
instructional approaches that have been used in elementary school classrooms. First,
mental computation strategies that are similar to the traditional teaching of paper-and-
pencil computation algorithms are directly presented to students. However, many
educators claim that this approach causes students to quickly lose many important
attributes (e.g., understanding the meaning of computation). Second, mental
computation strategies can be taught using a constructivist approach. In other words,
students are allowed to construct their mental computation strategies based on their
prior experience and knowledge. Third, students are taught standard written methods
for computing and must develop from such experiences to compute mentally. The
problem of this approach is that it causes students to apply inefficient standard, written
algorithms.
Currently, there is a call for mental computation strategies that are closely related
to conceptual understanding and active problem solving rather than simply memorized

33
rules or standard procedures. There are two growing different approaches to instruction:
Direct Teaching and Developing Students’ Own Strategies (e.g., Hartnett, 2007;
Murphy, 2004; Swan & Sparrow, 2001; Varao & Farran, 2007). Even though the direct
teaching instruction originally came from a behavioristic approach, several researchers
agree that the direct teaching should be involved in students’ conceptual understanding
along with their procedural skills (Reys et al. 1995; McIntosh et al., 1995). Without
conceptual understanding of students’ mathematical knowledge, there is not much
difference between written algorithms and mental computation strategies with respect to
long term memory. Accordingly, Swan and Sparrow (2001) stressed that directly
teaching a mental computation strategy is easier to apply because teachers can focus
on a single line of reasoning rather than cope with a variety of strategies. According to
Murphy (2004), mental strategies using direct teaching instruction can be created by
categorizing and analyzing deductive mental calculation strategies “where known
calculation facts are used to derive new ones” (p. 4). For example, the compensation
method (e.g., 12 + 9 = 12 + 10 – 1 = 21) can be used as one example of a deductive
mental calculation strategy.
However, when teachers teach various strategies, they should not always expect
to be able to categorize strategies under specific headings. Teaching should be focused
on student explanations of how they use the strategies (Threlfall, 2002). In doing so,
students are able to develop a wide range of mental strategies by selecting an
appropriate strategy for each problem. In line with this, Threlfall (2002) argued that
meaningful and conceptually based strategies are more likely to impact students’

34
understanding of mental computation. Thus, teachers should guide students to help
them choose the best strategy that fits their individual needs for each problem.
Next, some examples of Direct Teaching studies are provided. Many studies
(e.g., Blöte et al., 2000; Hartnett, 2007; Reys et al., 1995; Varol & Farran, 2007)
examined strategies for two digit mental addition and subtraction. These strategies are
N10, N10C, 10s, 1010, A10, counting, short jump, and using the mental image of pen
and paper algorithm (See Table 1). In line with this, Blöte et al. (2000) conducted a
study with Dutch second grade students in order to determine which mental strategies
students preferred to use while solving addition and subtraction problems. In this study,
they categorized three main strategies: 1010, N10, and ‘short jump’ procedures: 1) A
1010 is a strategy, where the numbers are decomposed in tens and ones which are
processed separately and then the tens put back together. The 10s (1010 stepwise) is a
1010 procedure that conceptually can be located between the 1010 and the N10
procedure, 2) A N10 (‘N10C’ is a variant of N10) starts with counting by tens up or down
from the first, unsplit number, 3) the “short jump’ is a strategy that refers to bridging the
difference in subtraction problems in one or two steps instead of subtracting the second
number from the first one (see Table 1).
Participants were introduced to the mental strategies, N10 and 1010, separately.
Studies (Blöte et al., 2000; Varol & Farran, 2007) showed that the 1010 strategy was
the dominant procedure used by second graders in both addition and subtraction
problems in the United States, mainly because the primary school teaches this strategy
that decomposes numbers into tens and ones. On the other hand, the N10 strategy is
favored in European countries because this is the strategy that minimizes the

35
percentage of errors students make. Interestingly, the mental image of the pen and
paper algorithm is used by inflexible students, which is also considered an inefficient
strategy (Varol & Farran, 2007).
Table 1
Mental Computation Strategies for Two Digit by Two Digit Addition and Subtraction
Strategies Addition Examples 45+27 Subtraction Examples 65-39
N10 45+20= 65; 65+7= 72 65-30=35; 35–9=26
N10C 45+30=75; 75-3=72 65-40=25; 25+1=26
10s 40+20=60; 60+5=65; 65+7=72 60-30=30; 30+5=35; 35-9=26
1010 40+20=60; 5+7=12; 60+12=72 60-30=30; 5-9 = -4, 30+ (-4)=26
A10 45+5=50; 50+22=72 65-5=60; 60-34=26
Counting Counting backward from 65 to 39
Short jump *39 ∩ 50 ∩ 65 = 11 + 15 = 26
Mental image of paper/pencil
algorithm
Using pencil and paper
algorithm mentally
Note. ∩: the difference between numbers
Heirdsfield and Cooper (2004) carried out a case study with seven third grade
students to measure students’ understanding of mental addition and subtraction, and
understanding of number sense and other cognitive, metacognitive, and affective
factors regarding mental computation. They identified and summarized various mental
strategies for addition and subtraction in terms of two types of efficiency, “aggregation”
and “wholistic [sic]” (see Table 2), and determined which strategies were the most
sophisticated. Among various strategies, Reys et al. (1995) emphasized that the mental
image of pencil and paper algorithm can be considered an inefficient strategy.
Compared with a variety of mental computation strategies for addition and subtraction,
fewer studies have examined mental computation strategies for multiplication and division using
a direct teaching instruction. An array model in the teaching of multiplication is the most
appealing strategy for multiplication algorithms (Bobis, 2007; Day & Hurrell, 2015).
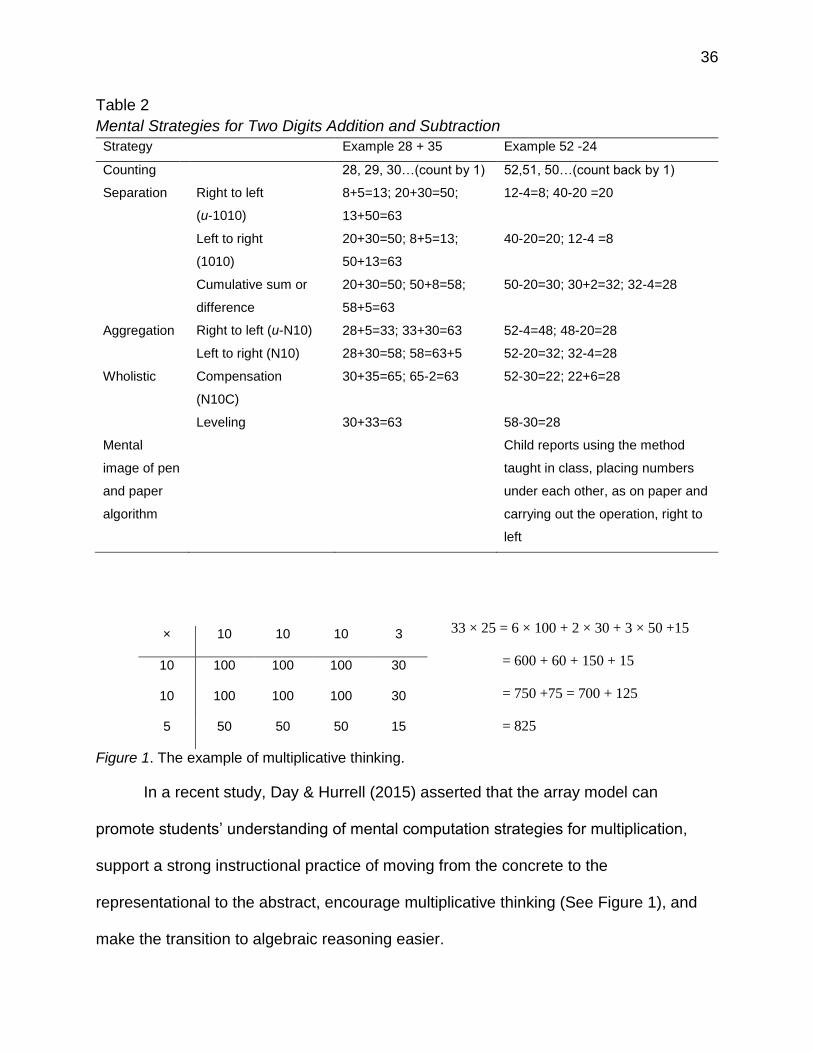
36
Table 2
Mental Strategies for Two Digits Addition and Subtraction
Strategy Example 28 + 35 Example 52 -24
Counting 28, 29, 30…(count by 1) 52,51, 50…(count back by 1)
Separation Right to left
(u-1010)
8+5=13; 20+30=50;
13+50=63
12-4=8; 40-20 =20
Left to right
(1010)
20+30=50; 8+5=13;
50+13=63
40-20=20; 12-4 =8
Cumulative sum or
difference
20+30=50; 50+8=58;
58+5=63
50-20=30; 30+2=32; 32-4=28
Aggregation Right to left (u-N10) 28+5=33; 33+30=63 52-4=48; 48-20=28
Left to right (N10) 28+30=58; 58=63+5 52-20=32; 32-4=28
Wholistic Compensation
(N10C)
30+35=65; 65-2=63 52-30=22; 22+6=28
Leveling 30+33=63 58-30=28
Mental
image of pen
and paper
algorithm
Child reports using the method
taught in class, placing numbers
under each other, as on paper and
carrying out the operation, right to
left
× 10 10 10 3
10 100 100 100 30
10 100 100 100 30
5 50 50 50 15
Figure 1. The example of multiplicative thinking.
In a recent study, Day & Hurrell (2015) asserted that the array model can
promote students’ understanding of mental computation strategies for multiplication,
support a strong instructional practice of moving from the concrete to the
representational to the abstract, encourage multiplicative thinking (See Figure 1), and
make the transition to algebraic reasoning easier.
33 × 25 = 6 × 100 + 2 × 30 + 3 × 50 +15
= 600 + 60 + 150 + 15
= 750 +75 = 700 + 125
= 825

37
As a mental and written computation strategy, the identification and naming of
factors and multiples and commutativity (e.g., regardless of the order in which you use
the numbers, the result will be the same) play a crucial part for mathematical
understanding of multiplication. To examine this, one-by-one digit (e.g., 2 × 3), and two-
by- one digit multiplication (e.g., 3 × 13) (see Figure 2), and two-by-two digit
multiplication (e.g., 12 × 11) array models (See Figure 3) are used to represent various
one or two digit multiplication problems.
Figure 2. One-by one and two-by one digit array model multiplication.
Figure 2 clearly represents commutative (e.g., 2 × 3 = 3 × 2) and distributive
(e.g., 13 × 3 = 10 × 3 + 3 × 3) properties of multiplication. The commutative property
says that “the numbers to be added or multiplied may reverse roles, a + b = b + a or a ×
b = b × a” and the distributive property says that “the multiple of a sum is the same as
the sum of the multiples, (a + b) c = ac + bc” (Petitto & Ginsburg, 1982, p. 82).
Figure 3 and Figure 4 support that the array model scaffolds the mental
computation strategies involving partitioning and provides a convenient representation
of the distributive property of multiplication (Bobis, 2006; Days & Hurrell, 2015), which is
a key component of mathematical understanding. Days and Hurrell (2015) emphasized
that the use of a non-standard algorithm enables students to understand not only the
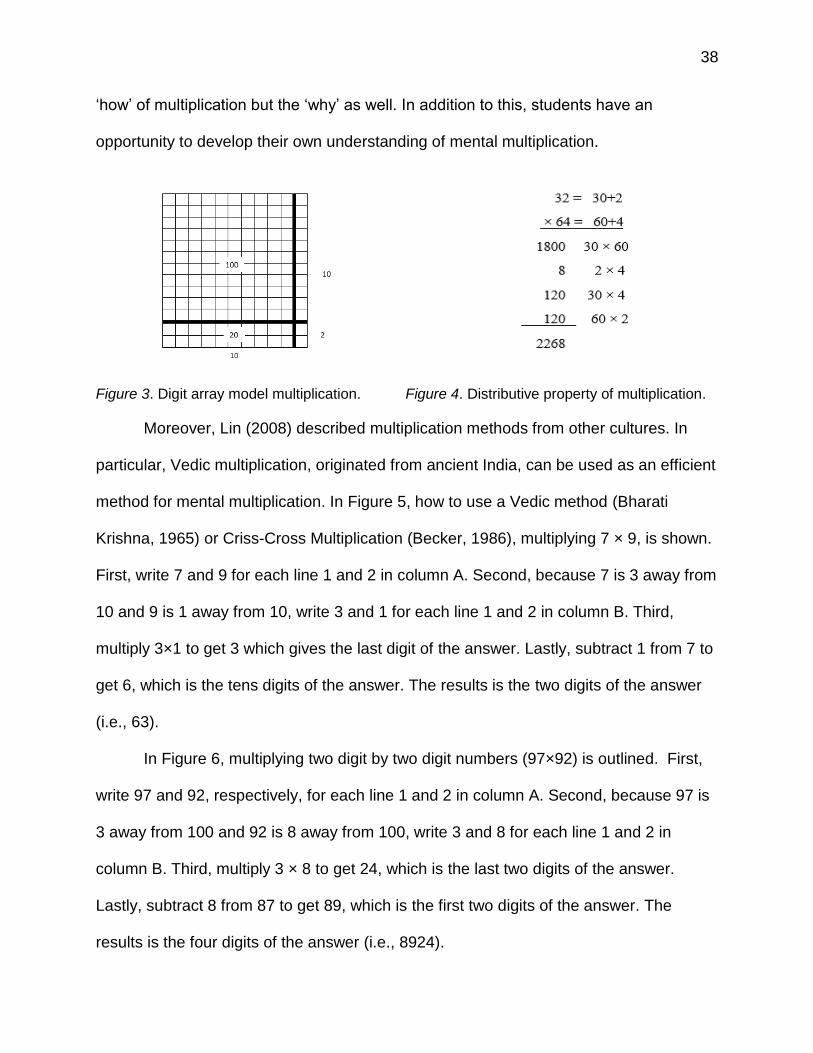
38
‘how’ of multiplication but the ‘why’ as well. In addition to this, students have an
opportunity to develop their own understanding of mental multiplication.
Figure 3. Digit array model multiplication. Figure 4. Distributive property of multiplication.
Moreover, Lin (2008) described multiplication methods from other cultures. In
particular, Vedic multiplication, originated from ancient India, can be used as an efficient
method for mental multiplication. In Figure 5, how to use a Vedic method (Bharati
Krishna, 1965) or Criss-Cross Multiplication (Becker, 1986), multiplying 7 × 9, is shown.
First, write 7 and 9 for each line 1 and 2 in column A. Second, because 7 is 3 away from
10 and 9 is 1 away from 10, write 3 and 1 for each line 1 and 2 in column B. Third,
multiply 3×1 to get 3 which gives the last digit of the answer. Lastly, subtract 1 from 7 to
get 6, which is the tens digits of the answer. The results is the two digits of the answer
(i.e., 63).
In Figure 6, multiplying two digit by two digit numbers (97×92) is outlined. First,
write 97 and 92, respectively, for each line 1 and 2 in column A. Second, because 97 is
3 away from 100 and 92 is 8 away from 100, write 3 and 8 for each line 1 and 2 in
column B. Third, multiply 3 × 8 to get 24, which is the last two digits of the answer.
Lastly, subtract 8 from 87 to get 89, which is the first two digits of the answer. The
results is the four digits of the answer (i.e., 8924).

39
Column A Column B Column A Column B
Line1 7 3 Line1 97 3
Line 2 9 1 Line 2 92 8
Line 3 7-1=6 3×1=3 Line 3 97-8=89 3×8=24
Answer: 7 × 9 = 63 Answer: 97 × 92 = 8924
Figure 5. The table of multiplying 7 × 9. Figure 6. The table of multiplying 97 × 92.
In Figure 7, multiplying two-digit by two-digit numbers (22 ×31) using the Vedic
method of vertical and crosswise multiplication is outlined. First, multiply ones digit
place numbers vertically to get the ones digit of the answer (i.e., 2). Second, multiply
crosswise and add the products to get the tens digit of the answer. Finally, multiply tens
digits numbers vertically to get the hundreds digit of the answer (i.e., 682).
2 2
× 3 1
6 8 2
Figure 7. The Vedic method of vertical multiplication.
Therefore, from the literature reviewed, mathematics educators acknowledge that
although direct teaching instruction comes from a behaviorist view, they can foster
students’ understanding with explicit teaching procedures using various mathematics
properties such as associative, distributive, and commutative (e.g., Bobis, 2006; Days &
Hurrell, 2015; Petitto & Ginsburg, 1982) for mental multiplication strategies. In this
regard, the associative property says that “the sequence in which additions and
multiplications are carried out is irrelevant, (a + b) + c = a + (b + c)” (Petitto & Ginsburg,
1982, p. 82).
● ● ● ● ● ●
● ● ● ● ● ●
2× 3 = 6 2 × 1 + 2× 3 = 8 2 × 1=2
2 × 1 = 2
2 ×3 = 6
40
As for the mental computation strategies for division, many British students
successfully solve division problems by using a counting-up mental strategy and
chunking strategy. According to Anghileri and Beishuizen (1998), the counting up
strategy reflects fifth-grade students’ important understanding of various arithmetic
problems and even adults frequently use the backward counting strategy when they
want to check results in a secure way. For instance, when students solve the division
problem 96 ÷ 4, they use tally marks partitioned into 4s or repeated addition of 4s to
reach a total of 24. In Beishuizen and Anghileri’s (1998) study, they found that students’
mental solution trials reflect counting strategies as well. In terms of the chunking
strategy, Anghileri and Beishuizen (1998) defined chunking as “the process of
partitioning numbers to convenient parts” (p. 3). When given a division problem like 96 ÷
4, most students divided this problem using mental chucking process like 40 + 40 + 16
or 80 + 16 that is divisible by 4 and got the answer 10 +10 + 4 or 20 + 4 = 24. For a
different divisor like 96 ÷ 6, students were able to divide 96 as 60 + 36 and got the
answer 10 + 6 = 16. When students solved more complicated division problems like 68
÷ 17 and 76 ÷ 19, they used mental counting-up strategies using doubling such as 17 +
17 = 34, 34 + 17 = 51, etc. (Beishuizen & Anghileri, 1998). In addition, according to Van
Putten, Van den Brom-Snijders, & Beishuizen, (2005), when students solve long
division problems, the strategy of doubling (the divisor) or halving (the dividend) could
be used as an efficient strategy because students can easily identify the numerical
relationship between the divisor and dividend (e.g., 24 ÷ 4 = 12 ÷ 2 = 6, 24 ÷ 8 = 12 ÷ 4
= 3).

41
Teaching long division problems can also be done with a mental division strategy
for whole numbers (e.g., Anghileri & Beishuizen, 1998; Beishuizen & Anghileri, 1998;
Van Putten, et al. 2005). Anghileri and Beishuizen (1998) stressed that the written
algorithms used in Britain and in the Netherlands could be reconciled with mental
strategies if a long division approach (See Figure 8) was adopted. In this way, they
demonstrated how mental and written methods can be related and combined
(Beishuizen & Anghileri, 1998). In particular, Beishuizen and Anghileri (1998) stressed
that smaller number problems can be solved mentally but for larger numbers written
procedures are more efficient.
4 96 or 4 96
Figure 8. The examples of long division approaches.
The second approach Developing Students’ Own Strategies comes from a
constructivist view (e.g., Becker & Epstein, 2007; Becker & Shimada, 1997; Blöte et al.,
2000; Bobis, 2007; Day & Hurrell, 2015; Hashimoto & Becker, 1999; Hartnett, 2007;
Linsen et al., 2015; Murphy, 2004; Olsen, 2015; Parrish, 2011; Reys et al., 1995; Yang
& Huang, 2014). This approach asserts that mental computations can be seen as
higher-order thinking, where instruction must be learner-centered so that students can
come up with a variety of creative mental computation strategies on their own (e.g.,
40 × 10
56
40 × 10
16
16 × 4
0 24
80 × 20
16
16 × 4
0 24

42
Becker & Epstein, 2007; Becker & Shimada, 1997; Hashimoto & Becker, 1999; Reys et
al., 1995). Teachers can create this environment by encouraging students to solve
problems in a variety of ways (Becker & Epstein, 2007; Becker & Shimada, 1997;
Hashimoto & Becker, 1999; Blöte et al., 2000) and to develop and implement more
efficient strategies that reflect understanding through classroom discussions (Becker &
Epstein, 2007; Becker & Shimada, 1997; Hashimoto & Becker, 1999; Hartnett, 2007;
Heirdsfield & Cooper, 2004; NCTM, 2000; Swan & Sparrow, 2001; Yang & Huang,
2014). According to the Principles and Standards for School Mathematics (NCTM
2000), students can share their problem-solving methods through discussions in their
mathematics classrooms.
In line with this, Varol and Farran (2007) stressed the importance of conceptual
understanding that is more likely to develop students’ deeper understanding of mental
computation strategies. Accordingly, Swan & Sparrow (2001) asserted that students
should explore and discuss various strategies on their own and adopt the strategies that
are suited to their needs and develop a constructivist approach of mental strategies
through discussion. For instance, one of the activities the researchers used in the
classroom is “That’s Easy?” To do this activity, a question (e.g., 3 × 2 × 7 × 5 × 5 × 2)
that looks difficult but really is easy to do mentally is presented and the students are
encouraged to discuss a variety of strategies to find the answer. The question looks
hard for students because there are so many numbers included, but it is really easy.
Students were encouraged to use the commutative property (when you multiply the
order does not matter) so the question could be changed to look like this: 2 × 5 × 2 × 5
× 3 × 7. Students easily got an answer 10 × 10 × 21 or 2100. Clearly, the most

43
important aspect of any activity designed to improve constructivist approaches of mental
strategies is discussion.
However, Hierdsfield (2003) pointed out that “whether students should be
encouraged to develop their own mental strategies or be taught specific strategies is not
clear” (p. 421) because it is not clearly found whether calculating mental computation
strategies are connected to the numbers involved or calculating with understanding.
Therefore, studies (Blöte et al., 2000, Heirdsfield, 2003, Hierdsfield & Cooper, 2004) put
an emphasis on students’ mental computation flexibility and the ways they explore,
discuss, and justify their strategies and solutions. Students’ mental computation
flexibility will be discussed in more detail below.
Consequently, the findings of the present study will provide valuable information
to the research that is related to preservice teachers’ strategies used in mental
computation. In addition, this will enable math educators to find the best instruction in
relation to not only whole numbers but also the other areas of mathematics content
(e.g., integers and rational numbers including decimals, percentages, and fractions).
Most importantly, this study will assist teachers to foster mental computation knowledge
so that they can enhance their own confidence and teaching skills.
Flexibility in Mental Computation
Flexible mental calculation is a highly desired aspect of mental computation. Heirdsfield
(2002) asserted that “the purpose of the inclusion of mental computation in any
mathematics curriculum would be to develop flexible computational strategies” (p.89). It
can be achieved by teaching students a set of different strategies and how to choose
the best method for the problem (Threlfall, 2002). Students who benefit from a

44
constructivist view need to have an ability to use various mental computation strategies
in different situations. Studies have compared the characteristics of flexible and
inflexible learners (e.g., Blöte et al., 2000; Heirdsfield & Cooper, 2004; Threlfall, 2002).
According to Heirdsfield and Cooper (2004), students’ selection of the most efficient
strategy is dependent on the following factors: “a broad numeration understanding
(canonical, noncanonical, multiplicative, and proximity of number), number facts
(particularly number facts strategies), metacognition (beliefs and strategies),
understanding the effect of operation on numbers, and strong beliefs about their own
strategies” (p. 458). Numeration understanding included students’ ability to use
canonical form (e.g., 34 is not only 3 tens and 4 ones), the noncanonical form (e.g., 34
is 2 tens and 14 ones), the multiplicative form (e.g., 100 is 10 tens, 10 is 10 ones), and
proximity of number (99 is close to 100). Also, Heirdsfield and Cooper (2004) examined
the characteristics of flexible and inflexible learners and found that students who are
flexible in mental computation employ efficient number fact strategies, exhibit number
and operation understanding, employ high-level strategies (e.g., wholistic
compensation, e.g., 123 +99 = 123 + 100 – 1); and are confident in the use of their own
self-developed strategies. Metacognitive strategies have been applied when students
are checking their answers at the final stage. Thus, flexible students show no difficulty
choosing efficient mental strategies.
On the other hand, the inflexible students who do not have efficient number fact
knowledge employ an automatic strategy such as mental image of pencil and paper
45
algorithms, exhibit a lack of numeration understanding, and are confident in the teacher-
taught algorithms. Heirdsfield and Cooper (2004) stressed that to be able to manipulate
numbers mentally, students should have a numeration understanding, which is an
understanding of partitioning of numbers.
In addition, Heirdsfield and Cooper (2004) presented the mental computation
process of accurate but inflexible students. They presented the lack of important factors
of constructing flexible strategies– beliefs in self-developed strategies, metacognitive
strategies (e.g., checking), and various understandings. In other words, students who
apply an automatic strategy tend to exhibit limited knowledge. They fail to select an
efficient strategy and they do not check their solutions.
Furthermore, several studies (e.g., Blöte et al., 2000; Bobis, 2007; Day & Hurrell,
2015; Heirdsfield, 2002, 2003; Heirdsfield & Cooper, 2004; Threlfall, 2002) examined
how flexibility can be achieved as students solve problems mentally. Blöte et al. (2000)
assess the strategic flexibility of second-grade Dutch students in mental computation up
to the number 100 and stressed that in order to improve flexible problem solving
strategies, it is important to use a realistic context that builds on students’ informal
strategies by presenting problems in a context. Through a real-world context, students
build their own knowledge and operate with numbers in a flexible way if they have a
clear understanding of characteristics of the problems. For instance, a flexible learner
can easily identify that the best way to solve a problem like “72-19” is to use the N10C
strategy (e.g., first subtract 20 then add 1) strategy and “54-18” is to use the N10
strategy (e.g., 54 – 10 = 44; 44 – 8 = 36). Thus, a flexible learner who is able to choose
their strategy based on the characteristics of the problems can also exhibit a good

46
conceptual understanding of numbers and strategies (Blöte et al., 2000, Heirdsfield,
2002, 2003). Accordingly, in order to be a flexible learner, Heirdsfiled & Cooper (2004)
encouraged students to develop their own efficient mental computation strategies by
promoting students’ own thinking. To do this, teachers should encourage students to
make more use of number facts, rules, and connections. Most importantly, verbalizing
and discussing alternative mental computations along with recording the procedural
steps of number operations can help students construct their own strategies in a flexible
and efficient way. In addition, in order to readily assess the range and depth of students’
mental computation strategies, teachers should assess students’ mental computation
strategies on a regular basis to identify their ability; specifically, their flexibility and
accuracy allow students to write a detailed explanation of the procedures and strategies
students used to solve each problem (Rogers, 2009).
Therefore, this study will help mathematics educators in both preservice
teachers’ education and inservice teachers’ professional developmental programs,
concerning how flexibility can be developed, what classroom instruction helps develop
students’ flexibility regarding mental computation, what mental computation strategies
work best for flexible and inflexible learners, and how preservice and inservice teachers’
attitudes towards mental computation strategies can be changed.
In light of the above, several weaknesses in relation to mental computation
knowledge are shown in the literature reviewed. First, very few studies have been
conducted regarding mental multiplication (Bobis, 2007; Linsen et al., 2015; Parrish
2011), compared with a variety of studies in relation to addition and subtraction (Blöte et
al., 2000; Hartnett, 2007; Heirdsfield & Cooper; 2004; Liu, et al., 2015; Murphy, 2004;

47
Reys et al., 1995; Threlfall, 2002; Yang & Huang). One study included rational number
fractions (Lui & Bonner, 2016) and the other (Reys et al., 1995) included number and
operations - numbers, whole numbers, fractions, and decimal computation with percent
problems all together - but no detailed corresponding mental computation strategies
were found. No studies regarding other content areas such as fractions, percentages,
decimals, etc. were studied. Second, there was different terminology of mental
computation with same meaning such as a mental arithmetic (Kilpatrick et al., 2001;
Swan & Sparrow; 2001) or mental algorithms (Reys et al., 1995), while written
computation (Reys et al., 1995; Yang & Hwang, 2014) is used as standard algorithm
(Bobis, 2007) or algorithm computation (Linsen et al., 2015). This may cause confusion
among both teachers and students towards mathematics teaching and learning; so an
agreement for clear terminology for mental computation should be determined. Third, no
research regarding higher-level grades was found. Except for the studies about
attitudes, the majority of studies reviewed involved the elementary grade levels. Only
one study (Reys et al., 1995) included eighth-grade students and the other one (Lui &
Bonner, 2016) included college students. No studies for preservice teachers’ mental
computation ability were found. Fourth, the instruments used in some empirical studies
(Blöte et al., 2000; Hartnett, 2007; Heirdsfiled & Cooper, 2004; White et al.,2006) have
not provided detailed descriptions of instrument validity and reliability. Fifth, most
importantly, all of the studies reviewed so far suffer from the fact that no suggestions for
teaching how to make good strategy choices in mental calculation, and no empirical
studies comparing the effect of teaching approaches between the direct teaching and
48
the open-ended approach to develop preservice teachers’ own strategies were
provided.
Conclusion
Although preservice and inservice teachers may hold constructivist orientations
for mathematics teaching and learning, they may also hold traditional beliefs about what
mathematics is. Although teachers may acknowledge that conceptual mathematical
knowledge plays a major role in students’ mathematics learning, they may focus more
on the development of procedure for mental computation strategies without providing
any activities that foster students’ understanding. This is because their teaching
strategies must be heavily influenced by their previous mathematics learning
experiences (Bekdemir, 2010; Beswick, 2006; Hartnett, 2007). In particular, Hartnett
(2007) stresses that although many teachers in classrooms today acknowledge that
mental computation strategies have benefits for student mathematics learning, their lack
of knowledge, confidence, and teaching ideas lead them to hesitate to take the idea
forward into their practice. Based on the reviewed literature, many researchers have
already constructed their own mental computation strategies that foster both students’
conceptual and procedural knowledge in their mathematics classroom. Some teachers
may choose to apply a direct teaching instruction and others may apply developing
students’ own strategies instruction in order to accommodate their students’ individual
needs. It is also imperative for both pre-and in-service teachers to have positive
attitudes, strong content knowledge of mathematics, and mathematics teaching and
learning to foster students’ proficiency.

49
Therefore, this study seeks to measure preservice teachers’ attitudes towards
mathematics content knowledge, which is mental computation. Preservice teachers’
positive attitudes and open minds that accept their students’ different strategies may
lead the students to be a successful critical thinkers in the future. Also, this study seeks
to find an effective mental computation strategy using two different teaching instructions
in order to meet different students’ needs (e.g., Direct Teaching and Open Approach).
Then, mathematics educators in both preservice teachers’ education and teachers’
professional developmental programs would apply what approach works best for
students’ flexibility and conceptual understanding of solving whole numbers including
addition, subtraction, multiplication, and division, integers, and rational numbers
including decimals, fractions, and percents.

50
CHAPTER 3
METHODOLOGY
A mixed methods design (Creswell, 2009) is an appropriate approach for this
study. Creswell (2009) pointed out that mixed methods research “utilizes the strengths
of both qualitative and quantitative research” and “provides an expanded understanding
of research problems” (p. 203). Indeed, this study involves both quantitative and
qualitative research approaches. It measures preservice teachers’ (PTS) attitudes
towards mathematics and mental computation ability using a survey (See Appendix C),
assesses their mental computation performances using pre-and post-MCT (See
Appendix E) and interviews to provide a better understanding of mental computations.
This is consistent with Creswell’s (2009) concurrent mixed methods design in that “the
researcher converges or merges quantitative and qualitative data in order to provide a
comprehensive analysis of the research problem” (p. 14). As a result, a mixed methods
design provides more evidence in studying the research problems than using either
quantitative or qualitative research alone.
In this study, five research questions are posed to examine PTS’ attitudes
towards mathematics and use of different mental computation strategies with respect to
operations on whole numbers, integers, and rational numbers including decimals,
fractions, and percentages in problem-solving with two different teaching approaches.
1. To what extent do PTS’ believe that mathematics attitudes, mental and written
computation, and anxiety changes regarding mental computation are
important?

51
2. Is there a significant correlation between PTS’ mental computation
performance and their attitudes towards mathematics, written and mental
computations, and mental computation anxiety?
3. Are there significant differences in mental computation performance between
the experimental groups (i.e., DT and OA) and the control group before and
after instruction?
4. What are the differences in the use of mental computation strategies between
the experimental groups? For each group and among individuals, what mental
computation strategies work best for solving addition, subtraction,
multiplication, division, integer, fraction, decimal, and percentage problems?
5. How does the use of PTS’ mental computation strategies affect students’
flexibility regarding mental computation?
Participants
The target population in this study is all PTS in the USA. PTS are chosen as my
participants because there are no studies reviewed of PTS’ mental computation
performance. Most studies found for my literature review were conducted in regard to
PTS’ attitudes towards mathematics (Bekdemir, 2010; Beswick, 2006; Cornell, 1999;
Jong & Hodges, 2015; Swars et al., 2006; White et al., 2006).
The accessible population is students enrolled in a teacher education program
for PTS preparing to teach grades K-8 at a mid-sized, four-year, state university in the
mid-western part of the United States. A list of individual members of the entire
accessible population was obtained through the department administration. This
population may be generalizable to my target population because this university
52
represents diverse and mixed socioeconomic groups for the population. Thus, the
results were useful for any similar universities that service all socioeconomic levels. This
study provided useful information to both pre-and in-service education programs and
inservice teachers’ professional development.
The sample size was about 50 PTS before intervention and 40 after the
intervention. Three classes were used for this study: two classes in a mathematics class
(Course A) for experimental groups and one class for the control group. One class from
Education courses was selected. The students of the control group were selected
based on the following criterion: 1) students should be PTS in the teacher education
programs, 2) students who had taken any higher mathematics courses in university
level and Course A before should be eliminated to make an equivalent level with two
experimental groups. To make sure that the three classes were on the same level, the
pre-Mental Computation Test (MCT) was compared. A one-way ANOVA was conducted
to determine if there was a significant difference in the mean pre-MCT scores between
the experimental groups and the control group. The mean difference in the pre-MCT
scores, therefore, was not significant, F (2, 47) = 1.23, p=.301 among three groups.
The convenient sampling design was used for this study because subjects were
already formed into classrooms and readily available. With a convenient sample,
selection bias was a major issue in this research.
This study was conducted with PTS who were taking a course A during the
spring semester of 2017. Two sections of Course A were selected for the study because
this course was designed to provide PTS with the developments of procedural and
conceptual knowledge in solving mathematics problems and on the pedagogical content

53
knowledge in teaching mathematics for the elementary and middle schools. Moreover,
the pedagogical content knowledge, the development of an understanding of operations
with whole numbers, integers, and rational numbers, can be closely connected to
mental computation. In addition, several studies (Carvalho & da Ponte, 2013; Kilpatrick
et al., 2001; Ma, 1999; Wheeldon, 2008) pointed out that preservice elementary
teachers have difficulty showing content knowledge of rational numbers. In this regard,
according to Ball (1990a), teachers should understand rational numbers to assist not
only students’ procedural knowledge but also their conceptual understanding of
mathematics using various representations.
Table 3
Preservice Teachers’ Demographic Information
Characteristics
Direct Teaching (DT) Open Approach (OA) Control
Pre (N=14)
Post (N=11)
Pre (N=16)
Post (N=15)
Pre (N=20)
Post (N=14)
N % N % N % N % N % N %
Gender Male 1 7.1 1 9.1 2 12.5 2 13.3 7 35 6 42.9
Female 13 92.9 10 90.9 14 87.5 13 86.7 13 65 8 57.1
Status Freshman 9 64.3 7 63.6 7 43.8 6 40.0 8 40 6 42.9
Sophomore 4 28.6 3 27.3 3 18.7 3 20.0 4 20 2 14.3
Junior 1 7.1 1 7.1 6 37.5 6 40.0 4 20 3 21.4
Senior 0 0.0 0 0.0 0 0.0 0 0.0 4 20 3 21.4
Race White 7 50.0 6 54.5 13 81.3 12 80.0 14 70 9 64.3
African American
7 50.0 5 45.5 3 18.7 3 20.0 3 15 2 14.3
Asian 0 0.0 0 0.0 0 0.0 0 0.0 1 5 1 7.1
other 0 0.0 0 0.0 0 0.0 0 0.0 2 10 2 14.3
Major Early Childhood
3 21.4 2 18.2 2 12.5 2 13.3 1 5 1 7.15
Elementary 10 71.5 8 72.7 10 62.5 9 60.0 1 5 1 7.15
Special 1 7.1 1 9.1 4 25.0 4 26.7 1 5 0 0.0
Other 0 0.0 0 0.0 0 0.0 0 0.0 17 85 12 85.7
The demographic information for each group is summarized in Table 3. There
were a different number of students before and after the instruction because several
54
PTS withdrew from the course during the instruction. Regarding the experimental group
1(DT), before instruction, there were 14 students who took both the pre-attitudinal
survey and the pre-MCT and 11 students participated in both the post-attitudinal survey
and the post-MCT.
As for the experimental group 2 (OA), 16 students took both the pre-attitudinal
and the pre-MCT before instruction. After instruction, 15 students took both the post-
attitudinal and post-MCT measures. The majority of the PTS in the experimental group
1 (92.9 % & 90.9 % - before and after instruction) and group 2 (87.5 % & 86.7 %) were
female. About half of the PTS in the experimental group 1 were white (50% & 54.5 %).
The majority of the PTS of the experimental group 2 (81.3 % & 80 %) were white. Most
of the PTS in both groups 1 (71.5 % & 72.7 %) and 2 (62.5% & 60 %) majors in
Elementary Education (ELE). The age range for all participants were from 18 to 22
years for experimental group 1 and 2, except for one student from group 2 (i.e., 27-32).
With respect to the control group, 20 students took both the pre-attitudinal and
pre-MCT measures at the beginning of the instruction. After 8 weeks, 15 students took
only the post-MCT. This is because there was no instruction for the control group so it
was not meaningful for them to take the post-attitudinal survey. As shown in Table 3,
among 20 students, 7 students (35%) were male and 13 students (65 %) were female at
the beginning of the session. After 8 weeks, out of the 14 students, 6 were male and 8
were female students. At the beginning of the semester, there were 8 freshmen (40%),
4 sophomores (20%), 4 juniors (20%), and 4 seniors (20%). After 8 weeks, out of 14,
there were 6 freshman (42.9%), 2 sophomore (14.3%), 3 junior (21.4%), and 3 senior

55
(21.4%) students. In terms of race, 14 out of 20 students (70%) were white before
instruction and after 8 weeks, 9 out of 14 students were white (64.3%).
Data-Gathering Procedures
The study used a concurrent embedded strategy of mixed methods, designed by
Creswell (2009). Creswell (2009) states that “a concurrent embedded approach has a
primary method that guides the project and a secondary database that provides a
supporting role in the procedures” (p. 214). Many studies in the literature reviewed on
mental computation used survey(s) as their instrument when they examine PTS’
attitudes towards mathematics (Berkdemir, 2010; Beswick, 2006; Jong & Hodges, 2015;
Lui & Boner, 2016; White et al., 2006). However, the survey is not appropriate to
measure PTS’ mathematics knowledge. Thus, when measuring mental computation
performance, many studies used a mental computation test as their major instrument
(Blöte et al., 2000; Hartnett, 2007; Linsen et al., 2015; Liu et al., 2015; Reys et al.,
1995). Within the research reviewed, only one well-known study used a mixed methods
approach using survey instruments and interviews (Blöte et al., 2000). In some
empirical studies (Blöte et al., 2000; Hartnett, 2007; Heirdsfiled & Cooper, 2004; White
et al., 2006), the instruments did not provide detailed descriptions of instrument validity
and reliability. Although the majority of the studies from the reviewed literature did not
use a mixed methods approach, a mixed methods design was used to assess a deeper
understanding of mental computation strategies and attitudes towards mathematics.
The data-gathering procedures were based on a concurrent embedded strategy
of mixed methods in which “both quantitative and qualitative data are collected
simultaneously” and “quantitative data addresses the outcomes expected from the

56
treatments while the qualitative data explores the processes experienced by individuals
in the treatment groups” (p. 214). More specifically, Creswell (2009) mentions that:
The mixing of the data from the two methods is often to integrate the information
and compare one data source with the other, typically accomplished in a
discussion section of a study. However, the data may also not be compared but
reside side by side as two different pictures that provide an overall composite
assessment of the problem (Creswell, 2009 p. 214).
Thus, once the data are collected from surveys, pre-and post-tests, and interviews, it
was analyzed separately and the information was integrated and synthesized in the
discussion section. More specifically, Table 4 presents the research design of this
study.
Quantitative sources of data
Two instruments were used to collect quantitative data. First, the Mathematics
Attitude Survey (MAS) (See Appendix C) was administrated. The Likert-type scale
consisted of 81 items under three subscales: attitudes towards mathematics, attitudes
towards mental and written computation, and mental computation anxiety. The first part
includes 38 statements, the second part includes 30 and the last part 13. The degree of
agreements for the Likert-type scale is shown in the 5 point scale: Strongly Disagree
(SD), Disagree (D), Neutral (N), Agree (A), and Strongly Agree (SA).
The first part was intended to measure PTS’ attitudes towards mathematics. The
first part of the survey included 38 statements, clustered by the following 3 categories:
PTS’ positivity towards learning mathematics (8), their experience about mathematics
teachers’ behavior (16), and mathematics teachers’ instruction (14).
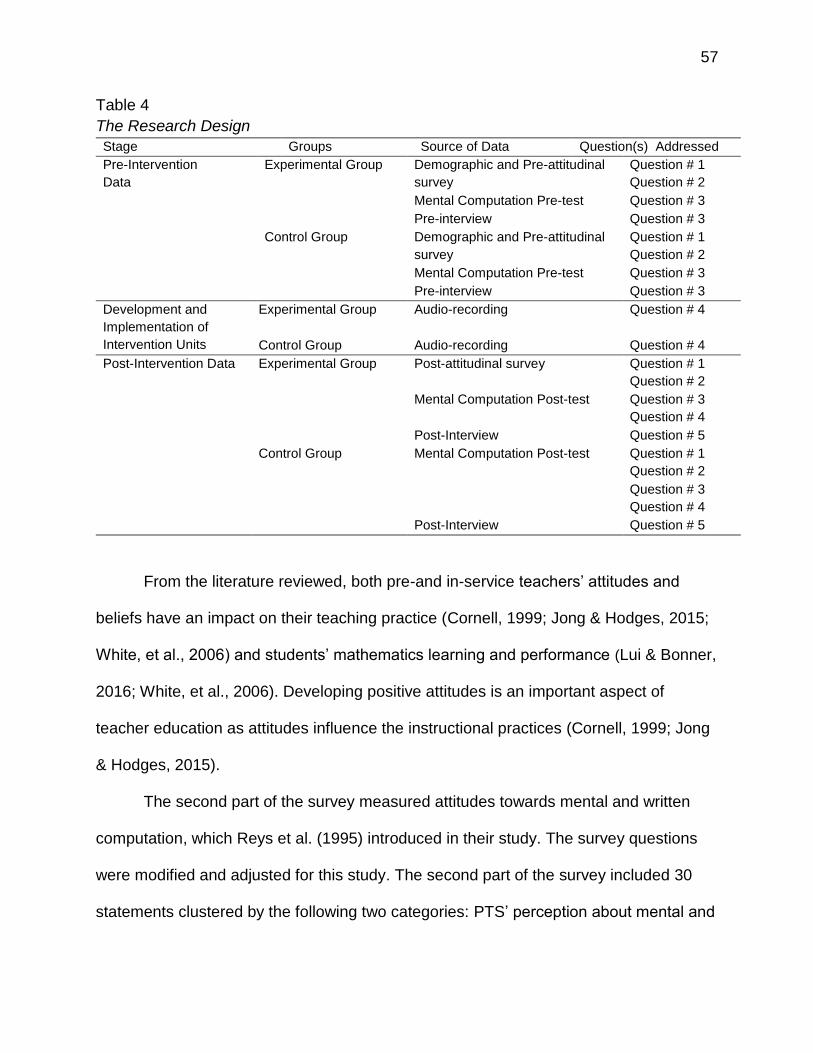
57
Table 4
The Research Design
Stage Groups Source of Data Question(s) Addressed
Pre-Intervention
Data
Experimental Group Demographic and Pre-attitudinal
survey
Question # 1
Question # 2
Mental Computation Pre-test Question # 3
Pre-interview Question # 3
Control Group Demographic and Pre-attitudinal
survey
Question # 1
Question # 2
Mental Computation Pre-test Question # 3
Pre-interview Question # 3
Development and
Implementation of
Intervention Units
Experimental Group Audio-recording Question # 4
Control Group Audio-recording Question # 4
Post-Intervention Data Experimental Group Post-attitudinal survey Question # 1
Question # 2
Mental Computation Post-test Question # 3
Question # 4
Post-Interview Question # 5
Control Group Mental Computation Post-test Question # 1
Question # 2
Question # 3
Question # 4
Post-Interview Question # 5
From the literature reviewed, both pre-and in-service teachers’ attitudes and
beliefs have an impact on their teaching practice (Cornell, 1999; Jong & Hodges, 2015;
White, et al., 2006) and students’ mathematics learning and performance (Lui & Bonner,
2016; White, et al., 2006). Developing positive attitudes is an important aspect of
teacher education as attitudes influence the instructional practices (Cornell, 1999; Jong
& Hodges, 2015).
The second part of the survey measured attitudes towards mental and written
computation, which Reys et al. (1995) introduced in their study. The survey questions
were modified and adjusted for this study. The second part of the survey included 30
statements clustered by the following two categories: PTS’ perception about mental and

58
written computation (16) and PTS’ perception of instruction between written and mental
computation (14). Two types of statements were included in a parallel way – each
statement was accompanied by a parallel statement. For example, the parallel
statements “I feel comfortable and safe when using written computation” and “I feel
comfortable and safe when using mental computation” were included in the second part
of the survey. These pairings allowed the researcher to check the consistency of PTS’
responses on MAS. In the reviewed literature, studies compared the characteristics of
mental computation with written computation (Baroody & Coslick, 1998; Linsen et al.,
2015; Murphy, 2004; Reys et al, 1995). More specifically, Reys et al. (1995) pointed out
that written computation is difficult to internalize because it does not correspond to ways
people naturally think about numbers. This implies that “children have their own ways of
thinking about and doing mathematics” (Baroody & Coslick, 1998, p.3-6). In line with
this, several studies emphasized that instruction of mental computation strategies
should be introduced before the written computation is taught (Baroody & Coslick, 1998;
Mardjetko & Macpherson, 2007; Yang & Huang, 2014). Thus, the results of the second
part of the survey determined how many PTS put emphasis on either mental or written
computation.
The last part of the survey included 13 statements that measure feelings of
anxiety when computing mental mathematics problems. Researchers (Bekdemir, 2010;
Swan & Sparrow, 2001; Swars et al., 2006; Vinson, 2001) have studied anxiety levels
about mathematics and mathematics learning and teaching. However, more specifically,
research on the PTS’ anxiety about mental computations, compared with written
computations, was limited. Therefore, the results of the last part of the survey examined
59
the changes in levels of mental computation anxiety caused by two different
instructional approaches.
The MAS was reviewed by three mathematics educators and pilot tested. After
reviewing the MAS, the necessary items for each operation were modified, deleted or
added. The survey (See Appendix C) was used for the pre-and post-test with both the
experimental and control groups. Using the pre-MAS (N=50), Cronbach’s alpha test was
calculated to check the internal consistency reliability. The MAS was found to be highly
reliable (81 items; α= 0.90). The three subcategories of MAS were as follows: attitudes
towards mathematics (38 items; α= 0.93), attitudes towards mental and written
computation (30 items; α= 0.83), and mental computation anxiety (13 items; α= 0.87).
Administration time for the survey was approximately 15 minutes.
Second, the Mental Computation Test (MCT) (See Appendix E) was constructed
for this study. In order to investigate PTS’ mental computation knowledge of whole
numbers, integers, and rational numbers, the pre-and post-MCT were examined for
content validity by three different mathematics experts in the field of testing. It was used
for both the experimental and control groups. The test was designed to determine if
there were significant changes in PTS’ mental computation knowledge. The MCT
included 69 items of mental computation problems in relation to whole numbers,
integers, and rational numbers (fractions, decimals, and percentages).
In order to provide an accurate assessment of mental computation, the following
steps were taken. First, the MCT included only straight forward computational items (no
word problems involved). In this regard, prior studies had documented that the
instruments used in some empirical studies (Blöte et al., 2000; Hartnett, 2007;
60
Heirdsfiled & Cooper, 2004; White et al.,2006) did not provide detailed descriptions of
instrument validity and reliability. The decision on the appropriateness of MCT items for
PTS was assessed by three mathematics educators. The reliability for the MCT items
was calculated using Cronbach’s alpha coefficient (α = 0.96) using PTS’ pretests.
Second, all items on the MCT were given one at a time with PowerPoint, and the time
allowed for each item was controlled. Prior research suggested that 20 seconds for
each item is appropriate for students to do the computations mentally (Reys et al.,
1995). Third, a specially constructed answer sheet with no space for writing was
provided to prevent PTS from copying the problem shown or solving problems on paper.
Qualitative sources of data
Face-to-face interviews with individual participants were conducted in the study
(Creswell, 2009). The purpose of the interviews was two-fold. First, they supported the
results of the quantitative data to identify the consistency of the results of PTS’ mental
computation test. Thus, items for the interview protocols related to mental computation
performances were drawn from MCT for this study. Second, they were used to
determine the correlation between PTS’ performance and flexible mental computation
strategies. To do this, before and after instruction, PTS were encouraged to mentally
compute and find an exact answer for each item and then to briefly explain how they
arrived at their answer. On top of this, after instruction, they were asked to provide
alternative strategies for mentally computing an item among members of both the
experimental and control groups. By doing interviews, “triangulating data sources” were
applied so that “biases inherent in any single method could neutralize or cancel the
biases of other methods” (Creswell, 2009, p. 14). In the reviewed literature, several

61
studies applied qualitative instruments to collect data in relation to the PTS’ attitudes
towards mathematics and mental computation performances (Blöte et al., 2000; Bobis,
2007; Cornell, 1999; Heirdsfield & Cooper, 2004; Murphy, 2004; Swars et al., 2006;
Yang & Huang, 2014). However, from the literature, only one mixed methods study
used interviews with regard to mental computation performance (Blöte et al., 2000). The
participants in these mixed studies were different. Thus, the interview items along with
items of the MCT that were appropriate for PTS were discussed and approved by my
committee members.
Procedures
Following approval from the Human Subjects Committee (HSC), all the results
were deemed confidential and not released under any circumstances. Pseudonyms
were used to ensure that participants could not be identified. Then, in the pre-
intervention stage, the Mathematics Attitude Survey (MAS), the Mental Computation
Test (MCT), and face-to-face interviews were given to both the experimental and control
groups.
After eleven lessons for the experimental groups using two different approaches
– the Direct Teaching (DT) and the Open Approach (OA) – to developing PTS’ own
strategies, the PTS in both groups took posttests. In addition, the interviews were
conducted before and after the intervention sessions.
In the post-intervention stage, the Mathematics Attitude Survey (MAS), the
Mental Computation Test (MCT), and face-to-face interviews were given to both the
62
experimental and control groups again. The quantitative data were analyzed using the
Statistical Package for the Social Sciences (SPSS).
The Teaching Sessions
Course A is a three-credit-hour mathematics course that meets for 50-minute
time periods, three days a week for one semester (about 16 weeks). The PTS in Course
A learned mathematics content of the real numbers and fundamental arithmetic
operations. Two sections of course A are offered every semester and were used for the
experimental groups in the study. An equivalent class enrolled in the teacher education
program in the department of curriculum and instruction was used as a control group.
The researcher carried out both intervention sessions and test sessions over 8 weeks
during the semester. Each session was implemented three times a week. Before the
first session, the PTS in both the experimental and control groups completed the
demographic survey questions and the MAS. In addition, they participated in the pretest
of the MCT. During the intervention sessions, eleven lessons, including test sessions,
were implemented. In the two experimental groups, the mental computation strategies
that are more focused on conceptual understanding using the Direct Teaching (DT) and
the Open Approach (OA) were implemented. The two classes were randomly assigned
as experimental group A or B. After each lesson, for the two experimental groups,
quizzes using PowerPoints were given with the same ten problems to review what they
had learned, and most importantly, to see the differences in the use of strategies. In
doing so, first, the participants were told that they had to find their answer mentally and
then wrote it on the paper and they were encouraged to write down the strategy they

63
used to find the answer. If they did not write either the answer or strategy, or they had
unmatched answers and strategies, the answer was scored as incorrect.
Piloting
The pilot study was conducted with the PTS (i.e., 41 for pre-MCT and 40 for post-
MCT) who were in two sections of course A during the fall semester of 2016. Before
piloting the intervention sessions, the demographic survey and the pretest of the MCT
were provided for each class. After the piloting of the instrument, weaknesses in the
structure of the MAS and MCT were found and the instrument revised. For the MAS, the
time PTS required to complete the survey was recorded and the soundness of each
statement was checked out accordingly. Using the pretest of the mathematics attitude
survey (N = 40), the Cronbach’s alpha (α) was used as the measure of reliability or
average correlation of each statement in the instrument. The mathematics attitude
survey subscale consisted of two subscales: the first subscale, mathematics attitude
survey, included 38 items and the other subscale, attitudes towards mental and written
computation that consisted of 30 items. Also, both groups of PTS were given the
appropriate time for each question in the MCT after the pilot test. Accordingly, the
intervention lessons and the instruments MAS, MCT and interview questions were,
accordingly, deleted, edited, or revised on the basis of information gathered from the
piloting.
The Pretest and Posttest
The researcher handled the pretest, posttest, and the intervention sessions. In
the pretest and posttest, the PTS were presented with 69 computation problems on
whole numbers, integers, and the rational numbers –They were asked to solve each
64
problem mentally. The pre-MCT was found to be reliable (69 items, α=0.96). The PTS
were not allowed to write anything but answers on the specially constructed answer
sheet (with no extra space). The tests scored for right answers on mental computation
problems that were administrated from easy to more complicated in order to provide
confidence to work. The posttest was the same as the pretest, the only difference being
the fact that all inadequate items found by the experts were removed and also only the
arithmetic numbers were changed. The procedures for administrating the test were the
same. Comparing the results of both tests allowed the researcher to identify the
different outcomes of the results. Then, the scores between pretest and posttest were
compared to gauge the differences in the outcomes. Thus, the researcher could
determine whether there was a difference in scores between pretest and posttest, and
then determine if the intervention had an effect on the PTS’ mental computation
performance using two different approaches.
Procedure for the Control Group
At the beginning of the semester, the control group participated in the MAS. On
the first day, they received the consent form so it was clear their participation was
strictly voluntary (and they could refuse to answer any question without penalty, if they
chose to). Next, they were given the pre-survey questionnaire that were required
approximately 15 minutes. Then, the mental computation pretest was given. The
process was the same as with the other groups.
During the teaching sessions, the control group was not given any treatment.
This means that during the pretest, the control group was presented with mental
computation problems using PowerPoint slides and they only wrote the answer to the

65
given answer sheet. Then the participants in the control group were asked to do a pre-
interviews to identify how they solved given problems mentally. The interview process
was the same as for the two experimental groups.
After eight weeks, the control group was given the post-MCT. They did not
receive any instruction related to the mental computation strategies. Therefore, it is
hypothesized that their use of mental computation strategies would heavily rely on their
image of the traditional teaching methods that were used in their textbooks. For
example, when the participants in the control group was asked to calculate 11 × 12 =?,
PTS in the control group would probably solve the problem vertically using visualization
of the traditional algorithm. In this regard, Mardjetko and Macpherson (2007) stressed
that solving mental computation problems vertically by visualizing a written algorithm
can be more likely to produce errors and show little number sense. In terms of the
interviews, the post-interviews were conducted following the same procedures.
Procedure for Intervention Groups
During the teaching sessions, the experimental groups received mental
computation strategies using two different approaches: the Direct Teaching (DT) and
the Open Approach (OA). The researcher did not teach the vertical addition,
subtraction, multiplication, and division algorithms used in textbooks. As for the DT, the
researcher introduced and demonstrated several mental computation strategies in the
lessons for the whole numbers, integers, and rational numbers. According to Murphy
(2004), students’ use of mental computation strategies may not be naturally developed.
Also, a taught mental computation strategy could be introduced in whole class
instruction using more flexible deductive strategies that are connected to their pre-
66
requisite knowledge. The direct instruction can be developed using a range of deductive
strategies (e.g., the use of known facts to derive new ones). Therefore, in this study,
after the pretest, for the first four sessions, the researcher demonstrated a variety of
mental computation strategies for whole numbers in terms of addition, subtraction,
multiplication, and division such as counting on (e.g., 34 + 18 = ?, 34 + 10 = 44 and 44
+ 8 = 52), counting back to (e.g., 70 – 27= ?, 70 – 20 = 50 and 50 – 7 = 43), multiplying
by 9 or 99 (e.g., 12 × 99 = 12 × 100 –12 = 108), compensation (e.g., 20 × 199 = 20 ×
(200 – 1) = 20 × 200 – 20 × 1 = 4,000 – 20 = 3,980), using the distributive property (e.g.,
23 × 45 + 23 × 55 = 23 × (45 + 55) = 33 × 100 = 3,300), dividing using factors (e.g., 70
÷ 14 = (70 ÷ 7) ÷ 2 = 5), dividing the multiples of 100 or 1000 by 25 or 125 (e.g., 1600 ÷
25 = 16 × 100 ÷ 25 = 16 × 4 = 64), and so on. After instruction in mental computation
strategies for whole numbers, at the sixth session, PTS were given problems for whole
numbers and asked to solve each one mentally as a summative evaluation. To do this,
both experimental groups were given selected problems and asked to solve each one
mentally in a limited time and write down their answers on their individual dry erase
board. At the seventh session, similarly, various mental computation strategies for
integers were introduced and demonstrated. Finally, using the DT, at the eighth and
ninth sessions, mental computation strategies for integers and rational numbers
including fractions, decimals, and percentages were shown and explained. For instance,
changing money strategy for fractions (e.g., ½
+ ¾ = 50¢ + 75¢ = $1.25 = 1 ¼), changing fraction into decimals (e.g., 6 × ½ = 6 × 0.5 =
3), compensation (6.8 – 4.9 = 6.8 – 5.0 + 0.1 = 3.8 + 0.1 = 3.9), the use of number facts
(e.g., 9% × 450 = 10% of 450 – 1% of 450 = 45 – 4.5 = 40.5), and so on. At the tenth

67
session, the PTS were given mental computation problems on integers and rational
numbers as a summative evaluation. The process was the same as that for whole
numbers. During the last session, the PTS were participated in the posttest of the MCT.
For each lesson, after demonstrating mental computation strategies, the PTS
were provided the opportunity to review what they had learned. For the next lesson, at
the beginning of the class, the PTS were given a quiz on the previously taught mental
computation problems. In other words, they were asked to solve each problem mentally
first, then they were allowed to write their strategies next to their answer to check their
mental computation was correct. For a formative evaluation, they were scored based on
the correct answers and the strategies they used for each problem on their worksheet.
The timelines for the intervention sessions are provided in Table 5. A detailed
unit lesson plan for mental computation strategy using Direct Teaching approach is
attached in Appendix D.
Regarding the PTS’ own strategies in the constructivist instructional approach,
Varrol and Farran (2007) suggested that teachers should create a comfortable
classroom that allows students to feel secure to share their ideas, thoughts, and
solutions with their peers. In doing so, they are able to invent their own strategies that
show more accuracy and number sense. Providing students with various manipulatives
(e.g., base ten blocks, number lines, and other materials) can encourage students to
formulate their own strategies.

68
Table 5
The Timeline for Intervention Sessions
Sessions Topic Units
1 Pretest Demographic and Pre-attitudinal survey
Mental Computation Pretest
Pre-interview
2 Mental Computation Lesson for
Whole Numbers
Addition
3 Mental Computation Lesson for
Whole Numbers
Subtraction
4 Mental Computation Lesson for
Whole Numbers
Multiplication
5 Mental Computation Lesson for
Whole Numbers
Division
6 Mental Computation Evaluation for
Whole Numbers
Summative Evaluation for Addition, Subtraction,
Multiplication, and Division of Whole Numbers
7 Mental Computation Lesson for
Integers
Integers
8 Mental Computation Lesson for
Rational Numbers
Fractions, Decimals, and Percentages
9 Mental Computation Lesson for
Rational Numbers
Fractions, Decimals, and Percentages
10 Mental Computation Evaluation for
Integers and Rational Numbers
Summative Evaluation for Integers, Fractions,
Decimals, and Percentages
11 Posttest Post-attitudinal survey
Mental Computation Posttest
Post-Interview
The timeline for this experimental group was the same as the other group (See
Table 5). Basically, the treatment difference between these two experimental groups is
that this group was not provided any taught mental computation strategies. Instead, the
constructivist teaching method using the Open Approach (Hashimoto & Becker, 1999)
was implemented to deepen or develop PTS’ own mental computation strategies,
understanding, and knowledge of whole numbers, integers, and rational numbers. For
the OA group, the researcher presented a problem set that contains important concepts
for the lesson and ensured that the participants understand what is expected of them
before they begin. They were asked to record their responses as they solve problems
69
individually or in small groups. Then they were asked to find solutions in many different
ways and record the strategies they used to solve the problems. During this time, the
researcher encouraged the PTS’ natural ways of thinking to generate various different
mental computation strategies and selects answers that best fit the discussion with a
whole class. Next, the selected PTS shared or explained how they solved their
problems on the board for the whole class to see. The researcher then compared their
responses and guided a discussion about what strategies were effectively or efficiently
used for each mental computation problem. Last, the researcher summarized the lesson
based on the discussion, ideas, and thoughts. For instance, consider a mental
computation strategy for multiplication. The researcher posed the following mental
computation problems using PowerPoint:
1. 12 × 8=
2. 25 × 22=
3. 32 × 99=
4. 25 × 16 × 125=
5. 37 × 88 + 37 ×12=
6. 18 × 114 – 18 × 14 =
Then, the researcher clearly explained the purpose of the lesson shown.
1. To develop their own mental computation strategies for multiplication,
2. To find effective or efficient mental computation multiplication strategies that
focus on conceptual understanding,

70
3. To improve the mental computation test performance and flexibility using
alternative solutions
Next, the researcher posed one problem at a time using PowerPoint and asked PTS
individually to find as many different strategies as they could. For the example of 12 × 8,
they showed the following different strategies;
1. 12 + 12 = 24, 24 + 24= 48, 48 + 48 = 96
2. 11 × 8 = 88, 88 + 8 = 96
3. 8 × 6 = 48, 48 × 2= 96
4. (10 + 2) × 8= 80 + 16 = 96
5. 12 + 12 + 12 + 12+ 12 + 12 + 12 + 12 = 96, and so on.
Then, the class compared the strategy each student generated or created and
discussed the strategy used by each person, and what property of multiplication was
involved. Then, they categorized the strategies that can be effectively or efficiently used
for mental computation multiplication and explain why they have done so. The language
used in giving answers and the comparisons used was an important discussion. The
same discussion pattern was used for each mental computation problem. Finally a
summary of each lesson was given to the class. A detailed unit lesson plan for a mental
computation strategy using the open-ended approach is attached in Appendix D.
Interviews
The interviews were conducted before and after the intervention sessions. 38
PTS were participated in the pre-interviews and 36 were participated in the post-
interviews. The average length of time for the pre-interviews was approximately 10
minutes. During the interview, the individual students were presented with a mental

71
computation task from whole numbers, integers, or rational numbers that included
fractions, decimals, and percentages with respect to addition, subtraction, multiplication,
and division problems. The interview items came from the problems on the mental
computation pretest. Three levels of problems for each operation were selected, based
on the levels of difficulty.
To select problems for the interview, after calculating students’ total scores on
the pre-MCT, first, the researcher calculated the average percentages of correct
answers for each problem. Then, using this average, the researcher organized the
problems into three difficulty levels: low difficulty (more than 70% correct), moderate
difficulty (between 40% to 70% correct), and high difficulty (less than 40% correct).
Problems that were too difficult (e.g., close to 0% correct) were eliminated for the
interview questions because PTS would not be able to explain how they solved each
problem mentally. Finally, for each operation, the researcher selected one problem for
each level of difficulty. However, regarding integer problems, only one medium difficulty
problem has selected and for fraction problems, only low and medium difficulty
problems were selected because, for these operations, the alternative difficulty levels
did not exist.
As an example, Table 6 lists the problems selected from the mental computation
pretest for the pre-interview. To figure out what mental computation strategies were
most preferred or used by individual students and why, before and after instruction, PTS
were encouraged to mentally compute and find an exact answer for each item and then
briefly explained how they arrived at the answer. Prior to the interviews, a detailed
categorization of expected strategies for each of the interview items was formulated.

72
Table 6
The Pre-Interview Problems Selected from Pre-MCT
Types of Operation Levels of Difficulty Selected Problems
Addition Low 10 + 76 =
Moderate 22 + 17 + 11 =
High 39 + 399 + 3999=
Subtraction Low 40 – 6 =
Moderate 63 – (13 + 3) =
High 607 – 299 =
Multiplication Low 14 × 6 =
Moderate 42 × 20 =
High 99 × 13 =
Division Low 24 ÷ 8 =
Moderate 700 ÷ 25 =
High 342 ÷ 18 =
Integer Moderate 38 × (– 8) ÷ (– 2) =
Fraction Moderate 1
2 +
3
4 =
High 31
4 – 2
1
2=
Decimal Low 5.6 + 3.7 =
Moderate 0.5 × 48 =
High 0.02 × 0.4 =
Percentages Low 1% × 200 =
Moderate 25 % of 20 =
High 24% × 80 =
The expected strategies were grouped by common approaches. Before
instruction, they were asked the questions below:
1. Can you solve this problem mentally?
2. Can you tell me how you solved this problem? Show me your strategy.
After intervention sessions, the post-interview problems were selected from the
post-MCT. The process of the selection of problems for the post-interview was the same
as the pre-interviews. For the selection of post-interview problems, no difficult problem
for addition exists so this category was eliminated.
Table 7 presents the interview problems for the post-interview. After the mental
computation posttest, PTS for both the experimental and control groups were asked to

73
solve each problem mentally and to provide alternative strategies for mentally
computing an answer. The average length of time for the post-interview was
approximately 25 minutes. The PTS were asked the following questions:
1. Can you solve this problem mentally?
2. Can you tell me your strategy?
3. Do you have other ways of computing the problem? If so, what are they?
Table 7
The Post-Interview Problems Selected from Post-MCT
Types of Operation Levels of Difficulty Selected Problems
Addition Low 143 + 59 =
Moderate 18 + 27 + 37 =
Subtraction Low 36 – 8 =
Moderate 95 – 37 =
High 807 – 399 =
Multiplication Low 7 × 16 =
Moderate 24 × 30 =
High 99 × 180 =
Division Low 56 ÷ 7 =
Moderate 80 ÷ 25 =
High 468 ÷ 18 =
Integer Low 25 ×4×0
4 =
Moderate –13 – (– 37) + 20 =
High 24 × 4 ÷ (– 6) =
Fraction Low 2
3 × 18 =
Moderate 4 1
2 + 1
3
4 =
High 1
3 × 4
1
5 =
Decimal Low 5.8 + 2.6 =
Moderate 100 × 0.05 ÷ 1000 =
High 0.2 × 75 =
Percent Low 1% of 175 =
Moderate 75 % ×120 =
High 38 % × 60 =
The interview sessions for both the experimental and control groups were audio-
recorded and later transcribed. After all the interviews were completed, the audiotapes
were reviewed and alternative strategies for mentally computing the answers were

74
documented in script tapes and summarized for groups of similar responses. The script
tapes consisted of the interviewer’s question, the types of responses PTS’ chose to use,
the approximate time spent formulating the responses, a written summary of the
strategy described, PTS’ response to whether he or she could describe an alternative
strategy, and any other comments about the problems or solutions. Strategies
described by the interview were coded or grouped based on the mental computation
strategy categorization created by the researcher. New strategies and crucial findings
that emerged during the interview, were added to the categorization.
Data Analysis
Scoring Data
For the MAS, thirty-eight Likert-scale items were used. Each item has a scale
ranging from one to five points. A higher score for the first part indicated a more positive
attitude towards mathematics. A higher score for the second part showed PTS’ belief
about which computation is more important, either mental computation or written
computation. However, a higher score for the last part showed a more negative attitude
towards mental computation. In other words, a high score represented PTS’ possessing
more anxiety towards mental computation. Each item of the MCT was assigned one
point for a correct answer and no point for an incorrect answer or no response. The
items of the interview instrument were discussed with my committee members.
Therefore, the total possible score was sixty-nine. For each interview item, the PTS
provided their answer and verbally explained the strategies they used.

75
Analyzing Data
Creswell (2009) recommend: “in a concurrent embedded model, conduct a
survey at one level (e.g., with families) to gather quantitative results about a sample. At
the same time, collect qualitative interviews (e.g., with individuals) to explore the
phenomenon with specific individuals in the families” (p.219). From the literature review,
only one study used a mixed methods approach (Reys et al., 1995) that mostly fits this
study. In line with this, this study modified the sample and methods, explored the
relationship between conceptual understanding and the use of mental calculation, and
adjusted the context for PTS in the United States. To get a general idea of the
quantitative data, descriptive statistics with means and standard deviation were utilized
for all pre-and post-tests in terms of the MAS and the MCT. All of the group-
administered test scores were analyzed using SPSS with the significance level at α =
0.05. More specifically, to investigate the first research question, “To what extent do
PTS’ attach importance to mental and written computation?” In order to determine
whether there is any statistically significant difference among the three groups, the one-
way analysis of variance (ANOVA) was used. Then, the MAS was analyzed
descriptively.
To investigate the second research question, “Is there a significant correlation
between PTS’ mental computation performance and their attitudes towards
mathematics?”, a correlation was implemented to determine whether there was a
relationship between PTS’ mathematics performances using two different approaches
and their attitudes towards mathematics learning, more specifically, mental
computation.

76
To examine the third research question, “Are there significant differences in
mental computation performance between the experimental groups (the direct teaching
and the open-ended approach to developing students’ own strategies) and the control
groups before and after instruction?”, an Analysis of Covariance (ANCOVA) was used
to identify the differences between the experimental and the control groups in terms of
mental computation performances.
To explore the fourth question, “What are the differences in the use of mental
computation strategies between the experimental groups? “ and fifth question, “How
does the use of PTS’ mental computation strategy affect students’ flexibility?”, the
qualitative descriptive analysis was used based on all of the data gathered. Accordingly,
Kilpatrick et al. (2001) emphasized that it is vital for students to acquire flexibility in their
use of strategies. In this regard, after all the interviews were completed and the audio-
recordings reviewed, a written summary of the strategy was described, including PTS’
mental computation strategies, responses to whether they can describe an alternative
strategy, and other comments about mental computation strategies. All of the strategies
were coded and categorized to interpret the results of the study.
In light of the above, both quantitative and qualitative analyses were combined to
“integrate the information and compare one data source with the other” and/or
“reside side by side as two different pictures that provide an overall composite
assessment of the problem” (Creswell, 2009, p. 214).

78
CHAPTER 4
RESULTS
This chapter presents the findings of the study and the results of the descriptive
and statistical analysis of data collected from the pre-and post-Mathematics Attitudinal
Surveys (MAS), pre-and post-Mental Computation Test (MCT) and pre-and post-
interviews with three groups of preservice teachers (PTS). The five research questions
are given below:
1. To what extent do PTS believe that mathematics attitudes, mental and written
computation, and anxiety changes regarding mental computation are
important?
2. Is there a significant correlation between PTS’ mental computation
performance and their attitudes towards mathematics, written and mental
computations, and mental computation anxiety?
3. Are there significant differences in mental computation performance between
the experimental groups and the control groups before and after instruction?
4. What are the differences in the use of mental computation strategies between
the experimental groups?
5. How does the use of PTS’ mental computation strategies affect students’
flexibility regarding mental computation?
Research Findings
The purpose of the current study is to explore attitudes and beliefs of PTS
towards mathematics, mental and written computations, and mental computation

79
anxiety and to investigate their use of different mental computation strategies with two
different approaches that are connected to conceptual understanding and flexibility.
Appendix C presents the 81 statements of the Mathematics Attitude Survey (MAS) used
in this study. Descriptive and inferential statistics were used to analyze the results of
MAS that were completed by 50 PTS (before instruction) for the experimental and
control groups and 26 PTS (after instruction) for the experimental groups only during
one semester (spring 2017). Since no instruction or intervention was given to the control
group regarding mental computation, there are no post-attitudinal survey results.
PTS’ Mathematics Attitudes, Mental and Written Computation, and Mental
Computation Anxiety
In the first research question, the researcher asked: to what extent PTS believe
that mathematics attitudes, mental and written computation, and anxiety changes
regarding mental computation are important. Descriptive statistics were calculated for
the variables: mathematics attitudes, mental and written computation, and mental
computation anxiety. More specifically, minimum and maximum values of PTS’ scores,
mean, standard deviation on MAS are presented in Table 8.
Table 8
Descriptive Statistics for Mathematics Attitudes, Mental and Written Computation, and
Mental Computation Anxiety
Variable MIPS MAPS MIOS MAOS M* SD*
Mathematics
Attitudes
38 190 101 177 136.58 18.71
Mental and Written
Computation
Total 30 150 32 129 103.24 10.11
Mental 15 75 32 71 54.78 6.84
Written 15 75 32 60 48.46 5.44
Mental Computation
Anxiety
13 65 14 64 38.44 8.87
Note: MIPS=Minimum Possible Score, MAS=Maximum Possible Score, MIOS=Minimum Obtained Score,
MAOS=Maximum Obtained Score, M=Mean, SD=Standard Deviation, α = Cronbach’s Alpha
* Rounded to nearest hundredth

80
Based on the results of the analysis, the minimum obtained score is 101 and the
maximum is 177. The mean of the preservice attitude score is 137 and the standard
deviation is 18.7. It can be said that, in general, the fifty participating PTS have slightly
positive attitudes towards mathematics. In regard to statements classified under PTS’
attitudes or beliefs towards mental and written computation, two statements about
mental and written computation were provided in a parallel way. The results of this
survey indicated that PTS believed that mental computations were more important than
written computation (M=54.78 vs. M=48.46). More detailed explanations regarding PTS’
attitudes towards mental and written computation will be discussed in a subsequent
section.
Regarding mental computation anxiety, a high score represents PTS’ higher
anxiety levels towards mental computations. As a result of the analysis, the minimum
obtained score was 14 and the maximum was 64. The mean of the preservice attitude
score was 38.44 and the standard deviation was 8.87. So PTS had shown a somewhat
high anxiety level towards mental computation. In the next section, the researcher
illustrates the results of the survey in more detail based on the following subcategories:
mathematics attitudes, mental and written computation, and mental computation
anxiety.
Preservice Teachers’ Attitudes towards Mathematics. The 38 statements
were grouped into 3 parts as shown in Tables 9, 10, and 11: 1) PTS’ positivity towards
learning mathematics (i.e., 1 – 8), 2) mathematics teachers’ behavior (i.e., 9 – 24), and
3) mathematics teachers’ instruction (i.e., 25 – 38). Table 9 shows percentages of
responses of PTS’ attitudes towards mathematics learning.
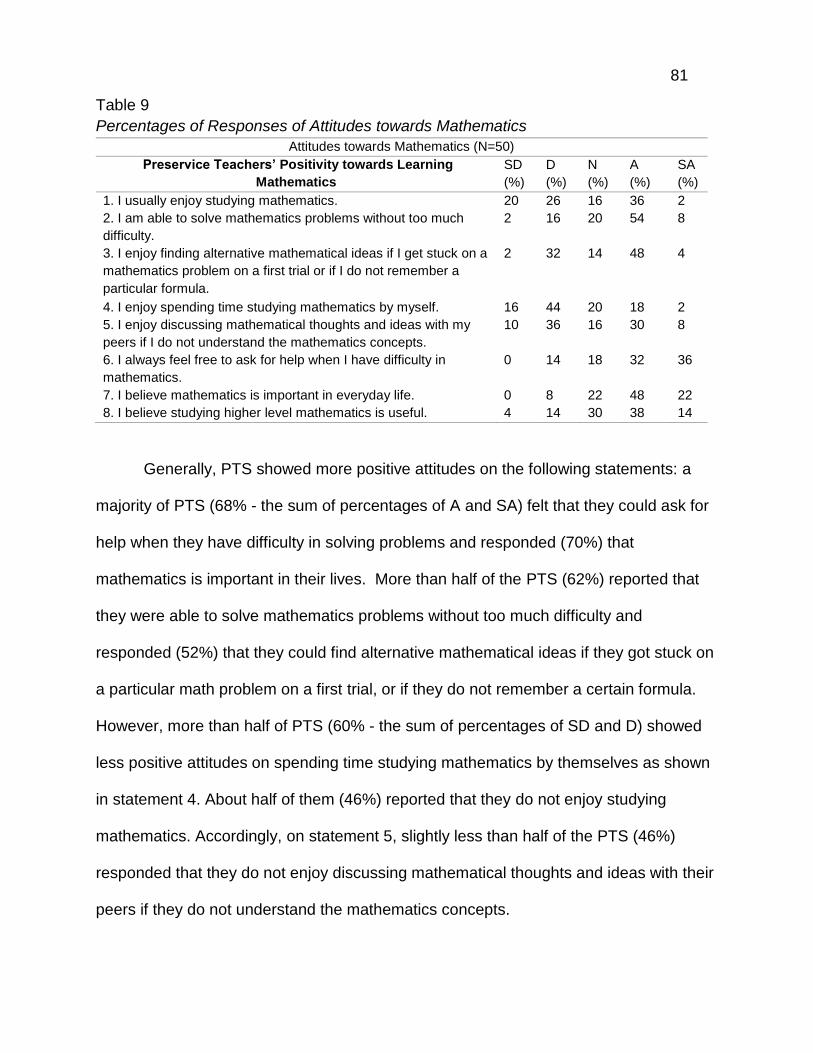
81
Table 9
Percentages of Responses of Attitudes towards Mathematics
Attitudes towards Mathematics (N=50)
Preservice Teachers’ Positivity towards Learning
Mathematics
SD
(%)
D
(%)
N
(%)
A
(%)
SA
(%)
1. I usually enjoy studying mathematics. 20 26 16 36 2
2. I am able to solve mathematics problems without too much
difficulty.
2 16 20 54 8
3. I enjoy finding alternative mathematical ideas if I get stuck on a
mathematics problem on a first trial or if I do not remember a
particular formula.
2 32 14 48 4
4. I enjoy spending time studying mathematics by myself. 16 44 20 18 2
5. I enjoy discussing mathematical thoughts and ideas with my
peers if I do not understand the mathematics concepts.
10 36 16 30 8
6. I always feel free to ask for help when I have difficulty in
mathematics.
0 14 18 32 36
7. I believe mathematics is important in everyday life. 0 8 22 48 22
8. I believe studying higher level mathematics is useful. 4 14 30 38 14
Generally, PTS showed more positive attitudes on the following statements: a
majority of PTS (68% - the sum of percentages of A and SA) felt that they could ask for
help when they have difficulty in solving problems and responded (70%) that
mathematics is important in their lives. More than half of the PTS (62%) reported that
they were able to solve mathematics problems without too much difficulty and
responded (52%) that they could find alternative mathematical ideas if they got stuck on
a particular math problem on a first trial, or if they do not remember a certain formula.
However, more than half of PTS (60% - the sum of percentages of SD and D) showed
less positive attitudes on spending time studying mathematics by themselves as shown
in statement 4. About half of them (46%) reported that they do not enjoy studying
mathematics. Accordingly, on statement 5, slightly less than half of the PTS (46%)
responded that they do not enjoy discussing mathematical thoughts and ideas with their
peers if they do not understand the mathematics concepts.

82
This results indicated that PTS are likely to show positive attitudes towards
learning mathematics, indicating they can solve problems without too much difficulty,
ask for help when they faced difficult problems and were aware of the importance of
learning mathematics, indicating they believe mathematics is important in their lives and
enjoy finding alternative mathematical ideas if they get stuck on a problem. However, it
can’t be overlooked that some of the PTS did not enjoy studying mathematics, spending
time studying mathematics by themselves, and discussing mathematical thoughts and
ideas with their peers although they did not understand the mathematics concepts.
The goal of next part is to report on PTS’ past experiences on their K-12
mathematics teachers’ behavior and instruction. Table 10 illustrates percentages of
responses of PTS’ previous experiences with their mathematics teachers’ behavior. The
majority of the PTS, both K-8 and high school, indicated they had more positive
experiences towards their previous mathematics teachers’ behavior. In particular, as
shown in statements 10 and 18, PTS (80% and 76%, respectively) felt that their K-8 and
high school mathematics teachers avoided disrespectful behaviors. Seventy-four
percent of PTS reported that their K-8 and high school teachers showed enthusiasm for
teaching mathematics as shown in statements 11 and 19. In statements 13 and 21,
respondents also said their K-8 and high school mathematics teachers (72% and 68%,
respectively) considered students’ interests and needs and had a good relationship with
them. Additionally, their K-8 and high school mathematics teachers (72% and 70%,
respectively) showed confidence when responding to students’ inquiries as indicated in
statements 15 and 23.

83
Table 10
Percentages of Responses of Mathematics Teachers Behavior
Attitudes towards Mathematics (N=50)
Preservice Teachers’ Experience of their Mathematics
Teacher Behavior
SD
(%)
D
(%)
N
(%)
A
(%)
SA
(%)
9. In K-8 school, my mathematics teachers listened carefully
when I had to ask questions.
0 10 28 42 20
10. In K-8 school, my mathematics teachers avoided disrespectful
behaviors such as scolding, ignoring, annoying, and laughing at
the students who made mistakes in mathematics classes.
0 12 8 52 28
11. In K-8 school, my mathematics teachers showed enthusiasm
for teaching mathematics.
0 8 18 62 12
12. In K-8 school, my mathematics teachers were patient with
students who had difficulty in mathematics.
1 6 30 50 14
13. In K-8 school, my mathematics teachers considered my
interests and needs and had a good relationship with me.
0 18 10 62 10
14. In K-8 school, my mathematics teachers encouraged me to
gain self-confidence in mathematics.
2 10 20 60 8
15. In K-8 school, my mathematics teachers showed prompt
responses to my inquiries with confidence.
0 6 24 64 6
16. In K-8 school, my mathematics teachers had an open mind to
accept students’ individual differences.
0 12 24 50 14
17. In high school, my mathematics teachers listened carefully
when I had to ask questions and have a good relationship with me.
0 12 14 48 26
18. In high school, my mathematics teachers avoided disrespectful
behaviors such as scolding, ignoring, annoying, and laughing at
the students who made mistakes in mathematics classes.
2 16 6 44 32
19. In high school, my mathematics teachers showed enthusiasm
for mathematics.
0 10 16 42 32
20. In high school, my mathematics teachers were patient with
students who had difficulty in mathematics.
0 18 30 28 24
21. In high school, my mathematics teachers considered my
interests and needs and had a good relationship with me.
0 12 20 38 30
22. In high school, my mathematics teachers encouraged me to
gain self-confidence in mathematics.
2 22 8 46 22
23. In high school, my mathematics teachers showed prompt
responses to my inquiries with confidence.
0 12 18 50 20
24. In high school, my mathematics teachers had an open mind to
accept students’ individual differences.
0 14 22 38 26
In regard to statements classified under PTS’ experience of their mathematics
teachers’ instructional methods, a majority of PTS showed relatively positive attitudes
and beliefs towards their previous mathematics teachers’ instruction. Table 11 shows
percentages of responses of the PTS’ past experience of their mathematics teachers’

84
instruction.
Table 11
Percentages of Responses to Mathematics Teachers’ Instruction
Attitudes towards Mathematics (N=50)
Preservice Teachers’ Experience of their Mathematics Teacher Instruction
SD (%)
D (%)
N (%)
A (%)
SA (%)
25. In K-8 school, my mathematics teachers used concrete materials
like manipulatives and visual representations when presenting
mathematics topics, in order to make them meaningful.
0 4 12 76 8
26. In K-8 school, my mathematics teachers encouraged students to
participate in class and small group discussion and to share their
ideas with peers.
2 10 18 60 10
27. In K-8 school, my mathematics teachers focused on students’
understanding of mathematics concepts, rather than on
demonstrating the formulas.
0 16 38 44 2
28. In K-8 school, my mathematics teachers provided individual
support to students having difficulty in mathematics.
0 16 12 66 6
29. In K-8 school, my mathematics teachers encouraged students to
use a variety of different methods related to learning concepts in
mathematics.
0 20 22 54 4
30. In K-8 school, my mathematics teachers accepted student’s
different strategies and valued students’ creative ideas.
0 18 34 34 14
31. In K-8 school, my mathematics teachers used alternative ways
to evaluate students’ mathematics performance.
4 16 30 44 6
32. In high school, my mathematics teachers used concrete
materials like manipulatives and visual representations when
presenting mathematics topics, in order to make them meaningful.
0 18 14 54 14
33. In high school, my mathematics teachers encouraged students
to participate in class and small group discussion and to share their
ideas with peers.
0 16 12 54 18
34. In high school, my mathematics teachers focused on students’
understanding of mathematics concepts, rather than on
demonstrating the formulas.
0 32 14 38 16
35. In high school, my mathematics teachers provided individual
support to students having difficulty in mathematics.
0 10 12 52 26
36. In high school, my mathematics teachers encouraged students
to use a variety of different methods related to learning concepts in
mathematics.
0 16 10 54 20
37. In high school, my mathematics teachers accepted student’s
different strategies and valued students’ creative ideas.
0 14 10 50 26
38. In high school, my mathematics teachers used alternative ways
to evaluate students’ mathematics performance.
0 22 22 46 10
There were PTS’ previous teachers’ instructional differences between K-8 and
high school. As shown in statements 25 and 32. PTS responded that their K-8

85
mathematics teachers (84%) were more likely to use concrete materials than their high
school teachers (68%). Interestingly, the differences between K-8 and high school
mathematics teachers’ instruction methods were described as follows: in statements 29
and 36, about two-thirds of high school mathematics teachers (74%) encouraged
students to use a variety of different methods related to learning concepts, in contrast,
slightly more than half of the K-8 teachers (58%) encouraged them to use different
methods. Moreover, in statements 30 and 37, surprisingly, about half of PTS’ K-8
mathematics teachers (48%) accepted students’ different strategies and creative ideas,
while seventy-six percent of PTS’ high school mathematics teachers accepted their
different strategies and ideas.
Similar percentages regarding their mathematics teachers’ instructional methods
were presented in other questions. As shown in statements 26 and 33, their K-8 and
high school mathematics teachers (70% and 72%, respectively) encouraged students’
participation in class and small group discussion. In addition, in statements 28 and 35,
their teachers (72 % and 78%, respectively) provided individual support when they had
difficulty solving problems. However, less than half of PTS (46% and 44%, respectively)
felt that their K-8 and high school mathematics teachers focused on their understanding
of mathematics concepts, rather than on demonstrating the formulas as indicated in
statements 27 and 34. About half of the PTS (50% and 56%, respectively) felt that their
mathematics teachers used alternative ways to evaluate their performances.
PTS’ Attitudes towards Mental and Written Computations. Table 12 is a
summary of the second category, mental and written computation, on the MAS. The
statements are grouped in two clusters: PTS’ beliefs about mental and written
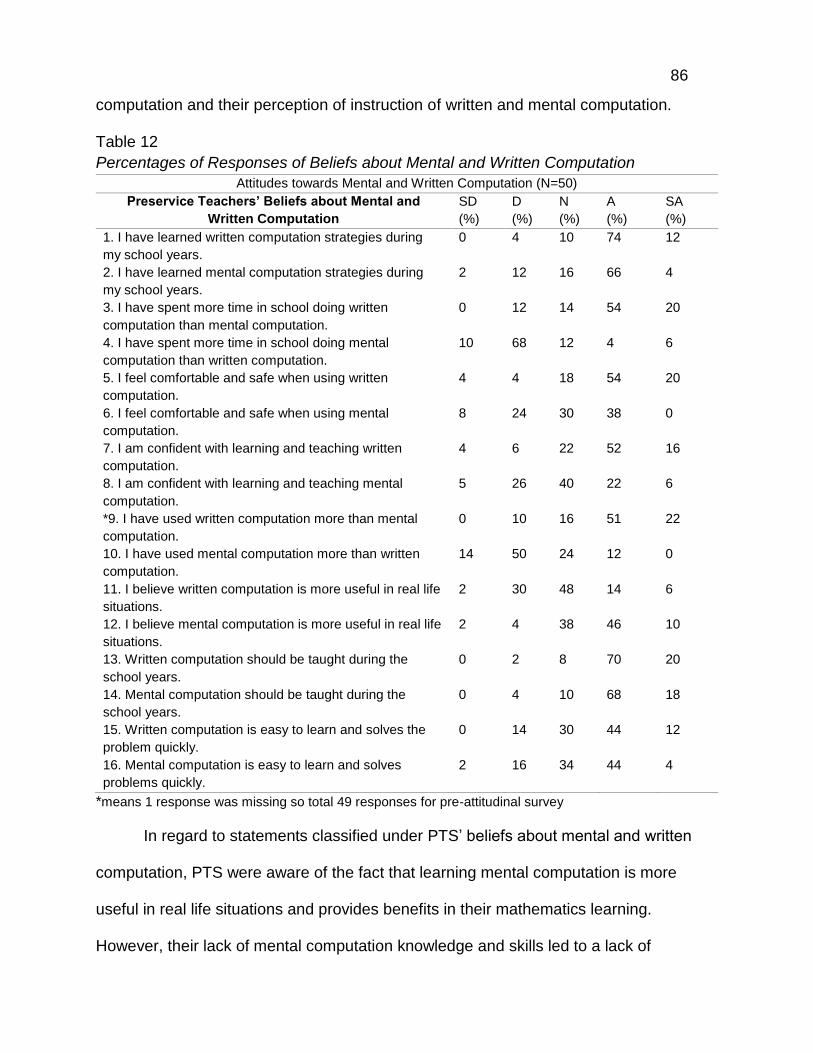
86
computation and their perception of instruction of written and mental computation.
Table 12
Percentages of Responses of Beliefs about Mental and Written Computation
Attitudes towards Mental and Written Computation (N=50)
Preservice Teachers’ Beliefs about Mental and
Written Computation
SD
(%)
D
(%)
N
(%)
A
(%)
SA
(%)
1. I have learned written computation strategies during
my school years.
0 4 10 74 12
2. I have learned mental computation strategies during
my school years.
2 12 16 66 4
3. I have spent more time in school doing written
computation than mental computation.
0 12 14 54 20
4. I have spent more time in school doing mental
computation than written computation.
10 68 12 4 6
5. I feel comfortable and safe when using written
computation.
4 4 18 54 20
6. I feel comfortable and safe when using mental
computation.
8 24 30 38 0
7. I am confident with learning and teaching written
computation.
4 6 22 52 16
8. I am confident with learning and teaching mental
computation.
5 26 40 22 6
*9. I have used written computation more than mental
computation.
0 10 16 51 22
10. I have used mental computation more than written
computation.
14 50 24 12 0
11. I believe written computation is more useful in real life
situations.
2 30 48 14 6
12. I believe mental computation is more useful in real life
situations.
2 4 38 46 10
13. Written computation should be taught during the
school years.
0 2 8 70 20
14. Mental computation should be taught during the
school years.
0 4 10 68 18
15. Written computation is easy to learn and solves the
problem quickly.
0 14 30 44 12
16. Mental computation is easy to learn and solves
problems quickly.
2 16 34 44 4
*means 1 response was missing so total 49 responses for pre-attitudinal survey
In regard to statements classified under PTS’ beliefs about mental and written
computation, PTS were aware of the fact that learning mental computation is more
useful in real life situations and provides benefits in their mathematics learning.
However, their lack of mental computation knowledge and skills led to a lack of
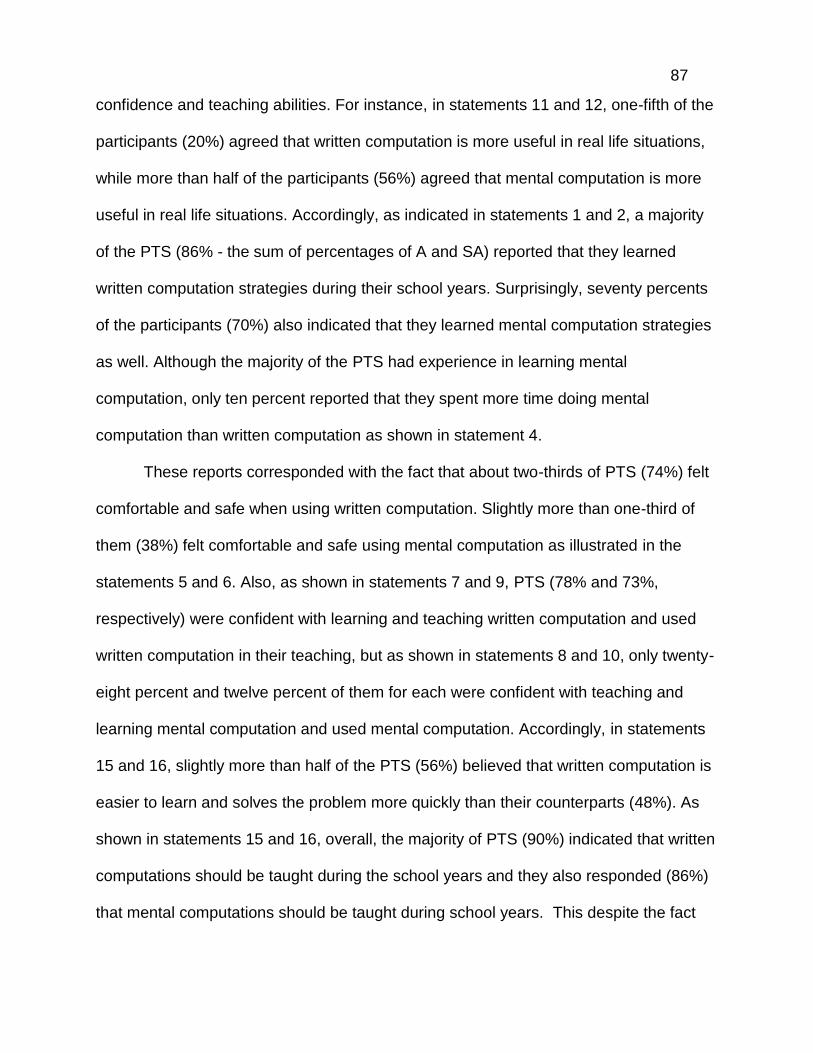
87
confidence and teaching abilities. For instance, in statements 11 and 12, one-fifth of the
participants (20%) agreed that written computation is more useful in real life situations,
while more than half of the participants (56%) agreed that mental computation is more
useful in real life situations. Accordingly, as indicated in statements 1 and 2, a majority
of the PTS (86% - the sum of percentages of A and SA) reported that they learned
written computation strategies during their school years. Surprisingly, seventy percents
of the participants (70%) also indicated that they learned mental computation strategies
as well. Although the majority of the PTS had experience in learning mental
computation, only ten percent reported that they spent more time doing mental
computation than written computation as shown in statement 4.
These reports corresponded with the fact that about two-thirds of PTS (74%) felt
comfortable and safe when using written computation. Slightly more than one-third of
them (38%) felt comfortable and safe using mental computation as illustrated in the
statements 5 and 6. Also, as shown in statements 7 and 9, PTS (78% and 73%,
respectively) were confident with learning and teaching written computation and used
written computation in their teaching, but as shown in statements 8 and 10, only twenty-
eight percent and twelve percent of them for each were confident with teaching and
learning mental computation and used mental computation. Accordingly, in statements
15 and 16, slightly more than half of the PTS (56%) believed that written computation is
easier to learn and solves the problem more quickly than their counterparts (48%). As
shown in statements 15 and 16, overall, the majority of PTS (90%) indicated that written
computations should be taught during the school years and they also responded (86%)
that mental computations should be taught during school years. This despite the fact

88
that they lack confidence, teaching skills, and the necessary knowledge of mental
computation.
Table 13
Percentages of Responses of Instruction between Mental and Written Computation
Attitudes towards Mental and Written Computation (N=50)
Preservice Teachers’ Perception of Instruction between
Mental and Written Computation
SD
(%)
D
(%)
N
(%)
A
(%)
SA
(%)
17. I think I will use written computation more when I teach
students.
0 10 36 46 8
18. I think I will use mental computation more when I teach
students.
4 16 56 22 2
*19. Students can be successful mathematics learners by
teaching only written computation.
4 47 31 16 2
20. Students can be successful mathematics learners by
teaching only mental computation.
4 56 30 6 4
21. Written computation should be introduced first when
teaching mathematics.
0 10 18 58 14
22. Mental computation should be introduced first when
teaching mathematics.
4 30 36 26 4
*23. Teaching written computation can build students’
mathematical procedural knowledge and understanding.
0 0 10 73 16
24. Teaching mental computation can build students’
mathematics procedural knowledge and understanding.
0 10 12 66 12
25. Written computation should be taught to learn advanced
mathematics.
2 2 22 58 16
26. Mental computation should be taught to learn advanced
mathematics.
0 14 32 44 10
27. Students can develop their natural thinking ability through
learning written computation.
0 4 24 62 10
28. Students can develop their natural thinking ability through
learning mental computation.
0 2 20 64 14
29. Students who are highly skilled in written computation
develop problem-solving skills.
0 6 30 52 12
30. Students who are highly skilled in mental computation
develop problem-solving skills.
0 6 30 48 16
*means 1 response was missing so total 49 responses for pre-attitudinal survey
Table 13 shows statements relating to PTS’ perception of the instructional
differences between mental and written Computation. This illustrates similar
percentages of responses to the questions about PTS’ instructional perception about
mental and written computation. For example, in statements 29 and 30, more than half
of PTS (64% each) agreed that students who are highly skilled in written computation or

89
mental computation develop problem-solving skills. In statements 27 and 28, more than
three-quarters of PTS (72 %) felt that students can develop their natural thinking ability
through learning written computation, while slightly more (78%) felt that students can
develop their natural thinking ability through learning mental computation. Similarly, only
about one-fifth of PTS (18%) agreed that students can be successful mathematics
learners by teaching only written computation, while similar percentages (10%) said that
students can be successful mathematics learners by teaching only mental computation.
In addition, under this category of statements, fifty PTS have put more
importance to the written computation instruction. For example, as shown in statements
17 and 18, slightly more than half of the PTS (54%) prefer written computation rather
than mental computation (44%) when they teach students. Accordingly, more than two-
thirds of PTS (72%) reported that written computation should be introduced before
mental computation (30%). In the statements 23 and 24, PTS believed that written
computation (89%) can build students’ mathematical procedural knowledge and
understanding than mental calculations (78%). Likewise, seventy-eight percent of PTS
felt that written computation should be taught in advanced mathematics. On the other
hand, slightly more than half of them (54%) agreed that mental computation should be
taught first.
PTS’ Mental Computation Anxiety. All the results of PTS’ responses to mental
computation anxiety are presented in Table 14. The mental computation anxiety cluster
suggested that although PTS are interested and have some confidence in solving
problems mentally, they have slightly higher anxiety levels regarding mental
computation. For example, almost two-thirds of the participants (62%) said that they are
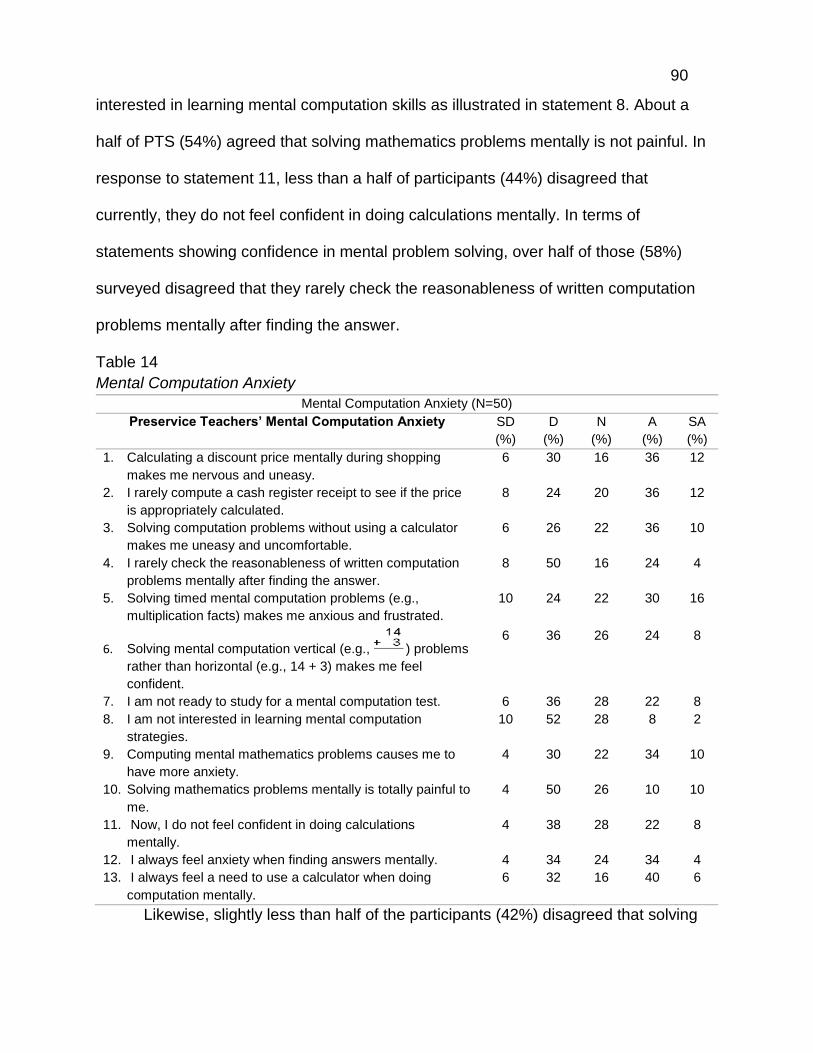
90
interested in learning mental computation skills as illustrated in statement 8. About a
half of PTS (54%) agreed that solving mathematics problems mentally is not painful. In
response to statement 11, less than a half of participants (44%) disagreed that
currently, they do not feel confident in doing calculations mentally. In terms of
statements showing confidence in mental problem solving, over half of those (58%)
surveyed disagreed that they rarely check the reasonableness of written computation
problems mentally after finding the answer.
Table 14
Mental Computation Anxiety
Mental Computation Anxiety (N=50)
Preservice Teachers’ Mental Computation Anxiety SD
(%)
D
(%)
N
(%)
A
(%)
SA
(%)
1. Calculating a discount price mentally during shopping
makes me nervous and uneasy.
6 30 16 36 12
2. I rarely compute a cash register receipt to see if the price
is appropriately calculated.
8 24 20 36 12
3. Solving computation problems without using a calculator
makes me uneasy and uncomfortable.
6 26 22 36 10
4. I rarely check the reasonableness of written computation
problems mentally after finding the answer.
8 50 16 24 4
5. Solving timed mental computation problems (e.g.,
multiplication facts) makes me anxious and frustrated.
10 24 22 30 16
6. Solving mental computation vertical (e.g., ) problems
rather than horizontal (e.g., 14 + 3) makes me feel
confident.
6 36 26 24 8
7. I am not ready to study for a mental computation test. 6 36 28 22 8
8. I am not interested in learning mental computation
strategies.
10 52 28 8 2
9. Computing mental mathematics problems causes me to
have more anxiety.
4 30 22 34 10
10. Solving mathematics problems mentally is totally painful to
me.
4 50 26 10 10
11. Now, I do not feel confident in doing calculations
mentally.
4 38 28 22 8
12. I always feel anxiety when finding answers mentally. 4 34 24 34 4
13. I always feel a need to use a calculator when doing
computation mentally.
6 32 16 40 6
Likewise, slightly less than half of the participants (42%) disagreed that solving

91
mental computation vertical problems rather than horizontal makes them feel confident
However, when the participants were asked the statements focusing on anxiety
about mental computation in solving computation problems, the results revealed that
they have not processed their thoughts and ideas clearly. For example, in response to
statement 12, “I always feel anxiety when finding answers mentally,” the same
percentages of participants (48%) both agreed and disagreed with the statement.
Taken together, the results of responses to this study suggested that the PTS
were somewhat anxious about mental computation. For example, according to
statements 9, 5, 13, and 3, slightly less than a half of PTS (44%) agreed that computing
mental mathematics problems causes them to have more anxiety. More specifically,
solving timed mental computation problems made them (46%) anxious and frustrated.
The same percentage of participants (46%) said that they always feel a need to use a
calculator when doing computation mentally and agreed that solving computation
problems without using a calculator makes them uneasy and uncomfortable. Only 42%
of PTS said that they are ready for a mental computation test. These results are
consistent with the participants’ statements applied to their real-life situations as shown
in statements 1 and 2, the same percentages of PTS (48%) indicated that calculating a
discount price mentally during shopping makes them nervous and uneasy. Also, they
rarely compute a cash register total to see if the prices are appropriately calculated.
Group Differences on Mathematics Attitudes, Mental and Written Computation,
and Mental Computation Anxiety
Data were analyzed using descriptive statistics and inferential statistics. The one-
way analysis of variance (ANOVA) was the inferential statistics used to determine

92
whether there are any statistically significant differences among three groups of
independent variables. To evaluate the assumptions, Levene’s test and normality
checks were carried out and the assumptions of normality and homogeneity of variance
were met. Levene’s test showed the variances are equal in all three variables: Attitude
towards mathematics (F (2, 47) = 0.603, p = 0.551), Attitudes towards mental and
written computation (F (2, 47) = 2.112, p= 0.132 and F (2, 47) = 1.107, p= 0.339
respectively), and Mental computation anxiety (F (2, 47) = 0.921, p = 0.405).
Table 15
Pre-Attitudinal Survey Mean Scores of Attitudes towards Mathematics
Groups N Mean SD F-value df p-value η2
DT 14 133. 57 15.55 .994 2 .378 0.04
OA 16 142.00 32.36
Control 20 134.35 18.46
Total 50 136.58 18.71
Note. η2 (eta squared): effect size
Regarding attitudes towards mathematics, as shown in Table 15, the results
indicated that the mean score for the DT group was 133.57 with a standard deviation of
15.55 and that of the OA group was 142.00 with a standard deviation of 32.36, while
that of the control group was 134.35 with a standard deviation of 18.46. The results
indicated that the mean difference of pre-attitudinal survey scores of the two
experimental groups and the control group was not significant, F (2, 48) = 0.994, p =
.378, η2=0.04. Also, the effect size (Cohen, 1988) between two variables were very
small. This, therefore, means that the two experimental groups and the control group
were at the same level of positive attitudes towards mathematics.
With respect to the attitudes towards mental and written computation, as
indicated in Table 16, an analysis of variance showed the mean scores for the
experimental and control groups.
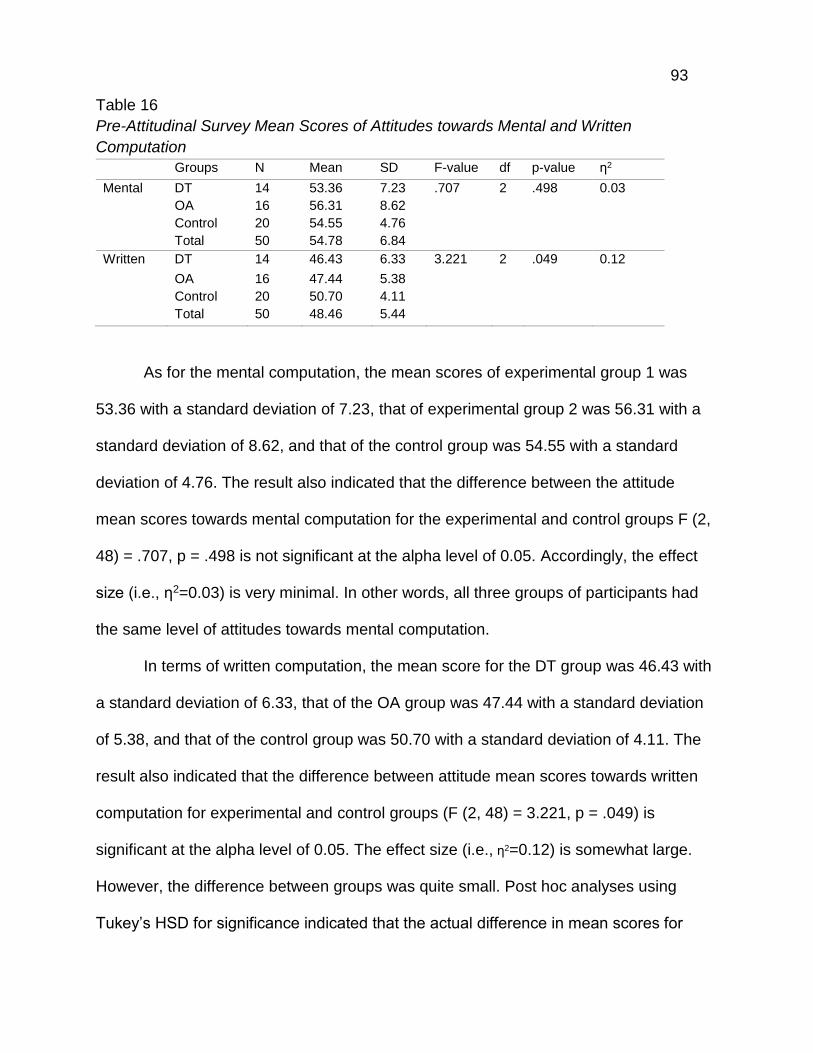
93
Table 16
Pre-Attitudinal Survey Mean Scores of Attitudes towards Mental and Written
Computation
Groups N Mean SD F-value df p-value η2
Mental DT 14 53.36 7.23 .707 2 .498 0.03
OA 16 56.31 8.62
Control 20 54.55 4.76
Total 50 54.78 6.84
Written DT 14 46.43 6.33 3.221 2 .049 0.12
OA 16 47.44 5.38
Control 20 50.70 4.11
Total 50 48.46 5.44
As for the mental computation, the mean scores of experimental group 1 was
53.36 with a standard deviation of 7.23, that of experimental group 2 was 56.31 with a
standard deviation of 8.62, and that of the control group was 54.55 with a standard
deviation of 4.76. The result also indicated that the difference between the attitude
mean scores towards mental computation for the experimental and control groups F (2,
48) = .707, p = .498 is not significant at the alpha level of 0.05. Accordingly, the effect
size (i.e., η2=0.03) is very minimal. In other words, all three groups of participants had
the same level of attitudes towards mental computation.
In terms of written computation, the mean score for the DT group was 46.43 with
a standard deviation of 6.33, that of the OA group was 47.44 with a standard deviation
of 5.38, and that of the control group was 50.70 with a standard deviation of 4.11. The
result also indicated that the difference between attitude mean scores towards written
computation for experimental and control groups (F (2, 48) = 3.221, p = .049) is
significant at the alpha level of 0.05. The effect size (i.e., η2=0.12) is somewhat large.
However, the difference between groups was quite small. Post hoc analyses using
Tukey’s HSD for significance indicated that the actual difference in mean scores for
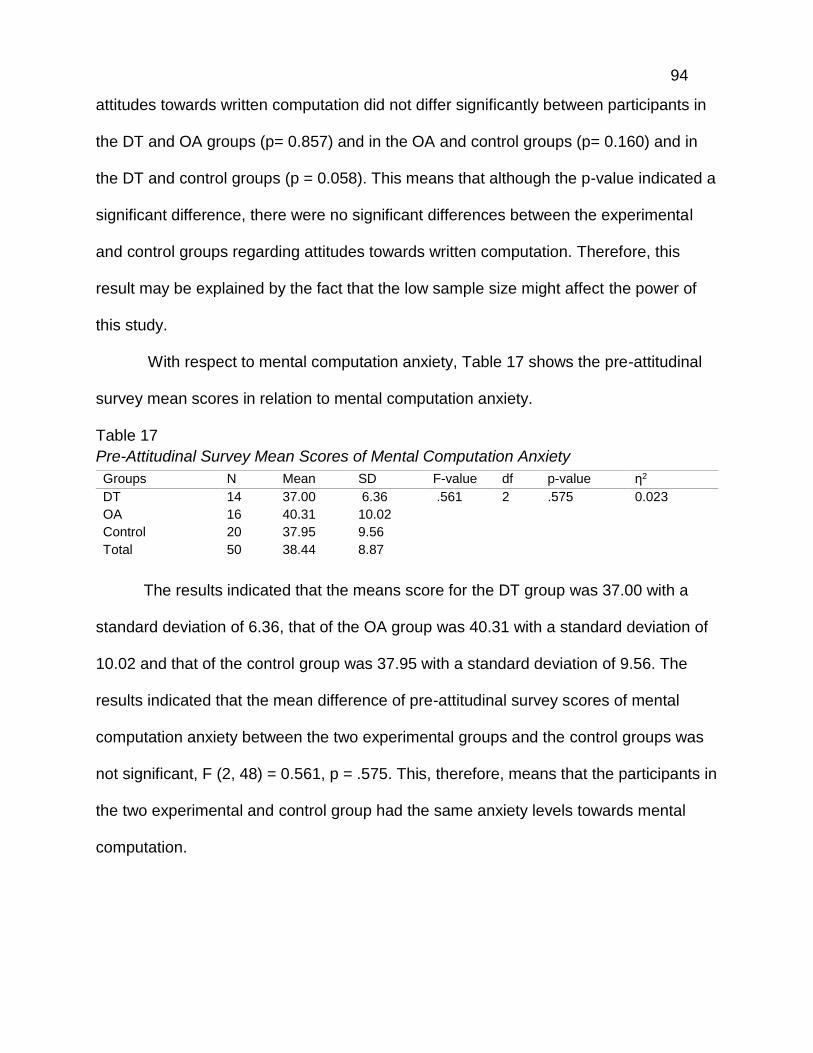
94
attitudes towards written computation did not differ significantly between participants in
the DT and OA groups (p= 0.857) and in the OA and control groups (p= 0.160) and in
the DT and control groups (p = 0.058). This means that although the p-value indicated a
significant difference, there were no significant differences between the experimental
and control groups regarding attitudes towards written computation. Therefore, this
result may be explained by the fact that the low sample size might affect the power of
this study.
With respect to mental computation anxiety, Table 17 shows the pre-attitudinal
survey mean scores in relation to mental computation anxiety.
Table 17
Pre-Attitudinal Survey Mean Scores of Mental Computation Anxiety
The results indicated that the means score for the DT group was 37.00 with a
standard deviation of 6.36, that of the OA group was 40.31 with a standard deviation of
10.02 and that of the control group was 37.95 with a standard deviation of 9.56. The
results indicated that the mean difference of pre-attitudinal survey scores of mental
computation anxiety between the two experimental groups and the control groups was
not significant, F (2, 48) = 0.561, p = .575. This, therefore, means that the participants in
the two experimental and control group had the same anxiety levels towards mental
computation.
Groups N Mean SD F-value df p-value η2
DT 14 37.00 6.36 .561 2 .575 0.023
OA 16 40.31 10.02
Control 20 37.95 9.56
Total 50 38.44 8.87

95
The Comparison of Pre-and Post-Attitudinal Survey
The purpose of this section is to see whether there are any changes in the PTS’
attitudes towards mental and written computation and mental computation anxiety after
the intervention. The participants in the control group did not take the post-attitudinal
survey because there was no intervention involved. In total, for the experimental
groups, there were 30 responses to the pre-survey and 26 responses to the post-
survey; however, there were only 26 matches – participants who responded to both the
pre- and post-survey. Four students were dropped out of Course A. Data were analyzed
using descriptive statistics.
Tables 18, 19, 20, and 21 show the post-attitudinal survey mean scores of
mental and written computation and mental computation anxiety, respectively.
Mean Changes in Attitudes towards Mental and Written Computation. Data
were analyzed using descriptive statistics. The dependent variable is the total score of
the surveys on mental and written computation.
Table 18
Descriptive Data for Differences towards Mental and Written Computation
Minimum
Raw Score
Maximum
Raw Score
Mean* Standard*
Deviation
N
Pre-MAS Total 71 129 103.24 10.11 50
Mental 32 71 54.78 6.84
Written 32 60 48.46 5.44
Post-MAS Total 70 115 104.85 9.29 27
Mental 33 74 58.70 8.70
Written 20 56 46.15 9.17
Note. MAS: Mathematics Attitudinal Survey, * Rounded to nearest hundredth
Changes in the mean score of attitude can be examined visually as indicated by
Table 18. As for the pre-MAS, the minimum score for the pre-attitudinal survey was 71,
with a maximum score of 129, out of a possible 150, indicating a rather wide range of
attitudes at the beginning of the course. The mean pre-MAS score was 103.24 (SD
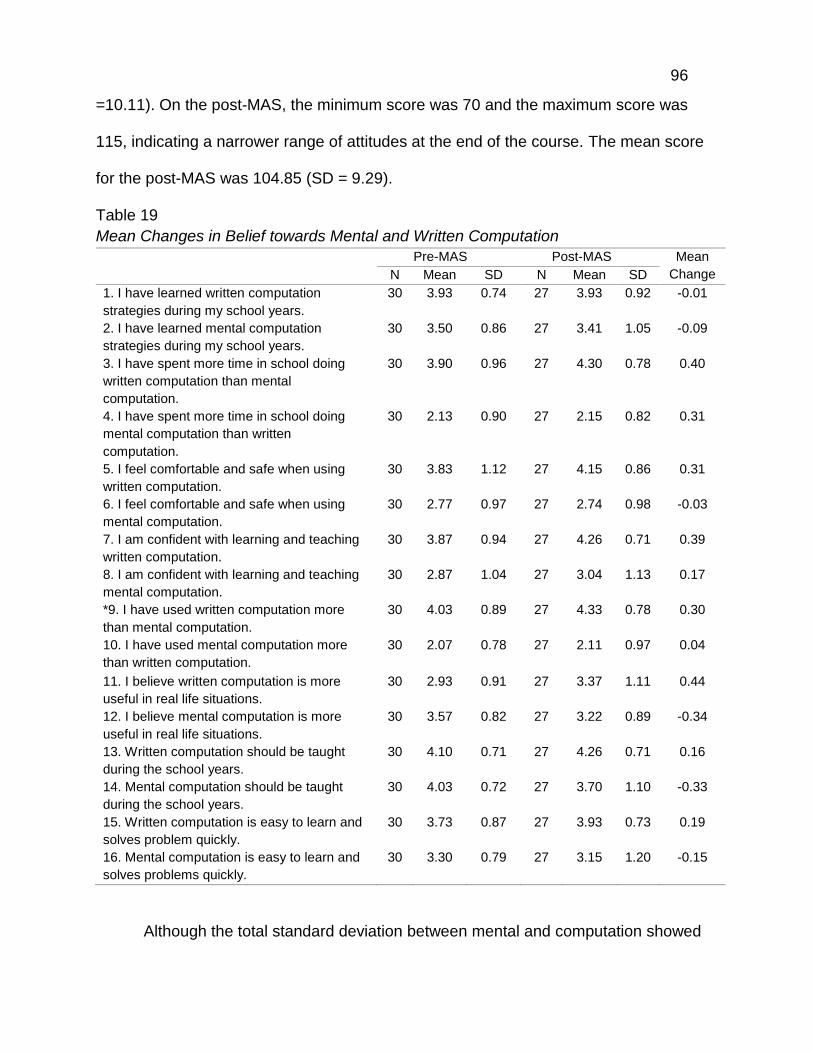
96
=10.11). On the post-MAS, the minimum score was 70 and the maximum score was
115, indicating a narrower range of attitudes at the end of the course. The mean score
for the post-MAS was 104.85 (SD = 9.29).
Table 19
Mean Changes in Belief towards Mental and Written Computation
Pre-MAS Post-MAS Mean
Change N Mean SD N Mean SD
1. I have learned written computation
strategies during my school years.
30 3.93 0.74 27 3.93 0.92 -0.01
2. I have learned mental computation
strategies during my school years.
30 3.50 0.86 27 3.41 1.05 -0.09
3. I have spent more time in school doing
written computation than mental
computation.
30 3.90 0.96 27 4.30 0.78 0.40
4. I have spent more time in school doing
mental computation than written
computation.
30 2.13 0.90 27 2.15 0.82 0.31
5. I feel comfortable and safe when using
written computation.
30 3.83 1.12 27 4.15 0.86 0.31
6. I feel comfortable and safe when using
mental computation.
30 2.77 0.97 27 2.74 0.98 -0.03
7. I am confident with learning and teaching
written computation.
30 3.87 0.94 27 4.26 0.71 0.39
8. I am confident with learning and teaching
mental computation.
30 2.87 1.04 27 3.04 1.13 0.17
*9. I have used written computation more
than mental computation.
30 4.03 0.89 27 4.33 0.78 0.30
10. I have used mental computation more
than written computation.
30 2.07 0.78 27 2.11 0.97 0.04
11. I believe written computation is more
useful in real life situations.
30 2.93 0.91 27 3.37 1.11 0.44
12. I believe mental computation is more
useful in real life situations.
30 3.57 0.82 27 3.22 0.89 -0.34
13. Written computation should be taught
during the school years.
30 4.10 0.71 27 4.26 0.71 0.16
14. Mental computation should be taught
during the school years.
30 4.03 0.72 27 3.70 1.10 -0.33
15. Written computation is easy to learn and
solves problem quickly.
30 3.73 0.87 27 3.93 0.73 0.19
16. Mental computation is easy to learn and
solves problems quickly.
30 3.30 0.79 27 3.15 1.20 -0.15
Although the total standard deviation between mental and computation showed

97
not much difference, the difference towards written computation between pre-and post-
MAS showed a wide range of scores on attitudes. It could be interpreted that PTS’s
attitudes towards written computations were changed.
Tables 19 and 20 show the mean score changes of the two experimental groups
regarding mental and written computation. To obtain the average, the score of each
person was computed and then average it for each item. As for the mean changes in
belief towards mental and written computation as shown in Table 19, there were
negative and positive changes between the pre and post surveys on a belief about
mental and written computation. In the researcher’s analysis, the positive changes are
mostly related to written computation. The greatest positive mean change between pre
and post was 0.44: “I believe written computation is more useful in real life situations.”
This was followed with: “I have spent more time in school doing written computation
than mental computation.” (Mean Changes (MC) = 0.40); and “I am confident with
learning and teaching written computation (MC = 0.39).
The negative changes were mostly connected to the mental computation. There
were two negative changes that were greater than 0.25. First, “I believe mental
computation is more useful in real life situations” decreased with a mean change of 0.34
between the pre and post surveys. Second, with a negative mean change of 0.33 was:
“Mental computation should be taught during the school years.”
There were also negative and positive changes between the pre- and post-
surveys on instruction in mental and written computation as shown in Table 20. The
positive changes were mostly found in written computation: “Written computation should
be introduced first when teaching mathematics” (MC = 0.34). There was also positive

98
increases indicating that “I think I will use written computation more when I teach
students (MC = 0.32)”. Also, survey results showed that “students who are highly skilled
in written computation develop problem-solving skills (MC = 0.25).”
Table 20
Mean Changes in Instruction towards Mental and Written Computation
Pre-MAS Post-MAS Mean Change N Mean SD N Mean SD
17. I think I will use written computation more when I teach students.
30 3.53 0.82 27 3.85 0.91 0.32
18. I think I will use mental computation more when I teach students.
30 2.97 0.85 27 2.85 1.06 -0.11
*19. Students can be successful mathematics learners by teaching only written computation.
30 2.48 0.78 27 2.70 1.10 0.22
20. Students can be successful mathematics learners by teaching only mental computation.
30 2.43 0.73 27 2.22 0.75 -0.21
21. Written computation should be introduced first when teaching mathematics.
30 3.73 0.91 27 4.07 0.87 0.34
22. Mental computation should be introduced first when teaching mathematics.
30 2.80 1.00 27 2.70 1.17 -0.10
*23. Teaching written computation can build students’ mathematical procedural knowledge and understanding.
30 4.00 0.53 27 4.22 0.42 0.22
24. Teaching mental computation can build students’ mathematics procedural knowledge and understanding.
30 3.70 0.84 27 3.70 0.91 0.00
25. Written computation should be taught to learn advanced mathematics.
30 3.73 0.83 27 3.96 0.90 0.23
26. Mental computation should be taught to learn advanced mathematics.
30 3.40 0.89 27 3.33 1.00 -0.07
27. Students can develop their natural thinking ability through learning written computation.
30 3.73 0.74 27 3.81 0.74 0.08
28. Students can develop their natural thinking ability through learning mental computation.
30 3.83 0.59 27 3.78 0.89 -0.06
29. Students who are highly skilled in written computation develop problem solving skills.
30 3.60 0.77 27 3.85 0.77 0.25
30. Students who are highly skilled in mental computation develop problem solving skills.
30 3.60 0.77 27 3.74 0.66 0.14
The surveys’ negative changes mostly related to the mental computation. The
greatest negative change in means between pre and post was - 0.21: “Students can be
successful mathematics learners by teaching only mental computation.” This was
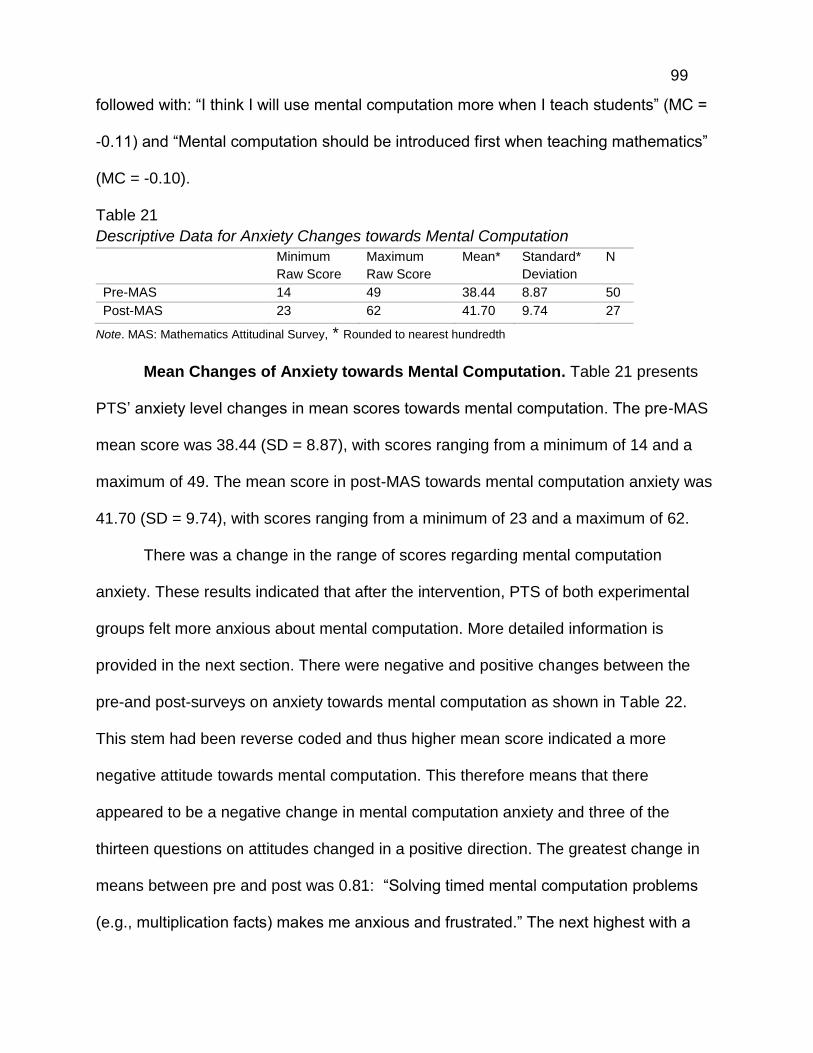
99
followed with: “I think I will use mental computation more when I teach students” (MC =
-0.11) and “Mental computation should be introduced first when teaching mathematics”
(MC = -0.10).
Table 21
Descriptive Data for Anxiety Changes towards Mental Computation
Minimum
Raw Score
Maximum
Raw Score
Mean* Standard*
Deviation
N
Pre-MAS 14 49 38.44 8.87 50
Post-MAS 23 62 41.70 9.74 27
Note. MAS: Mathematics Attitudinal Survey, * Rounded to nearest hundredth
Mean Changes of Anxiety towards Mental Computation. Table 21 presents
PTS’ anxiety level changes in mean scores towards mental computation. The pre-MAS
mean score was 38.44 (SD = 8.87), with scores ranging from a minimum of 14 and a
maximum of 49. The mean score in post-MAS towards mental computation anxiety was
41.70 (SD = 9.74), with scores ranging from a minimum of 23 and a maximum of 62.
There was a change in the range of scores regarding mental computation
anxiety. These results indicated that after the intervention, PTS of both experimental
groups felt more anxious about mental computation. More detailed information is
provided in the next section. There were negative and positive changes between the
pre-and post-surveys on anxiety towards mental computation as shown in Table 22.
This stem had been reverse coded and thus higher mean score indicated a more
negative attitude towards mental computation. This therefore means that there
appeared to be a negative change in mental computation anxiety and three of the
thirteen questions on attitudes changed in a positive direction. The greatest change in
means between pre and post was 0.81: “Solving timed mental computation problems
(e.g., multiplication facts) makes me anxious and frustrated.” The next highest with a

100
mean change of .71 was: “I feel much confident solving mental computation problems
vertically (e.g., ) rather than horizontally (e.g., 14 + 3).” There was one positive
change that was greater than 0.25, “I always feel a need to use a calculator when doing
computation mentally” decreased with a mean change of 0.35 between the pre-and
post- surveys. This was followed with: “Solving computation problems without using a
calculator makes me uneasy and uncomfortable” (MC = -0.17).
Table 22
Mean Changes in Mental and Written Computation
Pre-MAS Post-MAS Mean
Change N Mean SD N Mean SD
1. Calculating a discount price mentally during shopping makes me nervous and uneasy.
30 3.43 1.17 27 3.59 1.05 0.16
2. I rarely compute a cash register receipt to see if the price is appropriately calculated.
30 3.20 1.16 27 3.11 1.05 -0.09
3. Solving computation problems without using a calculator makes me uneasy and uncomfortable.
30 3.43 1.07 27 3.26 0.98 -0.17
4. I rarely check the reasonableness of written computation problems mentally after finding the answer.
30 2.83 1.09 27 3.22 1.15 0.39
5. Solving timed mental computation problems (e.g., multiplication facts) makes me anxious and frustrated.
30 3.00 1.23 27 3.81 1.14 0.81
6. I feel much confident solving mental
computation problems vertically (e.g., ) rather than horizontally (e.g., 14 + 3).
30 3.10 1.03 27 3.81 1.08 0.71
7. I am not ready to study for a mental computation test.
30 2.70 0.92 27 2.96 1.02 0.26
8. I am not interested in learning mental computation strategies.
30 2.13 0.68 27 2.48 1.01 0.35
9. Computing mental mathematics problems causes me to have more anxiety.
30 3.23 1.10 27 3.52 1.05 0.29
10. Solving mathematics problems mentally is totally painful to me.
30 2.70 0.88 27 3.00 1.24 0.30
11. Now, I do not feel confident in doing calculations mentally.
30 2.80 0.89 27 2.81 1.08 0.01
12. I always feel anxiety when finding answers mentally.
30 3.00 0.98 27 3.26 1.20 0.26
13. I always feel a need to use a calculator when doing computation mentally.
30 3.20 1.06 27 2.85 1.26 -0.35

101
Correlation between MCT Performance and Attitudes
In the second research question, the researcher asked whether there is a
significant correlation between PTS’ mental computation performance and their
attitudes towards mathematics, written and mental computations, and mental
computation anxiety. The purpose of this research question was to explore the
relationship between the mathematics attitude survey (MAS) clustered to three
variables; mathematics attitudes, attitudes towards mental and written computation,
mental computation anxiety, compared to their mental computation performance in the
PTS’ test scores. Specifically, the researcher examined the relationship between
mathematics attitudes, attitudes towards mental and written computation, mental
computation anxiety on their mental computation test scores. To report the results,
inferential statistics were used. The Pearson correlation coefficient (r) was obtained to
measure the degree of linear relationship between the three different variables and was
used in order to determine whether there was a relationship between PTS’ mathematics
attitudes and their MCT performance; and attitudes towards mental and written
computation and their MCT performance; and mental computation anxiety and their
MCT performance.
This correlation coefficient (r) was used to compare the relationship between the
pre-attitudinal survey and pre-MCT and the post-attitudinal survey and post-MCT. This
is a rather disappointing result. No significant relation was found between the pre-MCT
and MAS. The results of the correlational analysis between pre-MCT performance and
attitudes towards mathematics revealed there was no significant relationship between
those variables (r (48) = 0.12, p > 0.05). Also, the correlation between pre-MCT and
102
attitudes towards mental and written computation was insignificant (r (48) =0.030, p >
0.05). Pearson correlation regarding the relationship between PTS’ performance and
mental computation anxiety indicated that there is a negative correlation between the
variables, and the correlation was insignificant (r (48) = -0.009, p > 0.05).
Accordingly, the results of the correlational analysis between PTS’ post-MCT and
MAS can be compared. The results of the correlational analysis between post-MCT
performance and attitudes towards mental and written computation revealed that there
was no relationship between PTS’ post-MCT performance and attitudes towards mental
and written computation (r (25) = -0.031, p > 0.05). The results of the correlational
analysis between post-MCT performance and mental computation anxiety showed a
negative relationship, but no significant correlation was found (r (25) = -0.029, p > 0.05).
Mental Computation Performance
In this section, the third research question, “Are there significant differences in
mental computation performance between the experimental groups and the control
groups before and after instruction?” was examined.
To investigate this research question, first data were analyzed using descriptive
statistics and inferential statistics to find out if there were significant differences in
mental computation performance among the three groups with different instruction (e.g.,
DT, OA, and Control). Then, in order to identify the difficulty levels for mental
computation problems for each operation, items were ordered by percentages of PTS
answering each item correctly (problems presented vertically were eliminated). Next,
significant differences among instructional types (e.g., DT, OA, and control) for each
operation were analyzed. Finally, the effect of mode of presentation was identified using

103
a paired-sample t-test.
Comparison of Pre-and Post-MCT Performance with Three Different
Instruction. Table 23 presents an overview of the descriptive statistics for pre-and post-
MCT scores. The mean difference in the pre-MCT scores was not significant, F (2, 47) =
1.23, p=.301 among three groups.
Table 23
Overall Descriptive Statistics Comparison between Experimental Groups and the
Control Group on the Pre-and Post-MCT
TEST DT OA Control
N M SD N M SD N M SD
Pre-MCT 14 27.86 14.57 16 32.38 16.05 20 35.80 14.21
Post-MCT 12 40.08 14.00 15 44.60 18.82 14 34.21 14.44
Improvement 12 9.50 5.58 15 11.87 6.85 14 -3.27 7.62
Note. DT= Direct Teaching, OA= Open Approach
In the pre-MCT test, the DT group had the lowest means (M= 27.86, SD= 14.57)
among three groups. This was followed by the OA group (M=32.38, SD=16.05) and
control group (M=35.80, SD=14.21). However, after the intervention, the OA group
which was instructed by using the open-approach had higher means (M= 44.60,
SD=18.82) than other groups (DT: M= 40.08, SD=14.00, Control: M= 34.21, SD= 14.44,
respectively) on their post-MCT scores. As indicated in Table 23, the OA group
improved the most (M=11.87, SD=6.85), then followed by the DT group (M=9.50,
SD=5.58). Scores did not improve for the PTS in the control group (M=-3.27, D=7.62).
As for the inferential statistics, a one-way ANCOVA was conducted. The
independent variable, type of instruction, included three different instruction
approaches: Direct Teaching (DT), Open Approach (OA) and control group. The
dependent variable was PTS’ post-MCT scores and the covariate was PTS’ pre-MCT
scores. Levene’s test and normality checks were carried out and the assumptions of

104
normality and homogeneity of variance were met. The result of the Levene’s test
showed the variances are equal, F (2, 38) = 0.207, p = 0.814. Also, a preliminary
analysis evaluating the homogeneity-of-regression (slopes) assumption indicated that
the relationship between the covariate and the dependent variable did not differ
significantly as a function of the independent variable, F(2, 35) = 1.401, p = .260. Table
24 shows one-way ANCOVA results and descriptive statistics for post-MCT
performance by instructional type and pre-MCT scores.
Table 24
ANCOVA Results and Descriptive Statistics for Post-MCT by Instructional Condition and
Pre-MCT Scores
Type of Groups
Mathematics Scores
Observed
Mean
Adjusted
Mean SD
N
DT 40.08 42.79 14.00 12
OA 44.60 45.29 18.81 15
Control 34.21 31.16 13.50 14
Source SS df MS F P ηp2
Instruction 1570.92 2 785.46 17.52* 0.001 .486
Error 1659.29 37 44.85
Note. R2 = .84, Adj. R2 = .83, adjustments based on Pre-MCT mean = 39.75. Homogeneity of regression tested and
not significant: F = 1.40, p>.05. Pre-MCT regression coefficient = 0.88*. * p < .05
The results showed that there was a statistically significant difference F (2, 37) =
17.52, p < .05, at the .05 level, in post-MCT scores between the different instructional
groups, when adjusted for pre-MCT scores. Accordingly, both the observed and
adjusted means showed that PTS with OA group performed better than the PTS with
DT group. The PTS in control group performed worst (See Table 24). Thus, the greater
PTS’ pre-MCT scores, the greater is their post-MCT scores. Follow-up tests were
conducted to evaluate pairwise differences among the adjusted means for different
instruction type.

105
Table 25
Multiple Comparisons and Mean Differences in Post-MCT Scores by Instruction Type
Controlling for Pre-MCT Scores
Comparison Mean Difference Standard Error of
Difference
Bonferroni Adjusted
95% CI
DT vs. OA -2.49 2.60 -9.01, 4.02
DT vs. Control 11.64* 2.67 4.94, 18.33
OA vs. Control 14.13* 2.51 7.85, 20.41
Note. Comparisons based on ANCOVA adjusted means controlling for Pre-MCT mean scores of 39.75. DT=direct
teaching OA=open approach. * p <.05, where p-values are adjusted using the Bonferroni method.
As indicated by Table 25, multiple comparisons showed that there was a
significant difference between the DT and control groups (p < 0.01) and the OA and
control (p < 0.01) groups. However, the DT and OA groups did not significantly differ (p
=1.00) on their post-MCT scores.
Figure 9. Scatter plot of pre-and post-MCT scores with regression slopes and predicted means
Accordingly, Figure 9 provides a visual display of these results. Pretest and
posttest scores from PTS in each group showed a strong, positive association. PTS in
Adjusted means
Group 1 (DT) Group 2 (OA) Group 3 (Control) Group 1 Group 2 Group 3
45.29
42.79
31.16
39.75

106
the DT and OA groups who performed poorly on the pretest tended to perform poorly on
the posttest, and those who performed well on the pretest tended to perform well on the
posttest. PTS in the control group demonstrated the similar pattern of results.
Comparison of Pre-and Post-MCT Performance for Each Operation. In order
to examine what operation has a marked difference for each group, Table 26
summarizes the comparison of three different groups with different instruction for each
operation between pre-and post-MCT scores and provides mean scores and standard
deviations for each group and each operation. The F values and effect sizes are also
given. The partial Eta Squared (ηp2) indicates the effect size (i.e., 0.01– small effect, 0.06
– moderate effect, 0.15 – large effect).
Table 26
Comparison of Type of Instruction for Each Operation between Pre-and Post-MCT
scores using ANCOVA
Operation Test DT OA Control F ηp2 p-value
M SD M SD M SD
Additions Pre 74.40 33.95 66.40 30.62 79.00 20.74 .73 .12 .642
Post 86.80 12.60 88.00 8.63 84.40 11.11
Subtractions Pre 61.60 29.59 65.20 20.07 76.00 12.94 2.57 .32 .235
Post 80.00 19.22 73.40 8.17 65.60 26.71
Multiplications Pre 15.00 19.40 18.78 21.27 23.89 21.33 8.48* .43 .002
Post 38.89 25.97 39.33 17.44 22.11 13.68
Divisions Pre 26.57 30.95 40.29 32.12 37.86 32.00 .17 .02 .848
Post 49.00 24.33 57.14 23.23 50.00 21.50
Integers Pre 36.00 9.90 56.50 9.19 42.50 10.61 .80 .44 .556
Post 45.50 17.68 63.00 14.14 46.50 14.85
Fractions Pre 28.63 14.43 45.50 20.07 41.88 15.80 4.66* .32 .022
Post 46.75 17.38 65.75 14.00 39.25 19.03
Decimals Pre 48.00 23.36 56.30 25.11 57.00 19.18 5.88* .31 .008
Post 67.50 18.63 76.80 13.05 52.90 22.42
Percents Pre 26.00 24.62 28.33 32.10 35.00 28.28 .98 .40 .401
Post 32.00 27.66 45.50 20.71 32.00 24.24
Note. ηp2 means Partial Eta-Squared. * p < .05
This table also provides the instructional type differences between experimental

107
and control groups for addition (5 items), subtraction (5 items), multiplication (9 items),
division (7 items), integers (2 items), fractions (8 items), decimals (10 items), and
percents (6 items). A one-way ANCOVA was conducted on the post-MCT performance,
with type of instruction (DT, OA, and Control) as a between-subjects factor and pre-
MCT scores as covariates to control for pre-MCT score differences among the groups.
There were significant differences between pre-and post-MCT performance
among three groups in solving multiplication, fraction, and decimal operations. More
specifically, the one-way ANCOVA for mental multiplication performance was
significant, F (2, 23) = 8.48, p = .002, ηp2 = 0.43. The effect size (ηp
2) = 0.43 is quite
large. The pairwise comparisons revealed that there were significant differences
between the DT and control groups (p = .003) and between the OA and control groups
(p = .007). The one-way ANCOVA for mental fractions was also significant, F (2, 20) =
4.66, p = .022, ηp2 = 0.32. The effect size (ηp
2 = 0.32) is still large. The pairwise
comparisons indicated that there was a significant difference between the OA and
control groups (p=0.006). Additionally, the ANCOVA for mental decimals, F (2, 26) =
5.88, p = .008, ηp2 = 0.31 showed a significant result and large effect size. The pairwise
comparisons showed that there were significant differences between the DT and control
groups (p= 0.026) and between the OA and control groups (p= 0.023). A significant
difference between the DT and OA groups was not present for the pairwise
comparisons. However, these results need to be interpreted with caution because some
operations including subtractions (ηp2 = 0.32), integers (ηp
2 = 0.44), and percents (ηp2 =
0.40) indicated larger effect size as well. Therefore, power analysis should be
conducted to determine minimal sample size required for this study in the future.
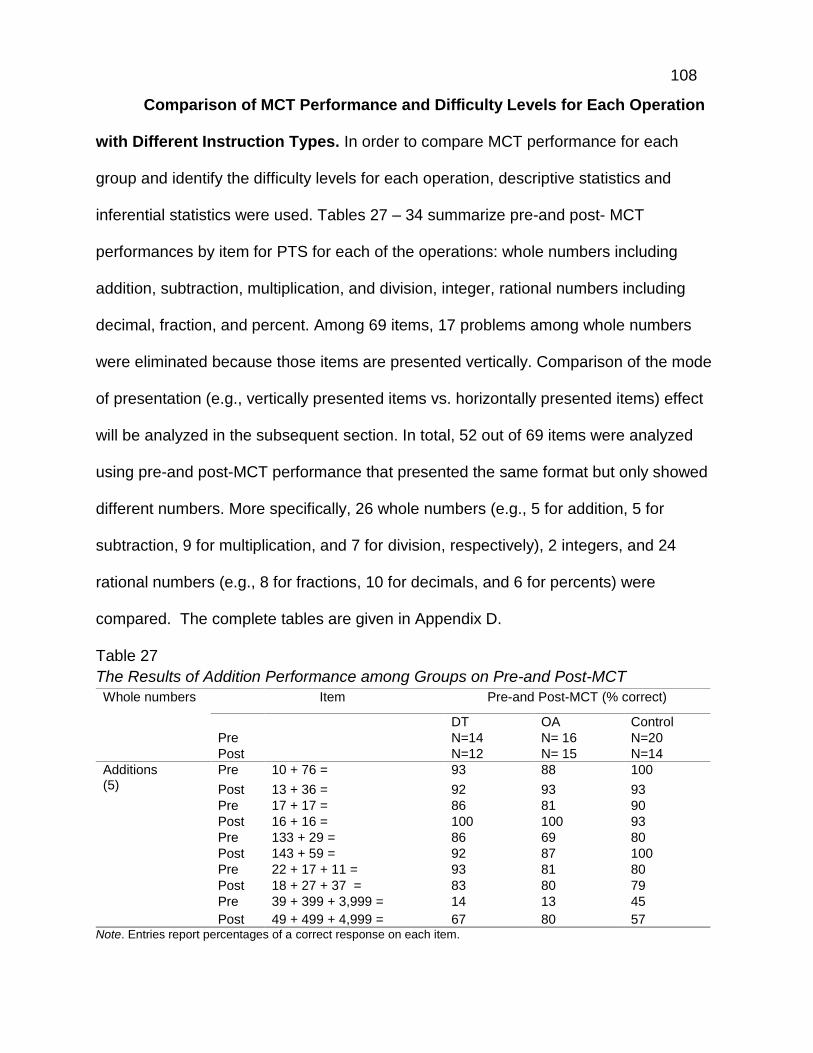
108
Comparison of MCT Performance and Difficulty Levels for Each Operation
with Different Instruction Types. In order to compare MCT performance for each
group and identify the difficulty levels for each operation, descriptive statistics and
inferential statistics were used. Tables 27 – 34 summarize pre-and post- MCT
performances by item for PTS for each of the operations: whole numbers including
addition, subtraction, multiplication, and division, integer, rational numbers including
decimal, fraction, and percent. Among 69 items, 17 problems among whole numbers
were eliminated because those items are presented vertically. Comparison of the mode
of presentation (e.g., vertically presented items vs. horizontally presented items) effect
will be analyzed in the subsequent section. In total, 52 out of 69 items were analyzed
using pre-and post-MCT performance that presented the same format but only showed
different numbers. More specifically, 26 whole numbers (e.g., 5 for addition, 5 for
subtraction, 9 for multiplication, and 7 for division, respectively), 2 integers, and 24
rational numbers (e.g., 8 for fractions, 10 for decimals, and 6 for percents) were
compared. The complete tables are given in Appendix D.
Table 27
The Results of Addition Performance among Groups on Pre-and Post-MCT
Whole numbers Item Pre-and Post-MCT (% correct)
DT OA Control
Pre N=14 N= 16 N=20
Post N=12 N= 15 N=14
Additions (5)
Pre 10 + 76 = 93 88 100
Post 13 + 36 = 92 93 93
Pre 17 + 17 = 86 81 90
Post 16 + 16 = 100 100 93
Pre 133 + 29 = 86 69 80
Post 143 + 59 = 92 87 100
Pre 22 + 17 + 11 = 93 81 80
Post 18 + 27 + 37 = 83 80 79
Pre 39 + 399 + 3,999 = 14 13 45
Post 49 + 499 + 4,999 = 67 80 57 Note. Entries report percentages of a correct response on each item.

109
For the majority of addition items, PTS performed better in post-MCT than in the
pre-MCT for both DT and OA groups, as shown in Table 27. The most notable
exception was the item 22 + 17 + 11 shown by the pre-MCT. The addition item 18 + 27
+ 37 showed no improvement for all groups in the post-MCT. Additionally, it is notable
that almost all addition items showed above 75 % between pre- and post- MCT
performance except for one item (e.g., 39 + 399 + 3,999). Participants performed worst
in solving the item 39 + 399 + 3,999: 14 % correct for the DT group, 13 % correct for the
OA group, and 45% correct for the control group in their pre-MCT, however, they
showed much improvement: 67% correct for the DT group, 80% correct for the OA
group, and 57% for the control group in their post-MCT.
Table 28
The Results of Subtraction Performance among Groups on Pre-and Post-MCT
Whole numbers Item Pre-and Post-MCT (% correct)
DT OA Control
Pre N=14 N= 16 N=20
Post N=12 N= 15 N=14
Subtractions (5) Pre 28 – 4 = 100 94 95
Post 36 – 8 = 100 87 86
Pre 85 – 38 = 29 50 60
Post 95 – 37 = 67 73 86
Pre 95 – 13 – 5 = 79 75 80
Post 123 – 7 – 13 = 100 73 64
Pre 63 – (13 + 3) = 64 63 75
Post 83 – (14 + 3) = 75 67 71
Pre 607 – 299 = 36 44 70
Post 807 – 399 = 58 67 21
Note. Entries report percentages of a correct response on each item.
For the majority of subtraction items, PTS performed better in post-MCT than in
the pre-MCT for the DT and OA groups (See Table 28). There were slightly lower
correct percentages on their post-MCT for the control groups on the items like 36 – 8,
123 – 7 – 13, and 83 – (14 + 3). However, there was a huge difference in the items, like
607 – 299 (70% correct) and 807 – 399 (21% correct). The notably improved items for
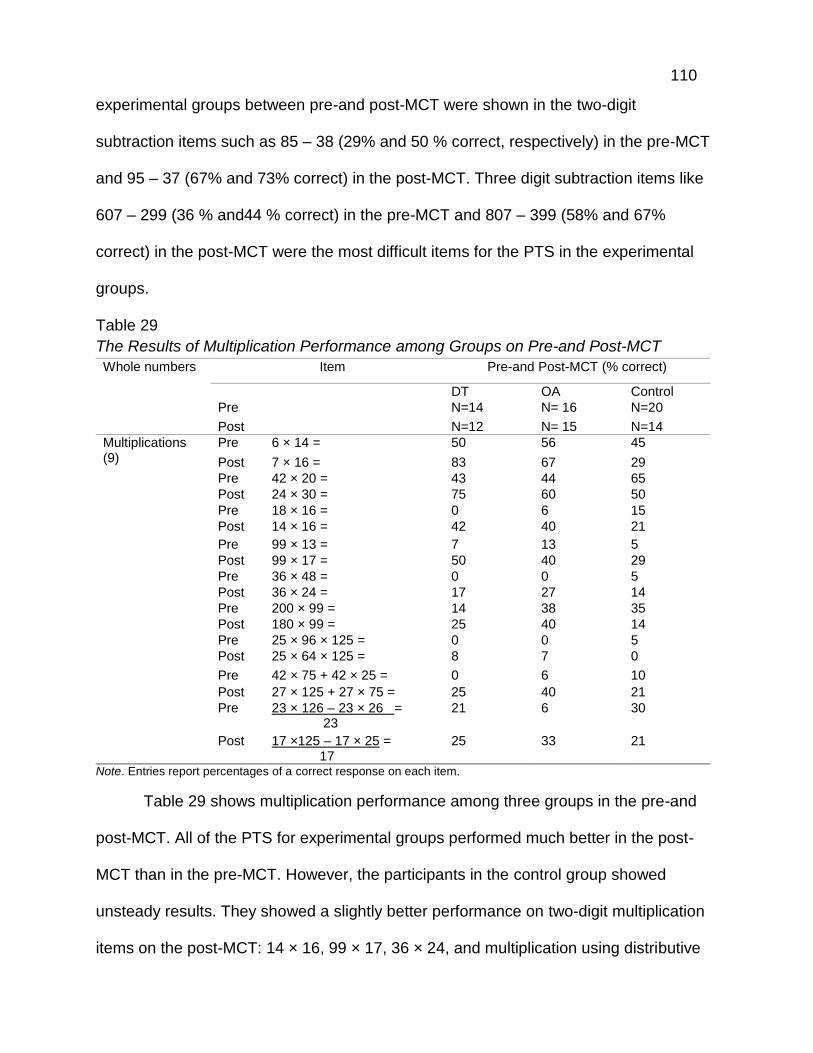
110
experimental groups between pre-and post-MCT were shown in the two-digit
subtraction items such as 85 – 38 (29% and 50 % correct, respectively) in the pre-MCT
and 95 – 37 (67% and 73% correct) in the post-MCT. Three digit subtraction items like
607 – 299 (36 % and44 % correct) in the pre-MCT and 807 – 399 (58% and 67%
correct) in the post-MCT were the most difficult items for the PTS in the experimental
groups.
Table 29
The Results of Multiplication Performance among Groups on Pre-and Post-MCT
Whole numbers Item Pre-and Post-MCT (% correct)
DT OA Control
Pre N=14 N= 16 N=20
Post N=12 N= 15 N=14
Multiplications (9)
Pre 6 × 14 = 50 56 45
Post 7 × 16 = 83 67 29
Pre 42 × 20 = 43 44 65
Post 24 × 30 = 75 60 50
Pre 18 × 16 = 0 6 15
Post 14 × 16 = 42 40 21
Pre 99 × 13 = 7 13 5
Post 99 × 17 = 50 40 29
Pre 36 × 48 = 0 0 5
Post 36 × 24 = 17 27 14
Pre 200 × 99 = 14 38 35
Post 180 × 99 = 25 40 14
Pre 25 × 96 × 125 = 0 0 5
Post 25 × 64 × 125 = 8 7 0
Pre 42 × 75 + 42 × 25 = 0 6 10
Post 27 × 125 + 27 × 75 = 25 40 21
Pre 23 × 126 – 23 × 26 = 23
21 6 30
Post 17 ×125 – 17 × 25 = 17
25 33 21
Note. Entries report percentages of a correct response on each item.
Table 29 shows multiplication performance among three groups in the pre-and
post-MCT. All of the PTS for experimental groups performed much better in the post-
MCT than in the pre-MCT. However, the participants in the control group showed
unsteady results. They showed a slightly better performance on two-digit multiplication
items on the post-MCT: 14 × 16, 99 × 17, 36 × 24, and multiplication using distributive

111
property item 27 × 125 + 27 × 75, while in items like 7 × 16, 24 × 30, 180 × 99,
participants showed worse performance on their post-MCT. As shown in Table 29, the
most difficult of the multiplication items was 25 × 96 × 125 (0 %, 0%, and 5 % correct) in
the pre-MCT and 25 × 64 × 125 (8%, 7%, and 0% correct) in the post-MCT. This was
followed by the item 36 × 48 (0%, 0%, and 5 % correct) in the pre-MCT and 36 × 24 (17
%, 27 %, and 14 % correct) in their post-MCT and the item 42 × 75 + 42 × 25 (0%, 6%
and 10% correct) in the pre-MCT and 27 × 125 + 27 × 75 (25%, 40%, and 21% correct)
in the post-MCT. Less improvement was observed from pre-MCT to post-MCT for the
items listed above. Also, the participants had trouble finding the answer of the item 18 ×
16 mentally (0%, 6 %, and 15 % correct) in the pre-MCT. However, they showed much
improvement in finding the answer to the item, like 14 × 16 (42%, 40%, and 21%) in the
post-MCT. More improvement was observed for the two digit multiplication item starting
with 99, like 99 × 13 (7%, 13%, and 5% correct) in the pre-MCT, while the item 99 × 17
(50%, 49%, and 29% correct) on the post-MCT.
As indicated in Table 30, the majority of PTS for experimental groups performed
better solving division items mentally in the post-MCT than in the pre-MCT. Large
difference between pre-and post-MCT was observed in the item, like (10 ×25) / (10 × 0)
(0%, 25%, and 10% correct, respectively) in the pre-test and the item, like (25 ×4 ×0)/4
(67%, 73%, and 79% correct) in the post-test. This was followed by mixed multiplication
and division items such as 44 × 22 ÷ 88 (7%, 13%, and 25 % correct) in the pre-MCT
and 33 × 22 ÷ 66 (42%, 22%, and 43% correct ) in the post-MCT and more complex
mixed multiplication and division items like 222 × 999 ÷ 333 (7%, 22 %, and 15 %
correct) in the pre-MCT and 222 × 888 ÷ 444 (33%, 53%, and 36% correct) in the post-

112
MCT. It is particularly interesting to note that less difference was observed between the
items, like 700 ÷ 25 (43%, 69%, 70% correct) in the pre-MCT and 775 ÷ 25 (50%, 47%,
and 50% correct) in the post-MCT. This item could be considered the most difficult in
the division operation.
Table 30
The Results of Division Performance among Groups on Pre-and Post-MCT
Whole numbers
Item Pre-and Post-MCT (% correct)
DT OA Control
Pre N=14 N= 16 N=20
Post N=12 N= 15 N=14
Divisions (7) Pre 24 ÷ 8 = 86 94 95
Post 56 ÷ 7 = 92 93 64
Pre 70 ÷ 14 = 36 50 30
Post 80 ÷ 16 = 42 67 64
Pre 342 ÷ 18 = 7 6 20
Post 468 ÷ 18 = 17 47 14
Pre 700 ÷ 25 = 43 69 70
Post 775 ÷ 25 = 50 47 50
Pre 44 × 22 ÷ 88 = 7 13 25
Post 33 × 22 ÷ 66 = 42 20 43
Pre 222 × 999 ÷ 333 = 7 25 15
Post 222 × 888 ÷ 444 = 33 53 36
Pre 10 ×25
10 × 0 = 0 25 10
Post 25 ×4 ×0
4 = 67 73 79
Note. Entries report percentages of a correct response on each item.
For integers, only two items were provided in the pre-and post-MCT, respectively
as shown in Table 31.
Table 31
The Results of Integer Performance among Groups on Pre-and Post-MCT
Integers Item Pre-and Post-MCT (% correct)
DT OA Control
Pre N=14 N= 16 N=20
Post N=12 N= 15 N=14
Integers (2) Pre – 12 – (– 30) + 22 = 29 63 35
Post – 13 – (– 37) + 20 = 58 73 57
Pre 30 × (– 8) ÷ (– 2) = 43 50 50
Post 24 × 4 ÷ (– 6) = 33 53 36
Note. Entries report percentages of a correct response on each item.

113
Unsteady results were observed for all groups with integer addition and
subtraction items, such as – 12 – (– 30) + 22 (29%, 63%, and 35% correct, respectively)
in the pre-MCT and – 13 – (– 37) + 20 (58%, 73%, and 57% correct) in the post-MCT.
PTS in the DT group performed better multiplying and dividing integer item 30 × (– 8) ÷
(– 2) than adding and subtracting integer item – 12 – (– 30) + 22.
Table 32
The Results of Fraction Performance among Groups on Pre-and Post-MCT Rational
Numbers
Item Pre-and Post-MCT (% Correct)
DT OA Control Pre N=14 N= 16 N=20 Post N=12 N= 15 N=14
Fractions (8) Pre 𝟏
𝟐 +
𝟑
𝟒 = 43 56 55
Post 3
5 +
1
2 = 33 67 50
Pre 2𝟏
𝟐 + 1
𝟑
𝟒 = 36 38 50
Post 4 1
2 + 1
3
4 = 67 73 71
Pre 𝟑
𝟒 –
𝟏
𝟐 = 50 44 70
Post 6
8 –
1
2 = 33 80 50
Pre 3 𝟏
𝟒 – 2
𝟏
𝟐 = 14 25 30
Post 5 1
4 – 2
1
2 = 58 53 50
Pre 𝟑
𝟐 × 12 = 29 44 40
Post 𝟐
𝟑 × 18 = 75 60 29
Pre 1
4×
3
5 =
21 88 25
Post 1
5 ×
4
7 = 33 80 29
Pre 𝟏
𝟐 × 4
𝟏
𝟑 = 7 44 25
Post 1
3 × 4
1
5 = 33 40 21
Pre 8 ÷ 𝟏
𝟑 = 29 25 40
Post 12 ÷ 1
3 = 42 73 14
Note. Entries report percentages of a correct response on each item.
As indicated in Table 32, PTS performed much better (4 out of 8 items) in the
post-MCT than in the pre-MCT. More specifically, much improvement was shown in the
mixed fraction addition items like 2 ½ + 1 ¾ (36%, 38%, and 50% correct, respectively)
in the pre-MCT and 4 ½ + 1 ¾ (67%, 73%, and 71% correct) in the post-MCT. This was

114
followed by the mixed fraction subtraction items, such as 3 ¼ – 2 ½ (14%, 25% and
30% correct) in the pre-MCT and 3 ¼ – 2 ½ (58%, 53%, and 50% correct) in the post-
MCT.
Better performance was shown in fraction multiplication for both DT and OA
groups, while worse performance was shown for the control group, such as fraction
multiplication items like 3/2 × 12 (29%, 44%, and 40% correct) in the pre-MCT and 2/3 ×
18 (75%, 60%, and 29% correct) in the post-MCT. This was followed by fraction division
items using whole numbers, like 8 ÷ 1/3 (29%, 25% and 40% correct) in the pre-MCT
and 12 ÷ 1/3 (42%, 73%, and 13% correct) in the post-MCT. Also, the largest difference
shown in the OA group was fraction subtraction items, like ¾ - ½ (44% correct) and 6/8
– 1/2 (80% correct) where almost two times as many participants were correct with their
post-MCT compared with the pre-MCT.
It is interesting to note that there was no improvement for the DT group which
dropped their percent from 50% to 33%. This happened to the fraction addition items
like ½ + ¾ (43 % correct for DT) in the pre-MCT and 3/5 + 1/2 (33% correct for DT) in
the post-MCT, while the correct percentage for the OA group increased from 56% to
67%. In contrast, better performance was shown for the DT group in fraction
multiplication items like ½ × 4 1/3 (7% correct) in the pre-MCT and 1/3 × 4 1/5 (33%
correct) in the post-MCT and ¼ × 3/5 (21 % correct) in the pre-MCT and 1/5 × 4/7 (33%
correct) in the post-MCT, but the percentages of correct response for the OA group was
reduced from 44% to 40%. Differences were not large in the control group.
The most difficult fraction items were found in fraction multiplication with mixed
fraction such as 1/2 × 4 1/3 in the pre-MCT and 1/3 × 4 1/5 in the post-MCT. More than

115
half of the PTS were not able to find the correct answer from pre-MCT to post-MCT.
Table 33 compares the decimal performance among three groups from pre-MCT
to post-MCT.
Table 33
The Results of Decimal Performance between Groups on Pre-and Post-MCT
Rational
Numbers
Item Pre-and Post-MCT (% Correct)
DT OA Control
Pre N=14 N= 16 N=20 Post N=12 N= 15 N=14
Decimals
(10)
Pre 5.6 + 3.7 = 86 88 70
Post 5.8 + 2.6 = 92 87 71
Pre 0.5 + 0.75 = 36 56 50
Post 0.25 + 0.8= 67 80 43
Pre 4.7 + 5.6 – 1.7 = 29 25 40
Post 3.7 + 2.6 – 1.7– 1.3 = 58 60 50
Pre Write the answer as positive or negative? 4.9 – 6.8 =
86 94 90
Post Write the answer as positive or negative? 1.29 – 1.38 =
100 100 100
Pre Position the decimal point appropriately in 000000800000, so that it represents the product of 0.02 × 0.4
43 63 60
Post Position the decimal point appropriately in 0000001910329400000, so that it represents the product of 13.202 × 14.47
58 67 29
Pre Sam was given this number sentence and was asked to place the decimal point correctly in the quotient. 54.875 ÷ 6.25 = 0.878. Do you agree with Sam?
64 56 80
Post April was given this number sentence and was asked to place the decimal point correctly in the
quotient. 13.94656 ÷ 4. 2𝟓 = 0.328 Do you agree with April?
67 80 57
Pre 0.57 × 10 = 36 31 25
Post 0.37 × 10 = 83 87 71
Pre 10 × 0.2 ÷ 1000 = 21 31 45
Post 100 × 0.05 ÷ 1000 = 50 67 43
Pre 0.5 × 48 = 50 81 55
Post 0.2 × 75 = 42 60 36
Pre 0.385 ÷ 100 = 29 38 55
Post 0.75 ÷ 1000 = 58 80 29
Note. Entries report percentages of a correct response on each item.
For the majority of decimal items, PTS for experimental groups performed much
better in the post-MCT (8 out of 10) than in the pre-MCT. Unsteady results were found
for the control group. The only exception was observed in the item 0.5 × 48 in the pre-

116
MCT and 0.2 × 75 in the post-MCT. The percentages of correct response for the DT
group reduced from 52% to 42%, from 81% to 60% for the OA group, and from 55% to
36% for the control group. There were marked differences in decimal items involving
multiplying by 10 between pre-MCT and post-MCT. The PTS (36% and 31%) in the DT
and OA groups, respectively, correctly computed the item 0.57 × 10 in the pre-MCT,
and 83 percent of them in the DT group and 87 percent of them in the post-MCT
correctly computed the item 0.37 × 10 in the post-MCT. The control group also showed
a marked difference from 25% to 71%. The decimal items involving multiplication and
division showed marked differences as well. Participants in the DT group (21%) and the
OA group (31%) correctly computed the item 10 × 0.2 ÷ 1000 in the pre-MCT. On the
other hand, participants in the DT group (50%) and in the OA group (67%) correctly
computed the item 100 × 0.05 ÷ 1000 in the post-MCT. The control group also showed
less difference from 45% to 43%. There were two times differences between pre-MCT
and post- MCT observed in the decimal item involving addition and subtraction 4.7 + 5.6
– 1.7 in the pre-MCT and 3.7 + 2.6 – 1.7– 1.3 in the post-MCT. The performance was
improved from 29% to 58% for the DT group and from 25% to 60% for the OA group.
No large difference was observed for the control group.
The difficult items were found in the decimal items involving multiplication and
division such as 10 × 0.2 ÷ 1000 (21%, 31% and 45% correct) in the pre-MCT and 100
× 0.05 ÷ 1000 (50%, 67%, and 43 % correct) in the post-MCT. These decimal items
showed a low correct percent of pre-and post-MCT compared with other decimal
operations.
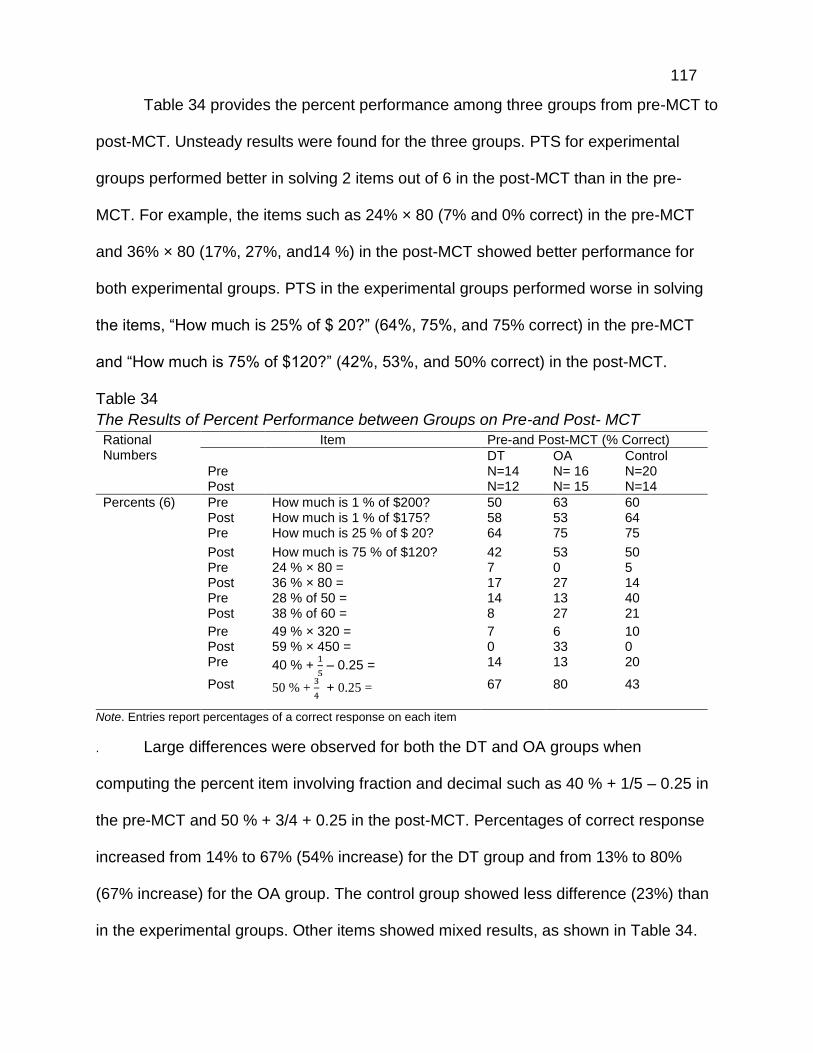
117
Table 34 provides the percent performance among three groups from pre-MCT to
post-MCT. Unsteady results were found for the three groups. PTS for experimental
groups performed better in solving 2 items out of 6 in the post-MCT than in the pre-
MCT. For example, the items such as 24% × 80 (7% and 0% correct) in the pre-MCT
and 36% × 80 (17%, 27%, and14 %) in the post-MCT showed better performance for
both experimental groups. PTS in the experimental groups performed worse in solving
the items, “How much is 25% of $ 20?” (64%, 75%, and 75% correct) in the pre-MCT
and “How much is 75% of $120?” (42%, 53%, and 50% correct) in the post-MCT.
Table 34
The Results of Percent Performance between Groups on Pre-and Post- MCT
Rational Numbers
Item Pre-and Post-MCT (% Correct)
DT OA Control Pre N=14 N= 16 N=20 Post N=12 N= 15 N=14
Percents (6) Pre How much is 1 % of $200? 50 63 60 Post How much is 1 % of $175? 58 53 64 Pre How much is 25 % of $ 20? 64 75 75
Post How much is 75 % of $120? 42 53 50 Pre 24 % × 80 = 7 0 5 Post 36 % × 80 = 17 27 14 Pre 28 % of 50 = 14 13 40 Post 38 % of 60 = 8 27 21
Pre 49 % × 320 = 7 6 10 Post 59 % × 450 = 0 33 0 Pre 40 % +
1
5 – 0.25 = 14 13 20
Post 50 % + 3
4 + 0.25 = 67 80 43
Note. Entries report percentages of a correct response on each item
. Large differences were observed for both the DT and OA groups when
computing the percent item involving fraction and decimal such as 40 % + 1/5 – 0.25 in
the pre-MCT and 50 % + 3/4 + 0.25 in the post-MCT. Percentages of correct response
increased from 14% to 67% (54% increase) for the DT group and from 13% to 80%
(67% increase) for the OA group. The control group showed less difference (23%) than
in the experimental groups. Other items showed mixed results, as shown in Table 34.

118
Percent items could be the most difficult operation for these PTS. PTS performed
worst (less than 35% correct from pre-to post-MCT) in computing 3 out of 6 items: 24 %
× 80 (7%, 0%, and 5% correct) in the pre-MCT and 36 % × 80 (17%, 27%, and 14%
correct) in the post-MCT, 28 % of 50 (14%, 13%, and 40 %) in the pre-MCT and 38 % of
60 (8%, 27%, and 21 %) in the post-MCT, and 49 % × 320 (7%, 6%, and 10% correct)
in the pre-MCT and 59 % × 450 (0%, 33%, and 0% correct, respectively) in the post-
MCT.
Table 35
T-test Comparing Performance of Whole numbers on Pre-and Post-MCT by Mode of
Presentation
Test N Mode Mean SD t-value df p-value
Pre - MCT 51 Horizontal 47.76 32.20 -2.155 50 .036
Vertical 54.53 28.93
Post - MCT 51 Horizontal 59.18 26.51 -1.741 50 .088
Vertical 63.84 27.68
The Effect of Mode of Presentation. To examine the effect of mode of
presentation on the whole numbers between pre-and post-MCT, a paired-sample t-test
was conducted. In total, 51 items were examined (17 for each for the two experimental
groups and the control group).The complete analysis of the mode of presentation
effects was shown in Table 35. The results indicated that the mean score for
horizontally presented problems was 47.76 with a standard deviation of 32.20, and that
of vertically presented problems was 54.53 with a standard deviation of 28.93. A paired-
sample t-test indicated that the difference between mode of presentation mean scores
for PTS (t (50) = 0.036) using pre-MCT is significant at the alpha level of 0.05. On the
other hand, Table 35 also presents the post-MCT mode of presentation mean scores of
the PTS. The results indicated that the mean score for horizontally presented problems
was 59.18 with a standard deviation of 26. 51, and that of vertically presented problems

119
was 63.84 with a standard deviation of 27.68. The results also showed that the
difference between mode of presentation mean scores for PTS (t (50) = 0.088) using
post-MCT is not significant at the alpha level of 0.05.
This, therefore, means that at the beginning of the lessons, the PTS were more
likely to compute mental computation problems vertically; however, at the end of the
lessons, more PTS were likely to use mental computation problems horizontally. In
other words, these results may provide strong evidence that mode of presentation has a
significant effect on mental computation performance if participants have not been
exposed to mental computation lessons before. Namely, the mode of presentation
(visually vertically or horizontally presented) for the study may affect PTS’ performance
levels on individual items in the pre-MCT, but not in the post-MCT.
Comparison of Differences in the Use of Mental Computation Strategies between
the Experimental Groups
The fourth research question asked what the differences are in the use of mental
computation strategies between the experimental groups. The main focus in this section
was on the distinction between the strategies used for the DT and OA groups. In the
experimental task, ten items or problems were administered after each lesson for both
groups to observe differences in the use of strategies. In doing so, first, participants
were told that they had to find their answers mentally and then write down their mental
strategies used. If they did not write either answers or strategies, or they had
unmatched answers and strategies, their answers would be scored as incorrect.
Appendix F summarizes the comparison of PTS’ different mental computation
strategies between two experimental groups by item for six operations: addition,

120
subtraction, multiplication, division, integer, and decimal, fraction, and percent together.
In general, the participants for both DT and OA groups exhibited a variety of strategies
as the lesson progressed and showed an ability to use a wide range of strategies. For
the DT group, various mental computation strategies were demonstrated (See Appendix
C). As for the OA group, no explicit demonstration was provided and participants’ own
strategies were highly encouraged during the lesson.
Comparison of Differences in the Use of Mental Computation Addition
Strategies. Regarding mental computation addition strategies, while the OA group (N=
14) was provided no direct instruction, various mental computation addition strategies
were demonstrated for the DT group (N=13): Count all and counting on, Reordering,
Adding by place, Making ten(s) and hundred(s), Compensation, and Using double and
near double numbers (See Appendix C).
Table 36
The Comparison of Mental Computation Addition Strategies of 25 + 99
Item Group Strategies Example % Correct
% Total Correct
25 + 99 = DT Compensation 25 + 100 – 1= 124; 46 92
Making 10s and100s
99 + 20 + 5= 124; 99 + 24 + 1= 124
15
Adding by place 90 + 20 + 5 +9 = 110 + 14= 124 23
Traditional (verti.) 124 8
OA Compensation 25 + 100 – 1 = 124 29 86
Making 10s and100s
99 + 1+ 24= 124; 99 + 1 = 100, 25 -1= 24, 100 + 24 = 124; 24 + 100= 124
36
Adding by place 90 + 20 + 9 + 5= 124 7
Double number 24+ 50 + 50= 124 7
Traditional (verti.) 124 7
Analysis and comparison of mental computation strategies between the two
groups showed that both groups used mental computation addition strategies in a
similar way but the participants in DT group used more different strategies than its
121
counterpart as indicated in Appendix F. The OA group used more strategies on only one
item 25 + 99 as shown in Table 36. In addition, in 8 out of 10 addition items, the
participants’ in the DT groups showed higher percentages of total correct items than the
OA group. However, as indicated in Appendix F, the participants in the DT group used
more Traditional methods by rewriting the problem vertically in the air in 6 out of 10
items, while the participants in the OA group used the Traditional method for only two
items (e.g., 25 + 99 and 79 + 26). When the participants were asked to compute the
problem 1 + 2+ 3 +…+ 98 + 99 + 100, the majority of participants in both groups had
trouble computing this item mentally. Only 8% and 14% of participants were able to
solve this item mentally. Table 36 shows the examples of each strategy.
A closer analysis of mental computation addition strategies (See Appendix F)
showed that in adding two-digit numbers with 9 (e.g., 16 + 9), 62% of participants in the
DT group used the strategies of Adding by place (31%) and Making 10s (31%). This
was followed by Compensation strategy (23%). Similarly, 50% of the participants in the
OA group used making 10s (36%) and Adding by place (13%). 7% used Compensation
and Double number strategies, respectively. On the other hand, in terms of adding two-
digit numbers involving 99 (e.g., 25 + 99), slightly less than half of the participants (46%)
in the DT group used Compensation strategy, while 36% of participants in the OA group
used the strategy Making 10s and100s. Only about one-third of them (29%) used the
Compensation strategy.
Accordingly, in the problem 165 + 99, more than half of the participants in the DT
group (57%) used the Compensation strategy. A minority of them (15%) used the
Adding by place strategy, while slightly less than half of the participants (43%) in the OA

122
group used the Compensation strategy. This was followed by the strategy Making 10s
and 100s (29%). These results indicate that the participants in the DT group were more
likely to use the Compensation strategy than its OA counterpart when they computed
mental computation addition problems involving 99.
As for the adding two-digit numbers involving making 10s or 100s (e.g., 68 + 32),
slightly more than half of the participants (54%) in the DT group made use of the
strategy Adding by place. Then they employed the strategy Making 10s and 100s (38
%). On the other hand, about two-thirds of participants (65%) in the OA group used the
strategy, Adding by place, then Making 10s and 100s (14%) followed. Interestingly, the
results showed that the participants in both groups prefer to use the strategy Adding by
place rather than Making 10s and 100s when they add two two-digit numbers.
However, in terms of adding three digit numbers involving making 10s or 100s
(e.g., 189 + 266 + 411), about one-third of participants (31%) in the DT group employed
the strategy Making 10s and 100s. This was followed by the strategy Adding by place
(23%), while slightly less than one-third of the participants (29%) in the OA group used
the strategy, Reordering (e.g., 189 + 411 + 266). This was followed by the strategy
Adding by place (21%). Only 14% of them used the strategy Making 10s and 100s.
Accordingly, in adding several two and one digit numbers (e.g., 65 + 66 + 35 + 34 + 7),
slightly less than half of the participants (46%) in the DT group used the Adding by
place strategy. This was followed by the strategy Reordering (15%). In contrast, about
one-third of the participants (29%) in the OA group used the strategy Reordering. Then
they used Adding by place (14%) strategy.
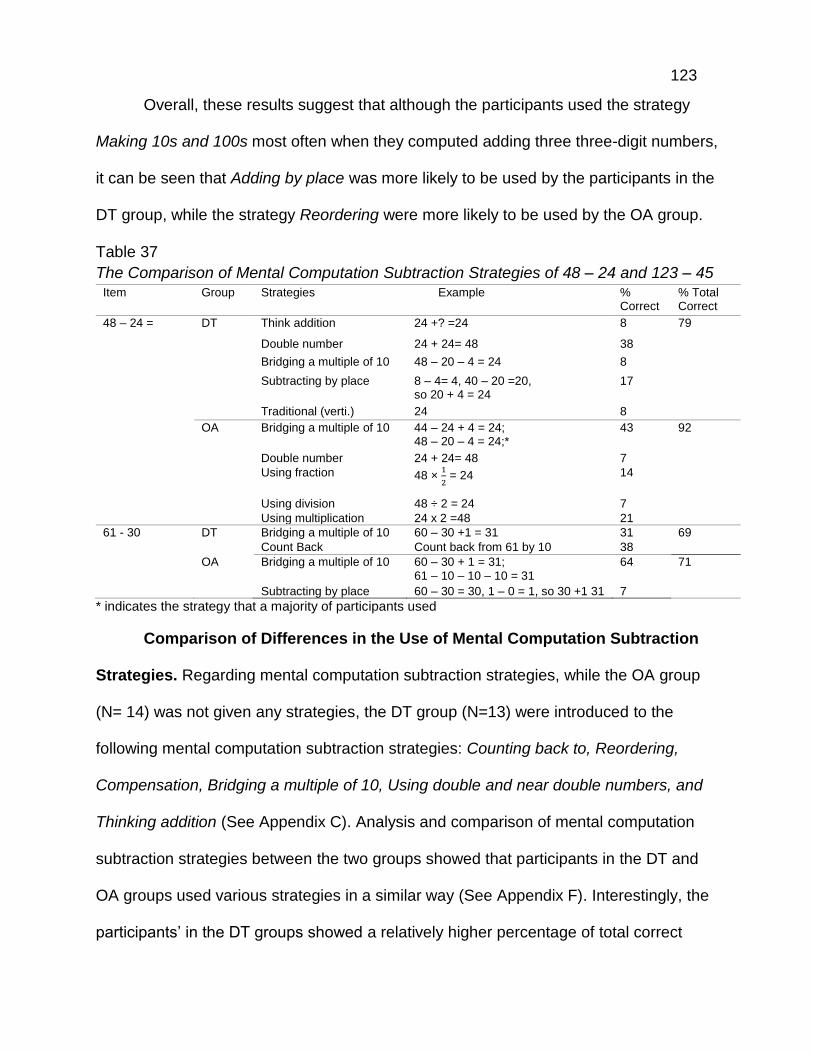
123
Overall, these results suggest that although the participants used the strategy
Making 10s and 100s most often when they computed adding three three-digit numbers,
it can be seen that Adding by place was more likely to be used by the participants in the
DT group, while the strategy Reordering were more likely to be used by the OA group.
Table 37
The Comparison of Mental Computation Subtraction Strategies of 48 – 24 and 123 – 45 Item Group Strategies Example %
Correct % Total Correct
48 – 24 = DT Think addition 24 +? =24 8 79
Double number 24 + 24= 48 38
Bridging a multiple of 10 48 – 20 – 4 = 24 8
Subtracting by place 8 – 4= 4, 40 – 20 =20, so 20 + 4 = 24
17
Traditional (verti.) 24 8
OA Bridging a multiple of 10 44 – 24 + 4 = 24; 48 – 20 – 4 = 24;*
43 92
Double number 24 + 24= 48 7
Using fraction 48 × 1
2 = 24 14
Using division 48 ÷ 2 = 24 7
Using multiplication 24 x 2 =48 21
61 - 30 DT Bridging a multiple of 10 60 – 30 +1 = 31 31 69
Count Back Count back from 61 by 10 38
OA Bridging a multiple of 10 60 – 30 + 1 = 31; 61 – 10 – 10 – 10 = 31
64 71
Subtracting by place 60 – 30 = 30, 1 – 0 = 1, so 30 +1 31 7
* indicates the strategy that a majority of participants used
Comparison of Differences in the Use of Mental Computation Subtraction
Strategies. Regarding mental computation subtraction strategies, while the OA group
(N= 14) was not given any strategies, the DT group (N=13) were introduced to the
following mental computation subtraction strategies: Counting back to, Reordering,
Compensation, Bridging a multiple of 10, Using double and near double numbers, and
Thinking addition (See Appendix C). Analysis and comparison of mental computation
subtraction strategies between the two groups showed that participants in the DT and
OA groups used various strategies in a similar way (See Appendix F). Interestingly, the
participants’ in the DT groups showed a relatively higher percentage of total correct
124
answers than its OA counterpart except for the items 48 – 24 and 61 – 30 (See Table
37).
The participants in the DT group used the strategies the researcher
demonstrated during the intervention, while the participants in the OA group created
their own strategies. Regarding the item 123 – 45, half of the participants (50%) in the
OA group showed a slightly higher total correct percentage as opposed to that of the DT
group (47%). In the use of mental computation strategies, more than half of the
participants (54%) computed this item correctly using the strategy Subtracting by place.
Then the strategy Bridging a multiple of 10 was used by 15% of the participants. Then,
a minority of participants (8%) used the Traditional method strategy. On the other hand,
slightly less than half of the participants (43%) in the OA group computed this using
Bridging a multiple of 10. A minority of participants (7%) employed the strategy Making
10s and 100s. Like the mental computation addition strategy, the participants in the DT
group used the Traditional method more by rewriting the problem vertically in the air (5
out of 10 items), while only one person used the Traditional method (horizontally) in
computing the item 100 – 58 for the OA group (See Appendix F).
Participants had the fewest correct answers in the problem involving parentheses
(e.g., 417 – (156 + 127)). Only 8% of the DT and 7% of the OA groups, respectively,
were able to solve this item mentally. The participants in the DT group computed using
the strategy Subtracting by place (e.g., 417 – 200 – 70 – 13 = 134), while the
participants in the OA group used the strategy Subtracting the sum of parentheses (e.g.,
417 – 283 = 134). A close analysis of mental computation subtraction strategies shows
that in the subtraction items involving 9 or 99 (See Appendix F), Compensation was the
125
most prominently used strategy for both groups. For example, in the item 36 – 9, less
than half of the participants (38%) in the DT group computed this item correctly using
Compensation. Also, 50% of participants in the OA group used the strategy
Compensation as well. Accordingly, the item 265 – 99 showed that almost two-thirds of
the participants (69%) in the DT group and half of the participants (50%) in the OA
group computed this problem correctly using Compensation. The same results
happened in the item 29 + 299 + 2999 + 29999, about two-thirds of the participants (62
%) in the DT group and more than half of the participants (57%) in the OA group
computed this item correctly using Compensation strategy. Similarly, when the
participants computed the item 100 – 58, more than half of the participants (54%) in the
DT group used the Compensation strategy and then about one-fifth of them (23%) used
the strategy Bridging a multiple of 10 (e.g., 100 – 50 – 8 = 42). However, for the OA
group, half of the participants (50 %) used the strategy Bridging a multiple of 10 and
about one-third of participants (36%) employed the Compensation. Thus, a comparison
of the two results reveals that when the participants computed the item involving 8, 9 or
99 mentally, it can be seen that Compensation was the strategy the participants most
frequently used in both groups.
As indicated in Table 37, comparison of mental computation subtraction
strategies are presented. In subtraction items involving double and near double
numbers (e.g., 48 – 24 and 61 – 30), only 38% of the participants in the DT group
computed 48 – 24 correctly using the strategy Double number. Then they used the
strategies Subtracting by place (17%), Thinking addition (8%), and Traditional method
(8%). As for the OA group, the strategy Bridging a multiple of 10 (43%) was used by

126
participants. Then, the strategies Using multiplication (21%), Using fraction (14%),
Using division (7%), Double number (7%) followed. As shown in Appendix F, for the
item 61 – 30, the participants in the DT group computed this item correctly using the
strategies Bridging a multiple of 10 (31%) and Count back (38%) (i.e., Count back
numbers from 61 by 10). Similarly, about two-thirds of the participants (64%) in the OA
group computed this item using the strategy Bridging a multiple of 10 and using the
strategy Subtracting by place (7%). Surprisingly, the OA group had twice as many
correct answers using the Bridging a multiplied 10 strategy compared to the DT group.
Accordingly, when comparing this with the item involving 7 (e.g., 90 – 27), a majority of
participants (85%) in the DT group computed this item correctly using the strategy
Bridging a multiple of 10 (e.g., 90 – 20 – 7 or 90 – 30 + 3) and slightly more than half of
the participants (57%) in the OA computed this item correctly using the same strategy.
A minority of participants (8% and 7%) for each group employed the Traditional method.
The strategy Decomposing subtrahend (e.g., 90 – 25 – 2) was used by only seven
percent of the participants in the OA group. A comparison of the two groups revealed
that in the subtraction items involving double number and near double numbers and the
item involving 7, Bridging a multiple of 10 was the strategies the participants for both
groups most frequently used for this study.
Comparison of Differences in the Use of Mental Computation Multiplication
Strategies. For mental computation multiplication strategies, various mental
computation strategies were shown in the DT group (N=12): Doubling and halving,
Compensation, Multiplying using factors, Vedic method of vertical multiplication, Partial
product multiplication, Anchor method, Making 100s and 1000s using factors, and Using

127
distributive property (See Appendix C). On the other hand, the participants in the OA
group (N=16) were encouraged to make their own strategies when computing problems
mentally. Analysis and comparison of mental computation multiplication strategies
between the two groups showed that the participants in the OA group used more
different mental computation strategies than did the participants in the DT group as
indicated in Appendix F.
Among 10 multiplication items, the participants in the DT group showed a slightly
higher percentage of total correct in the following items; 60 × 12, 98 × 6, 23 × 199, 125
× 40, and 5 × 16 × 125. The participants in the OA group demonstrated a relatively
higher total correct percentage in the following items: 12 × 4, 14 × 99, 33 × 35, 25 × 20
× 100 × 4, and 35 × 55 + 35 × 45. Interestingly, for unlike addition and subtraction
strategies, in 7 out of 10 multiplication items, the participants in the OA group computed
them correctly using the Traditional method strategy, while the participants in the DT
group used the Traditional method in two of the items (e.g., 60 × 12 and 98 × 6). All of
the participants in the DT group had trouble computing 33 × 35 mentally (0% correct),
while slightly more than one-third of participants (38%) in the OA group succeeded
computing this item mentally. A close inspection of the strategies revealed that in the
multiplication items involving 9 or 99, the participants in both groups most frequently
used the strategy, Compensation. For example, in the item 14 × 99, half of the
participants (50%) in the DT group computed this item correctly using Compensation
(e.g., 14 × (100 – 1)) and about two-thirds of participants (63%) computed this item with
the same strategy. This happened with the item 23 × 199. The participants in both
groups computed this using Compensation (50% and 44%, respectively), even though

128
half of the participants in both groups computed the item 98 × 6 using Compensation
(50% for each). Taken together, these results suggest that in the multiplication items
involving 8, 9, or 99, participants in both groups prominently used the strategy
Compensation.
In items involving double-digit numbers (e.g., 60 × 12, 33 × 35), as shown in
Appendix F, the participants in the OA group demonstrated a wider variety of mental
computation strategies than that of the DT group. In terms of 60 × 12, the DT group
used the following strategies: Basic fact (25%), Distributive property of Multiplication
(25%), Using factors (8%), and Traditional method (8%). On the other hand, the OA
group used a wider variety of strategies. For example, Basic fact (19%), Distributive
property of Multiplication (19%), Using factors (13%), German method (6%), Using
multiplication and repeated addition (6%) and Traditional method (6%). In other words,
Basic fact and Distributive property of multiplication were most commonly used
strategies for both groups. The item 33 × 35 showed interesting outcomes. None of the
participants in the DT group produced correct solutions with any strategy. However, the
participants in the OA group computed their answer mentally using Vedic method (6%),
German method (13%), Partial product of multiplication (6%), and Traditional method
(13%).
Another analysis of the items involving 25 and 125 such as 125 × 40, 5 × 16 ×
125, and 25 × 20 × 100 × 4 reported that Making 100s and 1000s using factors was the
most frequently used strategy for both groups. As for the item 125 × 40, about half of
the participants for each group (42% and 44%) used this strategy. For the item 5 × 16 ×
125, about one-third of the participants (33%) in the DT group computed this using

129
Making 100s and 1000s using factors (e.g., 5 × 8 × 2 × 125 = 10 × 1000 =10000). The
OA group employed the strategies Making 100s and 1000s using factors (13%) and
Traditional method (13%). However, different results were observed in the item 25 × 20
× 100 × 4. About one-third of the participants (33%) in the DT group used the strategy
Reordering (e.g., 25 × 4 × 100 × 20 or 20 × 100 × 4 × 25), while Reordering (44%) was
the most common mental multiplication strategy for the OA group.
These results suggest that participants from both groups (33% and 19%) used
the strategy Making 100s and 1000s using factors when computing items involving 25
and 125. However, when they computed items multiplying four numbers Reordering
was the most commonly used strategy for both groups. Finally, when participants
computed the item multiplying the same multiplier with multiplicand that can be added to
multiplies of 100 (e.g., 35 × 55 + 35 × 45), the strategy Distributive property of
multiplication (e.g., 35 × (55 + 45)) was mostly used by both groups (25 % and 31%).
Comparison of Differences in the Use of Mental Computation Division
Strategies. In terms of mental computation division strategies, a variety of mental
computation strategies were given to the DT group (N=12): Doubling and halving,
Dividing using factors, Using patterns, Partitioning the dividend, Dividing the multiples of
100 or 1000 by 25 or 125, Chunking method, and Decomposing the multiplicand (See
Appendix C). Participants in the OA group (N= 16) were encouraged to use their natural
ways of thinking to generate a variety of different mental division strategies.
An analysis of mental computation division strategies between the two groups
revealed that the participants in the both groups used a variety of mental computation
strategies in a similar way as reported in Appendix F. However, the OA group

130
demonstrated more varieties of division strategies in the item 300 ÷ 6 than in any other
items.
Table 38
Comparison of Different Ways of Mental Computation Division Strategies of 300 ÷ 6
Item Group Strategies Example %
Correct
% Total
Correct
300 ÷ 6 = DT Using inverse multiplication 50 × 6 = 300 42 83
Basic fact 30 ÷ 6 = 5, then put 0 at the end 33
Traditional(vert.) 300 8
OA Basic fact 30 ÷ 6 = 5, then put 0 at the end;
30 ÷ 6 = 5 so 300 ÷ 6 = 50
25 69
Using inverse multiplication 5 × 6 = 30 so 50 × 6= 300 6
Using factors 300 ÷ 3= 100, 100 ÷2 = 50 13
Partitioning the dividend (360 – 60 ) ÷ 6= 60 – 10 = 50 6
Chunking method 50 6
Traditional(vert.) 50 13
In particular, Table 38 summarizes the comparison of different ways of mental
computation division strategies of 300 ÷ 6. The DT group presented the strategies of
Using inverse multiplication (42%), Basic fact (33%), and Traditional method (8%), while
the OA group used a number of different strategies such as Basic fact (25%), Using
factors (13%), Traditional method (13%), Partitioning the dividend (6%), and Chunking
method (6%). Detailed examples of the strategies participants used are shown in Table
38. Among 10 division items, the participants in the OA group showed a higher total
correct percentage in the following six items: half of 52, 132 ÷ 11, 240 ÷ 16, 1600 ÷ 25,
3990 ÷ 19, and 1375÷125. On the other hand, the DT group presented a higher ‘total
correct” percentage in the following items: 300 ÷ 6, 442 ÷ 8, 4750 ÷ 50, and 42 × 169 ÷
13 ÷ 6. Unlike other operations, in the division operation, the Traditional method was
commonly observed for both groups. The lowest percentages of total correct items were
442 ÷ 8 (26% and 12%) and 3990 ÷ 19 (6% and 13%).

131
A close comparison of mental computation division strategies indicated that in
the items involving dividing three digit numbers by one digit (e.g., 300 ÷ 6 and 442 ÷ 8),
when participants computed the item 300 ÷ 6, about half of the DT group (42%) used
the strategy Using inverse multiplication and one-third of them (33%) used the strategy
Basic fact. Similarly, the Basic fact (25%) was most commonly used by the OA group.
This was followed by the strategies of Using factors (13%) and Traditional method
(13%). As for the more complicated item 442 ÷ 8, a small percentage of the DT group
(13% for each) computed this item correctly using the strategies Partitioning the
dividend and Traditional method. In contrast, the strategies Using fraction (6%) and
Traditional method (6%) were employed by the OA group. A comparison of the two
items revealed that Basic fact and Traditional method were the most popular mental
computation division strategies for both groups. Actually, there is essentially no
difference in the strategies used by these two groups for these items.
There were two items involving dividing a three-digit number by a two-digit
number (e.g., 132 ÷ 11 and 240 ÷ 16). For the item 132 ÷ 11, the Basic fact (13%) and
Traditional method (13%) were strategies most commonly used in the DT group. A
minority of participants (8%) computed this item correctly using the strategy Partitioning
the dividend (e.g., (400 ÷ 8) + (42 ÷ 8) = 50 + 5.25 = 55.25). For the OA group,
Traditional method (31%) was the strategy the participants frequently used. This was
followed by the strategies Using inverse multiplication (19%) and Double number (19%).
In an analysis of the item 240 ÷ 16, the strategy Using fraction (17%) was the highest
percentage of correct answers in the DT group. This was followed by the strategies
Basic fact, Double number, and Using inverse multiplication (8% for each). The
132
traditional method (25%), Using multiplication (13%), Chunking method (6%), and
Partitioning the dividend (6%) were the strategies used by the participants in the OA
group. Taken together, these results suggest that for the items involving dividing three
digit number by two digit numbers, the DT group used the strategies Basic fact and
Partitioning the dividend for these two items, while the Traditional method and Using
inverse multiplication were the most commonly used strategies for the OA group.
Regarding the items dividing a four-digit number by a two-digit number (e.g.,
1600 ÷ 25, 3990 ÷ 19, and 4750 ÷ 50), The Traditional method and Using inverse
multiplication were observed as the commonly used strategies for both groups. In terms
of the item 1600 ÷ 25, the DT group employed the strategies Using inverse
multiplication (17%), Dividing the multiples of 100 by 25 (8%), and Partitioning the
dividend (8%). On the other hand, the OA group demonstrated the following strategies:
Using inverse multiplication (25%), Chunking method (6%), Making 100s and 1000s
using factors (6%), and Traditional method (6%). Surprisingly, the items 3990 ÷ 19 and
4750 ÷ 50 revealed that the Traditional method was the only strategy participants in the
DT (6% and 33%, respectively) and OA group showed (33% and 25%, respectively). As
for the item 1375 ÷125, both groups used Partitioning the dividend (17% and 38%,
respectively) and Traditional method (8% and 6%) as the two commonly used
strategies.
Comparison of Differences in the Use of Mental Computation Integer
Strategies. In the mental computation Integer strategies, numerous mental computation
strategies were provided for the DT group (N=12): Adding two positive numbers, Adding
two negative numbers, Adding two numbers with different signs, Converting double
133
negative to positive, Multiplying or dividing two numbers with the same signs, and
Multiplying or Dividing two numbers with different signs (See Appendix D). More
detailed strategies were described in Appendix F. Like other operations, the participants
in the OA group (N=15) were encouraged to use their natural ways of thinking to create
their own mental integer strategies. The comparison of mental computation integer
strategies between the two groups showed that the participants in the OA group used
slightly more mental computation integer strategies in the following items: (– 24) + (–
66), (– 113) – (– 12), (– 14) × 6, 216 ÷ (– 12), and 120 ÷ (– 5) × (– 4) than its OA
counterpart (See Appendix F). Among 10 integer items, the participants in the OA
group showed a relatively higher total correct percentage in 8 out of 10 division items,
compared to its DT counterpart. A close analysis of mental computation integer addition
strategies are compared in Appendix F. Regarding the integer addition item involving
adding two negative numbers (e.g., (– 24) + (– 66)), both groups computed using the
strategies in a similar way. For instance, one-fourth of the DT group (25%) and about
one-third of the OA group (33%) used the strategy, Adding two numbers and keeping
the same sign (e.g., 24 + 66 = 90, then keep the negative sign). Then about one-fifth of
the DT group (17%) and one-fifth of the OA group (20%) used the strategy Dropping the
addition sign and keeping the same sign (e.g., – 24 – 66 = – 90). Eight percent of the
DT group and one-fifth of the participants (20%) in the OA group computed this item
correctly using the strategy Taking the same sign outside of parenthesis (e.g., – (66 +
24) = – 90). Vertically adding two numbers and keeping the same sign (7%) was
observed only with OA group. As for the integer item involving adding two numbers with
different signs (e.g., (– 3) + 14 = 11), two integer strategies were observed for both
134
groups: Finding the difference between two numbers and keeping the sign of the larger
number (42% and 73%) and Using number line (8% and 7%).
Mental computation integer subtraction strategies were also analyzed. When
subtracting a number with the same sign (e.g., (– 113) – (– 12) ), about one-third of the
DT group (33%) computed this item correctly using the strategy Converting double
negative to positive (e.g., –113 + (+12) = –101) and about one-fifth of the OA group
(17%) used the strategy Find the difference between two numbers and keeping the sign
of the larger number. On the other hand, the OA group came up with the following three
strategies: Converting double negative to positive (67%), Find the difference between
two numbers and keep the sign of the larger number (20%), and Taking the same sign
outside of parenthesis (7%). As for the items involving integer multiplication with the
same or different sign (e.g., (– 14) × 6, 25 × (– 2) × 4, and (– 12) × (– 16)), both groups
used strategies in a similar way (See Appendix F). When computing the items with a
different sign (– 14) × 6, about three-fourths of the DT group (75%) used the strategy
Multiplying two numbers and keeping the negative sign and 8% of them computed this
item using Vertically multiplying and keeping the negative sign. For the OA group, about
half of the participants (47%) computed this using the strategy Multiplying two numbers
and keeping the negative sign and a minority of participants (7%) employed the strategy
Using the repeated addition. Interestingly, the strategy Vertically multiplying and
keeping the negative sign was observed in 40% of participants. Similarly, when
computing 25 × (– 2) × 4, about two-thirds of the participants in the DT group (67%)
used the strategy Multiplying numbers and keeping the negative sign and eight percent
of the group computed this using the strategy Using repeated addition and keeping the

135
negative sign. Also, about three-fourths of the OA group (73%) used the strategy
Multiplying numbers and keeping the negative sign and 13% of the group showed the
strategy Vertically multiplying and keeping the negative sign. When multiplying the item
with the same sign (– 12) × (– 16), two major strategies were observed: Multiplying two
numbers and keeping the positive sign (67% and 47%, respectively) and Vertically
multiplying and keeping the negative sign (17% and 27%, respectively). Overall, these
results reveal that when multiplying two numbers with the same or different signs, the
participants in both groups commonly used the strategies Multiplying two numbers and
keeping the positive or negative sign and Vertically multiplying and keeping the positive
or negative sign for their mental computation integer strategies involving multiplication
with the same sign.
The items involving integer division with the same or different signs were
analyzed as shown in Appendix F. When computing the item involving integer division
with different signs (e.g., 216 ÷ (– 12)), the following two strategies were observed for
the DT group: Dividing two numbers and keeping the negative sign (25%) and Vertically
dividing and keeping the negative sign (17%). On the other hand, the OA group showed
the following three strategies: Dividing two numbers and keeping the negative sign
(20%), Using multiplication and different sign gives negative (13%), and Vertically
dividing and keeping the negative sign (20%). When analyzing the strategies of the item
involving integer division with the same sign (e.g., (– 240) ÷ (– 4)), the same strategies
for both groups were as follows: Dividing two numbers and keeping the positive sign
(33% and 53%, respectively), Using multiplication and keeping the positive sign (8%
and 7%), and Vertically dividing and keeping the positive sign (17% and 7%). Together

136
these results suggest that the most commonly observed strategies for integer division
items involving the same or different signs were Dividing two numbers and keeping the
positive or negative sign and Vertically dividing and keeping the positive or negative
sign.
Comparison of Differences in the Use of Mental Computation Fraction,
Decimal, and Percent Strategies. In the mental computation strategies regarding
fraction, decimal, and percent, the DT group (N=12) was introduced to numerous mental
computation strategies. Under the subcategory of the fraction operation, the following
strategies were introduced: Repeated multiplication strategy of fraction, Converting
money strategy of fraction, and Compensation, Converting fraction to decimals.
Under the subcategory of the decimal operation, the strategies Counting on or
up, Reordering, Using doubling, Making 1s, 10s, and 100s, Compensation, Converting
decimal numbers to fractions, multiplying decimal numbers by the multiples of 10, and
Dividing decimal numbers by powers of 10 were demonstrated.
Under the subcategory of the percent operation, Compatible numbers, The use
of known fact, and Composition of 10% or 1% were employed (See Appendix C). The
OA group (N= 15) was encouraged to create their own strategies for those rational
operations.
Appendix F summarizes an analysis of mental computation fraction strategies
between two experimental groups in which these three fraction items were introduced ½
+ ¼, 1 ½ + ¾ and 5 ¼ - 3 ½. The comparison of fraction strategies for ½ + ¼ revealed
that both groups used fraction strategies in a similar way. In terms of a total correct
percentage, about two-thirds of participants (59%) of the DT group correctly computed

137
this item, while three-fourths of the OA group (73%) calculated it accurately. The DT
group used the following three strategies: Converting faction to decimal (25%), Making
the same denominator (17%), and Converting fraction to money (17%). For the OA
group, the strategies Making the same denominator (53%), Using drawing (13%), and
Converting fraction to money (7%) were employed.
In terms of the item 1½ + ¾, the OA group (67%) showed a higher total correct
percentage than its DT counterpart (59%). Slightly less than half of the DT group (42%)
computed this item correctly with the strategy Converting faction to decimal and about
one-fifth of the group (17%) computed this item correctly using the strategy Adding
whole number and Making the same denominator. On the other hand, about half of the
OA group correctly calculated this using the strategies Making the same denominator
(47%), Adding whole number and making the same denominator (13%), and
Compensation (7%).
Concerning the fraction item 5¼ - 3½, the DT group (67%) had a higher total
correct percentage than that of the OA group (47%). The DT group accurately
calculated the item with the following strategies: Changing faction to decimal (42%),
Making the same denominator (17%), Subtracting whole numbers and making the same
denominator (8%). In contrast, the OA group correctly computed this using the
strategies: Making the same denominator (33%), Subtracting whole number and making
the same denominator (7%), and Using drawing (7%). The strategies they used were
similar but the DT group had a higher total correct percentage using the strategy
Converting faction to decimal. These results suggest that in the items involving fraction
addition and subtraction Converting faction to decimal was the commonly used strategy
138
for the DT group, while Making the same denominator was the most commonly used
strategy for the OA group.
In respect to the mental computation decimal strategies, four items were
introduced: 0.5 + 0.75 – 0.8, 1.5 × 25, 0.3 × 100 ÷ 1000, as well as the item Position the
decimal point appropriately in 00003751875000, so that it represents the product of
33.35 × 11.25. As shown in Appendix F, as to the decimal addition item 0.5 + 0.75 –
0.8, the OA group (61%) had a higher total correct percentage than that of the DT group
(51%) and demonstrated more varied strategies than its DT counterpart. While the DT
group correctly computed this item using the strategies: Basic fact, Reordering, and
Converting fraction to money (17% for each), the OA group accurately computed this
item using the following strategies: Basic fact (20%), Using double numbers (20%),
Reordering (7%), Converting fraction to money (7%), and Traditional method (7%).
Concerning the decimal multiplication item 1.5 × 25, the OA group (53%) had two
times higher total correct percentage than that of the DT group (25%). As to the use of
the strategies Multiplying two numbers and putting the decimal points in the answer
(17% and 13%) and Traditional methods (8% and 20%) were shown for both groups.
Higher percentages of the strategy Traditional method were observed in the OA group.
Similar use of strategies were found in the decimal multiplication and division
items involving a multiples of 10, 0.3 × 100 ÷ 1000. Multiplying decimal number by
powers of 10 was the most commonly used strategy for both groups (42% and 25%,
respectively). Interestingly, all of the participants who correctly computed this item
showed that they first used multiplication (e.g., (0.3 × 100) ÷ 1000 = 30 ÷ 1000) rather
than division (e.g., 0.3 × (100 ÷ 1000) = 0.3 × 0.1). Also, Traditional method (7%) was

139
found in the OA group. Accordingly, the decimal multiplication item, Position the decimal
point appropriately in 00003751875000, so that it represents the product of 33.35 ×
11.25, the participants in the OA group (27%) correctly computed this item about four
times greater than that of DT group (8%). The strategy Using approximate numbers was
found in both groups (8% and 27%) and Traditional method was observed only in the
OA group (7%). Taken together, these results indicate that in the decimal items
involving addition and subtraction, the participants in both groups computed these items
with numerous strategies. However, in the decimal item involving multiplication and
division, The Traditional method was observed for the OA group more often than with
the DT group.
With regard to the mental computation percent strategies, two items were
provided: 50% × 48 and 39% × 420. In the item 50% × 48, the participants in the DT
group (84%) had a higher total correct percentage than that of the OA group (53%). The
same strategies were used in both groups: Converting percent to fraction (42% and
13%), Converting percent to decimal (17% and 20%), and Using division (25% and
20%).
Another item involving percent (e.g., 39% × 420) had a very low total correct
percentage for both groups (16% and 20%). The OA group (20%) showed a slightly
higher total correct percentage than that of the DT group (16%). Among correct
responses, two strategies were found: Converting percent to decimal (8% and 7%) and
Using known fact (e.g., (40 % - 1%) × 420 = 168 - 4.2 = 163.8) (8% and 13%).
Comparing these two items, it can be seen that in a relatively easy item 50% ×
48, the largest difference was shown in the use of the strategy of Converting percent to
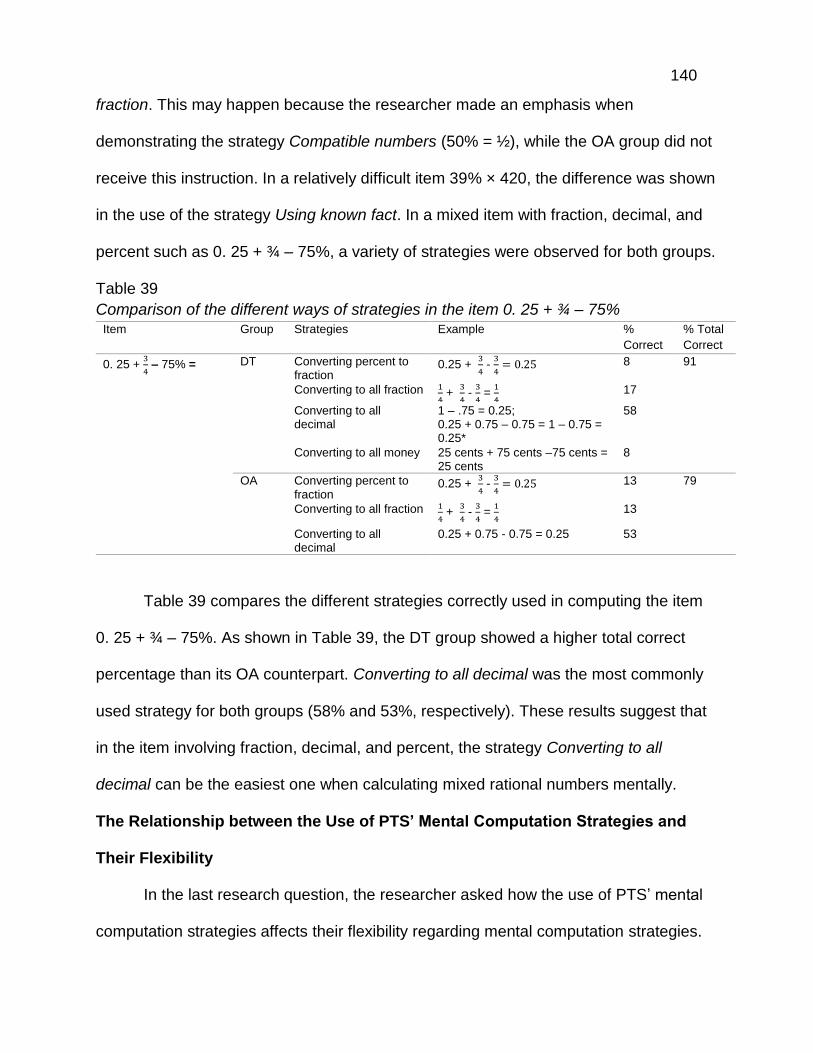
140
fraction. This may happen because the researcher made an emphasis when
demonstrating the strategy Compatible numbers (50% = ½), while the OA group did not
receive this instruction. In a relatively difficult item 39% × 420, the difference was shown
in the use of the strategy Using known fact. In a mixed item with fraction, decimal, and
percent such as 0. 25 + ¾ – 75%, a variety of strategies were observed for both groups.
Table 39
Comparison of the different ways of strategies in the item 0. 25 + ¾ – 75% Item Group Strategies Example %
Correct
% Total
Correct
0. 25 + 3
4 – 75% =
DT Converting percent to fraction
0.25 + 3
4 -
3
4= 0.25 8 91
Converting to all fraction 1
4 +
3
4 -
3
4 =
1
4 17
Converting to all decimal
1 – .75 = 0.25; 0.25 + 0.75 – 0.75 = 1 – 0.75 = 0.25*
58
Converting to all money 25 cents + 75 cents –75 cents = 25 cents
8
OA Converting percent to fraction
0.25 + 3
4 -
3
4= 0.25 13 79
Converting to all fraction 1
4 +
3
4 -
3
4 =
1
4 13
Converting to all decimal
0.25 + 0.75 - 0.75 = 0.25 53
Table 39 compares the different strategies correctly used in computing the item
0. 25 + ¾ – 75%. As shown in Table 39, the DT group showed a higher total correct
percentage than its OA counterpart. Converting to all decimal was the most commonly
used strategy for both groups (58% and 53%, respectively). These results suggest that
in the item involving fraction, decimal, and percent, the strategy Converting to all
decimal can be the easiest one when calculating mixed rational numbers mentally.
The Relationship between the Use of PTS’ Mental Computation Strategies and
Their Flexibility
In the last research question, the researcher asked how the use of PTS’ mental
computation strategies affects their flexibility regarding mental computation strategies.
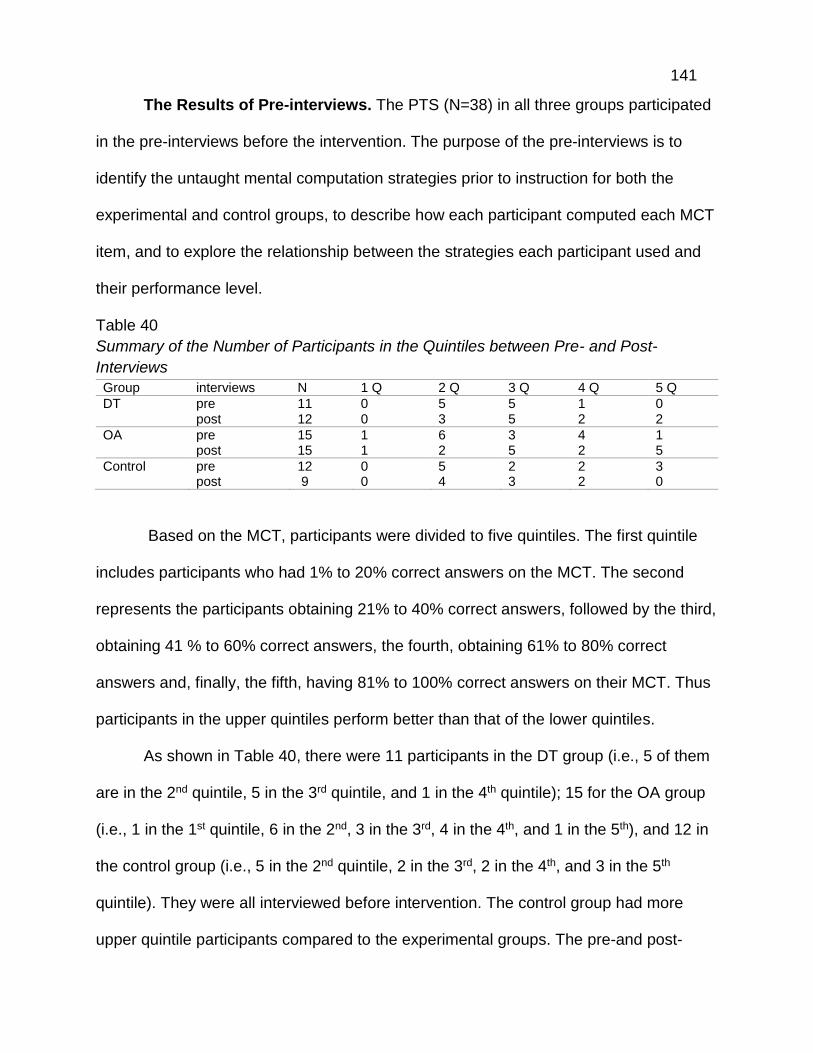
141
The Results of Pre-interviews. The PTS (N=38) in all three groups participated
in the pre-interviews before the intervention. The purpose of the pre-interviews is to
identify the untaught mental computation strategies prior to instruction for both the
experimental and control groups, to describe how each participant computed each MCT
item, and to explore the relationship between the strategies each participant used and
their performance level.
Table 40
Summary of the Number of Participants in the Quintiles between Pre- and Post-
Interviews
Group interviews N 1 Q 2 Q 3 Q 4 Q 5 Q
DT pre 11 0 5 5 1 0 post 12 0 3 5 2 2
OA pre 15 1 6 3 4 1 post 15 1 2 5 2 5
Control pre 12 0 5 2 2 3 post 9 0 4 3 2 0
Based on the MCT, participants were divided to five quintiles. The first quintile
includes participants who had 1% to 20% correct answers on the MCT. The second
represents the participants obtaining 21% to 40% correct answers, followed by the third,
obtaining 41 % to 60% correct answers, the fourth, obtaining 61% to 80% correct
answers and, finally, the fifth, having 81% to 100% correct answers on their MCT. Thus
participants in the upper quintiles perform better than that of the lower quintiles.
As shown in Table 40, there were 11 participants in the DT group (i.e., 5 of them
are in the 2nd quintile, 5 in the 3rd quintile, and 1 in the 4th quintile); 15 for the OA group
(i.e., 1 in the 1st quintile, 6 in the 2nd, 3 in the 3rd, 4 in the 4th, and 1 in the 5th), and 12 in
the control group (i.e., 5 in the 2nd quintile, 2 in the 3rd, 2 in the 4th, and 3 in the 5th
quintile). They were all interviewed before intervention. The control group had more
upper quintile participants compared to the experimental groups. The pre-and post-

142
interviews items were selected from the problems on the pre-and post-MCT,
respectively. Three levels of problems for each operation were selected, based on the
difficulty levels (e.g., high, medium, and low difficulty). However, only one medium
difficulty level for integer operation and medium and low difficulty levels for fraction
operations were found. In total, twenty-one problems selected from the pre-MCT for the
pre-interviews. On completion of all pre-and post-interviews, the script tapes were
reviewed item by item for the three groups. The researcher coded each strategy using
the categorization of participants’ responses. The response of each group in pre-
interviews was categorized and the resulting data were compiled for each interview
item. After all coding was completed, each quintile for each student was identified in
order to analyze what strategy each participant used.
Tables 41 to 48 summarize the results of the analysis in regard to addition (3
items), subtraction (3 items), multiplication (3 items), division (3 items), integer (1 item),
fraction (2 items), decimal (3 items), and percent (3 items).
Table 41 summarizes the results of pre-interview analyses on addition operation.
Three items were introduced: 10 + 76, 22 + 17 + 11, and 39 + 399 + 3999. For the low
difficulty item 10 + 76, the strategies the participants used were simple. The DT group
considered this item as Basic fact (45%) and computed this item using Adding by place
(45%) strategy. Only 10% of them computed this using the Traditional method (e.g.,
vertically lining up the two numbers). The Basic fact was also the commonly used
strategy (67%) for the participants in the OA group, followed by the strategies Adding by
place (27%) and Traditional method (6%). In contrast, the commonly used strategy for
the control group was the Traditional method (42%). All participants for each group

143
computed this item correctly. No highlighting significance was found regarding
participants’ performance and their use of strategies.
Table 41
The Results of Pre-Interviews on Addition Operations
Addition
Item Group Strategy Example % Used
Quintile % Correct
10 + 76 = DT (N=11)
Basic fact 86 45 2, 3, 4, 2, 2 100
Adding by place 10 + 70 + 6 = 86 45 2, 3, 2, 3, 3 100
Traditional 86 10 2 100
OA (N=15)
Basic fact 86 67 3, 2, 3, 1, 2 5, 2, 2, 3, 4
100
Adding by place 10 + 70 + 6 = 86 27 4, 2, 4, 2 100
Traditional 86 6 4 100
control (N=12)
Basic fact 86 33 5, 4, 4, 2 100
Adding by place 10 + 70 + 6 = 86 25 2, 2, 5 100
Traditional 86 42 2, 3, 5, 3, 2 100
22 + 17 + 11 =
DT Adding by place (20 + 10 + 11) + (2 + 7 + 1) = 50
18 2, 3 50
Rearranging numbers
22 + 11 + 17 = 50; 17 + 11 + 22 = 50
73 3, 3, 2, 2, 3, 4, 2, 2
88
Adding up 22 + 20 + 11 – 3 = 50 9 3 100
OA Adding by place (20 + 10 + 11) + (2 + 7 + 1) = 50
13 4, 4 100
Rearranging numbers
22 + 11 + 17 = 50; 17 + 11 + 22 = 50
47 2, 3, 2, 2, 2, 2, 4, 2
88
Decomposing 22 + 7= 29, 29 + 10= 39, 39 + 11 = 50
7 3 100
Traditional 50 27 1, 4, 5, 3 75
control Adding by place (20 + 10 + 11) + (2 + 7 + 1) = 50
17 2, 5 100
Rearranging numbers
22 + 11 + 17 = 50; 17 + 11 + 22 = 50; 22 + 17 + 11 = 50
58 5, 4, 2, 5, 4, 2, 2 86
Decomposing 11 + 7 + 32 = 50 8 3 100
Traditional 50 17 2, 3 50
39 + 399 + 3999=
DT Compensation 40+ 400 + 4000 – 3 = 4437
36 3, 2, 3, 2 75
Traditional 4437 18 4, 2 0
IDK 46 2, 3, 2, 3, 3
OA Compensation 40+ 400 + 4000 – 3 = 4437
27 4, 5, 4, 4 75
IDK 73 3, 2, 3, 1, 2, 4, 2, 2, 2, 3, 2
control Compensation 40+ 400 + 4000 – 3 = 4437
42 3, 5, 4, 4, 5, 75
Traditional 8 1 100
Rounding up 4000 + 400 + 37= 4437 8 5 100
IDK 42 2, 2, 2, 2, 3

144
When interviewing for the medium difficulty item 22 + 17 + 11, more than two-
thirds of participants (73%) in the DT group used the strategy Rearranging numbers,
followed by the strategy Adding by place (18%). The examples are shown in Table 41.
Rearranging numbers (47%) was the most commonly used strategy for the OA group.
Then about one-third of them (27%) used the Traditional method. Similarly, about two-
thirds of participants (58%) in the control group computed this using the Rearranging
numbers strategy. Various levels of the participants for all groups in the second, third,
fourth, and fifth quintiles used the strategy Rearranging numbers, shown in Table 41.
The percentages of correct responses of this strategy for each group is relatively high
(e.g., 88%, 88%, and 86%, respectively).
In the high difficulty item 39 + 399 + 3999, as expected I Do Not Know (IDK) was
the most common responses for all three groups (46%, 73%, and 42%, respectively),
especially, for the lower quintile participants. The OA group showed the highest
percentage of the IDK response. Then the Compensation (36%, 27%, and 42%) and the
Traditional method (18% for DT group and 42% for the control group) strategies were
followed. Compensation was employed with the 2nd and 3rd quintiles for the DT, upper
quintiles for the OA, and upper quintiles for the control group. The percentage of correct
responses to the Compensation was quite high for all three groups (75% for each).
Table 42 summarizes the results of pre-interviews on the subtraction operation.
As expected, when interviewing for the low difficulty item 40 – 6, almost all respondents
for all three groups correctly computed. The commonly used strategies for all three
groups were Basic fact (36%, 54%, and 67%, respectively) and Subtracting by ones

145
place (27%, 33%, and 17%, respectively). No remarkable results regarding quintile
differences were found for this item.
Table 42
The Results of Pre-Interviews on Subtraction Operations
Subtraction
Item Group Strategy Example % Used
Quintile % Correct
40 – 6 = DT (N=11)
Basic fact 34 36 3, 4, 2, 2 100
Count up 6 + 4 = 10 so 34 18 2, 2 50
Subtracting by ones place
10 – 6 = 4 so 34 27 3, 3, 3 100
Traditional 34 18 2, 3 100
OA (N=15)
Basic fact 34 54 4, 3, 1, 2, 4, 5, 2, 4
100
Count up 6 + 4 = 10 so 34 13 2, 3 100
Subtracting by ones place
10 – 6 = 4 so 34 33 3, 2, 2, 2, 4 100
control (N=12)
Basic fact 34 67 3, 5, 4, 2, 5, 4, 2, 2
100
Subtracting by ones place
10 – 6 = 4 so 34;
17 3, 5 100
Count back 39, 38, 37, 36, 35, 34 8 2 100
Decomposing 40 – 5 – 1 = 34 8 2 100
63 – (13 + 3 ) =
DT Decomposing 13 – 6 = 7, 60 – 7 – 10 = 47; 63 – 10 – 6 = 47; 63 – 10 – 3 – 3 = 47
36 3, 2, 4, 3 100
Traditional 47 64 2, 3, 2, 3, 3, 2, 2
57
OA Decomposing 63 – 6 – 10 = 47; 63 – 3 – 10 – 3 = 47
20 2, 3, 4 100
Rearranging 63 – 13 – 3 = 47 20 3, 4, 5 67
Traditional 47 40 4, 1, 4, 2, 2, 3 67
IDK 20 2, 2, 3
control Decomposing 63 – 3 – 13 = 47; 63 – 10 – 6 = 47
42 2, 4, 4, 5, 5 100
Traditional 47 42 2, 2, 3, 3, 5 100
IDK 16 2, 2
607 – 299 = DT Compensation 607 – 300 + 1 = 308 74 2, 3, 2, 3, 4, 2, 3, 2
50
Traditional 308 18 2, 3 50
IDK 18 2, 3
OA Compensation 607 – 300 + 1 = 308 54 2, 2, 2, 3, 4, 4, 4, 5
63
Traditional 308 13 2, 4 50
IDK 33 1, 2, 2, 3, 3
control Compensation 607 – 300 + 1 = 308 67 2, 2, 3, 4, 4 5, 5, 5,
63
Traditional 308 25 2, 2, 2, 3 75
146
When interviewing for the medium difficulty subtraction item 63 – (13 + 3),
Decomposing and Traditional methods were the two commonly used strategies for all
three groups. A review of the strategies used for this item revealed a heavy reliance on
mental images of the Traditional method for all three groups (64%, 40%, and 42%,
respectively). In other words, the PTS first added the two numbers inside the
parentheses (e.g., 13 + 3) and then subtracted 16 from 63 by vertically lining up. Then
the strategy Decomposing (36%, 20%, and 42%, respectively) was followed. The
strategy Rearranging was observed only in the OA group. The percentage of the
correct response of this item was 67%. The error was found when removing the
parenthesis, computing the item 63 – 13 + 3, instead of computing 63 – 13 – 3.
Regarding percentages of correct responses, the experimental groups showed
relatively low percentages of correct responses (57% and 67% correct) when using the
Traditional method than that of the control group (100% correct). Specifically, the
respondents in the control group revealed that the Traditional method was used for the
lower quintiles and Decomposing was employed for the upper quintiles.
When interviewing for the high difficulty item 607 – 299, the two strategies
Compensation (74%, 54%, and 67%, respectively) and Traditional method (18%, 13%,
and 25%, respectively) were distinctively used for all three groups. Relatively, the
interviewees in the upper quintiles computed this with the strategy Compensation and
the lower quintiles used the Traditional method. As expected, the percentages of correct
responses were relatively low (50%, 63%, and 63%, respectively). The common
mistake found in this item was that participants computed this item like 607 – 300 – 1

147
instead computing like 607 – 300 + 1. The IDK response (33%) was relatively high in
the OA group (See Table 42).
Table 43 summarizes the results of pre-interviews on the multiplication items: 14
× 6, 42 × 20, and 99 ×13. As for the low difficulty item 14 × 6, the most common
strategies observed were Traditional method (46%, 53%, and 75%, respectively) and
Distributive property (27%, 20%, and 17%) for all three groups. Surprisingly, about half
of the participants for each group used a mental image of the Traditional method when
computing two digits times one digit item. The more surprising aspects of this item were
that the percentages of correct responses (80%, 88%, and 67%) were relatively low
when compared to the strategy Distributive property (100% correct for all groups) and,
also, upper quintiles computed this item using the Traditional method.
When interviewing for the medium difficulty item 42 × 20, an unexpected result
was observed. Basic fact (27%, 27%, and 42%, respectively) was the most common
strategy used for a majority of the upper quintiles in all three groups. The strategy Basic
fact means that they memorized the fact of multiplication tables and immediately
retrieve from memory (e.g., 42 × 2 = 48, then add 0 at the end). The researcher named
this strategy as Basic fact as PTS stated during interviews. Unlike the scores of pre-
MCT performance, a majority of participants correctly computed this item mentally.
Surprisingly, IDK responses (37% and 47%) were relatively higher for both the DT and
the OA groups, compared to the IDK response in the control group (8%). For the high
difficulty item 99 × 13, the strategies Compensation and the Traditional method were the
commonly used strategies for all three groups (See Table 48). As expected, the

148
percentage of correct responses of the item was pretty low. Only 27% of the DT group
tried to compute this item using Compensation but their responses were all incorrect.
Table 43
The Results of Pre-Interviews on Multiplication Operations Multiplication
Item Group Strategy Example %Used Quintile %Correct
14 × 6 =
DT (N=11)
Repeated add. 14 + 14 = 28, 28 + 28 + 28 = 84; 14 + … + 14 = 84
18 3, 3 50
Distributive prop.
(10 + 4) × 6 = 84 27 2, 2, 3 100
Traditional 84 46 2, 2, 3, 3, 4 80
IDK 9
OA (N=15)
Using multi. and repeated add.
14 × 2 = 28, 28 + 28 = 56, 56 + 28 = 84
7 2 100
Distributive prop.
(10 + 4) × 6 = 84 20 3, 4, 4 100
Using factors 14 × 2 = 28, 28 × 3 = 84 7 2 0
Traditional 84 53 2, 2, 2, 3, 3, 4, 4, 5
88
IDK 13 1, 2
control (N=12)
Distributive prop.
(10 + 4) × 6 = 84 17 4, 5 100
Traditional 84 75 2, 2, 2, 2, 3, 3, 4, 5, 5
67
IDK 8
42 × 20 =
DT Basic fact 42 × 2 = 84, then add 0 27 3, 3, 4 100 Distributive prop.
(40 + 2) × 20 = 840 18 2, 3 100
Using factors 42 × 10 × 2 = 840 9 3 0
Traditional 840 9 2 100
IDK 37 2, 2, 2, 3
OA Basic fact 42 × 2 = 84, then add 0 at the end
27 4, 4, 4, 4 100
Using factors 42 × 10 × 2 = 840 13 2, 5 100
Traditional 840 13 2, 3 100
IDK 47 1, 2, 2, 2, 2, 2, 3
control Basic fact 42 × 2 = 84, then add 0 42 2, 3, 4, 5, 5 100
Using factors 42 × 10 × 2 = 840 17 3, 5 100
Using multi. and repeated add.
42 × 10 = 420, 420 + 420 = 840
8 3 100
Traditional 25 2, 2, 2 100
IDK 8 2
99 × 13 =
DT Compensation 100 × 13 – 13 = 1287 27 2, 3, 3 0
Traditional 1287 9 2 0
IDK 64 2, 2, 2, 3, 3, 3, 3
OA Compensation 100 × 13 – 13 = 1287 33 4, 4, 5, 5 33
Traditional 1287 7 3 0
IDK 60 1, 2, 2, 2, 2, 2, 2, 3, 3, 4
control Compensation 100 × 13 – 13 = 1287 58 3, 3, 4, 4, 5, 5, 5 86
Traditional 1287 8 2 100
IDK 33 2, 2, 2, 2
149
Only about one-third of the participants in the OA group used the strategy
Compensation, but their percentage of correct responses was low also (33%). However,
more than half of the participants in the control group used Compensation strategy and
their percentage of correct response was quite high (86%). Accordingly, both the DT
and OA groups presented higher IDK responses (64% and 60%), while the control
group showed somewhat lower IDK responses (33%).
The results of the pre-interviews for the division operation are summarized in
Table 44. The following items were posed to solve mentally: 24 ÷ 8, 700 ÷ 25, and 342 ÷
18. During the interviews of the low difficulty item 24 ÷ 8, all of the participants (82% and
80%, respectively) for all groups considered this as basic fact and computed this Using
inverse multiplication (e.g., 8 × 3 = 24). The percentages of correct responses were very
high (91%, 100%, and 91%, respectively). No specific preference between upper or
lower quintiles was found in the use of the strategy on this item.
For the medium difficulty item 700 ÷ 25, it was revealed that a majority of
interviewees correctly computed this, although it was determined to be a medium
difficulty item (See Table 44). The most commonly used strategy was Using known
multiplication fact (55%, 53%, and 67%, respectively) for interviewees mostly in the
middle and upper quintiles for each group. The percentages of correct response were
quite high (100%, 88%, and 88%, respectively). Then the strategy Traditional method
was followed with low percentages of correct response (9%, 7%, and 13%). On the
other hand, interviewees in the lower quintiles for both DT and OA groups were
observed with higher IDK responses (36% and 40%, respectively) than that of the
control group (8%).

150
Table 44 The Results of Pre-Interviews on Division Operations
The results of the high difficulty item 342 ÷ 18, confirmed that the IDK responses
(73%, 93%, and 67%), obviously, was the most widely used strategy for all three
groups, regardless of the quintile levels. In the use of strategy, the control group
showed more various strategies, then followed by the DT, and the OA.
Division
Item Group Strategy Example % Used
Quintile % Correct
24 ÷ 8 = DT (N=11)
Basic fact 8 × 3 = 24 100 2, 2, 2, 2, 2, 3, 3, 3, 3, 3, 2
91
OA (N=15)
Basic fact 8 × 3 = 24 100 1, 2, 2, 2, 2, 2, 2, 3, 3, 3, 4, 4, 4, 4 ,5
100
control (N=12)
Basic fact 8 × 3 = 24 100 2, 2, 2, 2, 2, 3, 3, 4, 4, 5, 5, 5
92
700 ÷ 25 = DT Using known multiplication fact
25 × 4 = 100, 4 × 7 = 28
55 2, 3, 3, 3, 3, 4 100
Traditional 28 9 2 100
IDK 36 2, 2, 2, 3,
OA Using known multiplication fact
25 × 4 = 100, 4 × 7 = 28
53 2, 2, 3, 4, 4, 4, 4, 5
88
Traditional 7 2 100
IDK 40 1, 2, 2, 2, 3, 3,
control Using known Multiplication fact
25 × 4 = 100, 4 × 7 = 28
67 2, 2, 2, 2, 3, 4, 4, 5
88
Chunking method 25 × 20 = 500, 25 ×10 = 250, 750 – 50 = 700 so 30 – 2 = 28
8 5 100
Traditional 13 2, 5 100
IDK 8 3
342 ÷ 18 = DT Using known Multiplication fact
18 × 19 = 342 9 3 0
Traditional 18 2, 3 50
IDK 73 2, 2, 2, 2, 3, 3, 3, 4
OA Traditional 19 7 5 100
IDK 93 1, 2, 2, 2, 2, 2, 2, 3, 3, 3, 4, 4, 4, 4
control Using pattern 18 × 20 = 360, 18 × 19 = 342
17 5, 5 100
Using fraction
8 5 100
Traditional 19 8 2 100
IDK 67 2, 2, 2, 2, 3, 3, 4, 4
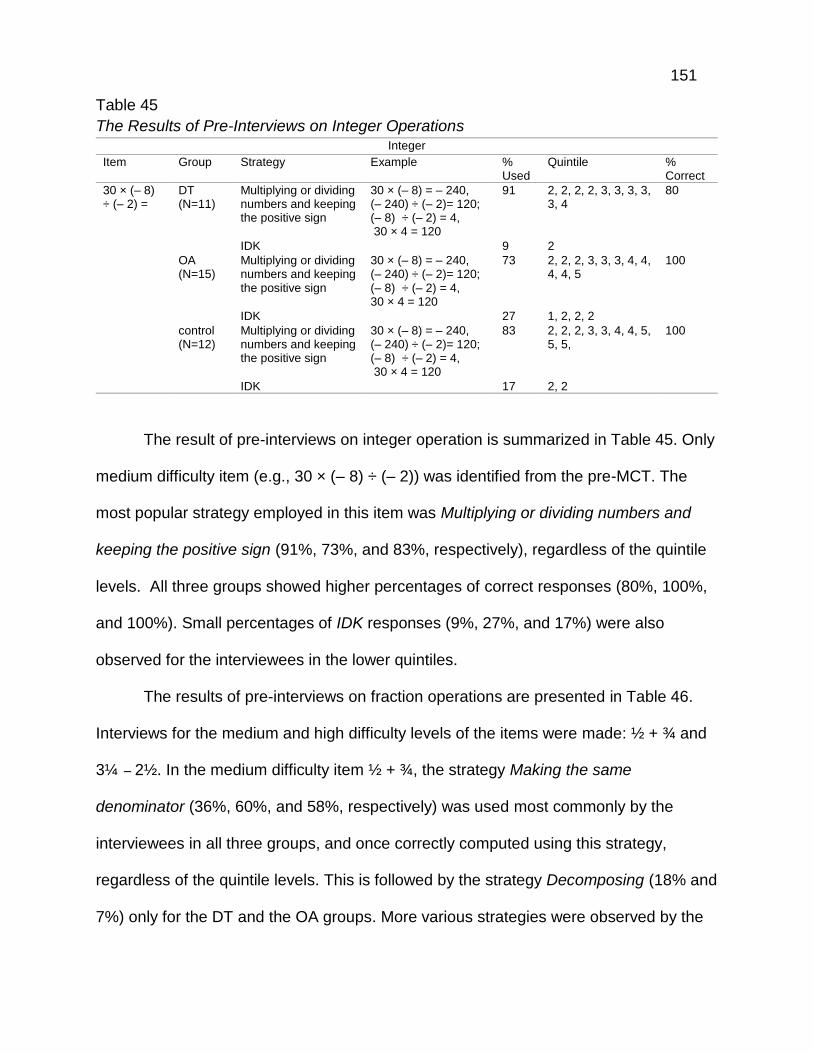
151
Table 45
The Results of Pre-Interviews on Integer Operations Integer
Item Group Strategy Example % Used
Quintile % Correct
30 × (– 8) ÷ (– 2) =
DT (N=11)
Multiplying or dividing numbers and keeping the positive sign
30 × (– 8) = – 240, (– 240) ÷ (– 2)= 120; (– 8) ÷ (– 2) = 4, 30 × 4 = 120
91 2, 2, 2, 2, 3, 3, 3, 3, 3, 4
80
IDK 9 2
OA (N=15)
Multiplying or dividing numbers and keeping the positive sign
30 × (– 8) = – 240, (– 240) ÷ (– 2)= 120; (– 8) ÷ (– 2) = 4, 30 × 4 = 120
73 2, 2, 2, 3, 3, 3, 4, 4, 4, 4, 5
100
IDK 27 1, 2, 2, 2
control (N=12)
Multiplying or dividing numbers and keeping the positive sign
30 × (– 8) = – 240, (– 240) ÷ (– 2)= 120; (– 8) ÷ (– 2) = 4, 30 × 4 = 120
83 2, 2, 2, 3, 3, 4, 4, 5, 5, 5,
100
IDK 17 2, 2
The result of pre-interviews on integer operation is summarized in Table 45. Only
medium difficulty item (e.g., 30 × (– 8) ÷ (– 2)) was identified from the pre-MCT. The
most popular strategy employed in this item was Multiplying or dividing numbers and
keeping the positive sign (91%, 73%, and 83%, respectively), regardless of the quintile
levels. All three groups showed higher percentages of correct responses (80%, 100%,
and 100%). Small percentages of IDK responses (9%, 27%, and 17%) were also
observed for the interviewees in the lower quintiles.
The results of pre-interviews on fraction operations are presented in Table 46.
Interviews for the medium and high difficulty levels of the items were made: ½ + ¾ and
3¼ – 2½. In the medium difficulty item ½ + ¾, the strategy Making the same
denominator (36%, 60%, and 58%, respectively) was used most commonly by the
interviewees in all three groups, and once correctly computed using this strategy,
regardless of the quintile levels. This is followed by the strategy Decomposing (18% and
7%) only for the DT and the OA groups. More various strategies were observed by the

152
Table 46
The Results of Pre-Interviews on Fraction Operations
interviewees in the control group. What is interesting about the data in this table is that
the computational errors were observed by the interviewees mostly in the lower quintiles
Fraction
Item Group Strategy Example % Used
Quintile % Correct
1
2 +
3
4 = DT
(N=11) Making the same denominator
2
4 +
3
4 =
5
4 36 3, 3, 3, 4 100
Decomposing 1
2 +
2
4 +
1
4 =
1
2 +
1
2 +
1
4 = 1
1
4 18 2, 3 100
Cf) Miscomputation 1
2 +
3
4 =
1+3
2+4 =
3
6 =
1
2 45 2, 2, 2, 2, 3
OA (N=15)
Making the same denominator
2
4 +
3
4 =
5
4 60 2, 2, 2, 3, 3,
4, 4, 4, 5 100
Decomposing 1
2 +
2
4 +
1
4 =
1
2 +
1
2 +
1
4 = 1
1
4 7 4 100
IDK 13 1, 2 Cf) Miscomputation 1
2 +
3
4 =
1+3
2+4 =
3
6 =
1
2;
1
2 +
3
4 =
4
8 =
1
2
20 2, 2, 3
control (N=12)
Making the same denominator
2
4 +
3
4 =
5
4 58 2, 2, 3, 4, 5,
5, 5 100
Converting to decimals 0.5 + 0.75= 1.25 8 4 100
Converting to money 50¢ + 75¢ = 125¢ 8 3 100 Cf) Miscomputation Same as an example in DT 25 2, 2, 2
31
4 – 2
1
2
=
DT Subtracting the whole number and making the same denominator
3 – 2 = 1, 11
4 -
1
2 =
5
4−
2
4 =
3
4 9 3 100
Converting to improper fraction
13
4−
2
5 =
13
4 -
10
4 = =
3
4 9 4 100
IDK 36 2, 3, 3, 3
Cf) Miscomputation 3 – 2 = 1, 11
4 –
1
2= 1
1
2; 45 2, 2, 2, 2, 3
OA Converting to improper fraction
13
4−
2
5 =
13
4 -
10
4 = =
3
4 33 4, 4, 4, 4, 5 100
IDK 40 1, 2, 2, 2, 3, 3
Cf) Miscomputation Same as examples in DT 27 2, 2, 2, 3
control Converting to improper fraction
13
4−
2
5 =
13
4 -
10
4 = =
3
4 25 2, 4, 5 100
Converting to decimals 3 – 2 = 1, 1.25 – 0.5 = 0.75 17 3, 4 100
Subtracting whole number and making the same denominator
3 – 2 = 1, 11
4 -
1
2 =
5
4−
2
4 =
3
4 8 5 100
Subtracting whole number and fraction
3 – 2 = 1, 1
4 -
2
4 = -
1
4,
so 1 - 1
4=
3
4
8 3 100
IDK 8 2
Cf) Miscomputation Same as examples in DT 33 2, 2, 2, 5

153
(45%, 20%, and 25%, respectively) for all three groups. For example, they computed
this item like this: ½ + ¾ = (1+3) / (2+4) = 3/6 = ½ or ½ + ¾ = 4/8 = ½.
When interviewing for the high difficulty item 3¼ – 2½, the IDK responses were
commonly observed (36% and 40%, respectively) for the lower and middle quintiles in
both the DT and OA groups. In contrast, only 8% of interviewees in the control group
answered IDK. Converting to improper fraction (9%, 33%, and 25%) was the most
popular strategy used by the upper quintiles in all three groups. The control group
presented more various strategies, compared to the other groups. What stands out on
the table was that two types of computational errors (45%, 27%, and 33%, respectively)
were also observed for all three groups. For instance, 3 – 2=1, 1¼ - ½ =1½. All
interviewees using strategies, except for IDK and Miscomputation, showed 100% of
correct responses.
Table 47 summarizes the results of pre-interviews on the decimal operation. The
following items were introduced: 5.6 + 3.7, 0.5 × 48, and 0.02 × 0.4. In terms of the low
difficulty item 5.6 + 3.7, the two most popular strategies were Adding by place (27%,
40%, and 58%, respectively) and mental image of Traditional method (64%, 40%, and
42%) for all three groups, regardless of the levels of quintiles. Unsurprisingly, high
percentages of correct responses were found when using both strategies. Computation
errors were observed for both the DT and OA groups. For example, some of the lower
quintile respondents did not know how to add the decimal point when adding two
decimal numbers. More specifically, although they added the ones place 5 + 3 = 8
correctly, miscalculation was shown when adding the tenth place 0.6 + 0.7 = 0.13. Then
the answer became 8.13 after adding 8 and 0.13 together.
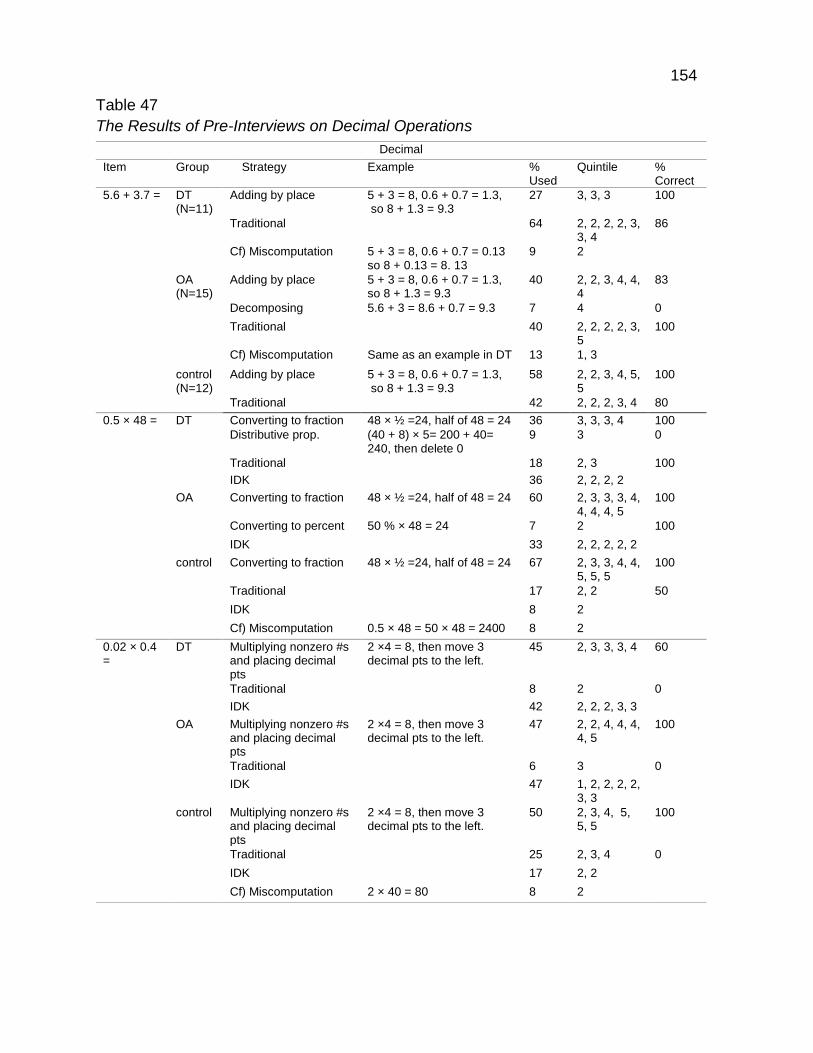
154
Table 47
The Results of Pre-Interviews on Decimal Operations
Decimal
Item Group Strategy Example % Used
Quintile % Correct
5.6 + 3.7 = DT (N=11)
Adding by place 5 + 3 = 8, 0.6 + 0.7 = 1.3, so 8 + 1.3 = 9.3
27 3, 3, 3 100
Traditional 64 2, 2, 2, 2, 3, 3, 4
86
Cf) Miscomputation 5 + 3 = 8, 0.6 + 0.7 = 0.13 so 8 + 0.13 = 8. 13
9 2
OA (N=15)
Adding by place 5 + 3 = 8, 0.6 + 0.7 = 1.3, so 8 + 1.3 = 9.3
40 2, 2, 3, 4, 4, 4
83
Decomposing 5.6 + 3 = 8.6 + 0.7 = 9.3 7 4 0
Traditional 40 2, 2, 2, 2, 3, 5
100
Cf) Miscomputation Same as an example in DT 13 1, 3
control (N=12)
Adding by place 5 + 3 = 8, 0.6 + 0.7 = 1.3, so 8 + 1.3 = 9.3
58 2, 2, 3, 4, 5, 5
100
Traditional 42 2, 2, 2, 3, 4 80
0.5 × 48 = DT Converting to fraction 48 × ½ =24, half of 48 = 24 36 3, 3, 3, 4 100
Distributive prop. (40 + 8) × 5= 200 + 40= 240, then delete 0
9 3 0
Traditional 18 2, 3 100
IDK 36 2, 2, 2, 2
OA Converting to fraction 48 × ½ =24, half of 48 = 24 60 2, 3, 3, 3, 4, 4, 4, 4, 5
100
Converting to percent 50 % × 48 = 24 7 2 100
IDK 33 2, 2, 2, 2, 2
control Converting to fraction 48 × ½ =24, half of 48 = 24 67 2, 3, 3, 4, 4, 5, 5, 5
100
Traditional 17 2, 2 50
IDK 8 2
Cf) Miscomputation 0.5 × 48 = 50 × 48 = 2400 8 2
0.02 × 0.4 =
DT Multiplying nonzero #s and placing decimal pts
2 ×4 = 8, then move 3 decimal pts to the left.
45 2, 3, 3, 3, 4 60
Traditional 8 2 0
IDK 42 2, 2, 2, 3, 3
OA Multiplying nonzero #s and placing decimal pts
2 ×4 = 8, then move 3 decimal pts to the left.
47 2, 2, 4, 4, 4, 4, 5
100
Traditional 6 3 0
IDK 47 1, 2, 2, 2, 2, 3, 3
control Multiplying nonzero #s and placing decimal pts
2 ×4 = 8, then move 3 decimal pts to the left.
50 2, 3, 4, 5, 5, 5
100
Traditional 25 2, 3, 4 0
IDK 17 2, 2
Cf) Miscomputation 2 × 40 = 80 8 2

155
For the medium difficulty item 0.5 × 48, a majority of interviewees computed this
item using the strategy Using fraction (36%, 60%, and 67%, respectively) (See Table
47). Mostly, this strategy was used by a majority of interviewees in the middle and upper
quintiles with 100% of correct responses. On the other hand, IDK responses (36% and
33%) in the DT and OA groups were relatively higher than that of the control group (8%)
and used by the second lowest quintile. The mental image of the Traditional method
(18% and 17%) was found in the DT and control groups. A computational error was
observed in the control group. One interviewee moved the decimal point to the right by
multiplying 100 in both terms, then ended up with 2400 as an answer.
For the high difficulty item 0.02 × 0.4, the most popular strategy observed for all
three groups was Multiplying nonzero numbers and placing decimal points (See Table
47). About half of the participants (45%, 47%, and 50%) used this strategy, regardless
of the quintile levels. One hundred percent of correct responses were shown in both the
OA and control groups, but only sixty percent correct responses were shown in the DT
group. The Traditional method (8%, 6%, and 25%) was also observed for all three
groups. Surprisingly, the percentages of correct responses of this mental image of the
Traditional methods in all groups were zero. As expected, higher IDK responses (42%
and 47%) were also observed with the interviewees in the low and middle quintiles in
the DT and OA group, while only 17% of IDK responses were shown in the control
group. A computational error was also found by an interviewee in the control group. He
moved decimal points to the right by multiplying 100 in both terms, then ended up
answering 2 × 40 = 80.
156
Lastly, Table 48 provides the results of pre-interviews on the percent operation.
Three difficulty level items were presented: 1% × 200, 25% of 20, and 24% × 80. In the
low difficulty item 1% × 200, Basic fact (55%, 33%, and 42%) was the most widely used
strategy for all three groups and used by the interviewees in the 2nd, 3rd, and 4th
quintiles. 100% of correct responses were observed for all three groups. In the use of
the strategies, the OA and the control groups provided various responses compared to
the DT group. Interestingly, some participants (18% and 20%) in the DT and OA groups
correctly found the answer using Guessing. They were not able to explain how they got
the answer 2. IDK responses (27%, 27%, and 17%) were also observed for the
interviewees in the lower and middle quintiles.
When interviewing for the medium difficulty item 25% of 20, the results revealed
that more than two-thirds of participants (73%, 80%, and 67%, respectively) among
three groups computed this item using the strategy Converting percent to fraction and
showed higher percentages of correct responses (88%, 92%, and 100%). None of the
interviewees changed percentages to decimals or used Traditional method.
Consequently, low percentages of IDK responses (18%, 20%, and 25%) were observed
for all groups. In the high difficulty item 24% × 80, the results showed higher
percentages of IDK responses (73%, 80%, and 58%) for each group, as expected. The
control showed more various responses compared to the strategies used by participants
in the DT and OA groups (See Table 48). It is apparent from this table that some
interviewees used the strategy Guessing. They were aware of the fact that 25% of 80 =
20, so the answer should be less than 20; however, no correct answers were found
among three groups.
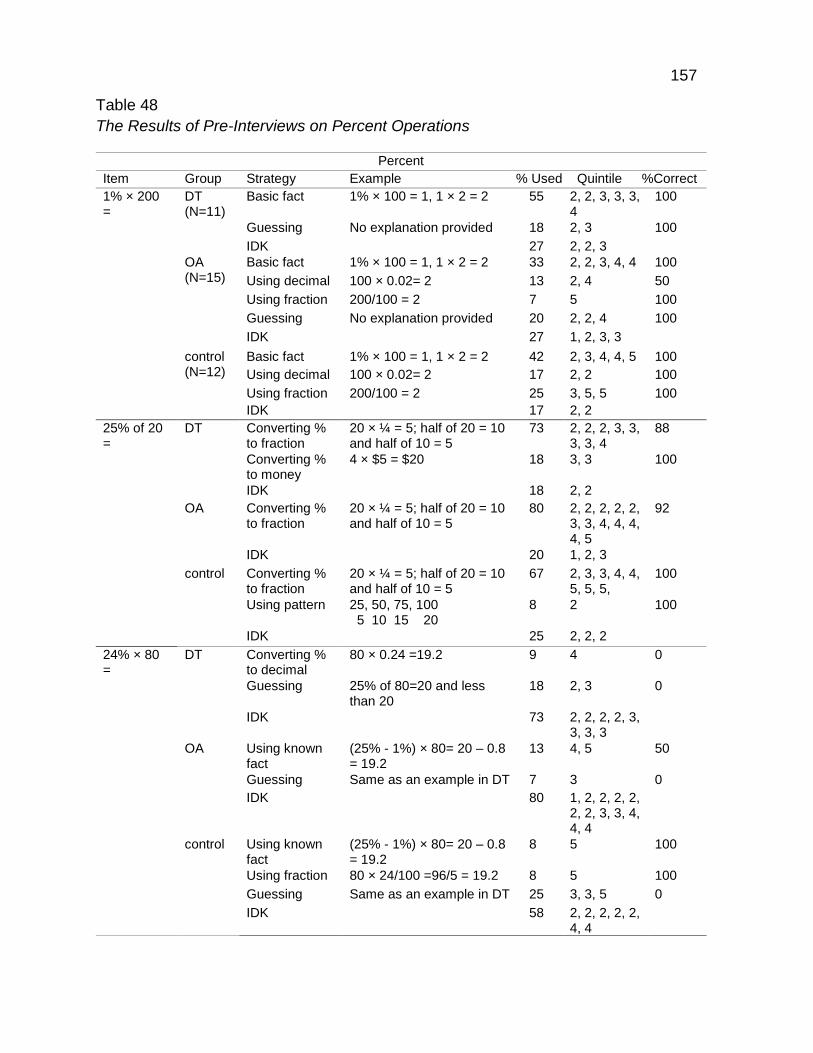
157
Table 48
The Results of Pre-Interviews on Percent Operations
Percent
Item Group Strategy Example % Used Quintile %Correct
1% × 200 =
DT (N=11)
Basic fact 1% × 100 = 1, 1 × 2 = 2 55 2, 2, 3, 3, 3, 4
100
Guessing No explanation provided 18 2, 3 100
IDK 27 2, 2, 3
OA (N=15)
Basic fact 1% × 100 = 1, 1 × 2 = 2 33 2, 2, 3, 4, 4 100
Using decimal 100 × 0.02= 2 13 2, 4 50
Using fraction 200/100 = 2 7 5 100
Guessing No explanation provided 20 2, 2, 4 100
IDK 27 1, 2, 3, 3
control (N=12)
Basic fact 1% × 100 = 1, 1 × 2 = 2 42 2, 3, 4, 4, 5 100
Using decimal 100 × 0.02= 2 17 2, 2 100
Using fraction 200/100 = 2 25 3, 5, 5 100
IDK 17 2, 2
25% of 20 =
DT Converting % to fraction
20 × ¼ = 5; half of 20 = 10 and half of 10 = 5
73 2, 2, 2, 3, 3, 3, 3, 4
88
Converting % to money
4 × $5 = $20 18 3, 3 100
IDK 18 2, 2
OA Converting % to fraction
20 × ¼ = 5; half of 20 = 10 and half of 10 = 5
80 2, 2, 2, 2, 2, 3, 3, 4, 4, 4, 4, 5
92
IDK 20 1, 2, 3
control Converting % to fraction
20 × ¼ = 5; half of 20 = 10 and half of 10 = 5
67 2, 3, 3, 4, 4, 5, 5, 5,
100
Using pattern 25, 50, 75, 100 5 10 15 20
8 2 100
IDK 25 2, 2, 2
24% × 80 =
DT Converting % to decimal
80 × 0.24 =19.2 9 4 0
Guessing 25% of 80=20 and less than 20
18 2, 3 0
IDK 73 2, 2, 2, 2, 3, 3, 3, 3
OA Using known fact
(25% - 1%) × 80= 20 – 0.8 = 19.2
13 4, 5 50
Guessing Same as an example in DT 7 3 0
IDK 80 1, 2, 2, 2, 2, 2, 2, 3, 3, 4, 4, 4
control Using known fact
(25% - 1%) × 80= 20 – 0.8 = 19.2
8 5 100
Using fraction 80 × 24/100 =96/5 = 19.2 8 5 100
Guessing Same as an example in DT 25 3, 3, 5 0
IDK 58 2, 2, 2, 2, 2, 4, 4

158
In the use of strategies, one interviewee in the upper quintile for the DT group
computed this using the strategy Converting percent to decimal and gave all correct
answers. Two interviewees in the upper quintiles for the OA group used the strategy
Using known fact and 50% of them gave correct responses. Two interviewees in the
upper quintiles for the OA group used the strategy Using known fact and 50% of them
gave correct response as well. Accordingly, the strategies Using known fact and Using
Fraction were employed each by one interviewee in the highest quintile in the control
group and they gave all correct responses.
The Results of Post-interviews. The PTS (N=36) in all three groups
participated in the post-interviews after intervention. The goal of the post-interviews is to
identify the different use of mental computation strategies for each operation and to
explore the relationship between participants’ mental computation performance in terms
of the levels of quintiles and their flexibility in the experimental groups and the control
group.
As shown in Table 40, the participants were divided to five quintiles based on the
results of the post-MCT. Generally, almost the same PTS participated in the post-
interviews for all groups, and more participants moved up to next quintiles for the DT
and OA groups after intervention. Specifically, 12 participants for the DT group (e.g., 3
from the 2nd, 5 from the 3rd, 2 from the 4th, and 2 from the 5th quintiles) and 15 for the
OA group (e.g., 1 from the 1st, 2 from the 2nd, 5 from the 3rd, 2 from the 4th, and 5 from
the 5th quintiles) participated in the post-interviews. There was a difference in the control
group regarding the number of participants in the 5th quintile. Specifically, among 9 PTS,
4 of them were from the 2nd quintile, 3 were from the 3rd quintile, and 2 from the 4th

159
quintile. No PTS in the 5th quintile participated in the post-interviews. Three levels of
problems for each operation were selected based on the difficulty levels (e.g., high,
medium, and low difficulty) on the post-MCT. In total, the twenty-three problems were
selected from the post-MCT for the post-interviews.
Tables 49 to 56 summarize the results of the analysis in regards to operations on
addition (2 items), subtraction (3 items), multiplication (3 items), division (3 items),
integer (3 item), fraction (3 items), decimal (3 items), and percent (3 items).
Table 49 summarizes the results of the post-interviews on addition operations.
The following two items were introduced: 143 + 59 and 18 + 27 + 37. When computing
the low difficulty item 143 + 59, the strategies participants used were varied. The DT
group computed this item using the following strategies: Adding by place (33%),
Compensation (50%), and a mental image of the Traditional method (17%). The most
interesting result to emerge from the data is that a majority of participants in the middle
and higher quintiles used the strategy Adding by place and Compensation in the DT and
control group. On the other hand, more participants from the middle to higher quintiles
in the OA group used the Traditional method (40%). The percentage of correct
responses of this item was 100%, except for the strategy Traditional method (83%) in
the control group.
In the item 18 + 27+ 37, it was revealed that participants in the DT and OA group
used more strategies than their counterpart, the control group, as shown in Table 54.
The strategy commonly used for the DT and OA was Adding by place (33% and 40%).
Then, the strategies Decomposing (25% and 13%), Adding up (25% and 13%), and
Rearranging numbers (17% and 13%) followed. No participants used the strategy

160
Traditional method in the DT group. Strikingly, about two-thirds of the participants (67%)
in the control group used the strategy Traditional method.
Table 49
The Results of Post-Interviews on Addition Operations
Addition
Item Group Strategy Example % Used
Quintile % Correct
143 + 59 = DT (N=12)
Adding by place
140 + 50 + 3 + 9 = 202
33 2, 2, 4, 5 100
Compensation 143 + 60 – 1= 202 50 3, 3, 3, 3, 4, 5 100
Traditional 202 17 2, 3 100
OA (N=15)
Adding by place
140 + 50 + 3 + 9 = 202
27 3, 3, 5, 5 100
Compensation 143 + 60 – 1 = 202; 160+ 43 – 1 = 202
20 3, 3, 5 100
Decomposing 143 + 50 + 9 = 202 7 4 100
Traditional 202 40 2, 2, 3, 4, 5, 5 100
IDK 7 1
control (N=9)
Compensation 143 + 60 – 1 = 202 22 3, 3 100
Decomposing 143 + 50 + 9 = 202 11 4 100
Traditional 202 67 2, 2, 2, 2, 3, 4 83
18 + 27 + 37=
DT Decomposing 27 + 37 + 10 + 8 = 82; 20 + 30 + 18 + 7 + 7 = 82
25 3, 5, 5 67
Adding up 20 + 25 + 37 = 82; 20 + 30 + 40 – 8 = 82; 30 + 40 + 12 = 84
25 3, 4, 4 100
Rearranging numbers
45 + 37 = 82; 27 + 37 = 64, 64 + 18 = 82
17 3, 3 50
Adding by place
10 + 20 + 30 + 7 + 7 + 8 = 82
33 2, 2, 2, 3 100
OA Decomposing 27 + 37 + 10 + 8 = 82; 20 + 30 + 18 + 7 + 7 = 82
13 3, 4 100
Adding up 20 + 25 + 37 = 82; 20 + 30 + 40 – 8 = 82; 30 + 40 + 12 = 84
13 3, 4 100
Rearranging numbers
45 + 37 = 82; 27 + 37 = 64, 64 + 18 = 82
13 2, 5 100
Adding by place
10 + 20 + 30 + 7 + 7 + 8 = 82
40 3, 3, 5, 5, 5, 5 100
Traditional 82 20 1, 2, 3, 33
control Decomposing 20+ 30+ 14 + 10 + 8 = 82 11 3 100
Adding by place
10 + 20 + 30 + 7 + 7 + 8 = 82
22 2, 4 100
Traditional 82 67 2, 2, 2, 3, 3, 4 83
161
In the use of mental computation addition strategies, Decomposing and Adding
up were implemented for the participants in the middle and higher quintiles for the DT
and OA groups. The most striking result to emerge from these interviews was that the
participants in the lower quintiles for the DT group used the strategy Adding by place,
while the participants in the higher quintiles for the OA group used the same strategy.
The use of Traditional method (33% and 83%) for the OA and the control group led to
frequent errors.
Overall, Traditional method was not used in the DT group. In contrast, the OA
and control group employed a mental image of the Traditional method (20% and 67%).
This is because the researcher directly demonstrated a variety of strategies involving
mental computation addition in the DT group. Although the OA group highly encouraged
participants to create their own strategies, they may have felt comfortable and safe
when using the Traditional method. The control group may use a formal instruction
strategy like Traditional method as they learned their school years.
Table 50 illustrates the results of the post-interviews on subtraction operations.
The participants were interviewed using the following three difficulty level items: 36 – 8,
95 – 37, and 807 – 399. During the interviews of the item 36 – 8, a variety of strategies
were observed for all the three groups. The most popular strategies for the DT group
were Decomposing (25%) and Compensation (25%). These strategies were shown for
the participants in the middle and higher quintiles. There were three popular strategies
used by the OA group. Count back (47%) was the most popular strategy. This was
followed by the strategies Subtracting by place (20%) and Decomposing (20%). The

162
Table 50
The Results of Post-Interviews on Subtraction Operations
Subtraction
Item Group Strategy Example % Used Quintile % Correct
36 – 8 = DT (N=12)
Basic fact 28 8 5 100
Subtracting by place
6 – 8 = –2, 30 – 2 = 28
17 2, 4 100
Count back 35, 34, …, 29, 28 17 2, 3 100
Decomposing 36 – 6 – 2 = 28; 30 – 8 + 6 = 28
25 2, 4, 5 100
Using addition 8 + 8 = 16, 16 + 20 = 36 8 3 100
Compensation 36 – 10 + 2 = 28 25 3, 3, 3 100
OA (N=15)
Basic fact 28 13 3, 5 100
Subtracting by place
6 – 8 = – 2, 30 – 2 = 28
20 4, 5, 5, 100
Count back 35, 34, …, 29, 28 47 1, 2, 2, 3, 3, 3, 3 86
Decomposing 36 – 6 – 2 = 28; 30 – 8 + 6 = 28
20 4, 5, 5 100
control (N= 9)
Basic fact 28 11 2 100
Using addition 8 + 8 = 16, 16 + 20 = 36 11 4 100
Decomposing 36 – 6 – 2 = 28; 30 – 8 + 6 = 28
44 3, 3, 4, 5 100
Compensation 36 – 10 + 2 = 28 22 2, 2 100
Traditional 28 11 2 100
95 – 37= DT Subtracting by place
90 – 30 = 60; 5 – 7 = –2, 60 – 2 = 58; 90 – 30 – 7 + 5 = 58
25 2, 2, 4 33
Compensation 95 – 40 +3 = 58; 90 – 40 + 5 + 3 = 58
33 3, 3, 4, 5 50
Decomposing 95 – 35 – 2 = 58 25 3, 3, 5, 100
Traditional 58 17 2, 3 100
OA Subtracting by place
90 – 30 = 60; 5 – 7 = –2, 60 – 2 = 58; 90 – 30 – 7 + 5 = 58
20 4, 5, 5 100
Compensation 95 – 40 +3 = 58 7 5 100
Decomposing 95 – 35 – 2 = 58; 90 – 37 + 5= 58
27 3, 3, 4, 5 75
Traditional 58 47 1, 2, 2, 3, 3, 3, 5 43
control Decomposing 95 – 30 – 7 = 58 33 3, 4, 4 100
Traditional 58 67 2, 2, 2, 2, 3, 3 50
807 – 399 =
DT Compensation 807 – 400 + 1= 408 92 2, 2, 3, 3, 3, 3, 3, 4, 4, 5, 5
64
Traditional 408 8 2 0
OA Compensation 807 – 400 + 1= 408 73 2, 3, 3, 3, 3, 4, 4, 5, 5, 5, 5
73
Traditional 408 27 1, 2, 3, 5, 50
control Compensation 807 – 400 + 1= 408 67 2, 2, 3, 3, 4, 4 83
Subtracting by place
7 – 9= – 2, 800 – 390 = 410, 410 – 2 = 408
11 2 0
Traditional 408 22 2, 3 100

163
strategy Count back was implemented by almost all of the participants in the middle and
lower quintiles.
In contrast, the other two strategies were observed from the participants in the
middle and higher quintiles. In addition, the two strategies Decomposing (44%) and
Compensation (22%) were observed for the participants in the control group. Here,
Decomposing was used for the participants in the middle and higher quintiles, while
Compensation was used in the lower quintiles. The percentages of the correct
responses given for this item were 100%, except one (e.g., Count back from the OA
group - 86% correct).
During the interviews of the item 36 – 8, a variety of strategies were observed for
all the three groups. The most popular strategies for the DT group were Decomposing
(25%) and Compensation (25%). These strategies were shown for the participants in
the middle and higher quintiles. There were three popular strategies used by the OA
group. Count back (47%) was the most popular strategy. This was followed by the
strategies Subtracting by place (20%) and Decomposing (20%). The strategy Count
back was implemented by almost all of the participants in the middle and lower quintiles.
In contrast, the other two strategies were observed from the participants in the middle
and higher quintiles. In addition, the two strategies Decomposing (44%) and
Compensation (22%) were observed for the participants in the control group. Here,
Decomposing was used for the participants in the middle and higher quintiles, while
Compensation was used in the lower quintiles. The percentages of the correct
responses given for this item were 100%, except one (e.g., Count back from the OA
group - 86% correct).
164
Comparing the three results of the medium difficulty item 95 – 37 showed that all
three groups showed similar strategies. As indicated in Table 50, the most commonly
used strategy for the DT group was Compensation (33%) and followed by Subtracting
by place and Decomposing (25% each). The Compensation strategy was implemented
for the interviewees in the middle and higher quintiles. However, the percentage of
correct responses of this item was 50%. In contrast, the Traditional method was used
for the interviewees in the lower quintiles. The most popular strategy used for the OA
group was the Traditional method (47%) and was implemented by the majority of
participants in the lower quintiles. This was followed by the strategies Decomposing
(27%) and Subtracting by place (20%) and were implemented for the participants in the
middle and higher quintiles. However, the percentage of correct responses in the
Traditional method was relatively low (43%). Compensation (7%) was the least used
strategy in this group, used by one interviewee in the highest quintile. The participants
in the control group used two strategies Decomposing (33%) and Traditional method
(67%). Remarkably, the former was used by participants in the upper quintiles and the
latter for the lower quintiles. In general, the mental image of the Traditional method was
observed by the interviewees in the lower quintiles for all of the three groups. The
percentages of correct responses for the Traditional method in the OA and the control
group were relatively low (47% and 67%, respectively), compared to other strategies.
In the high difficulty item 807 – 399, it was revealed that the two popular
strategies Compensation (92% and 73%) and Traditional method (8% and 27%) were
observed for the DT and OA groups. The percentages of correct responses of the
Compensation (92% and 73%) in the DT and OA groups were much higher than that of
165
the Traditional method (0% and 50%).The control group showed three different
strategies in order, Compensation (67%), Traditional method (22%), and Subtracting by
place (11%). Mostly, the Traditional method was implemented by the interviewees in the
lower quintiles. The reason showing relatively low percentages of correct responses
(64%, 73%, and 84% correct) in the use of the strategy Compensation was that a
majority of interviewees computed this item using the incorrect computation method
such as 807 – 400 – 1= 406, rather than showing 807 – 400 +1 = 408.
Table 51 provides the results obtained from the post-interviews on multiplication
operation. The three different level of difficulty problems followed: 7 × 16, 24 × 30, and
99 × 180. For the low difficulty problem 7 × 16, it was found that Distributive property
and Traditional method were the two commonly used strategies for all three groups. In
the use of mental multiplication strategies, about half of the interviewees (50%) in the
DT group computed this item using the Traditional method and followed by the
Distributive property (33%), Using factors (8%), and Using known multiplication fact
(8%). For the OA group, more than half of the interviewees computed this item using
Distributive property (60%) and followed by Traditional method (20%). Similarly, the
control group showed that more than half of the interviewees used the strategy
Distributive property (56%) and followed by the Traditional method (33%). The
percentages of correct responses of the item 7 × 16 using Distributive property (75%,
89%, and 80%) were relatively high and used by a majority of the interviewees in the
middle and higher quintiles. The Traditional method was observed for all groups but the
percentages of correct responses (67% correct for each) were lower than that of

166
Distributive property. IDK responses (20% and 11%) were observed for the OA and
control groups.
Table 51
The Results of Post-Interviews on Multiplication Operations
Multiplication
Item Group Strategy Example % Used Quintile % Correct
7 × 16 = DT (N=12)
Distributive prop. (10 + 6) × 7 = 112 (10 – 3) × 16 = 112
33 3, 3, 4, 5 75
Using factors 7 × 4 × 4 =28 × 4= 112 8 5 100
Using known multiplication fact
7 × 15 = 105, 105 + 7= 112
8 3 100
Traditional 112 50 2, 2, 2, 3, 3, 4 67
OA (N=15)
Distributive prop. (10 + 6) × 7 = 112 60 3, 3, 3, 3, 4, 4, 5, 5, 5
89
Traditional 112 20 3, 5, 5 67
IDK 20 1, 2, 2
control (N=9)
Distributive prop. (10 + 6) × 7 = 112; (4 + 3) × 16 = 112
56 2, 3, 3, 3, 4, 80
Traditional 112 33 2, 2, 4 67
IDK 11 2
24 × 30 = DT Basic fact 24 × 3 = 72, then add 0 at the end
33 3, 3, 5 100
Distributive prop. (20 + 4) × 30 = 720 8 3 100 Using factors 24 × 3 × 10 = 720 8 5 100
Traditional 720; Vertically multiply 24 and 3, then add 0 at the end
25 2, 3, 4 100
IDK 25 2, 2, 3
OA Basic fact 24 × 3 = 72, then add 0 at the end
20 5, 5, 5 100
Using factors 24 × 3 × 10 = 720 13 3, 5 100 Distributive prop. (20 + 4) × 30 = 720 7 4 100
Traditional 720; Vertically multiply 24 and 3, then add 0 at the end
27 3, 3, 3, 5 100
IDK 33 1, 2, 2, 3, 4
control Distributive prop. (20 + 4) × 30 = 720 11 3 100
Basic fact 24 × 3 = 72, then add 0 11 4 100
Traditional 720; Vertically multiply 24 and 3, then add 0
56 2, 2, 3, 3, 4 80
IDK 22 2, 2
99 × 180 =
DT Compensation 180 × 100 – 180 = 17820 58 2, 3, 3, 3, 4, 5, 5 43
Traditional 17820 8 3 0
IDK 33 2, 2, 3, 4
OA Compensation 180 × 100 – 180 = 17820 47 3, 4, 5, 5, 5, 5, 5 71
Traditional 17820 7 4 0
IDK 47 1, 2, 2, 3, 3, 3, 3
control Compensation 180 × 100 – 180 = 17820 56 2, 3, 3, 4, 4 40
Traditional 17820 11 2 0
IDK 33 2, 2, 3

167
The results of the medium difficulty item 24 × 30 indicated that Basic fact and
Traditional method were the two popular strategies implemented by interviewees for the
DT and OA groups. More than one-third of interviewees (33%) in the middle and upper
quintiles for the DT group considered this item as Basic fact. One-fourth of the DT group
(25%) computed this item using the Traditional method. Then the strategies Distributive
property (8%) and Using factors (8%) followed. Those strategies were observed by the
interviewees in the middle and upper quintiles. Accordingly, one-fifth of the interviewees
(20%) in the OA group computed this item using the strategy Basic fact used by
interviewees in the fifth quintile and Traditional method (27%). The percentage of
correct responses of this item was 100% for both groups. In the control group, more
than half of the interviewees (56%) used the strategy Traditional method, regardless of
the level of quintiles. The percentage of the correct responses of this method was
relatively low (80%).
The results of the high difficulty multiplication item 99 × 180 showed that
Compensation was the strategy commonly used by all the three groups. About half of
the interviewees (58%, 47%, and 56%, respectively) in the middle and upper quintiles
for each group computed this item using Compensation strategy. Interesting
observations to emerge from the interviews comparison were that the interviewees who
used the strategy Traditional methods had a 0% of the correct response and that IDK
responses were high (33%, 47%, and 33%, respectively) for all three groups.
The results obtained from the division operation can be compared in Table 52.
Participants were asked to compute items at three difficulty levels: 56 ÷ 7, 80 ÷ 16, and
468 ÷ 18. When interviewing for the low difficulty item 56 ÷ 7, it was revealed that Basic

168
fact (83%, 87%, and 78%) was the strategy most of the interviewees implemented for all
three groups, as expected. The percentage of the correct responses was 100%. Then,
the strategies Using double number multiplication and Using patterns followed (8%
each).
The interview results of the medium difficulty item 80 ÷ 16 indicated that the
interviewees for each group used the following strategies: Using multiplication fact,
Using fraction, Traditional method, and IDK responses. Among them, the Traditional
method and Using multiplication fact were two commonly used strategies for each
group, regardless of the levels of quintiles. The most surprising aspect of the interviews
was that more than one-third of participants (33% each) in the DT and control group and
more than half of the interviewees (53%) in the OA group implemented the Traditional
method. The percentages of correct responses using Traditional method (40%, 50%,
and 33%) were quite low for each group.
The results of the high difficulty interview item 468 ÷ 18 revealed that the DT group used
more division mental computation strategies than other groups, as indicated in Table
57. The strategies Traditional method and Using fraction were the most common
strategies observed in all groups. The participants in the upper quintiles (8%, 13%, and
11%) for each group implemented the strategy Using fraction. The majority of
interviewees in the middle and upper quintiles for the DT and OA groups implemented
the Traditional method (33% and 27%). In contrast, the participants (22%) in the second
quintile for the control group applied the Traditional method. The percentage of correct
responses for the use of Traditional method was 0% for the DT and control group, while

169
the OA group had 100% correct responses of the Traditional method. This is because
more upper quintiles applied this method than other groups.
Table 52
The Results of Post-Interviews on Division Operations
Division
Item Group Strategy Example % Used
Quintile % Correct
56 ÷ 7 = DT (N=12)
Basic fact 8, 7 × 8 = 56 83 2, 2, 3, 3, 3, 3, 3, 4, 5, 5
100
Using double number 8 × 8 =64, 64 – 8 = 56 8 4 100 Using patterns 7 × 7= 49, 7 × 8= 56 8 2 100
OA (N=15)
Basic fact 8, 7 × 8 = 56 87 2, 3, 3, 3, 3, 3, 4, 4, 5, 5, 5, 5, 5
100
IDK 1, 2
control (N=9)
Basic fact 8, 7 × 8 = 56 78 2, 2, 2, 3, 3, 4, 4 100
Using patterns 7 × 7= 49, 7 × 8= 56 22 2, 3 100
80 ÷ 16 =
DT Using multiplication fact 16 × 5= 80 20 3, 4, 5 100
Using fraction 80 = 5 16
7 5 100
Traditional 5 33 2, 2, 3, 3, 3 40
IDK 20 2, 3, 4
OA Using multiplication fact 16 × 5= 80 13 3, 5 50
Using fraction 80 = 5 16
13 4, 5 100
Traditional 5 53 3, 3, 3, 3, 4, 5, 5, 5,
50
IDK 20 1, 2, 2
control Using multiplication fact 16 × 5= 80 33 2, 3, 4 67
Using fraction 80 = 5 16
11 4 100
Traditional 5 33 2, 2, 3 33
IDK 22 2, 3
468 ÷ 18 =
DT Using factors 468 ÷ 2 ÷ 9 = 26 3 0
Using multiplication fact 20 × 18 = 360, 6 × 18 = 108, 20 + 6 = 26
8 5 100
Using fraction 468 = 52, 52 = 26 9 2
8 5 100
Traditional 26 33 2, 3, 3, 3 0
IDK 42 2, 2, 3, 4, 4
OA Using fraction 468 = 52, 52 = 26 9 2
13 4, 5 50
Traditional 26 27 4, 5, 5, 5 100
IDK 60 1, 2, 2, 3, 3, 3, 3, 3, 5
control Using fraction 468 = 52, 52 = 26 9 2
11 4 100
Traditional 26 22 2, 2, 0
IDK 67 2, 2, 3, 3, 3, 4
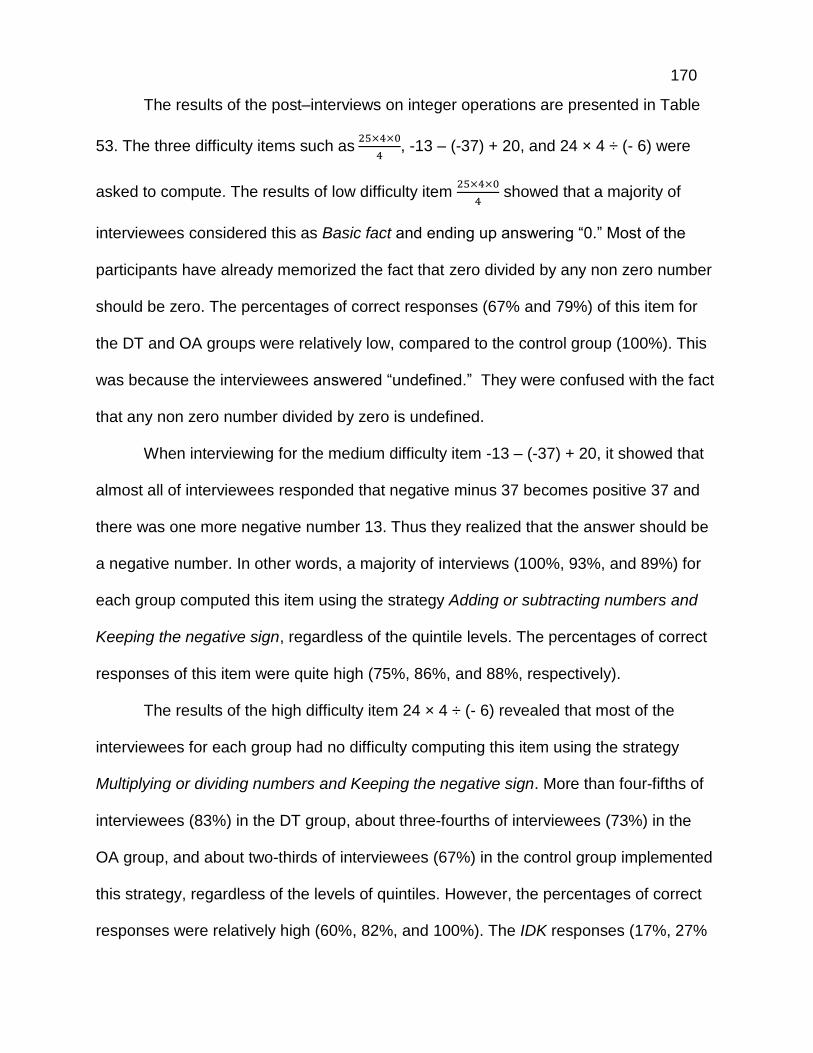
170
The results of the post–interviews on integer operations are presented in Table
53. The three difficulty items such as 25×4×0
4, -13 – (-37) + 20, and 24 × 4 ÷ (- 6) were
asked to compute. The results of low difficulty item 25×4×0
4 showed that a majority of
interviewees considered this as Basic fact and ending up answering “0.” Most of the
participants have already memorized the fact that zero divided by any non zero number
should be zero. The percentages of correct responses (67% and 79%) of this item for
the DT and OA groups were relatively low, compared to the control group (100%). This
was because the interviewees answered “undefined.” They were confused with the fact
that any non zero number divided by zero is undefined.
When interviewing for the medium difficulty item -13 – (-37) + 20, it showed that
almost all of interviewees responded that negative minus 37 becomes positive 37 and
there was one more negative number 13. Thus they realized that the answer should be
a negative number. In other words, a majority of interviews (100%, 93%, and 89%) for
each group computed this item using the strategy Adding or subtracting numbers and
Keeping the negative sign, regardless of the quintile levels. The percentages of correct
responses of this item were quite high (75%, 86%, and 88%, respectively).
The results of the high difficulty item 24 × 4 ÷ (- 6) revealed that most of the
interviewees for each group had no difficulty computing this item using the strategy
Multiplying or dividing numbers and Keeping the negative sign. More than four-fifths of
interviewees (83%) in the DT group, about three-fourths of interviewees (73%) in the
OA group, and about two-thirds of interviewees (67%) in the control group implemented
this strategy, regardless of the levels of quintiles. However, the percentages of correct
responses were relatively high (60%, 82%, and 100%). The IDK responses (17%, 27%
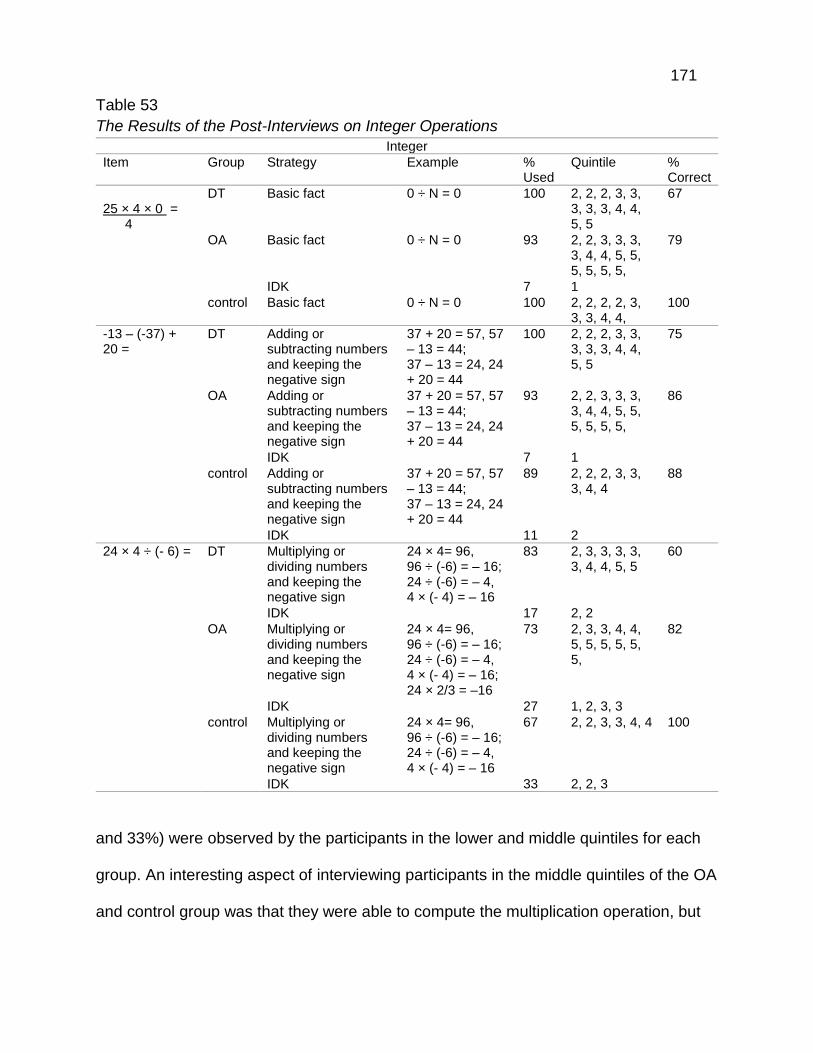
171
Table 53
The Results of the Post-Interviews on Integer Operations
Integer
Item Group Strategy Example % Used
Quintile % Correct
25 × 4 × 0 = 4
DT Basic fact 0 ÷ N = 0 100 2, 2, 2, 3, 3, 3, 3, 3, 4, 4, 5, 5
67
OA Basic fact 0 ÷ N = 0 93 2, 2, 3, 3, 3, 3, 4, 4, 5, 5, 5, 5, 5, 5,
79
IDK 7 1
control Basic fact 0 ÷ N = 0 100 2, 2, 2, 2, 3, 3, 3, 4, 4,
100
-13 – (-37) + 20 =
DT Adding or subtracting numbers and keeping the negative sign
37 + 20 = 57, 57 – 13 = 44; 37 – 13 = 24, 24 + 20 = 44
100 2, 2, 2, 3, 3, 3, 3, 3, 4, 4, 5, 5
75
OA Adding or subtracting numbers and keeping the negative sign
37 + 20 = 57, 57 – 13 = 44; 37 – 13 = 24, 24 + 20 = 44
93 2, 2, 3, 3, 3, 3, 4, 4, 5, 5, 5, 5, 5, 5,
86
IDK 7 1
control Adding or subtracting numbers and keeping the negative sign
37 + 20 = 57, 57 – 13 = 44; 37 – 13 = 24, 24 + 20 = 44
89 2, 2, 2, 3, 3, 3, 4, 4
88
IDK 11 2
24 × 4 ÷ (- 6) = DT Multiplying or dividing numbers and keeping the negative sign
24 × 4= 96, 96 ÷ (-6) = – 16; 24 ÷ (-6) = – 4, 4 × (- 4) = – 16
83 2, 3, 3, 3, 3, 3, 4, 4, 5, 5
60
IDK 17 2, 2
OA Multiplying or dividing numbers and keeping the negative sign
24 × 4= 96, 96 ÷ (-6) = – 16; 24 ÷ (-6) = – 4, 4 × (- 4) = – 16; 24 × 2/3 = –16
73 2, 3, 3, 4, 4, 5, 5, 5, 5, 5, 5,
82
IDK 27 1, 2, 3, 3
control Multiplying or dividing numbers and keeping the negative sign
24 × 4= 96, 96 ÷ (-6) = – 16; 24 ÷ (-6) = – 4, 4 × (- 4) = – 16
67 2, 2, 3, 3, 4, 4 100
IDK 33 2, 2, 3
and 33%) were observed by the participants in the lower and middle quintiles for each
group. An interesting aspect of interviewing participants in the middle quintiles of the OA
and control group was that they were able to compute the multiplication operation, but
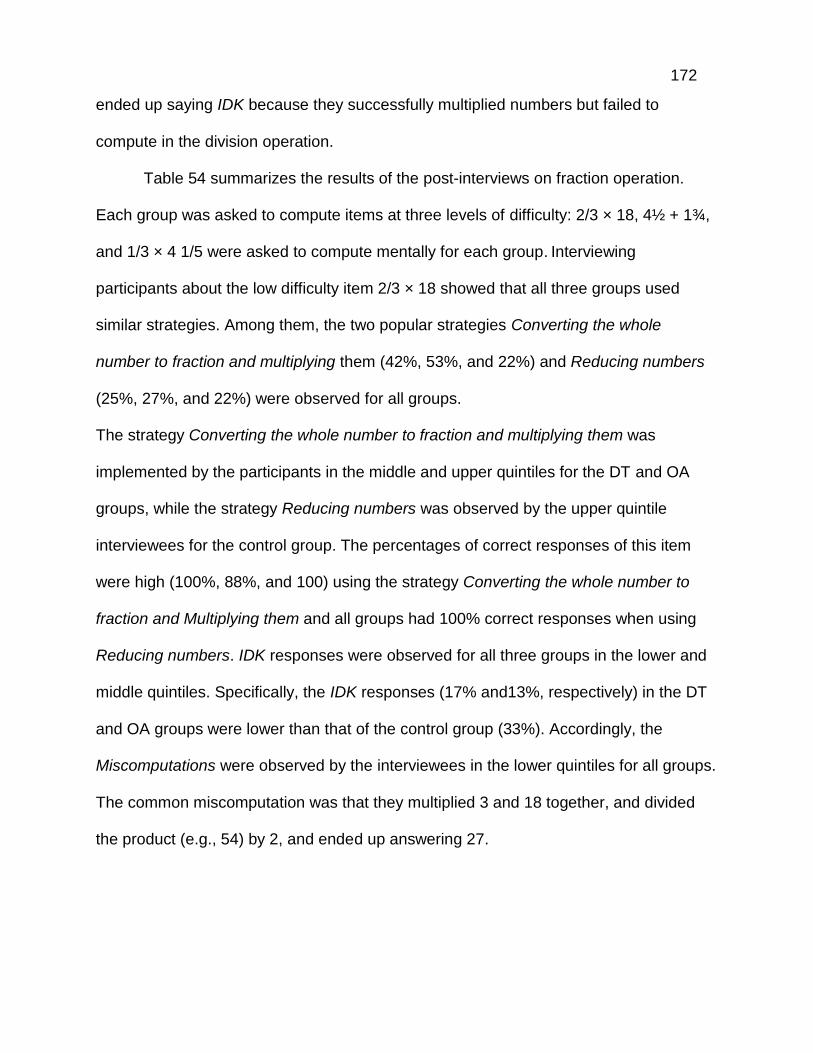
172
ended up saying IDK because they successfully multiplied numbers but failed to
compute in the division operation.
Table 54 summarizes the results of the post-interviews on fraction operation.
Each group was asked to compute items at three levels of difficulty: 2/3 × 18, 4½ + 1¾,
and 1/3 × 4 1/5 were asked to compute mentally for each group. Interviewing
participants about the low difficulty item 2/3 × 18 showed that all three groups used
similar strategies. Among them, the two popular strategies Converting the whole
number to fraction and multiplying them (42%, 53%, and 22%) and Reducing numbers
(25%, 27%, and 22%) were observed for all groups.
The strategy Converting the whole number to fraction and multiplying them was
implemented by the participants in the middle and upper quintiles for the DT and OA
groups, while the strategy Reducing numbers was observed by the upper quintile
interviewees for the control group. The percentages of correct responses of this item
were high (100%, 88%, and 100) using the strategy Converting the whole number to
fraction and Multiplying them and all groups had 100% correct responses when using
Reducing numbers. IDK responses were observed for all three groups in the lower and
middle quintiles. Specifically, the IDK responses (17% and13%, respectively) in the DT
and OA groups were lower than that of the control group (33%). Accordingly, the
Miscomputations were observed by the interviewees in the lower quintiles for all groups.
The common miscomputation was that they multiplied 3 and 18 together, and divided
the product (e.g., 54) by 2, and ended up answering 27.
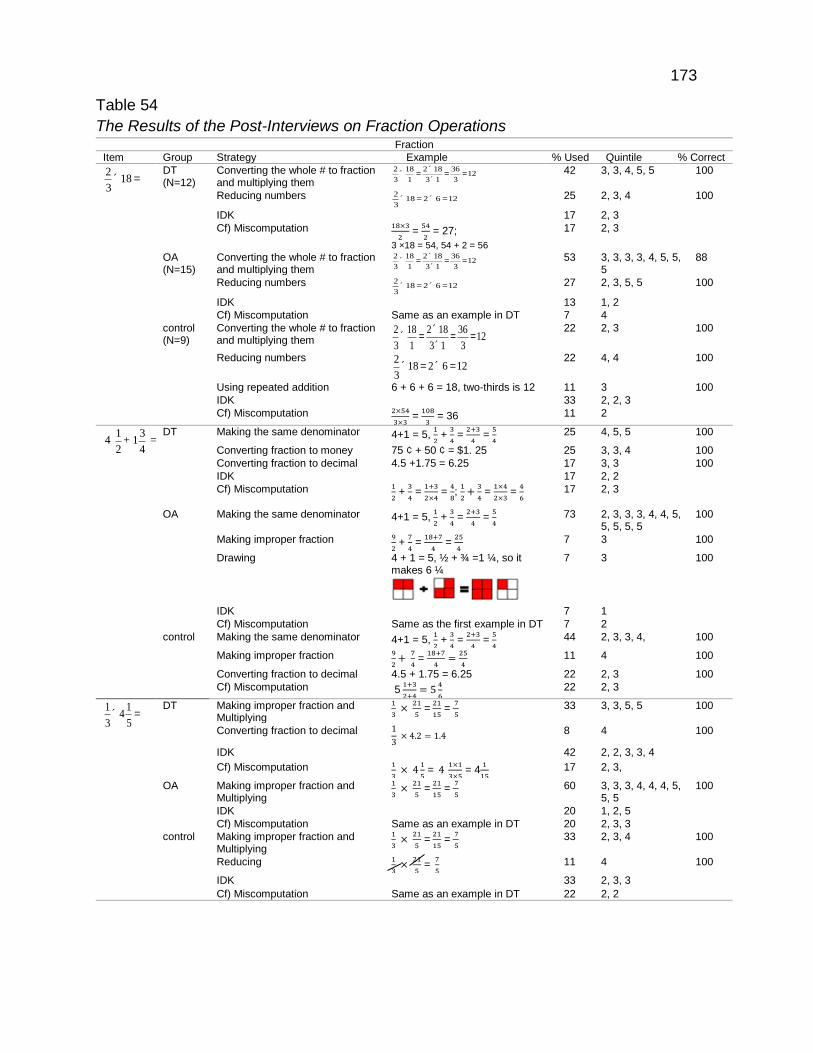
173
Table 54
The Results of the Post-Interviews on Fraction Operations Fraction
Item Group Strategy Example % Used Quintile % Correct
2
3´18 =
DT (N=12)
Converting the whole # to fraction and multiplying them
2
3´
18
1=
2´18
3´1=
36
3=12
42 3, 3, 4, 5, 5 100
Reducing numbers 2
3´18 = 2´ 6 =12
25 2, 3, 4 100
IDK 17 2, 3
Cf) Miscomputation 18×3
2 =
54
2 = 27;
3 ×18 = 54, 54 + 2 = 56
17 2, 3
OA (N=15)
Converting the whole # to fraction and multiplying them
2
3´
18
1=
2´18
3´1=
36
3=12
53 3, 3, 3, 3, 4, 5, 5,
5 88
Reducing numbers 2
3´18 = 2´ 6 =12
27 2, 3, 5, 5 100
IDK 13 1, 2
Cf) Miscomputation Same as an example in DT 7 4
control (N=9)
Converting the whole # to fraction and multiplying them
2
3´
18
1=
2´18
3´1=
36
3=12
22 2, 3 100
Reducing numbers 2
3´18 = 2´ 6 =12 22 4, 4 100
Using repeated addition 6 + 6 + 6 = 18, two-thirds is 12 11 3 100
IDK 33 2, 2, 3
Cf) Miscomputation 2×54
3×3 =
108
3 = 36 11 2
4 1
2+ 1
3
4 =
DT Making the same denominator 4+1 = 5, 1
2 +
3
4 =
2+3
4 =
5
4 25 4, 5, 5 100
Converting fraction to money 75 ¢ + 50 ¢ = $1. 25 25 3, 3, 4 100
Converting fraction to decimal 4.5 +1.75 = 6.25 17 3, 3 100
IDK 17 2, 2
Cf) Miscomputation 1
2 +
3
4 =
1+3
2×4 =
4
8;
1
2+
3
4 =
1×4
2×3 =
4
6 17 2, 3
OA Making the same denominator 4+1 = 5, 1
2 +
3
4 =
2+3
4 =
5
4 73 2, 3, 3, 3, 4, 4, 5,
5, 5, 5, 5 100
Making improper fraction 9
2 +
7
4 =
18+7
4 =
25
4 7 3 100
Drawing 4 + 1 = 5, ½ + ¾ =1 ¼, so it makes 6 ¼
7 3 100
IDK 7 1
Cf) Miscomputation Same as the first example in DT 7 2
control Making the same denominator 4+1 = 5, 1
2 +
3
4 =
2+3
4 =
5
4 44 2, 3, 3, 4, 100
Making improper fraction 9
2+
7
4 =
18+7
4=
25
4 11 4 100
Converting fraction to decimal 4.5 + 1.75 = 6.25 22 2, 3 100
Cf) Miscomputation 5 1+3
2+4= 5
4
6 22 2, 3
1
3´ 4
1
5= DT Making improper fraction and
Multiplying
1
3 ×
21
5 =
21
15 =
7
5 33 3, 3, 5, 5 100
Converting fraction to decimal 1
3 × 4.2 = 1.4 8 4 100
IDK 42 2, 2, 3, 3, 4
Cf) Miscomputation 1
3 × 4
1
5 = 4
1×1
3×5 = 4
1
15 17 2, 3,
OA Making improper fraction and Multiplying
1
3 ×
21
5 =
21
15 =
7
5 60 3, 3, 3, 4, 4, 4, 5,
5, 5 100
IDK 20 1, 2, 5
Cf) Miscomputation Same as an example in DT 20 2, 3, 3
control Making improper fraction and Multiplying
1
3 ×
21
5 =
21
15 =
7
5 33 2, 3, 4 100
Reducing 1
3 ×
21
5 =
7
5 11 4 100
IDK 33 2, 3, 3
Cf) Miscomputation Same as an example in DT 22 2, 2
174
The results of interviews in the medium difficulty item 4 ½ + 1 ¾ showed that the
strategy Making the same denominator was the most popular strategy employed by the
interviewees in the middle and upper quintiles. For the DT group, a quarter of the
interviewees (25%) computed this using the strategy Making the same denominator,
and this was observed by the interviewees in the upper quintiles. Then the two
strategies Converting fraction to money (25%) and Converting fraction to decimal (17%)
were observed by the participants in the middle and upper quintiles. They all had 100%
correct responses. IDK response (17%) and Miscalculation (17%) were also observed
by the interviewees in the lower and middle quintiles. The examples of Miscalculation
were provided in Table 54. As for the OA group, about three-fourths of participants
(73%) computed this item using the strategy Making the same denominator, regardless
of the levels of quintiles. Then the strategies Making improper fraction and the informal
method of Drawing followed (7% each). IDK response and Miscalculation were
observed as well in the lower quintiles. In the control group, slightly less than half of the
interviewees (44%) computed this item using the strategy Making the same
denominator, regardless of the levels of quintiles. Then the two strategies Making
improper fraction (11%) and Converting fraction to decimal (22%) were observed by the
interviewees in the upper and middle quintiles. They had all 100% correct responses.
The results of interviews in the high difficulty item 1/3 × 4 1/5 showed that there were
not many different strategies. Making improper fraction and multiplying (33% and 60%,
respectively) was the strategy most commonly used by the interviewees in the middle
and upper quintiles for the DT and OA groups. In the DT group, the strategy Converting
fraction to decimal (8%) was also observed by the fourth quintile interviewees. Just over

175
one-third of the interviewees (33%) in the control group also computed this item using
the same strategy Making improper fraction and multiplying, regardless of the levels of
quintiles as shown in Table 59. Then the strategy Reducing (11%) was also observed
by the fourth quintile interviewees. Interestingly, they showed 100% correct responses
when using this strategy. As predicted, there were higher percentages of IDK
responses (42%, 20%, and 33%, respectively) for each group, regardless of the levels
of quintiles. The miscalculation was shown in all groups (See Table 54).
Table 55 summarizes the results of the post-interviews on the decimal operation.
There were three difficulty levels of problems: 5.8 + 2.6, 100 × 0.05 ÷ 1000, and 0.2 ×
75. The results of the low difficulty item 5.8 + 2.6 showed a variety of decimal addition
strategies. For the DT group, more than half of the interviewees (58%) computed this
item using the strategy Adding by place, followed by the strategies Decomposing (17%),
and Traditional method (17%). They all had 100 % correct responses. Similarly, the OA
group computed this with the strategies Adding by place (33%), Decomposing (7%),
Ignoring Decimals and Adding Numbers, then placing Decimal Point (7%), and
Traditional method (47%). For both groups, the strategies Adding by place and
Traditional method were mostly observed by the interviewees in the middle and upper
quintiles. The Traditional method showed a low percentage of correct responses (71%),
while other strategies showed 100% correct responses. The miscalculation was also
observed by the interviewees in the lower quintiles. They made errors because of their
lack of understanding in decimal place (e.g., 0.8 + 0.6 = 0.14). In contrast, the control
group showed only two strategies Adding by place (33%) and Traditional method (67%).
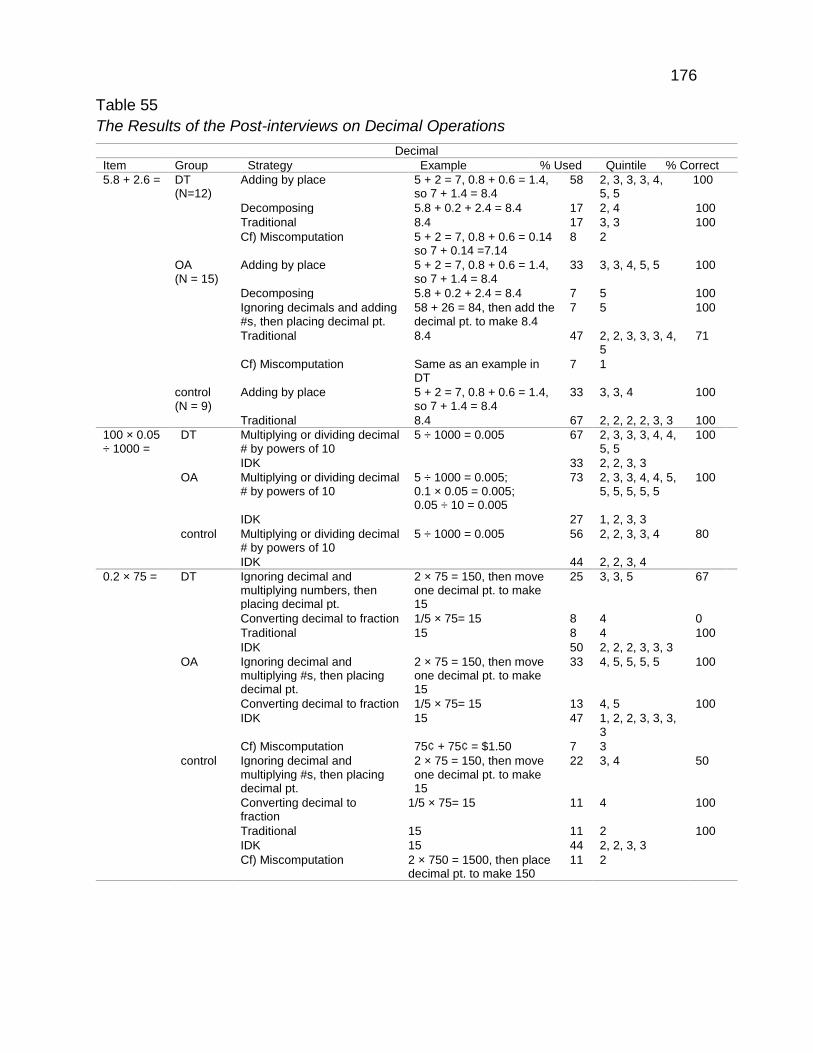
176
Table 55
The Results of the Post-interviews on Decimal Operations
Decimal
Item Group Strategy Example % Used Quintile % Correct
5.8 + 2.6 = DT (N=12)
Adding by place 5 + 2 = 7, 0.8 + 0.6 = 1.4, so 7 + 1.4 = 8.4
58 2, 3, 3, 3, 4, 5, 5
100
Decomposing 5.8 + 0.2 + 2.4 = 8.4 17 2, 4 100
Traditional 8.4 17 3, 3 100
Cf) Miscomputation 5 + 2 = 7, 0.8 + 0.6 = 0.14 so 7 + 0.14 =7.14
8 2
OA (N = 15)
Adding by place 5 + 2 = 7, 0.8 + 0.6 = 1.4, so 7 + 1.4 = 8.4
33 3, 3, 4, 5, 5 100
Decomposing 5.8 + 0.2 + 2.4 = 8.4 7 5 100
Ignoring decimals and adding #s, then placing decimal pt.
58 + 26 = 84, then add the decimal pt. to make 8.4
7 5 100
Traditional 8.4 47 2, 2, 3, 3, 3, 4, 5
71
Cf) Miscomputation Same as an example in DT
7 1
control (N = 9)
Adding by place 5 + 2 = 7, 0.8 + 0.6 = 1.4, so 7 + 1.4 = 8.4
33 3, 3, 4 100
Traditional 8.4 67 2, 2, 2, 2, 3, 3 100
100 × 0.05 ÷ 1000 =
DT Multiplying or dividing decimal # by powers of 10
5 ÷ 1000 = 0.005 67 2, 3, 3, 3, 4, 4, 5, 5
100
IDK 33 2, 2, 3, 3
OA Multiplying or dividing decimal # by powers of 10
5 ÷ 1000 = 0.005; 0.1 × 0.05 = 0.005; 0.05 ÷ 10 = 0.005
73 2, 3, 3, 4, 4, 5, 5, 5, 5, 5, 5
100
IDK 27 1, 2, 3, 3
control Multiplying or dividing decimal # by powers of 10
5 ÷ 1000 = 0.005 56 2, 2, 3, 3, 4 80
IDK 44 2, 2, 3, 4
0.2 × 75 = DT Ignoring decimal and multiplying numbers, then placing decimal pt.
2 × 75 = 150, then move one decimal pt. to make 15
25 3, 3, 5 67
Converting decimal to fraction 1/5 × 75= 15 8 4 0
Traditional 15 8 4 100
IDK 50 2, 2, 2, 3, 3, 3
OA Ignoring decimal and multiplying #s, then placing decimal pt.
2 × 75 = 150, then move one decimal pt. to make 15
33 4, 5, 5, 5, 5 100
Converting decimal to fraction 1/5 × 75= 15 13 4, 5 100
IDK 15 47 1, 2, 2, 3, 3, 3, 3
Cf) Miscomputation 75¢ + 75¢ = $1.50 7 3
control Ignoring decimal and multiplying #s, then placing decimal pt.
2 × 75 = 150, then move one decimal pt. to make 15
22 3, 4 50
Converting decimal to fraction
1/5 × 75= 15 11 4 100
Traditional 15 11 2 100
IDK 15 44 2, 2, 3, 3
Cf) Miscomputation 2 × 750 = 1500, then place decimal pt. to make 150
11 2

177
Apparently, the former was implemented by the interviewees in the middle and upper
quintiles and the latter was by the lower and middles quintiles. Interestingly, the DT
group showed no Traditional method, while the OA and control groups did. This is
because the researcher showed a variety of different strategies in a direct way.
(Although the researcher encouraged participants to create their own strategies, the
participants in the OA may feel safe when they compute items with the Traditional
method. The control group had not been exposed to any instruction, so they felt more
comfortable when using the Traditional method.
In the medium difficulty item 100 × 0.05 ÷ 1000, it was revealed that the most
popular strategy was Multiplying or dividing decimal numbers by powers of 10 for each
group. When computing this item, all of the participants in the DT group first applied
multiplication and then they divided the product 5 by 1000, while the OA group did not
care about the order. The examples were shown in Table 55. This strategy was used
mostly by the interviewees (67% and 73%, respectively) in the middle and upper
quintiles for both DT and OA groups. Both groups showed 100% correct response when
using this strategy. Slightly more than half of the interviewees (56%) in the control group
also computed this with the strategy Multiplying or Dividing Decimal Numbers by
Powers of 10. Mostly they computed multiplication first, but some of them failed to
compute the division operation, so their percentage of correct responses of this item
was 80%. IDK responses (33%, 27%, and 44%, respectively) were found in all groups.
The control group showed the highest IDK response.
The results of high difficulty item 0.2 × 75 found that there were not many
differences among groups in the use of strategies. The most popular response was IDK.

178
The most common two strategies were Ignoring decimal and multiplying numbers, then
placing decimal point (25%, 33%, and 22%, respectively) and Converting decimal to
fraction (8%, 13%, and 11%, respectively). The percentages of correct responses of the
former strategy were 67%, 100%, and 50%, and the latter strategy were 0%, 100%, and
100%. Both strategies were observed by the interviewees in the middle and upper
quintiles, while IDK response was observed by the lower quintiles, as predicted.
The results of the post-interviews on percent operation are shown in Table 56.
The following three difficulty items were provided: 1 % of 175, 75% × 120, and 38% ×
60. The results of 1% of 175 indicated that all of the groups used the same strategies
when computing this item, and no difference between the three groups was evident.
The most common strategies used by each group were Converting percent to decimal
(33%, 40%, and 27%) and Converting percent to fraction (25%, 33%, and 33%), which
were mostly used by the interviewees in the middle and upper quintiles. The most
surprising aspect of the interviews in this item was that the percentages of IDK
responses were fairly high (42%, 27%, and 44%) for participants in the lower and
middle quintiles in each group, although both groups received instruction. The
percentages of correct responses using the strategy Converting percent to decimal was
100%, 83%, and 100% for each group and Converting percent to fraction was 67%,
100%, and 100%.
In the medium difficulty item 75% × 120, the DT and OA groups used more
strategies than that of the control group. The DT group computed this item using the
strategies Converting percent to fraction (42%) and Converting percent to decimal
(17%). Those strategies were implemented by the interviewees in the middle and upper

179
Table 56
The Results of Post-interviews on Percent Operations Decimal
Item Group Strategy Example % Used Quintile % Correct 1% of 175 =
DT (N=12)
Converting % to decimal
0.01 × 175 = 17.5 33 3, 3, 5, 5 100
Converting % to fraction
1 × 175 = 175 = 7 100 100 4
25 2, 4, 4 67
IDK 42 2, 2, 3, 3, 3
OA (N=15)
Converting % to decimal
0.01 × 175 = 17.5 40 3, 4, 5, 5, 5, 5 83
Converting % to fraction
1 × 175 = 175 = 7 100 100 4
33 3, 3, 3, 4, 5 100
IDK 27 1, 2, 2, 3
control (N=9)
Converting % to decimal
0.01 × 175 = 17.5 22 2, 4 100
Converting % to fraction
1 × 175 = 175 = 7 100 100 4
33 2, 3, 4 100
IDK 44 2, 2, 3, 3 75% × 120 =
DT Converting % to decimal
0.75 × 120 =90; (100 + 20 ) × 0.75 = 75 + 15 = 90
17 3, 4 100
Converting % to fraction
¾ × 120 = 90; half of 120 = 60, half of 60 = 90
42 3, 3, 4, 5, 5 100
IDK 42 2, 2, 2, 3, 3
OA Converting % to fraction
¾ × 120 = 90; half of 120 = 60, half of 60 = 90
40 3, 4, 5, 5, 5, 5 100
Using division 30, 60, 90, 120 – 90 is 75% 7 5 100
IDK 53 1, 2, 2, 3, 3, 3, 3, 4
control Converting % to fraction
¾ × 120 = 90; half of 120 = 60, half of 60 = 90; ¾ × 60=45, 45 + 45 = 90
33 2, 4, 4 100
IDK 67 2, 2, 2, 3, 3, 3 38% × 60 =
DT Multiplying whole #s and Moving two decimal pts.
0.38 × 60 = 22.8 8 5 0
Using composition of 10% or 1%
3(10%) × 60 = 18, 8(1%) × 60 = 4.8, so 18 + 4.8 = 22.8
8 5 100
IDK 83 2, 2, 2, 3, 3, 3, 3, 3, 4, 4
OA Multiplying whole #s and Moving two decimal pts.
38 × 60 = 2280, move two decimal pts to the left to make 22.80
27 4, 5, 5, 5 50
Using composition of 10% or 1%
3(10%) × 60 = 18, 8(1%) × 60 = 4.8, so 18 + 4.8 = 22.8
7 5 100
Using known fact (40% - 2%) × 60 =24 – 1.2 = 22.8
7 5 100
IDK 60 1, 2, 2, 3, 3, 3, 3, 3, 4
control Converting % to decimal
0.38 × 60 = 22.8 11 2 0
Multiplying whole #s and Moving two decimal pts.
38 × 60 = 2280, move two decimal pts to the left to make 22.80
11 4 100
Converting % to fraction 38/100 × 60 = 114/5 = 22.8 11 4 100
IDK 66 2, 2, 2, 3, 3, 3

180
quintiles. The OA showed the two strategies Converting percent to fraction (40%) and
Using division (7%) for most of the interviewees in the upper quintiles. The correct
response percentage of this item when using those two strategies was 100%. In
contrast, about one-third of interviewees (33%) in the control group, mostly in the upper
quintiles, computed this item with the strategy Converting percent to fraction, showing
100% correct responses. IDK responses (42%, 53%, and 67%) were observed by the
participants in the lower and middle quintiles for each group, and their percentages of
responses were quite high.
The interview results of high difficulty item 38% × 60 showed the highest IDK
responses (83%, 60%, and 66%) for each group. Only two 5th quintile interviewees
(16%) in the DT group computed this item using the strategies Converting percent to
decimal and Using composition of 10% or 1%. However, one interviewee who computed
this with the strategy Multiplying whole numbers and move the decimal points had an
incorrect answer. For the OA group, about slightly more than one-fourth of interviewees
(27%) computed this with the strategy Multiplying whole numbers and move the decimal
points. However, they had only 50% correct responses. Also, one interviewee in the fifth
quintile applied the strategy Using known fact and had a correct answer and another
interviewee in the same quintile used the strategy Using composition of 10% or 1% and
had a 100% correct response as well. Similarly, for the control group, one interviewee
(11%) in the 2nd quintile used Converting percent to decimal but ended up with an
incorrect answer. One interviewee (11%) from the fourth quintile computed this with the
strategy Multiplying whole numbers and move the decimal points and had a 100%
correct response. One interviewee who computed this item with the strategy Converting
181
percent to fraction from the fourth quintile had a 100% correct answer as well. Overall,
the interviewees in the upper quintiles computed 38% × 60 with the strategy Multiplying
whole numbers and move the decimal points and Converting percent to decimal, but
had relatively low percentages of correct answers, compared to other strategies
provided in Table 56.
A Comparison of Pre-and Post-Interview Item on Each Operation. The
researcher selected one item presented for both pre-and post-interviews for each
operation that had a similar type of problem with different arithmetic numbers (i.e., 22 +
17 + 11 and 18 + 27 + 37). The purpose of the pre-and post-interview comparisons for
each operation was to determine differences in the use of mental computation
strategies and to identify the strategies each participant used. Thus, these interviews
provided insight into the different strategies between the experimental groups and the
control group.
Table 57 reports the percentages of mental computation strategies used by
participants on the pre-and post-interviews for the addition operation. For the DT group,
there was a marked difference in adding three two-digit numbers (e.g., 22 + 17 + 11 and
18 + 27 + 37) found that there was a marked difference in that a majority used the
Rearrange numbers (e.g., 22 + 11 + 17) strategy and on the post-interviews for 18 + 27
+ 37, the common strategy was Adding by place. Next, the strategy Adding up (e.g., 25
+ 20 + 10 – 5) was used by the interviewees in the DT group. The strategy
Decomposing (e.g., 22 + 11 + 10 + 7) was observed by several in the OA and control
groups.
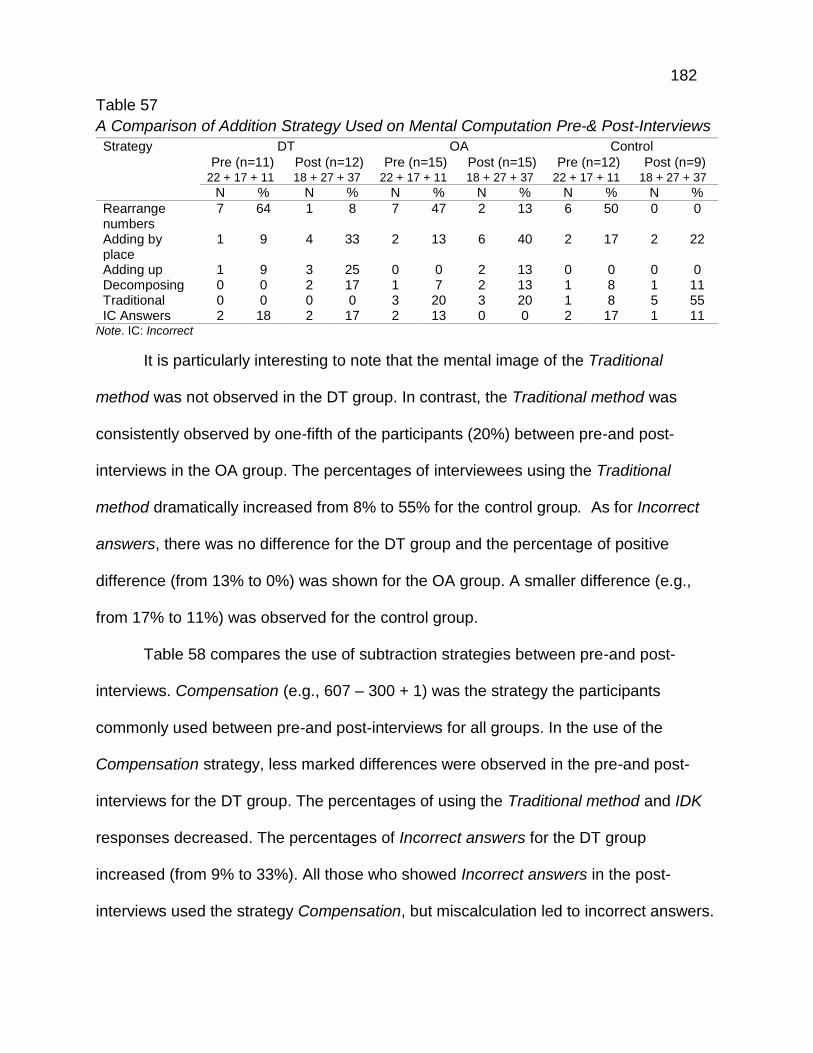
182
Table 57
A Comparison of Addition Strategy Used on Mental Computation Pre-& Post-Interviews
Strategy DT OA Control
Pre (n=11) Post (n=12) Pre (n=15) Post (n=15) Pre (n=12) Post (n=9) 22 + 17 + 11 18 + 27 + 37 22 + 17 + 11 18 + 27 + 37 22 + 17 + 11 18 + 27 + 37
N % N % N % N % N % N %
Rearrange numbers
7 64 1 8 7 47 2 13 6 50 0 0
Adding by place
1 9 4 33 2 13 6 40 2 17 2 22
Adding up 1 9 3 25 0 0 2 13 0 0 0 0 Decomposing 0 0 2 17 1 7 2 13 1 8 1 11 Traditional 0 0 0 0 3 20 3 20 1 8 5 55 IC Answers 2 18 2 17 2 13 0 0 2 17 1 11
Note. IC: Incorrect
It is particularly interesting to note that the mental image of the Traditional
method was not observed in the DT group. In contrast, the Traditional method was
consistently observed by one-fifth of the participants (20%) between pre-and post-
interviews in the OA group. The percentages of interviewees using the Traditional
method dramatically increased from 8% to 55% for the control group. As for Incorrect
answers, there was no difference for the DT group and the percentage of positive
difference (from 13% to 0%) was shown for the OA group. A smaller difference (e.g.,
from 17% to 11%) was observed for the control group.
Table 58 compares the use of subtraction strategies between pre-and post-
interviews. Compensation (e.g., 607 – 300 + 1) was the strategy the participants
commonly used between pre-and post-interviews for all groups. In the use of the
Compensation strategy, less marked differences were observed in the pre-and post-
interviews for the DT group. The percentages of using the Traditional method and IDK
responses decreased. The percentages of Incorrect answers for the DT group
increased (from 9% to 33%). All those who showed Incorrect answers in the post-
interviews used the strategy Compensation, but miscalculation led to incorrect answers.
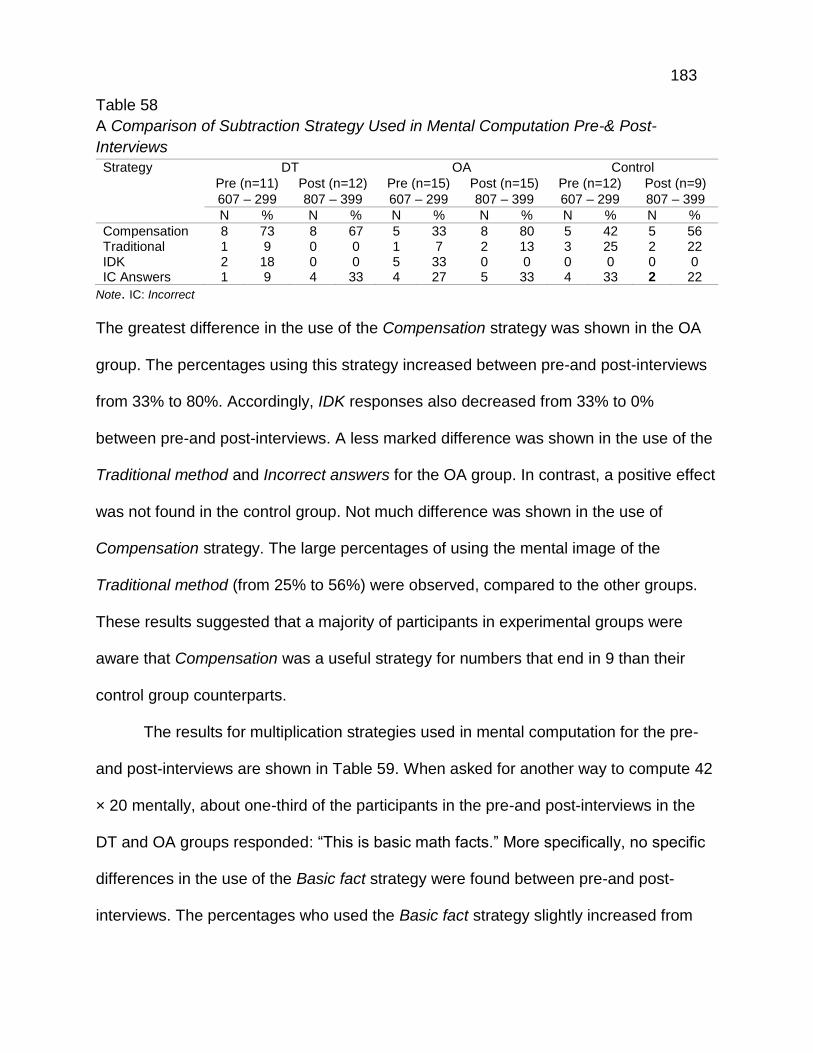
183
Table 58
A Comparison of Subtraction Strategy Used in Mental Computation Pre-& Post-
Interviews
Strategy DT OA Control
Pre (n=11) Post (n=12) Pre (n=15) Post (n=15) Pre (n=12) Post (n=9)
607 – 299 807 – 399 607 – 299 807 – 399 607 – 299 807 – 399
N % N % N % N % N % N %
Compensation 8 73 8 67 5 33 8 80 5 42 5 56 Traditional 1 9 0 0 1 7 2 13 3 25 2 22 IDK 2 18 0 0 5 33 0 0 0 0 0 0 IC Answers 1 9 4 33 4 27 5 33 4 33 2 22
Note. IC: Incorrect
The greatest difference in the use of the Compensation strategy was shown in the OA
group. The percentages using this strategy increased between pre-and post-interviews
from 33% to 80%. Accordingly, IDK responses also decreased from 33% to 0%
between pre-and post-interviews. A less marked difference was shown in the use of the
Traditional method and Incorrect answers for the OA group. In contrast, a positive effect
was not found in the control group. Not much difference was shown in the use of
Compensation strategy. The large percentages of using the mental image of the
Traditional method (from 25% to 56%) were observed, compared to the other groups.
These results suggested that a majority of participants in experimental groups were
aware that Compensation was a useful strategy for numbers that end in 9 than their
control group counterparts.
The results for multiplication strategies used in mental computation for the pre-
and post-interviews are shown in Table 59. When asked for another way to compute 42
× 20 mentally, about one-third of the participants in the pre-and post-interviews in the
DT and OA groups responded: “This is basic math facts.” More specifically, no specific
differences in the use of the Basic fact strategy were found between pre-and post-
interviews. The percentages who used the Basic fact strategy slightly increased from

184
27% to 33% for the DT group and the percentages were the same (27% each) for the
OA group. In contrast, the percentages using Basic fact in the control group were
reduced from 42% to 11%. The percentages of IDK responses decreased from 9% to
0% for the DT group and from 47% to 33% for the OA group, while a slight increase
(from 8% to 22%) of IDK responses for the control group was observed. Incorrect
answers were rarely observed by the interviewees in all three groups.
Table 59
A Comparison of Multiplication Strategy Used in Mental Computation Pre-& Post-
Interviews
Strategy DT OA Control
Pre (n=11) Post (n=12) Pre (n=15) Post (n=15) Pre (n=12) Post (n=9)
42 × 20 24 × 30 42 × 20 24 × 30 42 × 20 24 × 30
N % N % N % N % N % N %
Basic fact 3 27 4 33 4 27 4 27 5 42 1 11 Distributive property 2 18 1 8 0 0 0 0 0 0 1 11 Using factors 0 0 1 8 2 13 2 13 2 17 0 0 UMRA 0 0 0 0 0 0 0 0 1 8 0 0 Traditional 1 9 3 25 2 13 4 27 3 25 5 56 IDK 4 36 3 25 7 47 5 33 1 8 2 22 IC Answers 1 9 0 0 0 0 0 0 0 0 0 0
Note. UMRA: Using Multiplication and Repeated Addition, IC: Incorrect
Interestingly, the percentages of using Traditional method increased from 9% to
25% for the DT group, from 13% to 27% for the OA group, and from 25% to 56% for the
control group. The greatest difference (31%) was shown in the control group. The
reasons for this are not clear; presumably, for 42 × 2, regrouping or carrying is not
involved so the interviewees can easily do the multiplication. However, multiplying 24 ×
3 involves regrouping. The reason for the reduced percentages using Basic fact in the
control group can presumably be related to this fact, as well.
A summary of the division strategy used in mental computation pre-and post-
interviews is presented in Table 60. There were not many differences in the use of
mental computation division strategies during the pre-and post-interviews.
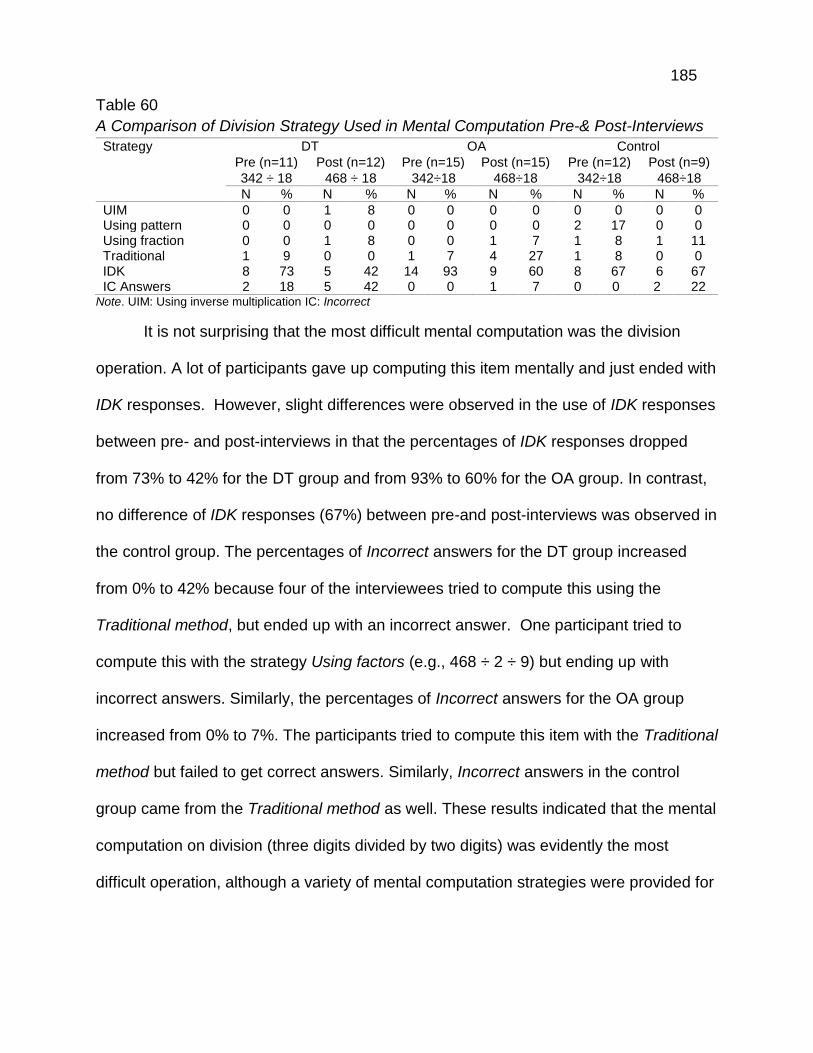
185
Table 60
A Comparison of Division Strategy Used in Mental Computation Pre-& Post-Interviews
Strategy DT OA Control
Pre (n=11) Post (n=12) Pre (n=15) Post (n=15) Pre (n=12) Post (n=9)
342 ÷ 18 468 ÷ 18 342÷18 468÷18 342÷18 468÷18
N % N % N % N % N % N %
UIM 0 0 1 8 0 0 0 0 0 0 0 0 Using pattern 0 0 0 0 0 0 0 0 2 17 0 0 Using fraction 0 0 1 8 0 0 1 7 1 8 1 11 Traditional 1 9 0 0 1 7 4 27 1 8 0 0 IDK 8 73 5 42 14 93 9 60 8 67 6 67 IC Answers 2 18 5 42 0 0 1 7 0 0 2 22
Note. UIM: Using inverse multiplication IC: Incorrect
It is not surprising that the most difficult mental computation was the division
operation. A lot of participants gave up computing this item mentally and just ended with
IDK responses. However, slight differences were observed in the use of IDK responses
between pre- and post-interviews in that the percentages of IDK responses dropped
from 73% to 42% for the DT group and from 93% to 60% for the OA group. In contrast,
no difference of IDK responses (67%) between pre-and post-interviews was observed in
the control group. The percentages of Incorrect answers for the DT group increased
from 0% to 42% because four of the interviewees tried to compute this using the
Traditional method, but ended up with an incorrect answer. One participant tried to
compute this with the strategy Using factors (e.g., 468 ÷ 2 ÷ 9) but ending up with
incorrect answers. Similarly, the percentages of Incorrect answers for the OA group
increased from 0% to 7%. The participants tried to compute this item with the Traditional
method but failed to get correct answers. Similarly, Incorrect answers in the control
group came from the Traditional method as well. These results indicated that the mental
computation on division (three digits divided by two digits) was evidently the most
difficult operation, although a variety of mental computation strategies were provided for
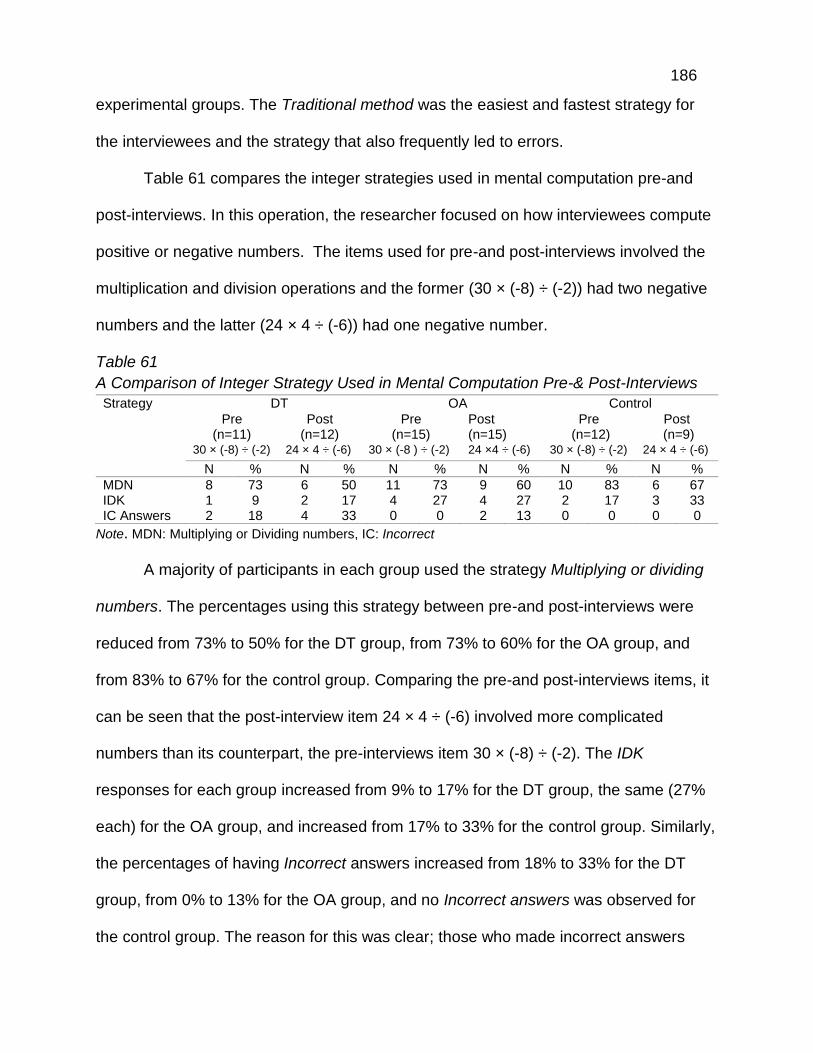
186
experimental groups. The Traditional method was the easiest and fastest strategy for
the interviewees and the strategy that also frequently led to errors.
Table 61 compares the integer strategies used in mental computation pre-and
post-interviews. In this operation, the researcher focused on how interviewees compute
positive or negative numbers. The items used for pre-and post-interviews involved the
multiplication and division operations and the former (30 × (-8) ÷ (-2)) had two negative
numbers and the latter (24 × 4 ÷ (-6)) had one negative number.
Table 61
A Comparison of Integer Strategy Used in Mental Computation Pre-& Post-Interviews
Strategy DT OA Control
Pre (n=11)
Post (n=12)
Pre (n=15)
Post (n=15)
Pre (n=12)
Post (n=9)
30 × (-8) ÷ (-2) 24 × 4 ÷ (-6) 30 × (-8 ) ÷ (-2) 24 ×4 ÷ (-6) 30 × (-8) ÷ (-2) 24 × 4 ÷ (-6)
N % N % N % N % N % N %
MDN 8 73 6 50 11 73 9 60 10 83 6 67 IDK 1 9 2 17 4 27 4 27 2 17 3 33 IC Answers 2 18 4 33 0 0 2 13 0 0 0 0
Note. MDN: Multiplying or Dividing numbers, IC: Incorrect
A majority of participants in each group used the strategy Multiplying or dividing
numbers. The percentages using this strategy between pre-and post-interviews were
reduced from 73% to 50% for the DT group, from 73% to 60% for the OA group, and
from 83% to 67% for the control group. Comparing the pre-and post-interviews items, it
can be seen that the post-interview item 24 × 4 ÷ (-6) involved more complicated
numbers than its counterpart, the pre-interviews item 30 × (-8) ÷ (-2). The IDK
responses for each group increased from 9% to 17% for the DT group, the same (27%
each) for the OA group, and increased from 17% to 33% for the control group. Similarly,
the percentages of having Incorrect answers increased from 18% to 33% for the DT
group, from 0% to 13% for the OA group, and no Incorrect answers was observed for
the control group. The reason for this was clear; those who made incorrect answers
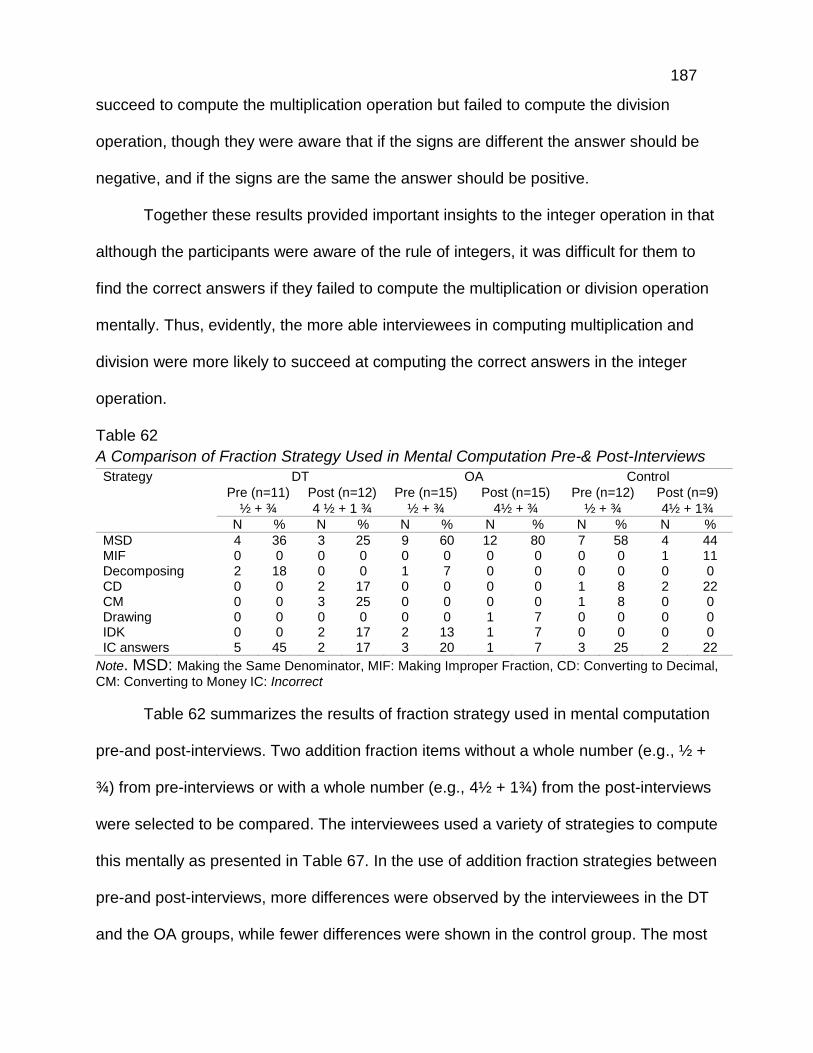
187
succeed to compute the multiplication operation but failed to compute the division
operation, though they were aware that if the signs are different the answer should be
negative, and if the signs are the same the answer should be positive.
Together these results provided important insights to the integer operation in that
although the participants were aware of the rule of integers, it was difficult for them to
find the correct answers if they failed to compute the multiplication or division operation
mentally. Thus, evidently, the more able interviewees in computing multiplication and
division were more likely to succeed at computing the correct answers in the integer
operation.
Table 62
A Comparison of Fraction Strategy Used in Mental Computation Pre-& Post-Interviews
Strategy DT OA Control
Pre (n=11) Post (n=12) Pre (n=15) Post (n=15) Pre (n=12) Post (n=9)
½ + ¾ 4 ½ + 1 ¾ ½ + ¾ 4½ + ¾ ½ + ¾ 4½ + 1¾
N % N % N % N % N % N %
MSD 4 36 3 25 9 60 12 80 7 58 4 44 MIF 0 0 0 0 0 0 0 0 0 0 1 11 Decomposing 2 18 0 0 1 7 0 0 0 0 0 0 CD 0 0 2 17 0 0 0 0 1 8 2 22 CM 0 0 3 25 0 0 0 0 1 8 0 0 Drawing 0 0 0 0 0 0 1 7 0 0 0 0 IDK 0 0 2 17 2 13 1 7 0 0 0 0 IC answers 5 45 2 17 3 20 1 7 3 25 2 22
Note. MSD: Making the Same Denominator, MIF: Making Improper Fraction, CD: Converting to Decimal,
CM: Converting to Money IC: Incorrect
Table 62 summarizes the results of fraction strategy used in mental computation
pre-and post-interviews. Two addition fraction items without a whole number (e.g., ½ +
¾) from pre-interviews or with a whole number (e.g., 4½ + 1¾) from the post-interviews
were selected to be compared. The interviewees used a variety of strategies to compute
this mentally as presented in Table 67. In the use of addition fraction strategies between
pre-and post-interviews, more differences were observed by the interviewees in the DT
and the OA groups, while fewer differences were shown in the control group. The most
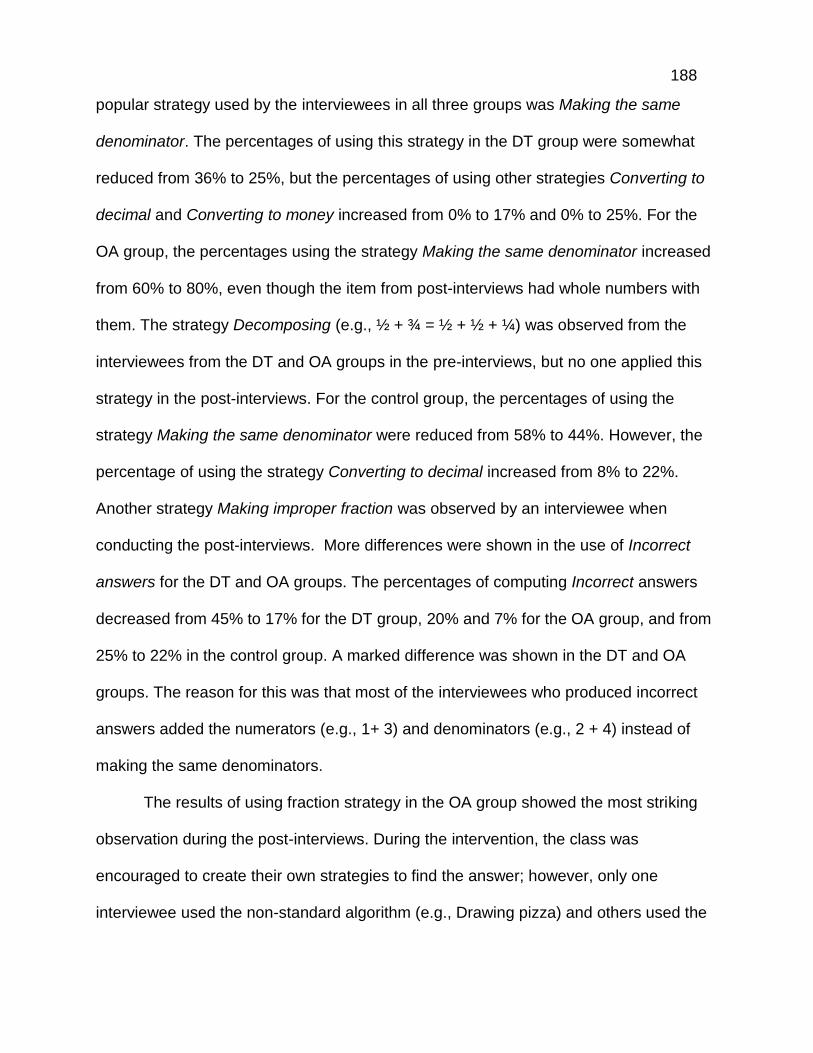
188
popular strategy used by the interviewees in all three groups was Making the same
denominator. The percentages of using this strategy in the DT group were somewhat
reduced from 36% to 25%, but the percentages of using other strategies Converting to
decimal and Converting to money increased from 0% to 17% and 0% to 25%. For the
OA group, the percentages using the strategy Making the same denominator increased
from 60% to 80%, even though the item from post-interviews had whole numbers with
them. The strategy Decomposing (e.g., ½ + ¾ = ½ + ½ + ¼) was observed from the
interviewees from the DT and OA groups in the pre-interviews, but no one applied this
strategy in the post-interviews. For the control group, the percentages of using the
strategy Making the same denominator were reduced from 58% to 44%. However, the
percentage of using the strategy Converting to decimal increased from 8% to 22%.
Another strategy Making improper fraction was observed by an interviewee when
conducting the post-interviews. More differences were shown in the use of Incorrect
answers for the DT and OA groups. The percentages of computing Incorrect answers
decreased from 45% to 17% for the DT group, 20% and 7% for the OA group, and from
25% to 22% in the control group. A marked difference was shown in the DT and OA
groups. The reason for this was that most of the interviewees who produced incorrect
answers added the numerators (e.g., 1+ 3) and denominators (e.g., 2 + 4) instead of
making the same denominators.
The results of using fraction strategy in the OA group showed the most striking
observation during the post-interviews. During the intervention, the class was
encouraged to create their own strategies to find the answer; however, only one
interviewee used the non-standard algorithm (e.g., Drawing pizza) and others used the

189
standard algorithm, which was Making the same denominator. No one used the strategy
Making improper fraction. In other words, the effect of the intervention for the OA group
was minimally shown.
Table 63
A Comparison of Decimal Strategy Used on Mental Computation Pre-& Post-Interviews
Strategy DT OA Control
Pre (n=11)
Post (n=12)
Pre (n=15)
Post (n=15)
Pre (n=12)
Post (n=9)
0.5 × 48 0.2 × 75 0.5 × 48 0.2 × 75 0.5 × 48 0.2 × 75
N % N % N % N % N % N %
Converting to fraction 4 36 1 8 9 60 2 13 8 67 1 11 Converting to percent 0 0 0 0 1 7 0 0 0 0 0 0 IDMP 0 0 2 17 0 0 5 33 0 0 2 22 Traditional 2 18 1 8 0 0 0 0 1 8 1 11 IDK 4 36 6 50 5 33 7 47 1 8 4 44 IC answers 1 9 2 17 0 0 1 7 2 17 1 11
Note. IDMPD: Ignoring Decimal and Multiplying numbers, then Placing decimal pt. IC: Incorrect
The results of the decimal mental computation strategy can be compared in
Table 63. Similar types of decimal multiplication items (e.g., 0.5 × 48 and 0.2 × 75) were
selected from pre-and post-interviews. Marked differences were shown by the
interviewees in all three group. As shown in Table 68, Converting to fraction, was the
common strategy used by the interviewees during the pre-interviews in all three groups.
Then this was followed by the Traditional method. The percentages of using the
strategy Converting to fraction were dramatically decreased from 36% to 8% for the DT
group, from 60% to 13% for the OA group, and from 67% to 11% for the control group.
In contrast, the percentages of using IDK responses increased from 36% to 50% for the
DT group, from 33% to 47% for the OA group, and from 8% to 44% for the control
group. This may be due to the fact that a majority of interviewees were aware that the
decimal number 0.5 is exactly the same as the fraction 1/2, but they failed to recognize
that the decimal number 0.2 is the same as 1/5. Less marked differences were shown in
the use of the Traditional method for each group, but the strategy Ignoring decimal and

190
multiplying numbers, then place decimal point emerged from the post-interviews (17%,
33%, and 22%, respectively). More Incorrect answers were shown during the post-
interviews, because they failed to multiply 2 × 75 vertically or horizontally. The
interviewees in this study reflected the lack of connection between fractions and
decimals, more specifically, incompatible numbers, such as decimal-fraction
equivalences (e.g., 0.2 equals one-fifth, 40% equals with two-fifths). This led to adding
another strategy Ignoring decimal and Multiplying numbers, then Placing decimal point.
The results obtained from the pre-and post-interviews in the use of percent
strategy are presented in Table 64.
Table 64 A Comparison of Percent Strategy Used on Mental Computation Pre-& Post-Interviews Strategy DT OA Control
Pre (n=11) Post (n=12) Pre (n=15) Post (n=15) Pre (n=12) Post (n=9)
25% × 20 75% × 120 25% × 20 75% × 120 25% × 20 75% × 120
N % N % N % N % N % N %
Converting to decimal 0 0 2 17 0 0 0 0 0 0 0 0 Converting to fraction 7 64 5 42 11 73 6 40 8 67 3 33 Converting to money 2 18 0 0 0 0 0 0 0 0 0 0 Using pattern 0 0 0 0 0 0 0 0 1 8 0 0 Using division 0 0 0 0 0 0 1 7 0 0 0 0 IDK 2 18 5 42 3 20 8 53 3 25 6 67 IC answers 1 9 0 0 1 7 0 0 0 0 0 0
Note. IC: Incorrect
Similar results with decimal interviews were found. The most common strategy
used by the interviewees was Converting to fraction. The percentages of using this
strategy decreased from 64% to 42% for the DT group, 73% to 40% for the OA group,
and from 67% to 33% for the control group. In contrast, the percentages of IDK
responses increased more than two times. The Incorrect answers were found only from
the pre-interviews when they miscalculated the multiplication operation in the DT and
OA groups. The reason there were more IDK responses during the post-interviews was
that some of the interviewees changed the percent (75%) to decimal (e.g., 0.75) but

191
failed to multiply mentally, or others were not able to recognize that 75% equals the
fraction ¾. This led to more percentages of IDK responses. These results showed that
the lack of connection between percent and fraction operations and a lack of
understanding equivalent (e.g., incompatible numbers), such as percent-fraction
equivalences (e.g., 75% equals with ¾) were apparent.
The Association of the Level of Mental Computation Performance and
Flexibility. To identify the relationship between each participant’s performance level
and their flexibility in the use of the mental computation strategies, the researcher asked
an interviewee to find their answer first and then to describe their strategy. After
describing the initial strategy the interviewees used on each item, they were asked if
they could think of another strategy to mentally compute each item for both
experimental groups and control group during the post-interviews. The interviews
started with the following operations in order: addition, subtraction, multiplication,
division, integer, fraction, decimal, and percent.
Figure 10. Addition frequency of strategies described for interviews item: 143 + 59
Figure 10 summarizes addition frequency of strategies for mentally computing
143 + 59, based on the five different quintile levels. For the DT group, all twelve
12
12
3
12
3
1
4
21
21 1 1 1
2 2
3
0 1 2 0 1 2 3 0 1 2
DT (N=12) OA (N=15) CONTROL (N=9)Nu
mb
er
of
Inte
rvie
we
es
Frequency of Strategies
143 + 59
1st quintile
2nd quintile
3rd quintile
4th quintile
5th quintile

192
interviewees provided at least one strategy. Six interviewees offered two different
strategies: two from the 5th, three from the 3rd, and one from the 2nd quintiles. Two
interviewees from the 2nd, 3rd, and 4th quintiles provided only one strategy. For the OA
group, three 5th quintile interviewees computed this item using three different ways.
Seven interviewees offered two strategies (i.e., 4 from the 3rd, 1 from the 4th, and 2 from
the 5th quintiles). Four interviewees provided one strategy (i.e., 2 from the 2nd, 1 from
the 3rd, and 1 from the 4th quintiles). One interviewee from the 1st quintile did not provide
any strategy. Each interviewee from the 2nd, 3rd, and 4th quintiles in the control group
offered two strategies and seven interviewees offered one strategy (i.e., 3 from the 2nd,
2 from the 3rd, and 1 from the 4th quintiles). In the addition operation, the interviewees in
the 3rd and 5th quintiles showed more strategies than that of other quintiles in the DT
and OA groups, while no specific important findings were observed in the use of
strategies in the control group.
A majority of interviewees regardless of the quintile levels employed a variety of
mental strategies as shown in Table 65. In total, the researcher investigated the 16
responses from the DT, 22 from the OA, and 12 from the control group. The most
frequently used strategies were Adding by place, Decomposing, Compensation, and
Traditional method.
As for the DT group, the interviewees in the fifth quintiles used the following
strategies: Adding by place (i.e., 100 + 40 + 50 + 3 + 9 or 140 + 50 + 12), Decomposing
(i.e., 143 + 50 + 9) and Compensation (i.e., 143 + 60 - 1). The strategies Adding by
place and Compensation (1 response for each) were observed in the 4th quintile.
Compensation (4 responses) was the most popular strategy in the 3rd quintile.

193
Traditional method (2 responses), Adding by place, and Making multiples of 10 (one for
each) followed. One response for Adding by place and Traditional method was
observed in the 2nd quintile.
Table 65
Strategies used on Mental Addition Computation Item: 143 + 59
143 + 59
Quintile Strategy DT (n=12) OA (n=15) Control (n=9)
5 Adding by place 1 1 Decomposing 2 1 Compensation 1 3 Traditional 0 3
4 Adding by place 1 Compensation 1 1 1 Decomposing 1 1 Traditional 1 1*
3 Compensation 4 2 2 Decomposing 1 Adding by place 1 3 Making multiples of 10 1 Traditional 2 2 2
2 Adding by place 1 Using fingers 1 Traditional 1 2* 4
1 IDK 1
Total responses 16 22 12
*means the frequency of incorrect answers
For the OA group, Compensation and Traditional method (3 responses for each)
were commonly observed strategies in the 5th quintile. In the 4th quintile, Compensation,
Decomposing, and Traditional method (one for each) were observed. In the 3rd quintile,
Adding by place (3 responses), Compensation (2 responses), and Traditional method (2
responses) were commonly observed. The Traditional method was only used in the 2nd
quintile. One IDK response was observed in the 1st quintile. In the control group, no
interviewees in the 5th quintile participated in the post-interviews. In the 4th quintile, one
response of Compensation, Decomposing, and Traditional method were observed. Two

194
responses of Compensation and Traditional method were commonly used in the 3rd
quintiles. The Traditional method was the most popular strategy in the 2nd quintile.
Figure 11. Addition frequency of strategies described for interview item: 18 + 27 + 37
The results of strategies described in the item 18 + 27 + 37 can be compared in
Figure 11. Distinctively, the interviewees in the middle and upper quintiles were more
likely use the two strategies than that of lower quintiles. More specifically, 6 responses
(i.e., 2 from 3rd, 1 from 4th, and 2 from 5th quintiles) were observed by the interviewees
in the DT group. Eight responses were observed for the OA group (i.e., 3 from 3rd, 2
from 4th, and 3 from 5th quintiles). In contrast, a majority of interviewees in the control
group were generally reluctant to offer alternative strategies except for an interviewee in
the fourth quintile. These results indicated that the interviewees in the upper quintiles
were more likely to be able to provide alternative strategies in addition operation.
The specific strategies related to the item 18 + 27 + 37 were shown in Table 66.
In total, 16 responses from the DT, 24 from the OA, and 10 for the control group were
examined. A variety of strategies were documented in relation to the different levels of
quintiles such as Adding by place, Decomposing, Rearranging numbers, Adding up
(Selter, 2001), and Traditional method. The most commonly used number-sense
1
3
2
4
3
2 2
3 3
1 1
2
1 1
2 2
3
0 1 2 0 1 2 0 1 2
DT (N=12) OA (N=15) CONTROL (N=9)
Nu
mb
er
of
Inte
rvie
we
es
Frequency of Strategies
18 + 27 + 371st quintile
2nd quintile
3rd quintile
4th quintile
5th quintile

195
strategies found in the upper quintiles were Adding by place (i.e., 10 + 20 + 30 + 8 + 7 +
7), Decomposing (i.e., 18 + 20 + 30 + 14), and Adding up (i.e., 20 + 30 + 40 – 2 – 3 – 3)
for the DT and OA groups. In contrast, the most frequently used strategies found in the
lower quintiles were Adding by place and Traditional method, which gave frequent
errors. A common view among interviewees in the OA and control groups was that the
Traditional method was observed in all of the quintiles. Surprisingly, no one used the
Traditional method in the DT group.
Table 66
Strategies used on Mental Addition Computation Item: 18 + 27 + 37
18 + 27 + 37
Quintile Strategy DT (n=12)
OA (n=15)
Control (n=9)
5 Adding by place 1 4 Decomposing 2 2 Rearranging numbers 2 Adding up 1 2
4 Adding by place 1 1 1 Adding up 2 1 1 Decomposing 1 Traditional 1 1
3 Adding by place 1 2 Decomposing 2 1 1 Rearrange numbers 2* Adding up 1 3 Traditional method 2 2
2 Adding by place 3 1 Traditional 1* 3*
1 Traditional 1*
Total responses 16 24 10 *means the frequency of incorrect answers
In this section, the results of the mental subtraction computation strategies based
on the three difficulty levels were examined. A comparison of the frequency of strategies
in relation to the low difficulty subtraction item 36 – 8 was provided in Figure 12. All of
the participants provided a great variety of mental strategies. The two fifth quintile
interviewees in the OA group provided three different strategies. The three interviewees
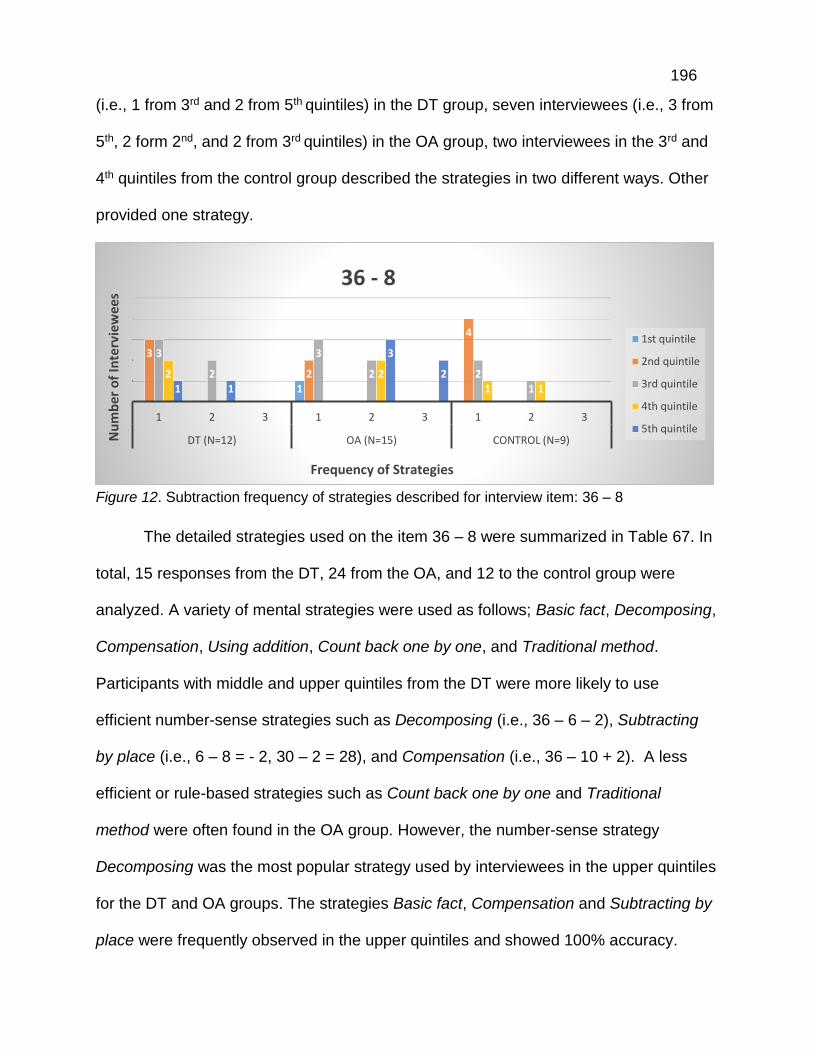
196
(i.e., 1 from 3rd and 2 from 5th quintiles) in the DT group, seven interviewees (i.e., 3 from
5th, 2 form 2nd, and 2 from 3rd quintiles) in the OA group, two interviewees in the 3rd and
4th quintiles from the control group described the strategies in two different ways. Other
provided one strategy.
Figure 12. Subtraction frequency of strategies described for interview item: 36 – 8
The detailed strategies used on the item 36 – 8 were summarized in Table 67. In
total, 15 responses from the DT, 24 from the OA, and 12 to the control group were
analyzed. A variety of mental strategies were used as follows; Basic fact, Decomposing,
Compensation, Using addition, Count back one by one, and Traditional method.
Participants with middle and upper quintiles from the DT were more likely to use
efficient number-sense strategies such as Decomposing (i.e., 36 – 6 – 2), Subtracting
by place (i.e., 6 – 8 = - 2, 30 – 2 = 28), and Compensation (i.e., 36 – 10 + 2). A less
efficient or rule-based strategies such as Count back one by one and Traditional
method were often found in the OA group. However, the number-sense strategy
Decomposing was the most popular strategy used by interviewees in the upper quintiles
for the DT and OA groups. The strategies Basic fact, Compensation and Subtracting by
place were frequently observed in the upper quintiles and showed 100% accuracy.
1
3
2
4
3
2
3
2 21
2 21 11 1
3
2
1 2 3 1 2 3 1 2 3
DT (N=12) OA (N=15) CONTROL (N=9)Nu
mb
er o
f In
terv
iew
ees
Frequency of Strategies
36 - 8
1st quintile
2nd quintile
3rd quintile
4th quintile
5th quintile

197
Table 67
Strategies used in Mental Subtraction Computation Item: 36 – 8
36 - 8
Quintile Strategy DT (n=12)
OA (n=15)
Control (n=9)
5 Basic fact 1 1 Decomposing 2 4 Compensation 2 Subtracting by place 2 Count back one by one 1 Traditional 2
4 Subtracting by place 1 1 Decomposing 1 2 1 Using addition 1 Traditional 1
3 Basic fact 1 1 Decomposing 2 Compensation 4 1 1 Using addition 1 Count back one by one 1 3 Traditional 1 1
2 Basic fact 1 Subtracting by place 1 Decomposing 1 Compensation 2 Count back one by one 1 2* Traditional 1
1 Count back one by one 1
Total responses 15 24 12 *means the frequency of incorrect answers
However, the less effective strategies such as Count back one by one and Traditional
method were observed in the lower quintiles with relatively higher accuracy. The
number-sense strategies Compensation (i.e., 2nd and 3rd quintiles) and Decomposing
(i.e., 3rd and 4th quintiles) was also used in the control group. The Traditional method
was observed in all quintiles they were in.
The results of subtraction strategies used in the medium difficulty subtraction
item 95 – 37 are provided in Figure 13. All of the participants provided at least one
response. As predicted, a majority of interviewees in the 5th quintile for the DT and OA
groups provided two different strategies. One response was mostly shown by the
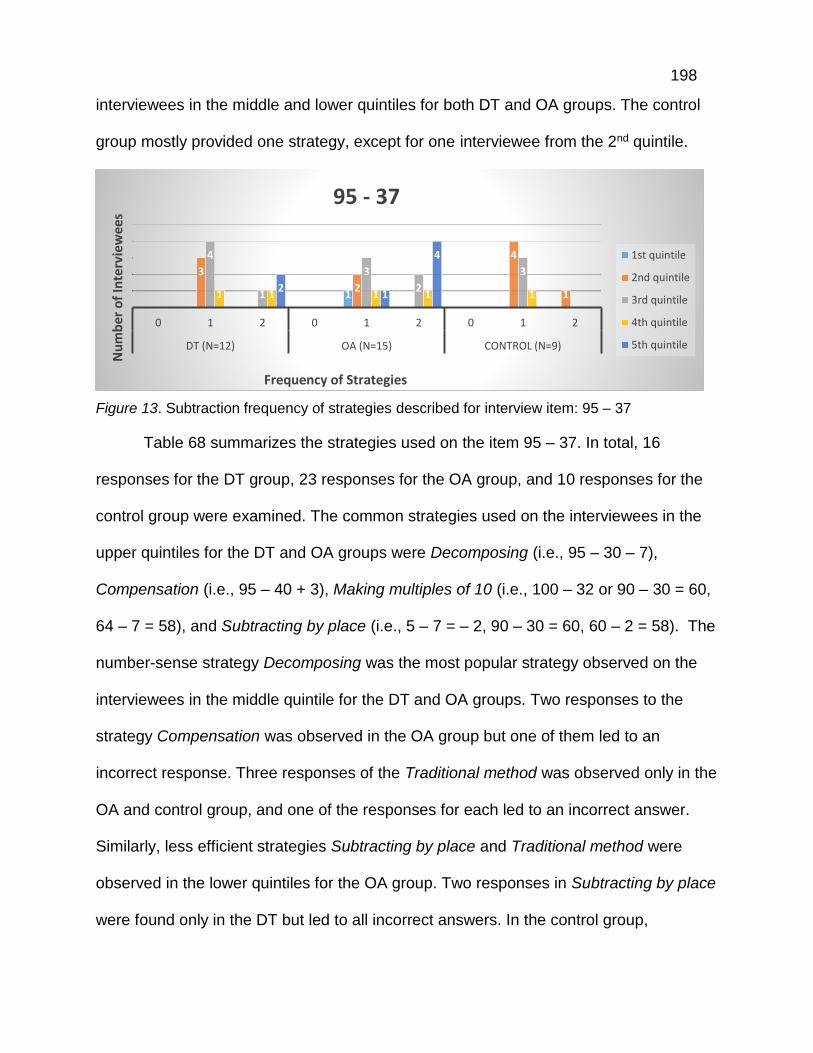
198
interviewees in the middle and lower quintiles for both DT and OA groups. The control
group mostly provided one strategy, except for one interviewee from the 2nd quintile.
Figure 13. Subtraction frequency of strategies described for interview item: 95 – 37
Table 68 summarizes the strategies used on the item 95 – 37. In total, 16
responses for the DT group, 23 responses for the OA group, and 10 responses for the
control group were examined. The common strategies used on the interviewees in the
upper quintiles for the DT and OA groups were Decomposing (i.e., 95 – 30 – 7),
Compensation (i.e., 95 – 40 + 3), Making multiples of 10 (i.e., 100 – 32 or 90 – 30 = 60,
64 – 7 = 58), and Subtracting by place (i.e., 5 – 7 = – 2, 90 – 30 = 60, 60 – 2 = 58). The
number-sense strategy Decomposing was the most popular strategy observed on the
interviewees in the middle quintile for the DT and OA groups. Two responses to the
strategy Compensation was observed in the OA group but one of them led to an
incorrect response. Three responses of the Traditional method was observed only in the
OA and control group, and one of the responses for each led to an incorrect answer.
Similarly, less efficient strategies Subtracting by place and Traditional method were
observed in the lower quintiles for the OA group. Two responses in Subtracting by place
were found only in the DT but led to all incorrect answers. In the control group,
1
3
2
4
1
4
1
3
2
3
1 1 1 1 12
1
4
0 1 2 0 1 2 0 1 2
DT (N=12) OA (N=15) CONTROL (N=9)
Nu
mb
er o
f In
terv
iew
ees
Frequency of Strategies
95 - 37
1st quintile
2nd quintile
3rd quintile
4th quintile
5th quintile
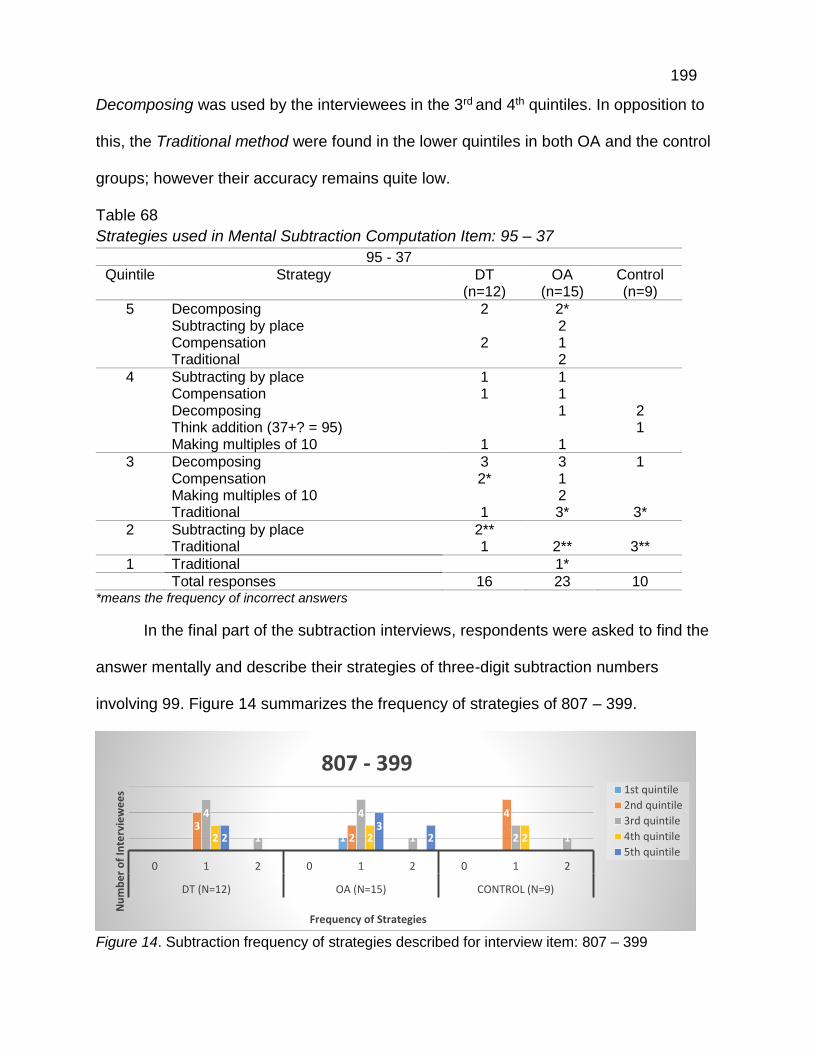
199
Decomposing was used by the interviewees in the 3rd and 4th quintiles. In opposition to
this, the Traditional method were found in the lower quintiles in both OA and the control
groups; however their accuracy remains quite low.
Table 68
Strategies used in Mental Subtraction Computation Item: 95 – 37
95 - 37
Quintile Strategy DT (n=12)
OA (n=15)
Control (n=9)
5 Decomposing 2 2* Subtracting by place 2 Compensation 2 1 Traditional 2
4 Subtracting by place 1 1 Compensation 1 1 Decomposing 1 2 Think addition (37+? = 95) 1 Making multiples of 10 1 1
3 Decomposing 3 3 1 Compensation 2* 1 Making multiples of 10 2 Traditional 1 3* 3*
2 Subtracting by place 2** Traditional 1 2** 3**
1 Traditional 1*
Total responses 16 23 10 *means the frequency of incorrect answers
In the final part of the subtraction interviews, respondents were asked to find the
answer mentally and describe their strategies of three-digit subtraction numbers
involving 99. Figure 14 summarizes the frequency of strategies of 807 – 399.
Figure 14. Subtraction frequency of strategies described for interview item: 807 – 399
13
2
44
1
4
1 2 12 2 223
2
0 1 2 0 1 2 0 1 2
DT (N=12) OA (N=15) CONTROL (N=9)
Nu
mb
er
of
Inte
rvie
we
es
Frequency of Strategies
807 - 3991st quintile
2nd quintile
3rd quintile
4th quintile
5th quintile

200
Most of the interviewees provided the subtraction strategy with at least one
answer. Interestingly, one interviewee from the 3rd quintile in each group described two
strategies. They initially provided the strategy Compensation and confidently computed
this using the Traditional method. The participants interviewed used a very narrow
range of strategies as shown in Table 69. In total, 11 responses from the DT, 17
responses from the OA, and 10 responses to the control group were observed.
Compensation was the most common strategy and was frequently observed by the
interviewees in all of the quintiles. However, more frequent errors can be found for the
interviewees in the middle and lower quintiles. The strategy Traditional method was
more likely to be found in the OA and control groups from all of the quintiles except for
the 4th quintile. Accuracy using these two strategies was generally lower when
employed by the interviewees in the middle and lower quintiles.
Table 69
Strategies used in Mental Subtraction Computation Item: 807 – 399
807 - 399
Quintile Strategy DT (n=12)
OA (n=15)
Control (n=9)
5 Compensation 1 4* Adding 1 to the first and subtracting 1 for
the second 1
Traditional 2
4 Compensation 2 2 2
3 Compensation 4** 4* 2 Traditional 1 2 1
2 Compensation 2* 1* 2 Subtracting by place 1* Traditional 1* 1* 2
1 Traditional 1
Total responses 11 17 10 *means the frequency of incorrect answers
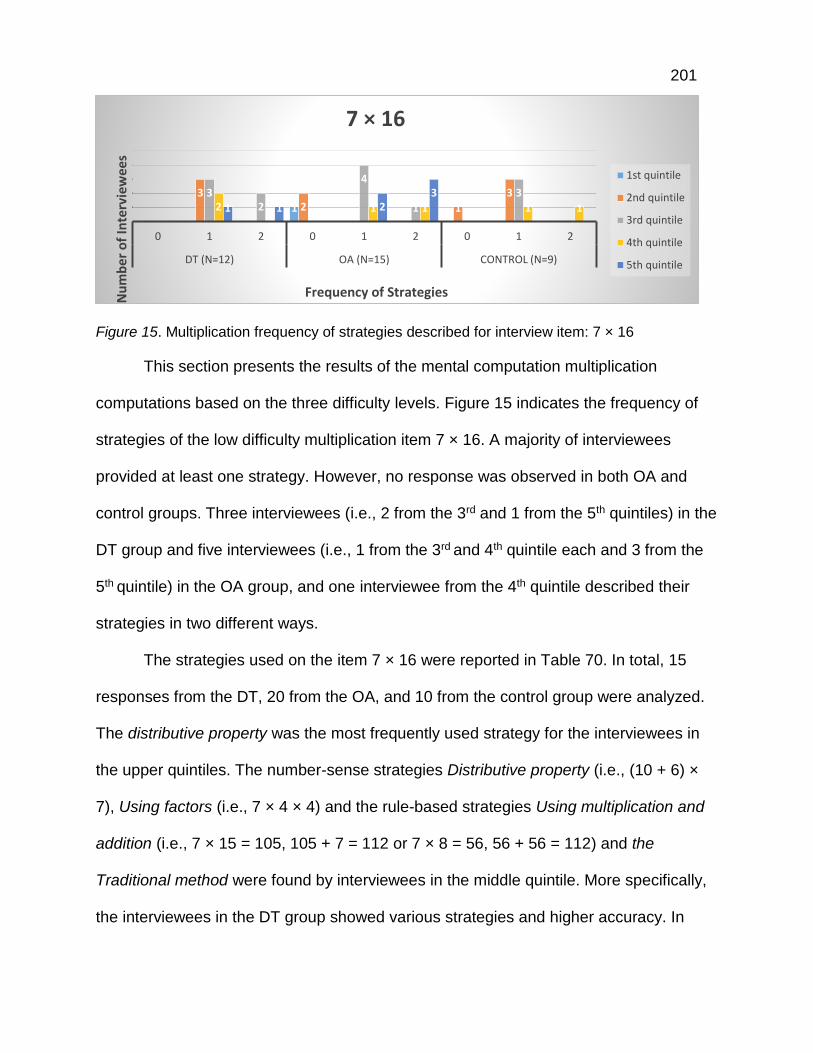
201
Figure 15. Multiplication frequency of strategies described for interview item: 7 × 16
This section presents the results of the mental computation multiplication
computations based on the three difficulty levels. Figure 15 indicates the frequency of
strategies of the low difficulty multiplication item 7 × 16. A majority of interviewees
provided at least one strategy. However, no response was observed in both OA and
control groups. Three interviewees (i.e., 2 from the 3rd and 1 from the 5th quintiles) in the
DT group and five interviewees (i.e., 1 from the 3rd and 4th quintile each and 3 from the
5th quintile) in the OA group, and one interviewee from the 4th quintile described their
strategies in two different ways.
The strategies used on the item 7 × 16 were reported in Table 70. In total, 15
responses from the DT, 20 from the OA, and 10 from the control group were analyzed.
The distributive property was the most frequently used strategy for the interviewees in
the upper quintiles. The number-sense strategies Distributive property (i.e., (10 + 6) ×
7), Using factors (i.e., 7 × 4 × 4) and the rule-based strategies Using multiplication and
addition (i.e., 7 × 15 = 105, 105 + 7 = 112 or 7 × 8 = 56, 56 + 56 = 112) and the
Traditional method were found by interviewees in the middle quintile. More specifically,
the interviewees in the DT group showed various strategies and higher accuracy. In
1
32 1
332
4
1
32 1 1 1 11 1 2
3
0 1 2 0 1 2 0 1 2
DT (N=12) OA (N=15) CONTROL (N=9)
Nu
mb
er o
f In
terv
iew
ees
Frequency of Strategies
7 × 16
1st quintile
2nd quintile
3rd quintile
4th quintile
5th quintile

202
opposition, the interviewees from the OA group led to errors when using the strategies
Distributive property (2 out of 4 responses) and the Traditional method (1 out of 1
response). Less mental multiplication strategies and accuracy were observed in the
lower quintiles. The distributive property was found in the control group but led to an
error. The Traditional method was observed in the DT and the control groups. Two out
of three responses made errors from the DT group. IDK response was found in the OA
and control groups.
Table 70 Strategies used in Mental Multiplication Computation Item: 7 × 16
7 × 16
Quintile Strategy DT (n=12)
OA (n=15)
Control (n=9)
5 Distributive property 1 4 Using factors 2 Traditional 4
4 Distributive property 1 3 1 Traditional 1 2*
3 Distributive property 2 4** 3 Using multiplication and addition 2 1 Using factors 1 Traditional 2 1*
2 Distributive property 1* Traditional 3** 2 IDK 2 1
1 IDK 1
Total responses 15 20 10
*means the frequency of incorrect answers
Overall, numerous strategies and higher accuracy were found by the
interviewees from the middle and upper quintiles in the DT group with higher accuracy
(e.g., accurate and flexible). In the OA group, the interviewees from the fifth quintile
tended to use the Traditional method as their alternative method with 100% accuracy
(e.g., accurate and not flexible). Less accurate responses and IDK responses were
frequently found in the lower and middle quintiles (e.g., inaccurate and not flexible). As
expected, fewer strategies were found in the control group. Only two strategies,
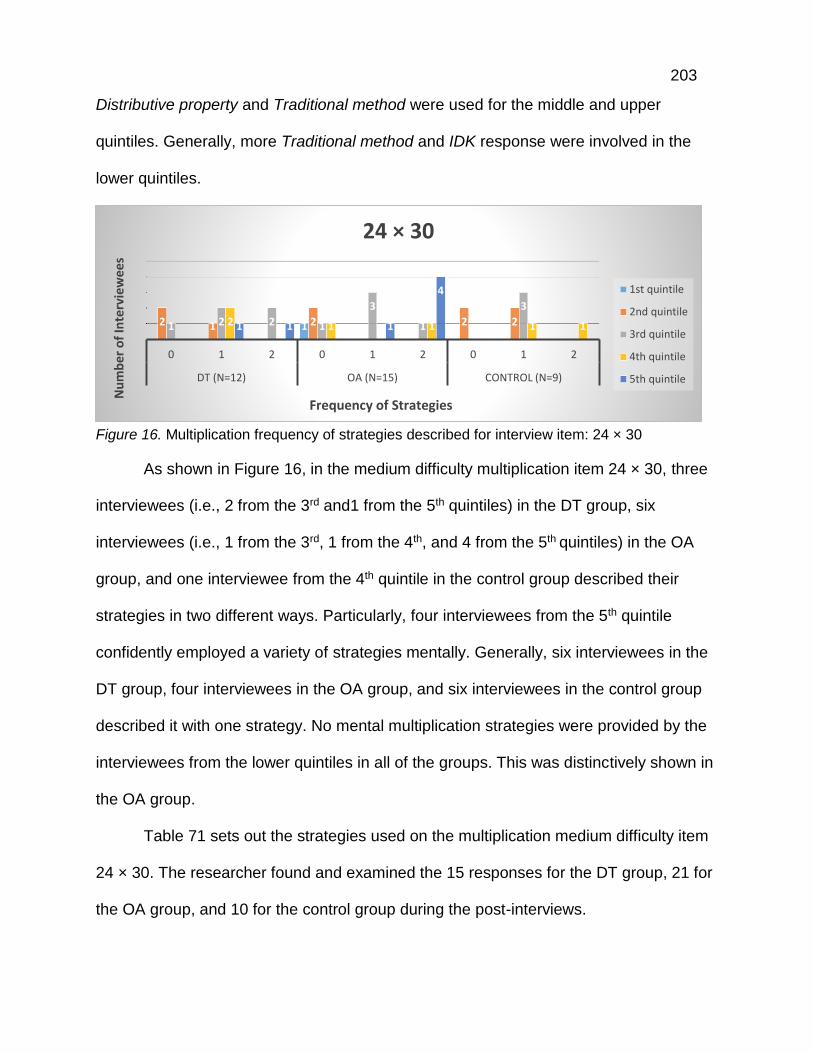
203
Distributive property and Traditional method were used for the middle and upper
quintiles. Generally, more Traditional method and IDK response were involved in the
lower quintiles.
Figure 16. Multiplication frequency of strategies described for interview item: 24 × 30
As shown in Figure 16, in the medium difficulty multiplication item 24 × 30, three
interviewees (i.e., 2 from the 3rd and1 from the 5th quintiles) in the DT group, six
interviewees (i.e., 1 from the 3rd, 1 from the 4th, and 4 from the 5th quintiles) in the OA
group, and one interviewee from the 4th quintile in the control group described their
strategies in two different ways. Particularly, four interviewees from the 5th quintile
confidently employed a variety of strategies mentally. Generally, six interviewees in the
DT group, four interviewees in the OA group, and six interviewees in the control group
described it with one strategy. No mental multiplication strategies were provided by the
interviewees from the lower quintiles in all of the groups. This was distinctively shown in
the OA group.
Table 71 sets out the strategies used on the multiplication medium difficulty item
24 × 30. The researcher found and examined the 15 responses for the DT group, 21 for
the OA group, and 10 for the control group during the post-interviews.
12 1 2 2 21 2 2 1
3
1
3
2 1 1 1 11 1 1
4
0 1 2 0 1 2 0 1 2
DT (N=12) OA (N=15) CONTROL (N=9)
Nu
mb
er o
f In
terv
iew
ee
s
Frequency of Strategies
24 × 30
1st quintile
2nd quintile
3rd quintile
4th quintile
5th quintile
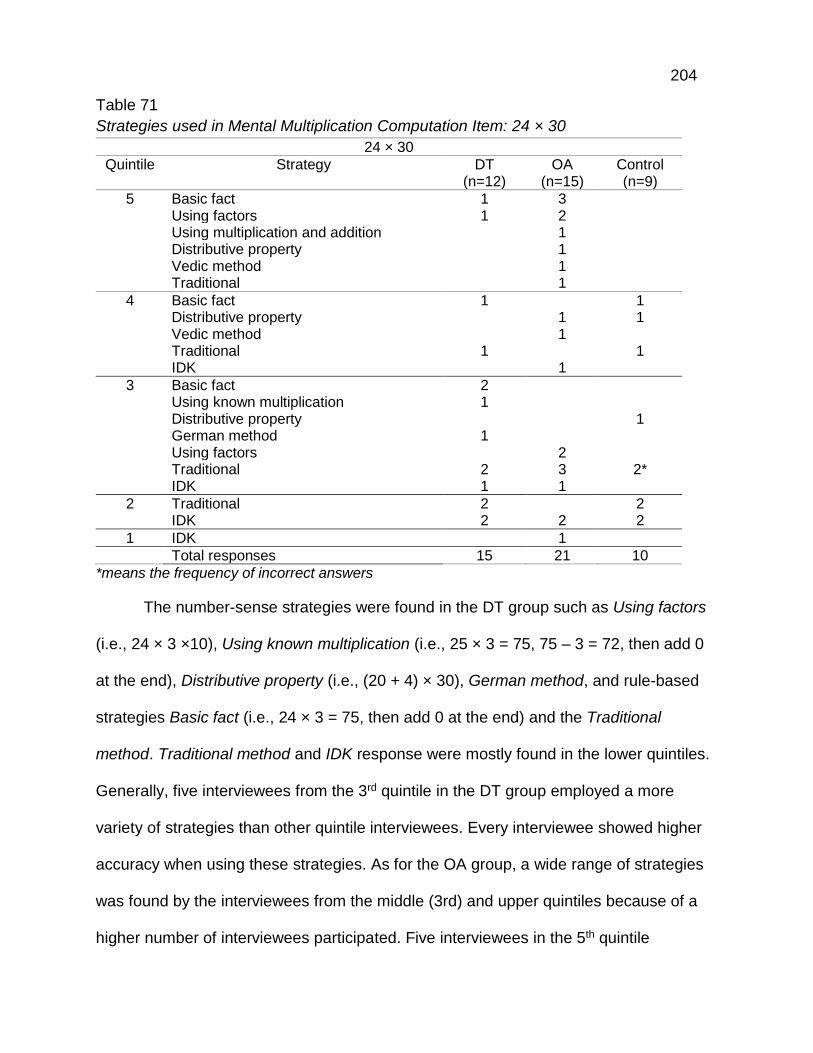
204
Table 71
Strategies used in Mental Multiplication Computation Item: 24 × 30
24 × 30
Quintile Strategy DT (n=12)
OA (n=15)
Control (n=9)
5 Basic fact 1 3 Using factors 1 2 Using multiplication and addition 1 Distributive property 1 Vedic method 1 Traditional 1
4 Basic fact 1 1 Distributive property 1 1 Vedic method 1 Traditional 1 1 IDK 1
3 Basic fact 2 Using known multiplication 1 Distributive property 1 German method 1 Using factors 2 Traditional 2 3 2* IDK 1 1
2 Traditional 2 2 IDK 2 2 2
1 IDK 1
Total responses 15 21 10
*means the frequency of incorrect answers
The number-sense strategies were found in the DT group such as Using factors
(i.e., 24 × 3 ×10), Using known multiplication (i.e., 25 × 3 = 75, 75 – 3 = 72, then add 0
at the end), Distributive property (i.e., (20 + 4) × 30), German method, and rule-based
strategies Basic fact (i.e., 24 × 3 = 75, then add 0 at the end) and the Traditional
method. Traditional method and IDK response were mostly found in the lower quintiles.
Generally, five interviewees from the 3rd quintile in the DT group employed a more
variety of strategies than other quintile interviewees. Every interviewee showed higher
accuracy when using these strategies. As for the OA group, a wide range of strategies
was found by the interviewees from the middle (3rd) and upper quintiles because of a
higher number of interviewees participated. Five interviewees in the 5th quintile
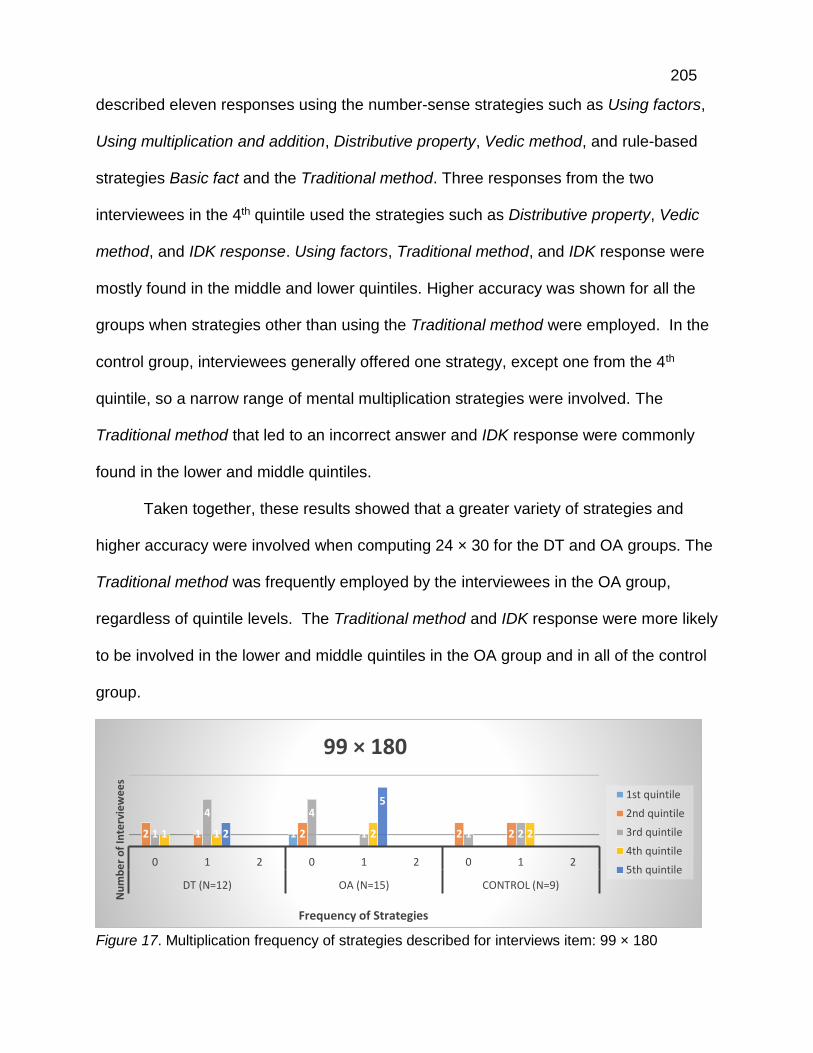
205
described eleven responses using the number-sense strategies such as Using factors,
Using multiplication and addition, Distributive property, Vedic method, and rule-based
strategies Basic fact and the Traditional method. Three responses from the two
interviewees in the 4th quintile used the strategies such as Distributive property, Vedic
method, and IDK response. Using factors, Traditional method, and IDK response were
mostly found in the middle and lower quintiles. Higher accuracy was shown for all the
groups when strategies other than using the Traditional method were employed. In the
control group, interviewees generally offered one strategy, except one from the 4th
quintile, so a narrow range of mental multiplication strategies were involved. The
Traditional method that led to an incorrect answer and IDK response were commonly
found in the lower and middle quintiles.
Taken together, these results showed that a greater variety of strategies and
higher accuracy were involved when computing 24 × 30 for the DT and OA groups. The
Traditional method was frequently employed by the interviewees in the OA group,
regardless of quintile levels. The Traditional method and IDK response were more likely
to be involved in the lower and middle quintiles in the OA group and in all of the control
group.
Figure 17. Multiplication frequency of strategies described for interviews item: 99 × 180
12 1 2 2 21
4 4
1 1 21 1 2 22
5
0 1 2 0 1 2 0 1 2
DT (N=12) OA (N=15) CONTROL (N=9)
Nu
mb
er
of
Inte
rvie
we
es
Frequency of Strategies
99 × 180
1st quintile
2nd quintile
3rd quintile
4th quintile
5th quintile
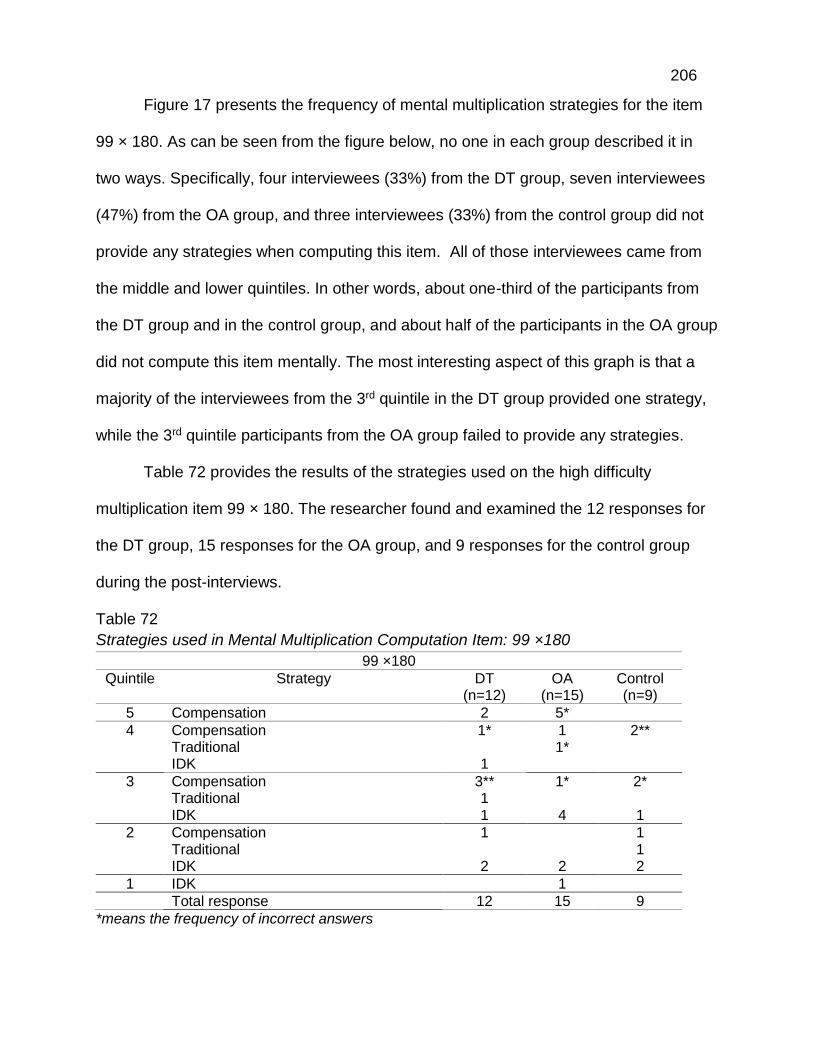
206
Figure 17 presents the frequency of mental multiplication strategies for the item
99 × 180. As can be seen from the figure below, no one in each group described it in
two ways. Specifically, four interviewees (33%) from the DT group, seven interviewees
(47%) from the OA group, and three interviewees (33%) from the control group did not
provide any strategies when computing this item. All of those interviewees came from
the middle and lower quintiles. In other words, about one-third of the participants from
the DT group and in the control group, and about half of the participants in the OA group
did not compute this item mentally. The most interesting aspect of this graph is that a
majority of the interviewees from the 3rd quintile in the DT group provided one strategy,
while the 3rd quintile participants from the OA group failed to provide any strategies.
Table 72 provides the results of the strategies used on the high difficulty
multiplication item 99 × 180. The researcher found and examined the 12 responses for
the DT group, 15 responses for the OA group, and 9 responses for the control group
during the post-interviews.
Table 72
Strategies used in Mental Multiplication Computation Item: 99 ×180
99 ×180
Quintile Strategy DT (n=12)
OA (n=15)
Control (n=9)
5 Compensation 2 5*
4 Compensation 1* 1 2** Traditional 1* IDK 1
3 Compensation 3** 1* 2* Traditional 1 IDK 1 4 1
2 Compensation 1 1 Traditional 1 IDK 2 2 2
1 IDK 1
Total response 12 15 9
*means the frequency of incorrect answers
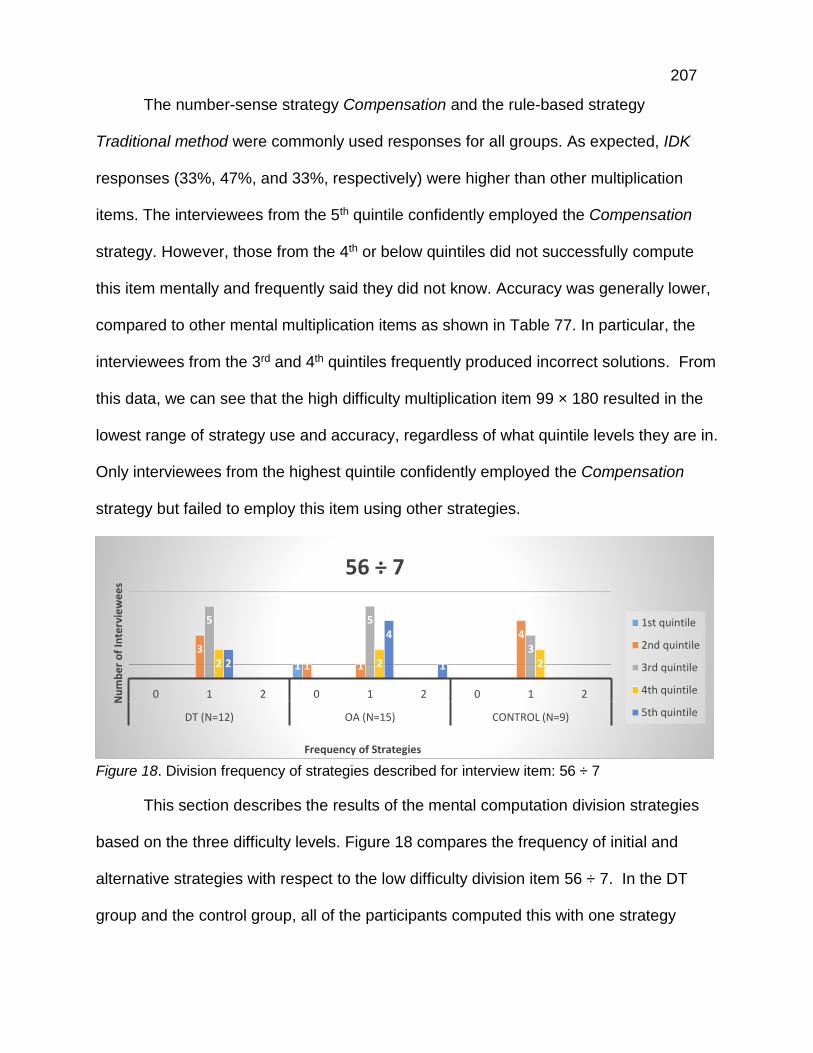
207
The number-sense strategy Compensation and the rule-based strategy
Traditional method were commonly used responses for all groups. As expected, IDK
responses (33%, 47%, and 33%, respectively) were higher than other multiplication
items. The interviewees from the 5th quintile confidently employed the Compensation
strategy. However, those from the 4th or below quintiles did not successfully compute
this item mentally and frequently said they did not know. Accuracy was generally lower,
compared to other mental multiplication items as shown in Table 77. In particular, the
interviewees from the 3rd and 4th quintiles frequently produced incorrect solutions. From
this data, we can see that the high difficulty multiplication item 99 × 180 resulted in the
lowest range of strategy use and accuracy, regardless of what quintile levels they are in.
Only interviewees from the highest quintile confidently employed the Compensation
strategy but failed to employ this item using other strategies.
Figure 18. Division frequency of strategies described for interview item: 56 ÷ 7
This section describes the results of the mental computation division strategies
based on the three difficulty levels. Figure 18 compares the frequency of initial and
alternative strategies with respect to the low difficulty division item 56 ÷ 7. In the DT
group and the control group, all of the participants computed this with one strategy
1
3
1 1
45 5
32 2 22
4
1
0 1 2 0 1 2 0 1 2
DT (N=12) OA (N=15) CONTROL (N=9)
Nu
mb
er
of
Inte
rvie
we
es
Frequency of Strategies
56 ÷ 7
1st quintile
2nd quintile
3rd quintile
4th quintile
5th quintile
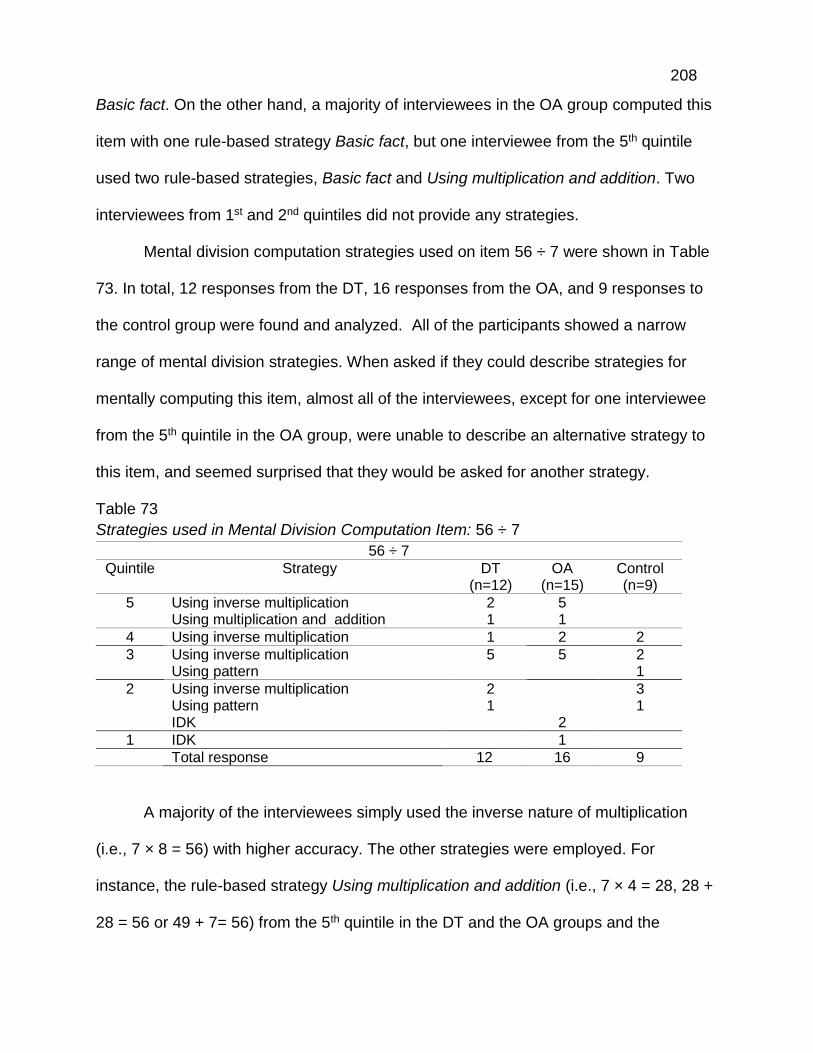
208
Basic fact. On the other hand, a majority of interviewees in the OA group computed this
item with one rule-based strategy Basic fact, but one interviewee from the 5th quintile
used two rule-based strategies, Basic fact and Using multiplication and addition. Two
interviewees from 1st and 2nd quintiles did not provide any strategies.
Mental division computation strategies used on item 56 ÷ 7 were shown in Table
73. In total, 12 responses from the DT, 16 responses from the OA, and 9 responses to
the control group were found and analyzed. All of the participants showed a narrow
range of mental division strategies. When asked if they could describe strategies for
mentally computing this item, almost all of the interviewees, except for one interviewee
from the 5th quintile in the OA group, were unable to describe an alternative strategy to
this item, and seemed surprised that they would be asked for another strategy.
Table 73
Strategies used in Mental Division Computation Item: 56 ÷ 7
56 ÷ 7
Quintile Strategy DT (n=12)
OA (n=15)
Control (n=9)
5 Using inverse multiplication 2 5 Using multiplication and addition 1 1
4 Using inverse multiplication 1 2 2
3 Using inverse multiplication 5 5 2 Using pattern 1
2 Using inverse multiplication 2 3 Using pattern 1 1 IDK 2
1 IDK 1
Total response 12 16 9
A majority of the interviewees simply used the inverse nature of multiplication
(i.e., 7 × 8 = 56) with higher accuracy. The other strategies were employed. For
instance, the rule-based strategy Using multiplication and addition (i.e., 7 × 4 = 28, 28 +
28 = 56 or 49 + 7= 56) from the 5th quintile in the DT and the OA groups and the
209
number-sense strategy Using pattern (i.e., 7 × 7 = 49, 7 × 8 = 56) was found by the
lower quintile interviewees from the DT and the control group. IDK response was found
only in the OA group. It is apparent from this table that the rule-based strategy Using
inverse multiplication was the most popular response used by the interviewees from 2nd
to 5th quintiles. In particular, the differences between interviewees in the upper and
lower quintiles were highlighted in the OA group. This means that the interviewees in
the middle and upper quintiles tended to use the rule-based strategies Using inverse
multiplication and Using multiplication and addition. On the contrary, the interviewees in
the lower quintiles were more likely to employ the IDK response. The number-sense
strategy Using pattern was frequently observed by the interviewees in the 2nd quintile
from the DT group and 2nd and 3rd quintiles in the control group. In contrast, IDK
response was not shown for these groups.
Figure 19. Division frequency of strategies described for interview item: 80 ÷ 16
Figure 19 presents the division frequency of strategies when interviewing 80 ÷
16. The strategy frequency of this item 80 ÷ 16 is somewhat narrow. Only one 5th
quintile interviewee in the DT group and 3 interviewees in the 5th quintile for the OA
group provided their strategies in two ways. Eight interviewees (i.e., 1 from 5th, 1 from
11 2 2 1
3
1
45
1 21 1 2 21 1 23
0 1 2 0 1 2 0 1 2
DT (N=12) OA (N=15) CONTROL (N=9)Nu
mb
er
of
Inte
rvie
we
es
Frequency of Strategies
80 ÷ 16
1st quintile
2nd quintile
3rd quintile
4th quintile
5th quintile

210
4th, 3 from 4th, 2 from 4th, and 5th from 5th quintiles) in the DT group, nine interviewees
(i.e., 2 from the 5th, 1 from the 4th, and 4 from the 5th quintiles) in the OA group, and
seven interviewee (i.e., 2 from the 4th, 2 from the 3rd, and 3 from the 2nd quintiles) from
the control group described their strategies in two different ways. The rest of
interviewees did not provide any response.
Table 74 indicates the results of the strategies used on the division medium
difficulty item 80 ÷ 16. The researcher reviewed 13 responses for the DT group, 18
responses for the OA group, and 9 responses for the control group.
Table 74
Strategies used in Mental Division Computation Item: 80 ÷ 16
80 ÷ 16
Quintile Strategy DT (n=12)
OA (n=15)
Control (n=9)
5 Using inverse multiplication 1 2 Using fraction 1 3 Traditional 1 3
4 Using inverse multiplication 1 1 Using fraction 1 1 Traditional 1 IDK 1
3 Using inverse multiplication 2 1 1 Traditional 2* 4 2 IDK 1 1
2 Using inverse multiplication
Traditional 2 2* IDK 1 2 1
1 IDK 1
Total response 13 18 9
*means the frequency of incorrect answers
The most popular strategies employed by the interviewees in the upper quintiles
were Using inverse multiplication (i.e., 16 × 5 = 80), Using fraction (i.e., 80
16 =
20
4= 5), and
the mental image of the Traditional method that was mostly used as an alternative
strategy. Those were all rule-based strategies. In the 3rd quintile, the rule-based
strategies Using inverse multiplication and Traditional method were commonly observed

211
strategies for all groups and IDK response was observed from the DT group and the
control group. The Traditional method and IDK response were used for the lower
quintiles for all of the three groups. In terms of accuracy, the interviewees in the OA
group produced all correct solutions. However, when employing the strategy Traditional
method, an interviewee from the 3rd quintile in the DT group and one interviewee from
the 2nd quintile in the control group produced incorrect solutions. The overall response
to the interviews indicated that fewer strategies for the mental division operation were
employed, the strategies Traditional method and IDK response were higher than the
researcher predicted in both DT and OA groups.
Figure 20. Division frequency of strategies described for interview item: 468 ÷ 18
In the high difficulty division item 468 ÷ 18, as predicted, the researcher found
fewer responses than other division items. Figure 20 shows the frequency of mental
division strategies for the item 468 ÷ 18. Only one interviewee from the 5th quintile in the
OA group described the strategies in two ways. Seven interviewees in the DT group,
five interviewees in the OA group, and three interviewees in the control group provided
one strategy. What stands out in Figure 12 was that the three interviewees from the 3rd
quintile in the DT group provided one strategy, while all of the five interviewees from the
12
12 2 22
3
5
3
2 21 1
21
3
1
0 1 2 0 1 2 0 1 2
DT (N=12) OA (N=15) CONTROL (N=9)
Nu
mb
er
of
Inte
rvie
we
es
Frequency of Strategies
468 ÷ 18
1st quintile
2nd quintile
3rd quintile
4th quintile
5th quintile
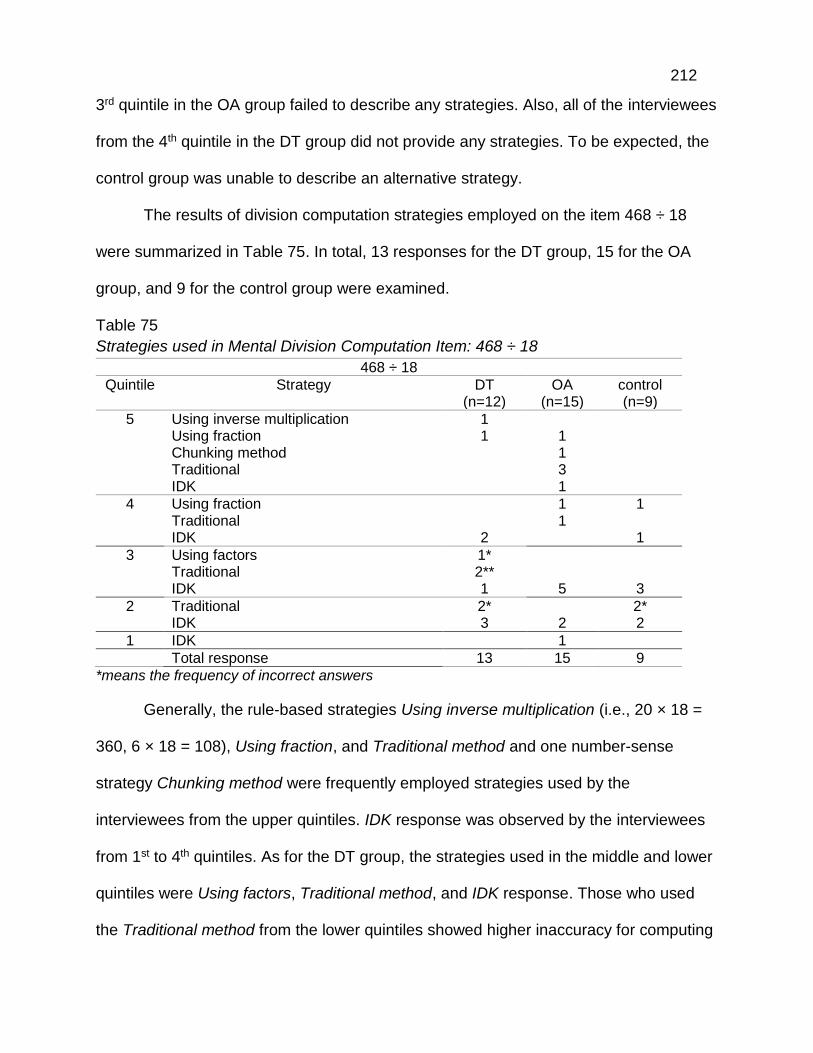
212
3rd quintile in the OA group failed to describe any strategies. Also, all of the interviewees
from the 4th quintile in the DT group did not provide any strategies. To be expected, the
control group was unable to describe an alternative strategy.
The results of division computation strategies employed on the item 468 ÷ 18
were summarized in Table 75. In total, 13 responses for the DT group, 15 for the OA
group, and 9 for the control group were examined.
Table 75
Strategies used in Mental Division Computation Item: 468 ÷ 18
468 ÷ 18
Quintile Strategy DT (n=12)
OA (n=15)
control (n=9)
5 Using inverse multiplication 1 Using fraction 1 1 Chunking method 1 Traditional 3 IDK 1
4 Using fraction 1 1 Traditional 1 IDK 2 1
3 Using factors 1* Traditional 2** IDK 1 5 3
2 Traditional 2* 2* IDK 3 2 2
1 IDK 1
Total response 13 15 9
*means the frequency of incorrect answers
Generally, the rule-based strategies Using inverse multiplication (i.e., 20 × 18 =
360, 6 × 18 = 108), Using fraction, and Traditional method and one number-sense
strategy Chunking method were frequently employed strategies used by the
interviewees from the upper quintiles. IDK response was observed by the interviewees
from 1st to 4th quintiles. As for the DT group, the strategies used in the middle and lower
quintiles were Using factors, Traditional method, and IDK response. Those who used
the Traditional method from the lower quintiles showed higher inaccuracy for computing
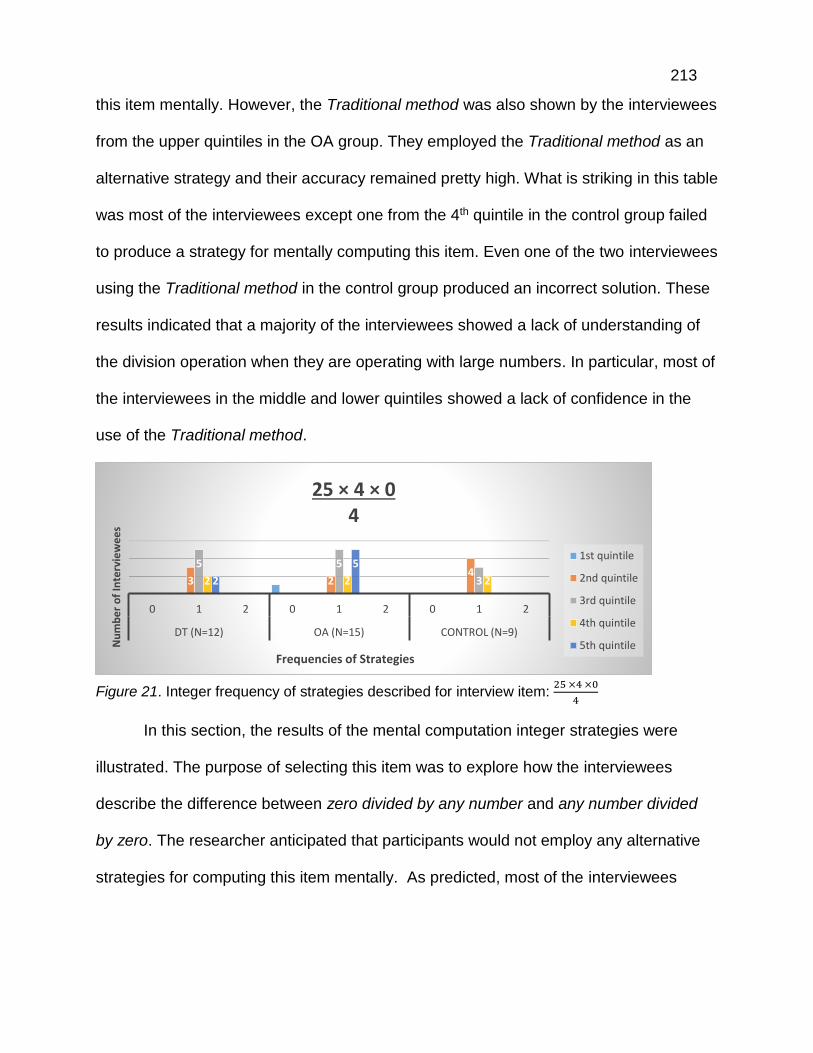
213
this item mentally. However, the Traditional method was also shown by the interviewees
from the upper quintiles in the OA group. They employed the Traditional method as an
alternative strategy and their accuracy remained pretty high. What is striking in this table
was most of the interviewees except one from the 4th quintile in the control group failed
to produce a strategy for mentally computing this item. Even one of the two interviewees
using the Traditional method in the control group produced an incorrect solution. These
results indicated that a majority of the interviewees showed a lack of understanding of
the division operation when they are operating with large numbers. In particular, most of
the interviewees in the middle and lower quintiles showed a lack of confidence in the
use of the Traditional method.
Figure 21. Integer frequency of strategies described for interview item: 25 ×4 ×0
4
In this section, the results of the mental computation integer strategies were
illustrated. The purpose of selecting this item was to explore how the interviewees
describe the difference between zero divided by any number and any number divided
by zero. The researcher anticipated that participants would not employ any alternative
strategies for computing this item mentally. As predicted, most of the interviewees
13 24
5 5
32 2 22
5
0 1 2 0 1 2 0 1 2
DT (N=12) OA (N=15) CONTROL (N=9)
Nu
mb
er
of
Inte
rvie
we
es
Frequencies of Strategies
25 × 4 × 0 4
1st quintile
2nd quintile
3rd quintile
4th quintile
5th quintile
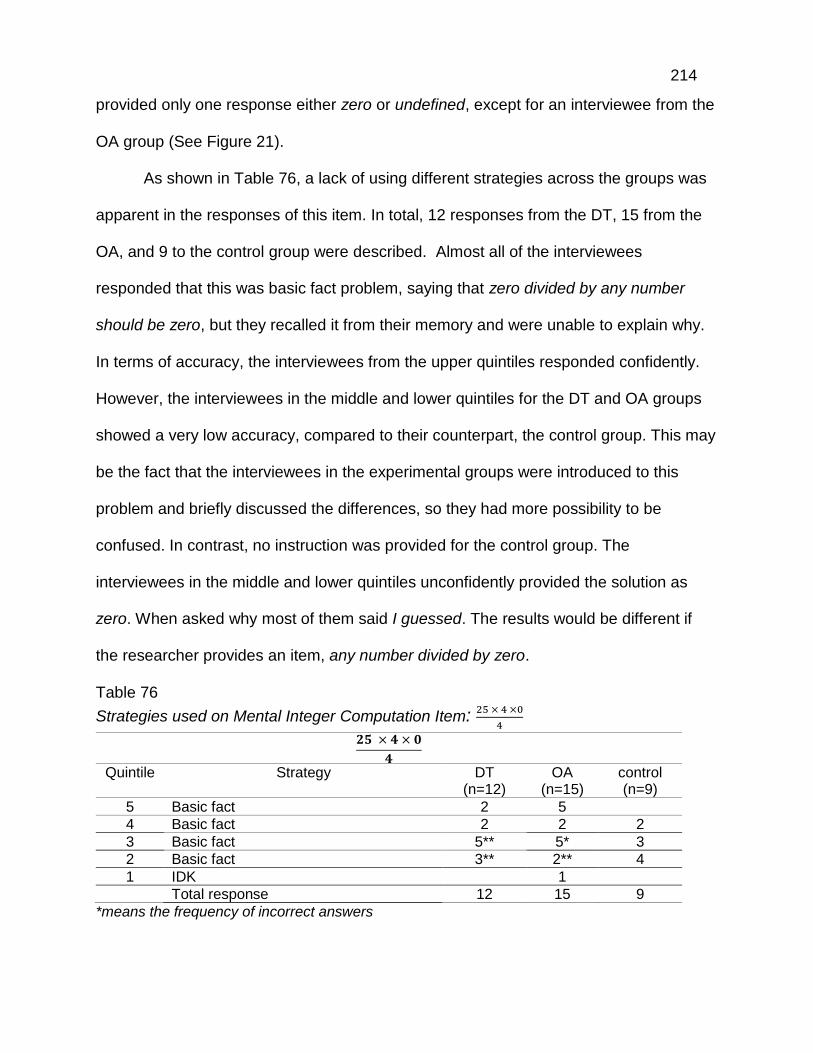
214
provided only one response either zero or undefined, except for an interviewee from the
OA group (See Figure 21).
As shown in Table 76, a lack of using different strategies across the groups was
apparent in the responses of this item. In total, 12 responses from the DT, 15 from the
OA, and 9 to the control group were described. Almost all of the interviewees
responded that this was basic fact problem, saying that zero divided by any number
should be zero, but they recalled it from their memory and were unable to explain why.
In terms of accuracy, the interviewees from the upper quintiles responded confidently.
However, the interviewees in the middle and lower quintiles for the DT and OA groups
showed a very low accuracy, compared to their counterpart, the control group. This may
be the fact that the interviewees in the experimental groups were introduced to this
problem and briefly discussed the differences, so they had more possibility to be
confused. In contrast, no instruction was provided for the control group. The
interviewees in the middle and lower quintiles unconfidently provided the solution as
zero. When asked why most of them said I guessed. The results would be different if
the researcher provides an item, any number divided by zero.
Table 76
Strategies used on Mental Integer Computation Item: 25 × 4 ×0
4
𝟐𝟓 × 𝟒 × 𝟎
𝟒
Quintile Strategy DT (n=12)
OA (n=15)
control (n=9)
5 Basic fact 2 5
4 Basic fact 2 2 2
3 Basic fact 5** 5* 3
2 Basic fact 3** 2** 4
1 IDK 1
Total response 12 15 9
*means the frequency of incorrect answers
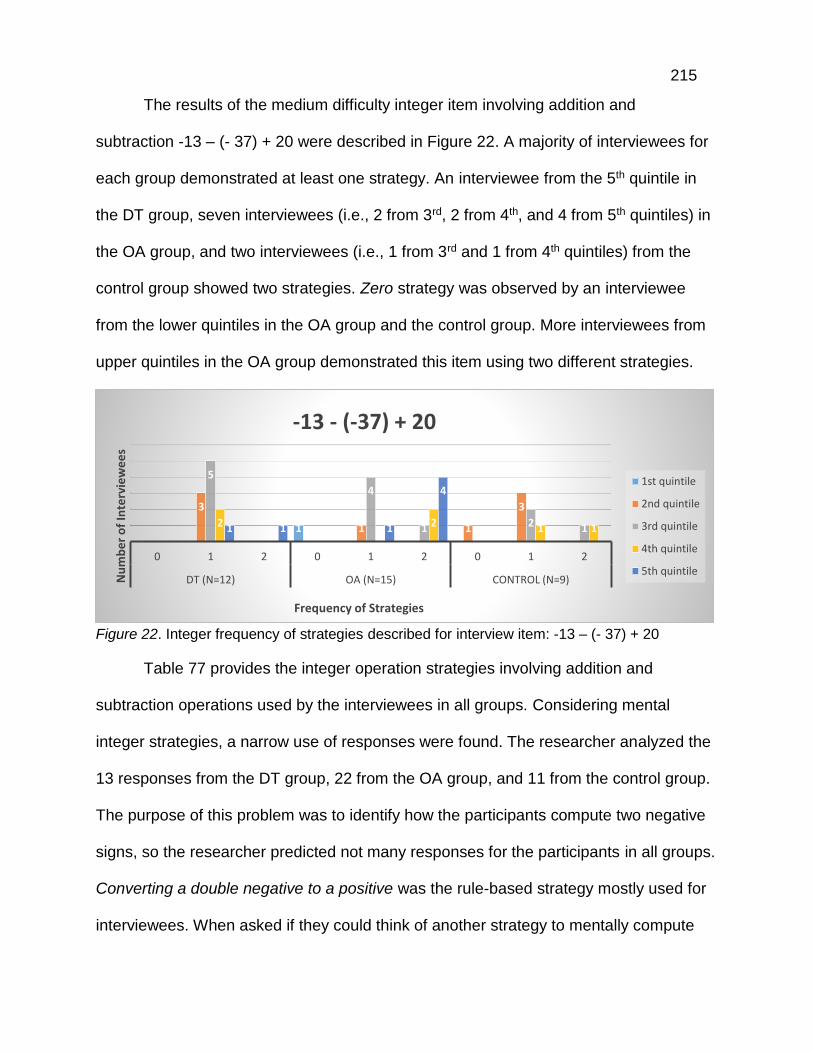
215
The results of the medium difficulty integer item involving addition and
subtraction -13 – (- 37) + 20 were described in Figure 22. A majority of interviewees for
each group demonstrated at least one strategy. An interviewee from the 5th quintile in
the DT group, seven interviewees (i.e., 2 from 3rd, 2 from 4th, and 4 from 5th quintiles) in
the OA group, and two interviewees (i.e., 1 from 3rd and 1 from 4th quintiles) from the
control group showed two strategies. Zero strategy was observed by an interviewee
from the lower quintiles in the OA group and the control group. More interviewees from
upper quintiles in the OA group demonstrated this item using two different strategies.
Figure 22. Integer frequency of strategies described for interview item: -13 – (- 37) + 20
Table 77 provides the integer operation strategies involving addition and
subtraction operations used by the interviewees in all groups. Considering mental
integer strategies, a narrow use of responses were found. The researcher analyzed the
13 responses from the DT group, 22 from the OA group, and 11 from the control group.
The purpose of this problem was to identify how the participants compute two negative
signs, so the researcher predicted not many responses for the participants in all groups.
Converting a double negative to a positive was the rule-based strategy mostly used for
interviewees. When asked if they could think of another strategy to mentally compute
1
3
1 1
3
5
4
1 2 12 2 1 11 1 1
4
0 1 2 0 1 2 0 1 2
DT (N=12) OA (N=15) CONTROL (N=9)Nu
mb
er
of
Inte
rvie
we
es
Frequency of Strategies
-13 - (-37) + 20
1st quintile
2nd quintile
3rd quintile
4th quintile
5th quintile

216
the answer, all of the participants successfully converted two negative signs to the
positive sign and were more likely to rearrange numbers such as 20 – 13 + 37 or 37 +
20 – 13 as their alternative strategy. Mostly, higher accuracy was shown by most of the
interviewees for each group. Fewer IDK responses were observed in the OA and the
control group. In terms of the use of integer strategies, almost all of the participants
were aware of the fact that if the signs of the numbers are the same, the answer should
be positive and if the signs of the numbers are different, the answer should be negative.
In this item, the answer should be negative because the signs are different.
Table 77
Strategies used on Mental Integer Computation Item: -13 – (-37) + 20
-13 – (-37) + 20
Quintile Strategy DT (n=12)
OA (n=15)
control (n=9)
5 Converting a double negative to a positive
3 9
4 Converting a double negative to a positive
2 4 3
3 Converting a double negative to a positive
5* 6* 4
2 Converting a double negative to a positive
3* 2 3
IDK 1
1 IDK 1
Total response 13 22 11
*means the frequency of incorrect answers
The results of the high difficulty integer problem involving multiplication and
division were provided in this section. Figure 23 indicates the results of the frequency of
strategies for the item 24 × 4 ÷ (-6). Compared to the integer problem involving addition
and subtraction, more zero responses (i.e., 2 interviewees for the DT, 4 for the OA, and
3 for the control groups) were found for each group.

217
Figure 23. Integer frequency of strategies described for interview item: 24 × 4 ÷ (-6)
A majority of interviewees provided one strategy and only one interviewee from
the 4th quintile and two interviewees from the 5th quintile provided two strategies. In
other words, the interviewees in the upper quintiles produced more strategies, while
those who were in the lower quintiles had fewer strategies. As predicted, the control
group was unable to describe alternative strategies.
Table 78
Strategies Used on Mental Integer Computation Item: 24 × 4 ÷ (-6)
24 × 4 ÷ (-6)
Quintile Strategy DT (n=12)
OA (n=15)
control (n=9)
5 Multiplying and dividing and keeping the negative if it is the different sign
2 7
4 Multiplying and dividing and keeping the negative if it is the different sign
3 2 2
3 Multiplying and dividing and keeping the negative if it is the different sign
5** 3* 2
IDK 2 1
2 Multiplying and dividing and keeping the negative if it is the different sign
1* 1* 2
IDK 2 1 2
1 IDK 1
Total response 13 17 9 *means the frequency of incorrect answer
Table 78 presents the results of mental integer computation strategies used by
interviewees in all three groups. When asked for another strategy to compute, most of
12 1 1 1 2 2
5
2
3
1 21 1 2 22
3
2
0 1 2 0 1 2 0 1 2
DT (N=12) OA (N=15) CONTROL (N=9)Nu
mb
er
of
Inte
rvie
we
es
Frequency of Strategies
24 × 4 ÷ (-6)
1st quintile
2nd quintile
3rd quintile
4th quintile
5th quintile

218
them were more likely to employ Rearranging numbers (i.e., 24 × 4 ÷ (-6) = 96 ÷ (-6) or
24 ÷ (-6) × 4 = (-4) × 4) like the integer addition and subtraction problem above. In total,
13 responses from the DT group, 17 from the OA group, and 9 in the control group were
analyzed. Most of the interviewees from the upper quintiles accurately computed this
item, while less accuracy was observed from a majority of the interviewees in the lower
quintiles, who unsuccessfully computed the division operation problem. Accordingly,
IDK response was shown by the interviewees from the lower quintiles in the DT group
and from the middle and lower quintiles in the OA and the control group. From the data
in Figure 26 and Table 78, it is apparent that a majority of the interviewees were aware
of the rules for negative and positive numbers in integer multiplication and division
problems, but the interviewees from the middle and lower quintiles had difficulty in
computing the division operation rather than computing the multiplication operation.
Figure 24. Fraction frequency of strategies described for interview item: 2
3 × 18
In this section, the researcher reports the results of mental computation
strategies with respect to the fraction operations. The results of the frequency of
strategies were summarized in Figure 24. Most interviewees in every quintile described
it with one strategy for each group. One interviewee from the 3rd quintile provided two
12 1 1 1 2 213
1
5
1 22 2 1 12 23
0 1 2 0 1 2 0 1 2
DT (N=12) OA (N=15) CONTROL (N=9)
Nu
mb
er
of
Inte
rvie
we
es
Frequency of Strategies
2/3 × 181st quintile
2nd quintile
3rd quintile
4th quintile
5th quintile

219
strategies in the DT group, three 5th quintile interviewees in the OA group, and one 4th
quintile interviewee provided two strategies in the control group. Two interviewees (i.e.,
1 for 2nd and 1 for 3rd quintiles) from the DT group, two interviewees (i.e., 1 for 2nd and 1
for 1st quintiles), and three interviewees (i.e., 1 from 3rd and 2 from 2nd quintiles) failed to
provide strategies.
Table 79 compares the results of strategies used on the low difficulty fraction
item 2/3 × 18. The researcher examined 13 responses from the DT group, 18 from the
OA group, and 9 from the control group.
Table 79
Strategies used on Mental Fraction Computation Item: 2
3 × 18
𝟐
𝟑 × 18
Quintile Strategy DT (n=12)
OA (n=15)
control (n=9)
5 Converting the whole number to fraction and Multiplying fractions together
2 4
Reducing 3 Drawing 1
4 Converting the whole number to fraction and Multiplying fractions together
1 1
Using repeated addition 1 Reducing 1 2 Incorrect computation 1
3 Converting the whole number to fraction and Multiplying fractions together
3 4* 1
Using repeated addition 1 Reducing 1 1 Incorrect computation 1 IDK 1
2 Converting the whole number to fraction and Multiplying fractions together
1
Reducing 1 1 Incorrect computation 1 1 IDK 1 1 2
1 IDK 1
Total response 13 18 9
*means the frequency of incorrect answers

220
The most commonly used strategies employed by the interviewees in the middle
and upper quintiles for the DT group and the OA group were the rule-based strategies
Converting the whole number to fraction and Multiplying fractions together (e.g., 2
3 ×
18
1 =
2 ×18
3 × 1 ) and Reducing (e.g.,
2
3 × 18 6 = 2 × 6). In particular, the number-sense strategy
Drawing (e.g., ) was also observed from the interviewee in the 5th quintile in the
OA group. Incorrect computations (e.g., 3 × 18 = 54, 54 + 2 = 56 or (2 × 54)/3) were
observed by the interviewees in the middle and lower quintiles for the DT and in the 2nd
and 4th quintiles for the OA group. Similarly, IDK response was observed by the
interviewees in the 2nd and 3rd quintiles for the DT group and in the 1st and 2nd quintiles
for the OA group. In the control group, the number-sense strategy Using repeated
addition (i.e., 6 + 6 + 6 = 18, 6 + 6 = 12 is the two-thirds of 18) and rule-based strategy
Reducing were used by the interviewees in the 4th quintile. The 3rd quintile interviewees
employed the strategies Converting the whole number to fraction and multiplying
fractions together and Using repeated addition. This strategy was also observed by the
interviewees in the 2nd quintile. An Incorrect computation and two IDK responses were
shown in the same quintile. They all showed a relatively higher accuracy when
computing this item. These results showed that the interviewees in the DT group
mentally computed this item using rule-based strategies or teacher–taught algorithm.
Likewise, most of the interviewees in the OA group used similar strategies like the DT
group, except for the number-sense strategy or self-developed strategy (e.g., Drawing)
in the 5th quintile.

221
Figure 25. Fraction frequency of strategies described for interview item: 4 1
2 + 1
3
4
This section illustrates the results of the medium difficulty fraction item 4 ½ + 1 ¾.
Figure 25 reports the results of the frequency of the fraction medium difficulty item 4 ½ +
1 ¾. One 5th quintile interviewee in the DT group and four 5th quintile interviewees in the
OA group computed this item using two strategies. Most of the 2nd, 3rd, and 4th quintile
interviewees for each group described it with one strategy. Two 2nd quintile interviewees
and one interviewee from the OA group provided no strategies for mentally computing
this item. The control group participants showed an inability to formulate alternative
strategies. Generally, the participants in the higher quintiles showed more strategies,
while one or zero strategies were employed by the interviewees in the lower quintiles.
The detailed strategies used for this item were presented in Table 80 and a wide
range of strategies was found. The researcher examined 13 total responses from the
DT group, 19 from the OA group, and 9 from the control group. In the DT group, the
rule-based strategies were mostly used by the interviewees in the middle and upper
quintiles such as Making the same denominator, and the number-sense strategy
Converting fraction to decimal and Converting fraction to money. Incorrect computation
and IDK response were found by the interviewees in the lower quintiles.
12 1 2
4
5 5
3
2 2 21 1 1
4
0 1 2 0 1 2 0 1 2
DT (N=12) OA (N=15) CONTROL (N=9)
Nu
mb
er
of
Inte
rvie
we
es
Frequency of Strategies
4 1/2 + 1 3/4
1st quintile
2nd quintile
3rd quintile
4th quintile
5th quintile
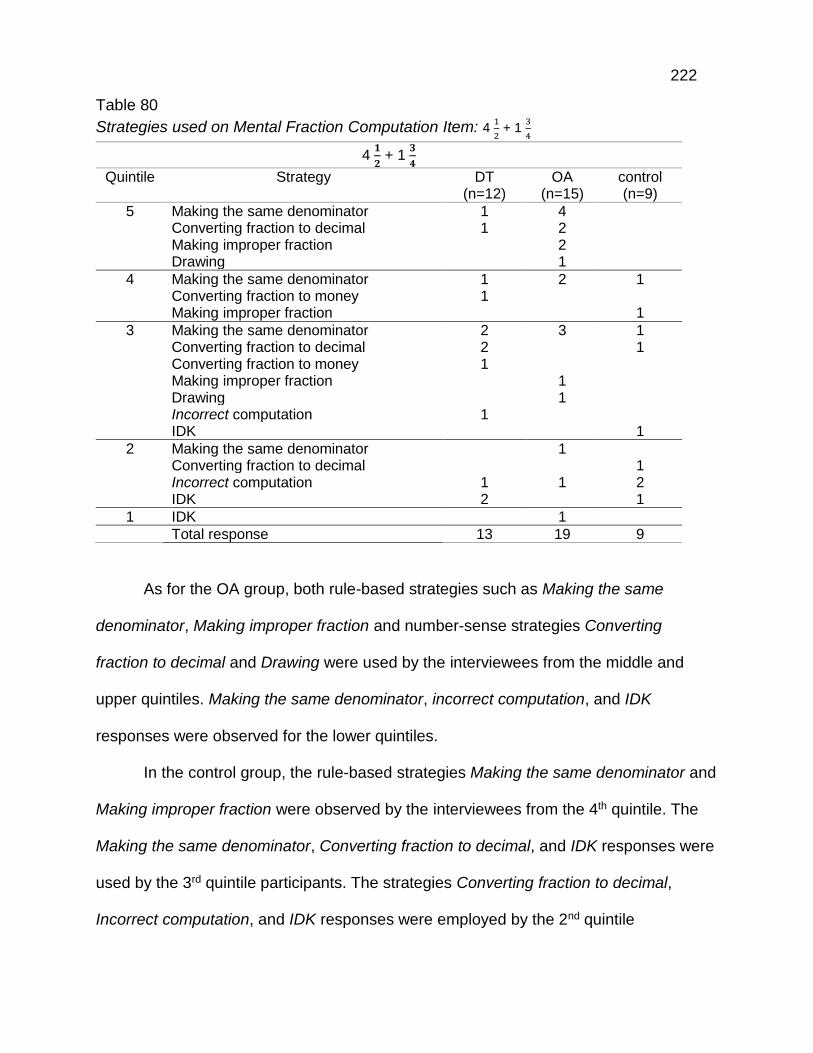
222
Table 80
Strategies used on Mental Fraction Computation Item: 4 1
2 + 1
3
4
4 𝟏
𝟐 + 1
𝟑
𝟒
Quintile Strategy DT (n=12)
OA (n=15)
control (n=9)
5 Making the same denominator 1 4 Converting fraction to decimal 1 2 Making improper fraction 2 Drawing 1
4 Making the same denominator 1 2 1 Converting fraction to money 1 Making improper fraction 1
3 Making the same denominator 2 3 1 Converting fraction to decimal 2 1 Converting fraction to money 1 Making improper fraction 1 Drawing 1 Incorrect computation 1 IDK 1
2 Making the same denominator 1 Converting fraction to decimal 1 Incorrect computation 1 1 2 IDK 2 1
1 IDK 1
Total response 13 19 9
As for the OA group, both rule-based strategies such as Making the same
denominator, Making improper fraction and number-sense strategies Converting
fraction to decimal and Drawing were used by the interviewees from the middle and
upper quintiles. Making the same denominator, incorrect computation, and IDK
responses were observed for the lower quintiles.
In the control group, the rule-based strategies Making the same denominator and
Making improper fraction were observed by the interviewees from the 4th quintile. The
Making the same denominator, Converting fraction to decimal, and IDK responses were
used by the 3rd quintile participants. The strategies Converting fraction to decimal,
Incorrect computation, and IDK responses were employed by the 2nd quintile

223
interviewees. Accuracy was considerably higher when strategies other than Incorrect
computation and IDK responses were employed. These results showed that the
participants from the 3rd quintile used a wider variety of strategies than other groups.
Generally, the participants for the OA group provided more different strategies than the
other groups. Even the OA groups computed this item with rule-based strategies or
teacher-taught algorithms but two interviewees (one from 3rd and one from 5th quintiles)
used the number-sense strategy Drawing.
This section describes the findings of the high difficulty mental fraction
multiplication item 1/3 × 4 1/5. As shown in Figure 26, six participants in the DT group
used one strategy and only one interviewee was able to provide two different strategies.
In the OA group, there were no interviewees who responded with two strategies, a
majority of interviewees in the middle and upper quintiles provided only one strategy,
and three interviewees (i.e., 1 from 1st, 1 from 2nd, and 1 from 5th quintiles) failed to
describe any strategies. Unlike other groups, the interviewees in the control group were
reluctant to provide alternative strategies.
Figure 26. Fraction frequency of strategies described for interviews item: 1
3 × 4
1
5
12
1 1 1 1
3
2
3
5
211 1
2 221
4
0 1 2 0 1 2 0 1 2
DT (N=12) OA (N=15) CONTROL (N=9)
Nu
mb
er
of
Inte
rvie
we
es
Frequency of Strategies
1/3 × 4 1/5
1st quintile
2nd quintile
3rd quintile
4th quintile
5th quintile

224
The total responses were as follows: 13 responses for the DT group, 15 for the
OA group, and 9 for the control group. In the use of strategies of this item, a majority of
interviewees were generally unable to produce an alternative strategy, but they
described a variety of strategies, especially in the 4th quintile compared to other high
difficulty items. As shown in Table 81, more middle and lower quintile participants in the
DT group failed to describe their strategies compared to other groups. The interviewees
in the upper quintiles for the DT group employed the rule-based strategies Making
improper fraction (i.e., 1
3 × 4
1
5=
1
3 ×
21
5=
21
15=
7
5) and number-sense strategies
Converting fraction to decimal, and Using inverse multiplication (i.e.,? × 3 = 4.2). The
interviewees in the middle quintiles used the rule-based strategy Making improper
fraction. Incorrect computation (i.e., 1
3 × 4
1
5 = 4 ×
1 × 1
3 × 5 = 4
1
15 ) and IDK responses were
mostly found in the 2nd and 3rd quintiles.
Table 81
Strategies used on Mental Fraction Computation Item: 1
3 × 4
1
5
𝟏
𝟑 × 4
𝟏
𝟓
Quintile Strategy DT (n=12)
OA (n=15)
control (n=9)
5 Making improper fraction 1 4 IDK 1
4 Converting fraction to decimal 1 Making improper fraction 2 1 Making improper fraction and reducing 1 Using inverse multiplication 1 IDK 1
3 Making improper fraction 2 3 Incorrect computation 2 2 1 IDK 2 2
2 Making improper fraction 1 Incorrect computation 1 1 2 IDK 2 1 1
1 IDK 1
Total response 13 15 9
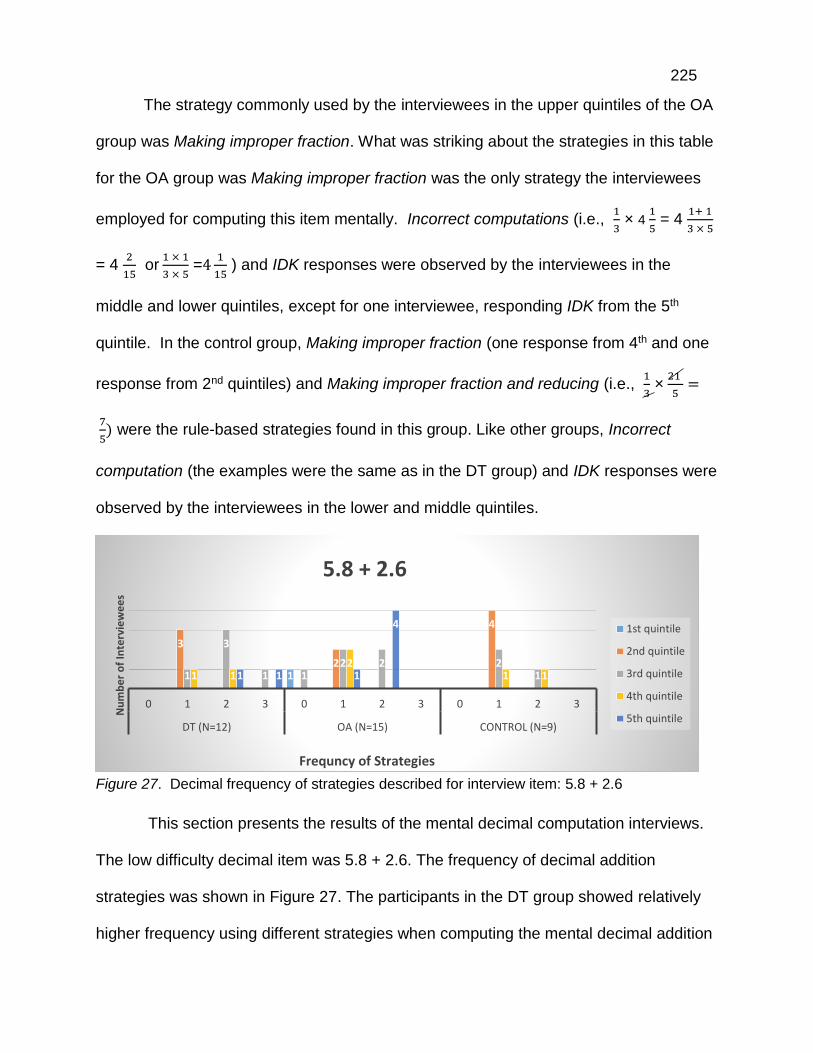
225
The strategy commonly used by the interviewees in the upper quintiles of the OA
group was Making improper fraction. What was striking about the strategies in this table
for the OA group was Making improper fraction was the only strategy the interviewees
employed for computing this item mentally. Incorrect computations (i.e., 1
3 × 4
1
5 = 4
1+ 1
3 × 5
= 4 2
15 or
1 × 1
3 × 5 =4
1
15 ) and IDK responses were observed by the interviewees in the
middle and lower quintiles, except for one interviewee, responding IDK from the 5th
quintile. In the control group, Making improper fraction (one response from 4th and one
response from 2nd quintiles) and Making improper fraction and reducing (i.e., 1
3 ×
21
5=
7
5) were the rule-based strategies found in this group. Like other groups, Incorrect
computation (the examples were the same as in the DT group) and IDK responses were
observed by the interviewees in the lower and middle quintiles.
Figure 27. Decimal frequency of strategies described for interview item: 5.8 + 2.6
This section presents the results of the mental decimal computation interviews.
The low difficulty decimal item was 5.8 + 2.6. The frequency of decimal addition
strategies was shown in Figure 27. The participants in the DT group showed relatively
higher frequency using different strategies when computing the mental decimal addition
1
3
2
4
1
3
1 12 2 2
11 12
1 11 1 1
4
0 1 2 3 0 1 2 3 0 1 2 3
DT (N=12) OA (N=15) CONTROL (N=9)
Nu
mb
er
of
Inte
rvie
we
es
Frequncy of Strategies
5.8 + 2.6
1st quintile
2nd quintile
3rd quintile
4th quintile
5th quintile
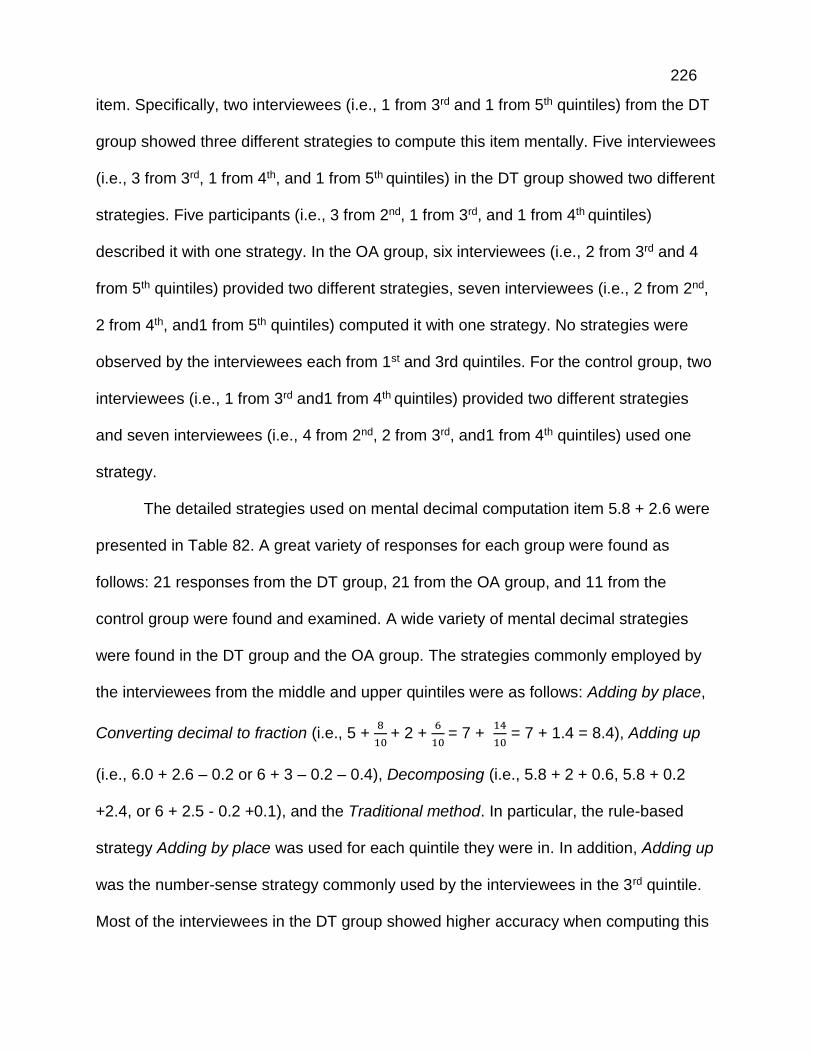
226
item. Specifically, two interviewees (i.e., 1 from 3rd and 1 from 5th quintiles) from the DT
group showed three different strategies to compute this item mentally. Five interviewees
(i.e., 3 from 3rd, 1 from 4th, and 1 from 5th quintiles) in the DT group showed two different
strategies. Five participants (i.e., 3 from 2nd, 1 from 3rd, and 1 from 4th quintiles)
described it with one strategy. In the OA group, six interviewees (i.e., 2 from 3rd and 4
from 5th quintiles) provided two different strategies, seven interviewees (i.e., 2 from 2nd,
2 from 4th, and1 from 5th quintiles) computed it with one strategy. No strategies were
observed by the interviewees each from 1st and 3rd quintiles. For the control group, two
interviewees (i.e., 1 from 3rd and1 from 4th quintiles) provided two different strategies
and seven interviewees (i.e., 4 from 2nd, 2 from 3rd, and1 from 4th quintiles) used one
strategy.
The detailed strategies used on mental decimal computation item 5.8 + 2.6 were
presented in Table 82. A great variety of responses for each group were found as
follows: 21 responses from the DT group, 21 from the OA group, and 11 from the
control group were found and examined. A wide variety of mental decimal strategies
were found in the DT group and the OA group. The strategies commonly employed by
the interviewees from the middle and upper quintiles were as follows: Adding by place,
Converting decimal to fraction (i.e., 5 + 8
10 + 2 +
6
10 = 7 +
14
10 = 7 + 1.4 = 8.4), Adding up
(i.e., 6.0 + 2.6 – 0.2 or 6 + 3 – 0.2 – 0.4), Decomposing (i.e., 5.8 + 2 + 0.6, 5.8 + 0.2
+2.4, or 6 + 2.5 - 0.2 +0.1), and the Traditional method. In particular, the rule-based
strategy Adding by place was used for each quintile they were in. In addition, Adding up
was the number-sense strategy commonly used by the interviewees in the 3rd quintile.
Most of the interviewees in the DT group showed higher accuracy when computing this

227
item mentally. Incorrect computation (i.e., 5.8 + 2.6 = 7.14) was shown in the 2nd quintile
of this group.
Table 82
Strategies used on Mental Decimal Computation Item: 5.8 + 2.6
5.8 + 2.6
Quintile Strategy DT (n=12)
OA (n=15)
control (n=9)
5 Adding by place 2 2 Converting decimal to fraction 1 Adding up 1 2 Decomposing 1 Ignoring decimal pt., adding the
numbers, and placing decimal pt. 2
Traditional 1 2
4 Adding by place 1 1 1 Decomposing 1 Adding up 1 Traditional 1 1 1
3 Adding by place 3 3 2 Adding up 4 1 Decomposing 1 Traditional 2 3** 2
2 Adding by place 1 Decomposing 1 Traditional 2 4 Incorrect computation 1
1 Incorrect computation 1
Total response 21 21 11
*means the frequency of incorrect answers
As for the OA group, less variety of strategies were found compared to the
strategies of the OA group. Particularly, both number-sense strategies such as Adding
up, Decomposing, and rule-based strategies Adding by place, Ignoring decimal pt.,
adding the numbers, and placing decimal pt. (i.e., 58 + 26 = 84, then place the decimal
pt. to make 8.4), and the Traditional method were shown from the upper quintiles. Also,
Adding by the place was the most commonly used strategy for the OA group. The
Traditional method was frequently found for each quintile except for one interviewee
228
from the 1st quintile. This group showed generally higher accuracy except for two
interviewees who used on the Traditional method in the 3rd quintile.
In the control group, only one interviewee from 4th quintile provided two different
strategies such as Adding by place and Decomposing (i.e., 6 + 3 – 0.2 – 0.4). The
mental image of the Traditional method was frequently used for the interviewees in each
quintile. These results indicated that more interviewees from the middle and upper
quintiles flexibly chose their strategies for computing this item mentally. Less variety of
strategies, except the interviewees in the 5th quintile, were shown for the OA and the
control groups. The Traditional method was frequently observed in the OA group in all
quintiles and gave incorrect answers in the 3rd quintile.
Figure 28. Decimal frequency of strategies described for interview item: 100 × 0.05 ÷ 1000
This section describes the results of the medium difficulty decimal item 100 ×
0.05 ÷ 1000. Figure 28 shows the frequency of strategies regarding the decimal
multiplication and division. In the DT group, two interviewees (i.e., 1 from 3rd and 1 from
5th quintiles) used two different strategies, six interviewees from 2nd to 5th quintiles used
only one strategy, and four interviewees (i.e., 2 from 2nd and 2 from 4th quintiles)
provided zero strategies. Accordingly, in the OA group, five interviewees (i.e., 1 from 4th
12
1 1 1 1
3
2 21
2
3
122
1 1 1 11 1 1
4
0 1 2 0 1 2 0 1 2
DT (N=12) OA (N=15) CONTROL (N=9)
Nu
mb
er
of
Inte
rvie
we
es
Frequency of Strategies
100 × 0.05 ÷ 1000
1st quintile
2nd quintile
3rd quintile
4th quintile
5th quintile

229
and 4 from 5th quintiles) described it in two strategies, seven interviewees from 2nd to 5th
quintiles showed one strategy, and four interviewees (i.e., 1 from 1st, 1 from 2nd, and 2
from 3rd quintiles) failed to provide any strategies. The control group showed similar
patterns like the experimental groups. One 4th quintile interviewee provided two different
strategies, five interviewees (i.e., 3 from 2nd and 2 from 3rd quintiles) showed only one
strategy, and three interviewees (i.e., 1 from 2nd, 1 from 3rd, and 1from 4th quintiles) were
unable to show any strategies. In other words, the results indicated that more
interviewees in the upper quintiles employed more strategies and lower quintiles used
fewer strategies.
Table 83 shows the detailed strategies used on interviewees for computing the
item 100 × 0.05 ÷ 1000. In total, the researcher examined 13 responses for the DT
group, 20 responses for the OA group, and 10 responses for the control group.
Table 83
Strategies used on Mental Decimal Computation Item: 100 × 0.05 ÷ 1000
100 × 0.05 ÷ 1000
Quintile Strategy DT (n=12)
OA (n=15)
control (n=9)
5 Multiplying or dividing decimal number by multiples or powers of 10
3 11
4 Multiplying or dividing decimal number by multiples or powers of 10
2 1 2
IDK 1
3 Multiplying or dividing decimal number by multiples or powers of 10
3 3 2*
IDK 2 2 1
2 Multiplying or dividing decimal number by multiples or powers of 10
1 1 3
IDK 2 1 1
1 IDK 1
Total response 13 20 10
*means the frequency of incorrect answers
A lack of using multiple strategies was apparent in the response of interviewees.
The purpose of choosing this item was to examine if the interviewees were able to
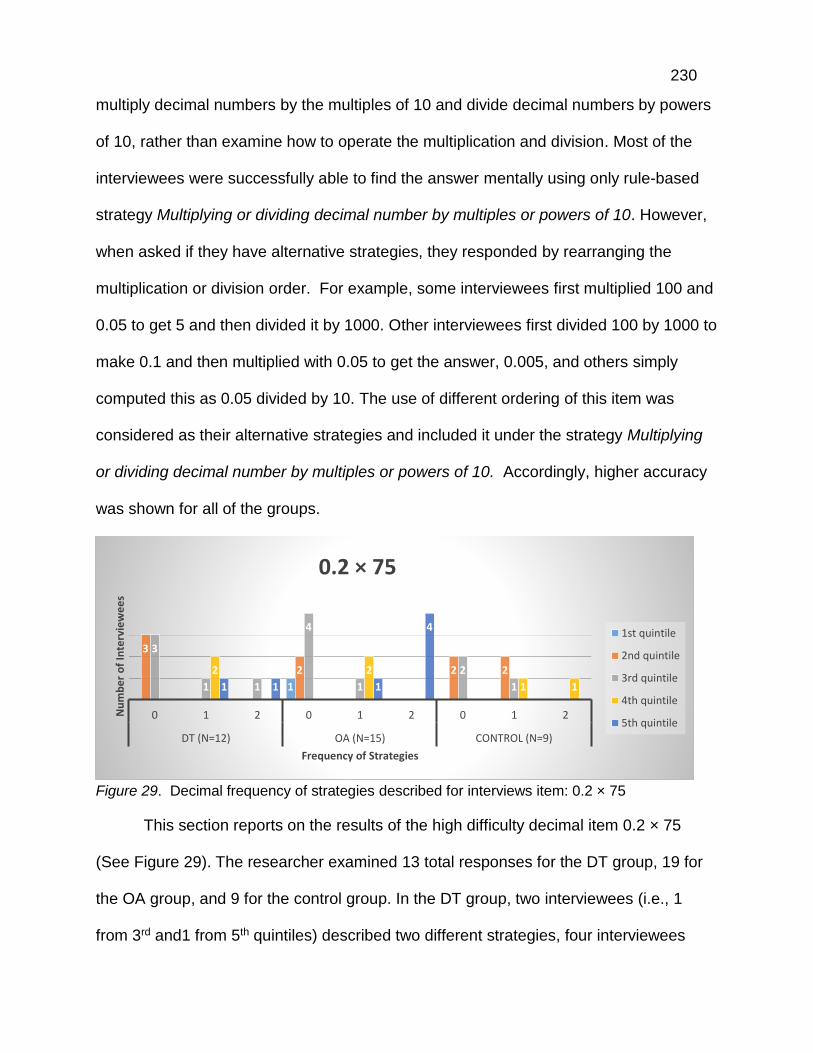
230
multiply decimal numbers by the multiples of 10 and divide decimal numbers by powers
of 10, rather than examine how to operate the multiplication and division. Most of the
interviewees were successfully able to find the answer mentally using only rule-based
strategy Multiplying or dividing decimal number by multiples or powers of 10. However,
when asked if they have alternative strategies, they responded by rearranging the
multiplication or division order. For example, some interviewees first multiplied 100 and
0.05 to get 5 and then divided it by 1000. Other interviewees first divided 100 by 1000 to
make 0.1 and then multiplied with 0.05 to get the answer, 0.005, and others simply
computed this as 0.05 divided by 10. The use of different ordering of this item was
considered as their alternative strategies and included it under the strategy Multiplying
or dividing decimal number by multiples or powers of 10. Accordingly, higher accuracy
was shown for all of the groups.
Figure 29. Decimal frequency of strategies described for interviews item: 0.2 × 75
This section reports on the results of the high difficulty decimal item 0.2 × 75
(See Figure 29). The researcher examined 13 total responses for the DT group, 19 for
the OA group, and 9 for the control group. In the DT group, two interviewees (i.e., 1
from 3rd and1 from 5th quintiles) described two different strategies, four interviewees
1
3
2 2 2
3
1 1
4
1
2
1
2 2
1 11 1 1
4
0 1 2 0 1 2 0 1 2
DT (N=12) OA (N=15) CONTROL (N=9)
Nu
mb
er
of
Inte
rvie
we
es
Frequency of Strategies
0.2 × 75
1st quintile
2nd quintile
3rd quintile
4th quintile
5th quintile
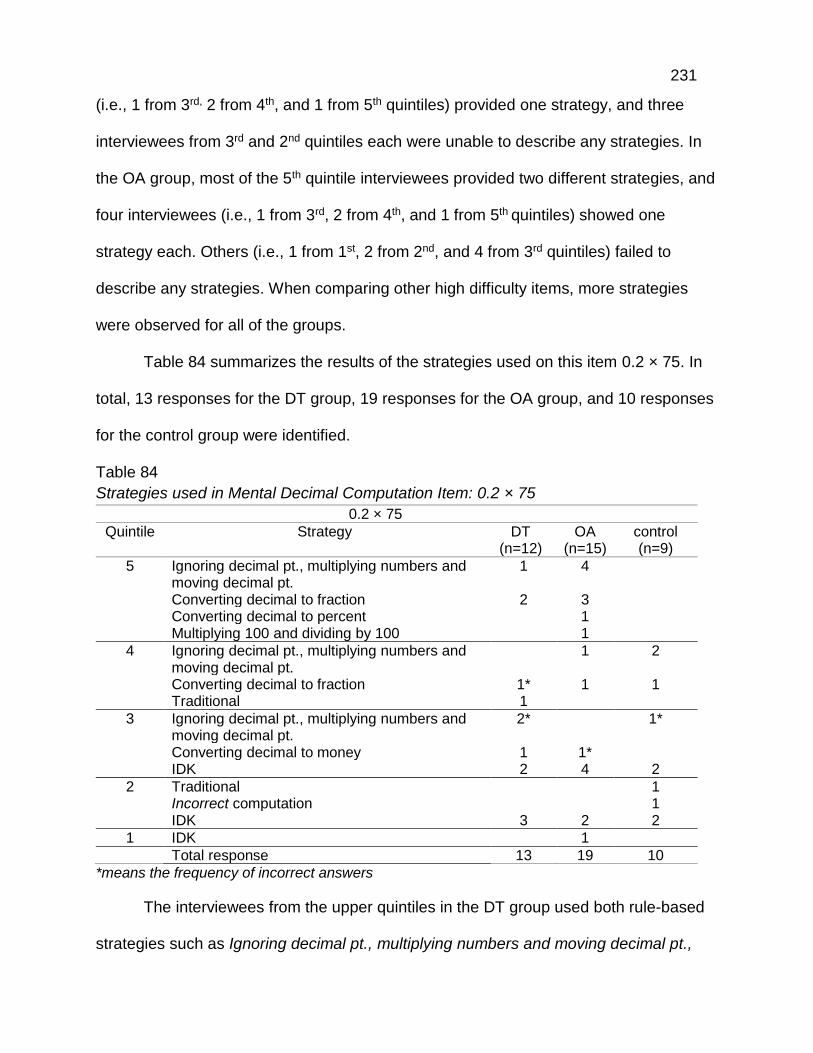
231
(i.e., 1 from 3rd, 2 from 4th, and 1 from 5th quintiles) provided one strategy, and three
interviewees from 3rd and 2nd quintiles each were unable to describe any strategies. In
the OA group, most of the 5th quintile interviewees provided two different strategies, and
four interviewees (i.e., 1 from 3rd, 2 from 4th, and 1 from 5th quintiles) showed one
strategy each. Others (i.e., 1 from 1st, 2 from 2nd, and 4 from 3rd quintiles) failed to
describe any strategies. When comparing other high difficulty items, more strategies
were observed for all of the groups.
Table 84 summarizes the results of the strategies used on this item 0.2 × 75. In
total, 13 responses for the DT group, 19 responses for the OA group, and 10 responses
for the control group were identified.
Table 84
Strategies used in Mental Decimal Computation Item: 0.2 × 75
0.2 × 75
Quintile Strategy DT (n=12)
OA (n=15)
control (n=9)
5 Ignoring decimal pt., multiplying numbers and moving decimal pt.
1 4
Converting decimal to fraction 2 3 Converting decimal to percent 1 Multiplying 100 and dividing by 100 1
4 Ignoring decimal pt., multiplying numbers and moving decimal pt.
1 2
Converting decimal to fraction 1* 1 1 Traditional 1
3 Ignoring decimal pt., multiplying numbers and moving decimal pt.
2* 1*
Converting decimal to money 1 1* IDK 2 4 2
2 Traditional 1 Incorrect computation 1 IDK 3 2 2
1 IDK 1
Total response 13 19 10
*means the frequency of incorrect answers
The interviewees from the upper quintiles in the DT group used both rule-based
strategies such as Ignoring decimal pt., multiplying numbers and moving decimal pt.,
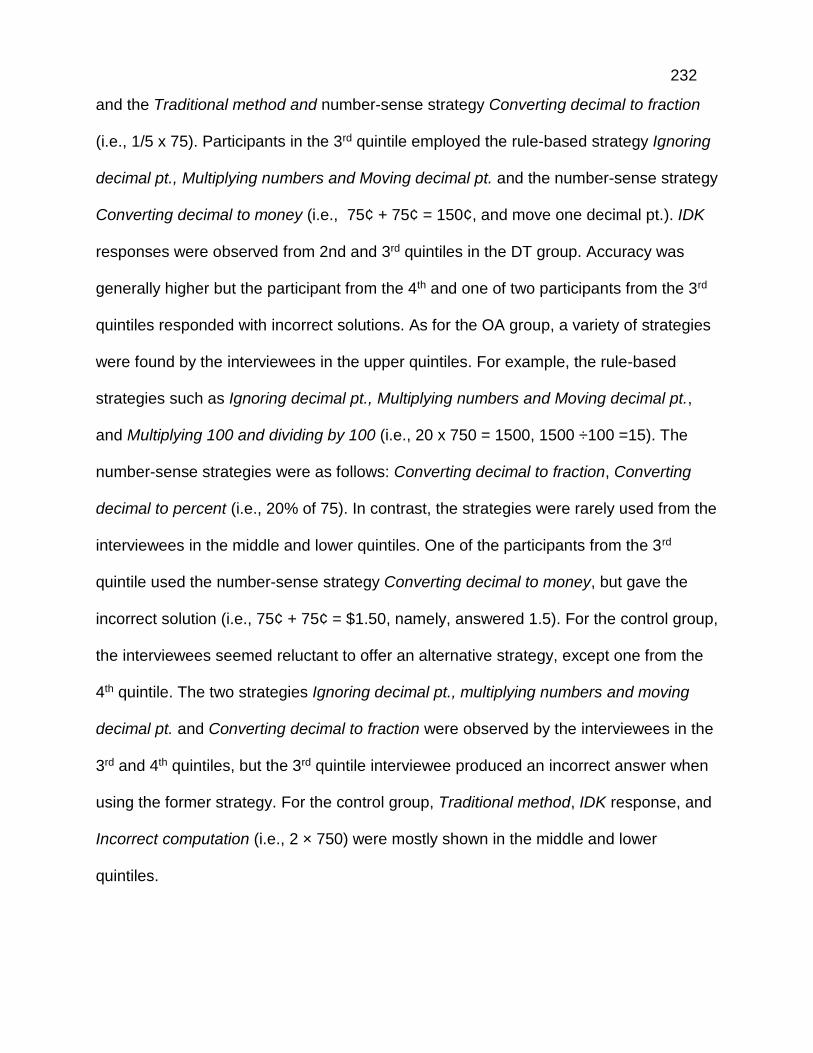
232
and the Traditional method and number-sense strategy Converting decimal to fraction
(i.e., 1/5 x 75). Participants in the 3rd quintile employed the rule-based strategy Ignoring
decimal pt., Multiplying numbers and Moving decimal pt. and the number-sense strategy
Converting decimal to money (i.e., 75¢ + 75¢ = 150¢, and move one decimal pt.). IDK
responses were observed from 2nd and 3rd quintiles in the DT group. Accuracy was
generally higher but the participant from the 4th and one of two participants from the 3rd
quintiles responded with incorrect solutions. As for the OA group, a variety of strategies
were found by the interviewees in the upper quintiles. For example, the rule-based
strategies such as Ignoring decimal pt., Multiplying numbers and Moving decimal pt.,
and Multiplying 100 and dividing by 100 (i.e., 20 x 750 = 1500, 1500 ÷100 =15). The
number-sense strategies were as follows: Converting decimal to fraction, Converting
decimal to percent (i.e., 20% of 75). In contrast, the strategies were rarely used from the
interviewees in the middle and lower quintiles. One of the participants from the 3rd
quintile used the number-sense strategy Converting decimal to money, but gave the
incorrect solution (i.e., 75¢ + 75¢ = $1.50, namely, answered 1.5). For the control group,
the interviewees seemed reluctant to offer an alternative strategy, except one from the
4th quintile. The two strategies Ignoring decimal pt., multiplying numbers and moving
decimal pt. and Converting decimal to fraction were observed by the interviewees in the
3rd and 4th quintiles, but the 3rd quintile interviewee produced an incorrect answer when
using the former strategy. For the control group, Traditional method, IDK response, and
Incorrect computation (i.e., 2 × 750) were mostly shown in the middle and lower
quintiles.

233
From this table, it can be seen that more strategies were observed in the upper
quintiles and more IDK responses and Incorrect computation were observed in the
lower quintiles. For the interviewees in this study, a discrepancy between the scores of
MCT and the results of the interviews was shown. In other words, participants showed a
very low correct percentage in the MCT but showed more correct responses with
strategies during the post-interviews.
Lastly, this section describes the results of the percent operation. Percent
frequency of strategies for each group is summarized in Figure 30.
Figure 30. Percent frequency of strategies described for interview item: 1% of 175
In the DT group, three interviewees (i.e., 1 from 3rd, and 2 from 5th quintiles)
computed this using two different strategies. Four interviewees (i.e., 1 from 2nd, 1 from
3rd, and 2 from 4th quintiles) provided one strategy for each item. Others (i.e., 2 from 2nd
and 3 from 3rd quintiles) were unable to show any strategies. The majority of the
interviewees from the 5th quintile described two different strategies and six interviewees
(i.e., 3 from 3rd, 2 from 4th, and 1 from 5th quintiles) showed one strategy. Others (i.e., 1
from 1st, 2 from 2nd, and 2 from 3rd quintiles) failed to show any strategies. Some
interviewees (i.e., 2 from 2nd, 1 from 3rd, and 2 from 4th quintiles) in the control group
1
2
1
2 2 2
3
1 1
2
3
2
1
2 2 22
1
4
0 1 2 0 1 2 0 1 2
DT (N=12) OA (N=15) CONTROL (N=9)
Nu
mb
er o
f In
terv
iew
ees
Frequency of Strategies
1% of 175
1st quintile
2nd quintile
3rd quintile
4th quintile
5th quintile
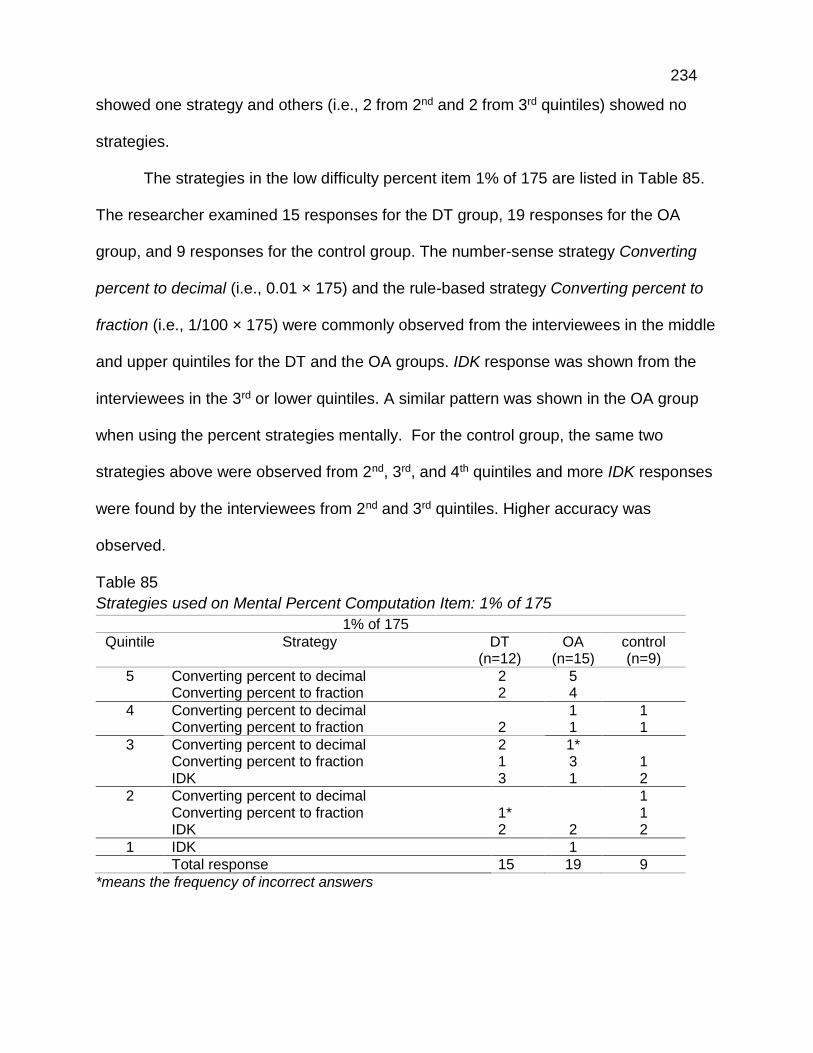
234
showed one strategy and others (i.e., 2 from 2nd and 2 from 3rd quintiles) showed no
strategies.
The strategies in the low difficulty percent item 1% of 175 are listed in Table 85.
The researcher examined 15 responses for the DT group, 19 responses for the OA
group, and 9 responses for the control group. The number-sense strategy Converting
percent to decimal (i.e., 0.01 × 175) and the rule-based strategy Converting percent to
fraction (i.e., 1/100 × 175) were commonly observed from the interviewees in the middle
and upper quintiles for the DT and the OA groups. IDK response was shown from the
interviewees in the 3rd or lower quintiles. A similar pattern was shown in the OA group
when using the percent strategies mentally. For the control group, the same two
strategies above were observed from 2nd, 3rd, and 4th quintiles and more IDK responses
were found by the interviewees from 2nd and 3rd quintiles. Higher accuracy was
observed.
Table 85
Strategies used on Mental Percent Computation Item: 1% of 175
1% of 175
Quintile Strategy DT (n=12)
OA (n=15)
control (n=9)
5 Converting percent to decimal 2 5 Converting percent to fraction 2 4
4 Converting percent to decimal 1 1 Converting percent to fraction 2 1 1
3 Converting percent to decimal 2 1* Converting percent to fraction 1 3 1 IDK 3 1 2
2 Converting percent to decimal 1 Converting percent to fraction 1* 1 IDK 2 2 2
1 IDK 1
Total response 15 19 9
*means the frequency of incorrect answers

235
Figure 31. Percent frequency of strategies described for interview item: 75% × 120
In the medium difficulty percent item 75% × 120, as shown in Figure 31, one
interviewee from the 5th quintile in the DT group showed two different strategies, six
interviewees (i.e., 3 from 3rd, 2 from 4th, and1 from 5th quintiles) provided only one
strategy, and all of the 2nd quintile interviewees and two interviewees from 3rd quintile
did not respond. In the OA group, four 5th quintile interviewees successfully provided
two strategies, each interviewee from 3rd, 4th, and 5th quintiles described one strategy,
and the rest of them (i.e., 1 from 1st, 2 from 2nd, 4 from 3rd, and1 from 4th) failed to
provide any strategies. For the control group, no one provided two different strategies.
Three interviewees (i.e., 1 from 2nd and 2 from 4th quintiles) used one strategy. Six
interviewees (i.e., 3 from 3rd and 2nd quintiles each) were not able to offer any
strategies.
The results of strategies in the medium difficulty percent item 75% × 120 are
summarized in Table 86. In total, 13 responses for the DT group, 19 responses for the
OA group, and 9 responses for the control group were identified. The strategies used by
the interviewees in the upper quintiles for the DT group were as follows: Converting
percent to fraction (i.e., 3/4 x 120 or half of 120 equals to 60, half of 60 is 30 so the sum
1
3
2
3
12
3
4
1
3
21 1
21 1 1
4
0 1 2 0 1 2 0 1 2
DT (N=12) OA (N=15) CONTROL (N=9)Nu
mb
er
of
Inte
vie
we
es
Frequency of Strategies
75% × 120
1st quintile
2nd quintile
3rd quintile
4th quintile
5th quintile

236
of 60 and 30 equals 90), Using multiplication, then Moving two decimal pt. to the left
(i.e., 75 x 120 = 9000 then move two decimal pts to the left to produce 90), and
Converting percent to decimal (i.e., 0.75 × 100 =75, 0.75 × 20 = 15, the sum of 75 and
15 is 90). The rule-based strategy Converting percent to fraction and the number-sense
strategy Converting percent to decimal were also found in the 3rd quintile. The IDK
response was mostly observed in the 2nd and 3rd quintiles.
Table 86
Strategies used on Mental Percent Computation Item: 75% × 120
75% × 120
Quintile Strategy DT (n=12)
OA (n=15)
control (n=9)
5 Converting percent to fraction 2 5 Converting percent to fraction and reducing 1 Using multiplication, then moving two decimal pts. 2 2 Using multiples of 30 1
4 Converting percent to fraction 1 2 Converting percent to decimal 1 IDK 1
3 Converting percent to fraction 2 1 Converting percent to decimal 1 IDK 2 4 3
2 Converting percent to fraction 1 IDK 3 2 3
1 IDK 1
Total response 13 19 9
In the OA group, the strategy Converting percent to fraction was frequently used
for the interviewees in all quintiles. Other rule-based strategies such as Converting
percent to fraction and reducing (i.e., 75
100 × 120 = 75 × 1.2 = 90), Using multiplication,
then Moving two decimal pts., and Using multiples of 30 (i.e., 30, 60, 90, 120 – 90 is the
¾ of 120) were also found in the 5th quintile. The rest of the participants responded with
IDK.
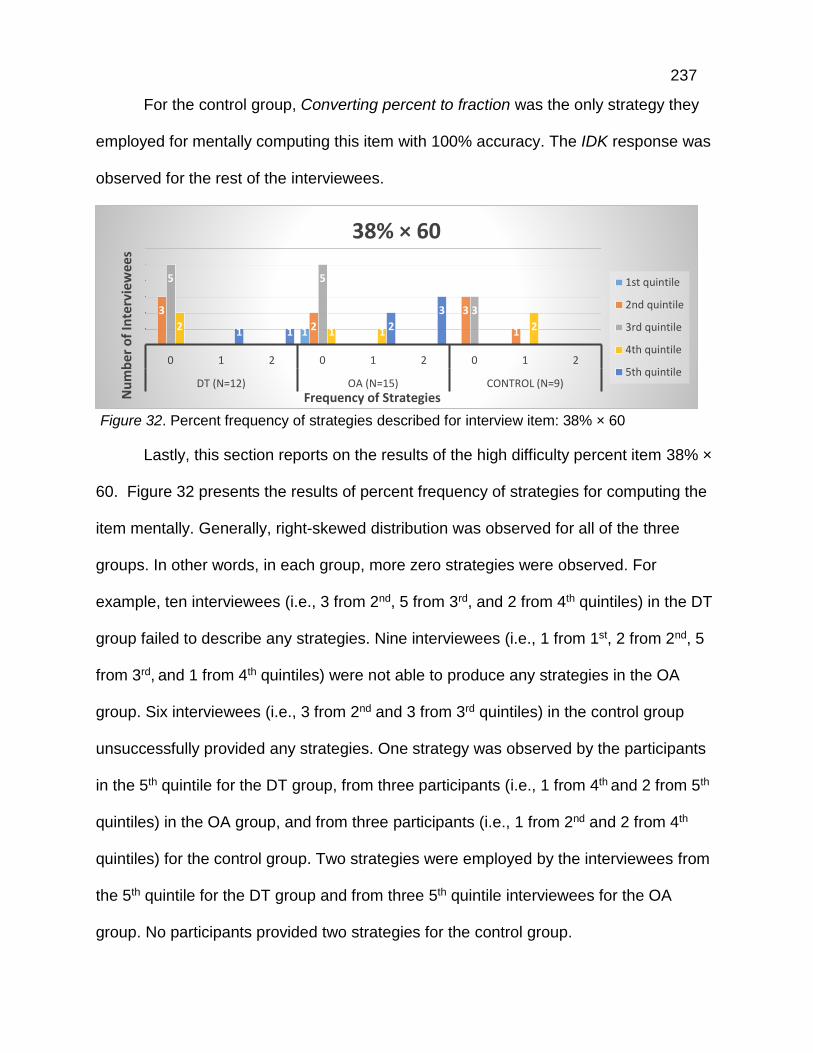
237
For the control group, Converting percent to fraction was the only strategy they
employed for mentally computing this item with 100% accuracy. The IDK response was
observed for the rest of the interviewees.
Figure 32. Percent frequency of strategies described for interview item: 38% × 60
Lastly, this section reports on the results of the high difficulty percent item 38% ×
60. Figure 32 presents the results of percent frequency of strategies for computing the
item mentally. Generally, right-skewed distribution was observed for all of the three
groups. In other words, in each group, more zero strategies were observed. For
example, ten interviewees (i.e., 3 from 2nd, 5 from 3rd, and 2 from 4th quintiles) in the DT
group failed to describe any strategies. Nine interviewees (i.e., 1 from 1st, 2 from 2nd, 5
from 3rd, and 1 from 4th quintiles) were not able to produce any strategies in the OA
group. Six interviewees (i.e., 3 from 2nd and 3 from 3rd quintiles) in the control group
unsuccessfully provided any strategies. One strategy was observed by the participants
in the 5th quintile for the DT group, from three participants (i.e., 1 from 4th and 2 from 5th
quintiles) in the OA group, and from three participants (i.e., 1 from 2nd and 2 from 4th
quintiles) for the control group. Two strategies were employed by the interviewees from
the 5th quintile for the DT group and from three 5th quintile interviewees for the OA
group. No participants provided two strategies for the control group.
1
3
2
3
1
5 5
3
2 1 1 21 1 2
3
0 1 2 0 1 2 0 1 2
DT (N=12) OA (N=15) CONTROL (N=9)
Nu
mb
er o
f In
terv
iew
ees
Frequency of Strategies
38% × 60
1st quintile
2nd quintile
3rd quintile
4th quintile
5th quintile

238
Table 87 summarizes the use of percent strategies used on the high difficulty
item 38% × 60. The researcher examined the total responses: 13 for the DT group, 18
for the OA group, and 9 for the control group.
A wide range of strategies can be seen by the interviewees from the 5th quintile
for the DT group and the OA group. Then, most of the interviewees in the 4th and lower
quintiles gave IDK responses (77%). Both rule-based strategies such as Converting
percent to fraction and Multiplying whole numbers and moving decimal pts., and
number-sense strategy Using composition of 10% or 1% (i.e., 3 (10%) × 60 =18, 8 (1%)
× 60= 4.8, so the sum of those numbers should be 22.8) were shown by the
interviewees from the 5th quintile for the DT group.
Table 87
Strategies used on Mental Percent Computation Item: 38% × 60
38% × 60
Quintile Strategy DT (n=12)
OA (n=15)
control (n=9)
5 Converting percent to fraction 1 1 Multiplying whole numbers and moving decimal pts. 1 4 Using composition of 10% or 1% 1 1 Using known fact 2
4 Multiplying whole numbers and moving decimal pts. 1* 1 Converting percent to fraction 1 IDK 2 1
3 IDK 5 5 3
2 Converting percent to decimal 1* IDK 3 2 3
1 IDK 1
Total response 13 18 9
*means the frequency of incorrect answers
Besides these strategies, one more number-sense strategy Using known fact
(i.e., (40% - 2%) × 60 = 24 -1.2 = 22.18 or (30% + 8%) × 60 = 18 + 4.8 = 22.8) was
found in the OA group. Then, IDK responses (50%) were observed from 1st to 4th
quintiles. The strategies Multiplying whole numbers and moving decimal pts.,

239
Converting percent to fraction, and Converting percent to decimal were observed in the
interviewees from the 2nd and 4th quintiles in the control group. The interviewee who
employed the strategy Converting percent to decimal gave incorrect solutions. Higher
IDK responses (67%) were presented in the control group.
240
CHAPTER 5
CONCLUSION
This chapter provides a summary and discussion of the study with respect to the
five research questions and its findings. Then, limitations of the study, other implications
for mathematics education, and recommendations for future research are discussed.
Summary and Discussion
The purpose of the current study was to explore attitudes and beliefs of
preservice teachers (PTS) towards mathematics, mental and written computation, and
mental computation anxiety; to investigate the use of different mental computation
strategies using different instructional approaches among the three different groups
(e.g., DT, OA, and Control groups); and to identify how the use of PTS’ mental
computation strategies affects their flexibility regarding mental computation.
Research Question 1
In the first research question, the researcher asked to what extent PTS believe
that mathematics attitudes, mental and written computation, and anxiety changes
regarding mental computation are important. In the PTS’ attitudes towards mathematics,
38 statements were included within clusters of 3 parts: PTS’ positivity towards learning
mathematics, their previous mathematics teachers’ behavior, and instruction.
As indicated earlier, prior studies that have noted the importance of positive
attitudes emphasized that preservice and inservice teachers’ positive attitudes and
beliefs have an impact on their teaching practice and students’ mathematics learning
and performance (Jong & Hodges, 2015; Lui & Bonner, 2016; Vinson, 2001; White et
al., 2006). The results of this study indicated that PTS, in general, showed positive

241
attitudes towards learning mathematics and the importance of learning mathematics;
however, in reality, about half of them did not want to spend time learning or studying
mathematics. A majority of PTS, both K-8 and high school, showed relatively positive
attitudes and beliefs towards their previous mathematics teachers’ behavior and their
previous mathematics teachers’ instructional methods. It is interesting to note that both
PTS’ middle and high school mathematics teachers would likely use a variety of
different methods related to learning the concept of mathematics topics and accepted
their different strategies and valued creative ideas. These results are in agreement with
Lynch and Star’s (2014) findings which showed that generally, the teachers in the
middle and high school are likely have positive views towards teaching with multiple
strategies and the desire to incorporate them into their teaching.
In terms of PTS’ attitudes towards mental and written computation, two clusters
of statements (i.e., 30) were provided: PTS’ beliefs and their perception of instruction. In
terms of PTS’ beliefs about mental and written computation, most of the PTS reported
that they had learned mental computation strategies during their school years. They
were aware of the fact that learning mental computation is more useful in real life
situations and provides benefits in their mathematics learning. However, they do not feel
comfortable and safe when using mental computation because of their lack of
confidence and teaching abilities. These results are consistent with those of Hartnett
(2007) who pointed out that teachers’ lack of mental computation knowledge has led to
a lack of confidence and teaching skills. This may be due to the fact that they have not
spent more time in school doing mental computation although they had an opportunity
to learn mental computation strategies in their school years. With respect to their

242
perception of instruction towards written and mental computation, although PTS believe
that both written and mental computation can develop their problem-solving skills and
their natural thinking ability, in reality, they placed more emphasis on written
computation, indicating that written computation should be introduced first and can build
students’ mathematics procedural knowledge and understanding. It can, therefore, be
assumed that the PTS in this study have no or little confidence using mental
computation knowledge and skills. Although a majority of participants reported that both
written and mental computation should be taught during the school years, if they do not
devote time to mental computation, they will use written computation more while
teaching their students.
Lastly, the results of PTS’ responses to mental computation anxiety found that
although they are interested in learning mental computation and have some confidence
in solving problems mentally, they showed slightly higher anxiety levels when using
mental computation rather than using written. In line with this, Swan and Sparrow
(2001) suggested that teaching mental computation specific strategies may reduce
flexibility in thinking but may not cause as much anxiety rather than the methods they
understand.
To determine whether there is any statistically significant difference among the
three groups for the three independent variables in pre-Mathematics Attitude Survey
(MAS), a one-way analysis of variance (ANOVA) was used. Results of the pre-MAS
mean scores with respect to all three variables showed that there was no significant
difference between the experimental and control groups.
Next, to identify if there were any changes in the PTS’ attitudes towards their

243
perception of mental and written computation and mental computation anxiety after
intervention, a post-MAS was provided for the two experimental groups. Then, the
results of their pre-and post-MAS analysis were compared. As for the mean changes in
PTS’ beliefs towards mental and written computation, there were negative and positive
changes. The positive changes mostly related to written computation, while the negative
changes were mostly connected to mental computation. Similar results of the pre-and
post-MAS on instruction regarding mental and written computation were found. The
positive changes were mostly related to written computation, while negative changes
were mostly connected to mental computation. These findings were unexpected and the
researcher found these changes to be somewhat counterintuitive. It seemed the PTS
still have difficulty in computing and learning methods of mental computation, meaning
they would rather focus more on learning written computation probably because of their
lack of their mental computation knowledge and skills and the difficulty of learning
mental computation strategies.
Mean scores of PTS’ anxiety levels changed regarding mental computation. After
intervention, PTS in both experimental groups expressed more anxiety towards mental
computation. Although a slight positive change was shown in the use of a calculator,
they still felt more anxiety when solving timed mental problems and horizontally
presented problems. A possible explanation for this might be that a majority of the PTS
in our study had already engrained previous learning experiences that focused more on
the rote memorization of basic facts and the development of procedures for completing
written algorithms. It is not easy for them to change their mathematics learning in
innovative ways.

244
Research Question 2
In the second research question, the researcher asked if there is a significant
correlation between PTS’ mental computation performance and their attitudes towards
mathematics, written and mental computation, and mental computation anxiety. The
Pearson correlation coefficient (r) was calculated to measure the degree of relationship
between the three different variables and their MCT performance. To do this, the
relationship between PTS’ pre-MCT performance and each variable (i.e., attitude
towards mental computation, mental and written computation, and mental computation
anxiety) was measured and then the relationship between post-MCT performance and
each variable (i.e., attitude towards mental and written computation and mental
computation anxiety) were calculated. The results of the analysis between pre-MCT
performance and attitudes towards mathematics revealed no significant correlation
between pre-MCT performance and the three variables. Also, there were no significant
correlations between PTS’ post-MCT performance and their attitudes towards mental
and written computation and mental computation anxiety.
The researcher hypothesis that PTS who had higher achievement in MCT were
more likely to have positive attitudes towards mental computations. However, the
correlation showed no significant correlation between pre-and post-MCT scores and
each variable. This may be due to the fact that the PTS had negative attitudes towards
mental computations after intervention. Higher achieved PTS were still having a
difficulty in solving problems mentally. The results of surveys found that although they
were exposed to mental computation when they were in school, but they had not spent
additional time learning it.
245
Research Question 3
Regarding the third research question, the differences in mental computation
performance between the experimental groups and the control group before and after
instruction were examined. A one-way analysis of covariance (ANCOVA) was
conducted to identify if there were significant differences in mental computation
performance among the three groups with different instruction (e.g., DT, OA, and
Control). The results showed that there was a statistically significant difference in post-
MCT scores between the different instructional groups when adjusted for pre-MCT
scores. In particular, PTS in the OA group performed better than PTS in the DT group.
As predicted, PTS in the control group performed worst. The result of multiple
comparisons of the different instructional types revealed there was a significant
difference between the DT group and the control group, and between the OA group and
the control group. However, the difference between the DT group and OA group was
not significant with respect to post-MCT scores. In other words, it was found that the
class using the open-approach performed the best but the difference between the DT
and OA groups were not significant. The findings support previous research (Reys et al.
1995; McIntosh et al., 1995) in that if the direct teaching is involved in students’
conceptual understanding along with procedural skills, this approach can develop
students’ mental computation skills. In this study, a variety of different strategies were
involved and demonstrated to develop students’ understanding in the DT group. This
may increase PTS’ conceptual understanding.
Then, a one-way ANCOVA was conducted on post-MCT performance to
examine for what operation(s) is (are) a marked difference for each group. There were

246
significant differences between pre-and post-MCT performance among the three groups
in solving multiplication, fraction, and decimal operation problems. In particular, the
pairwise comparisons revealed that there were significant differences between the DT
group and the control group and between the OA group and the control group when
solving multiplication and decimal operations. The one-way ANCOVA for fraction
operation was also significant and the pairwise comparison revealed that there was a
significant difference between the OA group and the control group. The pairwise
comparisons revealed that there was no significant difference between the DT and OA
groups.
During the last several decades, numerous studies have documented students’
lack of understanding of fraction (e.g., Ball, 1990; Ma, 1999; Rizvi & Lawson, 2007) and
decimal (e.g., Stacey et al., 2001; Turnuklu & Yesildere, 2007; Ubuz & Yayan, 2010)
operations. Since understanding of decimal and fraction operations are so important, in
particular, rational numbers (i.e., fraction and decimal) represent the two formidable
obstacles for students learning of algebra (Hoffer, Venkataraman, Hedberg, & Shagle,
2007). It can thus be suggested that students’ mental computation performance
involving fraction and decimal operations can be achieved using these two different
instructional approaches.
With respect to the whole number operations, this finding is contrary to previous
studies (Kilpatrick et al., 2001; Siegler & Shipley, 1995; Parmar, 2003) which suggest
that students are having the most difficulty in computation in division algorithms. In this
study, students’ mental computational skills in multiplication were considerably low on
their pre-MCT. This result may be explained by the fact that a variety of alternative
247
strategies used in the multiplication operation helped PTS develop their understanding.
These results must be interpreted with caution because the results may be different
depending on the participants’ different educational and performance backgrounds.
Next, PTS’ pre-and post-MCT performance for each operation was compared
descriptively for the three groups. Large improvement and the most difficult items were
analyzed for each operation. For the five addition items, the participants in both DT and
OA groups performed better in the post-MCT. No difference was shown in the control
group. All groups correctly computed most of the addition items with higher (at least
75%) accuracy. The addition items that were most difficult and improved were made: 39
+ 399 + 3999 (14%, 13%, and 45%) in the pre-MCT and 49 + 499 + 4999 (67%, 80%,
and 57%) in the post-MCT for the DT, OA, and control groups.
In computing the five subtraction items, the participants from both DT and OA
groups also performed better in the post-MCT, but no difference was shown in the
control group. The most improved items were shown in solving two-digit subtraction
items (e.g., 85 – 38 in the pre-MCT and 95 – 37 in the post-MCT). The three digit
subtraction items involving 99 (e.g., 607- 299 in the pre-MCT and 807 – 399 in the post-
MCT) were identified as the most difficult, but their percentage of correct responses for
the DT and OA group improved from 36% and 44% to 58% and 67%, respectively in the
post-MCT. On the other hand, the percentage of correct responses in this item for the
control group decreased from 70% to 21%.
Of the nine multiplication items, all of the PTS for both groups performed much
better in the post-MCT, but the control group showed unsteady results. Improvements
were observed when computing two-digit by two-digit multiplication items (e.g., 18 × 16

248
(0% and 6%) in the pre-MCT and 14 × 16 (42% and 40%) in the post-MCT) as well as
two-digit by two-digit multiplication items involving 99 (e.g., 99 × 13 (7% and 13%) in the
pre-MCT and 99 × 17 (50% and 40%) in the post-MCT). The most difficult items were
found to be 36 × 48 (0% and 0%) and 25 × 96 ×125 (0% and 0%) in the pre-MCT and
36 × 24 (17% and 27%) and 25 × 64 ×125 (8% and 7%) on the post-MCT. A possible
explanation for this might be that demonstrating and comparing different strategies
helped the participants to better compute these items. These results are consistent with
data obtained in the post-interviews. During interviews, several interviewees stated that
they improved a lot in computing multiplication items but they just needed more time to
compute large numbers. In addition, in general, much research (Heirdsfield, 2002, 2003;
Heirdsfield & Cooper, 1996, 2004) found that students in elementary schools find it
difficult to compute two-digit by two-digit multiplication items using the wholistic
compensation strategy; however, the PTS in this study already understood that this
strategy was very efficient and useful to confidently compute two-digit by two-digit
multiplication items involving 9 or 99.
When computing the seven division items mentally, a better performance was
also shown in the post-MCT. In the percentages of correct responses, large
improvement was shown in the items (e.g., 10 × 25
10 × 0 , 44 × 22 ÷ 88, and 222 × 999 ÷ 333 in
the pre-MCT and 25 ×4 ×0
4 , 33 × 22 ÷ 66, and 222 × 888 ÷ 444 in the post-MCT) for all
three groups. The most difficult item was found to be three-digit numbers divided by two
digit numbers (e.g., 342 ÷ 18 (7% and 6%) in the pre-MCT and 468 ÷ 18 (17% and
47%) in the post-MCT and significant improvement was shown in the OA group. One
unanticipated finding was that the participants in all of the groups was considerably

249
improved in computing the items 10 ×25
10 × 0 in the pre-MCT (0%, 25%, and 10%) and
25 ×4 ×0
4
(67%, 73%, and 79%) in the post-MCT. It could be argued that the positive results were
due to the fact that they thought that “zero divided by any number should be zero” but
did not understand “any number divided by zero is undefined.” There might be different
results if the item was presented in a different order (i.e., 25 ×4 ×0
4 in the pre-MCT,
10 ×25
10 × 0
in the post-MCT).
Two integer items were provided. The percentages of correct responses in
integer addition and subtraction items were improved for all groups, however, in the
integer multiplication and division item, only the OA group showed improvement.
For the fraction mental computation items for both groups, large improvement
was shown in four out of eight items such as 2½ + 1¾, 3¼ – 2½, 3/2 × 12, and 8 ÷ 1/3
in the pre-MCT and 4½ + 1¾, 5¼ – 2 ½ , 3/2 × 18, 12 ÷ 1/3 in the post-MCT. The other
items have shown mixed results. For example, in the DT group, the percentages of
correct responses for the fraction addition and subtraction items like ½ + ¾ and ¾ - ½
in the pre-MCT and 3/5 + 1/2 and 6/8 – 1/2 in the post-MCT decreased, while that of the
OA group increased. On the other hand, in the fraction multiplication items (e.g., ¼ × 3/5
and 1/2 × 4 1/3 in the pre-MCT and 1/5 × 4/7 and 1/3 × 4 1/5 in the post-MCT), the
percentages of correct responses increased for the DT group and decreased for the OA
group. The most difficult fraction items were found in fraction multiplication with a mixed
fraction such as 1/2 × 4 1/3 in the pre-MCT and 1/3 × 4 1/5 in the post-MCT. An
interesting finding was that participants’ performance on fraction operations improved in
items involving basic fraction and decimal equivalences (e.g., ½ = 0.5, ¼ = 0.25, ¾ =
0.75, etc.). It can thus be suggested that PTS who used this strategy successfully have

250
an ability to use the efficient strategies using numerical relationships (e.g., converting
between different representations) (Carbalho & Da Ponte, 2015).
In computing the ten decimal items, PTS for the experimental groups performed
much better from pre-and post-MCT. A marked improvement was shown in the items
involving multiplying 10 (e.g., 0.57 × 10 and 0.37 × 10, respectively), involving
multiplication and division (e.g., 10 × 0.2 ÷ 1000 and 100 × 0.05 ÷ 1000), and involving
addition and subtraction (e.g., 4.7 + 5.6 – 1.7 and 3.7 + 2.6 – 1.7– 1.3) in the pre-and
post-MCT. The difficult items were found in the decimal items involving multiplication
and division such as 10 × 0.2 ÷ 1000 in the pre-MCT and 100 × 0.05 ÷ 1000 in the post-
MCT, although a large improvement was shown from pre-and post-MCT. These results
provide further support for the importance of understanding the equivalent decimal and
fraction numbers. A large improvement was shown but the only exception was observed
in the items 0.5 × 48 in the pre-MCT and 0.2 × 75 in the post-MCT. Like decimal
operations, this may be partly explained that the decimal number 0.5 is the same as the
fraction ½, but some participants may not recognize that 0.2 is the same as 1/5.
There were six percent items in the measures. The participants performed better
on two items; 24% × 80 and 40% + 1/5 – 0.25 in the pre-MCT and 36% × 80 and 50% +
3/4 + 0.25 in the post-MCT. Large differences were observed for both the DT and OA
groups when computing the percent item involving fraction and decimal such as 40% +
1/5 – 0.25 (14%, 13%, and 20% correct) in the pre-MCT and 50% + 3/4 + 0.25 (67%,
80%, and 43%) in the post-MCT. Percent items was the most difficult operation for this
study. PTS performed worst in the three items: 24% × 80, 28% of 50, and 49% × 320 in
the pre-MCT and 36% × 80, 38% of 60, and 59% × 450 in the post-MCT.

251
With respect to rational number operations in the pre-and post- MCT, PTS in this
study performed best in calculating decimal operations mentally, followed by fraction
operations, and worst in computing percent operations. This outcome is contrary to that
of Callingham and Watson (2004) who found that given in the context of a timed mental
computation test, tasks with fraction operations are easier than that of decimal and
percent operations. A note of caution is due here since their subjects were students in
Grades 3 to 10.
Lastly, to examine the effect of mode of presentation on the whole numbers
between pre-and post-MCT, a paired-sample t-test indicated that the difference
between mode of presentation mean scores using pre-MCT was significant (e.g., t(50)
=0.036), while the mean scores for their post-MCT was not significant (e.g., t(50) =
0.088) at the alpha level of 0.05. In this regard, these results are in agreement with
Mardjetko and Macpherson’s (2007) findings which showed the mode of presentation
significantly affects both student performance on mental computation and the choice of
mental computation strategy. This study showed that in the pre-MCT, they were more
likely to solve problems vertically in their head, however, in the post-MCT, they tried to
compute problems horizontally.
Research Question 4
The fourth research question asked what the differences are in the use of mental
computation strategies between the two experimental groups. To compare the
differences in the use of mental computation strategies between the DT and OA groups,
ten computation problems for each operation were administered after each lesson. For
the DT group, various mental computation strategies for each operation were directly
252
taught. On the other hand, the OA group was highly encouraged to create their own
strategies using an open-approach. No explicit strategies were provided for this group.
In mental computation addition strategies, both groups used mental strategies in a
similar way but the participants in the DT group used more different strategies and
showed higher percentages of total correct items (e.g., 8 out of 10 items) than the OA
group. However, more frequent use of the Traditional method of addition was observed
in the DT group. Regarding the use of strategies, the similarities for both groups were
shown when computing the following items: 16 + 9, Double 26, 68 + 32, and 165 + 99.
In adding the number involving 9 or 99 mentally, both groups were more likely to employ
the strategy Compensation. The Double number strategy was involved when computing
Double 26. When adding two-digit numbers (e.g., 68 + 32), more than half of the
participants for both groups used the strategy Adding by Place.
In contrast, the major differences were shown in the following items: 20 + 70, 25
+ 99, 189 + 266 + 411, and 65 + 66 + 35 + 34 + 7. Surprisingly, when adding two-digit
numbers involving 99, about half of the participants (46%) in the DT group used the
Compensation strategy, while the OA group used the strategy Making 100s. In adding
the three-digit numbers such as 189 + 266 + 411, the DT group computed it using the
strategy Making 10s and 100s (e.g., 189 + 11 + 400 + 266), while the OA group used
the strategy Reordering. When adding several numbers together mentally such as 65 +
66 + 35 + 34 + 7, half of the DT group used the strategy Adding by place, while the OA
group used the strategy Reordering.
The results of this study indicate that the DT group used more strategies than
that of the OA group. The most interesting finding was that Compensation was the most
253
commonly used strategy used by the participants for both groups when adding the
numbers involving 9 or 99. In line with this, Lemonidis (2016) points out that
Compensation is not an easily applicable strategy for students when adding the
numbers mentally. It may be that the participants for this study benefitted from long
years of basic operation schooling.
When computing subtraction items mentally, the two groups used various
strategies in a similar way. However, the participants’ in the DT group showed a
relatively higher percentage of total correct answers (i.e., 8 out of 10 items) than its OA
counterpart. More frequent use of the Traditional method was found in the DT group. In
the use of strategies, the commonly used strategy for both groups was the same in the
following items: 36 – 9, 61 – 30, 265 – 99, 90 – 27, and 27 – 15 + 30 – 7. Specifically, in
computing the items involving 9 or 99 such as 36 – 9 and 265 – 99, Compensation was
the most frequently used strategy for both groups. In the items involving near double
number like 61 – 30 and involving 7 like 90 – 27, Bridging a multiple of 10 (e.g., 90 – 20
– 7) was the strategy often employed. In computing the item 27 – 15 + 30 – 7,
Reordering is the only strategy the participants used.
The major differences were shown in the following items: 48 – 24, 123 – 45, and
100 – 58. In computing the item 48 – 24, Double number (e.g., 24 + 24 = 48) was the
most common strategy for the DT group, while Bridging a multiple of 10 (e.g., 48 – 20 –
4) was frequently used for the OA group. When computing 123 – 45 mentally, the
commonly used strategy for the DT group was Subtracting by place, while the OA group
used the strategy Bridging a multiple of 10. When computing 100 - 58, Compensation
was the strategy the DT group used most, while Bridging a multiple of 10 was the

254
strategy the OA group used most. It is interesting to note that both groups used the
Compensation strategy when subtracting numbers involving 8, 9 or 99, but they used
the Bridging a multiple of 10 when computing involving the 7 or near double number.
In the use of mental computation multiplication strategies, both groups used
strategies in a similar way but the participants in the OA group used more variety of
mental computation strategies than the DT group. Both groups showed the same
percentages of total correct items (i.e., 5 out of 10 items). The OA group frequently used
the Traditional method unlike addition and subtraction strategies. In general, both
groups employed the same commonly used strategies when computing the following
items: 14 × 99, 60 × 12, 98 × 6, 23 × 199, 33 × 35, 125 × 40, 5 × 16 × 125, 25 × 20 ×
100 × 4, and 35 × 55 + 35 × 45. In particular, in the multiplication items involving 8, 9, or
99 (e.g., 14 × 99, 98 × 6, and 23 × 199), the most common strategy used by participants
in both groups was Compensation. In the items involving 25 and 125 (e.g., 125 × 40 and
5 × 16 × 125), Making 100s and 1000s using factors was the most frequently used
strategy for both groups. For the item 60 × 12, the two common strategies used by both
groups were Basic fact and Distributive property of multiplication (e.g., 60 x (10 + 2) =
600 + 120 = 720). When computing 25 × 20 × 100 × 4, both groups frequently used the
strategy Reordering.
The major differences were shown when computing the item 12 × 4. The
common strategy for the DT group was Basic fact. In contrast, the OA group frequently
used the strategy Using factors (e.g., 12 × 2 × 2). In the item 33 × 35, none of the
participants in the DT group produced the correct solutions with any strategy. However,
the OA group computed this using Vedic method (6%), German method (13%), Partial

255
product of multiplication (6%) and Traditional method (13%).
It is somewhat surprising that the participants in the DT group failed to compute
this item mentally. A possible explanation for this might be that the participants in the
OA group benefitted from the class discussion regarding when or how to use the Vedic
method, German method, and so on, unlike the DT group. This may allow the OA group
to retain their strategies longer than that of the OA group.
Another important finding was that for the item 12 × 4, the strategies Basic fact
(e.g., retrieval from memory) and Using factors were the two common strategies used
by both groups. However, the DT group used the strategy Basic fact most, while the OA
group used the strategy Using Factors most. According to these results, we can infer
that the participants in the DT group were more likely to retrieve the product from
memory. In contrast, the participants in the OA group used alternative ways to compute.
This outcome is contrary to that of Campbell and Xue (2001) who found that retrieval
from memory has become the central strategy for students until higher education when
computing simple arithmetic multiplication problems (Lemonidis, 2016). The participants
in the DT group heavily used the Basic fact strategy by retrieving it from memory, but
the OA group used other strategies.
In the comparison of different ways of mental computation division strategies, the
participants in both groups used a variety of mental computation strategies in a similar
way. The OA group showed a higher total correct percentage on six items, while the DT
group presented a higher ‘total correct” percentage of four items. Unlike other
operations, the Traditional method was commonly observed for both groups. The
commonly used strategy for both groups was the same in the following items: 1600 ÷
256
25, 3990 ÷ 19, 4750 ÷ 50, 1375 ÷ 125, and 42 × 169 ÷ 13 ÷ 6. For example, in the items
dividing four digit numbers by two digit numbers (e.g.,1600 ÷ 25, 3990 ÷ 19, and 4750 ÷
50), the common strategy used by both groups in computing the item 1600 ÷ 25 was
Using multiplication (e.g., 25 × 4 = 100, 4 × 16 = 64). In addition, the most frequently
used strategy for the items 3990 ÷ 19 and 4750 ÷ 50 was the Traditional method. In the
item dividing 1375 by 125, the most common strategy used by both groups was
Partitioning the dividend (e.g., (1250 + 125) ÷125 = 10 + 1 = 11). In the item involving
multiplication and division operations like 42 × 169 ÷ 13 ÷ 6, the common strategy used
by both groups was Reordering.
The commonly used strategy for both groups was different in the following items:
Half of 52, 300 ÷ 6, 442 ÷ 8, 132 ÷ 11, and 240 ÷ 16. The common strategy used by the
DT group was Halving (e.g., 52 ÷ 2 = 26) and the OA group used the strategy
Partitioning the dividend (e.g., (50 + 2) ÷ 2 = 25 + 1 = 26). In the items involving
dividing three digit numbers by one digit (e.g., 300 ÷ 6 and 442 ÷ 8), when participants
computed the item 300 ÷ 6, the most common strategy used by the DT group was Using
multiplication (e.g., 50 × 6 = 300) and Basic fact was most commonly used by the OA
group. As for the more complicated item 442 ÷ 8, a small percentage of the DT group
computed this item correctly using the strategies Partitioning the dividend and
Traditional method (13% for each). In contrast, the strategies Using fraction (6%) and
Traditional method (6%) were employed by the OA group. Lastly, there were the items
involving dividing three digit numbers by two digit numbers (e.g., 132 ÷ 11 and 240 ÷
16). When computing 132 ÷ 11, Basic fact and Traditional method (13% each) were
strategies the participants in the DT group commonly used. The Traditional method
257
(31%) was the strategy the participants in the OA group frequently used. In computing
the item 240 ÷ 16, the strategy Using fraction produced the largest percentage of
correct answers in the DT group. The Traditional method was the common strategy
used by the participants in the OA group.
In division operations, both groups substantially employed the strategy
Traditional method when computing more complicated problems such as 3990 ÷ 19 and
4750 ÷ 50. The reason for this is not clear but it may have something to do with the
method of teaching written division operations. Lemonidis (2016) points out that many
teachers heavily used a teacher-centered method when they execute written division
algorithms – They focus more on procedural steps than students’ understanding.
Accordingly, this result supports the idea of Lemonidis’s (2016) study of the positive
characteristics of written (traditional) algorithms: “They are very powerful in solving
problem categories, especially when calculations include many numbers and the
memory may be heavily charged” (Lemonidis, 2016, p. 26).
In the use of mental computation integer strategy, the participants in the OA
group used slightly more varied mental computation strategies and showed a relatively
higher total correct percentage in 8 out of 10 division items. Regarding the integer
addition item involving adding two negative numbers (e.g., (– 24) + (– 66)), both groups
computed using the strategies in a similar way. For instance, the most commonly used
strategy was Adding two numbers and keeping the same sign (e.g., 24 + 66 = 90, then
keep the negative sign). As for the integer item involving adding two numbers with
different signs (e.g., (– 3) + 14 = 11), the most common strategy used by both groups
was Finding the difference between two numbers and keeping the sign of the larger

258
number (e.g., 14 – 3 = 11). When subtracting the item with the same sign (e.g., (– 113)
– (– 12)), Converting a double negative to a positive (e.g., –113 + (+12) = –101) was the
most frequently used strategy for both groups. When computing the multiplication item
with different signs such as (– 14) × 6 and 25 × (– 2) × 4 and with the same signs like (–
12) × (– 16), the strategy Multiplying two numbers and keeping the negative sign was
commonly used by the participants in both groups. Lastly, When computing involving
integer division with a different sign like 216 ÷ (– 12) and with the same sign like (– 240)
÷ (– 4), the strategy Dividing two numbers and keeping the negative sign was frequently
used for both groups. A major difference on integer operations was not shown.
One of the issues that emerge from these findings is that most of the PTS were
already aware that negative times negative become positive. The most incorrect
answers were observed in computing division operation rather than multiplication
operation. It can be inferred that the participants’ performance in the integer operation
may be affected by how well they have learned the division operation.
In mental computation strategies regarding fraction, decimal, and percent, three
fraction items were introduced ½ + ¼, 1½ + ¾ and 5¼ - 3½. Both groups used fraction
strategies in a similar way and the OA group showed a higher percentage of total
correct in the fraction addition items, and the DT group showed it in the fraction
subtraction. In the items involving fraction addition and subtraction, Converting faction to
decimal was the commonly used strategy for the DT group, while Making the same
denominator was the most frequently used strategy for the OA group.
In this regard, studies (Khoury & Zazkis, 1994; O’Conner, 2001) found that both
pre-and in-service teachers were more likely to consider fraction and decimal operations
259
as different types of numbers rather than as alternative representations of the same
number. Obviously, the participants in the DT group used the number-sense strategy
(Yang, 2005, 2007) that shows conceptual understanding by converting a fraction to a
decimal. With explicit teaching, they had an “A-ha” moment when the researcher
alternatively used the operations, fraction or decimal, when computing items mentally.
On the other hand, the OA group were more likely to employ previous learning strategy,
namely, teacher-taught method, Making the same denominator.
Then four decimal items were introduced: 0.5 + 0.75 – 0.8, 1.5 × 25, 0.3 × 100 ÷
1000, as well as the item “position the decimal point appropriately in 00003751875000,
so that it represents the product of 33.35 × 11.25.” The OA group had a relatively higher
total correct percentage except for the item 0.3 × 100 ÷ 1000. When computing 0.5 +
0.75 – 0.8, the DT group employed the strategies in the same percentage (17% for
each); Basic fact, Reordering, and Converting fraction to money. On the other hand, the
strategies Basic fact and Using double numbers were used by the OA group with the
same percentages (20% each). As for the item 1.5 × 25, Multiplying two numbers and
placing the decimal point was the strategy most used for the DT group. The common
strategy used in the OA group was Traditional method. From these results, it can be
inferred that the participants for both groups heavily used the rule-based strategy that
indicates the whole number analogies (Callingham & Watson, 2008). When computing
0.3 × 100 ÷ 1000, both groups frequently employed the strategy Multiplying decimal
number by powers of 10 (e.g., 30 ÷ 1000 = 0.03). In the decimal multiplication item,
“position the decimal point appropriately in 00003751875000, so that it represents the
product of 33.35 × 11.25,” the strategy Using approximate numbers was mostly used by
260
both groups. Unlike decimal addition and subtraction items, in the decimal item involving
multiplication and division, the Traditional method was observed for the OA group more
often than with the DT group.
Lastly, two percent items were provided such as 50% × 48 and 39% × 420. In the
item 50% × 48, the participants in the DT group had a higher total correct percentage
and frequently used the strategy Converting percent to fraction. For the OA group, the
participants used the strategies Converting percent to decimal and Using division (20%
for each). For another item involving percent 39% × 420, the OA group showed a
slightly higher total correct percentage. The two number-sense strategies (Yang, 2005,
2007) were found in the DT group with the same low correct percentage (8% each):
Converting percent to decimal and Using known fact (e.g., (40 % - 4 %) × 420 = 168 -
4.2 = 163.8). In contrast, Using known fact (13%) was the strategy correctly and
commonly used by the OA group. In a mixed item with fraction, decimal, and percent
such as 0. 25 + ¾ – 75%, various strategies were observed for both groups. The DT
group showed a higher total correct percentage. The strategy Converting to all decimals
was highly used for the participants for both groups so it can be assumed that this
strategy can be the easiest when calculating mixed rational numbers mentally.
In reviewing the literature, no study was found on the effect of mental
computation strategies using two different instructional approaches such as the direct
teaching and open-approach. The current study found that with respect to the
percentages of total correct for each operation, the DT group was more likely to perform
better in basic operations such as addition and subtraction. On the other hand, the OA
group showed higher percentages of total correct in the division, integer, fraction, and
261
decimal operations. No large difference of percentages of total correct was shown in
multiplication and percent operations.
With respect to the number of different strategies used, the DT group showed
more various strategies in addition and percent operations. In contrast, the OA group
demonstrated multiple ways of computing problems in multiplication, integer, and
decimal operations. No difference was found in operations such as subtractions,
divisions, and fractions. Another important finding was that in the use of the mental
image of the Traditional method, the DT group showed higher percentages of using the
Traditional method in basic operation such as addition and subtraction. On the other
hand, the OA group used the more Traditional method in computing multiplication,
decimal multiplication and division, and percent operations. One unanticipated finding
was that the Traditional method was not observed when computing integers and fraction
operations for both groups.
Research Question 5
In the last research question, the researcher asked how the use of PTS’ mental
computation strategies affects their flexibility regarding mental computation.
The Result of Pre-Interviews. To examine the relationship between PTS’
mental computation strategies and their flexibility in mental computation, pre-and post-
interviews were conducted before and after the intervention. The purpose of the pre-
interviews was to identify PTS’ untaught mental computation strategies and to describe
how each participant computed pre-MCT items based on their quintile level. Participants
were divided into five quintiles based on their pre-MCT scores. The participants in the
fifth quintile performed the best. In the pre-interviews, 11 participants for the DT group,

262
15 for the OA group, and 12 for the control group were interviewed. Three levels of
difficulty (e.g., low, medium, and high) for each operation were selected. In interviewing
addition operation, three items were introduced: 10 + 76, 22 + 17 + 11, and 39 + 399 +
3,999. When interviewing the low difficulty item 10 + 76, the strategy Basic fact was
commonly used for both the DT and OA groups, while mental image of the Traditional
method was commonly used for the control group. All of the groups computed with
100% accuracy. Then the medium difficulty item 22 + 17 + 11 was presented. The
strategy Rearranging numbers was frequently used by all of the groups with relatively
higher accuracy (i.e., 88%, 88%, and 86%). Lastly, the high difficulty item 39 + 399 +
3,999 was introduced. This finding suggests that IDK was the most common response
for the lower quintiles for the DT and OA groups. In the control group, Compensation
was the commonly used the strategy for the upper quintiles with 75% accuracy and IDK
responses were most common found in the lower quintiles.
Three subtraction items 40 – 6, 63 – (13 + 3), and 607 – 299 were introduced.
When interviewing for the low difficulty item 40 – 6, almost all interviewees in all three
groups correctly computed with 100 % accuracy and the Basic fact was frequently used
by all three groups. Then the interviewee were asked to compute the medium difficulty
subtraction item 63 – (13 + 3). The most common strategy used by the DT and OA
groups was the Traditional method with 57% and 67% accuracy, while the participants
in the control group employed two strategies Decomposing and Traditional method with
the same percentages (42% each) with 100% accuracy. When interviewing for the high
difficulty item 607 – 299, all three groups frequently used the strategy Compensation
with 50%, 63%, and 63% accuracy. In general, therefore, it seems that although the

263
participants in all quintiles attempted to employ the Compensation strategy, their
accuracy was relatively low.
Next, PTS in all groups were asked to compute the three items (e.g., 14 × 6, 42
× 20, and 99 ×13) mentally. As for the low difficulty item 14 × 6, as expected, the
Traditional method was the most common strategy used by all of three groups with
80%, 88%, and 67% accuracy. Regarding the medium difficulty item 42 × 20, IDK
responses (37% and 47%, respectively) were highly used by the interviewees in both
DT and OA groups and mostly from the middle and lower quintiles. The participants in
the control group employed Basic fact (i.e., 42%) strategy with 100% accuracy. Lastly,
in the high difficulty item 99 × 13, the results revealed that the IDK response was
frequently observed for the DT and OA groups in the lower and middle quintiles.
However, the control group employed the strategy Compensation (i.e., 58%) with 86%
accuracy from the middle and upper quintiles. According to these data, it can be inferred
that Traditional method and IDK responses were commonly used strategies for the
interviewees in the DT and OA groups when computing multiplication items.
For the division operation, interviewees were asked to compute three items: 24 ÷
8, 700 ÷ 25, and 342 ÷ 18. For the low difficulty item 24 ÷ 8, all of the groups answered
that this was the Basic fact problem (e.g., 8 x 3 = 24) and showed a higher accuracy
(e.g., 91%, 100%, and 92%). In the medium difficulty item 700 ÷ 25, the most commonly
used strategy for all groups (55%, 53%, and 67%, respectively) was Using known
multiplication fact (e.g., 25 × 4= 100, 4 × 7 = 28) with higher accuracy (e.g., 100%, 88%,
and 88%). However, IDK responses (36% and 40%, respectively) for DT and OA groups
were relatively high. When interviewing the high difficulty item 342 ÷ 18, as predicted,

264
the highest percentages of IDK responses (73%, 93%, and 67%, respectively) were
found in all three groups. This observation may support the assumption that mental
computation for division (e.g., three digits divided by two digits) could be the most
difficult operation among the whole number items during the pre-interviews.
For the integer operation, only one medium difficulty item (e.g., 30 × (– 8) ÷ (– 2))
was identified and Multiplying or dividing numbers and Keeping the positive sign was
the most common strategy with higher percentages of correct responses (e.g., 80%,
100%, and 100%) for the DT, OA and control groups.
For the fraction operations, only medium and high difficulty levels were identified:
½ + ¾ and 3 ¼ – 2 ½. In the medium difficulty item ½ + ¾, Making the same
denominator was frequently used by the interviewees in all three groups with 100%
accuracy. The computational errors were observed by the interviewees mostly in the
lower quintiles (45%, 20%, and 25%) for all three groups. With respect to the high
difficulty item 3 ¼ – 2 ½, higher IDK responses (36% and 40%) were found in the DT
and OA groups from the lower and middle quintiles. However, the strategy Converting to
improper fraction was the most common strategy used by the interviewees (33% and
25%) in the OA and the control groups with 100% accuracy. A higher level of errors for
each group (45%, 27%, and 33%) were observed. The results of computing the fraction
items indicated that the interviewees in the control group showed more variety of
strategies compared to other experimental groups.
In the decimal operation, three interview items were introduced: 5.6 + 3.7, 0.5 ×
48, and 0.02 × 0.4. For the low difficulty item 5.6 + 3.7, the Traditional method was
commonly used for the DT group from the lower and middle quintiles with 86%
265
accuracy. The strategies Adding by place and Traditional method (40% each) were
used the most in the OA group with higher accuracy (e.g., 83% and 100%). Adding by
place was the common strategy the control group (58%) employed with 100% accuracy.
In the medium difficulty item 0.5 × 48, Converting to fraction was the strategy all three
groups employed the most with 100% accuracy. In the high difficulty item 0.02 × 0.4, the
strategy Multiplying nonzero numbers and Placing decimal points (45%, 47%, and 50%)
were frequently observed for all three groups with relatively higher accuracy (e.g., 60%,
100%, and 100%). Surprisingly, the IDK response was relatively higher in the DT and
OA groups (42% and 50%) than the control group (17%). A possible explanation is that
the lower quintile interviewees for both experimental groups gave up computing the
answer mentally.
Three difficulty level items for percent operations 1% × 200, 25% of 20, and 24%
× 80 were presented. For the low difficulty item 1% × 200, the Basic fact (55%, 33%,
and 42%) was the most widely used strategy for all three groups with 100% accuracy,
regardless of the quintile levels. In the medium difficulty item 25% of 20, Converting
percent to fraction was the most common strategy used by all three groups and showed
higher percentages of correct responses (i.e., 88%, 92%, and 100%). Low percentages
of IDK responses (i.e., 18%, 20%, and 25%) were observed for all groups. In the high
difficulty item 24% × 80, higher percentages of IDK responses (i.e., 73%, 80%, and
58%) were observed, as expected. Interviewees in the three groups frequently used
Guessing but all gave all incorrect answers. The data thus suggest that among rational
numbers, mental computation with percent operations was the most difficult operation.

266
The Results of Post-Interviews. In total, 36 PTS -12 participants in the DT
group, 15 in the OA group, and 9 in the control group - participated in the post-
interviews following intervention. The goal of the post-interviews was to identify the
different uses of mental computation strategies for each operation and to describe how
each participant computed post-MCT items based on their quintile level. Based on the
post-MCT scores, three levels of problems for each operation were selected except for
the addition (2 items). In the addition operation, two items such as 143 + 59 and 18 +
27 + 37 were introduced. Compared to the pre-interview items, a wide range of
strategies were observed for the DT and OA groups, but not in the control group. In the
low difficulty item 143 + 59, Compensation was the strategy the DT group used most
with 100% accuracy. The interviewees in the OA and control groups used the strategy
Traditional method with higher accuracy (100% and 83%). One unanticipated finding
was that slightly less than half of the OA interviewees (40%) employed the Traditional
method, although they showed a wide variety of the strategies. This may be explained
by the fact that they still feel safe and convenient when using the teacher-taught
Traditional method. For 18 + 27 + 37, the strategy Adding by place was commonly
used by the interviewees in the lower quintiles in the DT group with 100% accuracy.
Interestingly, the interviewees in the upper quintiles used the strategies Decomposing
and Adding up (25% each). For the OA group, Adding by place was also commonly
used by interviewees in the middle and upper quintiles with 100% accuracy. In contrast,
those in the control group mostly employed the Traditional method with relatively lower
accuracy (83%). It can thus be suggested that the strategies Decomposing and Adding
up were only found in the middle and upper level quintile interviewees in all groups.
267
For the subtraction operation, the three difficulty level items such as 36 – 8, 95 –
37, and 807 – 399 were introduced. While computing 36 – 8, the most common
strategies used by the DT group were Decomposing (25%) and Compensation (25%)
which were employed by the interviewees in the middle and higher quintiles with 100%
accuracy. There were three common strategies used by the OA group: Count back,
Subtracting by place, and Decomposing. Subtracting by place and Decomposing (20%
each) were employed by the interviewees in the middle and higher quintiles. In contrast,
the strategy Count back (47%) was used by the lower quintile interviewees. For the
control group, the strategy Decomposing (44%) was mostly used by the middle and
upper quintiles and Compensation (22%) was observed for the participants in the 2nd
quintile. In computing the medium difficulty item 95 – 37, for the DT group, the three
strategies Compensation (33%), Subtracting by place (25%), and Decomposing (25%)
were frequently observed. The strategies Compensation (with 50% accuracy) and
Decomposing (with 100% accuracy) were found in the middle and upper quintiles. In
contrast, Subtracting by place was mostly used by the lower quintiles with a low
accuracy (33%). In the OA group, slightly less than half of the interviewees (47%) in the
low and middle quintiles employed the Traditional method with low accuracy (43%).
Then, the strategy Decomposing followed by the interviewees (27%) in the middle and
upper quintiles with higher accuracy (75%). Only two strategies Traditional method
(67%) and Decomposing (33%) were used by the participants in the control group. The
Traditional method was observed in the lower and middle quintiles with 50% accuracy,
while Decomposing was observed in the middle and upper quintiles with 100%
268
accuracy. In the high difficulty item 807 – 399, Compensation was the most commonly
used strategy for all of the groups with higher accuracy (e.g., 64%, 73%, and 83%).
These results further support the idea of flexible and inflexible learner
characteristics. According to Heirdsfield and Cooper (2004), it can be inferred that the
interviewees from the middle and upper quintiles who employed strategies
Decomposing and Compensation were more likely to have flexible learner
characteristics. The interviewees from the lower quintiles who used the Traditional
method could be considered as inflexible learners.
In the multiplication operation, there were problems of three different levels: 7 ×
16, 24 × 30, and 99 × 180. A wide variety of multiplication strategies were found in the
DT group. Among them, Distributive property and Traditional method were strategies
frequently used by interviewees in all groups. In the low difficulty problem 7 × 16, for the
DT group, the Traditional method was the strategy commonly used by interviewees
(50%) from the 2nd to 4th quintiles with a relatively low accuracy (67%). Then, the
Distributive property was found by the interviewees (33%) in the middle and upper
quintiles with 75% accuracy. More than half of the interviewees (60%) in the OA group
used the Distributive property with higher accuracy (89%) and one-fifth of interviewees
(20%) used the Traditional method with 67% accuracy and they were all from the middle
and upper quintiles. Distributive property (56%) and Traditional method (33%) were also
frequently observed in the control group, regardless of the levels of quintiles with a
relatively lower accuracy (80% and 67%). For the medium difficulty problem 24 × 30,
Basic fact was used by the interviewees in the middle and upper quintiles and
Traditional method was found in all of the quintiles. Those were two common strategies

269
implemented by interviewees for the DT and OA groups with 100% accuracy. For the
control group, the interviewees heavily employed the Traditional method with 80%
accuracy. IDK responses were mostly observed by the interviewees in the lower
quintiles; however, several interviewees in the middle and upper quintiles for the DT and
OA groups said IDK as well. In the high difficulty multiplication item 99 × 180,
Compensation (58%, 47%, and 56%) was the strategy similarly used by all of the three
groups in the middle and upper quintiles. However, the OA group had the highest
percentage of correct responses (71%), compared to the DT and control groups (43%
and 40%). As predicted, IDK responses (33%, 47%, and 33%) for each group were
higher than other items. Interestingly, the interviewees who employed the strategy
Traditional method in this item all had incorrect answers. One unanticipated finding was
that the DT group was more likely to employ the Traditional method strategy when
asked to compute multiplication items mentally compared to addition and subtraction
operations.
For the division operation, the following three difficulty level of items were
identified: 56 ÷ 7, 80 ÷ 16, and 468 ÷ 18. The DT group used a more wide range of
strategies than their counterparts in the OA and control groups. In the low difficulty item
56 ÷ 7, Basic fact (83%, 87%, and 78%) strategy was considerably employed by the
participants in all three groups and they all gave correct answers. Here, when asked
what Basic fact means, they responded that they retrieved a multiplication fact from
memory (e.g., 7 × 8 = 56). In other words, they used the inverse operation of
multiplication to find 8. In the medium difficulty item 80 ÷ 16, the three most common
strategies which appeared in all groups were Using multiplication fact (e.g., 20%, 13%,

270
and 33%), Using fraction (7%, 13%, and 11%), and Traditional method (33%, 53%, and
33%). Interestingly, interviewees did not differentiate the strategy Using multiplication
fact (e.g., 16 × 5 = 80) as Basic fact, specifically, they responded they used the
multiplication fact strategy. The Traditional method was observed mostly in the lower
and middle quintiles, except for the OA group (found in all quintiles); however, as
predicted, the percentage of correct responses for this strategy was relatively low (40%,
50 % and 33%). Surprisingly, the interviewees who employed the strategy Using
fraction were observed in the upper quintiles and all had correct answers. While
computing the high difficulty interview item 468 ÷ 18, as expected, the IDK response
was considerably high (42%, 60%, and 67%) for all three groups, regardless of the
levels of quintiles. Then, the Traditional method was highly used for the interviewees in
the lower and middle quintiles for the DT and control groups and they all had incorrect
answers. In contrast, another important finding was that about one-third of the
interviewees (27%) in upper quintiles for the OA group used the Traditional method and
all had correct answers. This may partly be explained by the fact that those who
employed this method may feel safe and confident when using this method.
In the integer operation, PTS were asked to compute the three difficulty items
mentally: 25×4×0
4, -13 – (-37) + 20, and 24 × 4 ÷ (- 6). Similar strategy use was observed
in all groups. In the low difficulty item (25×4×0)/4, almost all of the participants for each
group computed this using the strategy Basic fact (100%, 93%, and 100%). In other
words, a large number of the participants have already memorized the fact that zero
divided by any non-zero number should be zero so they retrieved this fact from memory.
The percentage of the interviewees who correctly answered this item remained

271
relatively low (e.g., 69% and 79%) for the DT and OA groups compared to the control
group (e.g., 100%). The interviewees who answered incorrectly were confused with the
fact that any number divided by zero is undefined so this indicates that PTS often have
a limited understanding of the zero property of division. In computing the medium
difficulty item -13 – (-37) + 20, a majority of interviewees for all groups used the strategy
Adding or subtracting numbers and Keeping the negative sign, regardless of the quintile
level. The percentages of correct responses of this item were quite high (e.g., 75%,
86%, and 88%). In the high difficulty item 24 × 4 ÷ (- 6), a majority of the interviewees in
each group implemented the strategy Multiplying or dividing numbers and Keeping the
negative sign with considerably higher accuracy (60%, 82%, and 100%). IDK responses
(17%, 27%, and 33%) for each group were higher than integer addition and subtraction.
A possible explanation for this might be that although the interviewees who answered
this item incorrectly or IDK had no difficulty in multiplying 24 and 4, they failed to
compute dividing 96 (e.g., 24 × 4 = 96) by – 6 mentally. Thus, although they showed a
procedural knowledge of integer operation (e.g., a positive number divided by a
negative number is always negative), they still showed a limited understanding of the
division operation.
During the fraction interviews, three difficulty level items 2/3 × 18, 4½ + 1¾, and
1/3 × 4 1/5 were presented. No significant difference was found among groups in the
use of fraction strategy. In the low difficulty item 2/3 × 18, most of the strategies
employed were rule-based (Yang, 2005, 2007; Yang et al., 2009) that focus more on the
memorizing rules of standard written algorithms, rather than connecting to conceptual
understanding. For example, the strategies Converting the whole number to fraction and

272
Multiplying them (42%, 53%, and 22%) and Reducing numbers (25%, 27%, and 22%)
were commonly implemented by the interviewees for all groups with higher correct
responses. However, the control group showed the highest IDK response (33%). The
common miscomputation shown was that they multiplied 3 and 18 and divided the
product (54) by 2, so they ended up with 27 as an incorrect answer. In the medium
difficulty item 4½ + 1¾, number-sense strategies (Yang, 2005, 2007; Yang et al., 2009)
that enhance deep conceptual understanding were also observed. For example, the
rule-based strategy Making the same denominator (25%, 73%, and 44%) was observed
in all groups with 100% accuracy. The number-sense strategies such as Converting
fraction to money and Converting fraction to decimal were used in the middle and upper
quintiles for the DT group. The OA group used more rule-based strategies such as
Making the same denominator and Making improper fraction. Common miscomputation
(i.e., 1/2 + 3/4 = (1+3)/(2×4) = 4/8; 1/2+3/4 = (1×4)/(2×3) = 4/6) was shown in all
groups. In the high difficulty item1/3 × 4 1/5, most of the interviewees employed rule-
based strategies. For example, Making improper fraction and multiplying was the
strategy most commonly used by the interviewees in the middle and upper quintiles for
all three groups with100% accuracy. Only one 4th quintile interviewee in the DT group
used a number-sense strategy such as Converting fraction to decimal. As expected,
higher percentages of IDK responses (42%, 20%, and 33%) were observed by the
interviewees in all groups, regardless of the level of quintiles. The most common
miscalculation (i.e., 1
3 × 4
1
5 = 4
1×1
3×5 = 4
1
15 ) was observed by the interviewees in the
lower and middle quintiles for each group.

273
The results of the decimal operation were described. The interviewees were
asked to compute the three decimal operations: 5.8 + 2.6, 100 × 0.05 ÷ 1000, and 0.2 ×
75. The use of decimal strategy difference was not observed among groups. For the low
difficulty item 5.8 + 2.6, the DT group computed this item showing conceptual
understanding. The strategy Adding by place was commonly found and used by the
interviewees from the middle and upper quintiles in the DT group with 100% accuracy.
In contrast, a rule-based strategy such as the Traditional method was highly
implemented by the interviewees in the OA and control groups (e.g., 47% and 67%) but
produced relatively low accuracy (71%) in the OA group and 100% accuracy in the
control group. Miscomputation (e.g., 0.8 + 0.6 = 0.14) was frequently observed by the
interviewees in the lower quintiles for both DT and OA groups. They showed that they
have a lack of understanding in decimal place. The higher percentage of using the
Traditional method (67%) in the control group was not surprising since they were not
exposed to any intervention. The results of the medium difficulty item 100 × 0.05 ÷ 1000
revealed that a majority of the interviewees (67%, 73%, and 56% ) in all groups used
the rule-based method Multiplying or dividing decimal numbers by powers of 10, which
showed a lack of conceptual understanding of the procedure but they showed higher
accuracy (100%, 100%, and 80%). IDK response was higher in the control group. For
the high difficulty item 0.2 × 75, the most common strategy used by all groups was the
rule-based strategy Ignoring decimal and multiplying numbers, then Placing decimal
point (25%, 33%, and 22%) and was used by the interviewees in the middle and upper
quintiles with relatively higher accuracy (67%, 100%, and 50%). IDK was the highest
response (50%, 47%, and 44%) shown in all three groups. Interestingly, the DT group
274
showed fewer uses of Traditional method, while the OA and control group used more.
This may be explained by the fact that the researcher demonstrated a variety of
different strategies in a direct way. Although the researcher encouraged participants in
the OA group to create their own strategies, the interviewees in the upper quintiles used
the highest rate of the rule-based strategies during the post-interviews, while the lower
and middle quintile interviewees had the highest IDK responses (47%). This
inconsistency may be due to their lack of confidence in computing each item in a limited
time.
Lastly, the participants were asked to compute the three percent operation items:
1% of 175, 75% × 120, and 38% × 60. The use of strategies among groups was very
similar. More number-sense strategies were observed in all three groups. When
interviewing for the low difficulty item 1% of 175, the most common number-sense
strategies were Converting percent to decimal (33%, 40%, and 22%) and Converting
percent to fraction (25%, 33%, and 33%) for each group. However, the highest IDK
response (44%) was observed by the control group. In the medium difficulty item 75% ×
120, the middle and upper quintile DT and OA group interviewees computed this item
using the number-sense strategy Converting percent to fraction (42% and 40%) and
also about one-third of the control group (33%) in the 2nd and 4th quintiles used the
same strategy. Also, higher IDK responses (42%, 53%, and 67%) were observed by
the interviewees in the lower and middle quintiles for each group. In the high difficulty
item 38% × 60, the highest IDK responses (83%, 60%, and 66%) were observed for
each group. For the OA group, the rule-based strategy Multiplying whole numbers and

275
move the decimal points (27%) was observed by the upper quintile interviewees but
only 50% of them gave correct responses.
A Comparison of the Pre–and Post–Interview Items on Each Operation. To
examine the different use of strategies between pre-and post-interviews, similar items
for each operation between pre-and post-interviews were selected. In the addition
operation, items involving three two-digit numbers (e.g., 22 + 17 + 11 and 18 + 27 + 37)
were chosen. There was a marked difference in the use of addition strategies with the
items 22 + 17 + 11 and 18 + 27 + 37 between pre-and post-interviews. In general, the
most common strategy the interviewees used was Rearrange numbers (64%, 47%, and
50%) in the pre-interviews but Adding by place (33%, 40%, and 22%) was employed the
most during post-interviews. No one used the Traditional method in the DT group and
the percentages of using the Traditional method was the same (20% each for pre-and
post-MCT) in the OA group. However, for the control group, the percentage of using
Traditional method was considerably increased from 8% to 55% between pre-and post-
interviews.
In the subtraction operation, the researcher selected the item 607 – 299 in the
pre-interviews and 807 – 399 in the post-interviews. For the three groups,
Compensation was the most common strategy from 73%, 33%, and 42% to 67%, 80%,
and 56% between pre-and post-interviews. The OA group showed a marked difference
and also their IDK responses were decreased from 33% to 0%. One interesting finding
is that the percentages of the incorrect answers in the DT group were heavily increased
from 9% to 33% between pre-and post-interviews. This result may be explained by the
fact that the participants in the DT group tried to use Compensation strategy but ended

276
up with incorrect answers. No large difference in the use of strategies was found in the
control group.
In the multiplication operation, the items 42 × 20 in the pre-interviews and 24 ×
30 in the post-interviews were selected to compare the group differences. Among the
multiple strategies, Basic fact was the commonly used strategy in all groups and no
large difference was shown in the use of strategies for the DT and OA groups. However,
the percentage of using Basic fact was heavily decreased from 42% to 11% in the
control group between pre-and post-interviews. What is surprising is that the percentage
of using Traditional method was increased at least two times from 9%, 13%, and 25% to
25%, 27%, and 56% for each group between pre-and post-interviews. It seems possible
that these results are due to the different types of the composition of numbers. The
former item (42 × 20) was easier to compute mentally but for the latter item (24 × 30),
the interviewees needed to regroup the ones in their heads so the Traditional method
was selected to easily calculate it. Thus, it can be assumed that the students are able to
choose appropriate multiple strategies based on their knowledge of number or operation
presented in the tasks. According to Heirdsfield and Cooper (2004), accurate and
inflexible students were more likely to choose the mental image of the Traditional
method. However, the percentage of IDK response was decreased for the DT and OA
groups, but not for the control group.
As for the division operation, the items 342 ÷ 18 for the pre-interviews and 468 ÷
18 for the post-interviews were selected. In the use of strategies, almost all of the
interviewees in all groups had unsuccessfully computed these items mentally. No
common strategy was identified for the DT and OA groups. The most obvious finding is

277
that IDK response was significantly decreased for the DT and OA groups, but no
changes were found in the control group. The percentage of the Incorrect answers in
the DT group was considerably increased from 18% to 42%. This may be partly
explained by the fact that they at least tried to compute the item mentally during the
post-interviews but failed to get the correct answers. For the OA group, the percentage
of using the Traditional method was significantly increased from 7% to 27%. For the
control group, no large difference was shown between pre-and post-interviews.
In the integer operation, the items 30 × (-8) ÷ (-2) in the pre-interviews and 24 × 4
÷ (-6) in the post-interviews were examined. The most common strategy was Multiplying
or Dividing numbers and the percentages of this strategy were decreased from 73%,
73%, and 83% to 50%, 60%, and 67% in all three groups. Surprisingly, IDK response
was increased in all groups. Additionally, the percentages of the Incorrect answers were
increased for the DT and OA groups. A possible explanation for this might be that the
interviewees computed this item 30 × (-8) ÷ (-2) with less difficulty than the item 24 × 4 ÷
(-6) since the former involved the multiples of 10s (e.g., 30), which was less complicated
to compute mentally. Another possible explanation for this is that it is observed that
many interviewees had a difficulty computing this item 24 × 4 ÷ (-6). The majority of the
interviewees were aware of the fact that negative times negative becomes positive but
they had trouble computing division operation so ending up getting incorrect answers.
The fraction items ½ + ¾ (without a whole number) in the pre-interviews and 4½
+ 1¾ (with a whole number) in the post-interviews were examined to see the
differences. Interviewees in all groups heavily used the strategy Making the same
denominator during the pre-interviews, regardless of the presence of the whole number.
278
During the post-interviews, more strategies such as Converting to decimal and
Converting to money were found in the DT group. For the OA group, more interviewees
used Making the same denominator strategy. One notable difference was that the
percentages of Incorrect answers were significantly decreased for the DT and OA
group, but not much difference was observed in the control group.
In the comparison of decimal operation, the items 0.5 × 48 in the pre-interviews
and 0.2 × 75 in the post-interviews were selected. Converting to fraction (36%, 60%,
and 67%) was the most common strategy used by the interviewees during the pre-
interviews in all three groups. During the post-interviews, more interviewees used the
strategy Ignoring decimal and multiplying numbers, then placing decimal point (17%,
33%, and 22%) for each group. One interesting finding is that the percentages of using
IDK responses were slightly increased for the DT and OA groups and considerably
increased for the control group. This may be due to the fact that a majority of
interviewees were aware that the decimal number 0.5 is exactly the same as one-half,
but they failed to recognize the compatible number, such as 0.2, is the same as one–
fifth. The percentages of Incorrect answers were increased for the DT and OA group but
decreased for the DT group. A possible explanation for this might be that it was
observed that they had an incorrect answer when they multiplied two numbers (e.g., 2 ×
75) mentally.
In the comparison of percent strategies, the items 25% × 20 in the pre-interviews
and 75% × 120 in the post-interviews were compared. The most common strategy used
by the interviewees was Converting to fraction. The use of this strategy was somewhat
decreased from 64%, 73%, and 67% to 42%, 40%, and 33% for each group between
279
pre-and post-interviews. During the post-interviews, although small percentages of other
strategies such as Converting to decimal for the DT group and Using division for the OA
group were found, the percentages of IDK responses were considerably increased in all
three groups. It seems possible that these results are due to the failure of recognizing
compatible or equivalent numbers because interviewees in all three groups were not
able to recognize the fact that 75% equals with the fraction ¾.
The Relationship of the Levels of Mental Computation Performance and
Flexibility. To identify the relationship between each interviewee’s quintile levels and its
flexibility, during the post-interviews, interviewees were asked to describe their initial
strategy and asked if they could think of another strategy to mentally compute each item
(23 items in total) for both experimental groups and the control group. The frequency of
the sum of initial and alternative strategies was summarized for each item to compare
the differences among the three groups. In total, 12 participants for the DT group (i.e., 3
from the 2nd, 5 from the 3rd, 2 from the 4th, and 2 from the 5th quintiles), 15 for the OA
group (i.e., 1 from the 1st, 2 from the 2nd, 5 from the 3rd, 2 from the 4th, and 5 from the 5th
quintiles), and 9 for the control group (i.e., 4 from the 2nd, 3 from the 3rd, and 2 from the
4th quintiles) participated in the post-interviews. There were no 5th quintile participants in
the control group during the post-interviews. Based on the PTS’ mental computation
interviews, the interviewees participated were identified as accurate and flexible,
accurate and not flexible, inaccurate and flexible, and inaccurate and not flexible (e.g.,
Heirdsfield, 2000, 2002; Heirdsfield & Cooper, 2004). This study adopted those terms to
identify PTS’ flexibility on operations with a whole number, integer, and rational number.

280
The participants were asked to compute the two addition operation items 143 +
59 and 18 + 27 + 37 mentally during the post-interviews. For 143 + 59, there were 16
responses for the DT group, 22 for the OA group, and 12 for the control group.
Regarding the frequency of strategy use, three 5th quintile interviewees in the OA group
computed this item using three different ways. Six interviewees (i.e., 1 from the 2nd, 3
from the 3rd, and 2 from the 5th quintiles) in the DT group, seven interviewees (i.e., 4
from the 3rd, 1 from the 4th, and 2 from the 5th quintiles) in the OA group, and each
interviewee from the 2nd, 3rd, and 4th quintiles in the control group offered two strategies.
The remaining interviewees provided only one strategy. Based on the quintile levels, the
mental addition strategies were analyzed. It is interesting to note that no one used the
Traditional method in the DT group. In contrast, this method was also frequently
observed by the interviewees in every quintile for the OA group. Unsurprisingly, the
Traditional method was heavily used in the lower and middle quintiles for the control
group.
With respect to the item 18 + 27 + 37, there were 16 responses from the DT, 24
for the OA, and 10 for the control group. Five interviewees (i.e., 2 from the 3rd, 1 from
the 4th, and 2 from the 5th quintiles) in the DT group, eight interviewees (i.e., 3 from the
3rd, 2 from the 4th, and 3 from the 5th quintiles) described two strategies in the OA group,
and only one 4th quintile interviewee showed two strategies. The remaining interviewees
computed this item mentally using only initial strategy. In the use of strategy based on
the levels of quintiles, the most commonly used strategies found in the middle and
upper quintiles were Adding by place, Decomposing, and Adding up for the DT and OA.
In contrast, the two strategies found in the lower quintiles were Adding by place for both
281
DT and control groups and the Traditional method that was often observed in the OA
and control group. However, this method led frequent errors.
Taken together, these results suggested that generally, a majority of interviewees
in every quintile used more number-senses strategies that enhance students’
conceptual understanding and efficient number fact strategies such as Adding by place,
Decomposing, and Compensation with higher accuracy from the DT and OA groups.
However, interestingly, the rule-based strategy (Yang, 2005, 2007) that focused more
on the rules and procedures such as the Traditional method was frequently observed in
the interviewees in every quintile in the OA group. Accordingly, the interviewees who
were in the upper quintiles in the DT group were more likely to employ at least two
number-sense mental computation strategies. They could be categorized as accurate
and flexible learners (Heirdsfield, 2000, 2002; Heirdsfield & Cooper, 2004). However,
the interviewees in all quintiles for the OA group employed efficient mental strategies
and the mental image of the Traditional method that is connected to the characteristics
of inflexible learners but showed higher accuracy. They were more likely to be accurate
and inflexible learners
In light of the above, the results of mental computation on addition operations
revealed that interviewees in the middle and upper quintiles for the DT and OA groups
were more likely to choose efficient number fact addition strategies (e.g., Adding by
place, Decomposing, and Compensation) and showed higher accuracy. According to
Heirdsfield (2000), proficient mental computation students appeared to use a variety of
strategies and had the confidence to use them. In this regard, our PTS demonstrated
choosing at least two number-sense strategies to compute addition items mentally.

282
Those participants can be categorized as accurate and flexible learners (Heirdsfield,
2000, 2002; Heirdsfield & Cooper, 2004). Additionally, the results of mental addition
strategies revealed that a majority of participants in the upper quintiles in the OA group
implemented Traditional method as their initial or alternative strategy. Accordingly,
Heirdsfield and Cooper (2004) found that the accurate and inflexible students tended to
employ the mental image of the Traditional method as a well-known rule-based strategy
(Yang, 2005, 2007) and showed higher accuracy. In other words, those who applied the
Traditional method in upper quintiles as their strategy compensated for limited
knowledge. Thus, they can be categorized as accurate and inflexible learners
(Heirdsfield, 2000, 2002; Heirdsfield & Cooper, 2004). In the control group, as predicted,
the Traditional method was observed in the lower and middle (i.e., 3rd) quintiles with
higher accuracy. They appeared to be accurate and inflexible learners.
In the subtraction operation, the three items 36 – 8, 95 – 37, and 807 – 399 were
introduced to compute. In the mental subtraction computation strategies of 36 – 8, every
interviewee provided at least one strategy. In total, 15 responses from the DT, 24 from
the OA, and 9 from the control group were analyzed. Two fifth quintile interviewees in
the OA group provided three different strategies. Three interviewees (i.e., 2 from the 4th
and 1 from the 5th quintiles) in the DT group computed this item using two strategies,
seven interviewees (i.e., 2 from the 3rd, 2 form the 4th, and 3 from the 5th quintiles) in the
OA group, and each interviewee from the 3rd and 4th quintiles provided two mental
strategies. Others provided only one strategy. In the use of strategy, the number-sense
mental computation strategies such as Basic fact, Decomposing, Subtracting by place,
and Compensation were observed in the upper quintiles for both DT and OA groups.

283
The less efficient or rule-based strategies such as Count back one by one and
Traditional method were mostly observed in the OA group. In the control group,
Decomposing (3rd and 4th quintiles), Compensation (2nd and 3rd quintiles), and the
Traditional method were frequently observed in all quintiles.
In terms of subtraction item 95 – 37, 16 responses in the DT group, 23 in the OA
group, and 9 in the DT group were examined. Four interviewees (i.e., 1 from the 3rd, 1
from the 4th, and 2 from the 5th quintiles) in the DT group, seven interviewees (i.e., 2
from the 3rd, 1 from the 4th, and 4 from the 5th quintiles) in the OA group, and one 2nd
quintile interviewee computed this item using two different strategies. All of the
interviewees in the control group provided one strategy except one interviewee from the
2nd quintile which gave two different strategies. In the use of the strategy of 95 – 37,
Decomposing was the most common strategy observed by the interviewees in the
middle quintile for the DT and OA groups. Other efficient strategies such as
Decomposing, Compensation, Making multiples of 10, and Subtracting by place were
found by the interviewees in the upper quintiles for the DT and OA groups. An efficient
method (e.g., subtracting by place) found in the 2nd quintile in the DT group led to all
errors and the Traditional method used by the middle and lower quintile interviewees
also led frequent errors for all of the groups.
The last subtraction item 807 – 399 produced fewer total responses (i.e., 11 for
the DT, 17 for the OA, and 10 for the control). Only one interviewee from 3rd quintile for
the DT group, three interviewees (i.e., 1 from the 3rd and 2 from the 5th quintiles) for the
OA group, and one interviewee from the 3rd quintile in the control group employed two
different strategies. Others computed this item with one strategy. Compensation was
284
the most common strategy used by the interviewees in all of the quintiles for all groups.
However, when using the strategies Compensation and Traditional method, more errors
were found by the interviewees in the middle and lower quintiles for both DT and OA
groups. The Traditional method was more likely to be found from all of the quintiles in
the OA and from middle and lower quintiles in the control group.
Taken together, a comparison of the three groups in the use of subtraction
computation revealed that interviewees in the middle and upper quintiles tended to use
more efficient or number-sense strategies (i.e., Decomposing, Compensation, and
Making multiples of 10) that required good numeration understanding (Hierdsfield,
2000). Those who used at least two rule-based strategies (i.e., Traditional method) with
higher accuracy can be considered as accurate but inflexible learners (Heirdsfield,
2000, 2002; Heirdsfield & Cooper, 2004). For example, the Traditional method was
frequently observed in the upper quintiles for the OA group. They compensated their
limited mental computation knowledge using the Traditional method. Accordingly, those
who used efficient mental strategies (i.e., Compensation and Decomposing-required
good numeration understanding) in the upper quintiles but gave incorrect answers can
be considered as flexible but inaccurate students. The interviewees in the lower
quintiles appeared to use the Traditional method with poor accuracy were neither
flexible nor accurate (Heirdsfield, 2000, 2002; Heirdsfield & Cooper, 2004).
As for the multiplication operation, the interviewees were asked to compute the
three items 7 × 16, 24 × 30, and 99 × 180 mentally. For the item 7 × 16, in total, 15
responses in the OA group, 20 in the DT group, and 10 in the control group were
identified, including the IDK response. Three interviewees (i.e., 2 from the 3rd and 1 from

285
the 5th quintiles) in the DT group and five interviewees (i.e., 3 from the 5th and 1 from the
4th and 3rd quintiles each) in the OA group, and one interviewee from 4th quintile
described their strategies in two different ways. Three interviewees (i.e., 1 from the 1st
and 2 from the 2nd quintiles) in the OA group and an interviewee from the 2nd quintile in
the control group did not provide any strategy. In terms of strategy use, the number-
sense strategy Distributive property of multiplication was the most frequently used
strategy for the interviewees in the middle and upper quintiles for all of the groups. In
other words, they computed a product based on other products they already know.
Those who used the Distributive property of multiplication have already known that any
number can be divided in a variety of ways (e.g., 7 × 16 = 7 × 10 + 7 × 6 = 70 + 42 =
112 or 7 × 16 = 7 × 8 + 7 × 8 = 56 + 56 = 112). French (2005) state that the Distributive
law is a very useful strategy to calculate arithmetic facts of the multiplication tables and
is a key concept in understanding algebra. Other number sense strategies Using
factors, Using multiplication and addition and rule-based strategy Traditional method
were observed for the DT and OA groups. Generally, numerous strategies and higher
accuracy were shown by the interviewees from the middle and upper quintiles in the DT
group (accurate and flexible). In contrast, the 5th quintile interviewees in the OA group
tended to use the Traditional method as their alternative methods (accurate and
inflexible). Less accurate responses and IDK responses were frequently found in the
lower and middle quintiles in the OA group (inaccurate and not flexible). No other
strategies were identified in the control group except for the Traditional method. The
computational errors and IDK response were frequently observed in the lower and
middle quintiles for the OA and control group (inaccurate and not flexible).

286
For the item 24 × 30, in total, 15 responses for the DT group, 21 for the OA group
and 10 for the control group were examined. Three interviewees (i.e., 1 from the 5th and
2 from the 3rd quintiles) in the DT group, six interviewees (i.e., 4 from the 5th, 1 from the
4th, and 1 from the 3rd quintiles) in the OA group, and one interviewee from the 4th
quintile in the control group described their strategies in two different ways. Numerous
interviewees (i.e., 2 from the 2nd and 1 from the 3rd quintiles in the DT group, 1 from 1st,
2 from the 2nd, 1 from the 3rd, and 1 from the 4th quintiles, and 2 from the 2nd quintile in
the control group) did not describe any strategies. In the use of the strategy of this item
24 × 30, a variety of strategies and higher accuracy were involved in the DT and OA
groups. For example, Basic fact, Using factors, Using known multiplication, Distributive
property of multiplication, and German method were observed in the middle and upper
quintiles for both DT and OA groups with higher accuracy. The Traditional method and
IDK responses were mostly found in the lower and middle quintiles for both the DT and
OA groups. It is interesting to note that the five interviewees from the 3rd quintile in the
DT group showed a wider variety of strategies than any other quintile interviewees.
In the last multiplication item 99 × 180, fewer responses were observed (i.e., 12
responses for the DT, 15 for the OA, and 9 for the control groups). No interviewees
provided more than one strategy. Four interviewees (i.e., 2 from the 2nd, 1 from the 3rd,
and1 from the 4th quintiles) from the DT group, seven interviewees (i.e., 1 from the 1st, 2
from the 2nd, and 4 from the 3rd quintiles) from the OA group, and three interviewees
(i.e., 2 from the 2nd and1 from the 3rd quintiles) from the control group did not provide
any strategy. When examining their use of strategy, the two strategies Compensation
and Traditional method were commonly used for all groups. Although a majority of
287
interviewees used the number-sense strategy Compensation, less accuracy was
observed from the middle and upper quintiles in all of the three groups. They could be
categorized as inaccurate and flexible learners. Higher IDK responses (33%, 47%, and
33%) were observed from the lower and middle quintiles for each group.
In sum, the participants in the upper quintiles demonstrated numerous strategies
and higher accuracy for the DT and OA groups when computing both low and medium
difficulty items. They appeared to be accurate and flexible learners. However, the upper
quintiles interviewees in the OA group still appeared to use the rule-based strategy
Traditional method as their alternative methods with higher accuracy. They were
categorized as accurate and not flexible learners. The participants in the control group
were reluctant to provide any alternative strategies.
When interviewing about division operations, the three items 56 ÷ 7, 80 ÷ 16, and
468 ÷ 18 were used. During interviewing of the item 56 ÷ 7, a narrow range of
responses (e.g., 12 from the DT, 16 from the OA, and 9 from the control group) was
observed. Only an interviewee from the 5th quintile from the OA group employed two
strategies. All of the participants from both DT and control groups computed this
mentally using one strategy. Two interviewees (i.e., 1 from the 1st and 1 from the 2nd
quintiles) did not provide any strategies. It is apparent from this table that the rule-based
strategy Using inverse multiplication (7 × 8 = 56) (French, 2005) was the most common
response used by the interviewees from 2nd to 5th quintiles. In particular, the differences
between interviewees in the upper quintiles and lower quintiles were highlighted in the
OA group. The interviewees in the middle and upper quintiles tended to use the rule-
based strategies Basic fact and Using multiplication and addition, while the interviewees

288
in the lower quintiles were more likely to employ the IDK responses. The rule-based
strategy Using pattern (7 × 7 = 49, 7 × 8 = 56) was also observed in the middle and
lower quintiles (i.e., 2nd quintile in the DT group and 2nd and 3rd quintiles in the control
group). Using pattern, namely, Increase or decrease once (French, 2005) is the strategy
that students use to compute a product based on other familiar facts, such as 7 × 7 =
49, 7 × 8 = 56, which can be memorized easily. In contrast, IDK responses were shown
for the lower quintiles in the OA group.
When interviewing for the item 80 ÷ 16, in total, 13 responses for the DT group,
18 for the OA group, and 9 for the control group were identified. Only one interviewee
from 5th quintile in the DT group and three interviewees from the 5th quintile computed it
using two different strategies. Three interviewees (i.e., 1 each for 2nd, 3rd, and 4th
quintiles) from the DT group, three interviewees (i.e., 1 from 1st and 2 from 2nd
quintiles) from the OA group, and two interviewees (i.e., 1 from 2nd and 1 from 3rd
quintiles) from the control group failed to describe any strategies. Others provided only
one strategy. In terms of strategy use, the rule-based strategy Using inverse
multiplication (16 × 5 = 80) was the most common response employed in the upper
quintiles with higher accuracy. These results are in agreement with French’s (2005)
findings which showed the relationship that divisions are calculated based on the
multiplication. Also, the rule-based strategies Using fraction (e.g., 80/16 =5), and
Traditional method were used in the middle and upper quintiles for all of the three
groups. In terms of accuracy, even though the OA group employed Traditional method
more often than other groups, the interviewees in the OA group produced all correct
solutions.
289
In the last division item 468 ÷ 18, as predicted, fewer responses (i.e., 3 from the
DT group, 15 from the OA group, and 9 from the control group) were observed. Only
one interviewee from the 5th quintile in the OA group used two different strategies. Six
interviewees (i.e., 2 each from the 2nd, 3rd, and 4th quintiles) in the DT group, nine
interviewees (i.e., 1 from the 1st, 2 from the 2nd, 5 from the 3rd, and 1 from the 5th
quintiles), and six interviewees (i.e., 2 from the 2nd, 3 from the 3rd, and 1 from the 4th
quintiles) were not able to offer any strategies. Surprisingly, even upper quintile
interviewees were not able to compute this item mentally. With respect to the use of
strategy, the rule-based strategies Using inverse multiplication, Using fraction, and
Traditional method and the number-sense strategy Chunking method were frequently
employed by the interviewees from the upper quintiles with 100% accuracy. Those who
used The Traditional method in the lower and middle quintiles in the DT group gave
higher incorrect responses. IDK response was observed in the OA group, regardless of
the levels of the quintiles and was highly used in the control group.
Overall, these results indicate that a majority of the interviewees used the
strategy Using inverse multiplication when computing 56 ÷ 7 and 80 ÷ 16 with higher
accuracy. This indicates that “multiplication and division are two complementary
mathematical operations” and “multiplication and division facts are represented together
in memory” (Lemonidis, 2016, p. 131). These results are in line with those of previous
studies (LeFevre & Morris, 1999; Robinson, Arbuthnott & Gibbons, 2002). Those
research studies found that adults were more likely to rely on retrieval when solving
simple division problems. In other words, they retrieved corresponding multiplication 7 ×
8 = 56 to find 8 and used the inverse multiplication strategy. This finding is contrary to

290
previous studies (Robinson, Arbuthnott, Rose, McCarron, Globa, & Phonexay, 2015)
which have suggested that more students used the strategy Direct retrieval in solving
addition, subtraction, and multiplication problems as the grade level increased.
However, for the division operation, the percentages of using this strategy was low and
did not increase in higher grades. In line with this, when the participants were operating
on large numbers 468 ÷ 18 mentally, only one response of the strategy Using inverse
multiplication (e.g., Direct Retrieval) was observed by the interviewee from the 5th
quintile in the OA group. The others did not rely on the direct retrieval strategy Using
inverse multiplication. Many computational errors and IDK responses were observed,
regardless of levels of quintiles. An important aspect of this study is that many of the
number fact strategies were employed by the interviewees for the DT and OA groups
when computing addition, subtraction, and multiplication operations. On the other hand,
the rule-based strategies were heavily used by the interviewees for the DT and OA
groups in computing division operations. Here, those who used number-sense
strategies or one number-sense and one rule-based strategy in more than one way and
gave correct responses could be categorized accurate and flexible learners. If the
interviewees provided only rule-based strategies with higher accuracy, they could be
categorized as accurate and not flexible learners. Similarly, those who used one
strategy with lower accuracy appear to be inaccurate and not flexible learners.
Accordingly, those who did not provide any strategy could be considered as inaccurate
and inflexible learners.
In light of the above, these results suggest that there is an association between
each interviewee’s levels of quintiles and their flexibility in the use of the mental

291
computation strategies with whole numbers. As a result of PTS’ mental computation
performance on the whole number operations, they were identified as accurate and
flexible, accurate and not flexible, inaccurate and flexible, and inaccurate and not
flexible (Heirdsfield, 2000, 2002; Heirdsfield & Cooper, 2004). This study adopted those
terms to identify PTS’ flexibility with whole number operations. In terms of frequency of
strategies with whole number operations, generally, the interviewees in the middle and
upper quintiles in both DT and OA used more than two different strategies with higher
accuracy. The rule-based strategy of mental image of the Traditional method was
frequently observed in the OA group. Those who used this method with higher
accuracy, mostly in the upper quintiles, could be categorized as accurate and inflexible
learners. In contrast, the lower quintiles did not provide any alternative strategies for
both groups. The interviewees in the control group offered the least range of strategy.
Regarding the whole number operation strategies, the results revealed that interviewees
in the middle and upper quintiles for the DT and OA groups were more likely to use the
strategies that reflect efficient number fact or number-sense (e.g., Adding by place,
Decomposing, & Compensation) and showed relatively higher accuracy. They could be
categorized as accurate and flexible learners. The interviewees for both groups in the
lower quintiles appeared to use the Traditional method with poor accuracy, inaccurate
and not flexible. Interestingly, the upper quintiles interviewees in the OA group tend to
frequently employ the Traditional method as their alternative methods. These could be
accurate and inflexible learners. Inaccurate and flexible leaners could be found in the 3rd
quintiles in the DT group, specifically, in computing addition, subtraction, multiplication
items. Some of them provide more than two different strategies but with lower accuracy.

292
Apparently, the participants in the control group were reluctant to provide any alternative
strategies. In computing whole number operations, when computing division operations,
the interviewees for both DT and OA group demonstrated many computational errors
and IDK responses, regardless of levels of quintiles. They were also considered as
inaccurate and not flexible learners.
In the integer operation, the interviewees were asked to compute the
items: 25×4×0
4, -13 – (-37) + 20, and 24 × 4 ÷ (- 6). For the item
25×4×0
4, almost all of the
interviewees provide only one strategy except for one interviewee from the 1st quintile in
the OA group who did not provide any strategies. This is because they recalled the fact
that zero divided by any non zero number should be zero. When asked what strategy
they used, almost all of the interviewees responded that this was the basic fact problem
which is “zero divided by any number is zero”. The interviewees in the upper quintiles
clearly recalled the fact, while those in the lower and middle quintiles made frequent
errors. Surprisingly, all of the interviewees in the control were correctly computed the
problem without any errors.
In the integer item involving addition and subtraction 13 – (-37) + 20, the
interviewees offered 13 responses from the DT group, 22 from the OA group, and 11
from the control group. One interviewee from the 5th quintile in the DT group, seven
interviewees (i.e., 2 from the 3rd, 2 from the 4th, and 4 from the 5th quintiles) in the OA
group, and two interviewees (i.e., 1 from the 3rd and1 from the 4th quintiles) from the
control group provide two strategies. The 1st quintile interviewee in the OA group and
the 2nd quintile interviewee in the control group were not able to provide any strategies.
The remaining interviewees provide only one strategy. In terms of the use of integer
293
strategies, almost all of the participants were aware of the fact that if the signs of the
numbers are the same, the answer should be positive or if the signs of the numbers are
different, the answer should be negative. Thus, only rule-based strategy Converting a
double negative to a positive was found. When asked an alternative strategy,
interviewees just rearranged numbers in another way. Higher accuracy was found in the
upper quintiles for both DT and OA groups. The IDK responses were observed by the
interviewees in the lower quintiles for both OA and control groups.
In the integer item involving multiplication and division 24 × 4 ÷ (-6), a narrow
variety of strategies applied (i.e., 13 responses for the DT group, 17 for the OA group,
and 9 in the control group). Unlike integer addition and subtraction item 13 – ( -37) + 20,
less alternative responses and no responses were often observed. It was observed that
this was because of their lack of ability to compute division operation mentally. When
asked any alternative strategies, like integer addition and subtraction item, they were
more likely to compute it by rearranging numbers. IDK responses were often found by
the interviewees in the middle and lower quintiles for the OA and control groups.
Computational errors were mostly shown in the middle and lower quintiles for both DT
and OA groups.
In sum, these findings may help us to identify a lack of PTS’ conceptual
understanding regarding the integer operations involving zero. No number-sense
strategies for all of the groups were observed. To make it worse, although they already
know the integer rules, they were not able to compute it because of their lack of mental
computation ability in the division operation. Generally, it can be inferred that a majority
of interviewees in the upper quintiles appeared to be accurate and inflexible learners.

294
On the contrary, those who were in the middle and lower quintiles were more likely to be
inaccurate and not flexible learners.
When interviewing for fraction operations 2/3 × 18, 4½ + 1¾, and 1/3 × 41/5,
interviewees were asked to compute mentally. For the item 2/3 × 18, compared to other
easy difficulty level items, fewer responses (i.e., 13 responses from the DT group, 18 in
the OA group, and 9 in the control group ) were observed by interviewees in all groups.
One interviewee from the 3rd quintile, three 5th quintile interviewees in the OA group,
and one 4th quintile interviewee in the control group provided two different strategies.
Three interviewees (i.e., 2 for the 2nd and 1 for the 3rd quintiles) from the DT group, two
interviewees (i.e., 1 for the 2nd and 1 for the 1st quintiles), and three interviewees (i.e., 2
from the 2nd and 1 from the 3rd quintiles) did not offer any strategies. The majority of
interviewees from all quintiles in the DT successfully computed this item mentally with
100% accuracy using rule-based strategies (Yang, 2005, 2007) such as Converting the
whole number to fraction and multiplying fractions together and Reducing. Likewise,
most of the interviewees from the middle and upper quintiles in the OA group used
similar strategies like the DT group (Accurate and inflexible learners), except for the
number-sense or self-developed strategy (Drawing) shown in the 5th quintile with higher
accuracy. Incorrect computations (i.e., 3 × 18 = 54, 54 + 2 = 56 or (2 × 54)/3) were often
observed in the lower quintiles (i.e.,1 each from 2nd and 3rd quintiles for the DT group, 1
form 4th quintile for the OA group, and 1 from 2nd quintile for the control group). IDK
response was found mostly in the lower quintiles for all groups (inaccurate and inflexible
learners).
295
In the results of fraction item 4½ + 1¾, the researcher examined 13 responses
from the DT group, 19 from the OA group, and 9 from the control group. A few
interviewees (i.e., 1 from the 5th quintile in the DT group and 4 from the 5th quintile in the
OA group) computed this item using two strategies. Most of the 2nd, 3rd, and 4th quintile
interviewees for each group computed it using only one strategy. Two 2nd quintile
interviewees in the DT group, one interviewee from the OA group, the control group did
not offer any alternative strategies. A wider variety of strategies for this item were found.
In the DT group, both rule-based strategy Making the same denominator and number-
sense strategies such as Converting fraction to decimal and Converting fraction to
money were commonly used by the interviewees in the middle and upper quintiles. It is
interesting to note that rule-based strategy Making the same denominator was found in
all quintiles in the OA group. Additionally, number-sense strategies such as Converting
fraction to decimal and Drawing were observed by the interviewees in the middle and
upper quintiles in the OA group. For the control group, only one 3rd quintile interviewee
used number-sense strategy Converting fraction to decimal and the others used rule-
based strategies. Incorrect responses and IDK responses were found by the
interviewees in the lower quintiles for all of the groups. One interesting finding is that the
participants from the 3rd quintile showed a wide variety of strategies than other quintiles.
Accuracy was considerably higher in all groups when strategies other than Incorrect
computation and IDK responses were employed.
In the mental fraction multiplication item 1/3 × 41/5, in total, fewer strategies (e.g.,
13 responses for the DT group, 15 for the OA group, and 9 for the control group) were
examined. Only the 4th quintile interviewee in the DT group was able to provide two

296
different strategies. Six interviewees (i.e., 2 from the 5th, 3 from the 3rd, and 1 from the
2nd quintiles) in the DT group, twelve interviewees (i.e., 4 form the 5th, 2 from the 4th, 5
from the 3rd, and 1 from the 2nd quintiles) in the OA group and six interviewees (i.e., 2
from the 4th, 1 from the 3rd, and 3 from the 2nd quintiles) in the control group provided
one strategy. Others were reluctant to offer any alternative strategies. The interviewees
in all groups used a wider variety of rule-based strategies: Making improper fraction
(e.g., 1
3 × 4
1
5=
1
3 ×
21
5=
21
15=
7
5), Making improper fraction and Reducing (i.e.,
1
3 1 ×
21 7
5=
7
5 ), and Using reciprocal multiplication (e.g., ? × 3 = 4.2), except for one fourth quintile
interviewee (i.e., Converting fraction to decimal) in the DT group. The most striking
result to emerge from this table for the OA group was that Making improper fraction was
the only commonly employed strategy by the interviewees, although they demonstrated
more varied strategies during the intervention. Like other computations, Incorrect
computation and IDK responses were observed by the interviewees in the lower and
middle quintiles.
Overall, these results indicate that the interviewees in the DT and OA groups
were more likely to employ the rule-based strategies that are linked to more procedural
knowledge when computing fraction mental multiplication computations; however, more
number-sense strategies that are connected to deep conceptual understanding were
found when adding the whole number fraction item mentally, specifically, more
observations were found in the DT group. In other words, those who showed the
number-sense strategies with more than one way with 100% accuracy appeared to be
accurate and flexible learners. However, those who showed only rule-based strategy in
two different ways with higher accuracy were more likely to be considered as accurate

297
and inflexible learners. In addition to this, the interviewees showed a wider variety of
strategies and confidently implemented their strategies to the fraction addition item to
achieve a correct solution; however, they showed less variety in computing fraction
multiplication operations, indicating a higher rate of IDK response and Incorrect
computation. These results are in agreement with Callingham and Watson’s (2004)
findings which showed that multiplication and division with rational numbers are more
difficult for students in grades 3 to 10 than addition and subtraction operations. Our PTS
showed the same results.
In the decimal operation, the interviewees were asked to describe their strategies
when computing the three items: 5.8 + 2.6, 100 × 0.05 ÷ 1000, and 0.2 × 75. The results
of the item 5.8 + 2.6 revealed that there were a large number of responses (i.e., 21
responses from the DT group, 21 from the OA group, and 11 from the control group).
Generally, the interviewees in the DT group employed a wide variety of strategies. Two
interviewees (i.e., 1 from the 3rd and 1 from the 5th quintiles) in the DT group used three
different strategies. Five interviewees (i.e., 3 from the 3rd, 1 from the 4th, and 1 from the
5th quintiles) in the DT group, six interviewees (i.e., 2 from the 3rd and 4 from the 5th
quintiles) in the OA group, and two interviewees (i.e., 1 from the 3rd and 1 from the 4th
quintiles) in the control group employed two different strategies. Five (i.e., 3 from the
2nd, 1 from the 3rd, and 1 from the 4th quintiles) in the DT group, seven (i.e., 2 from the
2nd, 2 from the 3rd, 2 from the 4th, and 1 from the 5th quintiles) in the OA group, and
seven interviewees (i.e., 4 from the 2nd, 2 from the 3rd, and 1 from the 4th quintiles) used
one strategy. No strategy (e i.e., 1 from the 3rd and 1 from the 5th quintiles) was only
found in the OA group. When implementing the strategies, for the DT group, both rule-
298
based strategies (i.e., Adding by place and Traditional method) were frequently found in
all quintiles. Also, number-sense strategies (i.e., Converting decimal to fraction, Adding
up, and Decomposing) were observed in the 3rd and 5th quintiles. For the OA group, a
majority of interviewees employed the rule-based strategies (i.e., Adding by place,
Ignoring decimal point, adding the numbers, and placing decimal point, and Traditional
method). Accordingly, the rule-based strategies (i.e., Traditional method and Adding by
place) were frequently observed in all quintiles. Higher accuracy was found in all
groups, except for two 3rd quintile interviewees using the Traditional method in the OA
group.
When interviewing for the item 100 × 0.05 ÷ 1000, 13 responses for the DT
group, 20 for the OA group, and 10 for the control group were found. Two interviewees
(i.e., 1 from the 3rd and1 from the 5th quintiles) in the DT group, five interviewees (i.e., 1
from the 4th and 4 from the 5th quintiles) in the OA group, a 4th quintile interviewee used
two different strategies. Four interviewees (i.e., 2 from the 2nd and 2 from the 4th
quintiles) in the DT group, four interviewees (i.e., 1 from the 1st, 1 from the 2nd, and 2
from the 3rd quintiles) in the OA group, and three interviewees (i.e., 1 each from the 2nd,
3rd, and 4th quintiles) did not offer any strategies. Others provide one strategy. The most
common strategy employed by the interviewees in all groups was the rule-based
strategy Multiplying or dividing decimal number by multiples or powers of 10. When
asked if they have alternative strategies, a majority of 5th quintile interviewees in the OA
group confidently responded to this using two strategies by rearranging the
multiplication or division order. The use of the different order of this item was considered
as their alternative strategy and was included it under the strategy Multiplying or dividing
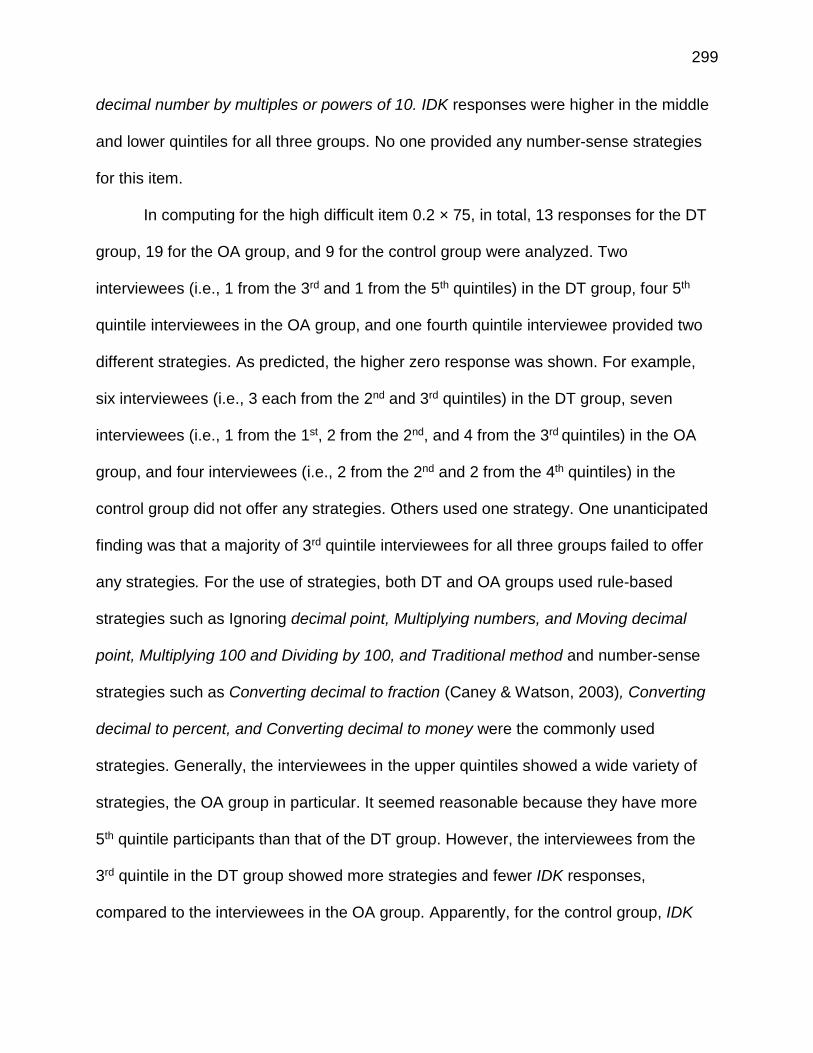
299
decimal number by multiples or powers of 10. IDK responses were higher in the middle
and lower quintiles for all three groups. No one provided any number-sense strategies
for this item.
In computing for the high difficult item 0.2 × 75, in total, 13 responses for the DT
group, 19 for the OA group, and 9 for the control group were analyzed. Two
interviewees (i.e., 1 from the 3rd and 1 from the 5th quintiles) in the DT group, four 5th
quintile interviewees in the OA group, and one fourth quintile interviewee provided two
different strategies. As predicted, the higher zero response was shown. For example,
six interviewees (i.e., 3 each from the 2nd and 3rd quintiles) in the DT group, seven
interviewees (i.e., 1 from the 1st, 2 from the 2nd, and 4 from the 3rd quintiles) in the OA
group, and four interviewees (i.e., 2 from the 2nd and 2 from the 4th quintiles) in the
control group did not offer any strategies. Others used one strategy. One unanticipated
finding was that a majority of 3rd quintile interviewees for all three groups failed to offer
any strategies. For the use of strategies, both DT and OA groups used rule-based
strategies such as Ignoring decimal point, Multiplying numbers, and Moving decimal
point, Multiplying 100 and Dividing by 100, and Traditional method and number-sense
strategies such as Converting decimal to fraction (Caney & Watson, 2003), Converting
decimal to percent, and Converting decimal to money were the commonly used
strategies. Generally, the interviewees in the upper quintiles showed a wide variety of
strategies, the OA group in particular. It seemed reasonable because they have more
5th quintile participants than that of the DT group. However, the interviewees from the
3rd quintile in the DT group showed more strategies and fewer IDK responses,
compared to the interviewees in the OA group. Apparently, for the control group, IDK

300
response, Traditional method, and Incorrect computation were frequently observed in all
quintiles.
These results suggest that in computing decimal addition operation items, a wide
range of strategies were observed with 100% accuracy. The DT group showed more
number-sense strategies, but interviewees in the OA group relied heavily on the rule-
based strategies. In computing fraction multiplication and division operations, both DT
and OA group considerably used the rule-based strategy, specifically, on the item 100 ×
0.05 ÷ 1000. It is not surprising since they have obtained their knowledge of rational
numbers by written computations based on standard algorithms. These results are
consistent with those of Yang et al. (2009) who found that PTS in Taiwan were more
likely to apply rule-based methods and were dependent deeply on standard written
algorithms. Accordingly, for this study, when computing decimal addition operations,
more accurate and flexible learners were observed from the middle and upper quintiles
in the DT group. By contrast, more accurate and inflexible learners were observed in the
upper quintiles the OA group. In computing decimal operation item involving
multiplication 0.2 × 75, both DT and OA showed fewer varieties of strategies with less
accuracy. The only rule-based strategy was observed in the decimal item involving
decimal division operation. Thus, when computing decimal multiplication and division
operations mentally, more number-sense strategies should be introduced to enhance
students’ conceptual understanding.
Lastly, in the fraction operation, the three difficulty level items 1% of 175, 75% ×
120, and 38% × 60 were introduced. In terms of computing 1% of 175 mentally, a
narrow range of strategies (i.e., 15 responses for the DT group, 19 for the OA group,

301
and 9 for the control group) were observed, compared to other low difficulty level items.
Three interviewees (i.e., 1 from the 3rd and 2 from the 5th quintiles) in the DT group and
four 5th quintile interviewees in the OA group computed this using two different
strategies. No one provided an alternative strategy for the control group. Four
interviewees (i.e., 2 form the 4th, 1 from the 3rd, and 1 from the 2nd quintiles), six
interviewees (i.e., 1 from the 5th, 2 from the 4th, and 3 from the 3rd quintiles), and five
interviewees (i.e., 2 from the 4th, 1 from the 3rd, and 2 from the 2nd quintiles) gave one
strategy. Others were not able to give any strategies. In the use of strategy, both the
number-sense strategy Converting percent to decimal and the rule-based strategy
Converting percent to fraction were used by all three groups. It was clearly shown that
interviewees in the upper quintiles in all groups were more likely to give alternative
strategies; however, more IDK responses were observed in the lower and middles
quintiles. Relatively higher accuracy was found in all three groups.
In the percent item 75% × 120, in total, 13 responses for the DT group, 19 for the
OA group, and 9 for the control group were identified. A majority of 5th quintile
interviewees in the DT and OA groups showed two different strategies. In contrast, no
one used two strategies in the control group. There was a number of interviewees who
did not describe any strategies in the DT group (i.e., 3 from the 2nd and 2 from the 3rd
quintiles) and the OA group (i.e., 1 from the 1st, 2 from the 2nd, 4 from the 3rd, and 1 from
the 4th quintiles). A majority of interviewees in the control group were reluctant to
describe any strategies. In implementing strategies, the rule-based strategies
Converting percent to fraction, Converting percent to fraction and Reducing (i.e., 75
100 ×
120 = 75 × 1.2 = 90), and Using multiplication, then moving two decimal point to the left

302
were heavily used by interviewees in the 5th quintile interviewees for the DT and OA
groups. Several interviewees in the 3rd and 4th quintile interviewees applied the number-
sense strategy (i.e., Converting percent to decimal). On the contrary, the number-sense
strategy Using multiples of 30 (i.e., 30, 60, 90, 120 – 90 is the ¾ of 120) were observed
by the 5th quintile interviewees in the OA group. IDK responses were observed in the 2nd
and 3rd quintiles for the DT group and from 1st to the 4th quintiles for the OA group.
Highest IDK response (6 out of 9) were observed in the control group. According to
these data, we can infer that those who aware of the fact that 75% is equal to 3/4 were
more likely to use number-sense strategies with higher accuracy. These findings
indicate that PTS’ frequency of strategy use was very limited although their accuracy
remains high. The rule-based strategies were frequently observed for the DT and OA
groups with higher accuracy.
When interviewing for the high difficulty level item 38% × 60, a majority of the
interviewees for all three group were relcutant to describe any alternative strategies,
specifically, ten interviewees (i.e., 3 from the 2nd, 5 from the 3rd, and 2 from the 4th
quintiles) in the DT group, nine interviewees (i.e., 1 from the 1st , 2 from the 2nd, 5 from
the 3rd, and1 from the 4th quintiles) in the OA group, and six interviewees (i.e., 3 from the
2nd and 3 from the 3rd quintiles) in the control group were unsuccessfully describe any
strategies. Two strategies were observed by the 5th quintile interviewee in the DT group,
three 5th quintiles interviewees in the OA group with higher accuracy. No one described
two strategies for the control group. A wide range of rule-based strategies such as
Converting percent to fraction, Multiplying whole numbers and moving decimal points
and number-sense strategies such as Using composition of 10% or 1% and Using
303
known fact (only the OA groups) were mostly used by the interviewees in the 5th quintile
for the DT and OA groups. Higher IDK responses among all groups were observed.
In general, therefore, it seems that interviewees in the upper quintiles for both DT
and OA groups were more likely to employ the rule-based strategies when computing
percent operations mentally. Those who used more than one strategy with 100%
accuracy appears to be accurate and flexible learners. No flexible learners were shown
in the control group. IDK response was considerably shown in the middle and lower
quintiles for all groups. These findings indicate that PTS in our study showed not only a
limited understanding of mental computation with the percent operations but also
content knowledge of percent operations. There is considerable evidence that PTS
faced many difficulties in computing integer and rational number operations, including
fraction, decimal, and percent mentally, compared to whole numbers. These research
results support previous research (Caney & Watson, 2003; Stacey & Steinle, 1998;
Watson, Campbell, & Collis, 1993; Watson, Collis, & Campbell, 1995) that found the
difficulties in operating with rational numbers.
Taken together, these results provide important insights into the relationship
between each interviewee’s quintile levels and their flexibility in the use of the mental
computation strategies with integer and rational numbers. In the frequency of different
strategies on the integer and rational operations, generally, interviewees for both DT
and OA groups showed a very narrow range of strategies, compared with the whole
number operations. More specifically, a majority of middle and upper quintile
interviewees provide more than one different strategy. By contrast, most of the lower
quintile interviewees gave one strategy or did not provide any strategies. Obviously, the

304
control group was very reluctant to provide any alternative strategies. The range of
strategies for mental computation with the integer and rational number operations
described in the interviews was quite narrow as well, compared to the whole number
operations. For both DT and OA groups, interviewees in the middle and upper quintiles
showed a variety of mental computation strategies with integer and rational numbers
with relatively higher accuracy (accurate and flexible learners). However, most of the
strategies they employed were rule-based strategies (Yang, 2005, 2007), in other
words, teacher-taught methods that reflected rules and procedures of steps. Among
groups, the interviewees in the DT group showed strategies that focused more on
conceptual understanding. In opposition to this, the interviewees in the OA group were
more likely to apply teacher-taught methods, including the Traditional method. These
results were not very encouraging. During the intervention, a wider range of number-
sense (Yang, 2005, 2007) or self-developed strategies using drawings and
representations were easily observed so those strategies were expected to be used
when they took the post-MCT. The post-interview showed the contradictory results for
the OA groups. It can, therefore, be assumed that although short periods of intervention
affect PTS’ performance of mental computation test, the most popular mental
computation strategy for interviewees in the OA group described here reflected a mental
image of the Traditional method, regardless of levels of quintiles.
Limitations of the Study
The current research has several limitations. First, this study used a quasi-
experimental and nonequivalent control group design. Since the participants in this
305
study were not randomly assigned, the existing differences between the nonequivalent
groups could have had an impact on the findings. Also, the participants may not
represent all populations, so conclusions drawn from such a sample may not reflect the
views of all PTS living in the USA, but it may help other researchers to understand
relationships that may exist in this study.
Second, it is difficult to generalize the findings of the study because of the small
sample size. In this study, 50 PTS before intervention and 40 PTS after intervention
participated. Large sample sizes would be more representative of populations.
Third, since the researcher used a sample of convenience, some of the PTS
during intervention sessions were absent, and this may affect their post-MCT
performance. In other words, their performance of post-MCT was generally worse than
other PTS who had perfect attendance.
Fourth, the validity of instruments such as pre-and post- attitudinal survey
questionnaires and pre-and post-MCT may not represent the actual construct because
the researcher created the instrument that was reliable; however, the evidence of
instrumental validity was not thoroughly examined except for the content validity
examined by three mathematics experts. Therefore, it is difficult to rely on the statistics
results to interpret the findings even though descriptive analysis and interviews are
supporting the effectiveness of the intervention sessions.
Fifth, eleven 50 minutes intervention sessions were provided (including test
sessions) and those were maybe not enough time for PTS to practice mental
computation strategies using multiple solution methods. If more instructional time was

306
allowed for PTS, the performance differences among groups might have been
considerably different from the current results.
Sixth, the name of each strategy may be different from other studies. For
example, the researcher named Basic fact as the participants stated during interviews.
For example, when asked computing 12 × 4 mentally and what strategy they used, they
directly answered 48 and responded that it is basic multiplication fact problem. Thus,
the researcher codified this strategy as basic fact strategy. Some studies named the
same strategy as Direct Retrieval or the Derived Product (Lemonidis, 2016) and Derived
Fact Strategies (Heirdsfield, 2000, 2002; Heirdsfield & Cooper, 2004).
Seventh, there is a potential danger in making pre-and post-test problems differ
only by changing the numbers. Depending on how the intervention was done, some
bright students could still be operating procedurally though they might look as if they
have deeper knowledge because they know the right words to say.
Eighth, during intervention, more time was spent on whole number operations in
comparison to fraction, decimals, and percentages. This could have influenced the
outcomes of the study.
Lastly, in this study, the interviews revealed the maximum number of strategies
to be three. The researcher determined those participants who provided more than one
strategy, using either number-sense strategies or using both number-sense and rule-
based strategies, to be flexible learners. It might be different in other studies.
Implications for Mathematics Education
Three are seven major implications for mathematics education. First, this study
307
found that after the intervention, PTS were more likely to implement written computation
in their mathematics teaching rather than to incorporate mental computation. Also, they
showed more anxiety when computing mental computation problems after intervention.
That may be due to the fact that their teaching and learning strategies are influenced by
their previous learning experiences. Therefore, it is imperative for both mathematics
educators to provide PTS with more opportunities to develop their mental computation
knowledge and related mathematics skills in order to prepare teaching strategies that
focus more on enhancing their conceptual understanding along with their procedural
fluency. More specifically, in teaching rational numbers, it is vital for mathematics
educators to connect rule-based strategies (i.e., converting to fractions with the same
denominator) with number-sense strategies (i.e., use of number line or a piece of pizza
as a mental representation).
Second, for this study, the results revealed that the intervention produced
substantial gains in multiplication of whole numbers, fractions, and decimals. According
to Lortie-Forgues and Siegler (2015), the research has considerably been focused on
the understanding of fractions (e.g., understanding whether 4/5 is larger than 5/9) and
decimals, not the arithmetic of operations on fractions and decimals. To gain a deeper
understanding of arithmetic operations, it might be useful to apply mental computation
strategies in multiple ways. Understanding compatible or equivalent numbers will help
both preservice and inservice teachers to enhance their students’ understanding of
arithmetic operations.
Third, in this study, PTS in all groups performed worse in computing whole
numbers, more specifically, multiplication and division operations, as well as rational
308
numbers involving multiplication and division operations. Callingham and Watson’s
(2004) study found that rational numbers involving multiplication and division operations
were commonly more difficult for students than addition and subtraction. In line with this,
previous studies (Khoury & Zazkis, 1994; Lemonidis, 2016; Kermeli & Palaigeorgiou,
2014) highlighted students’ lack of knowledge in the mathematical content of mental
computation with rational numbers. It is obvious that our PTS have weaknesses in their
knowledge of mental computation involving multiplication and division whole number
operations and rational numbers with multiplication and division. Therefore, it is crucial
for teacher education programs to enhance PTS’ content knowledge of mental
computation with those operations.
Fourth, in this study, PTS made many computational errors when they employed
the mental image of the Traditional method. These results seem to be consistent with
other research (Heirdsfield & Cooper, 2004; Murphy, 2004; Reys et al., 1995) which
found that the Traditional method (e.g., pen and paper algorithm) was shown as an
inefficient strategy, producing problems in computation. A possible explanation for this
might be that PTS in this study focused more on remembering the traditional algorithm
steps rather than an understanding of the algorithms. In this regard, research
(Heirdsfield & Cooper, 1996; Reys et al., 1995) suggested that teachers should provide
children with enough time to create their own mental computation strategies that help
them improve their understanding of algorithms before the teaching of written
algorithms. According to them, children already had an ability to create a variety of
mental computation strategies. If children are first introduced to the written algorithm,
they are more likely to use the written algorithm taught by their teacher. Most

309
importantly, Kamii and Dominick (1997) emphasized that teaching written algorithms
first discourages children from developing number sense and their own thinking and
operating on numbers from left to right.
Fifth, compatible or equivalent numbers (e.g., 1/5 = 0.2 = 20%) should be taught
in developing mental computation with rational number operations. In this study, the
interviewees who knew the equivalence concepts were more likely to provide alternative
strategies that were showing their understanding of rational number operations. In this
regard, PTS should first understand the equivalence concepts, then focus on operating
with rational numbers. This helps them to use their knowledge of equivalence with
rational numbers to derive their algorithms that are conceptually understood.
Sixth, although there was increased emphasis on explicit instruction of mental
computation strategies, the use of informal strategies, and the development of mental
computation prior to the teaching of standard written algorithms (Murphy, 2003), the
PTS in this study clearly revealed that a majority of the interviewees employed the rule-
based strategies that reflected a limited understanding of mental computation. These
results are not surprising because it may be explained by the fact that mental
computation with both whole and rational numbers are not included in the mathematics
curricula or textbooks used in the U.S.A (Lemonidis, 2016). Therefore, teachers should
be able to balance the amount of time that is spent teaching rules and procedures with
the time that is spent in having students develop their own strategies.
Lastly, the findings of this study are somewhat counterintuitive. In the last several
decades, significant empirical research on mental computation with whole numbers,
integers, and rational numbers had been published throughout the world. Although

310
NCTM (2000) has emphasized the importance of mental computation to develop
students’ flexibility in computing numbers, in reality, few empirical studies on mental
computation practices are implemented in the U.S.A. mathematics classrooms,
compared to other countries (i.e., Australia, Europe and Asian countries). These
findings were not very encouraging. The results of students’ performance on Number
and Operations, one of the common standards for young children in the U.S.A,
developing their computational skills would be much improved if they have flexibility in
choosing their strategy that fits the problem to compute mentally. To do this, teacher
education programs should place more emphasis on mental computation knowledge in
a practical way and add this to the curriculum in the mathematics methods courses.
Recommendations for Future Study
There are several directions in which the researcher would like to proceed in
future research on mental computation with whole numbers, integers, and rational
number operations. This study found a limited range in number of strategies among
PTS interviewed. There may be more productive results if different test items or a
different interview approach in stimulating different strategies is used. In this regard,
mental computation is currently used in every culture by students (e.g., Reys et al.,
1995, McIntosh et al., 1995, 1997; Yang, 2005; Yang & Huang, 2014), but few studies
comparing PTS’ performance on mental computation have been done across cultures.
There are similarities and difference in the strategies used by PTS across cultures.
Therefore, a cross-cultural study of mental computation strategies employed by the PTS
would be a productive direction for further study.

311
Second, this study examined the PTS’ mental computation performance and
strategies used in using different teaching methods (i.e., Direct Teaching and Open-
Approach). There were several differences revealed among groups, but no statistically
significant differences. Thus, future research regarding the use of the same teaching
methods will greatly contribute to see consistency of mental computation performance
within the same grade levels.
Third, this study found that PTS demonstrated their mental strategies using two
different strategies or more were classified as flexible learners. In this regard, more
empirical studies focusing on PTS’ mental computation knowledge should be conducted
to compare the findings of this study.
Fifth, this study compared pre-and post-MCT performance scores to examine
what operation has a marked difference in performance. The results revealed that there
is significant difference in the operations of multiplication, fractions, and decimals. The
effect size of those operations was quite large. Whole number subtraction, integer and
percent operations also showed a large effect size (i.e., .32, .44, and .40, respectively),
although it showed no significant difference among groups. Thus, it will be necessary for
researchers to conduct power analysis to determine minimal sample sizes for studies.
Fifth, it is surprising how little research has been done to examine mental
computation with rational numbers, specifically, percent operations. NCTM (2000)
emphasized the importance of mental computation with percent operations “because
they are useful in deepening students’ understanding of rational numbers and helping
them think flexibly about these numbers” (pp. 220-221). This study found two of the
most recent published articles related to the percent operations (Gay & Aichele 1997;

312
Lembke & Reys 1994). A majority of data cited in the articles were mostly from
dissertations, unpublished manuscripts, and conference proceedings (Lemonidis, 2016).
More research is needed to evaluate the quality of research and findings. In addition,
the research has indicated that percent operations are one of the difficult topics for
middle school students to understand (Gay & Aichele, 1997). The lack of published
articles on mental computation with percent operations makes it difficult to identify
students’ conceptual understanding of rational numbers. Thus, more empirical studis
regarding mental computation with the percent operations should be conducted for
students and teachers, including PTS.
313
REFERENCES
Anghileri, J., & Beishuizen, M. (1998). Counting, chunking and the division
algorithm. Mathematics in School, 27(1), 2-4.
Ball, D. L. (1990a). The mathematical understandings that prospective teachers bring to
teacher education. The Elementary School Journal, 90(4), 449-466.
Ball, D. L., Thames, M. H. & Phelps, G. (2008). Content knowledge for teaching: What
makes it special? Journal of Teacher Education, 59, 389-407.
Becker, J. P. (1986). Ancient Hindu methods of computation for today’s classroom (part
I); The Illinois Mathematics Teachers, 37 (2), 2-8; Part II: The Illinois
Mathematics Teacher, 37 (3), 37-44.
Becker, J. P., & Epstein, J. (2007). The 'Open Approach' to Teaching School
Mathematics. Journal of the Korea Society of Mathematical Education Series D,
10(3), 151-167.
Becker, J. P., & Shimada, S. (1997). The open-ended approach: a new proposal for
teaching mathematics. Reston, VA: National Council of Teachers of
Mathematics.
Bharati Krishna, T. (1965). Vedic mathematics, or sixteen simple mathematical formulae
from the Vedas (for one-line answers to all mathematical problems). [Varanasi,
Hindu Vishvavidyalaya Sanskrit Publication Board, Banaras Hindu University]
Bekdemir, M. (2010). The pre-service teachers' mathematics anxiety related to depth of
negative experiences in mathematics classroom while they were students.
Educational Studies in Mathematics, 75(3), 311-328.

314
Beishuizen, M., & Anghileri, J. (1998). Which mental strategies in the early number
curriculum? A comparison of British ideas and Dutch views. British Educational
Research Journal, 24(5), 519-538.
Berwick, K. (2006). Changes in preservie teachers’ attitude and beliefs: The net impact
of two mathematics education units and intervening experiences. School Science
and Mathematics, 106(1), 36.
Blöte, A. W., Klein, A. S., & Beishuizen, M. (2000). Mental computation and conceptual
understanding. Learning and Instruction, 10, 221-247.
Campbell, J. I. D. & Xue, Q. (2001). Cognitive arithmetic across cultures. Journal of
Experimental Psychology: Cognition, 34, 54-55.
Carroll, W. M. (1996). Mental computation of students in a reform-based mathematics
curriculum. School Science & Mathematics, 96(6), 305.
Carvalho, R., & da Ponte, J. P. (2013). Student’s mental computation strategies with
rational numbers represented as fractions. Paper presented at Eighth Congress
of European Research in Mathematics Education (CERME 8), Antalya.
Callingham, R. & Watson, J. (2008). Research in mental computation: Multiple
perspectives. Brisbane: Post Pressed. ISBN: 978-1-921214-36-3.
Clements, D. H. & Battista, M. T. (1990). Constructivist learning and teaching.
Arithmetic Teacher, 38(1), 34-35.
Cohen, J (1988). Statistical power analysis for the behavioral sciences (2nd ed.).
Hillsdale, NJ: Erlbaum.
Cornell, C. (1992). "I hate math! I couldn't learn it, and I can't teach it !” Childhood
Education, 75, 225-230.

315
Creswell (2009). Research design: Qualitative, quantitative, and mixed methods
approaches. Thousand Oaks: CA: Sage.
Day, L., & Hurrell, D (2015). An explanation for the use of arrays. Australian Primary
Mathematics Classroom, 20(1), 20-23.
Ertmer, P. & Newby, T. (1993). Behaviorism, cognitivism, constructivism: Comparing
critical features form an instructional design perspective. Performance
Improvement Quarterly, 6(4), 50-72.
French, D. (2005). Double, Double, Double. Mathematics in School, 34(5), 8-9.
Gay, A.S., & Aichele, D. B. (1997). Middle school students’ understanding of number
sense related to percent. School Science and Mathematics, 97(1), 27-36.
Greeno, J. G. (1991). Number Sense as Situated Knowing in a Conceptual Domain.
Journal for Research in Mathematics Education, 22 (3), 170-218.
Hartnett, J. E. (2007). Categorisation of mental computation strategies to support
teaching and to encourage classroom dialogue. In Watson, Jane and Beswick,
Kim, Eds. Proceedings 30th annual conference of the Mathematics Education
Research Group of Australasia-Mathematics: Essential Research, Essential
Practice, 345-352, Hobart, Tasmania.
Hashimoto, Y., & Becker, J. P. (1999). The open approach to teaching mathematics-
Creating a culture of mathematics in the classroom: Japan. In L. Sheffield (Ed.),
Developing mathematically promising students. Reston, VA: National Council of
Teachers of Mathematics.
316
Heirdsfield, A. N. (2000). Mental computation: Is it more than mental architecture?
Paper presented at Annual Meeting of the Australian Association for Research in
Education, Melbourne, Sydney.
Heirdsfield, A. M. (2002). Flexible mental computation: What about accuracy?. In
Cockburn, A. and Nardi, E., Eds. Proceedings 26th Annual Conference of the
International Group for the Psychology of Mathematics Education. 3, 89-96,
Norwich, UK.
Heirdsfield, A. M. (2003). Mental computation: Refining the cognitive frameworks. In
Bragg, L and Campbell, C. and Herbert, H. and Mousely, J., Eds. Proceedings
Mathematics Education Research: Innovation, Networking, Opportunity, 421-
428, Geelong, Victoria.
Heirdsfield, A. M., & Cooper, T. J. (1996). The ‘ups’ and ‘downs’ of subtraction: Young
children’s additive and subtractive mental strategies for solutions of subtraction
word problems and algorithmic exercise. In P.C. Clarkson (ED.), Technology in
mathematics education. Annual Conference of the Mathematics Education
Research Group of Australasia (pp. 261-268). Melbourne, Vic.: Deakin
University Press.
Heirdsfield, A. M., & Cooper, T. J. (2004). Factors affecting the process of proficient
mental addition and subtraction: Case studies of flexible and inflexible
computers. Journal of Mathematical Behavior, 23, 443-463.
Hoffer, T. B., Venkataraman, L., Hedberg, E. C., & Shagle, S. (2007). Final report on the
national survey of algebra teachers for the National Math Panel. Washington,
DC: U.S. Department of Education.

317
Jong, C., & Hodges, T. E. (2015). Assessing Attitudes toward Mathematics across
Teacher Education Contexts. Journal of Mathematics Teacher Education, 18(5),
407-425.
Kamii, C. & Dominick, A. (1997). To teach or not to teach algorithms. Journal of
Mathematical Behavior, 16, 51-61.
Kilpatrick, J., Swafford, J., & Findell, B. (2001). Adding it up: Helping children learn
mathematics. Washington, DC: National Academy Press.
Khoury, H. A. & Zazkis. R. (1994). On fractions and non-standard representations:
Preservice teachers’ concept. Educational Studies in Mathematics, 27, 191- 204.
LeFevre, J., & Morris, J. (1999). More on the relation between division and multiplication
in simple arithmetic: Evidence for mediation of division solutions via
multiplication. Memory & Cognition, 27, 803-812
Lemonidis, C. (2016). Mental computation and estimation: Implications for mathematics
education research, teaching and learning. Abingdon, Oxon: Routledge, 2016.
Lemonidis, CH., Kermeli, A. & Palaigeorgiou, G. (2014). Exploring number sense in
sixth grade in Greece: An instructional proposal and its learning results. MENON:
Journal of Educational Research, 1st Thematic Issue, 159-172.
Lin, C. (2007). Teaching Multiplication Algorithms from Other Cultures. Mathematics
Teaching in the Middle School, 13(5), 298-304.
Linsen, S., Verschaffel, L., Reynvoet, B., & De Smedt, B. (2015). The association
between numerical magnitude processing and mental versus algorithmic multi-
digit subtraction in children. Learning and Instruction, 35, 42-50.
318
Liu, A. S., Kallai, A. Y., Schunn, C. D., & Fiez, J. A. (2015). Using mental computation
training to improve complex mathematical performance. Instructional Science: An
International Journal of the Learning Sciences, 43(4), 463-485.
Lembke, L., & Reys, B. (1994). The development of, and interaction between, intuitive
and school-taught ideas about percent. Journal for Research in Mathematics
Education, 25, 237-259.
Lui, A. M., & Bonner, S. M. (2016). Preservice and inservice teachers' knowledge,
beliefs, and instructional planning in primary school mathematics. Teaching and
Teacher Education, 56, 1-13.
Lynch, K., & Star, J. R. (2014). Teachers' views about multiple strategies in middle and
high school mathematics. Mathematical Thinking and Learning: An International
Journal, 16(2), 85-108.
Ma, L. (1999). Knowing and teaching elementary mathematics: Teachers’
understanding of fundamental mathematics in China and the United States.
Mahway, NJ: Lawrence Erlbaum.
Mardjetko, E & Macpherson, J. (2007). Is your classroom mental? Australian Primary
Mathematics Classroom, 12(2) 4-9.
McIntosh, A., Nohda, N., Reys, B. J., & Reys, R. E. (1995). Mental computation
performance in Australia, Japan and the United States. Educational Studies in
Mathematics, 29(3), 237-258.
McIntosh, A., Reys, R. E.., & Reys, B. J. (1997). Mental computation in the middle
grades: The importance of thinking strategies. Mathematics Teaching in the
Middle School, 2, 322-327.

319
Murphy, C. (2004). How do children come to use a taught mental calculation strategy?
Educational Studies in Mathematics, 56, 3-18.
National Council of Teachers of Mathematics (1989). Curriculum and Evaluation
Standards for School Mathematics. Reston, VA: National Council of Teachers of
Mathematics.
National Council of Teachers of Mathematics (2000). Principles and standards for
school mathematics. Reston, VA: NCTM.
O’Connor, M. C. (2001). ‘Can any fraction be turned into a decimal?’ A case study of a
mathematical group discussion. Educational Studies in Mathematics, 46, 143-
185.
Parmar, R. S. (2003). Understanding the concept of ‘division’: Assessment
considerations. Exceptionality, 11, 177-189.
Parrish, S. D. (2011). Number talks build numerical reasoning. Teaching Children
Mathematics, 18(3), 198-206.
Petitto, A. L., & Ginsburg, H. P. (1982). Mental arithmetic in Africa and America:
Strategies, principles, and explanations. International Journal of
Psychology, 17(1), 81-102.
Reys, R. (1984). Mental Computation and Estimation: Past, Present, and Future. The
Elementary School Journal, 84(5), 547-557.
Reys, R., Reys, B., Nohda, N., & Emori, H. (1995). Mental computation performance
and strategy use of Japanese students in grades 2, 4, 6, and 8. Journal for
Research in Mathematics Education, 26(4), 304-326.

320
Rizvi, N. F., & Lawson, M. J. (2007). Prospective teachers’ knowledge: Concept of
division. International Education Journal, 8(2), 377–392.
Robinson, K. M., Arbuthnott, K. D., & Gibbons, K. A. (2002). Adults’ representations of
division facts: A consequence of learning history. Canadian Journal of
Experimental Psychology, 56, 302–309.
Robinson, K. M., Arbuthnott, K. D., Rose, D., McCarron, M. C., Globa, C. A., &
Phonexay, S. D. (2006). Stability and change in children’s division strategies.
Journal of Experimental Child Psychology, 93(3), 224–238.
Rogers, A. (2009). Mental Computation in the Primary Classroom. MAV Annual
Conference 2009 Mathematics-Of Prime Importance, hal 190-199. Bundoora:
La Trobe University.
Selter, C. (2001). Addition and subtraction of three–digit numbers: German elementary
children’s success, methods and strategies. Educational Studies in Mathematics,
47, 145-173.
Siegler, R.S. & Shipley, C. (1995). Variation, selection, and cognitive change. In T. J.
Simon & G.S. Halford (Eds.), Developing cognitive competence: New
approaches to process modeling (pp. 31-76). Hillsdale, NJ: Lawrence Erlbaum.
Stacey, K., Helme, S., Steinle, V., Baturo, A., Irwin, K., & Bana, J. (2001). Preservice
teachers' knowledge of difficulties in decimal numeration. Journal of Mathematics
Teacher Education, 4(3), 205-225.
Stigler, J. W., Givvin, K. B., & Thompson, B. J. (2010). What community college
developmental mathematics students understand about mathematics?
Mathematics Educator, 1(3), 4-16.
321
Swan, P., & Sparrow, L. (2001). Strategies for going mental. The Australian Association
of Mathematics Teachers Inc., 236-243.
Swars, S. L., Daane, C. J., & Giesen, J. (2006). Mathematics anxiety and mathematics
teacher efficacy: What is the relationship in Elementary preservice teachers?
School Science and Mathematics, 106 (7), 306-315.
Threlfall, J. (2002). Flexible mental calculation. Educational Studies in Mathematics, 50,
29-47.
Turnuklu, E. B., & Yesildere, S. (2007). The pedagogical content knowledge in
mathematics: Pre-service primary mathematics teachers' perspectives in Turkey.
Issues in the Undergraduate Mathematics Preparation of School Teachers, 1, 1–
13.
Ubuz, B. & Yayan, B. (2010). Primary teachers’ subject matter knowledge: Decimals.
International Journal of Mathematical Education in Science and Technology,
41(6), 787–804.
Van Putten, C. M., Van den Brom-Snijders, P. A., & Beishuizen, M. (2005). Progressive
Mathematization of Long Division Strategies in Dutch Primary Schools. Journal
for Research in Mathematics Education, 36(1), 44-73.
Varol, F., & Farran, D. (2007). Elementary school students’ mental computation
proficiencies. Early Childhood Education Journal, 35(1), 89-94.
Vinson, B. M. (2001). A comparison of preservice teachers' mathematics anxiety before
and after a methods class emphasizing manipulatives. Early Childhood
Education Journal, 29(2), 89-94.

322
Wheeldon, D. (2008). Developing mathematical practices in a social context: An
instructional sequence to support prospective elementary teachers' learning of
fractions. Unpublished Dissertation, University of Central Florida, Orlando, FL.
White, A., Way, J., Perry, B., & Southwell, B. (2005/2006). Mathematical attitudes,
beliefs and achievement in primary preservice mathematics teacher education.
Mathematics Teacher Education and Development, 7, 33-52.
Yang, D. C. (2005). Number sense strategies used by sixth grade students in Taiwan.
Educational Studies, 31(3), 317-334.
Yang, D.C. (2007). Investigating the strategies used by preservice teachers in Taiwan
when responding to number sense question. School Science and Mathematics,
107, 293-301.
Yang, D., & Huang, K. (2014). An Intervention study on mental computation for second
graders in Taiwan. Journal of Educational Research, 107(1), 3-15.
Yang, D.C., Reys, R.E. & Reys, B. J. (2009). Number sense strategies used by pre-
service teachers in Taiwan. International Journal of Science and Mathematics
Education, 7(2), 383-403.

APPENDICES

323
APPENDIX A
INFORMED-CONSENT LETTER
Dear participant,
My name is Eunmi Joung. I am a graduate student in the Department of Curriculum and
Instruction at Southern Illinois University, Carbondale. I am currently conducting a pilot
study before completing my dissertation in Mathematics Education. The purpose of this
pilot study is to examine preservice teachers’ use of different mental computation
strategies with respect to whole numbers, fractions, decimals, and percentages using
two different approaches.
Your participation in this study is voluntary. If you change your mind, you may withdraw
at any time without hesitation. If you choose to participate in the study, you will be asked
to provide demographic information about yourselves such as gender, age, major, etc.,
but not your name. All of the students in class will then be asked to complete the survey
questions, mental computation tests and face to face interviews. Then I will collect the
data by selecting the participants who signed the consent form. The whole process will
last for the duration of the course, which is four weeks in length. Each week will take 50
minutes for 3 class hours.
I understand that my responses to the questions will be audio/videotaped, and that
these tapes will be transcribed/stored and kept for the duration of the research period in
a locked file cabinet. Afterward, these tapes will be destroyed.
All reasonable steps will be taken to protect the identities of participants in this study.
Personal information will not be included in any printed reports or articles. Access to
records of your participation will be limited to myself as the researcher––no one else will
have access to your records. After the study is completed, all questionnaires will be
destroyed.
For additional information, please contact me, Eunmi Joung, Tel: (618) 319-3981, e-
mail: [email protected] or to my supervising professor, Dr. Jerry P. Becker,
Department of Curriculum and Instruction, SIUC, Carbondale, IL 62901-4610. Phone
(618) 453-4246. Email: [email protected].
---------------------------------------------------------------------------------------------------------------------
I have read the information above and any questions I asked have been answered to
my satisfaction. I agree to participate in this activity and know my responses will be tape
recorded. I understand a copy of this form will be made available to me for the relevant
information and phone numbers.

324
“I agree_______ I disagree ________to have my responses recorded on audio/video
tape.”
“I agree_______ I disagree ________ that Eunmi Joung may quote me in her paper.”
___________________________________________
Participant signature and date
This project has been reviewed and approved by the SIUC Human Subjects Committee.
Questions concerning your rights as a participant in this research may be addressed to
the Committee Chairperson, Office of Sponsored Projects Administration, SIUC,
Carbondale, IL 62901- 4709. Phone (618) 453-4533. E-mail: [email protected]

325
APPENDIX B
PRESERVICE TEACHERS’ DEMOGRAPHIC INFORMATION
The purpose of this questionnaire is to provide some basic background information
about yourself. Please complete the following demographics questionnaire by placing
checkmarks.
---------------------------------------------------------------------------------------------------------------------
Demographic Information
1. Name: ______________________________
2. Course Name and Section: _____________________________________
3. Please indicate your current status
Freshman [ ] Sophomore [ ] Junior [ ] Senior [ ]
4. Gender: Female [ ] Male [ ]
5. Age range
18-22 [ ] 23-26 [ ] 27-32 [ ] 32+ [ ]
6. Ethnicity/Race
American Indian or Alaska Native [ ]
Asian [ ]
Black or African American [ ]
Native Hawaiian or other Pacific Islander [ ]
White [ ]
Other (please specify) _______________

326
7. Major
Early Childhood Education [ ]
Elementary Education [ ]
Special Education [ ]
Secondary Education [ ]
Other (Please specify) ________________
8. Career goal
Elementary school [ ]
Middle school mathematics [ ]
High school mathematics [ ]
Other (please specify) ______________
9. Your last mathematics course
Algebra I [ ]
Geometry [ ]
Algebra II [ ]
Precalculus [ ]
Calculus [ ]
Other (Please specify) __________________
10. The place you took your last mathetmics course
High school [ ]
Community College [ ]
Four-year college or University [ ]
Other (Please specify) ___________________

327
APPENDIX C
MATHEMATICS ATTITUDE SURVEY
The purpose of this questionnaire is to examine Preservice teachers’ attitudes
towards mathematics and mental computation performance. There are 81 statements
under the subscales: attitudes towards mathematics (38), attitudes towards mental and
written computation (30), and mental computation anxiety (14). Read each statement
carefully and the circle one of degrees that best describes your feelings, thoughts, and
ideas.
SD-Strongly Disagree D-Disagree N-Neutral A-Agree SA-Strongly Agree
Statements Degree of Agreement
I. Attitudes towards Mathematics
1. I usually enjoy studying mathematics. SD D N A SA
2. I am able to solve mathematics problems without
too much difficulty.
SD D N A SA
3. I enjoy finding alternative mathematical ideas if I
get stuck on a mathematics problem on a first trial
or if I do not remember a particular formula.
SD D N A SA
4. I enjoy spending time to study mathematics by
myself.
SD D N A SA
5. I enjoy discussing mathematical thoughts and
ideas with my peers if I do not understand the
mathematics concepts.
SD D N A SA
6. I always feel free to ask for help when I have
difficulty in mathematics.
SD D N A SA
7. I believe mathematics is important in everyday
life.
SD D N A SA
8. I believe studying higher level mathematics is
useful.
SD D N A SA

328
9. In K-8 school, my mathematics teachers listened
carefully when I had to ask questions.
SD D N A SA
10. In K-8 school, my mathematics teachers
avoided disrespectful behaviors such as scolding,
ignoring, annoying, and laughing at the students
who made mistakes in mathematics classes.
SD D N A SA
11. In K-8 school, my mathematics teachers
showed enthusiasm for teaching mathematics.
SD D N A SA
12. In K-8 school, my mathematics teachers were
patient with students who had difficulty in
mathematics.
SD D N A SA
13. In K-8 school, my mathematics teachers
considered my interests and needs and had a good
relationship with me.
SD D N A SA
14. In K-8 school, my mathematics teachers
encouraged me to gain self-confidence in
mathematics.
SD D N A SA
15. In K-8 school, my mathematics teachers
showed prompt responses to my inquiries with
confidence.
SD D N A SA
16. In K-8 school, my mathematics teachers had an
open mind to accept students’ individual
differences.
SD D N A SA
17. In high school, my mathematics teachers
listened carefully when I had to ask questions and
have a good relationship with me.
SD D N A SA
18. In high school, my mathematics teachers
avoided disrespectful behaviors such as scolding,
ignoring, annoying, and laughing at the students
who made mistakes in mathematics classes.
SD D N A SA
19. In high school, my mathematics teachers
showed enthusiasm for mathematics.
SD D N A SA
20. In high school, my mathematics teachers were
patient with students who had difficulty in
mathematics.
SD D N A SA
21. In high school, my mathematics teachers
considered my interests and needs and had a good
relationship with me.
SD D N A SA

329
22. In high school, my mathematics teachers
encouraged me to gain self-confidence in
mathematics.
SD D N A SA
23. In high school, my mathematics teachers
showed prompt responses to my inquiries with
confidence.
SD D N A SA
24. In high school, my mathematics teachers had
an open mind to accept students’ individual
differences.
SD D N A SA
25. In K-8 school, my mathematics teachers used
concrete materials like manipulatives and visual
representations when presenting mathematics
topics, in order to make them meaningful.
SD D N A SA
26. In K-8 school, my mathematics teachers
encouraged students to participate in class and
small group discussion and to share their ideas with
peers.
SD D N A SA
27. In K-8 school, my mathetmics teachers focused
on students’ understanding of mathematics
concepts, rather than on demonstrating the
formulas.
SD D N A SA
28. In K-8 school, my mathematics teachers
provided individual support to students having
difficulty in mathematics.
SD D N A SA
29. In K-8 school, my mathematics teachers
encouraged students to use a variety of different
methods related to learning concepts in
mathematics.
SD D N A SA
30. In K-8 school, my mathematics teachers
accepted student’s different strategies and valued
students’ creative ideas.
SD D N A SA
31. In K-8 school, my mathematics teachers used
alternative ways to evaluate students’ mathematics
performance.
SD D N A SA
32. In high school, my mathematics teachers used
concrete materials like manipulatives and visual
representations when presenting mathematics
topics, in order to make them meaningful.
SD D N A SA
33. In high school, my mathematics teachers
encouraged students to participate in class and
SD D N A SA

330
small group discussion and to share their ideas with
peers.
34. In high school, my mathematics teachers
focused on students’ understanding of mathematics
concepts, rather than on demonstrating the
formulas.
SD D N A SA
35. In high school, my mathematics teachers
provided individual support to students having
difficulty in mathematics.
SD D N A SA
36. In high school, my mathematics teachers
encouraged students to use a variety of different
methods related to learning concepts in
mathematics.
SD D N A SA
37. In high school, my mathematics teachers
accepted student’s different strategies and valued
students’ creative ideas.
SD D N A SA
38. In high school, my mathematics teachers used
alternative ways to evaluate students’ mathematics
performance.
SD D N A SA
II. Attitudes towards Mental and Written Computation
1. I have learned written computation strategies
during my school years.
SD D N A SA
2. I have learned mental computation strategies
during my school years.
SD D N A SA
3. I have spent more time in school doing written
computation than mental computation.
SD D N A SA
4. I have spent more time in school doing mental
computation than written computation.
SD D N A SA
5. I feel comfortable and safe when using written
computation.
SD D N A SA
6. I feel comfortable and safe when using mental
computation.
SD D N A SA
7. I am confident with learning and teaching written
computation.
SD D N A SA
8. I am confident with learning and teaching mental
computation.
SD D N A SA
9. I have used written computation more than
mental computation.
SD D N A SA
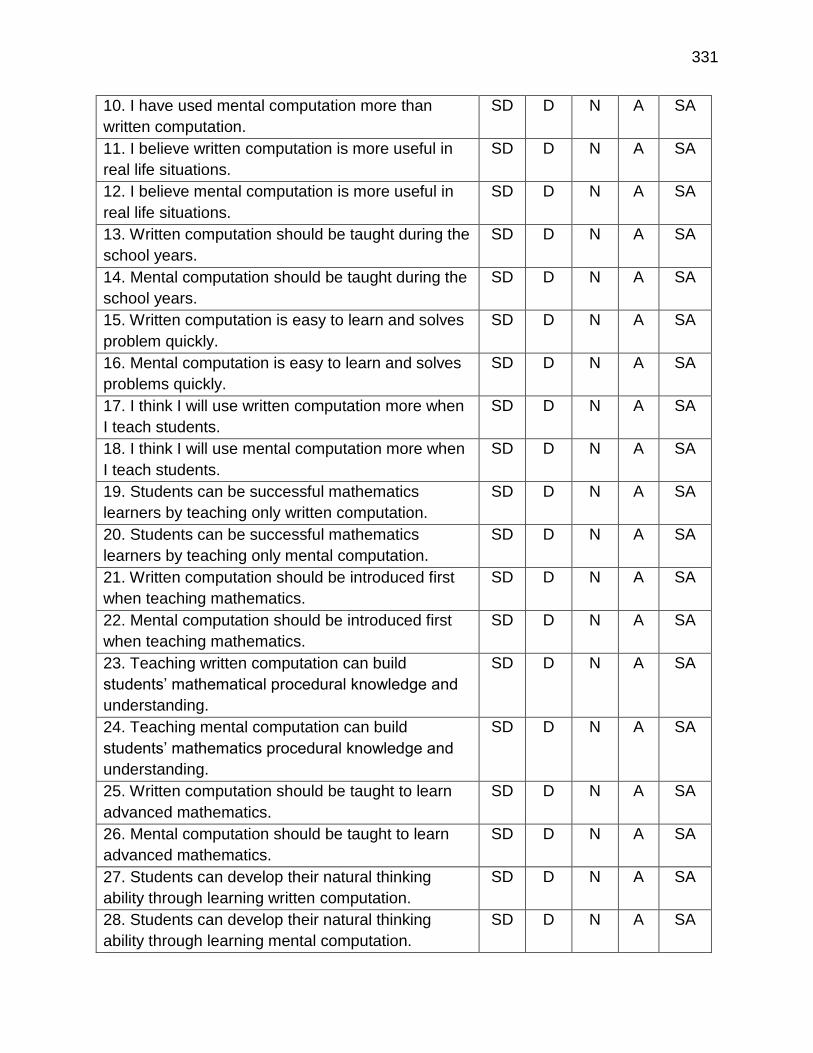
331
10. I have used mental computation more than
written computation.
SD D N A SA
11. I believe written computation is more useful in
real life situations.
SD D N A SA
12. I believe mental computation is more useful in
real life situations.
SD D N A SA
13. Written computation should be taught during the
school years.
SD D N A SA
14. Mental computation should be taught during the
school years.
SD D N A SA
15. Written computation is easy to learn and solves
problem quickly.
SD D N A SA
16. Mental computation is easy to learn and solves
problems quickly.
SD D N A SA
17. I think I will use written computation more when
I teach students.
SD D N A SA
18. I think I will use mental computation more when
I teach students.
SD D N A SA
19. Students can be successful mathematics
learners by teaching only written computation.
SD D N A SA
20. Students can be successful mathematics
learners by teaching only mental computation.
SD D N A SA
21. Written computation should be introduced first
when teaching mathematics.
SD D N A SA
22. Mental computation should be introduced first
when teaching mathematics.
SD D N A SA
23. Teaching written computation can build
students’ mathematical procedural knowledge and
understanding.
SD D N A SA
24. Teaching mental computation can build
students’ mathematics procedural knowledge and
understanding.
SD D N A SA
25. Written computation should be taught to learn
advanced mathematics.
SD D N A SA
26. Mental computation should be taught to learn
advanced mathematics.
SD D N A SA
27. Students can develop their natural thinking
ability through learning written computation.
SD D N A SA
28. Students can develop their natural thinking
ability through learning mental computation.
SD D N A SA
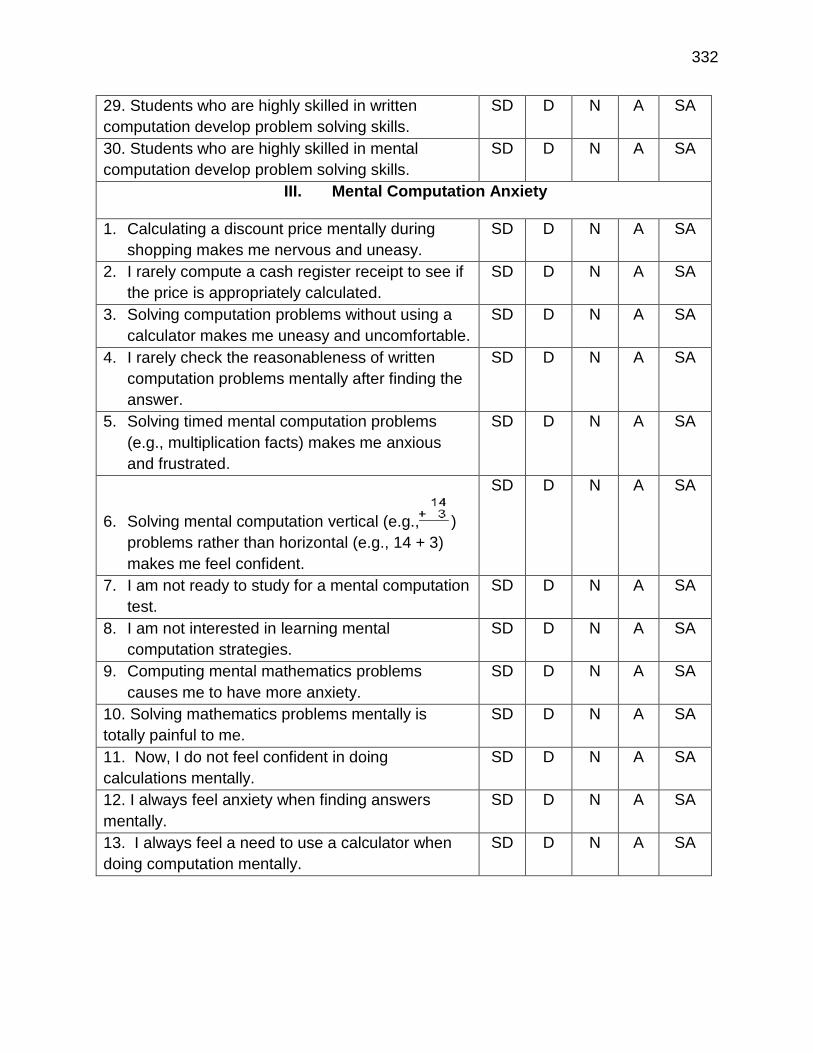
332
29. Students who are highly skilled in written
computation develop problem solving skills.
SD D N A SA
30. Students who are highly skilled in mental
computation develop problem solving skills.
SD D N A SA
III. Mental Computation Anxiety
1. Calculating a discount price mentally during
shopping makes me nervous and uneasy.
SD D N A SA
2. I rarely compute a cash register receipt to see if
the price is appropriately calculated.
SD D N A SA
3. Solving computation problems without using a
calculator makes me uneasy and uncomfortable.
SD D N A SA
4. I rarely check the reasonableness of written
computation problems mentally after finding the
answer.
SD D N A SA
5. Solving timed mental computation problems
(e.g., multiplication facts) makes me anxious
and frustrated.
SD D N A SA
6. Solving mental computation vertical (e.g., )
problems rather than horizontal (e.g., 14 + 3)
makes me feel confident.
SD D N A SA
7. I am not ready to study for a mental computation
test.
SD D N A SA
8. I am not interested in learning mental
computation strategies.
SD D N A SA
9. Computing mental mathematics problems
causes me to have more anxiety.
SD D N A SA
10. Solving mathematics problems mentally is
totally painful to me.
SD D N A SA
11. Now, I do not feel confident in doing
calculations mentally.
SD D N A SA
12. I always feel anxiety when finding answers
mentally.
SD D N A SA
13. I always feel a need to use a calculator when
doing computation mentally.
SD D N A SA

333
APPENDIX D
UNIT LESSON PLAN
1. Title of Unit: Preservice Teachers’ Mental Computation Performance and Their
Use of Strategy
2. Purpose of Unit
To improve preservice teachers’ attitude professionally and personally to
maintain students’ positive attitude towards mathematics teaching and
learning
To investigate preservice teachers’ use of different mental computation
strategies in a variety of settings
To develop preservice teachers’ mental computation strategies that are more
focused on conceptual understanding using direct teaching and developing
students’ own methods
To assist preservice teachers to determine what mental computation
strategies effectively work best for both flexible and inflexible learners in their
instruction
3. Curriculum Focal Points Standards (NCTM, 2006)
Curriculum Focal Points Standards and Connections
[Grade 2] Number and Operations and Algebra: Developing quick recall of
addition facts and related subtraction facts and fluency with multidigit
addition and subtraction.
Children develop, discuss, and use efficient, accurate, and generalizable methods
to add and subtract multidigit whole numbers. They select and apply appropriate
methods to estimate sums and differences or calculate them mentally, depending
on the context and numbers involved.

334
[Grade 4] Number and Operations and Algebra: Developing quick recall of
multiplication facts and related division facts and fluency with whole
number multiplication.
Students use understandings of multiplication to develop quick recall of the basic
multiplication facts and related division facts. They select appropriate methods
and apply them accurately to estimate products or calculate them mentally,
depending on the context and numbers involved.
[Grade 5] Number and Operations and Algebra: Developing an
understanding of and fluency with division of whole numbers.
Students apply their understanding of models for division, place value,
properties, and the relationship of division to multiplication as they develop,
discuss, and use efficient, accurate, and generalizable procedures to find
quotients involving multidigit dividends. They select appropriate methods and
apply them accurately to estimate quotients or calculate them mentally,
depending on the context and numbers involved.
Connection to the Focal Points [Grade 3] Number and Operations: Building on their work in grade 2, students
extend their understanding of place value to numbers up to 10,000 in various
contexts. Students also apply this understanding to the task of representing
numbers in different equivalent forms (e.g., expanded notation). They develop
their understanding of numbers by building their facility with mental computation
(addition and subtraction in special cases, such as 2,500 + 6,000 and 9,000 –
5,000), by using computational estimation, and by performing paper-and-pencil
computations.
Expectations of Content Standards
Number and Operations Grade 3 through 5
Develop fluency with basic number combinations for multiplication and division
and use these combinations to mentally compute related problems, such as 30 ×
50
Number and Operations, Grades 6 through 8
Select appropriate methods and tools for computing with fractions and decimals
from among mental computation, estimation, calculators or computers, and
paper and pencil, depending on the situation, and apply the selected methods.

335
4. Common Core State Standards for Mathematics (CCSSM, 2010)
Grade 1 » Number & Operations in Base Ten
CCSS.MATH.CONTENT.1.NBT.C.5
Given a two-digit number, mentally find 10 more or 10 less than the number,
without having to count; explain the reasoning used.
Grade 2 » Operations & Algebraic Thinking
CCSS.MATH.CONTENT.2.OA.B.2
Fluently add and subtract within 20 using mental strategies. By end of Grade 2,
know from memory all sums of two one-digit numbers.
Grade 2 » Number & Operations in Base Ten
CCSS.MATH.CONTENT.2.NBT.B.8
Mentally add 10 or 100 to a given number 100-900, and mentally subtract 10 or
100 from a given number 100-900.
Grade 3 » Operations & Algebraic Thinking
CCSS.MATH.CONTENT.3.OA.D.8
Solve two-step word problems using the four operations. Represent these
problems using equations with a letter standing for the unknown quantity. Assess
the reasonableness of answers using mental computation and estimation
strategies including rounding.
Grade 4 » Operations & Algebraic Thinking
CCSS.MATH.CONTENT.4.OA.A.3
Solve multistep word problems posed with whole numbers and having whole-
number answers using the four operations, including problems in which
remainders must be interpreted. Represent these problems using equations with
a letter standing for the unknown quantity. Assess the reasonableness of
answers using mental computation and estimation strategies including rounding.
Grade 5 » Number & Operations—Fractions
CCSS.MATH.CONTENT.5.NF.A.2
Solve word problems involving addition and subtraction of fractions referring to
the same whole, including cases of unlike denominators, e.g., by using visual

336
fraction models or equations to represent the problem. Use benchmark fractions
and number sense of fractions to estimate mentally and assess the
reasonableness of answers. For example, recognize an incorrect result 2/5 + 1/2
= 3/7, by observing that 3/7 < 1/2.
Grade 7 » Expressions & Equations
CCSS.MATH.CONTENT.7.EE.B.3
Solve multi-step real-life and mathematical problems posed with positive and
negative rational numbers in any form (whole numbers, fractions, and decimals),
using tools strategically. Apply properties of operations to calculate with numbers
in any form; convert between forms as appropriate; and assess the
reasonableness of answers using mental computation and estimation strategies.
For example: If a woman making $25 an hour gets a 10% raise, she will make an
additional 1/10 of her salary an hour, or $2.50, for a new salary of $27.50. If you
want to place a towel bar 9 3/4 inches long in the center of a door that is 27 1/2
inches wide, you will need to place the bar about 9 inches from each edge; this
estimate can be used as a check on the exact computation.
5. Instructional Procedures
Two approaches (Direct Teaching Approach & Developing Students’ Own
Strategies) for mental computation strategies will be applied in this unit.
A total of 11 sessions will be conducted using direct teaching approach.
Each lesson is intended to take about a 50 minute period.
Direct instruction of computation strategies will be implemented.
In this approach, teachers are expected to become deliverers of
concepts, facts, and skills and have an authority to control the class.
Specific lesson contents are as follows: mental computation strategies
for whole numbers (addition, subtraction, multiplication, and division),
integers, fractions, decimals, and percentages. Each lesson will be
covered for each operation of mental computation.
Students will be evaluated using Mental Computation Test (MCT) in
the last lesson.

337
A total of 11 lessons will be conducted using developing students’ own
strategies.
Each lesson is intended to take about a 50 minute period.
Constructivist teaching methods will be implemented based on Open
or Open-ended approach
Organizing lesson using the open approach (Hashimoto & Becker, 1999)
Introducing a problem or topic – the teacher presents or poses a
problem;
Understanding the problem – the teacher ensures what is expected of
students before they start to work through speaking and asking for
questions;
Problems solving by students – students are given a problem set to
record their responses to solve problems individually or in small
groups. The teacher encourages students’ natural ways of thinking to
generate a variety of different responses and to select answers that
best fit the discussion with a whole class;
Comparing and Discussing – the teacher guides a discussion and
compares their responses where their different answers are presented;
Summary of the lesson – the teacher summarizes the outcome of the
lesson based on students’ discussion.
In this approach, teachers are expected to become facilitators, guiders,
and supporters to develop students’ mathematical ideas and thoughts.
Specific lesson contents are as follows: whole numbers (addition,
subtraction, multiplication, and division), integers, fractions, decimals,
and percentages.
Students will be evaluated using Mental Computation Test (MCT) in the last lesson.

338
6. Instructional Plan
MENTAL COMPUTATION LESSON PLAN
Direct Teaching Approach (DT) Open Approach (OA)
Lesson 1 – Pretest
Lesson 2 – Mental Computation for Addition
1. Introduction
Introduce the following problems to the
students
Demonstrate how to solve each problem, if
possible, show as many different strategies
2. Demonstrate Various Mental Computation
Strategies for Addition
Count all and Counting on: counting on in
ones or tens from the first number
Reordering: changing the order of the
numbers makes easier calculation
1. Present or pose the following
mental computation problems for
addition
2. Introduce the purpose of the lesson
clearly and ensure what is expected
of students before they start to work
through speaking and asking for
questions.
3 + 5 = count individual unit from 1 to 3 and
count on another 5
16 + 8 = starting with the larger number 16, and
counting on 8, saying 17, 18, 19,…24,
12 + 17 + 8 + 3 = 12 + 8 + 17 + 3
34 + 27 + 46 = 34 + 46 + 27
157 + 650 = 650 + 157 (thinking of 157 as 150 + 7)
37 + 46 =
137 + 49 =
108 + 392=
14 + 39 + 16 +25 +21 =
1 + 2 + 3 + ... + 97 + 98 + 99 =
To develop your own mental
computation strategies for addition
To find effective or efficient mental
computation addition strategies that
are more focused on conceptual
understanding
To increase the mental computation
test performance and flexibility
using alternative solutions
37 + 46 =
137 + 49 =
14 + 39 + 16 +25 +21 =
1 + 2 + 3 + ... + 97 + 98 + 99 =
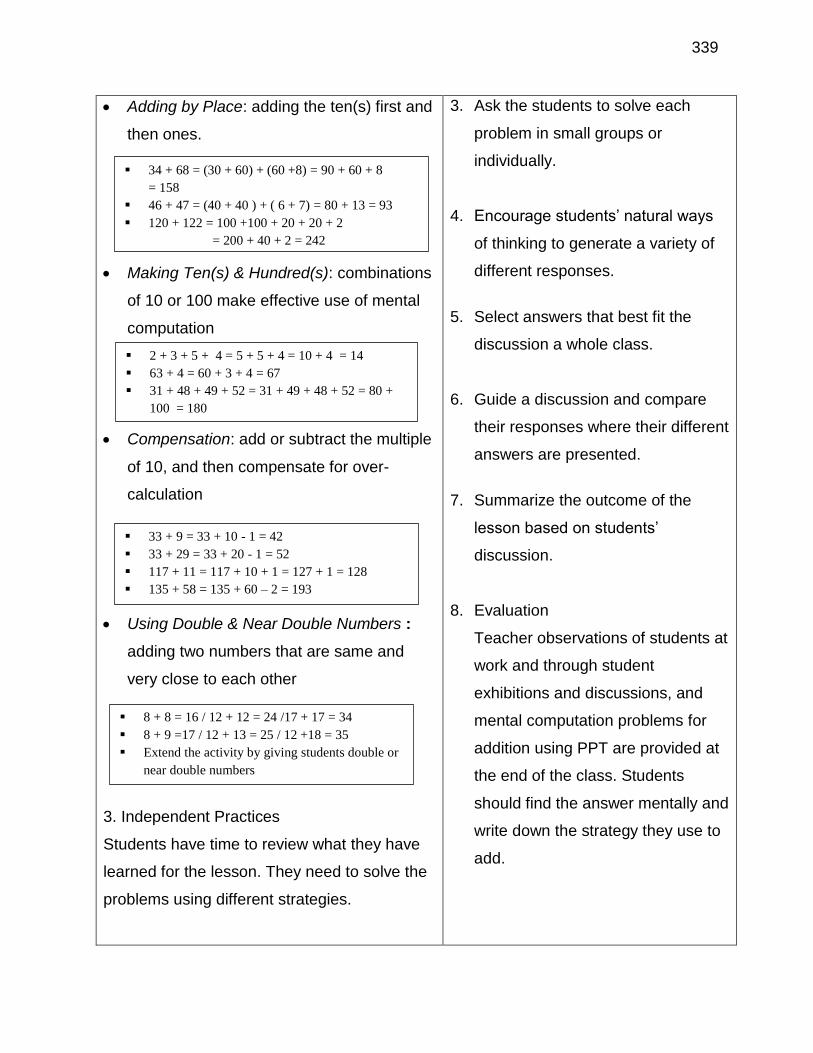
339
Adding by Place: adding the ten(s) first and
then ones.
Making Ten(s) & Hundred(s): combinations
of 10 or 100 make effective use of mental
computation
Compensation: add or subtract the multiple
of 10, and then compensate for over-
calculation
Using Double & Near Double Numbers :
adding two numbers that are same and
very close to each other
3. Independent Practices
Students have time to review what they have
learned for the lesson. They need to solve the
problems using different strategies.
3. Ask the students to solve each
problem in small groups or
individually.
4. Encourage students’ natural ways
of thinking to generate a variety of
different responses.
5. Select answers that best fit the
discussion a whole class.
6. Guide a discussion and compare
their responses where their different
answers are presented.
7. Summarize the outcome of the
lesson based on students’
discussion.
8. Evaluation
Teacher observations of students at
work and through student
exhibitions and discussions, and
mental computation problems for
addition using PPT are provided at
the end of the class. Students
should find the answer mentally and
write down the strategy they use to
add.
2 + 3 + 5 + 4 = 5 + 5 + 4 = 10 + 4 = 14
63 + 4 = 60 + 3 + 4 = 67
31 + 48 + 49 + 52 = 31 + 49 + 48 + 52 = 80 +
100 = 180
33 + 9 = 33 + 10 - 1 = 42
33 + 29 = 33 + 20 - 1 = 52
117 + 11 = 117 + 10 + 1 = 127 + 1 = 128
135 + 58 = 135 + 60 – 2 = 193
8 + 8 = 16 / 12 + 12 = 24 /17 + 17 = 34
8 + 9 =17 / 12 + 13 = 25 / 12 +18 = 35
Extend the activity by giving students double or
near double numbers
34 + 68 = (30 + 60) + (60 +8) = 90 + 60 + 8
= 158
46 + 47 = (40 + 40 ) + ( 6 + 7) = 80 + 13 = 93
120 + 122 = 100 +100 + 20 + 20 + 2
= 200 + 40 + 2 = 242

340
4. Evaluation
Mental computation problems for addition
using PPT are provided at the end of the class.
Students are graded based on the correct
answers and the strategies they used to add.
Lesson 3 – Mental Computation Strategies for Subtraction
1. Introduction
Introduce the following problems to the
class:
Demonstrate how to solve each problem, if
possible, show as many different strategies
2. Demonstrate Mental Computation
Strategies for Subtraction
Counting back to: Counting back in ones or
tens from the first number
Reordering: changing the order of the
numbers makes easier calculation
1. Present or pose the following
mental computation problems for
subtraction
2. Introduce the purpose of the lesson
clearly and ensure what is expected
of students before they start to work
through speaking and asking for
questions.
48 – 3 = 45, count back in ones from 48.
70 – 27 = 43, count back in tens then ones from 70 190 – 30 = 160, 19 tens count back 3 tens
860 – 300 = 560 count back in hundreds from 860
25 – 9 – 5 = 25 – 5 – 9 = 11
13 + 9 – 3 = 13 – 3 + 9 = 19
96 – (13 + 6) = 96 – 6 – 13 = 77
38 – 9=
24 – 12 =
170 – 18 =
38 + 16 – 14 + 4 =
39 + 399 + 3,999 =
9 + 99 + 999 + 9,999 =
To develop your own mental
computation strategies for
subtraction
To find effective or efficient mental
computation addition strategies that
are more focused on conceptual
understanding
To increase the mental computation
test performance and flexibility using
alternative solutions
38 – 9=
24 – 12 =
38 + 16 – 14 + 4 =
9 + 99 + 999 + 9,999 =
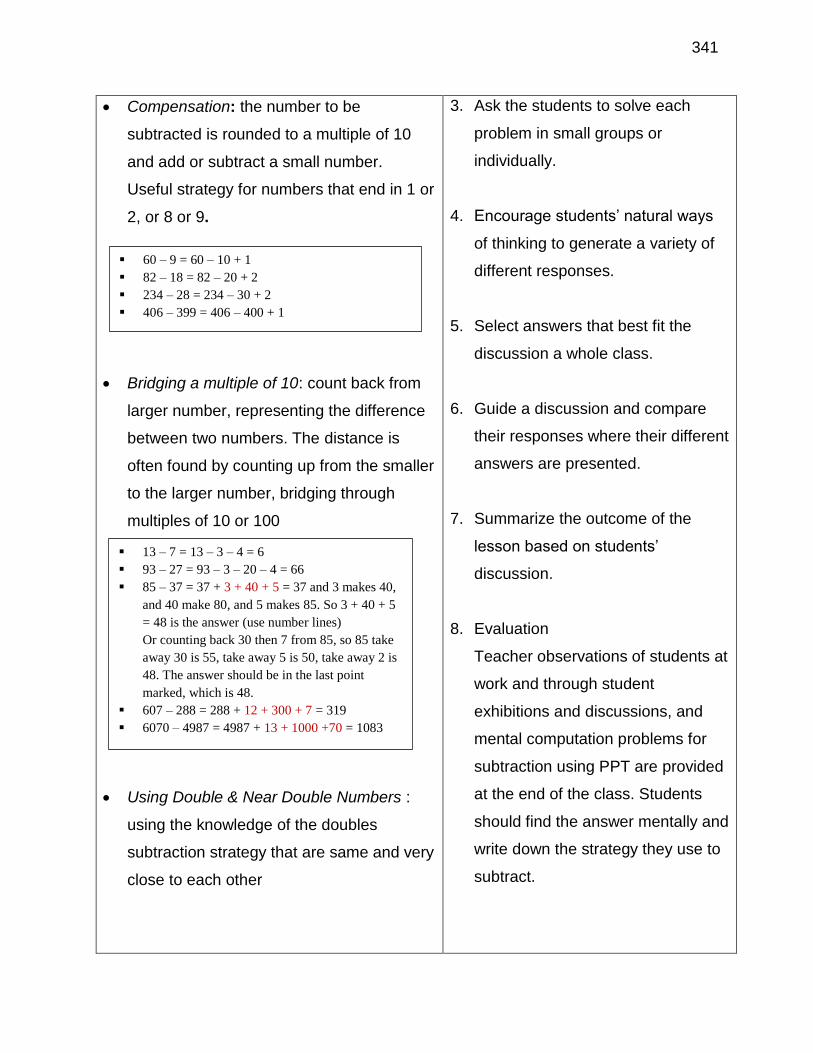
341
Compensation: the number to be
subtracted is rounded to a multiple of 10
and add or subtract a small number.
Useful strategy for numbers that end in 1 or
2, or 8 or 9.
Bridging a multiple of 10: count back from
larger number, representing the difference
between two numbers. The distance is
often found by counting up from the smaller
to the larger number, bridging through
multiples of 10 or 100
Using Double & Near Double Numbers :
using the knowledge of the doubles
subtraction strategy that are same and very
close to each other
3. Ask the students to solve each
problem in small groups or
individually.
4. Encourage students’ natural ways
of thinking to generate a variety of
different responses.
5. Select answers that best fit the
discussion a whole class.
6. Guide a discussion and compare
their responses where their different
answers are presented.
7. Summarize the outcome of the
lesson based on students’
discussion.
8. Evaluation
Teacher observations of students at
work and through student
exhibitions and discussions, and
mental computation problems for
subtraction using PPT are provided
at the end of the class. Students
should find the answer mentally and
write down the strategy they use to
subtract.
13 – 7 = 13 – 3 – 4 = 6
93 – 27 = 93 – 3 – 20 – 4 = 66
85 – 37 = 37 + 3 + 40 + 5 = 37 and 3 makes 40,
and 40 make 80, and 5 makes 85. So 3 + 40 + 5
= 48 is the answer (use number lines)
Or counting back 30 then 7 from 85, so 85 take
away 30 is 55, take away 5 is 50, take away 2 is
48. The answer should be in the last point
marked, which is 48.
607 – 288 = 288 + 12 + 300 + 7 = 319
6070 – 4987 = 4987 + 13 + 1000 +70 = 1083
60 – 9 = 60 – 10 + 1
82 – 18 = 82 – 20 + 2
234 – 28 = 234 – 30 + 2
406 – 399 = 406 – 400 + 1

342
Think addition: thinking addition but have a
missing addend
3. Independent practices
Students have time to review what they
have learned for the lesson. They need to
solve the problems using different
strategies.
4. Evaluation
Mental computation problems for
subtraction using PPT are provided at the
end of the class. Students are graded
based on the correct answers and the
strategies they used to add.
60 – 30 =30; double 3 tens is 6 tens, so 6 tens
take away 3 tens is 3 tens
84 – 42 = 42; 8 tens is double 4 tens and 4 is
double 2, so 84 – 42 is 42
15 – 7 = 8; 15 is one more than double 7, so
the answer is one more than 7
13 – 7 = 6; 13 is one less than double 7, so the
answer is one less than 7
13 – 9 = 9 + ? = 13
15 – 8 = 8 + ? = 15
74 – 30 = 30 + ? = 74
120 – 85 = 85 + ? = 120

343
Lesson 4 – Mental Computation Strategies for Multiplication
1.Introduction
Introduce the following problems to the
students
Demonstrate how to solve each problem, if
possible, show as many different strategies
2. Demonstrate Mental Computation
Strategies for Multiplication
Doubling and halving: double any one or
two-digit number and find the
corresponding halves or multiplying by 10
then halving
Multiplying using factors: Multiply double
digit numbers using factors
1. Introduction
Present or pose the following
mental computation problems for
multiplication.
2. Introduce the purpose of the lesson
clearly and ensure what is expected
of students before they start to work
through speaking and asking for
questions.
16 × 4 = 32 × 2 = 64
12 × 8 = 24 × 4 = 48 × 2 = 96 (doubling three times)
52 × 20 = 104 × 10 = 1040
16 × 5 = 160 ÷ 2 = 80
18 × 20 = 18 × 2 ×10 = 360
26 × 15 = 2 × 3 × 5 × 13 = 2 × 5 × 3 × 13 =390
18 × 24 = 18 × 6 × 4 or 18 × 8 × 3 or 18 × 2 × 12
or 18 × 2 × 3 × 2 × 2 = 432 25 × 40 = 25 × 2 × 2 × 10 or 25 ×2 = 50 50 × 2 =
100 100 ×10 = 1000
12 × 8 =
25 × 22 =
32 × 99 =
25 × 16 × 125 =
37 × 88 + 37 × 12 =
18 × 114 – 18 × 14 =
12 × 8 =
25 × 99 =
25 × 16 × 125 =
37 × 88 + 37 × 12 =
To develop your own mental
computation strategies for
multiplication
To find effective or efficient mental
computation multiplication strategies
that are more focused on conceptual
understanding
To increase the mental computation
test performance and flexibility using
alternative solutions

344
Compensation: multiply the multiple of 10,
and then compensate for over-calculation
The Vedic Method of Vertical Multiplication
(double digit numbers):
1) multiply vertically one the right number
that give the ones digit
2) multiply crosswise and add the products
which gives the tens digit
3) multiply vertically one the left number
that gives the hundreds digit
Partial Product Mental Multiplication
(double digit numbers): the combinations of
the individual digit multiplications, and they
are added up from left to right to find the
product
3. Ask the students to solve each
problem in small groups or
individually.
4. Encourage students’ natural ways
of thinking to generate a variety of
different responses.
5. Select answers that best fit the
discussion a whole class.
6. Guide a discussion and compare
their responses where their different
answers are presented.
7. Summarize the outcome of the
lesson based on students’
discussion.
8. Evaluation
Teacher observations of students at
work and through student
exhibitions and discussions, and
mental computation problems for
multiplication using PPT are
provided at the end of the class.
Students should find the answer
mentally and write down the
strategy they use to multiply.
8 × 9 = 8 × (10 – 1)= 80 – 8 =72
8 × 99 = 8 × (100 – 1) =100 – 8 = 792
32 × 9 = 32 × (10 – 1) = 320 – 32 = 288
35 × 99 = 35 × (100 – 1) = 3500 – 35 = 3465
15 × 99 = 15 × (100 – 1)
= 15 × 100 – 15 × 1
= 1500 – 15 = 1,485
20 × 199 = 20 × (200 – 1)
= 20 × 200 – 20 × 1
= 4,000 – 20 = 3,980
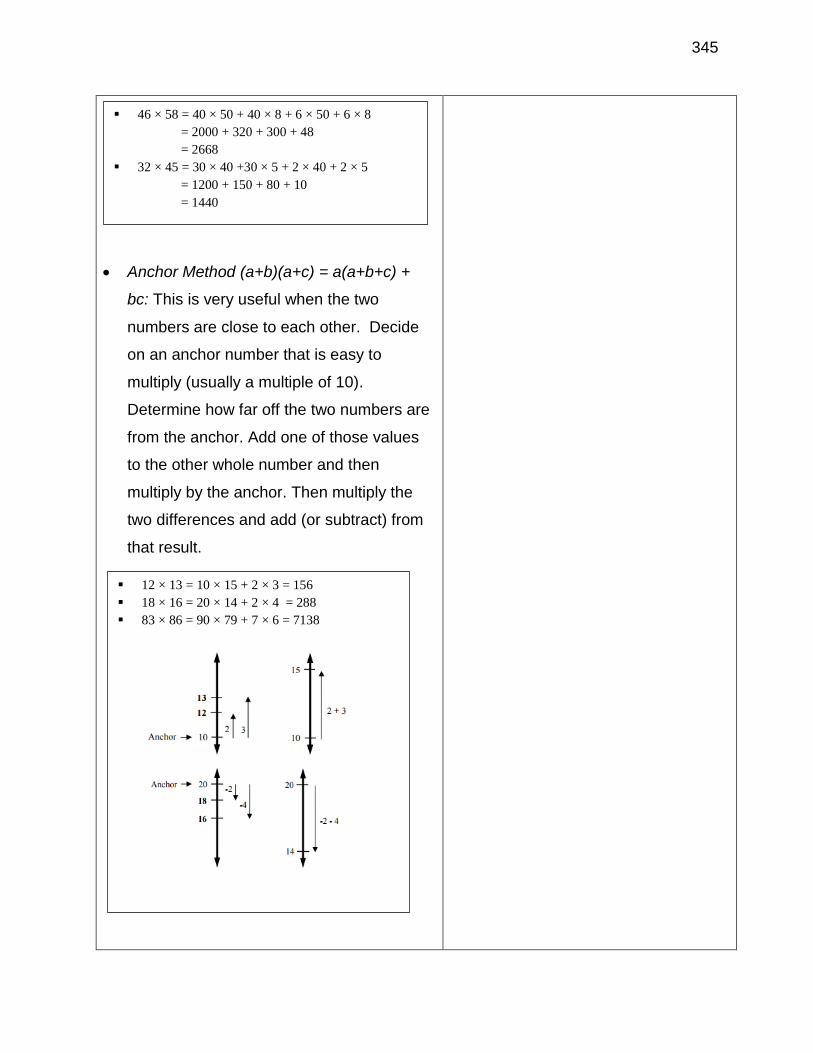
345
Anchor Method (a+b)(a+c) = a(a+b+c) +
bc: This is very useful when the two
numbers are close to each other. Decide
on an anchor number that is easy to
multiply (usually a multiple of 10).
Determine how far off the two numbers are
from the anchor. Add one of those values
to the other whole number and then
multiply by the anchor. Then multiply the
two differences and add (or subtract) from
that result.
46 × 58 = 40 × 50 + 40 × 8 + 6 × 50 + 6 × 8
= 2000 + 320 + 300 + 48
= 2668
32 × 45 = 30 × 40 +30 × 5 + 2 × 40 + 2 × 5
= 1200 + 150 + 80 + 10
= 1440
12 × 13 = 10 × 15 + 2 × 3 = 156
18 × 16 = 20 × 14 + 2 × 4 = 288
83 × 86 = 90 × 79 + 7 × 6 = 7138

346
Making Hundred(s) and Thousand(s) using
factors: it is important to know the
multiplication of numbers that will give the
answer of 100 or 1,000 (e.g., 8 × 125 =
1,000; 4 × 25 =100)
Using distributive property: multiply same
multiplier with multiplicand that can be
added or subtracted into the multiplies of
10 or 100
3. Independent practice
Students have time to review what they
have learned for the lesson. They need to
solve the problems using different
strategies.
4. Evaluation
Mental computation problems for
multiplication using PPT are provided at the
end of the class. Students are graded
based on the correct answers and the
strategies they used to add.
10 × 16 × 125 = 10 × 2 × 8 × 125
= 20 × 1000 = 20,000
25 × 32 × 125 × 35 = 25 × 4 × 8 × 125 × 35
= 100 × 1000 × 35
= 3,500,000
23 × 45 + 23 × 55 = 23 × (45 + 55)
= 33 × 100 = 3,300
12 × 114 – 12 × 14 = 12 × (114 – 14)
= 12 × 100 = 1,200

347
Lesson 5 – Mental Computation Strategies for Division
1.Introduction
Pose the following problems to the
students:
Demonstrate how to solve each problem, if
possible, show as many different strategies
2. Demonstrate Various Mental Computation
Strategies for Division
Doubling and halving: divide any one or
two digit numbers two or three times
Dividing using factors: divide one or two
digit numbers using factors of divisor
1. Present or pose the following
mental computation problems for
division.
2. Introduce the purpose of the lesson
clearly and ensure what is expected
of students before they start to work
through speaking and asking for
questions.
24 ÷ 4 = 12 ÷ 2 = 6
24 ÷ 8 = 12 ÷ 2 = 6 ÷ 1 = 6
128 ÷ 4 = 128 ÷ 2 = 64 ÷ 2 = 32
270 ÷ 50 = 2.7 × 2 = 5.4
48 ÷ 6 = (48 ÷ 2) ÷ 3 = 48
70 ÷ 14 = (70 ÷ 7) ÷ 2 = 5
240 ÷ 16 = (240 ÷ 4 ) ÷ 2 ÷ 2 = 15 (students
can find many alternatives)
342 ÷ 18 = (342 ÷ 2) ÷ 9 = 19
286 ÷ 11 = (286 ÷ 22) × 2 = 26 (Since 11 is
prime number, factors can be modified)
48 ÷ 4=
240 ÷16 =
12000 ÷ 125 =
333 × 222 ÷ 666=
𝟔 × 𝟎 ×𝟐
𝟐 =
70 ÷ 14 =
152 ÷ 19 =
12000 ÷ 125=
35 × 121 ÷ 11 ÷ 7 =
333 × 222 ÷ 666=
𝟔 × 𝟎 ×𝟐
𝟐 =
To develop students’ own mental
computation strategies for division
To find effective or efficient mental
computation division strategies that
are more focused on conceptual
understanding
To increase students’ mental
computation test performance and
their flexibility using alternative
solutions
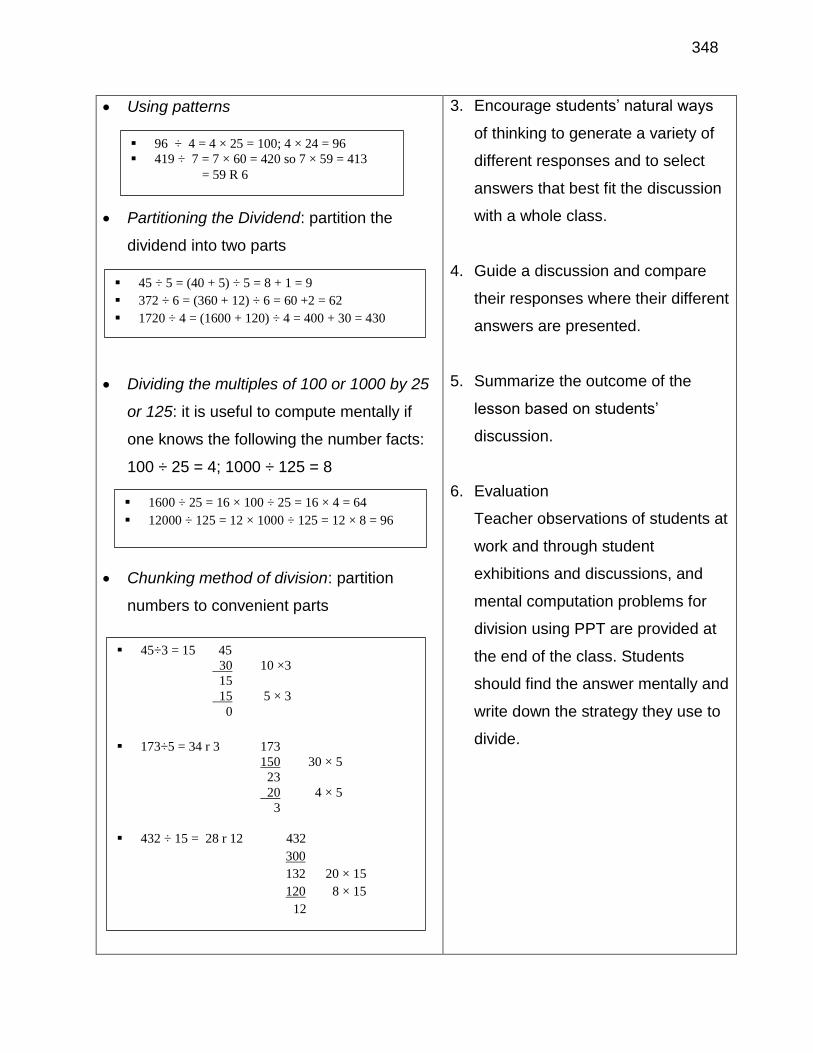
348
Using patterns
Partitioning the Dividend: partition the
dividend into two parts
Dividing the multiples of 100 or 1000 by 25
or 125: it is useful to compute mentally if
one knows the following the number facts:
100 ÷ 25 = 4; 1000 ÷ 125 = 8
Chunking method of division: partition
numbers to convenient parts
3. Encourage students’ natural ways
of thinking to generate a variety of
different responses and to select
answers that best fit the discussion
with a whole class.
4. Guide a discussion and compare
their responses where their different
answers are presented.
5. Summarize the outcome of the
lesson based on students’
discussion.
6. Evaluation
Teacher observations of students at
work and through student
exhibitions and discussions, and
mental computation problems for
division using PPT are provided at
the end of the class. Students
should find the answer mentally and
write down the strategy they use to
divide.
45 ÷ 5 = (40 + 5) ÷ 5 = 8 + 1 = 9
372 ÷ 6 = (360 + 12) ÷ 6 = 60 +2 = 62
1720 ÷ 4 = (1600 + 120) ÷ 4 = 400 + 30 = 430
45÷3 = 15 45
30 10 ×3
15
15 5 × 3
0
173÷5 = 34 r 3 173
150 30 × 5
23
20 4 × 5
3
432 ÷ 15 = 28 r 12 432
300
132 20 × 15
120 8 × 15
12
1600 ÷ 25 = 16 × 100 ÷ 25 = 16 × 4 = 64
12000 ÷ 125 = 12 × 1000 ÷ 125 = 12 × 8 = 96
96 ÷ 4 = 4 × 25 = 100; 4 × 24 = 96
419 ÷ 7 = 7 × 60 = 420 so 7 × 59 = 413
= 59 R 6

349
Decomposing the multiplicand: decompose
the multiplicand into two parts
3. Independent practice
Students have time to review what they
have learned for the lesson. They need to
solve the problems using different
strategies.
4. Evaluation
Mental computation problems for division
using PPT are provided at the end of the
class. Students are graded based on the
correct answers and the strategies they
used to divide.
Lesson 6 – Mental Computation Evaluation for
Addition, Subtraction, Multiplication, and Division
Summative Evaluation for Addition,
Subtraction, Multiplication, and Division of
Whole Numbers
Summative Evaluation for Addition,
Subtraction, Multiplication, and
Division of Whole Numbers.
33 × 22 ÷ 66 = 33 × 2 × 11 ÷ 66
= 66 × 11 ÷ 66 = 11
444 × 222 ÷ 888 = 444 × 2 × 111 ÷ 888
= 888 × 111 ÷ 888 =111

350
Lesson 7 – Mental Computation Strategies for Integers
1. Introduction
Introduce the following problems to the
students:
Demonstrate how to solve each problem, if
possible, show as many different strategies
2. Demonstrate Various Mental Computation
Strategies for Integers
Integer Addition
Adding two positive numbers: add two
numbers and keep the positive sign
Adding two negative numbers: add two
numbers and keep the negative sign
Adding two numbers with different signs:
find the difference between the two
numbers (e.g., subtract) and give the
answer the sign of the larger number
1. Present or pose the following
mental computation problems for
Integers
2. Introduce the purpose of the lesson
clearly and ensure what is
expected of students before they
start to work through speaking and
asking for questions
3. Encourage students’ natural ways
of thinking to generate a variety of
different responses and to select
30 + (– 40) =
45 – (– 25) =
120 ÷ (– 5) × (– 4) =
𝟒 (−𝟔) + 𝟖 − (−𝟐)
𝟏𝟓 – 𝟕 + 𝟐=
3 + (– 4) =
13 – (– 5) =
5 × (– 2) × (– 4) =
(– 24) ÷ 3 ÷ (– 2) =
𝟒 (−𝟔) + 𝟖 − (−𝟐)
𝟏𝟓 – 𝟕 + 𝟐=
To develop your own mental
computation strategies for Integers
To find effective or efficient mental
computation integer strategies that
are more focused on conceptual
understanding
To increase your mental computation
test performance and your flexibility
using alternative solutions
(+ 6) + (+7) = +13
(+ 12) + (+ 32) = +44
(+ 117) + (+ 12) = +129
(– 6) + (– 7) = – 13
(– 12) + (– 32) = – 44
(– 117) + (– 12) = – 129
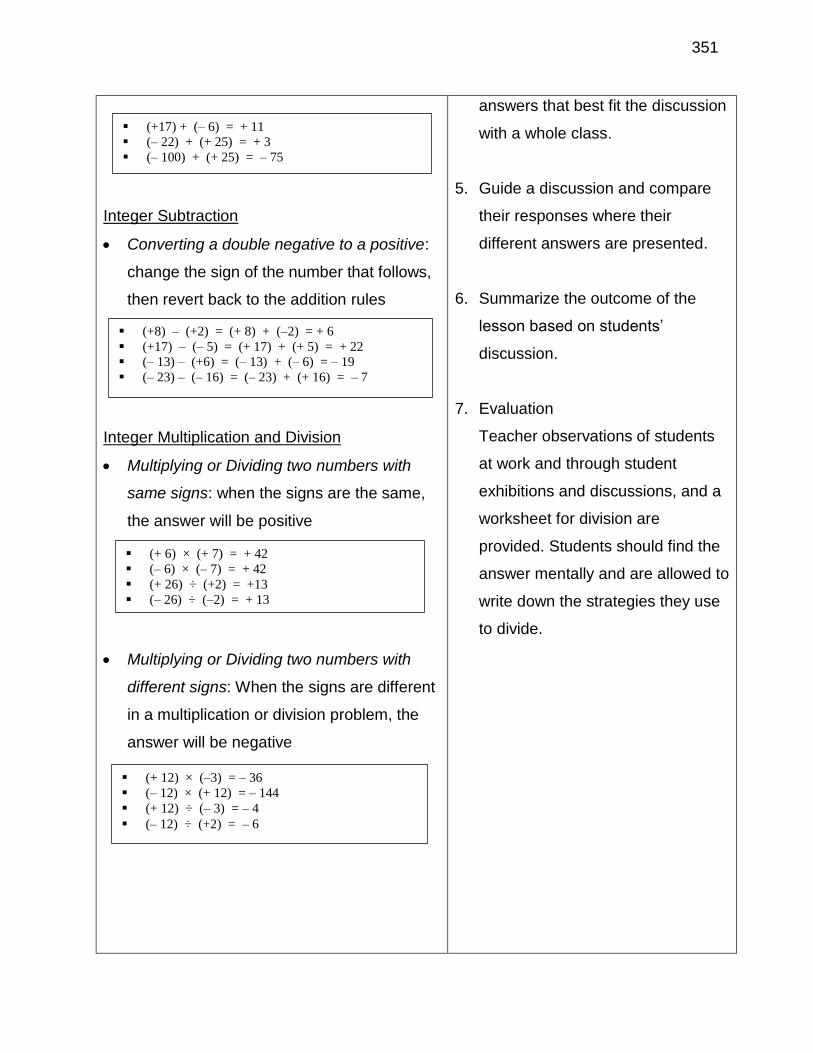
351
Integer Subtraction
Converting a double negative to a positive:
change the sign of the number that follows,
then revert back to the addition rules
Integer Multiplication and Division
Multiplying or Dividing two numbers with
same signs: when the signs are the same,
the answer will be positive
Multiplying or Dividing two numbers with
different signs: When the signs are different
in a multiplication or division problem, the
answer will be negative
answers that best fit the discussion
with a whole class.
5. Guide a discussion and compare
their responses where their
different answers are presented.
6. Summarize the outcome of the
lesson based on students’
discussion.
7. Evaluation
Teacher observations of students
at work and through student
exhibitions and discussions, and a
worksheet for division are
provided. Students should find the
answer mentally and are allowed to
write down the strategies they use
to divide.
(+17) + (– 6) = + 11
(– 22) + (+ 25) = + 3
(– 100) + (+ 25) = – 75
(+8) – (+2) = (+ 8) + (–2) = + 6
(+17) – (– 5) = (+ 17) + (+ 5) = + 22
(– 13) – (+6) = (– 13) + (– 6) = – 19
(– 23) – (– 16) = (– 23) + (+ 16) = – 7
(+ 6) × (+ 7) = + 42
(– 6) × (– 7) = + 42
(+ 26) ÷ (+2) = +13
(– 26) ÷ (–2) = + 13
(+ 12) × (–3) = – 36
(– 12) × (+ 12) = – 144
(+ 12) ÷ (– 3) = – 4
(– 12) ÷ (+2) = – 6
352
3. Independent practice
Students have time to review what they
have learned for the lesson. They need to
solve the problems using different
strategies.
4. Evaluation
Mental computation problems for division
using PPT are provided at the end of the
class. Students are graded based on the
correct answers and the strategies they
used to divide.

353
Lessons 8 & 9 – Mental Computation Strategies for Fractions, Decimals, and
Percentages
1. Introduction
Present a variety of 10 and 100 base block
grids and have the class figure out the
fractions, decimals, and percentages.
For example,
Ask the class to discuss the equivalence
between fractions, decimals and
percentages. (e.g., 1
4 , 0.25 and 25 %)
1. Introduction
Present or pose the following
mental computation problems for
fractions, decimals, and
percentages.
2. Introduce the purpose of the lesson
clearly and ensure what is expected
of students before they start to work
through speaking and asking for
questions.
Fraction _____ Fraction ______
Decimal _____ Decimal ______
Percentage ______ Percentage _______
Fraction ________ Fraction ________
Decimal ________ Decimal ________
Percentage _______ Percentage ________
3 𝟏
𝟒 – 2
𝟏
𝟐 =
𝟐
𝟑 ×
𝟔
𝟖 =
9% × 450 =
20 + 𝟒
𝟓 – 100% =
Position the decimal point
appropriately in 0000532315000,
so that it represents the product
of 3.35 × 15. 89
To develop your own mental
computation strategies for fractions,
decimals, and percentages.
To find effective or efficient mental
computation fraction, decimal, and
percentage strategies that are more
focused on conceptual understanding
To increase your mental computation
test performance and your flexibility
using alternative solutions

354
Provide grid papers for the class and ask
them to fill in the portions of 10 or 100
blocks when given problems of fractions,
decimals and percentages.
For example, half of 40, 𝟏
𝟐 × 40, 40 × 0.5, 50
% of 40.
Provide the following word problems to
develop students’ knowledge of how
numbers fit together logically.
2. Demonstrate Various Mental Computation
Strategies for Fractions, Decimals, and
Percentages
Mental Computation Strategies for fractions
A repeated multiplication strategy of
fraction: a sequential process that employ a
repeated multiplication
3. Encourage students’ natural ways
of thinking to generate a variety of
different responses and to select
answers that best fit the discussion
with a whole class.
4. Guide a discussion and compare
their responses where their different
answers are presented.
5. Summarize the outcome of the
lesson based on students’
discussion.
6. Evaluation
Teacher observations of students at
work and through student
exhibitions and discussions, and a
worksheet for division are provided.
Students should find the answer
mentally and are allowed to write
down the strategies they use to
divide.
4 × 3
4 = 2 ×
3
4 = 2 ×
3
2 = 3

355
Changing money strategy of fraction
(Conceptual knowledge of equivalents): the
problem involved changing the
representation of the fraction to a whole
number referent of 100.
Compensation: add or subtract the
appropriate whole number and then
compensate for over-calculation
Changing fraction into decimals
Mental Computation Strategies for decimals
Counting on or up: partition numbers
hundredths, tenths and ones, then count on
for addition and count up for subtraction
Reordering: changing the order of numbers
1
2 +
3
4 = ¢ 50 + ¢75 = $1.25 = 1
1
4
3
4 –
1
2 = ¢75 – ¢ 25 = ¢ 50 =
1
2
2
3 ×
6
8 (
6
8 = three quarters= ¢ 75)
= ¢ 75 × 2
3 = ¢ 75 ×
1
3 = ¢ 25 + ¢ 25 = ¢ 50 =
1
2
3 1
4 – 2
1
2 = 3.25 – 2.50 = .75
6 × 1
2 = 6 × 0.5 = 3
3 1
2 ÷
1
2= 3.5 ÷ 0.5 = 7
1.7 + 2.8 + 0.3 = 1.7 + 0.3 + 2.8 = 4.8
4.7 + 5.6 – 1.7 = 4.7 – 0.7 + 5.6 = 4 + 5.6 = 9.6
5.6 + 3.7 = 5.6 + 3 + 0.7 = 8. 6 + 0.7 = 9.3
4.4 – 3.2 = 4.4 – 3 – 0.2 = 1.4 – 0.2 = 1.2
21
2 + 1
3
4 = 2
1
2 + 2 –
1
4 = 3
1
4

356
Using doubling: use doubles when two
numbers are very close to each other
Making Ones, Ten(s), and Hundred(s)
Compensation: add or subtract the next
multiple of one(s), and then compensate for
over-calculation
Changing decimal numbers to fractions
Multiplying decimal numbers by the
multiples of 10 (Have students discuss why
the number of spaces the decimal shifts to
the right corresponds to the number of
zeroes in the multiplier).
Dividing decimal numbers by powers of 10
(Have students discuss why the number of
spaces the decimal shifts to the left
corresponds to the number of zeroes in the
divider.)
1.3 + 1.7 = 1.3 + 0.7 + 1.0 = 2 +1.0 = 3.0
30.7 + 0.45 = 30.7 + 0.3 + 0.15 = 31 + 0.15 =
31.15
8.3 – 2. 7 = 8.3 – 2.3 – 0.5 = 6- 0.5 = 5.5
5.7 + 3.9 = 5.7 + 4.0 – 0.1 = 9.7 – 0.1 = 9.8
6.8 – 4.9 = 6.8 – 5.0 + 0.1 = 3.8 + 0.1 = 3.9
0.5 + 0.5 = 1
2 +
1
2 =
2
2 = 1
0.5 + 0.75 = 1
2 +
3
4 =
5
4 = 1.25
0.25 × 10 = 1
4 × 10 =
10
4 =
5
2 = 2.5
5.4 + 5.7 = 5.4 + 5.4 + 0.3 = 10.8 + 0.3 = 11.1
5 × 10 = 50; 5 ×100 = 500; 5 × 1000 = 5000
0.5 × 10 = 5; 0.5 × 100 = 50 ; 0.5 × 1000 = 500
0.05 × 10 = 0.5; 0.05 × 100 = 5; 0.05 × 1000= 50
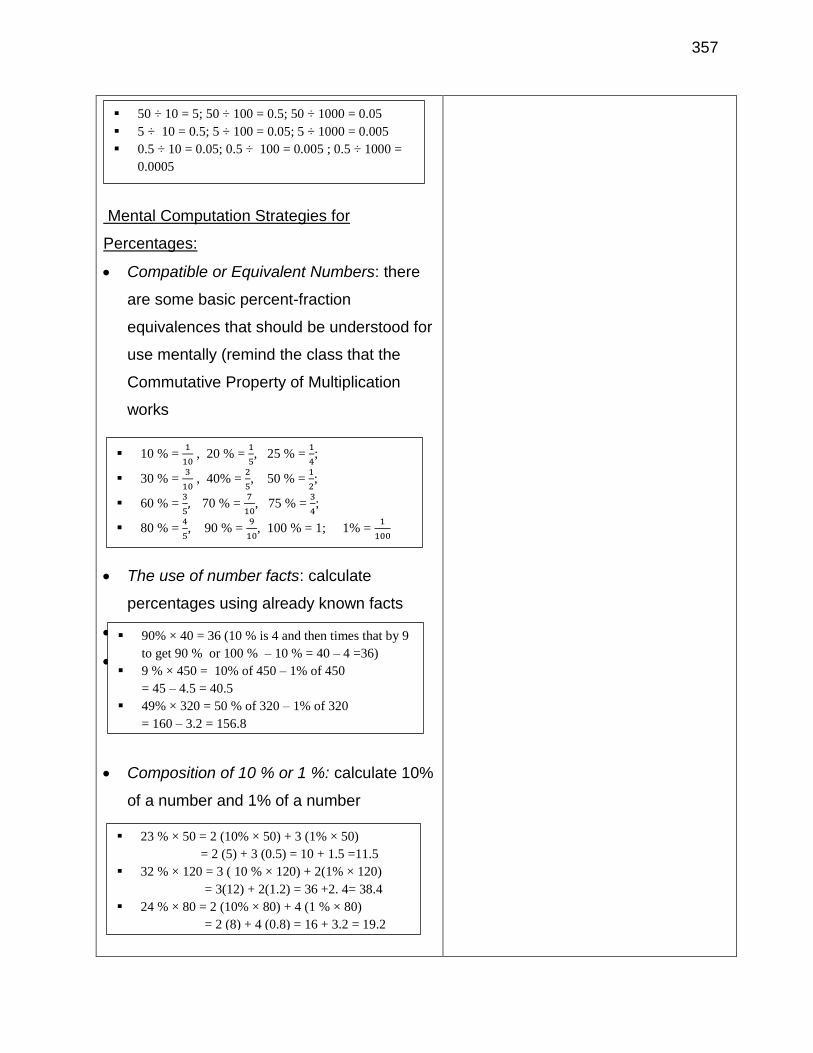
357
Mental Computation Strategies for
Percentages:
Compatible or Equivalent Numbers: there
are some basic percent-fraction
equivalences that should be understood for
use mentally (remind the class that the
Commutative Property of Multiplication
works
The use of number facts: calculate
percentages using already known facts
Composition of 10 % or 1 %: calculate 10%
of a number and 1% of a number
90% × 40 = 36 (10 % is 4 and then times that by 9
to get 90 % or 100 % – 10 % = 40 – 4 =36)
9 % × 450 = 10% of 450 – 1% of 450
= 45 – 4.5 = 40.5
49% × 320 = 50 % of 320 – 1% of 320
= 160 – 3.2 = 156.8
23 % × 50 = 2 (10% × 50) + 3 (1% × 50)
= 2 (5) + 3 (0.5) = 10 + 1.5 =11.5
32 % × 120 = 3 ( 10 % × 120) + 2(1% × 120)
= 3(12) + 2(1.2) = 36 +2. 4= 38.4
24 % × 80 = 2 (10% × 80) + 4 (1 % × 80)
= 2 (8) + 4 (0.8) = 16 + 3.2 = 19.2
10 % = 1
10 , 20 % =
1
5, 25 % =
1
4;
30 % = 3
10 , 40% =
2
5, 50 % =
1
2;
60 % = 3
5, 70 % =
7
10, 75 % =
3
4;
80 % = 4
5, 90 % =
9
10, 100 % = 1; 1% =
1
100
50 ÷ 10 = 5; 50 ÷ 100 = 0.5; 50 ÷ 1000 = 0.05
5 ÷ 10 = 0.5; 5 ÷ 100 = 0.05; 5 ÷ 1000 = 0.005
0.5 ÷ 10 = 0.05; 0.5 ÷ 100 = 0.005 ; 0.5 ÷ 1000 =
0.0005

358
Independent practice
Students are provided a worksheet that
involves fractions, decimals, and
percentages. Students need to show the
answer and their strategies to get the
answers as many ways as they can find.
4. Evaluation
Students are graded based on the correct
answers and the strategies they used for
fractions, decimals, and percentages
problems in their worksheet.
Lesson 10 – Mental Computation Evaluation
Summative Evaluation for Integers and
Rational Numbers
• Summative Evaluation for Integers
and Rational Numbers
Lesson 11- Posttest
7. Resources
Doerfler, R. W. (1993). Dead reckoning: calculating without instruments.
Houston: Gulf Pub. DfE (Department for Education) (2010) Teaching children to
calculate mentally. London: Department for Education. http://nationalstrategies.
standards.dcsf.gov.uk/nodc/428061

359
APPENDIX E
MENTAL COMPUTATION TEST (MCT)
PRETEST
Name _________________________ Date _______________________
Directions: Solve the following 69 problems mentally. Do not write anything down but
just answers mentally.
1.
10 + 76 =
2.
21
+ 45_
3.
17 + 17 =
4.
133 + 29 =
5.
145
+ 69
6.
22 + 17 + 11 =
7.
33
25
+ 27
8.
𝟏𝟎 ×𝟐𝟓
𝟏𝟎 × 𝟎 =
9.
28 – 4 =
10.
40
- 6
11.
83
– 27
12.
85 – 38 =
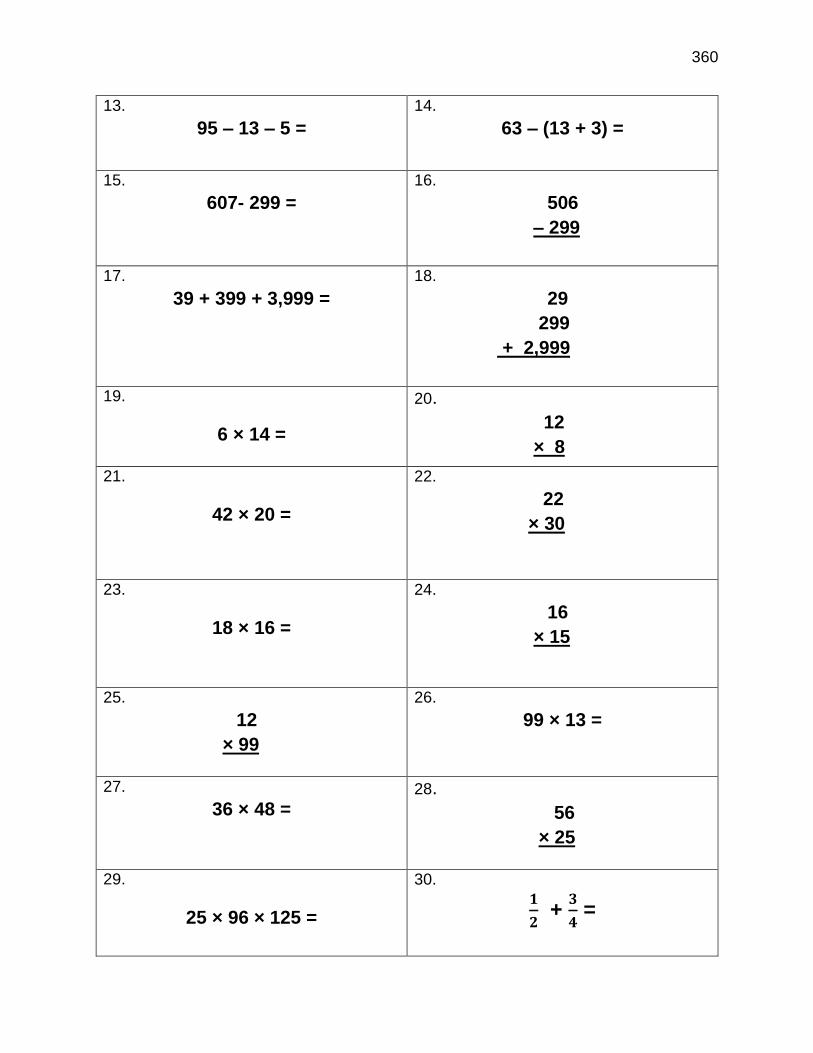
360
13.
95 – 13 – 5 =
14.
63 – (13 + 3) =
15.
607- 299 =
16.
506
– 299
17.
39 + 399 + 3,999 =
18.
29
299
+ 2,999
19.
6 × 14 =
20.
12
× 8
21.
42 × 20 =
22.
22
× 30
23.
18 × 16 =
24.
16
× 15
25.
12
× 99
26.
99 × 13 =
27.
36 × 48 =
28.
56
× 25
29.
25 × 96 × 125 =
30.
𝟏
𝟐 +
𝟑
𝟒 =
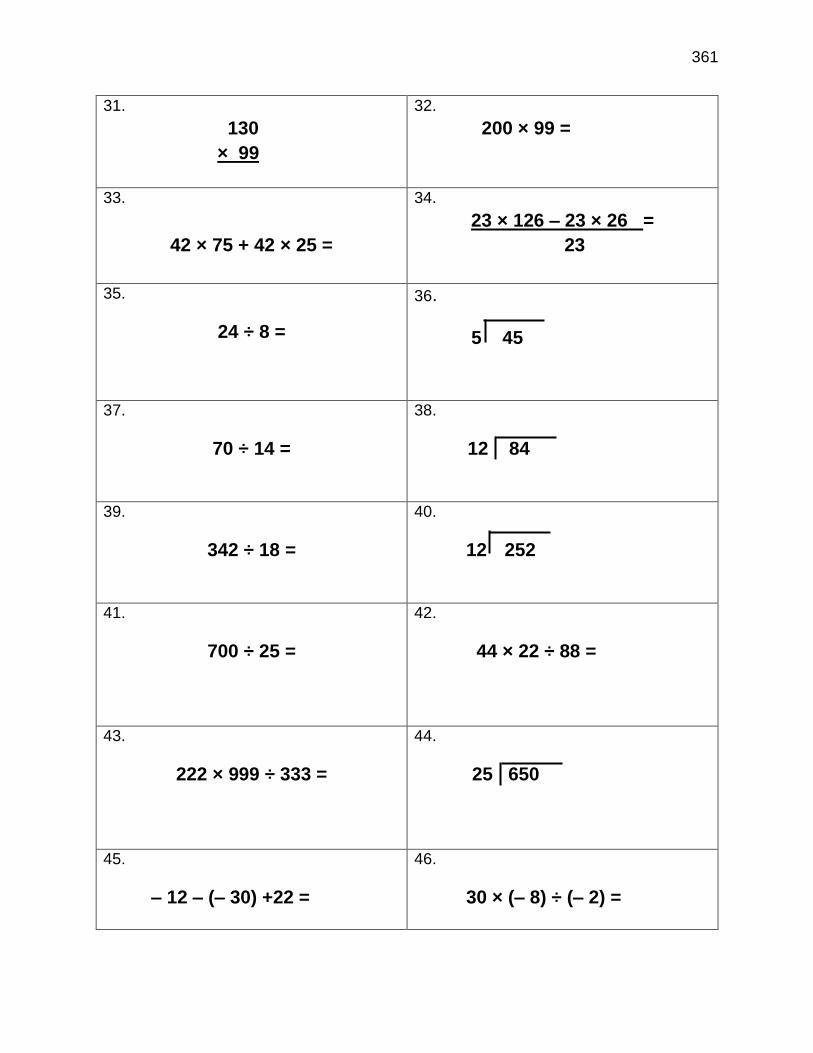
361
31.
130
× 99
32.
200 × 99 =
33.
42 × 75 + 42 × 25 =
34.
23 × 126 – 23 × 26 =
23
35.
24 ÷ 8 =
36.
5 45
37.
70 ÷ 14 =
38.
12 84
39.
342 ÷ 18 =
40.
12 252
41.
700 ÷ 25 =
42.
44 × 22 ÷ 88 =
43.
222 × 999 ÷ 333 =
44.
25 650
45.
– 12 – (– 30) +22 =
46.
30 × (– 8) ÷ (– 2) =
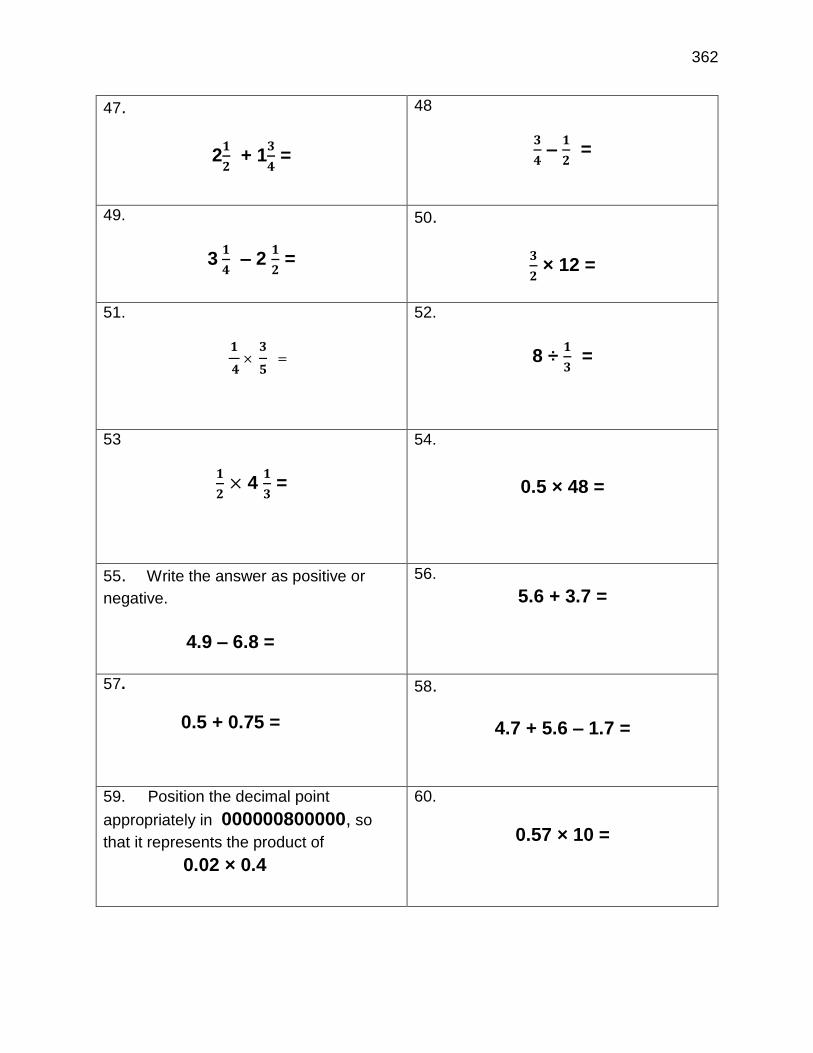
362
47.
2𝟏
𝟐 + 1
𝟑
𝟒 =
48
𝟑
𝟒 –
𝟏
𝟐 =
49.
3 𝟏
𝟒 – 2
𝟏
𝟐 =
50.
𝟑
𝟐 × 12 =
51.
𝟏
𝟒×
𝟑
𝟓 =
52.
8 ÷ 𝟏
𝟑 =
53
𝟏
𝟐 × 4
𝟏
𝟑 =
54.
0.5 × 48 =
55. Write the answer as positive or
negative.
4.9 – 6.8 =
56.
5.6 + 3.7 =
57.
0.5 + 0.75 =
58.
4.7 + 5.6 – 1.7 =
59. Position the decimal point
appropriately in 000000800000, so
that it represents the product of
0.02 × 0.4
60.
0.57 × 10 =
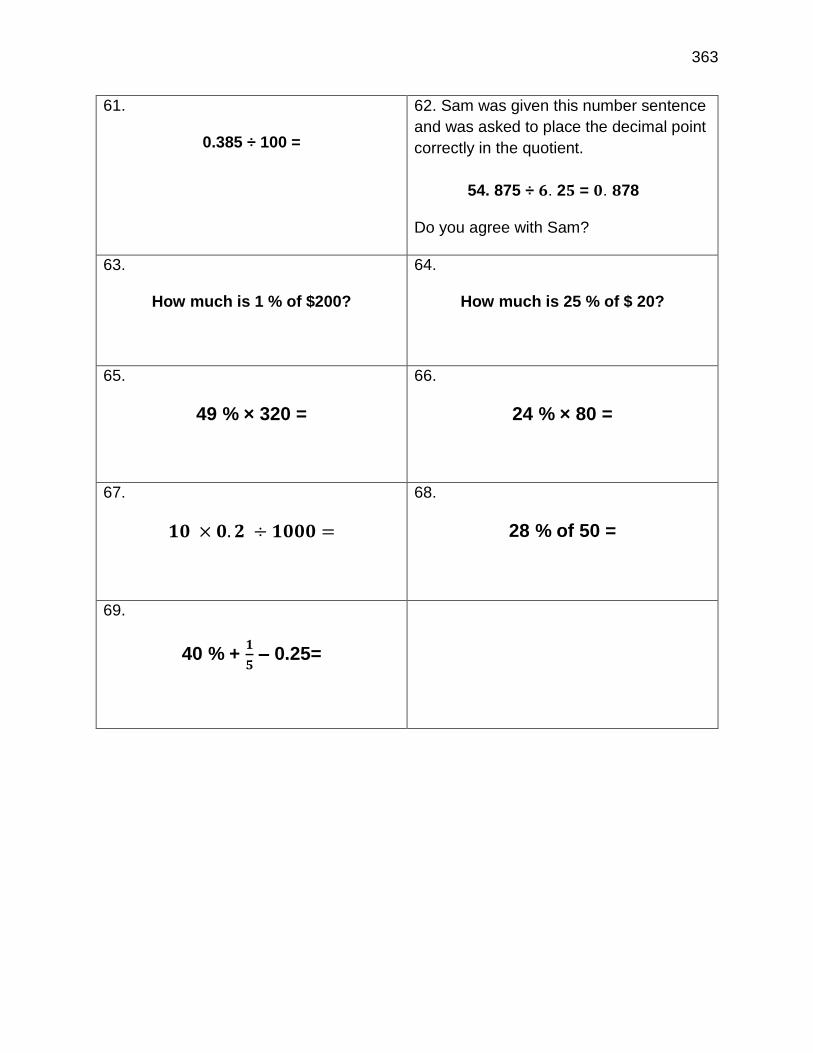
363
61.
0.385 ÷ 100 =
62. Sam was given this number sentence
and was asked to place the decimal point
correctly in the quotient.
54. 875 ÷ 𝟔. 2𝟓 = 𝟎. 𝟖78
Do you agree with Sam?
63.
How much is 1 % of $200?
64.
How much is 25 % of $ 20?
65.
49 % × 320 =
66.
24 % × 80 =
67.
𝟏𝟎 × 𝟎. 𝟐 ÷ 𝟏𝟎𝟎𝟎 =
68.
28 % of 50 =
69.
40 % + 𝟏
𝟓 – 0.25=

364
MENTAL COMPUTATION TEST (MCT)
POSTTEST
Name _________________________ Date _______________________
Directions: solve the following 50 problems mentally. Do not show your work.
1.
13 + 36 =
2.
32
+ 49
3.
16 + 16 =
4.
143 + 59 =
5.
129
+ 45
6.
18 + 27 + 37 =
7.
32
25
+ 28
8.
𝟐𝟓 ×𝟒 ×𝟎
𝟒 =
9.
36 – 8=
10.
4 5
- 7
11.
93
- 27
12.
95 – 37 =

365
13.
123 – 7 – 13 =
14.
83 – (14 + 3) =
15.
807- 399 =
16.
408
- 299
17.
499 + 49 + 4,999 =
18.
59
599
+ 5,999
19.
7 × 16 =
20.
14
× 7
21.
24 × 30 =
22.
36
× 20
23.
14 × 16 =
24. 17
× 16
25.
14
× 99
26.
99 × 17 =
27.
36 × 24 =
28.
48
× 32

366
29.
25 × 64 × 125 =
30. 𝟑
𝟓 +
𝟏
𝟐 =
31.
120
× 99
32.
180 × 99 =
33.
27 × 125 + 27 × 75 =
34.
17 × 125 - 17 × 25
𝟏𝟕 =
35.
56 ÷ 7 =
36.
8 72
37.
80 ÷ 16 =
38.
14 98
39.
468 ÷ 18 =
40.
12 360
41.
775 ÷ 25 =
42.
33 × 22 ÷ 66 =
43.
222 × 888 ÷ 444 =
44.
125 7000

367
45. – 13 – (– 37) + 20 = 46. 24 × 4 ÷ (– 6)=
47.
4 𝟏
𝟐 + 1
𝟑
𝟒 =
48.
𝟔
𝟖 –
𝟏
𝟐 =
49.
5 𝟏
𝟒 – 2
𝟏
𝟐 =
50.
𝟐
𝟑 × 18 =
51. 𝟏
𝟓 ×
𝟒
𝟕 =
52.
12 ÷ 𝟏
𝟑 =
53. 𝟏
𝟑 × 𝟒
𝟏
𝟓 =
54.
0.2 × 75 =
57. Write the answer as positive or
negative?
1.29 – 1.38 =
56.
5.8 + 2.6 =
57.
0.25 + 0.8=
58.
3.7 + 2.6 – 1.7– 1.3 =
59.
0.370 × 10 =
60. Position the decimal point appropriately
in 0000001910329400000, so that it
represents the product of
13.202 × 14.47

368
61.
0.75 ÷ 1000 =
62. April was given this number sentence
and was asked to place the decimal point
correctly in the quotient.
13. 94656 ÷ 4. 2𝟓 = 0.328
Do you agree with April?
63.
How much is 1 % of $175?
64.
How much is 75 % of $ 120?
65.
59 % × 450 =
66.
36 % × 80 =
67.
38 % of 60 =
68.
0.25+ 50 % + 𝟑
𝟒 =
69.
100 × 0.05 ÷ 1000 =

369
APPENDIX F
COMPARION OF DIFFERENT WAYS OF MENTAL COMPUTATION STRATEGIES
BETWEEN EXPERIMENTAL GROUPS
Comparison of Different Ways of Mental Computation Addition Strategies
Item Group Strategies Example % Correct
% Total Correct
16 + 9 = DT (n=13)
Compensation 16 + (10-1) = 25 23 100
Adding by place 10 + 6 + 9= 25; 31
Making 10s 15 + 10 = 25; 15 + 9 + 1 = 25; 20+ 5= 25
31
Using double number
6 + 6 + 3 + 10 = 25; 10 + 10 + 5 = 25
15
OA (n=14)
Compensation 16 + 10 – 1 = 25 7 64
Adding by place 9 + 6 + 10= 25 14
Making 10s 15 + 10 = 25; 16 + 4= 20, 9 – 4 = 5, 20 + 5 = 25 ; 16 – 1= 15, 9 + 1= 10, 15 + 10= 25; 16 + 4 + 5= 25;
36
Using double number
10 + 10 + 5= 25 7
20 + 70 = DT Basic fact 90 23 84
Making 10s 10 + 10 + 70 = 90 8
Adding by place 2+ 7= 9, then put 0 at the end 15
Using double number
20 + 50 + 20= 90 15
Distributive prop. (2 + 7) ×10 =90 15
Traditional 90 8
OA Basic fact 90 14 85
Making 10s 60 + 10 + 10 + 10= 90 7
Adding by place 7 +2= 9, then put 0 at the end 36
Using double number
50 + 20 + 20= 90 21
Distributive prop. (2+ 7) × 10 =90 7
Double 26 DT Using double number
26 + 26 = 52; 20 + 20 + 12 = 52;* 20 + 20 + 6 + 6 = 52; 25 + 25 + 2 = 52
77 85
Adding by place 10 + 10 + 10 + 10 + 6 + 6= 40 + 12 = 52 8
OA Using double number
25 + 25 + 1+1= 52; 20 + 20 + 6 +6= 52
64 78
Using multiplication
(25 × 2) + 2 = 52; 26 × 2 = 52
14
68 + 32 = DT Adding by place 60 + 30 + 8 + 2 = 100 54 100
Making 10s 70 +32 – 2 = 100; 70 + 30 = 100; 68 + 2 + 30 = 100
38
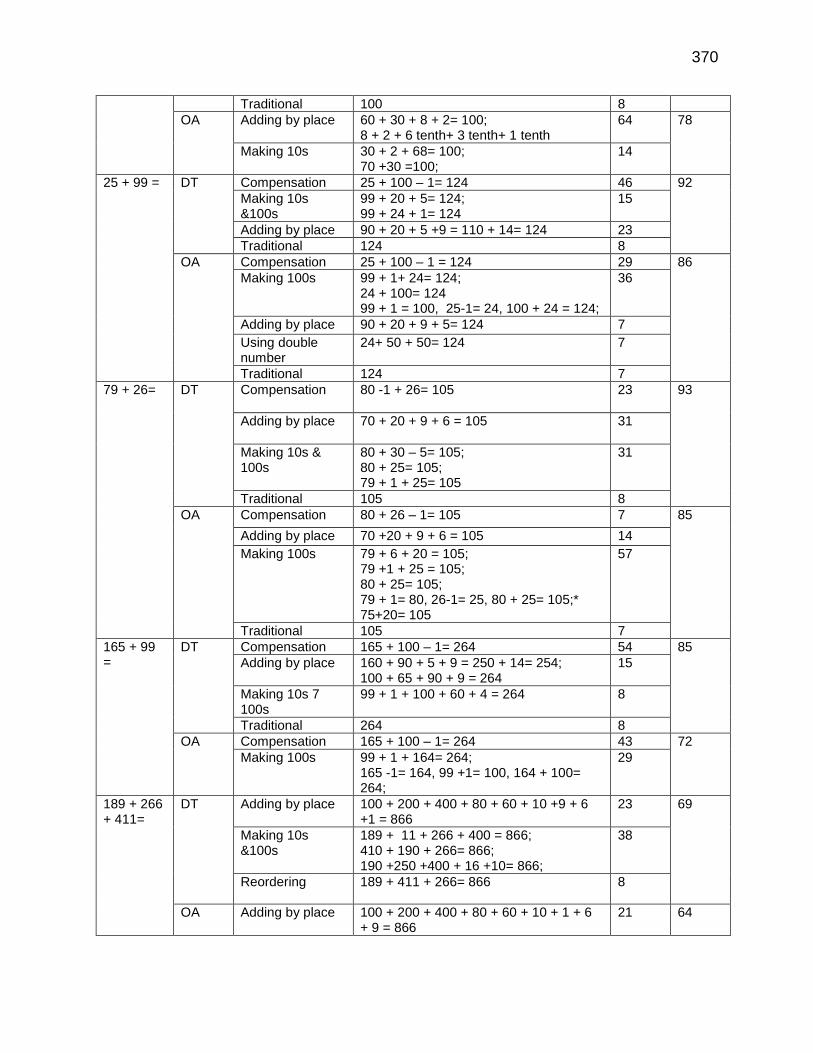
370
Traditional 100 8
OA Adding by place 60 + 30 + 8 + 2= 100; 8 + 2 + 6 tenth+ 3 tenth+ 1 tenth
64
78
Making 10s 30 + 2 + 68= 100; 70 +30 =100;
14
25 + 99 = DT Compensation 25 + 100 – 1= 124 46 92
Making 10s &100s
99 + 20 + 5= 124; 99 + 24 + 1= 124
15
Adding by place 90 + 20 + 5 +9 = 110 + 14= 124 23
Traditional 124 8
OA Compensation 25 + 100 – 1 = 124 29 86
Making 100s 99 + 1+ 24= 124; 24 + 100= 124 99 + 1 = 100, 25-1= 24, 100 + 24 = 124;
36
Adding by place 90 + 20 + 9 + 5= 124 7
Using double number
24+ 50 + 50= 124 7
Traditional 124 7
79 + 26= DT Compensation 80 -1 + 26= 105 23
93
Adding by place 70 + 20 + 9 + 6 = 105 31
Making 10s & 100s
80 + 30 – 5= 105; 80 + 25= 105; 79 + 1 + 25= 105
31
Traditional 105 8
OA Compensation 80 + 26 – 1= 105 7 85
Adding by place 70 +20 + 9 + 6 = 105 14
Making 100s 79 + 6 + 20 = 105; 79 +1 + 25 = 105; 80 + 25= 105; 79 + 1= 80, 26-1= 25, 80 + 25= 105;* 75+20= 105
57
Traditional 105 7
165 + 99 =
DT Compensation 165 + 100 – 1= 264 54 85
Adding by place 160 + 90 + 5 + 9 = 250 + 14= 254; 100 + 65 + 90 + 9 = 264
15
Making 10s 7 100s
99 + 1 + 100 + 60 + 4 = 264 8
Traditional 264 8
OA Compensation 165 + 100 – 1= 264 43 72
Making 100s 99 + 1 + 164= 264; 165 -1= 164, 99 +1= 100, 164 + 100= 264;
29
189 + 266 + 411=
DT Adding by place 100 + 200 + 400 + 80 + 60 + 10 +9 + 6 +1 = 866
23
69
Making 10s &100s
189 + 11 + 266 + 400 = 866; 410 + 190 + 266= 866; 190 +250 +400 + 16 +10= 866;
38
Reordering 189 + 411 + 266= 866 8
OA Adding by place 100 + 200 + 400 + 80 + 60 + 10 + 1 + 6 + 9 = 866
21
64
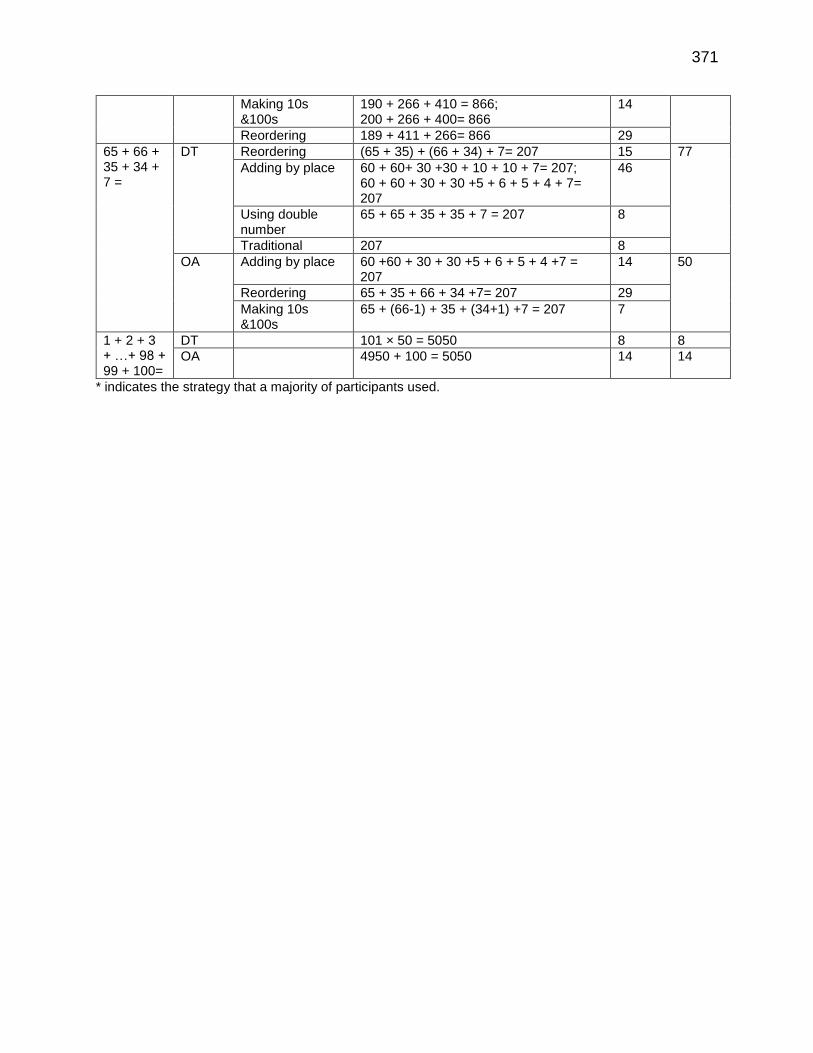
371
Making 10s &100s
190 + 266 + 410 = 866; 200 + 266 + 400= 866
14
Reordering 189 + 411 + 266= 866 29
65 + 66 + 35 + 34 + 7 =
DT Reordering (65 + 35) + (66 + 34) + 7= 207 15 77
Adding by place 60 + 60+ 30 +30 + 10 + 10 + 7= 207; 60 + 60 + 30 + 30 +5 + 6 + 5 + 4 + 7= 207
46
Using double number
65 + 65 + 35 + 35 + 7 = 207 8
Traditional 207 8
OA Adding by place 60 +60 + 30 + 30 +5 + 6 + 5 + 4 +7 = 207
14
50
Reordering 65 + 35 + 66 + 34 +7= 207 29
Making 10s &100s
65 + (66-1) + 35 + (34+1) +7 = 207 7
1 + 2 + 3 + …+ 98 + 99 + 100=
DT 101 × 50 = 5050 8 8
OA 4950 + 100 = 5050 14 14
* indicates the strategy that a majority of participants used.
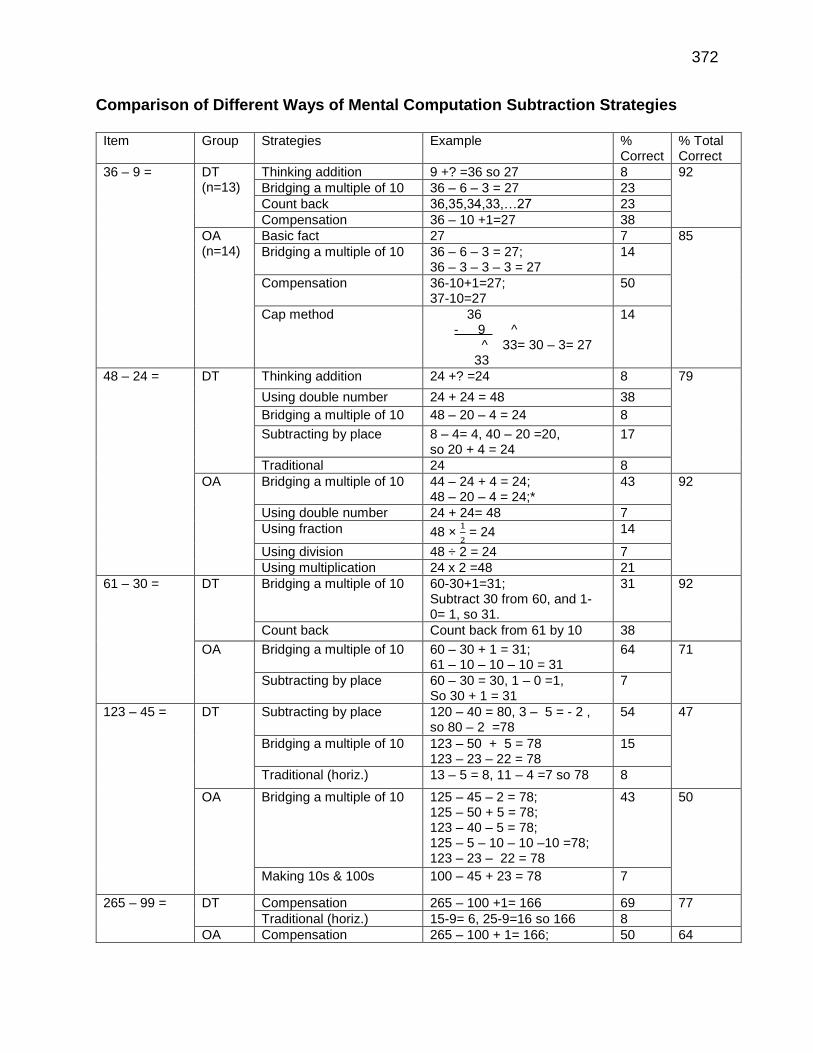
372
Comparison of Different Ways of Mental Computation Subtraction Strategies
Item Group Strategies Example % Correct
% Total Correct
36 – 9 = DT (n=13)
Thinking addition 9 +? =36 so 27 8 92
Bridging a multiple of 10 36 – 6 – 3 = 27 23
Count back 36,35,34,33,…27 23
Compensation 36 – 10 +1=27 38
OA (n=14)
Basic fact 27 7 85
Bridging a multiple of 10 36 – 6 – 3 = 27; 36 – 3 – 3 – 3 = 27
14
Compensation 36-10+1=27; 37-10=27
50
Cap method 36 - 9 ^
^ 33= 30 – 3= 27 33
14
48 – 24 = DT Thinking addition 24 +? =24 8 79
Using double number 24 + 24 = 48 38
Bridging a multiple of 10 48 – 20 – 4 = 24 8
Subtracting by place 8 – 4= 4, 40 – 20 =20, so 20 + 4 = 24
17
Traditional 24 8
OA Bridging a multiple of 10 44 – 24 + 4 = 24; 48 – 20 – 4 = 24;*
43 92
Using double number 24 + 24= 48 7
Using fraction 48 × 1
2 = 24 14
Using division 48 ÷ 2 = 24 7
Using multiplication 24 x 2 =48 21
61 – 30 = DT Bridging a multiple of 10 60-30+1=31; Subtract 30 from 60, and 1-0= 1, so 31.
31
92
Count back Count back from 61 by 10 38
OA Bridging a multiple of 10 60 – 30 + 1 = 31; 61 – 10 – 10 – 10 = 31
64 71
Subtracting by place 60 – 30 = 30, 1 – 0 =1, So 30 + 1 = 31
7
123 – 45 = DT Subtracting by place 120 – 40 = 80, 3 – 5 = - 2 , so 80 – 2 =78
54
47
Bridging a multiple of 10 123 – 50 + 5 = 78 123 – 23 – 22 = 78
15
Traditional (horiz.) 13 – 5 = 8, 11 – 4 =7 so 78 8
OA Bridging a multiple of 10 125 – 45 – 2 = 78; 125 – 50 + 5 = 78; 123 – 40 – 5 = 78; 125 – 5 – 10 – 10 –10 =78; 123 – 23 – 22 = 78
43 50
Making 10s & 100s 100 – 45 + 23 = 78 7
265 – 99 = DT Compensation 265 – 100 +1= 166 69 77
Traditional (horiz.) 15-9= 6, 25-9=16 so 166 8
OA Compensation 265 – 100 + 1= 166; 50 64
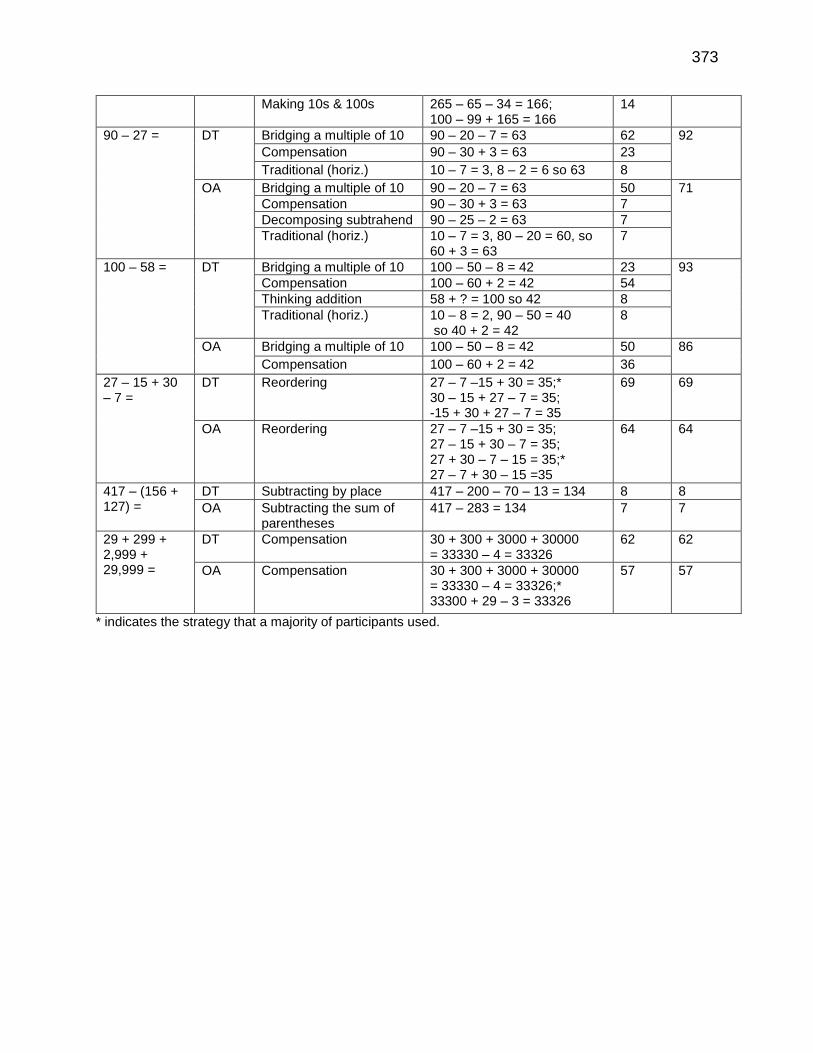
373
Making 10s & 100s 265 – 65 – 34 = 166; 100 – 99 + 165 = 166
14
90 – 27 = DT Bridging a multiple of 10 90 – 20 – 7 = 63 62 92
Compensation 90 – 30 + 3 = 63 23
Traditional (horiz.) 10 – 7 = 3, 8 – 2 = 6 so 63 8
OA Bridging a multiple of 10 90 – 20 – 7 = 63 50 71
Compensation 90 – 30 + 3 = 63 7
Decomposing subtrahend 90 – 25 – 2 = 63 7
Traditional (horiz.) 10 – 7 = 3, 80 – 20 = 60, so 60 + 3 = 63
7
100 – 58 = DT Bridging a multiple of 10 100 – 50 – 8 = 42 23 93
Compensation 100 – 60 + 2 = 42 54
Thinking addition 58 + ? = 100 so 42 8
Traditional (horiz.) 10 – 8 = 2, 90 – 50 = 40 so 40 + 2 = 42
8
OA Bridging a multiple of 10 100 – 50 – 8 = 42 50 86
Compensation 100 – 60 + 2 = 42 36
27 – 15 + 30 – 7 =
DT Reordering 27 – 7 –15 + 30 = 35;* 30 – 15 + 27 – 7 = 35; -15 + 30 + 27 – 7 = 35
69 69
OA Reordering 27 – 7 –15 + 30 = 35; 27 – 15 + 30 – 7 = 35; 27 + 30 – 7 – 15 = 35;* 27 – 7 + 30 – 15 =35
64 64
417 – (156 + 127) =
DT Subtracting by place 417 – 200 – 70 – 13 = 134 8 8
OA Subtracting the sum of parentheses
417 – 283 = 134 7 7
29 + 299 + 2,999 + 29,999 =
DT Compensation 30 + 300 + 3000 + 30000 = 33330 – 4 = 33326
62 62
OA Compensation 30 + 300 + 3000 + 30000 = 33330 – 4 = 33326;* 33300 + 29 – 3 = 33326
57 57
* indicates the strategy that a majority of participants used.

374
Comparison of Different Ways of Mental Computation Multiplication Strategies
Item Group Strategies Example % Correct
% Total Correct
12 × 4 = DT (n=12)
Basic fact 48 33 81
Doubling & halving 24 x 2 = 48 8
Using multiplication & repeated addition
10 x 4 + 4 + 4= 48
8
Repeated addition 12 + 12+ 12+12= 48 24 + 24= 48
17
Using factors 12 x 2 x 2 17
Distributive prop. (10 x 4) + (2 x 4)= 48; 8
OA (n=16)
Basic fact 48 13 96
Doubling & halving 12 + 12 = 24, 24 ×2 =48 13
Using multiplication & repeated addition
12 x 2 + 12 + 12 = 48; 4 x 10 + 4 + 4= 48
19
Using factors 12 x (2 +2)= 24 + 24= 48; 12 x 2= 24, 24 x 2 = 48
38
Distributive prop. (10 + 2) x 4 = 40 + 8 = 48 13
Using patterns 12 x 2= 24, 12 x 3= 36, 12 x 4= 48 1
60 × 12 = DT Basic fact 120 x 6= 720; 12 x 6 = 78, then put 0 at the end
25 66
Using factors 12 x 6 x 10= 720 8
Distributive Prop. 60 x (10 + 2)= 600 + 120= 720; 12 x (5 +1) = 72 then put 0 at end
25
Traditional 720 8
OA Basic fact 6 x 12 = 72 & put the 0 at the end 120 × 6= 720
19 63
Using factors 12 × 6= 72, 72 × 10 = 720 13
Distributive Prop. 60 x 10= 600, 2 x 60= 120 so 720; 19
German method 60 0 10 2 600 + 120= 720
600 0
120 0
6
Using multiplication & repeated addition
60 x 10 + 60 + 60 = 720
6
Traditional 720 6
14 × 99 = DT Compensation 14 x 100-14= 1386 50 50
OA Compensation 14 x 100-14= 1386 63 76
Traditional 1386 13
98 × 6 = DT Compensation 100 x 6 -12 = 588; 6 x (100-2)= 600 -12= 588
50 83
Traditional 588 33
OA Compensation 600 – 12 = 588; 98 + 98 + 98 + 98 + 98 + 98 =600 – 12 = 588
50 69
Distribution prop. 90 × 6= 540, 540 + 48 = 588 6
Traditional 588 13
23 × 199 = DT Compensation 23 x 200 – 23= 4577 50 50
OA Compensation 23 x 200 – 23= 4577 44 44
33 × 35 = DT
0 0

375
OA Vedic method 33 X 35 1155
6 38
German method 30 3 30 5 900 +150 + 90 +15= 1155
900 90
150 15
13
Partial product (30 + 3 ) x (30 + 5) = 900 + 150 + 90 + 15= 1155
6
Traditional 1155 13
125 × 40 = DT Basic fact 125 x 4 = 500, then put 0 at the end 17 59
Using factors 125 x 8 x 5 = 5000; 125 x 4 x 10 = 5000
42
OA Using factors 125 x 4= 500, 500 x 10= 5000 44 57
Traditional 5000 13
5 × 16 × 125 =
DT Making 100s & 1000s using factors
5 x 2 x 8 x 125 = 10 x 1000= 10000; 5 x 4 x 4 x 125 =10000; (5 x 16 ) x 125 = 80 x 125 = 10000
33 33
OA Making 100s & 1000s using factors
(5 × 2) × (8 × 125) =10 × 1000 =10000; 16 × 5= 80, 80 ×125= 10,000; 2000 × 5= 10000 (vert.)
19 32
Traditional 10,000 13
25 × 20 × 100 × 4 =
DT Reordering (25 x 4) x (20 x 100) = 20000; (100 x 20) x (25 x 4) = 200000
33 33
OA Basic facts 2000 x 100= 200000 (verti.) 6 62
Reordering (25 × 4) × (100 × 20) = 200000 ; 20 × 100 × 4 = 8000 × 25= 200000;
44
Making 100s & 1000s using factors
25 × 2 =50, 50 × 4= 200, 200 × 1000 = 200,000
6
Traditional 100 × 20 × 25 × 4= 200,000 (verti.) 6
35 × 55 + 35 × 45 =
DT Distributive prop. 35× (55 + 45) =3500 25 25
OA Distributive prop. 35× (55 + 45) =3500 31 37
Traditional 3500 6
* indicates the strategy that a majority of participants used.

376
Comparison of Different Ways of Mental Computation Division Strategies
Item Group Strategies Example % Correct
% Total Correct
Half of 52 = DT (n=12)
Halving 52 ÷2= 26 42 79
Distributive prop. (50 ÷2) + (2 ÷2)= 26 8
Partitioning the dividend
(50 + 2) ÷2 = 25 +1 = 26 13
Using multiplication 26 × 2= 52 8
Traditional 26 8
OA (n=16)
Partitioning the dividend
(50 + 2) ÷2 = 25 +1 = 26 38 100
Using patterns Half of 50 = 25, half of 52 = 26 12.5
Using multiplication 26 × 2= 52 31
Using double number 26 + 26 =52 6
Traditional 26 12.5
300 ÷ 6 = DT Using multiplication 50 × 6 = 300 42 82
Basic fact 30 ÷ 6 = 5, then put 0 at the end 33
Traditional 300 8
OA Basic fact 30 ÷ 6 = 5, then put 0 at the end; 30 ÷ 6 = 5 so 300 ÷ 6 = 50
25 69
Using multiplication 5 × 6 = 30 so 50 × 6= 300 6
Using factors 300 ÷ 3= 100, 100 ÷2 = 50 13
Partitioning the dividend
(360 – 60 ) ÷ 6= 60 – 10 = 50 6
Chunking method 50 6
Traditional 50 13
442 ÷ 8 = DT Partitioning the dividend
(400 ÷ 8) + (42 ÷ 8 )= 50 + 5.25 = 55.25
13 26
Traditional 55.25 13
OA Using fraction 400
8 = 50,
40
8 = 5,
2
8 =.25 , so 50 + 5
+.25 = 55.25
6 12
Traditional 55.25 6
132 ÷ 11= DT Basic fact 12 × 11 = 132 13 34
Partitioning the dividend
(110 +22) ÷11= 10 + 2 =12 8
Traditional 12 13
OA Using easy multiplication & repeated addition
11 × 10 + 11 + 11 = 132; 11 × 9 + 11 + 11 + 11= 132
19 69
Using double number 12 × 12 = 144, 144 – 12 = 132; 11 × 11 = 121, 121 + 11 =132
19
Traditional 12 31
240 ÷ 16 = DT Basic fact 240 ÷ 16 = 15 8 49
Partitioning the dividend
(160 + 80) ÷ 16 = 10 + 5 = 15 8
Using fraction 240
16 =
120
8=
60
4 = 15 17
Using double number 16 × 16= 256 -16=240 so 15 8
Using multiplication 16 × 15= 240 8
OA Partitioning the dividend
(160 + 80) ÷ 16 = 10 + 5 = 15; 6 50

377
Chunking method 15 6
Using multiplication 16 × 5= 80, 80 × 3 = 240 so 5 × 3= 15; 16 x 10= 160, 240 – 160=80, 16 x 5= 80 so 5 + 10 =15
13
Traditional 15 25
1600 ÷ 25 = DT Dividing the multiples of 100 by 25
16 × 100 ÷ 25 = 16 × 4 = 64 8 33
Partitioning the dividend
(1000 + 600) ÷ 25 = 40 + 24 = 64 8
Using multiplication 25 × 4 = 100, 4 × 16 = 64 17
OA Chunking method 64 6 43
Using multiplication 25 × 4 = 100, 4 × 16 = 64 25
Making 100s & 1000s using factors
25 x 4 = 100, 25 x 40= 1000, 25 x 20 = 500, so 40 + 20 + 4= 64
6
Traditional 64 6
3990 ÷ 19 = DT Traditional 210 6 6
OA Traditional 210 13 13
4750 ÷ 50= DT Traditional 95 33 33
OA Traditional 95 25 25
1375 ÷ 125 = DT Partitioning the dividend
(1000 + 375) ÷ 125 = 8 + 3 =11 17 33
Using patterns 125 ×10= 1250, 125 × 11= 1375 8
Traditional 11 8
OA Partitioning the dividend
(1250 + 125 ) ÷ 125 = 10 + 1= 11; (1000 + 375) ÷ 125 = 8 + 3 = 11
38 50
Making 100s & 1000s using factors
125 x 8 = 1000, 125 x 3= 375 so 8+3=11
6
Traditional 11 6
42 × 169 ÷ 13 ÷ 6 =
DT Reordering (42 ÷ 6) × (163 ÷13) = 7 × 13 = 91 25 33
Using factors 6 × 7 × 13 × 13 ÷ 13 ÷ 6 = 7 × 13 = 91
8
OA Reordering (42 ÷ 6 ) × (169 ÷13) = 7 ×13 = 91 169 ÷13 = 13, 42 x10= 420, 42 x 3= 126, 420 + 126 = 546, 546 ÷ 6 = 91
19 19
* indicates the strategy that a majority of participants used.
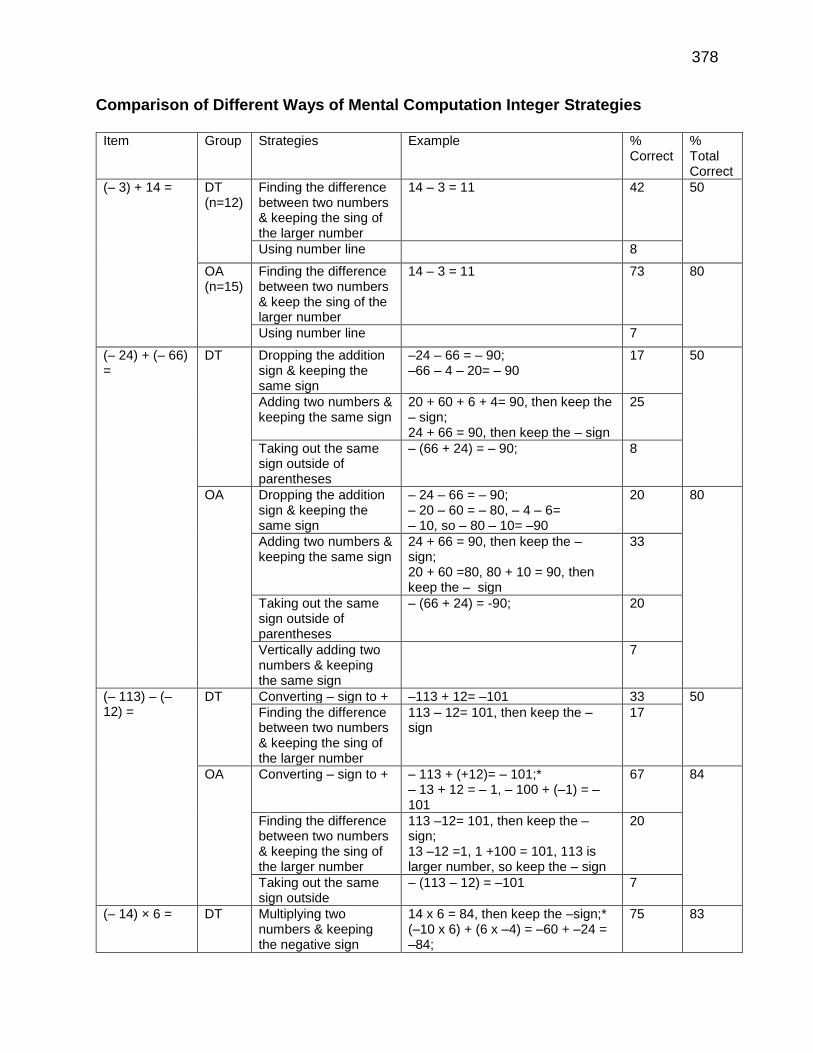
378
Comparison of Different Ways of Mental Computation Integer Strategies
Item Group Strategies Example % Correct
% Total Correct
(– 3) + 14 = DT (n=12)
Finding the difference between two numbers & keeping the sing of the larger number
14 – 3 = 11 42 50
Using number line 8
OA (n=15)
Finding the difference between two numbers & keep the sing of the larger number
14 – 3 = 11 73 80
Using number line 7
(– 24) + (– 66) =
DT Dropping the addition sign & keeping the same sign
–24 – 66 = – 90; –66 – 4 – 20= – 90
17 50
Adding two numbers & keeping the same sign
20 + 60 + 6 + 4= 90, then keep the – sign; 24 + 66 = 90, then keep the – sign
25
Taking out the same sign outside of parentheses
– (66 + 24) = – 90;
8
OA Dropping the addition sign & keeping the same sign
– 24 – 66 = – 90; – 20 – 60 = – 80, – 4 – 6= – 10, so – 80 – 10= –90
20 80
Adding two numbers & keeping the same sign
24 + 66 = 90, then keep the – sign; 20 + 60 =80, 80 + 10 = 90, then keep the – sign
33
Taking out the same sign outside of parentheses
– (66 + 24) = -90;
20
Vertically adding two numbers & keeping the same sign
7
(– 113) – (– 12) =
DT Converting – sign to + –113 + 12= –101 33 50
Finding the difference between two numbers & keeping the sing of the larger number
113 – 12= 101, then keep the – sign
17
OA Converting – sign to + – 113 + (+12)= – 101;* – 13 + 12 = – 1, – 100 + (–1) = –101
67 84
Finding the difference between two numbers & keeping the sing of the larger number
113 –12= 101, then keep the – sign; 13 –12 =1, 1 +100 = 101, 113 is larger number, so keep the – sign
20
Taking out the same sign outside
– (113 – 12) = –101 7
(– 14) × 6 = DT Multiplying two numbers & keeping the negative sign
14 x 6 = 84, then keep the –sign;* (–10 x 6) + (6 x –4) = –60 + –24 = –84;
75 83
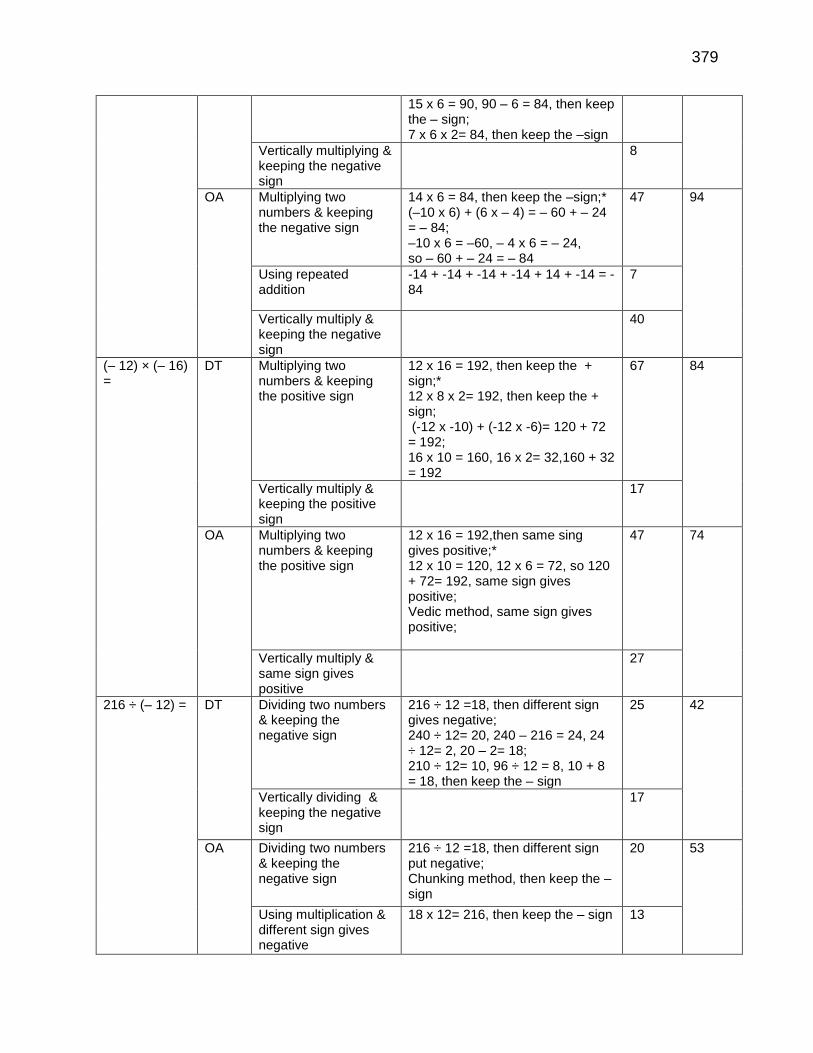
379
15 x 6 = 90, 90 – 6 = 84, then keep the – sign; 7 x 6 x 2= 84, then keep the –sign
Vertically multiplying & keeping the negative sign
8
OA Multiplying two numbers & keeping the negative sign
14 x 6 = 84, then keep the –sign;* (–10 x 6) + (6 x – 4) = – 60 + – 24 = – 84; –10 x 6 = –60, – 4 x 6 = – 24, so – 60 + – 24 = – 84
47 94
Using repeated addition
-14 + -14 + -14 + -14 + 14 + -14 = -84
7
Vertically multiply & keeping the negative sign
40
(– 12) × (– 16) =
DT Multiplying two numbers & keeping the positive sign
12 x 16 = 192, then keep the + sign;* 12 x 8 x 2= 192, then keep the + sign; (-12 x -10) + (-12 x -6)= 120 + 72 = 192; 16 x 10 = 160, 16 x 2= 32,160 + 32 = 192
67 84
Vertically multiply & keeping the positive sign
17
OA Multiplying two numbers & keeping the positive sign
12 x 16 = 192,then same sing gives positive;* 12 x 10 = 120, 12 x 6 = 72, so 120 + 72= 192, same sign gives positive; Vedic method, same sign gives positive;
47 74
Vertically multiply & same sign gives positive
27
216 ÷ (– 12) = DT Dividing two numbers & keeping the negative sign
216 ÷ 12 =18, then different sign gives negative; 240 ÷ 12= 20, 240 – 216 = 24, 24 ÷ 12= 2, 20 – 2= 18; 210 ÷ 12= 10, 96 ÷ 12 = 8, 10 + 8 = 18, then keep the – sign
25 42
Vertically dividing & keeping the negative sign
17
OA Dividing two numbers & keeping the negative sign
216 ÷ 12 =18, then different sign put negative; Chunking method, then keep the – sign
20 53
Using multiplication & different sign gives negative
18 x 12= 216, then keep the – sign
13
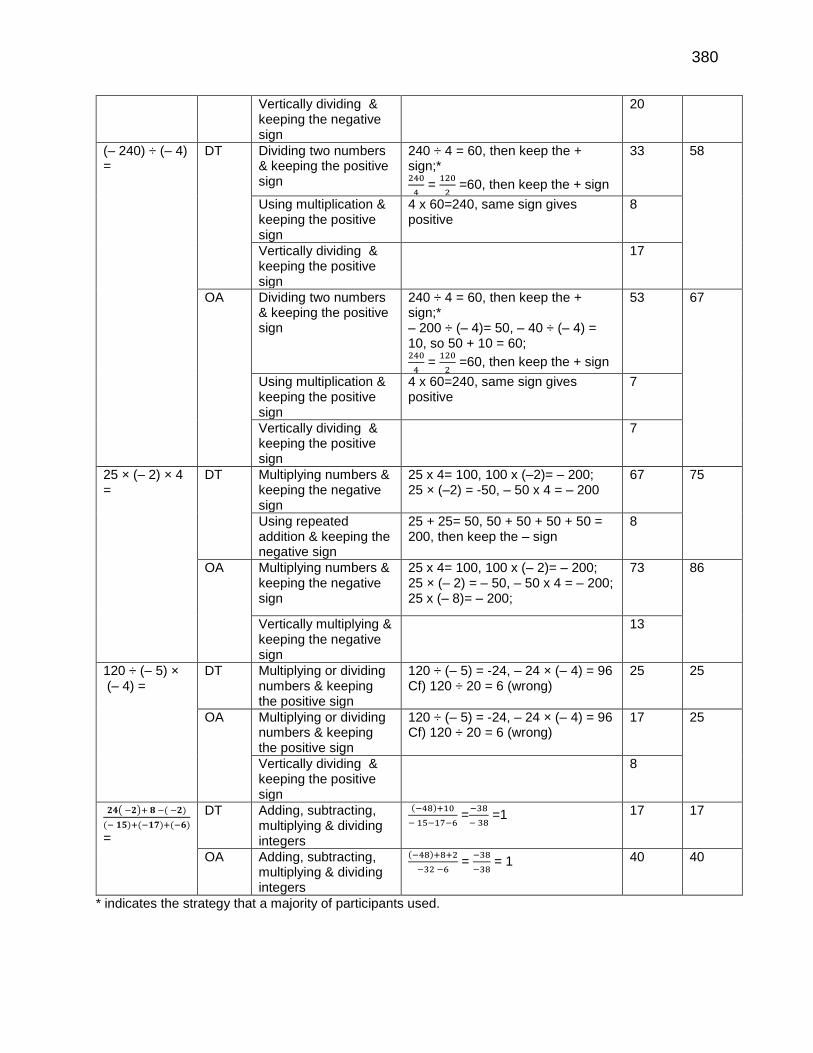
380
Vertically dividing & keeping the negative sign
20
(– 240) ÷ (– 4) =
DT Dividing two numbers & keeping the positive sign
240 ÷ 4 = 60, then keep the + sign;* 240
4 =
120
2 =60, then keep the + sign
33 58
Using multiplication & keeping the positive sign
4 x 60=240, same sign gives positive
8
Vertically dividing & keeping the positive sign
17
OA Dividing two numbers & keeping the positive sign
240 ÷ 4 = 60, then keep the + sign;* – 200 ÷ (– 4)= 50, – 40 ÷ (– 4) = 10, so 50 + 10 = 60; 240
4 =
120
2 =60, then keep the + sign
53 67
Using multiplication & keeping the positive sign
4 x 60=240, same sign gives positive
7
Vertically dividing & keeping the positive sign
7
25 × (– 2) × 4 =
DT Multiplying numbers & keeping the negative sign
25 x 4= 100, 100 x (–2)= – 200; 25 × (–2) = -50, – 50 x 4 = – 200
67 75
Using repeated addition & keeping the negative sign
25 + 25= 50, 50 + 50 + 50 + 50 = 200, then keep the – sign
8
OA Multiplying numbers & keeping the negative sign
25 x 4= 100, 100 x (– 2)= – 200; 25 × (– 2) = – 50, – 50 x 4 = – 200; 25 x (– 8)= – 200;
73 86
Vertically multiplying & keeping the negative sign
13
120 ÷ (– 5) × (– 4) =
DT Multiplying or dividing numbers & keeping the positive sign
120 ÷ (– 5) = -24, – 24 × (– 4) = 96 Cf) 120 ÷ 20 = 6 (wrong)
25 25
OA Multiplying or dividing numbers & keeping the positive sign
120 ÷ (– 5) = -24, – 24 × (– 4) = 96 Cf) 120 ÷ 20 = 6 (wrong)
17 25
Vertically dividing & keeping the positive sign
8
𝟐𝟒( −𝟐)+ 𝟖 −( −𝟐)
(− 𝟏𝟓)+(−𝟏𝟕)+(−𝟔)
=
DT Adding, subtracting, multiplying & dividing integers
(−48)+10
− 15−17−6 =
−38
− 38 =1 17 17
OA Adding, subtracting, multiplying & dividing integers
(−48)+8+2
−32 −6 =
−38
−38 = 1 40 40
* indicates the strategy that a majority of participants used.

381
Comparison of Different Ways of Mental Computation Fraction, Decimal, and
Percent Strategies
Item Group Strategies Example % Correct
% Total Correct
1
2 +
1
4 =
DT (n=12)
Making the same denominator
2
4 +
1
4 =
3
4
17 59
Converting fraction into decimal
0.5 + 0.25 = 0.75 25
Converting fraction into money
50 cents + 25 cents = 75 cents 17
OA (n=15)
Making the same denominator
2
4 +
1
4 =
3
4
53 73
Converting fraction into money
50 cents + 25 cents = 75 cents 7
Using drawing
13
0.5 + 0.75 – 0.8 = DT Basic fact 0.5 + 0.75 – 0.8 = 0.45 17 51
Reordering 0.75 – 0.8 + 0.5 = 0.45 17
Converting decimal into money
50 cents + 25 cents – 80 cents =75 cents
17
OA Basic fact 0.5 + 0.75 – 0.8 = 0.45 20 61
Using double number (0.5 + 0.5 ) + 0.25 – 0.8 = 1.25 20
Reordering (0.5 – 0.8) +0.75 = 1.25 7
Converting decimal into money
50 cents + 25 cents – 80 cents =75 cents
7
Traditional 0.45 7
1.5 × 25 = DT Multiplying two numbers & placing the decimal pt.
(1 + 0.5 ) × 25 = 25 + 12.5 = 37.5
17 25
Traditional 37.5 8
OA Multiplying two numbers & placing the decimal pt.
(1 + 0.5 ) × 25 = 25 + 12.5 = 37.5; Using Vedic multiplication & moved one decimal place to the left side.
13 53
Traditional 37.5 20
1 1
2 +
3
4 =
DT Adding whole number & making the same denominator
1 + 2
4 +
3
4 =2
1
4 17 59
Converting fraction into decimal
1.5 + .75 =2.25 42
OA Making the same denominator
1 2
4 +
3
4 =1
5
4 = 2
1
4;
4
4+
2
4+
3
4 = =
9
4;
47 67

382
3
2 +
3
4 =
6
4 +
3
4 =
9
4
Compensation 11
2 + (1–
1
4) = 2
1
2 –
1
4 = 2
1
4 7
Adding whole number & making the same denominator
1+ 5
4 = 2
1
4 13
5 1
4 – 3
1
2 =
DT Making the same denominator
21
4 –
14
4=
7
4 17 67
Chaining faction into decimal
5.25 – 3.5= 1.75 42
Subtracting whole number & Making the same denominator
5 – 3 = 2, 21
4 –
1
2 = 1
3
4 8
OA Making the same denominator
21
4 -
7
2=
21
4 -
14
4 =
7
4 33 47
Subtracting whole number & Making the same denominator
5 – 3 = 2, 21
4 –
1
2 =
9
4 –
2
4 =
7
4 7
Using drawing
7
50 % × 48 =
DT Converting percent into fraction
1
2 × 48= 24 42 84
Converting percent into decimal
48 × 0.5= 24 17
Using division 48 ÷2 = 24 25
OA Converting percent into fraction
1
2 × 48= 24 13 53
Converting percent into decimal
48 × 0.5= 24 20
Using division 48 ÷2 = 24 20
0.3 × 100 ÷ 1000 =
DT Multiplying decimal number by powers of 10
30 ÷ 1000= 0.03 42 42
OA Multiplying decimal number by powers of 10
30 ÷ 1000= 0.03 25 25
39 % × 420 =
DT Converting percent into decimal
0.39 x 420= 163.8 8 16
Using known fact (40 % -1 %) × 420 = 168-4.2= 163.8
8
OA Converting percent into decimal
0.39 x 420= 163.8 7 20
Using known fact (40 % -1 %) × 420 = 168-4.2= 163.8
13
0. 25 + 3
4 – 75% =
DT Converting percent into fraction
0.25 + 3
4 -
3
4= 0.25 8 91
Converting to all fractions
1
4 +
3
4 -
3
4 =
1
4 17

383
Converting to all decimals
1 - .75 = .25; 0.25 +0.75 -0.75 = 1-0.75=0.25*
58
Converting to all money
25 cents + 75 cents –75 cents = 25 cents
8
OA Converting percent into fraction
0.25 + 3
4 -
3
4= 0.25 13 79
Converting to all fraction
1
4 +
3
4 -
3
4 =
1
4 13
Converting to all decimal
0.25 + 0.75 - 0.75 = 0.25 53
Position the decimal point appropriately in 00003751875000, so that it represents the product of 33.35 × 11.25.
DT Using approximate numbers
33 × 11= 363 so 375.1875 8 8
OA Using approximate numbers
5 x 5 = 25, 11. 25 x 33. 35 (2 place after decimal x 2 places after decimal= 4 places after decimal);
27 34
Traditional 7
* indicates the strategy that a majority of participants used.

384
VITA
Graduate School Southern Illinois University
Eunmi Joung [email protected] Chosun University, South Korea Bachelor of Arts, English Language, February 1999 Southern Illinois University, Carbondale Master of Arts, Linguistics, May 2003 Southern Illinois University, Carbondale Master of Science in Education, Curriculum and Instruction, May 2013 Special Honors and Awards: Fall 2017 Dissertation Research Assistantship Award April 2014 Elmer J. and Grace C. Clark Doctoral Scholar Award April 2012 Cummings Scholarship Award Dissertation Title: A Study of Preservice Teachers’ Mental Computation Attitudes, Knowledge, and Flexibility in Thinking for Teaching Mathematics Major Professor: Jerry P. Becker Publications: Byun, J., & Joung, E. (2018). Digital game-based learning for K-12 mathematics education: A meta-analysis. School Science and Mathematics Journal. doi: 10.1111/ssm.12271


