
Graduate Theses and Dissertations Iowa State University Capstones, Theses andDissertations
2015
A study for increasing reusable cup consumption inthe coffee industry: focused on behavior changewith motivationJoongsup LeeIowa State University
Follow this and additional works at: https://lib.dr.iastate.edu/etd
Part of the Art and Design Commons
This Thesis is brought to you for free and open access by the Iowa State University Capstones, Theses and Dissertations at Iowa State University DigitalRepository. It has been accepted for inclusion in Graduate Theses and Dissertations by an authorized administrator of Iowa State University DigitalRepository. For more information, please contact [email protected].
Recommended CitationLee, Joongsup, "A study for increasing reusable cup consumption in the coffee industry: focused on behavior change with motivation"(2015). Graduate Theses and Dissertations. 14847.https://lib.dr.iastate.edu/etd/14847
A study for increasing reusable cup consumption in the coffee industry:
Focused on behavior change with motivation
by
Joongsup Lee
A thesis submitted to the graduate faculty
in partial fulfillment of the requirements for the degree of
MASTER OF FINE ARTS
Major: Graphic Design
Program of Study Committee:
Roger Baer, Major Professor
Debra Satterfield
Mimi Wagner
Iowa State University
Ames, Iowa
2015
Copyright © Joongsup Lee, 2015. All rights reserved.

ii
TABLE OF CONTENTS
LIST OF FIGURES····························································································iii LIST OF TABLES·····························································································iv
ABSTRACT·····································································································v
CHAPTER 1. INTRODUCTION·············································································1
1.1 Overview of Terms ················································································1
1.2 Research Methods·················································································3
1.3 Problem Observations·············································································3
1.3.1 Coffee markets in the world and North America····································3
1.3.2 What is the problem of using paper cups·············································4
1.3.3 Other researches for sustainable and reusable cups for hot beverage·············6
1.3.4 Why do people not use reusable cups? ·············································8
1.4. Questions ··························································································8
CHAPTER 2. REVIEW OF LITERATURE ·······························································10
2.1 What is Behavior Changing? ···································································10
2.1.1 Learning process ······································································11
2.1.2 Decision making process ····························································13
2.1.3 Behavior change theory ····························································15
2.2 Stages of Change Theory ······································································16
2.2.1 The stage of change theory; TTM model ··········································16
2.2.2 Each steps of ‘Stages of Change’ ···················································17
2.3 Case Studies of the Stages of Change Theory·················································19
2.3.1 Smoking cessation····································································20
2.3.2 Losing weight behavior ············································· ················22
2.3.3 Other outcomes by the theory························································22
2.4 Conclusions from the Literature································································24
iii
CHAPTER 3. METHODOLOGY ··········································································25
3.1 Analysis of Coffee Consumers··································································25
3.1.1 Research objectives···································································25
3.1.2 Research procedures··································································25
3.1.3 Demographic information of participants··········································27
3.1.4 Results from the survey·······························································29
3.1.5 Results from the interview···························································39
3.1.6 Conclusions from the analysis······················································40
3.2 Research of Environment Strategy for Existing Beverage Brands··························41
3.2.1 Research of Starbucks································································41
3.2.2 Problem statement of Starbucks·································· ··················44
` 3.2.3 Apply the Stages of Change theory for Starbucks································47
3.3 Design Solutions for Each of Stage·····························································51
3.3.1 Design solutions for stage of Pre-contemplation··································51
3.3.2 Design solutions for stage of Contemplation······································52
3.3.3 Design solutions for stage of Preparation for Action·····························53
3.3.4 Design solutions for stage of Action················································54
3.3.5 Design solutions for stage of Maintenance········································55
3.4 Design System for Sustainable Package: Green Number Project ······················56
3.4.1 Information graphic design··························································56
3.4.2 Eco friendly reusable cup design····················································58
3.4.3 User interface design··································································59
3.4.4 Brand and service design·····························································61
3.4.5 Information and experience design··················································63
CHAPTER 4. CONCLUSIONS AND IMPLICATIONS················································64
APPENDIX A. INSTITUTIONAL REVIEW BOARD APPROVAL ·································66
APPENDIX B. ATTACHMENTS FOR THE INTERVEW & SURVEY······························69
BIBLIOGRAPHY ····························································································81

iv
LIST OF FIGURES
Figure 1: Edible cups by http://www.thewayweseetheworld.com/ ............................................... 6
Figure 2: Symbol and logo of the COFFEE PROJECT / Take around Tumbler ........................... 7
Figure 3: The model of Behavior change flow ............................................................................ 11
Figure 4: The multi-store memory model .................................................................................... 13
Figure 5: Spectrum of thinking interventions .............................................................................. 14
Figure 6: The building behavior change model ........................................................................... 15
Figure 7: The model of Stages of Change flow ........................................................................... 17
Figure 8. Goal and progress for recycling in stores ................................................................... 45
Figure 9. Goal and progress of reducing waste with reusable cups ............................................ 46
Figure 10. Information graphic about paper cup consumption,
designed by Joongsup Lee, 2012 ............................................................................... 57
Figure 11. Tumbler design for Green Number project, designed by Joongsup Lee, 2012 .......... 58
Figure 12. QR code on the Green Number tumbler, designed by Joongsup Lee ....................... 60
Figure 13. User interface design for Green Number App, designed by Joongsup Lee .............. 60
Figure 14. Brand design for Green Number App, designed by Joongsup Lee ............................ 62
Figure 15. Providing prompt feedback system, designed by Joongsup Lee ................................ 63

v
LIST OF TABLES
Table 1: Top 100 chains: U.S. sales, all results are in $ millions.
http://nrn.com/us-top-100/top-100-chains-us-sales ....................................................... 2
Table 2: Figure depict annual consumption statistics and are based on calculations by
www.PaperCalculator.org and the Environmental Defense Fund. ............................... 5
Table 3: The various tools the mind uses to choose the right action ........................................... 14
Table 4: Effective of TTM ........................................................................................................... 21
Table 5: Age range of survey participants ................................................................................... 28
Table 6: What is your gender? ..................................................................................................... 29
Table 7: Average number of buying beverage each week ........................................................... 29
Table 8: Average number of buying beverage each week ........................................................... 30
Table 9: Result of selection weather participants use reusable cup or not. ................................. 30
Table 10: What kind of reusable cup do you have? (Multiple choice) ........................................ 31
Table 11: Main reasons for using reusable cups .......................................................................... 32
Table 12: Frequency of using reusable cups ................................................................................ 33
Table 13: Problems when participants use reusable cup ............................................................. 33
Table 14: How much interest do you have regarding environmental issues? .............................. 34
Table 15: Did you know that economic incentives are offered to consumers
who use a reusable cup?” ............................................................................................ 35
Table 16: What are your main reasons for not carrying a reusable cup? (Multiple choice) ........ 36
Table 17: Which one is the most inconvenient value when you carrying a reusable cup ........... 37
Table 18: If you decide to use a reusable cup, what kind of reusable cup do you select? ........... 38
Table 19: What are your main reasons to select the reusable cup? ............................................. 38
Table 20: Total U.S. retail coffee market (both in-home and out-of-home consumption) .......... 43
Table 21. Precontemplation; not ready to change ........................................................................ 47
Table 22, Contemplation; just thinking of changing ................................................................... 48
Table 23. The preparation/determination stage; ready to change ................................................ 49
Table 24. The action and willpower; making change .................................................................. 50
Table 25. The maintenance; staying on track .............................................................................. 51
Table 26. Design solutions for the first stage .............................................................................. 52
Table 27. Design solutions for the second stage .......................................................................... 53
Table 28. Design solutions for the third stage ............................................................................. 54
Table 29. Design solutions for the fourth stage ........................................................................... 55
Table 30. Design solutions for the last stage ............................................................................... 56

vi
ABSTRACT
The use of reusable cups as a solution for the issues on waste and environment destruction
has been brought up and is not that of a new topic. Although this has been an issue for decades and
there had been suggested solutions, we still could not solve the problem until now. The issue is
getting worse with the recent expansion of the hot beverage business market.
I believe we have to change our perspective on how we view the problem. It's not that
people can not recognize or are ignoring this problem, they just have a hard time putting it into
action. It is necessary to find out if there is a more fundamental problem in the series of actions
required to the people to solve the problem. In this perspective, this research first checks whether
the customers of the hot beverage business, that use the largest amount of disposal cups, are aware
of the issue. Next, if they are aware find out what stops them from taking action. Finally, by
proposing new solutions for the causes, help the consumers actively reduce the consumption of
disposable cups and rather use reusable cups instead.
In order to approach the goal that was mentioned beforehand, I have visited a local beverage
shop that had the biggest crowd of customers and conducted a survey and interviews. (Appendix B)
Through this process of involving in the scene, it was able to define the substantial problems, while
also applying the most representative behavioral change theory, 'Stage of Change Theory'. This
vii
theory classifies and defines the consumers' behavior in stages and provides a solution for an
appropriate behavioral change in each stage. It proposes an effective guide line on how the
consumers should determine what to do. Also, find the elements that can be solved with the
designers' view out of a variety of solutions that can come out of each stage. After defining the
elements provide a solution with design.
We can define the role of the design area apart from other various academic approaches of
behavior change of people through this process. I hope design is not just an assistance for
behavioral change, but that the designer has a basis and motive to actively involve in each stage of
behavioral change. But first, with a more certain form of design motive in the topic 'hot beverage
business', draw the consumers' changing behavior and provide various motivations that the change
can last, increasing the use of reusable cups.

1
CHAPTER 1. INTRODUCTION
Due to the busy lifestyle of modern day people, holding and drinking out of a beverage cup
on a road is a familiar scene in the TV shows and films. It is already regarded as a culture of
modern life in the world. Before 1990, however, people could just enjoy cool beverages outside
using PET (polyethylene terephthalate) bottles or aluminum cans. With the success of Starbucks in
the hot beverage market, coffee industries and other hot beverage markets have grown dramatically.
As of 2002, coffee consumption had risen with more than half of the population of United State of
America (about 109 million people) drinking coffee every day, and an additional fifty-two million
drinking coffee on an occasion. So holding a coffee in a paper cup can be represented as the modern
lifestyle rather than holding bottles or cans. These cultural changes have led to a huge problem of
using paper cups, because increasing coffee consumption brought huge paper cup consumption as
well. Consequently, this environmental concern is one of the hot issues in coffee industries today.
1.1 Overview of Terms
This research focuses on finding a solution for making people to change their behavior of
wasting produced by the global coffee industry from using disposable cups. Over a billion cups of
hot beverages are purchased in the world each day creating a large volume of waste. The purpose of
this research is to find some reasonable solutions for reducing the waste in order to increase
sustainability. In doing so, this project looked at a globally branded coffee shop, Starbucks. At a
location, in Ames Iowa, I surveyed customers to learn about their behaviors about using disposable
cups and interviewed some customers in the shops. (Appendix B) Because Starbucks is one of the
biggest hot beverage brands in the world, as of October 2011 they have 10,787 stores in United

2
States and 6,216 international stores.1 This means they are consuming huge amounts of paper cups
everyday in the world. Starbucks already had interest in their paper cup problem and attempted
various methods to solve the situation. In 2008, they started a global responsibility strategy called
‘Shared Planet.’ This campaign stated some goals such as improving coffee farmer’s access to
carbon markets, helping them generate additional income while protecting the cultural environment,
developing a comprehensive recycling solution for used paper and plastic cups, implementing front-
of-store recycling in owned stores and so on.
Table 1: Top 100 chains: U.S. sales, all results are in $ millions.
http://nrn.com/us-top-100/top-100-chains-us-sales
Rank Chain Segment 2011 2010 2009
1 McDonald's Sandwich $34,172.0 $32,395.4 $31,032.6
2 Subway Sandwich $11,434.0 $10,633.0 $9,999.3
3 Starbucks Coffee Beverage-Snack
$8,490.0 $7,955.0 $7,415.0
4 Burger King Sandwich $8,131.0 $8,433.0 $8,799.0
5 Wendy's Sandwich $8,108.0 $7,943.0 $8,023.0
6 Taco Bell Sandwich $7,000.0 $6,900.0 $6,800.0
7 Dunkin' Donuts Beverage-Snack
$5,931.0 $5,420.0 $5,176.0
8 Pizza Hut Pizza $5,500.0 $5,400.0 $5,000.0
9 KFC Chicken $4,600.0 $4,700.0 $4,900.0
10 Applebee's Neighborhood Grill & Bar
Casual Dining
$4,428.1 $4,317.0 $4,397.4
1 Starbucks Corporation, Starbucks Corporation 2011 Annual Report, Form 10-K, Starbucks Corporation, 2011, p3

3
Most of the goals of Starbucks corporate strategy seem to be achieved before the time they
are expected to take, one goal still remains at a standstill. That goal is serving reusable cups at least
25% until 2015, but from 2009 to 2012 it stayed the same 1.5%. Finally they changed the goal to
5% from 25%, but this rate would be not easy as well.2 As it appears that either this goal is an
impossible one to achieve or that Starbucks is looking for another solution, and this was an area of
interest for design research.
1.2 Research Methods
I used several research methods for this research. The first area of research was using
standard journal research to discover why people did not act in contrast with their values about
recycling. Journal research in psycho papers, behavior change theories, reusable alternative cups
and graphic design areas yielded some results. The literature review helped my research to acquire a
variety of perspectives about these issues. The second method was a survey, I built a survey of hot
beverage purchaser’s behaviors and interviewed some volunteers at the local Starbucks. These
surveys and interviews enabled me to understand me understand the perception of customers about
using reusable cups and paper cups. Lastly, I found and introduced some case studies that relates to
this issue.
1.3 Problem Observations
1.3.1 Coffee market in the world and North America
According to a report from the Specialty Coffee Association of America, the retail
value of the U.S. coffee market was estimated to be about $32 billion dollars in 2010. France,
2 Starbucks Corporation, Starbucks Global Responsibility Report – Goals and Progress, Starbucks Corporation, 2012, p11

4
Germany, Italy, Japan, and the United States are the five biggest coffee importing markets in
the global consumptions. Their global consumption bounced to about 37.3 million bags
during the period of January to September 2010, as compared to 36.5 million bags for the
same period the previous year. In recent years, there has been a huge surge demand of
Arabica coffee from large, emerging markets including Brazil, India, and China. These
countries have growing middle classes who have been providing high demand for good coffee
and they are competing with the United States to purchase these gourmet coffee beans.
Therefore, it can be said that the global coffee market is an industry that is going to continue
to grow and develop. 3
1.3.2 What is the problem of using paper cups?
As I mentioned above before the growing coffee markets, beverage retail markets
were based on cool drinks such as soft drink, beer, water and so on. The cool beverage
products were contained by aluminum cans or glass bottles that were recyclable packaging
materials. It seemed that the only environmental problem of the beverage market was the
usage of PET bottles; however, after the expansion of hot beverage markets, paper cup
consumption has become one of the big environmental issues. In this research I will focus
on the reusable package design and service design for hot beverage retail markets. The food-
packaging industry is one of the most remarkable non eco-friendly packaging market (Aaron
L. Brody et al, 2008, Ann Lorentzon, 2011). The environmental problems associated with
using disposable materials such as paper cups and PET cups are only accentuated by their
3 Specialty Coffee Association of America, 2012 Coffee Facts and Statistics, SCAA, 2012, P2
5
widespread usage among coffee drinkers. Considering how big the coffee industry has
become, it is difficult to determine just how many disposable coffee cups get used annually.
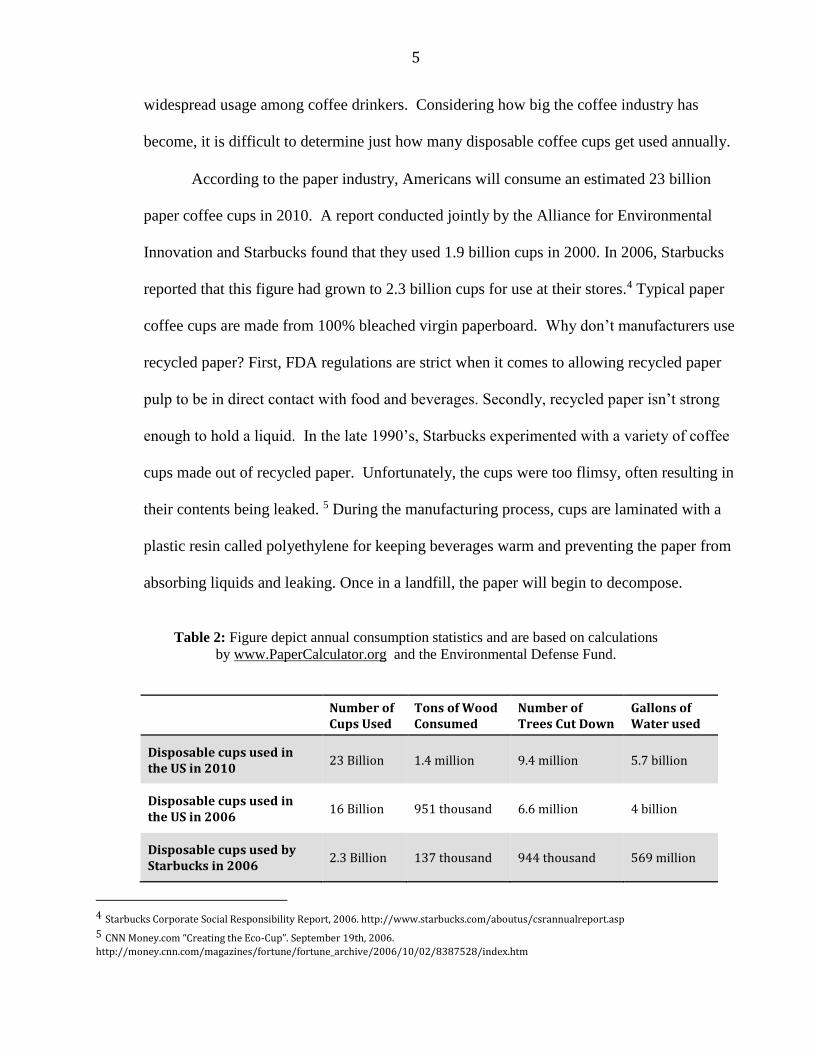
According to the paper industry, Americans will consume an estimated 23 billion
paper coffee cups in 2010. A report conducted jointly by the Alliance for Environmental
Innovation and Starbucks found that they used 1.9 billion cups in 2000. In 2006, Starbucks
reported that this figure had grown to 2.3 billion cups for use at their stores.4 Typical paper
coffee cups are made from 100% bleached virgin paperboard. Why don’t manufacturers use
recycled paper? First, FDA regulations are strict when it comes to allowing recycled paper
pulp to be in direct contact with food and beverages. Secondly, recycled paper isn’t strong
enough to hold a liquid. In the late 1990’s, Starbucks experimented with a variety of coffee
cups made out of recycled paper. Unfortunately, the cups were too flimsy, often resulting in
their contents being leaked. 5 During the manufacturing process, cups are laminated with a
plastic resin called polyethylene for keeping beverages warm and preventing the paper from
absorbing liquids and leaking. Once in a landfill, the paper will begin to decompose.
Table 2: Figure depict annual consumption statistics and are based on calculations
by www.PaperCalculator.org and the Environmental Defense Fund.
Number of Cups Used
Tons of Wood Consumed
Number of Trees Cut Down
Gallons of Water used
Disposable cups used in the US in 2010
23 Billion 1.4 million 9.4 million 5.7 billion
Disposable cups used in the US in 2006
16 Billion 951 thousand 6.6 million 4 billion
Disposable cups used by Starbucks in 2006
2.3 Billion 137 thousand 944 thousand 569 million
4 Starbucks Corporate Social Responsibility Report, 2006. http://www.starbucks.com/aboutus/csrannualreport.asp 5 CNN Money.com “Creating the Eco-Cup”. September 19th, 2006.
http://money.cnn.com/magazines/fortune/fortune_archive/2006/10/02/8387528/index.htm

6
This process releases methane, a greenhouse gas with 23 times the heat-trapping power of
carbon dioxide. 6 The process involved with manufacturing paper cups is extremely resource
intensive. Manufacturing paper requires harvesting trees and using machines to turn the
wood into wood chips. The chips are heavily washed to remove any dirt, and then mixed with
more water and processed. The resulting paper pulp is dried and the fibers are pressed
together to make paper. The entire process requires a substantial amount of water, energy and
a lot of trees.
1.3.3 Other researches for sustainable and reusable cups for hot beverage
Even though the problem of paper cup consumption is not a special and particular
theme on social issues, people have used a lot of paper cups in their daily life. For example,
when the average American adult prepares a party at home and BBQ at the backyard, he or
she usually goes to the local grocery store for purchasing disposable forks, spoons, plates and
cups. However there are two major ways for avoiding the usage of paper cups, first method
being a development of a new material for alternative beverage cups and the latter method a
request for customers to use reusable cups. Some other researchers suggested many kinds of
alternative beverage cups such as Jelloware cups, Edible cups and Biodegradable cups.
Figure 1: Edible cups by http://www.thewayweseetheworld.com/
6 Environmental Defense. Starbucks Paper Project Goals and Results. July 20th, 2007.
http://www.environmentaldefense.org/page.cfm?tagID=2155

7
However, most of these great ideas have similar problems requiring big budget and
maintenance issues to adjust on practical market situation. In other words, it would be too
costly compared to the retail price of each beverage and too weak of a material to keep hot
beverage for a long time. My research, thus, will not focus on the different material solution
for alternative but will consider solutions for changing the customer’s behavior by motivating
them to use well-known reusable cups such as ceramic mugs and plastic tumblers.
And there is another good example of reusable cup strategy. In most cases, to go
orders require the usage of disposable cups. However, I found a special case in a small local
coffee franchise in South Korea. Known as “Coffee Project,” started an extraordinary
solution from last year by taking on a project named “Take Around Tumbler” (TAT). Each
store prepared one hundred reusable tumblers for customers that ordered coffee to go. The
Coffee Project lent a tumbler marked ‘TAT’ to the customers, requesting them to bring it
again next time they make a visit.
Figure 2: Symbol and logo of the COFFEE PROJECT / Take around Tumbler
8
1.3.4 Why do people not use reusable cups?
There are two kinds of customers in the coffee shop, where one type makes an order
for enjoying the drink inside the store, whereas the second type orders to go. The first type of
customers does not pose a big problem because local coffee shops already use reusable cups
in their stores. When they serve customers who want to drink coffee in the store, they serve
the ordered beverage in the reusable cups such as mug cups. Ordinary small local coffee
stores only try to use the paper cup when the customers want to take the beverage outside.
The problem, then, lies in the big global coffee franchise brands such as Starbucks. They
served reusable cups to merely 1.5% of customers who ordered a beverage in their coffee
shop.7 Of course this case was not related to the behaviors of customers; instead, it is usually
maintenance problem of the venders. If they are going to serve reusable mug in store, they
need to add personnel to wash the cups and so on. So this is another ethical issue of the
providers. As of now, the solution presented by Starbucks is developing paper cup material
rather than having interest in the behavior of the customers.
1.4 Questions
In this study, I am going to observe the customers who order takeout beverages at
local Starbucks in Ames, Iowa, in order to see whether they use their own reusable cups or
not. However, the biggest problem on this issue is probably both types of customers using
reusable cup or paper cup. While the customers already recognize the harm posed by using
paper cups and also realize what they have to do for solving this problem, only a few of them
try to put this thought to action. This is why I believe the fundamental solution of this issue is
7 Starbucks Corporation, Starbucks Global Responsibility Report – Goals and Progress, Starbucks Corporation, 2012, p4

9
not changing the cup and the material things but changing the customer’s behavior. Therefore,
I will find the reasons why people do not use their own reusable beverage cup even though
they know the problems and solutions about this issue. Secondly, I am going to suggest a
reasonable system, which will give motivation to people to use their personal cup with fun
and reasonable rewards.

10
CHAPTER 2. REVIEW OF LITERATURE
Within the last decade, there has been a tremendous flowering of research in behavioral
economics, psychology, and persuasive technology. This research helps us understand how people
make decisions in their daily lives, and how those decisions are shaped by people’s prior
experiences and their environment. In order to make people change their behavior, designers must
understand how the behavior changes work into the human body. When people decide to change
their behavior, it is related to very complex processes such as stimulus, perception, memorize,
recognition, motivation, action and so on.8 Consequently, this subject relates to numerous theories
and methodologies in other variety academic areas. This literature review will introduce about the
process of behavior change and a theory that would be well applied in this subject.
2.1 What is Behavior Changing?
Have you ever imagined whether you could control your behavior? Let’s imagine that you
have the self-control in preventing yourself from doing everything according to your instincts and
desires – such as over-eating, drinking alcohol, being late, saying impulsive comments, making rash
purchases, unethical behavior, misplacing objects, procrastinating until the last minute and so on.
Unfortunately, for the ordinary person it is not easy to change behavior. Behavior changing is not
easy even though we strongly wish to do so. In this study, I will thus show some steps and levels of
behavior changes.
8 Stephen Wendel. (2013). Designing for Behavior Change. O’Reilly. page XV
11
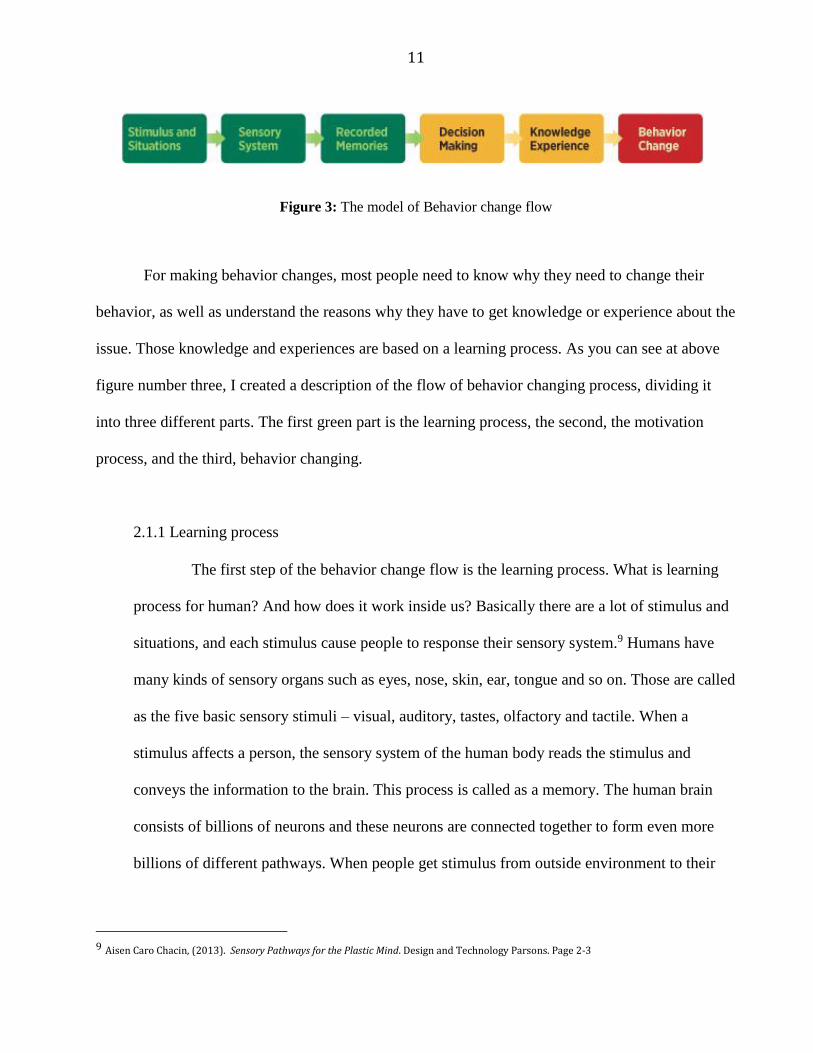
Figure 3: The model of Behavior change flow
For making behavior changes, most people need to know why they need to change their
behavior, as well as understand the reasons why they have to get knowledge or experience about the
issue. Those knowledge and experiences are based on a learning process. As you can see at above
figure number three, I created a description of the flow of behavior changing process, dividing it
into three different parts. The first green part is the learning process, the second, the motivation
process, and the third, behavior changing.
2.1.1 Learning process
The first step of the behavior change flow is the learning process. What is learning
process for human? And how does it work inside us? Basically there are a lot of stimulus and
situations, and each stimulus cause people to response their sensory system.9 Humans have
many kinds of sensory organs such as eyes, nose, skin, ear, tongue and so on. Those are called
as the five basic sensory stimuli – visual, auditory, tastes, olfactory and tactile. When a
stimulus affects a person, the sensory system of the human body reads the stimulus and
conveys the information to the brain. This process is called as a memory. The human brain
consists of billions of neurons and these neurons are connected together to form even more
billions of different pathways. When people get stimulus from outside environment to their
9 Aisen Caro Chacin, (2013). Sensory Pathways for the Plastic Mind. Design and Technology Parsons. Page 2-3

12
sensory system, the human brain records the stimulus on their memory storage area and builds
a pathway for the storage. Whenever they have a different experience, another new pathway
in the brain will be used. However, we call this kind of storage area and pathway group as
short-term memory.
For creating a working pathway, over required stimulus are needed. If one of the
experience is repeated, or the stimulus is very strong rather than expected, more nerve
impulses are sent along the new pathway. Repetition strengthens the connections between
neurons and makes it easier for impulses to travel along the pathway. When people are
exposed to repeated stimulus and experience, their brain and body will more easily
understand what they need to do next as a feedback. In other words, the human brain can find
information that they want to find from all memories because the storage have more pathways
to access than simple short-term memory.10 These storages and pathways into the human
brain are called the long-term memory.
Both long-term memory and short-term memory have the ability to store and retrieve
information. The effective time of short-term memory is usually about 30 seconds. When you
hear a new telephone number and the call time has ended, it is hard to remember the number.
This is a reason why this kind of shot-term memory is called volatility memory. If the amount
of information that arrives exceeds the capacity for the short-term memory, then some is lost.
On the other hand long-term memory may last your whole life. When you sing the words of
your favorite song, you are using your long-term memory. Although we often complain about
how hard it is to learn new things, there is no limit to how much information you can store in
10http://www.bbc.co.uk/schools/gcsebitesize/science/add_ocr_21c/brain_mind/complexrev1.shtml

13
your long-term memory. Therefore, it is just a matter of how many times you should repeat
the new things or how strong stimulus should be affected.
Figure 4: The multi-store memory model
2.1.2 Decision making process
The multi-store memory model can be used to help explain some steps involved in
long-term and short-term memory. Next, we are going to find how those memories are related
to human behaviors. Human behaviors are basically consisted of a lot of complex steps of
decision-making or habits. If there is a command from the brain, the human mind defines
whether the command is familiar or not. If the command is very familiar, the human mind
does not need to think about it and just executes the action based on its long-term memory.
This kind of reaction by very familiar situations and stimulus is called a habit. However, if the
command is unfamiliar people try to decide how they should give feedback about the demand,
because they don’t have any information on long-term storage in their brain.
Information you do not intend to be lost

14
Table 3: The various tools the mind uses to choose the right action11
MECHANISM WHERE IT’S MOST LIKELY TO BE USED
Habits Familiar cues trigger a learned routine
Other intuitive responses Familiar and semi- familiar situations, with a reaction based on
prior experiences
Active mindset or self- concept Ambiguous situations with a few possible interpretations
Heuristics Situations where conscious attention is required, but the choice
can be implicitly simplified
Focused, conscious calculation Unfamiliar situations where a conscious choice is required or
very important decisions we direct our attention toward
The above table shows how the decision-making system works depending on the
familiarity of stimulus. When a person gets any stimulus from outside, the brain checks if is
familiar or not. Then the brain tries to find the information from multi memory store, and
decides how to react to that.
Figure 5: Spectrum of thinking interventions12
11 Stephen Wendel. (2013). Designing for Behavior Change. O’Reilly. p 150 12 Stephen Wendel. (2013). Designing for Behavior Change. O’Reilly. p 22
15
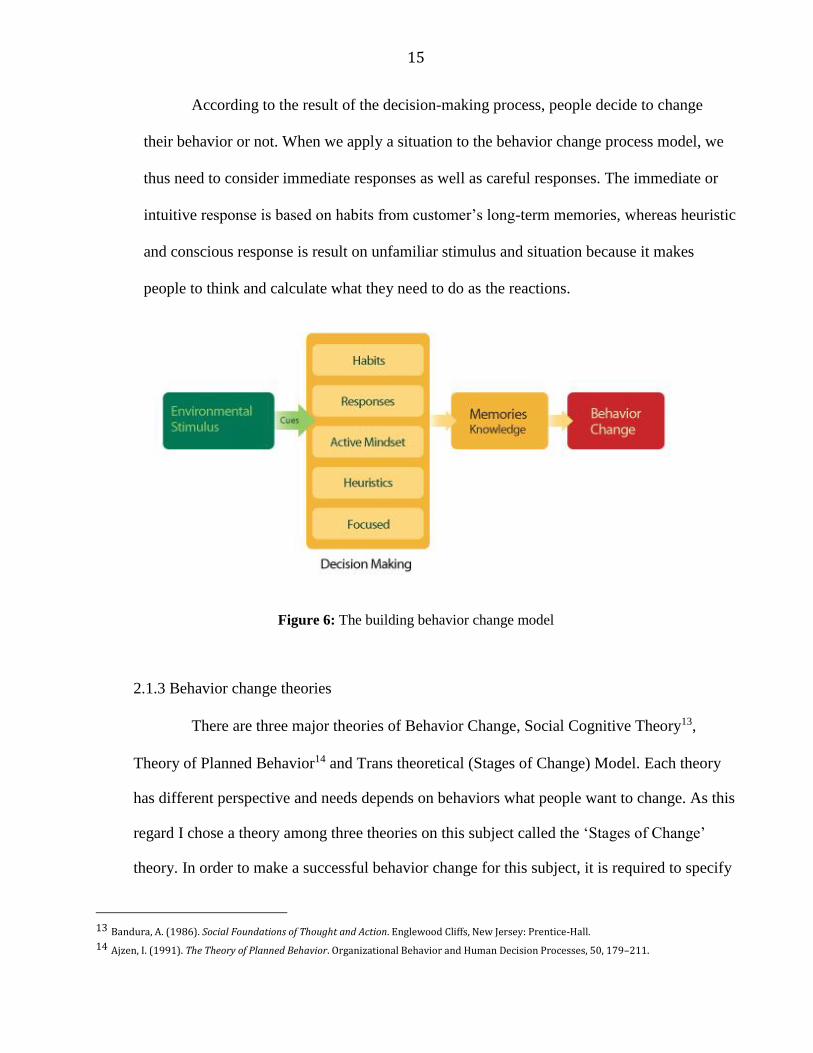
According to the result of the decision-making process, people decide to change
their behavior or not. When we apply a situation to the behavior change process model, we
thus need to consider immediate responses as well as careful responses. The immediate or
intuitive response is based on habits from customer’s long-term memories, whereas heuristic
and conscious response is result on unfamiliar stimulus and situation because it makes
people to think and calculate what they need to do as the reactions.
Figure 6: The building behavior change model
2.1.3 Behavior change theories
There are three major theories of Behavior Change, Social Cognitive Theory13,
Theory of Planned Behavior14 and Trans theoretical (Stages of Change) Model. Each theory
has different perspective and needs depends on behaviors what people want to change. As this
regard I chose a theory among three theories on this subject called the ‘Stages of Change’
theory. In order to make a successful behavior change for this subject, it is required to specify
13 Bandura, A. (1986). Social Foundations of Thought and Action. Englewood Cliffs, New Jersey: Prentice-Hall. 14 Ajzen, I. (1991). The Theory of Planned Behavior. Organizational Behavior and Human Decision Processes, 50, 179–211.

16
and understand each levels of behavior and to find solutions for progressing to the next stage
at each independent level.
2.2 Stages of Change Theory
According to the above behavior change process, the biggest problem on this issue is probably
that people already know what the problem is and what they have to do in order to solve this problem.
Using a personal reusable cup can solve the problem, but just few people try to pass from thought to
action. So the fundamental solution of this issue is not changing the cup and the materials but
changing the user’s behavior. In this research, I will find the reasons why people do not use their own
beverage cups even though they know what the problems is and the solutions. I focused on behavior
changing methods to find a solution. First, I studied what kind of stages exists for people to change
their behavior in the similar case of the problem by literature reviews. Secondly, I applied these
findings on the methods and I am going to suggest some solutions on each stages.
2.2.1 The stages of change Theory; TTM model
The Trans theoretical Model of Change15; a theoretical model of behavior change
was introduced by James Prochaska and Carlo DiClemente at the University of Rhode Island
when they were studying how smokers were able to give up their habits or addiction. It has
been the basis for developing effective interventions to promote health behavior change. The
model describes how people modify a problem behavior or acquire a positive behavior. The
TTM, Trans theoretical Model of Change, is a model of intentional change. This model
focuses on the decision making of the individual.
15 Prochaska JO , Velicer WF , Rossi JS , et al. ( 1994 ) Stages of change and decisional balance for 12 problem behaviors . Health Psychology
P13

17
Figure 7: The model of Stages of Change flow
The TTM may help to explain the differences in persons’ success during treatment
for a range of psychological and physical health problems. This model has been widely
applied in behavior modification techniques. As for this research topic, the perception and
behavior of the people who use disposable cups did not match like the various studies that
apply the TTM model in general. Therefore, it is needed to propose an appropriate solution by
separating each step of the Problem Recognition Stage and the Action Stage where practices
the solution of the problem.
2.2.2 Each steps of ‘Stages of Change’
People pass through a series of stages when change occurs. The stages discussed in
their change theory are: 16 17
16 Prochaska JO , Velicer WF , Rossi JS , et al. ( 1994 ) Stages of change and decisional balance for 12 problem behaviors . Health Psychology
P39 – 46.
17 The web page of UCLA Centre for Human Nutrition. http://www.cellinteractive.com/ucla/physcian_ed/stages_change.html

18
Stage1. PRECONTEMPLATION _ Not ready to change
The individual is not currently considering change:
Validate lack of readiness
Encourage re-evaluation of current behavior
Encourage self-exploration, not action
Explain and personalize the risk
Stage2. CONTEMPLATION _ Just thinking of changing
Encourage evaluation of pros and cons of behavior change.
Re-evaluation of group image through group activities.
Identify and promote new, positive outcome expectations
Stage3. PREPARATION _ Ready to change
Some experience with change and are trying to change:
The individual needs encouragement to evaluate pros and cons of behavior change.
The therapist needs to identify and promote new, positive outcome expectations in
the individual.
Encourage small initial steps.
These individuals have taken some actions in the past year such as joining a health
education class, consulting a counselor, talking to their physician, buying a self-help
book or relying on a self-change approach.
These groups of individuals are suitable for action- oriented programs for smoking
cessation, weight loss, or exercise programs.

19
Stage4. ACTION _ Making change
The active work toward desired behavioral change including modification of
environment, experiences, or behavior has been taken. At this stage people have made
specific overt modifications in their life-styles within the past six months and should be
taken against relapse.
Help the individual on restructuring cues and social support.
Enhance self-efficacy for dealing with obstacles.
Help to guard against feelings of loss and frustration.
Stage5. MAITENANCE _ Staying on track
Here, the focus is on ongoing, active work to maintain changes made and relapse
prevention. At this stage people are less tempted to relapse and increasingly more
confidant that they can continue their change.
Follow-up support
Reinforce internal rewards
Discuss coping with relapse
2.3 Case Studies of the Stages of Change Theory
The stage of change theory is also known as the Transtheoretical Model, so it can be called
as the abbreviation ‘TTM’. This theory introduced the Stages of Change, the dynamic change
processes and principles related to each stage in 1980s. In the 1990s, computer-tailored intervention
was developed based on the Transtheoretical Model and applying this tailored interventions for

20
smoking cessation proved effective even when more than 80% were not ready to quit. After this
demonstration TTM applied this theory to variety of behaviors beyond smoking cessation. From
2000, TTM-based interventions expanded their research area to simultaneous multiple behavior
change and also applied to a wide variety of new behavior change challenges.
2.3.1 Smoking cessation
The stage of change model, expert system intervention was evaluated on 4144
smokers in a two-arm randomized control trial with four follow-ups over 24 months. Smokers
were recruited by random digit-dial calls, and 80.0% of the eligible smokers were enrolled.
Individualized and interactive expert system computer reports were sent at first, after three
and six months. The reports provided feedback on 15 variables relevant for progressing
through the stages. The primary outcomes were point prevalence and prolonged abstinence
rates. At 24 months, the expert system resulted in 25.6% point prevalence and 12% prolonged
abstinence, which were 30% and 56% greater than the control condition. Abstinence rates at
each 6-month follow-up were significantly greater in the Expert System condition than in the
comparison condition with the absolute difference increasing at each follow-up. A proactive
home-based stage-matched expert system smoking cessation program can produce both high
participation rates and relatively high abstinence rates.
And multiple studies have found individualized interventions tailored on the 14
TTM variables for smoking cessation to effectively recruit and retain pre-Action participants
and produce long-term abstinence rates within the range of 22% – 26%. These interventions
have also consistently outperformed alternative interventions including best-in-class action-
oriented self-help programs, non-interactive manual-based programs, and other common

21
interventions.18 Furthermore, these interventions continued to move pre-Action participants to
abstinence even after the program ended. For a summary of smoking cessation clinical
outcomes, see Velicer, Redding, Sun, & Prochaska, 200719. It is important to note that TTM
interventions have a significantly greater impact than other programs because of their ability
to: involve a large percentage of the target population (people not ready, getting ready, or
ready to change), support high participation rates, achieve strong efficacy rates, produce
multiple behavior changes, and use optimal tailoring which minimizes demands on clients and
coaches.
For example, out of 1,000 people needing to make a lifestyle change (those in a pre-
Action stage), a TTM intervention targets 100% of that population while other programs
typically target only the 20% of that population in the Preparation stage. In addition, TTM
interventions typically have 70%-80% participation rate with proactive recruitment while
other programs typically have a 10% participation rate. Based on the following table, TTM
interventions clearly have a more substantial impact than action-oriented programs even when
they share the same efficacy rates.
Table 4: Effective of TTM
Target Population
x Participation Rate
x Hypothetical Efficacy
= # of People that Changed Lifestyle
TTM Interventions
1,000 (100%)
x 80% x 30% = 240
Other Programs
200 (20%) x 10% x 30% = 30
18 Prochaska, J. O., DiClemente, C. C., Velicer, W. F., & Rossi, J. S. (1993). Standardized, individualized, interactive, and personalized self-help
programs for smoking cessation. Health Psychology, 12, 399-405. 19 Velicer, W. F., Redding, C. A., Sun, X., & Prochaska, J. O. (2007). Demographic variables, smoking variables, and outcome across five studies.
Health Psychology, 26, 278-287.

22
As you can see in this example, even with the same efficacy rates, a TTM intervention would
have 8 times greater impact on the population than another program.
2.3.2 Losing weight behavior
In the Precontemplation stage, the biggest problem is that people are not thinking
seriously about changing and are not interested in receiving any kind of help. People in this
stage tend to defend their current bad habits and do not feel it as a problem. They may be
defensive in the face of other people's efforts to pressure them to quit.
2.3.3 Other outcomes by the theory
a. Stress management
One of well-known case study subject of TTM was provided Pro-Change’s Stress
Management intervention. Through the 18-month follow-up, a significantly the sixty-two
percent of the treatment group was effectively managing their stress when compared to
the control group. The intervention also produced statistically significant reductions in
stress and depression and an increase in the use of stress management techniques when
compared to the control group.20
b. Adherence to antihypertensive medication
Over 1,000 members of a New England group practice who were prescribed
antihypertensive medication participated in Pro-Change’s Adherence to
Antihypertensive Medication intervention. The vast majority (73%) of the intervention
20 Evers, K. E., Prochaska, J. O., Johnson, J. L., Mauriello, L. M., Padula, J. A., & Prochaska, J. M. (2006). A randomized clinical trial of a
population- and transtheoretical model-based stress-management intervention. Health Psychol., 25, 521-529.

23
group who were previously pre-Action were adhering to their prescribed medication
regimen at the 12-month follow-up when compared to the control group.21
c. Adherence to lipid-lowering drugs
Members of a large New England health plan and various employer groups who were
prescribed a cholesterol lowering medication participated in Pro-Change’s Adherence to
Lipid-Lowering Drugs intervention. More than half of the intervention group (56%) who
were previously pre-Action were adhering to their prescribed medication regimen at the
18-month follow-up. Additionally, only 15% of those in the intervention group who
were already in Action or Maintenance relapsed into poor medication adherence
compared to 45% of the controls. Further, participants who were at risk for physical
activity and unhealthy diet were given only stage-based guidance. The treatment group
doubled the control group in the percentage in Action or Maintenance at 18 months for
physical activity (45%) and diet (25%).22
d. Depression prevention
Participants were 350 primary care patients experiencing at least mild depression but not
involved in a treatment or planning to seek a treatment for depression in the next 30
days. Patients receiving the TTM intervention experienced significantly greater symptom
reduction during the 9-month follow-up period. The intervention’s largest effects were
observed among patients with moderate or severe depression, and who were in the
21 Johnson, S. S., Driskell, M. M., Johnson, J. L., Prochaska, J. M., Zwick, W., & Prochaska, J. O. (2006b). Efficacy of a transtheoretical model-
based expert system for antihypertensive adherence. Disease Management, 9, 291-301.
22 Johnson, S. S., Driskell, M. M., Johnson, J. L., Dyment, S. J., Prochaska, J. O., Prochaska, J. M. et al. (2006a). Transtheoretical model
intervention for adherence to lipid-lowering drugs. Disease Management, 9, 102-114.

24
Precontemplation or Contemplation stage of change at baseline. For example, among
patients in the Precontemplation or Contemplation stage, rates of reliable and clinically
significant improvement in depression were 40% for treatment and 9% for control.
Among patients with mild depression, or who were in the Action or Maintenance stage at
baseline, the intervention helped prevent disease progression to Major Depression during
the follow-up period.23
2.4 Conclusions from the Literature
As discussed above, there have been studies made on behavior changing in diverse areas
according to different needs. All the research conducted with behavior changing theories have an
aim to discover a solution where human behavior can be changed in a more positive manner. As
examined, there are numerous factors that interact and influence each other in the process of
determining human behavior. I have thus realized that in order to change human behavior, one must
select the most appropriate method after considering the given conditions. This is why I have
closely analyzed the Stage of Change theory – which holds the most appropriate condition out of all
the behavior changing theory subjects. Focusing on how to apply this particular theory in the future,
I will generalize the problem through the various approaches of research method. Furthermore, I
will explore design-based solutions according to the theoretical background of each given stage for
motivating people to change their behavior positively.
23 Levesque, D. A., Van Marter, D. F., Schneider, R. J., Bauer, M. R., Goldberg, D. N., Prochaska, J. O., & Prochaska, J.M. (in press). Randomized
trial of a computer-tailored intervention for patients with depression. American Journal of Health Promotion.

25
CHAPTER 3. METHODOLOGY
3.1 Analysis of Coffee Consumers
3.1.1 Research objectives
The objective of this research is to find and suggest a possible solution for increasing
the consumer rate of using non-disposable cups in the coffee industry and to understand why
consumers use disposal cups, particularly paper cups, when they purchase hot beverages. This
survey and the interviews can be used to figure out how frequently participants used disposable
cups and why they used them. The findings and solutions of this research will serve as an
opportunity to worldwide coffee industries to change adverse images, such as using huge
quantities of non-environmental products. The research will also motivate people to change
their behavior one that is more environmentally friendly. The final outcomes of this research
will help consumers to build a more positive experience when they are enjoying beverages. And
because this research relevant to human subject, I received an Institutional Review Board
approval from the office for Responsible Research. (Appendix A)
3.1.2 Research procedures
a. Survey
The survey participants were recruited via flyer (Appendix B, Attachment 1-1), word
of mouth (Appendix B, Attachment 6) and mass email (Appendix B, Attachment 3-
1) addressed to Iowa State University faculties, staff, students and my personal
contact list. Flyers were posted on the walls of the Iowa State University campus and
the word of mouth was also used in the recruitment. All of recruit materials included

26
the phone number and email address of the principal investigator Interested
participants were then asked to email or call the researcher for more information.
When I received the replied email from interested participants they had a copy of
informed consent as an email for agreement of the informed consent document
(Appendix B, Attachment 2-1) by marking a checkbox, and a follow up
questionnaire asking, the subject's demographic information, such as age group and
gender, will be obtained, as well as a research survey questionnaire enclosed in the
email. When the principal investigator met prospective participants directly, the
informed consent form was read or explained to the subjects to make sure that the
prospective participants understand what they have to do and the importance of the
study. If they agreed and didn't have any questions, they were asked to sign the form
to the start of the survey questions. (Appendix B, Attachment 7)
b. Interviews
Interview participants also were recruited via flyer and mass email addressed to ISU
faculty/staff and students. Flyers (Appendix B, Attachment 1) were posted around the
ISU campus. Word of mouth also was used in the recruitment. Interested participants
were asked to email the researcher for more information and to schedule a mutually
agreeable time. Once I received the reply, a copy of informed consent (Appendix B,
Attachment 2) and email script (Appendix B, Attachment 3) was emailed to them.
Interviews were done in the local Starbucks on Lincoln Way in Ames and any place in
town where it was convenient and safe for both researcher and participants. On the
interview day, the introduction script was read and the informed consent form was
read or explained to the subject to make sure that they understood what they needed to

27
do and the importance of the study. If they agreed and didn't have any questions, they
were asked to sign the form. Interviews lasted 10 minutes and were done in a
convenient location. A follow up questionnaire asking for the subject's demographic
information such as age group and gender was obtained. This interview was conducted
in private with a researcher to eliminate the influence of peer pressure. The subject’s
responses were audio-recorded, using digital voice recorders. The audio recordings
were then transcribed to analyze the session.
3.1.3 Demographic information of participants
The target demographic for this research is predicated on a number of factors. First,
the target customer should be someone who is living in nearby Ames, Iowa. Second, this
customer should also be a person who has experience in ordering hot beverages in a local
coffee house. Thirdly, for the purposes of this study, the customer should be a person who has
an interest about any kind of environmental issues.
Therefore the recommended target demographics for this research is as follows:
o Age group: Adult group age over 18.
o Gender; Male and Female
o Social Life: Residency of participants
This research focused on hot beverage customers rather than providers of hot
beverage services. I have one hundred and six participants for this research, ten interviewee
and ninety-six survey participants, both of them were recruited via flyer, word of mouth and
my personal contact list. I asked three demographic questions to the participants such as

28
ranges of age, gender and residence distribution. As for those demographic questions, 103
people answered and 3 participants of survey skipped the section and did not answer them.
a. Age groups
As I mentioned above, I have ninety three survey participants who gave answer the
survey questions, and designed the age range as four groups; the first age group is
twenty generation included eighteen and nineteen years old, the second group is
thirty and forty generation, and the third group is fifty and under sixty five and over
sixty five years old. Thirty participants were categorized into the first age range,
forty-seven people were placed the second group, eleven people were categorized in
the third age range, and the last group has five participants. And I have ten
interviewees for this research. I kept same age rages with the survey for compeering
each value. However, the first group has three participants, second group has four,
and third is two and the last group has only one people.
Table 5: Age range of survey participants, answered: 93 skipped: 3
Answer Choices Responses (%) Num. of Responses
18 to 29 32.26 30
30 to 49 50.54 47
50 to 64 11.83 11
65 or ol der 5.37 5
Total 100 93
b. Gender and residency
The seventy-eight survey candidates can be divided as thirty-five female and forty-
three male participants. Among them twenty people lives in North America and the

29
other fifty-eight people live outside North America. Furthermore, there were six
female and four male interviewees, and all of them lived in Ames, Iowa.
Table 6: What is your gender, answered: 93 skipped: 3
Answer Choices Responses (%) Num. of Responses
Female 46.24 43
Male 53.76 50
Total 100 93
3.1.4 Results from the survey
According to the result of the survey, nearly seventy-five percent of the respondents
drink at least one hot beverage in a week. Furthermore, over eighteen percent purchase a hot
drink every day. Based on the result, it can be said that hot beverage consumption at coffee
house is not a special culture or trend, but merely a daily life behavior of ordinary people.
Furthermore, this statistic information result shows that the target of this market is not
narrowed but spreads throughout everyone.
Table 7: Average number of buying beverage each week, answered: 93 skipped: 3
Answer Choices Responses (%) Num. of Responses
Total Male Female
Less than once per week 25.81 24 14 7
1~2 35.48 33 15 18
3~4 20.43 19 11 8
5~6 8.60 8 4 4
More than 6 9.68 9 3 6
Total 100 93 50 43

30
A question I asked the respondents was whether they are aware of the environment
problem of using disposable paper cups. Almost 84% of them answered that they understand
using disposable cup would lead to an environmental problem. It can be said, then, that most
people are already informed about the environmental damage by consuming disposable cups.
Table 8: Average number of buying beverage each week, answered: 93 skipped: 3
Answer Choices Responses (%) Num. of Responses
Total Male Female
I know 83.87 78 41 37
I do not mind 16.13 15 9 6
Total 100 93 50 43
There is another interesting result from the survey. Even though almost 84% of the
respondents were aware of the negative effects in using disposable cups, only 33.33% of them
use reusable cups when ordering beverage. According to the result I can formulate a
hypothesis such as while the people already recognize the harm posed by using paper cups
and also realize what they have to do for solving this problem, only a few of them try to put
this thought to action.
Table 9: Result of selection weather participants use reusable cup or not, answered: 93 skipped: 3
Answer Choices Responses (%)
Num. of Responses
T M F
i f Yes, go to a page of 'Reusable cup users' 33.33 31 13 18
i f No, go to a Page of 'Paper-c up users' 66.67 62 37 25
Total 100 93 50 43

31
From this section, customers can be divided in two categories – ones who use
reusable cups regularly, and those that do not. First of all, among the total number of 93
respondents, 31 used reusable cups regularly. According to their responses to the questions,
all 31 respondents use various types of reusable cups. In addition, 80% of the 31 respondents
stated that their reasons for using reusable cups is for environmental concerns, while 20%
stated that it is due to economic reasons. It seems that the principal reward of price reductions
provided by coffee brands is not a convincing factor for customers to change their current
behavior. As an alternative solution, the environmental effects of reusable cup utilization can
be presented to the customers in detail, thereby raising their self-esteem and motivation for
such practice.
Table 10: What kind of reusable cup do you have? (Multiple choice),
answered: 31 skipped: 62
Answer Choices Responses (%)
Num. of Responses
Total Male Female
Ceramic MUG 45.16 14 8 6
Plastic Tumbler 25.81 8 3 5
Stainless Tumbler 48.39 15 6 9
All of the above 22.58 7 4 3
Total Multiple choice 44/31

32
Table 11: Main reasons for using reusable cups, answered: 31 skipped: 62
Answer Choices Responses (%) Num. of Responses
Total Male Female
Environmental 61.29 19 11 8
Safely 19.35 6 2 4
Economical 22.58 7 3 4
Trendy 16.13 5 2 3
All of the above 16.13 5 3 2
Other (please specify) 19.35 6 4 2
Total Multiple choice 48/31
Other opinions
Less likely to burn your hands
Keeps my drink warm for longer.
Keeps my coffee hot for longer.
Convenient
Sometimes you get a couple cents discount.
Keep it warm or cold
I have also identified how often the customers use reusable cups, as well as the
inconvenience factors when using them. 75% of the users utilize the reusable cups constantly
and have pointed out maintenance reasons, cleanliness, as a factor of inconvenience. As an
alternative, there could be a system where reusable cups can be maintained efficiently, or a
guideline that helps customers to manage their cups.

33
Table 12: Frequency of using reusable cups, answered: 31 skipped: 62
Answer Choices Responses (%) Num. of Responses
Total Male Female
Level 1 _ Never Use 0 0 0 0
Level 2 _ Few time 6.45 2 2 0
Level 3 _ From time to time 9.68 3 1 2
Level 4 _ Sometime 48.39 15 7 8
Level 5 _ Always Use 16.13 5 2 3
Other (please specify) 19.35 6 1 5
Average Level Rating 3.83 (Between level 1to level 5)
Total 100 31 13 18
Table 13: Problems when participants use reusable cup, answered: 31 skipped: 62
Answer Choices Responses (%) Num. of Responses
Total Male Female
Volume and weight 32.26 10 3 7
Maintenance (cleaning cup and so on)
45.16 14 5 9
Appearance 3.22 1 0 1
Al l of the above 9.68 3 2 1
Other (please specify) 9.68 3 3 0
Total 100 31 13 18
34
Other opinions
Not portable.
Remembering it
Carrying it around after I'm done so I have it for next time.
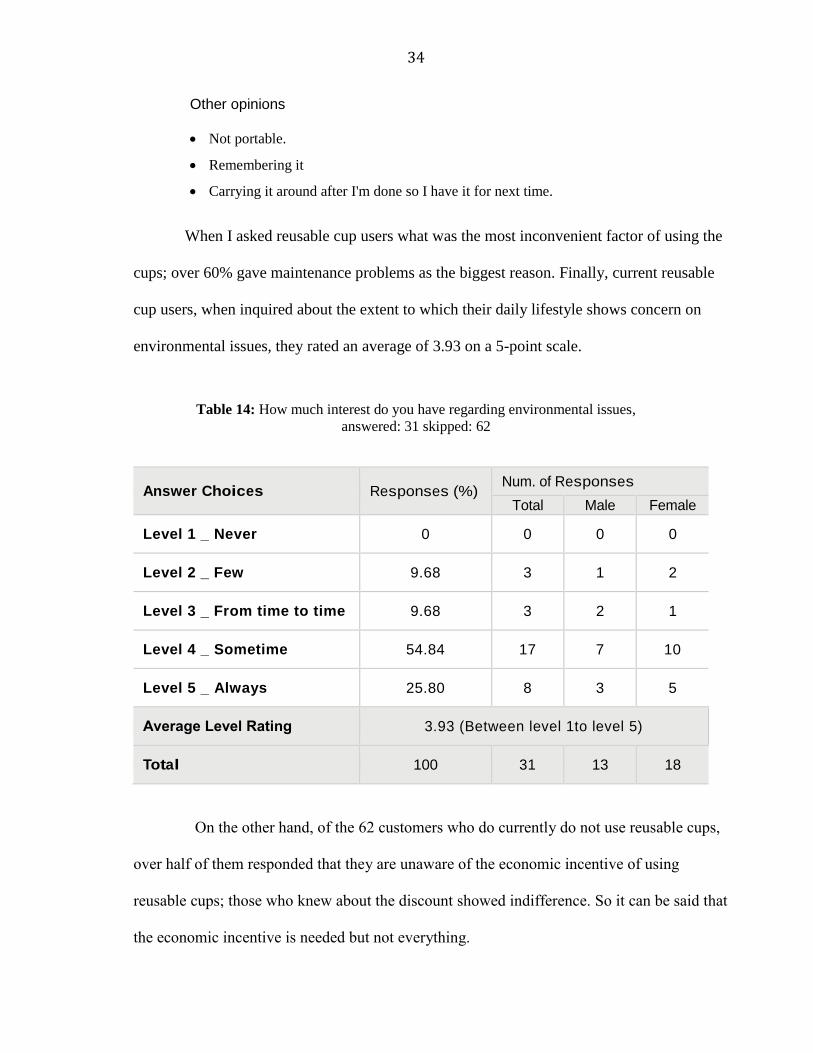
When I asked reusable cup users what was the most inconvenient factor of using the
cups; over 60% gave maintenance problems as the biggest reason. Finally, current reusable
cup users, when inquired about the extent to which their daily lifestyle shows concern on
environmental issues, they rated an average of 3.93 on a 5-point scale.
Table 14: How much interest do you have regarding environmental issues,
answered: 31 skipped: 62
Answer Choices Responses (%) Num. of Responses
Total Male Female
Level 1 _ Never 0 0 0 0
Level 2 _ Few 9.68 3 1 2
Level 3 _ From time to time 9.68 3 2 1
Level 4 _ Sometime 54.84 17 7 10
Level 5 _ Always 25.80 8 3 5
Average Level Rating 3.93 (Between level 1to level 5)
Total 100 31 13 18
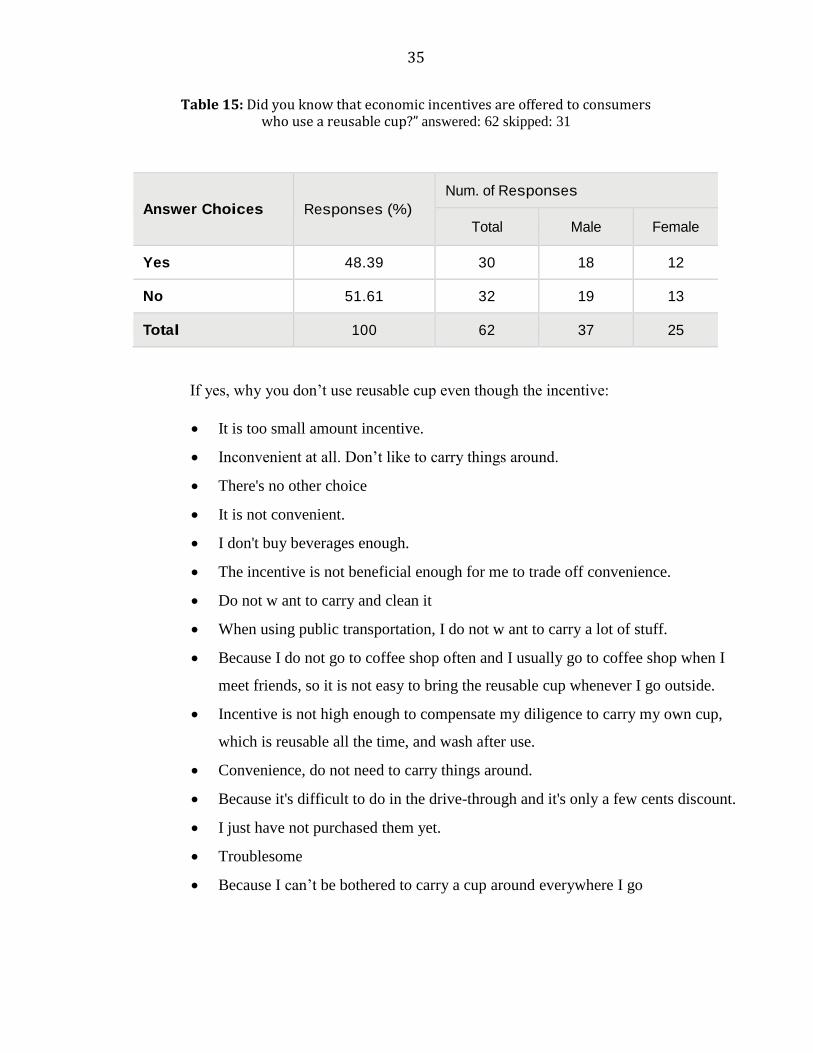
On the other hand, of the 62 customers who do currently do not use reusable cups,
over half of them responded that they are unaware of the economic incentive of using
reusable cups; those who knew about the discount showed indifference. So it can be said that
the economic incentive is needed but not everything.
35
Table 15: Did you know that economic incentives are offered to consumers who use a reusable cup?” answered: 62 skipped: 31
Answer Choices Responses (%)
Num. of Responses
Total Male Female
Yes 48.39 30 18 12
No 51.61 32 19 13
Total 100 62 37 25
If yes, why you don’t use reusable cup even though the incentive:
It is too small amount incentive.
Inconvenient at all. Don’t like to carry things around.
There's no other choice
It is not convenient.
I don't buy beverages enough.
The incentive is not beneficial enough for me to trade off convenience.
Do not w ant to carry and clean it
When using public transportation, I do not w ant to carry a lot of stuff.
Because I do not go to coffee shop often and I usually go to coffee shop when I
meet friends, so it is not easy to bring the reusable cup whenever I go outside.
Incentive is not high enough to compensate my diligence to carry my own cup,
which is reusable all the time, and wash after use.
Convenience, do not need to carry things around.
Because it's difficult to do in the drive-through and it's only a few cents discount.
I just have not purchased them yet.
Troublesome
Because I can’t be bothered to carry a cup around everywhere I go
36
It seems not much relatively because it's not easy to bring my cup everyday and
it spends the time and money to manage and buy the reusable one.
It is inconvenient to carry one around.
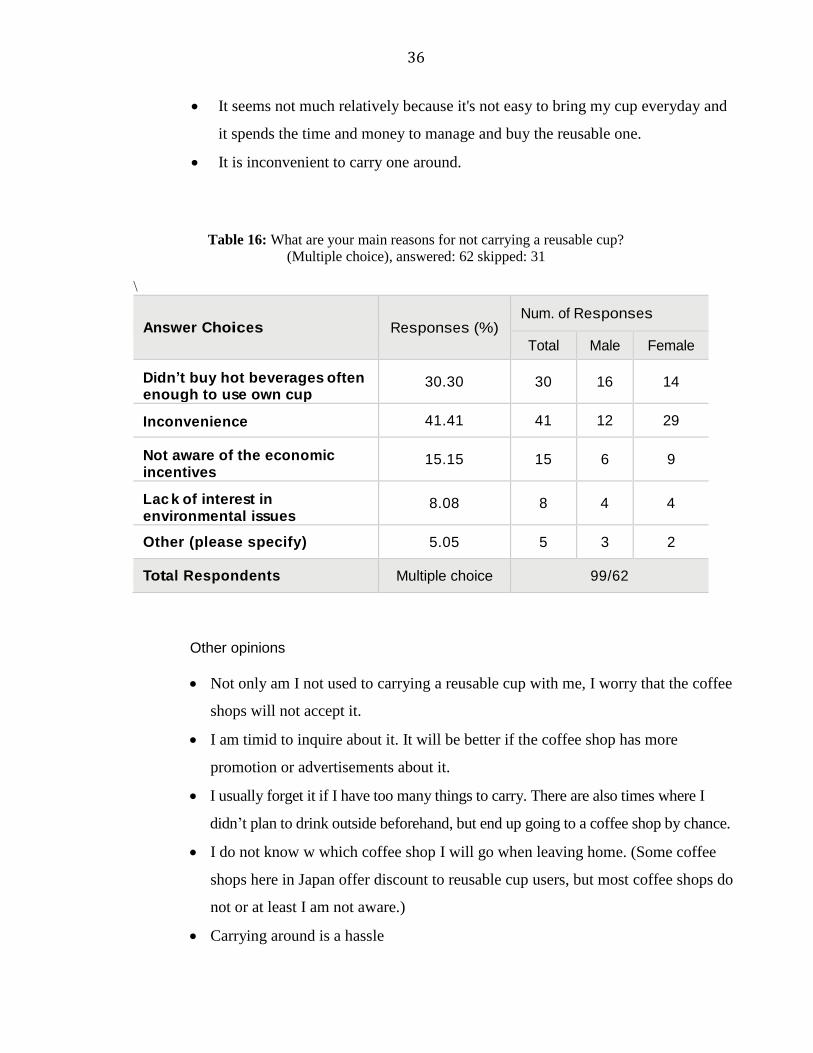
Table 16: What are your main reasons for not carrying a reusable cup?
(Multiple choice), answered: 62 skipped: 31
\
Answer Choices Responses (%) Num. of Responses
Total Male Female
Didn’t buy hot beverages often enough to use own cup
30.30 30 16 14
Inconvenience 41.41 41 12 29
Not aware of the economic incentives
15.15 15 6 9
Lac k of interest in environmental issues
8.08 8 4 4
Other (please specify) 5.05 5 3 2
Total Respondents Multiple choice 99/62
Other opinions
Not only am I not used to carrying a reusable cup with me, I worry that the coffee
shops will not accept it.
I am timid to inquire about it. It will be better if the coffee shop has more
promotion or advertisements about it.
I usually forget it if I have too many things to carry. There are also times where I
didn’t plan to drink outside beforehand, but end up going to a coffee shop by chance.
I do not know w which coffee shop I will go when leaving home. (Some coffee
shops here in Japan offer discount to reusable cup users, but most coffee shops do
not or at least I am not aware.)
Carrying around is a hassle
37
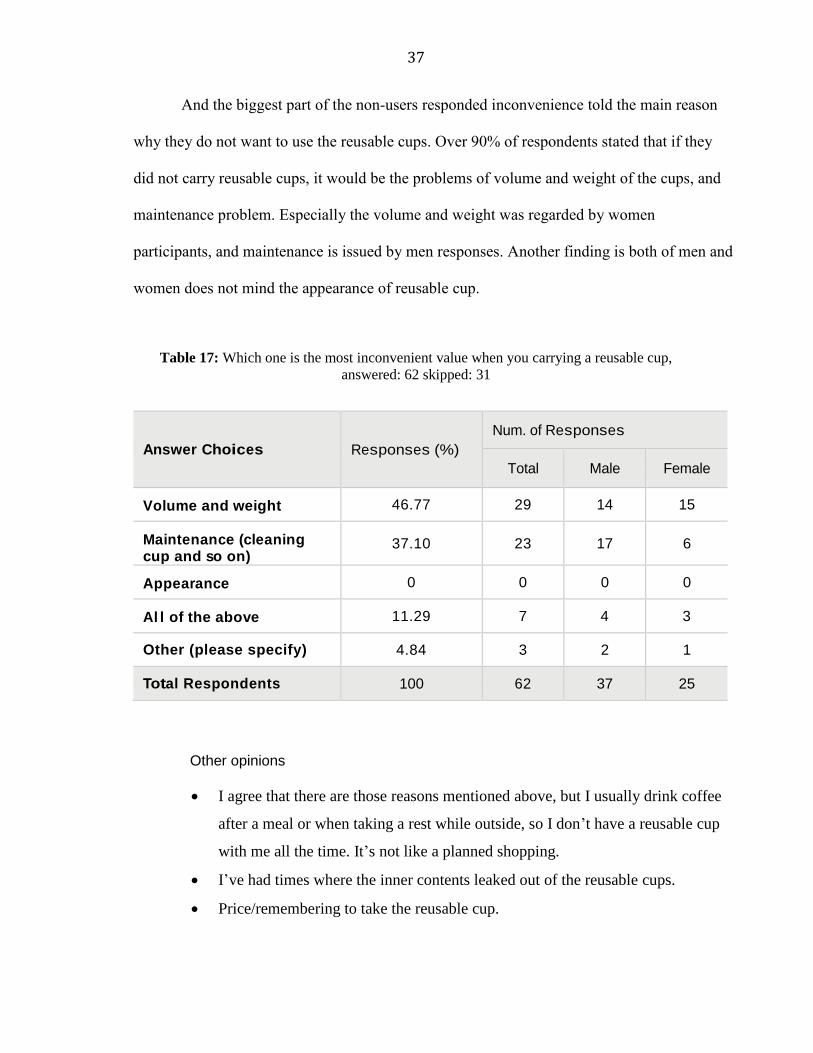
And the biggest part of the non-users responded inconvenience told the main reason
why they do not want to use the reusable cups. Over 90% of respondents stated that if they
did not carry reusable cups, it would be the problems of volume and weight of the cups, and
maintenance problem. Especially the volume and weight was regarded by women
participants, and maintenance is issued by men responses. Another finding is both of men and
women does not mind the appearance of reusable cup.
Table 17: Which one is the most inconvenient value when you carrying a reusable cup,
answered: 62 skipped: 31
Answer Choices Responses (%)
Num. of Responses
Total Male Female
Volume and weight 46.77 29 14 15
Maintenance (cleaning cup and so on)
37.10 23 17 6
Appearance 0 0 0 0
Al l of the above 11.29 7 4 3
Other (please specify) 4.84 3 2 1
Total Respondents 100 62 37 25
Other opinions
I agree that there are those reasons mentioned above, but I usually drink coffee
after a meal or when taking a rest while outside, so I don’t have a reusable cup
with me all the time. It’s not like a planned shopping.
I’ve had times where the inner contents leaked out of the reusable cups.
Price/remembering to take the reusable cup.

38
The last two questions asked the respondents which type of reusable cup they would use
if they decided to use it regularly; the majority – 36 out of 44 respondents – replied they would
use one made of stainless steel material, giving safety and economic issues as the main reasons.
Table 18: If you decide to use a reusable cup, what kind of reusable cup do you select,
answered: 62 skipped: 31
Answer Choices Responses (%) Num. of Responses
Total Male Female
Ceramic M UG 8.06 5 2 3
Plastic Tumbler 11.29 7 6 1
Stainless Tumbler 74.20 46 26 20
Al l of the above 6.45 4 3 1
Other (please specify) 0 0 0 0
Total Respondents 100 62 37 25
Table 19: What are your main reasons to select the reusable cup?
(Multiple choice), answered: 62 skipped: 31
Answer Choices Responses (%) Num. of Responses
Total Male Female
Safety 27.42 17 9 8
Economic 24.19 15 9 6
Trendy 17.74 11 5 6
Al l of the above 4.84 3 3 0
Other (please specify) 25.81 16 11 5
Total Respondents 100 62 37 25

39
Other opinions
I feel good when I drink from fancy cups. Paper cups are easy to leak and spill.
After having a baby, I try to not use paper cups.
Design
The economic benefit is not clear at the moment, but if there is, I will be
motivated.
I understand that paper cups are not only environmentally hazardous, but they also
have negative health effects. Therefore, I’ve tried many times but was not
successful.
I’m not sure if stainless steel cups are easier to wash and clean, but it seems that
they are cleaner and easier to maintain than plastic cups.
Weight
No matter how, I think to use the paper cup is too wasteful.
And environmental awareness. Want to protect the earth.
Make a statement with its design and also I can choose the size more easily.
I don't have to think ahead to bring one. Since I don't go that often I don't think
about it in advance.
Disposable waste has been increased in a tremendous way. The environment must
be regarded as very important for the future generation.
Furthermore, the majority of the non-users responded inconvenience was the main
reason for not using reusable cups – such as the size and weight of the cups, washing and
maintenance problems. Most respondents stated that if they do use reusable cups, it would be
preferable to use a light, stainless steel tumbler that easy to manage.
3.1.5 Results from the interview
In order to further observe details based on the survey questions, the interview was
carried out in a Starbucks store located in downtown Ames, Iowa. The most interesting

40
observation made was that most reusable cup users took great pride in their efforts of helping
the environment. They stated that although inconvenient at first, once one is used to carrying
his or her own cup to the store, it no longer becomes a hassle. Furthermore, the majority of
reusable cup users were involved in various other environmental activities. Non-users stated
that although they have a will to use reusable cups, the inconvenience of washing them
regularly and other sanitary issues were posed as barriers. Several respondents stated that in
the past, they have tried using ceramic mug cups that were relatively easy to wash, but
because the mugs were so easily broken, they used plastic or stainless tumblers. However, due
to the reason that it was difficult to wash the lids and the insides of the tumblers, they reverted
back to using paper cups provided at the coffee shops.
3.1.6 Conclusions from the analysis
Through the conducted surveys and interviews, I was able to recognize a variety of
opinions regarding the usage of reusable of cups. It is apparent that respondents who use
reusable cups basically have a concern for environmental issues, as well as non-users who are
at least aware of the problem. For many reasons, however, customers are unable to put their
thoughts into action despite the fact that they know how to act in a socially responsible way.
Furthermore, stainless steel tumblers appear to be the most preferable form of reusable
cups for potential users. Essentially, they must be presented with a plan which addresses the
maintenance and washing inconveniences.
41
3.2 Research of Environment Strategy for Existing Beverage Brands
3.2.1 Research of Starbucks
a. Market geographic of global Starbucks
According to a report of ‘Starbucks; Delivering customer service’ from 2002,24 it
shows that in the Southeastern part of the United States there was only one store for
every 110,000 people, whereas in the Pacific Northwest, there was one store for
every 20,000 people. Hence, the company was far from reaching existing markets.
As for global coffee markets, international plans showed that Starbucks was
operating in over 300 company-owned stores in the United Kingdom, Australia, and
Thailand. Furthermore, 900 licensed stores were operating in Asia, Europe, the
Middle East, Africa, and Latin America.
b. Demographics of main customers
A 1999 estimate showed that 70% of customers were internet users, and today the
numbers have risen, exceeding 90%. 25 Whereas customers that visit coffee shops
most frequently make an average of 18 visits per month, the typical customer visits
five times per month. The average age for an established customer was 40, while for
new customers the average of 36 years old. In addition, 45% of the customers who
started making visits to Starbucks in 2002 were female, whereas 55% were male.
24 Moon, Youngme, and John Quelch. Starbucks: Delivering Customer Service. Harvard, College. Boston: Harvard Business School,
2003. 1-20.
25 “Starbucks Corporation.” Hoovers, Inc. 2006. 4 Dec. 2006.
42
c. Feature of Starbucks in coffee market
In response to market needs26, Starbucks wishes to create an experience which
integrates the customers’ tight and busy schedule, as well as a place where one is
able to relax. Christine Day, the senior vice president of administration in North
America, explains that, “people come here for the coffee, but ambience is what
makes them want to stay” So when they want to stay and enjoy their time in local
Starbucks shop, customers are able to select a wide selection of the Starbucks menu,
which includes brewed coffee, espresso traditions and favorites, cold beverages,
coffee alternatives, Frappuccino, and the sale of whole beans. Not only menu
selection but also Starbucks provides easy accessibility to their customers, operating
over 10,000 retail stores. Most of the 4,200 franchised stores are located in shopping
malls and airports, where customers of all ages are able to access freely. And
Starbucks coffee brands are marketed through grocery stores in the form of beans as
well as ice cream flavors.
The employment method of Starbucks is closely connected to their manner of
customer service. For instance, Starbucks employees are referred to as “partners.” As
of 2002, Starbucks employed approximately 60,000 partners around the globe, out of
which 50,000 were those in the United States. In taking over Starbucks, Howard
Schultz, now the chairman and CEO of Starbucks, stated, “Partner satisfaction leads
to customer satisfaction”
26 Moon, Youngme, and John Quelch. Starbucks: Delivering Customer Service. Harvard, College. Boston: Harvard Business School,
2003. 1-20.

43
And another strength of this brand is Starbucks also provides competitive pricing for
their customers. In the 2002 fiscal year, the average price of an order in North
American stores was $3.85. The drinks come in three sizes: tall, grande, and venti
(Italian for small, medium, and large). The least expensive price for a tall drink is
$1.40 for brewed Coffee of the Day. The most expensive price for a venti is $4.15
for Frappuccino. Whole beans are sold in half and whole pound bags ranging from
$5.20 to $15.95.
Table 20: Total U.S. retail coffee market (both in-home and out-of-home consumption)
Year of 2002 Year of 2005
Specialty Coffee Market 42% 50%
Traditional Coffee 73% 69%
Specialty Coffee 27% 31%
Estimate(billion dollar) 21.5 22
Over the next few years, an estimate for the U.S. retail coffee market expects
specialty coffee to have a compound annual growth rate (CAGR) between 9%-10%.
Starbucks was also estimated in 2002 to grow at a CAGR of about 20% top-line
revenue growth. As of 2002, coffee consumption had risen with more than half of the
population (about 109 million people) drinking coffee everyday, and an additional 52
million drinking coffee on occasion. Reports show that in 2002, the number of
specialty coffee drinkers has become the Starbucks market’s biggest growth. An

44
estimated one-third of all U.S. coffee consumption takes place outside of the home
and in places such as offices, restaurants, and coffee shops. 27
3.2.2 Problem statement of Starbucks
Because recycling infrastructure varies widely amongst countries around the world –
even from one city to another – a one size-fits-all approach does not work for a global
business such as Starbucks with stores in more than 60 countries. Starbucks has proven that
used cups can be accepted in a variety of recycling systems, and it is bringing this to scale in
the United States, Canada, the United Kingdom and Germany. While developing material and
infrastructure solutions in additional markets, Starbucks is working toward its goal to provide
all customers access to cup recycling by 2015. By working with nongovernmental
organizations, policy makers, competitors and others, Starbucks is able to tackle common
challenges. As a member of the Paper Recovery Alliance and the Plastics Recovery Alliance,
and others, Starbucks is helping advance a number of meaningful food packaging initiatives
that will have a significant impact on the entire industry. Although most customers who visit
Coffee Project take their beverages to go, providing front-of-store recycling is an important
part of the company’s effort to develop comprehensive recycling solutions. In 2008 Starbucks
set a goal to implement front-of-store recycling in all company-owned locations by 2015. In
2012 24% of its company-owned stores in the United States and Canada offered front-of-store
recycling. Of these locations, 94% were able to recycle or compost the hot cup. Starbucks is
currently expanding to international markets to reach its goal.
27 Moon, Youngme, and John Quelch. Starbucks: Delivering Customer Service. Harvard, College. Boston: Harvard Business School,
2003. 1-20.
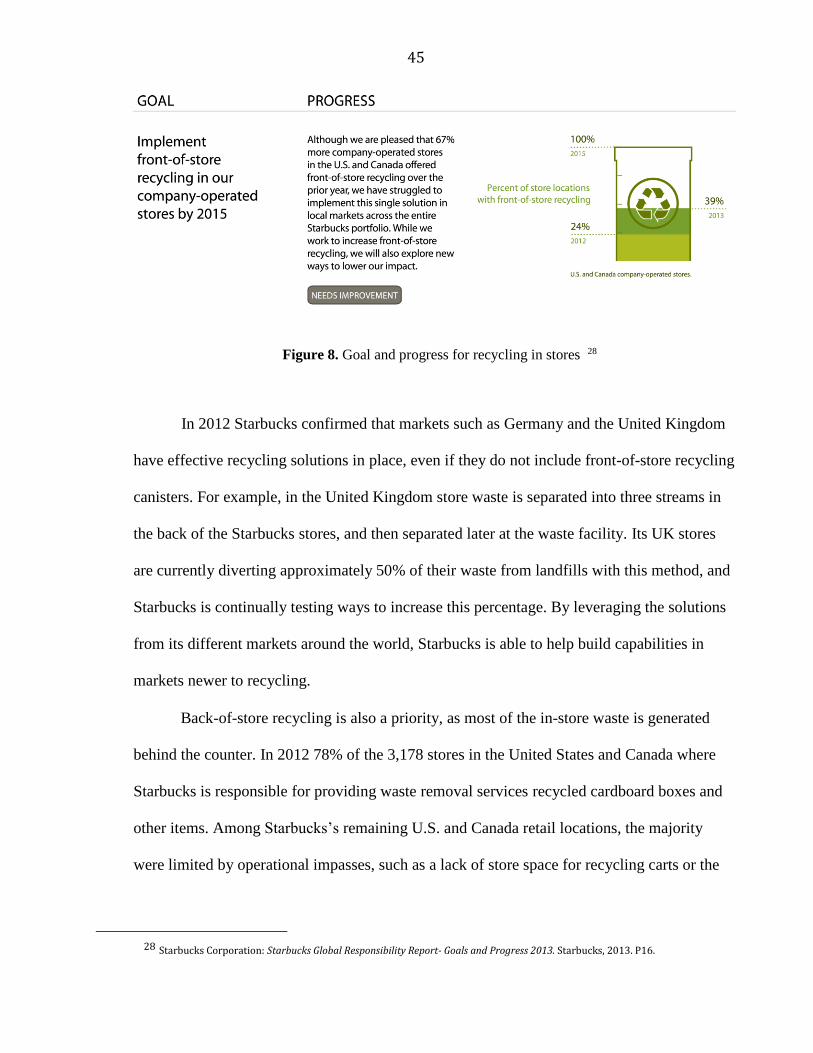
45
Figure 8. Goal and progress for recycling in stores 28
In 2012 Starbucks confirmed that markets such as Germany and the United Kingdom
have effective recycling solutions in place, even if they do not include front-of-store recycling
canisters. For example, in the United Kingdom store waste is separated into three streams in
the back of the Starbucks stores, and then separated later at the waste facility. Its UK stores
are currently diverting approximately 50% of their waste from landfills with this method, and
Starbucks is continually testing ways to increase this percentage. By leveraging the solutions
from its different markets around the world, Starbucks is able to help build capabilities in
markets newer to recycling.
Back-of-store recycling is also a priority, as most of the in-store waste is generated
behind the counter. In 2012 78% of the 3,178 stores in the United States and Canada where
Starbucks is responsible for providing waste removal services recycled cardboard boxes and
other items. Among Starbucks’s remaining U.S. and Canada retail locations, the majority
were limited by operational impasses, such as a lack of store space for recycling carts or the
28 Starbucks Corporation: Starbucks Global Responsibility Report- Goals and Progress 2013. Starbucks, 2013. P16.

46
unavailability of commercial recycling services. Starbucks is currently working to resolve
these barriers.
Reusable cups are an important component of Starbucks’s overall waste reduction
strategy. Since 1985 this coffee franchise business has rewarded its customers with a discount
when they bring in personal tumblers; Starbucks’s goal is to serve 5% of the beverages made
in its stores in tumblers and mugs brought in by the customers.
Figure 9. Goal and progress of reducing waste with reusable cups 29
In 2012 customers brought their own tumblers into Starbucks’s stores 35.8 million
times, saving more than 1.6 million pounds of paper from landfills. Although customers
brought in their personal mugs 1.6 million more times in 2012 over the previous year, the
percentage of customers choosing reusable mugs remained flat from last year.
To sum up, according to the report mentioned above, Starbucks is pursuing a
variety of eco-friendly projects, and a number of indicators show that the company is
29 Starbucks Corporation: Starbucks Global Responsibility Report- Goals and Progress 2013. Starbucks, 2013. P17.
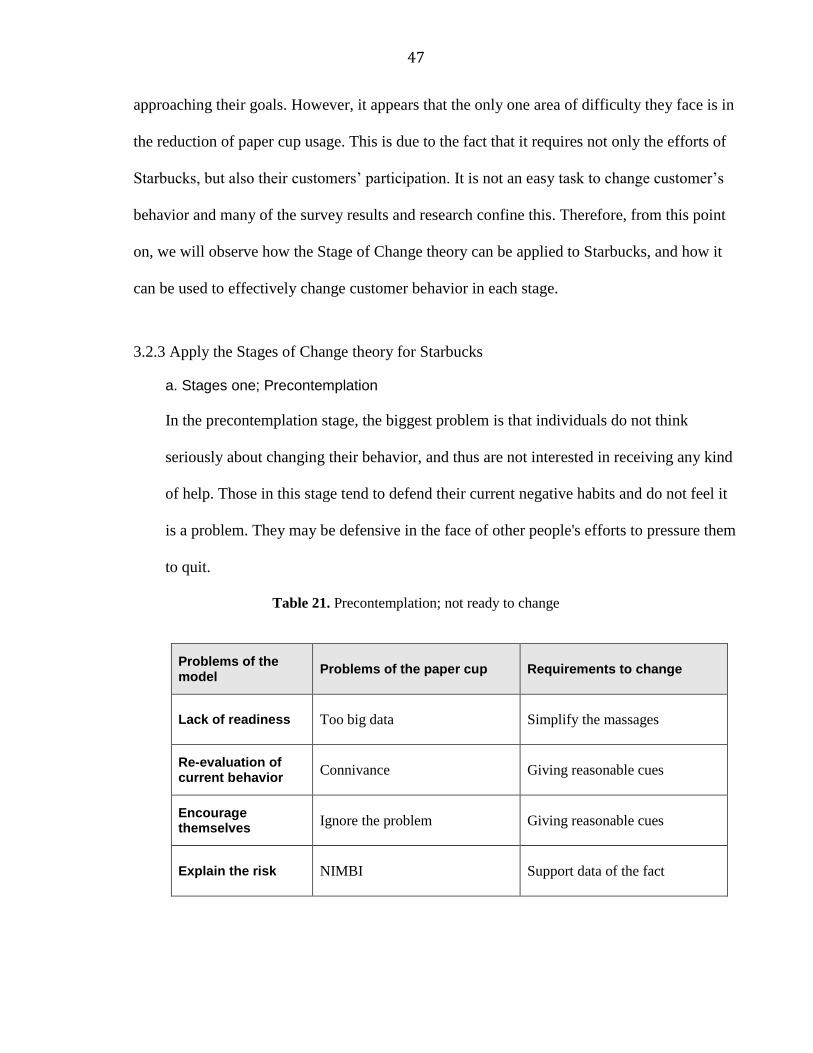
47
approaching their goals. However, it appears that the only one area of difficulty they face is in
the reduction of paper cup usage. This is due to the fact that it requires not only the efforts of
Starbucks, but also their customers’ participation. It is not an easy task to change customer’s
behavior and many of the survey results and research confine this. Therefore, from this point
on, we will observe how the Stage of Change theory can be applied to Starbucks, and how it
can be used to effectively change customer behavior in each stage.
3.2.3 Apply the Stages of Change theory for Starbucks
a. Stages one; Precontemplation
In the precontemplation stage, the biggest problem is that individuals do not think
seriously about changing their behavior, and thus are not interested in receiving any kind
of help. Those in this stage tend to defend their current negative habits and do not feel it
is a problem. They may be defensive in the face of other people's efforts to pressure them
to quit.
Table 21. Precontemplation; not ready to change
Problems of the model
Problems of the paper cup Requirements to change
Lack of readiness Too big data Simplify the massages
Re-evaluation of current behavior
Connivance Giving reasonable cues
Encourage themselves
Ignore the problem Giving reasonable cues
Explain the risk NIMBI Support data of the fact

48
b. Stage two: Contemplation
In the contemplation stage individuals are more aware of the personal consequences of
their negative habit and spend time thinking about their problem. Although they are able
to consider the possibility of changing, they tend to be ambivalent about it. In this stage,
one is on a teeter-totter, weighing the pros and cons of quitting or modifying his or her
behavior. Individuals may consider the negative aspects of their negative habit and the
potentially positive results of giving the behavior up or reducing it, but there may
nonetheless be a doubt that the long-term benefits associated with quitting will
outweigh the short-term costs. It might take as little as a couple weeks or as long as a
lifetime to get through the contemplation stage. On the plus side, people are more open
to receiving information about their negative habit, and more likely to actually use
educational interventions and reflect on their own feelings and thoughts concerning it.
Table 22, Contemplation; just thinking of changing
Problems of the model
Problems of the paper cup Requirements to change
Evaluation of Pros & Cons
Size matter of reusable cup Minimum or changeable size
Weight of reusable cup Using light material
Positive outcome expectation
Cleaning up maintenance Easy maintenance
Appearance Designed product
c. Stage three: Preparation/Determination
In the preparation/determination stage, the person has made a commitment to make
a change. This is sort of a research phase: individuals are now taking small steps
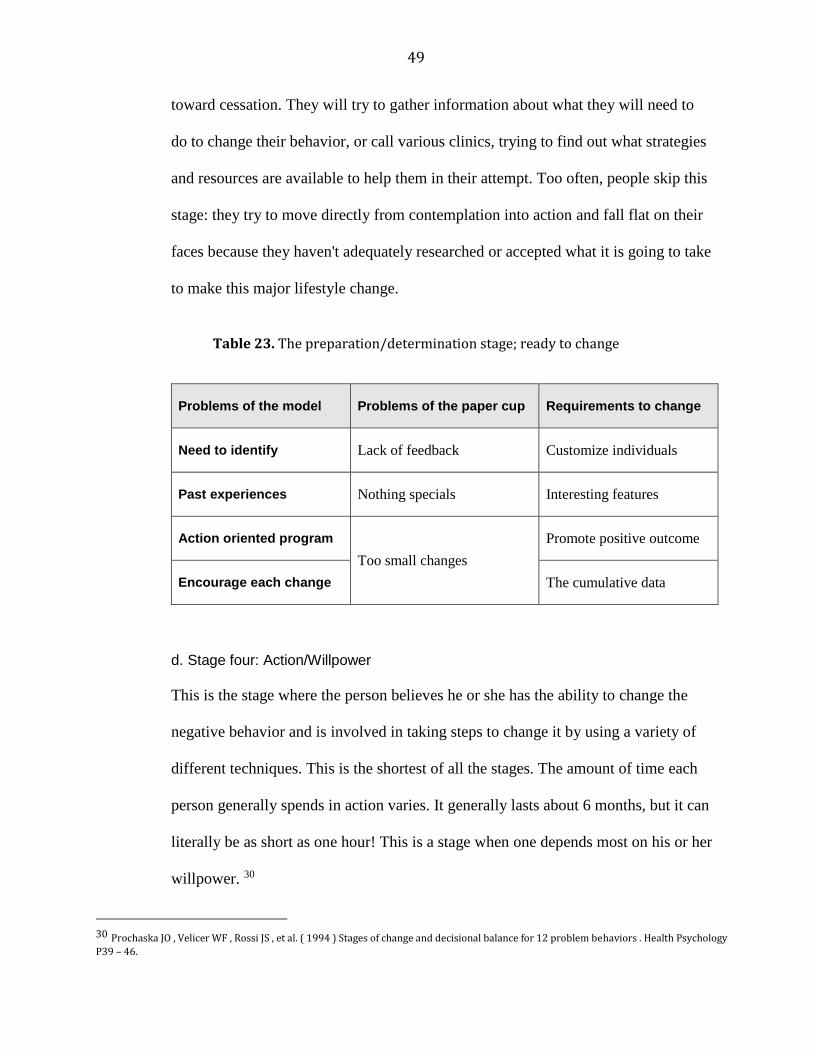
49
toward cessation. They will try to gather information about what they will need to
do to change their behavior, or call various clinics, trying to find out what strategies
and resources are available to help them in their attempt. Too often, people skip this
stage: they try to move directly from contemplation into action and fall flat on their
faces because they haven't adequately researched or accepted what it is going to take
to make this major lifestyle change.
Table 23. The preparation/determination stage; ready to change
Problems of the model Problems of the paper cup Requirements to change
Need to identify Lack of feedback Customize individuals
Past experiences Nothing specials Interesting features
Action oriented program
Too small changes
Promote positive outcome
Encourage each change The cumulative data
d. Stage four: Action/Willpower
This is the stage where the person believes he or she has the ability to change the
negative behavior and is involved in taking steps to change it by using a variety of
different techniques. This is the shortest of all the stages. The amount of time each
person generally spends in action varies. It generally lasts about 6 months, but it can
literally be as short as one hour! This is a stage when one depends most on his or her
willpower. 30
30 Prochaska JO , Velicer WF , Rossi JS , et al. ( 1994 ) Stages of change and decisional balance for 12 problem behaviors . Health Psychology
P39 – 46.

50
Table 24. The action and willpower; making change
Problems of the model
Problems of the paper cup Requirements to change
Pride Invisible change Motivation
Self-efficacy Inconvenient Convenience in use
Stress and depress
Forget or hard to carry reusable cup Portability
While making overt efforts to quit or change the behavior, one is at the greatest risk for
relapse. Individuals mentally review their commitment to themselves and develop plans
to deal with both personal and external pressures that may lead to slips. In order to
sustain their motivation, short-term rewards may be used, and behavior change efforts
may be analyzed in a way that enhances self-confidence. Those in this stage also tend to
be open to receiving help and are likely to seek support from others.
e. Stage five: Maintenance
Maintenance involves being able to successfully avoid any temptations that may lead
one to return to the bad habit. The goal of the maintenance stage is to maintain the new
status quo. Those in this stage tend to remind themselves of how much progress they
have made. Constantly reformulating the rules of their lives, they acquire new skills to
deal with life and avoid relapse. People in the maintenance stage are also able to
anticipate the situations in which a relapse may occur and prepare coping strategies in
advance. Furthermore, they remain aware that what they are striving for is personally
worthwhile and meaningful. They are also patient with themselves and recognize that it

51
often takes a while to let go of old behavior patterns, practicing new ones until
becoming second nature to them.
Table 25. The maintenance; staying on track
Problems of the model Problems of the paper cup Requirements to change
Follow-up support Less tempted Sustainable stimulus
Reinforce reward Boring Variety rewards
Relapse Ignore importance Remind
3.3 Design Solutions for Each Stage
3.3.1 Solution for stages of Pre-contemplation; Information graphic design
As mentioned earlier, the greatest problem in this stage is that consumers need an
accurate awareness of the environmental damages that can result from paper cup usage. In
order to deliver accurate information such as statistics, one must use an information design
that consumers can understand and remember well. More formally, an infographic is defined
as a visualization of data or ideas that tries to convey complex information to an audience in a
manner that can be quickly consumed and easily understood. The process of developing and
publishing infographics is called data visualization, information design, or information
architecture.31
31 Mark Smiciklas . The Power of Infographics: Using Pictures to Communicate and Connect with Your Audience. P3
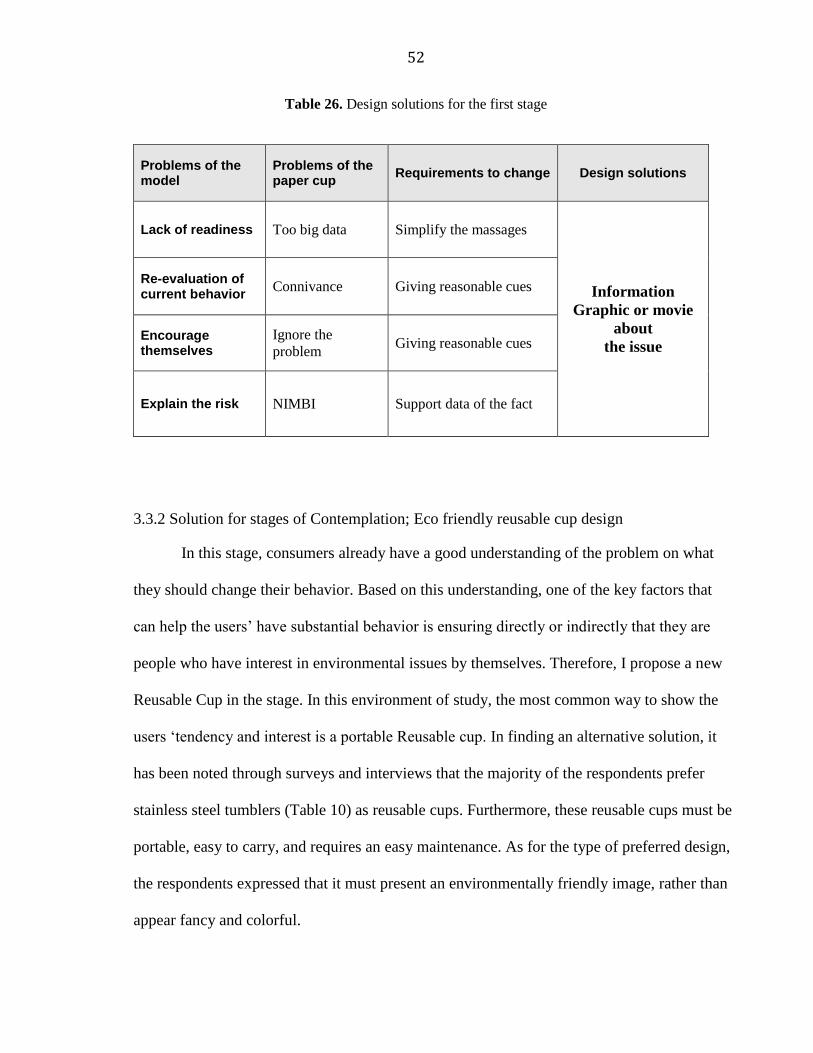
52
Table 26. Design solutions for the first stage
Problems of the model
Problems of the paper cup
Requirements to change Design solutions
Lack of readiness Too big data Simplify the massages
Information
Graphic or movie
about
the issue
Re-evaluation of current behavior
Connivance Giving reasonable cues
Encourage themselves
Ignore the
problem Giving reasonable cues
Explain the risk NIMBI Support data of the fact
3.3.2 Solution for stages of Contemplation; Eco friendly reusable cup design
In this stage, consumers already have a good understanding of the problem on what
they should change their behavior. Based on this understanding, one of the key factors that
can help the users’ have substantial behavior is ensuring directly or indirectly that they are
people who have interest in environmental issues by themselves. Therefore, I propose a new
Reusable Cup in the stage. In this environment of study, the most common way to show the
users ‘tendency and interest is a portable Reusable cup. In finding an alternative solution, it
has been noted through surveys and interviews that the majority of the respondents prefer
stainless steel tumblers (Table 10) as reusable cups. Furthermore, these reusable cups must be
portable, easy to carry, and requires an easy maintenance. As for the type of preferred design,
the respondents expressed that it must present an environmentally friendly image, rather than
appear fancy and colorful.

53
Table 27. Design solutions for the second stage
Problems of the model
Problems of the paper cup
Requirements to change
Design solutions
Evaluation of Pros & Cons
Size matter of
reusable cup
Minimum or
changeable size Plastic or
aluminum tumbler Weight of
reusable cup Using light material
Positive expectation
Cleaning up
maintenance Easy maintenance
Support cleaning
into the shop
Appearance Designed product Eco friendly design
Timeless style tumbler design
3.3.3 Solution for stages of Preparation for Action; User interface design
The third stage, Preparation for Action, is easy to be overlooked in many cases.
However, if this preparation stage is indefinite, it will be hard to see effective and long-term
behavior change in the next Stages of Action. In the case of Starbucks, the company must
move away from simply requesting customers to use reusable cups. Instead, for active
intervention, I redesign a new mobile device application service based on the existing
Starbucks App platform in smart phones, and thereby continually provide motivation factors
for the customers. Thus, by focusing on individual mobile devices, one should build a simple
and clear Interface Design.

54
Table 28. Design solutions for the third stage
Problems of the model
Problems of the paper cup
Requirements to change
Design solutions
Need to identify Lack of feedback Customize individuals App for Personal device
Past experiences Nothing specials Interesting features Visualize User Interface
Action oriented program
Too small change
Promote positive
outcome
Reward system design
Encourage each change
The cumulative data
3.3.4 Solution for stages of Action; Brand and service design
The fourth Action Stage is where the users directly take actions using their
knowledge and decisions they have built until now. It is easy for the users to enter this stage
for they have already decided to change their thoughts to action. But the problem is that the
moment they take practical action the substantial resistance also appears with it. As an
example, the users can take the reusable cup on their own volition, but would experience
inconvenience. Also, they will meet an unfamiliar experience like when it is your first time
ordering with the reusable cup and other differences that come up through these changes. In
this stage, it is important to take direct action but it is necessary to provide something more
valuable to the users that can predict these resistances and minimize or remove the resistance.
Therefore, by proposing a brand and other various promotions for this stage, through sharing

55
a brand value that the users can trust and with interesting promotions, a continuous act can
become their individual pride.
Table 29. Design solutions for the fourth stage
Problems of the model
Problems of the paper cup
Requirements to change
Design solutions
Pride Invisible change Motivation Brand design and other
application
Self-efficacy Inconvenient Convenience in use Creating fun and exciting value
Stress and depress
Forget or hard to
carry reusable cup Portability Attractive appearance
3.3.5 Solution for stages of Maintenance; Infographic and entertainment design
In the last stage 'Maintenance', it is important how the users overcome their boredom
of their repeated actions that they decided to do. In this stage, the Design Solution helps the
users to sense directly how much difference their actions changed by quantifying their actions
and showing them again. Also this should entertain the users with games or promotions that
will not make them feel bored but make them feel they have done something valuable. In this
study, we can develop a game that uses a tumbler and the game will have a reward system so
that the users can get many different kinds of benefits through the game. Besides, by developing
various types of game tools, users can sustainably use the tumbler.

56
Table 30. Design solutions for the last stage
Problems of the model
Problems of the paper cup
Requirements to change
Design solutions
Follow-up support Less tempted Sustainable
stimulus Diversify games
Reinforce reward Boring Variety rewards Create promotion events
Relapse Ignore importance Remind Clarify feed back
3.4 Design System for Sustainable Package: Green Number Project
Through the presented issues and the solution for those issues, I am proposing a new system
that uses a newly designed reusable tumbler based on a new reward system. The problem of paper
cup usage can be addressed by finding a design system for sustainable package that will present the
customers with practical and persuasive motivation factors. It called as Green Number Project.
3.4.1 Information graphic design
As regarding the design solution from the first stage, I tried to design an information
graphic poster that clearly shows the meaning of the rather high numbers. According to a
previously stated data in 2006, Starbucks consumed 2.3 billion numbers of disposable cups
worldwide. In order to produce this amount of paper cups, the paper cup industry needs to
cut down 944 thousand numbers of trees. A paper authored by David B. South32 (Professor
School of Forestry and Wildlife Sciences and Alabama Agricultural Experiment Station
32 South, David B. - "Planting longleaf pine at wide spacings", Native Plants Journal - Volume 7, Num1, Spring 2006, pp. 79-88

57
Auburn University, AL), it states that a typical 10-year-old Southern Pine might have a
diameter at breast height of 10 in and height of 53.5 ft. According to the Journal of
Construction Education, a standard American house of 1,500 square foot, 3-bedroom, one-
story gable house with slab-on-grade foundation in Florida takes about 400 board feet of
lumber.33 As a Lumber timber calculator, using the above Southern Pine, we would get
about 75 board feet (using the International Rule) per a tree. It would thus take around 5.3 of
these trees to build the house described above. This means that with the number of yearly
consumed paper cups in Starbucks Coffee 178 thousand American standard-size houses can
be built, which nearly equals the number of housing units in Minneapolis, Minnesota in
2012.34
Figure 10. Information graphic about paper cup consumption,
designed by Joongsup Lee, 2012
33 Journal of Construction Education: http://forestry.about.com/cs/forestvalua… and http://www.ascjournal.ascweb.org/journal…
34 2012 house hold numbers @ www.census.gov
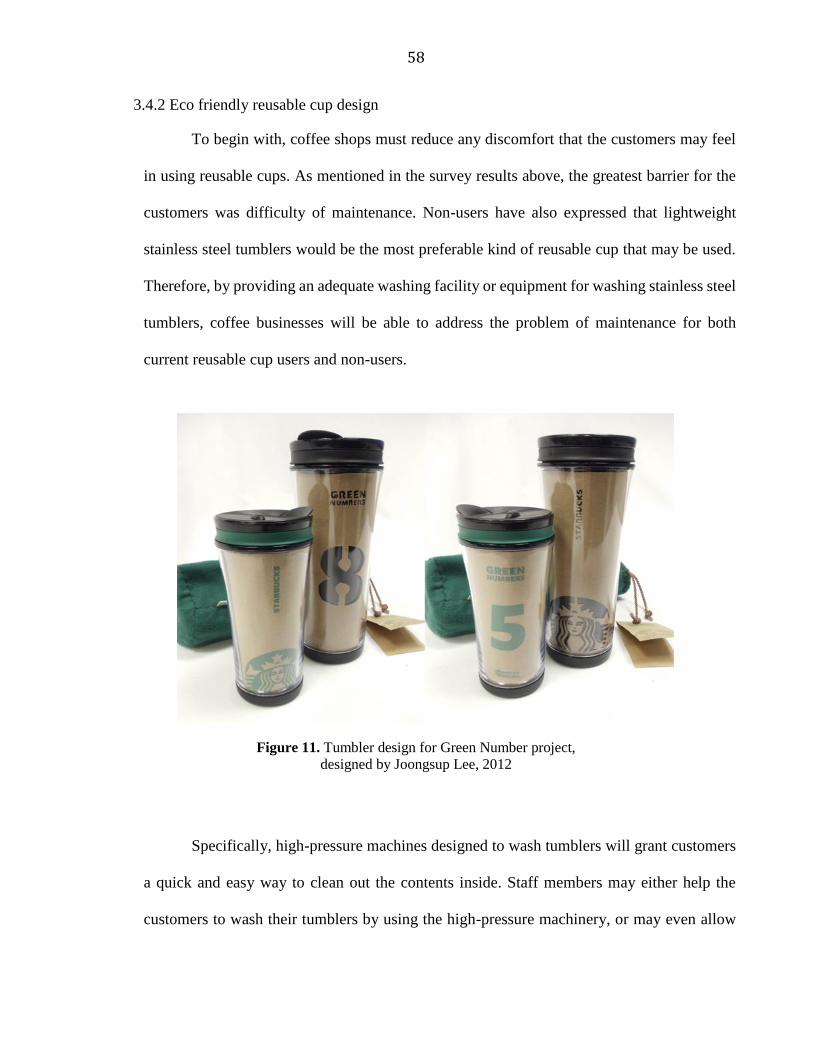
58
3.4.2 Eco friendly reusable cup design
To begin with, coffee shops must reduce any discomfort that the customers may feel
in using reusable cups. As mentioned in the survey results above, the greatest barrier for the
customers was difficulty of maintenance. Non-users have also expressed that lightweight
stainless steel tumblers would be the most preferable kind of reusable cup that may be used.
Therefore, by providing an adequate washing facility or equipment for washing stainless steel
tumblers, coffee businesses will be able to address the problem of maintenance for both
current reusable cup users and non-users.
Figure 11. Tumbler design for Green Number project,
designed by Joongsup Lee, 2012
Specifically, high-pressure machines designed to wash tumblers will grant customers
a quick and easy way to clean out the contents inside. Staff members may either help the
customers to wash their tumblers by using the high-pressure machinery, or may even allow

59
the customers to use the equipment themselves. Thus, when visiting the stores, customers can
bring their reusable cups unwashed, and easily access a machine that will do the cleaning for
them, ultimately removing any inconvenience related to maintenance issues.
Following the maintenance process above, is another important solution in the
designers' perspective, "Eco Friendly Reusable Cup Design". The design you see in Figure 11
is designed in two forms, a small sized tumbler and a big one. The small sized tumbler
minimizes the pollution using soy ink on recycled paper and prints in one color. And the large
tumbler uses the same recycled paper with no ink but displays information with paper cutting,
adopting a more eco-friendly manufacturing method. Also the pouch that keeps the tumbler
does an important role to complete an Eco Friendly Reusable Cup, which is made of worn
hoodies or shirts that are abandoned in houses.
3.4.3 User interface design
In order for an individual to move away from a negative habit to a new one, one must
have the adequate motivation to do so. In this case, two kinds of motivation may be given to
the customers – enjoyment and a sense of pride. This can be done by creating a system that
integrates both package design and smart-phone application.
First of all, the reusable cups that customers bring will be randomly marked with any
number between 0 and 9. The customers will then be able to play a game through their smart-
phones or even online, where each person will ultimately end up with a digit between 0 and
9. If the individual receives the same number that is marked on his or her tumbler, then the
application will send a coupon allowing for one free drink. Customers that play the game but
do not end up with the same digit will nonetheless have received a monetary benefit of

60
discount for using reusable cups. Therefore, whether or not the customers win or lose, there
will be a motivation factor of enjoyment by playing the game. When it's a busy hour it will be
hard to do a game because of the waiting line. Therefore the customers that bought a beverage
with the Green Number Tumbler can get the same reward by receiving a game coupon through
the mobile application and accessing the game with the QR code on the tumbler. For those
customers that do not use smart-phones, offline games may be provided in the store. For
example, customers who brought their tumblers will be given a chance to throw darts at a
target, where each area of the target will be marked a specific digit.
Figure 12. QR code on the Green Number tumbler, designed by Joongsup Lee

61
Figure 13. User interface design for Green Number App, designed by Joongsup Lee
3.4.4 Brand and service design
The stage above presents a physical pollution to provide the information and system
to change the user’s behavior. Starting from this stage qualitative things that the consumer
feels, thinks, and enjoys will become the key design elements. Although this kind of
solution could be hard to carry around, it is necessary to give them the pride to the
continuous reusable cup users and make sure they feel confident that they are doing the right
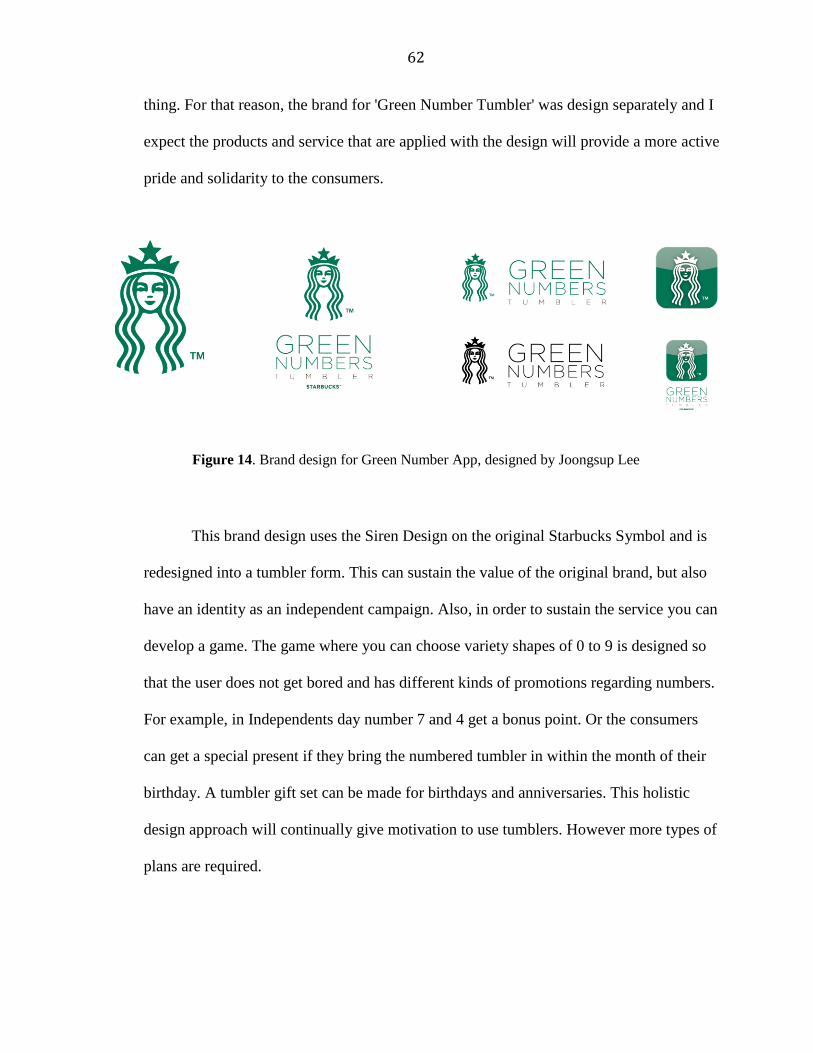
62
thing. For that reason, the brand for 'Green Number Tumbler' was design separately and I
expect the products and service that are applied with the design will provide a more active
pride and solidarity to the consumers.
Figure 14. Brand design for Green Number App, designed by Joongsup Lee
This brand design uses the Siren Design on the original Starbucks Symbol and is
redesigned into a tumbler form. This can sustain the value of the original brand, but also
have an identity as an independent campaign. Also, in order to sustain the service you can
develop a game. The game where you can choose variety shapes of 0 to 9 is designed so
that the user does not get bored and has different kinds of promotions regarding numbers.
For example, in Independents day number 7 and 4 get a bonus point. Or the consumers
can get a special present if they bring the numbered tumbler in within the month of their
birthday. A tumbler gift set can be made for birthdays and anniversaries. This holistic
design approach will continually give motivation to use tumblers. However more types of
plans are required.

63
3.4.5 Information and experience design
Another motivation factor that can be given to the customers is a sense of pride in using
reusable cups. This will also be done by a smart-phone application. Whenever a customer brings
a reusable cup to the store, the staff will register data that the customer has saved one paper cup.
As the number of paper cups increase each time the customer uses a reusable cup, he or she can
immediately check how many trees were saved. By such visible, realistic record, the customer
will grow a sense of pride in using reusable cups instead of paper cups.
Figure 15. Providing prompt feedback system, designed by Joongsup Lee
This kind of prompt and tangible feedback makes the customers participate
actively. Also these information and experiences can be used as a tool in creating a new
and positive behavioral change.

64
CHAPTER 4. CONCLUSIONS AND IMPLICATIONS
This research was carried out in order to find some reasonable solutions for reducing the
waste in order to increase sustainability. After recognizing that one of the greatest concerns for
coffee industries is the environmental problem caused by mass paper cup usage in coffee shops, I
have researched ways in which it may be addressed. In order to observe the problem in detail, I
focused on how the alternative solution – increasing the customers’ reusable cup usage – may be
achieved, specifically by behavior change with motivation. With this approach, I have presented
several solutions which integrate customer motivation and package design. In observing the
environmental problem posed by paper cup consumption, this project looked at a globally branded
coffee shop, Starbucks. Being one of the largest coffee franchise businesses, Starbucks already had
interest in the paper cup problem, trying numerous ways in which the situation may be solved.
However, it appears that their efforts are on a standstill, and other solutions are in need. When
carrying out the research, I tried to define why customers, who are aware of the environmental
problem of using paper cups, are not able to act according to the way they think. By studying
various literature reviews, I was able to acquire a broad perspective of the behavior motivation and
the steps required to make a behavior change.
By surveying and interviewing some hot beverage purchasers at the local Starbucks in Ames,
Iowa, I was able to understand the perception of customers about using reusable cups and paper
cups. The results of the surveys and interviews conducted at the local Starbucks store showed that
both types of customers – reusable cup users and paper cup users - basically have a concern for
environmental issues. In fact, while most reusable cup users have great pride in their efforts of
helping the environment, non-users stated that although they have a will to use reusable cups, the

65
inconvenience of washing them regularly and other maintenance issues prevented them to do so. If
non-users were to use reusable cups, however, stainless steel tumblers were expressed as the most
preferable form of reusable cups. From these observations, I recognized that both users and non-
users of reusable cups must be presented with a plan which addresses the maintenance and washing
inconveniences. By finding a design system for sustainable package, the customers will be provided
with persuasive factors that will motivate them to use reusable cups rather than paper cups. Since
the main difficulty that customers feel with reusable cups is maintenance inconvenience, stores
should provide adequate washing facilities for washing stainless steel tumblers – the type of
reusable cup most preferred by customers. With easy-to-use high-pressure machines designed to
wash tumblers, customers will no longer feel any sort of inconvenience related to maintenance
issues.
As recognized from the literatures, in order for an individual to move away from a bad
habit to a new one, one must have the adequate motivation to do so. Specifically, the customers can
be given a motivation for enjoyment and also a motivation to feel a sense of pride. The solution I
proposed is to create a system that integrates both package design and smart-phone application.
Firstly, the customers will be motivated to have fun by playing a game, either online or offline. If
one succeeds on receiving a result corresponding to the number marked on the reusable tumbler,
then the application will send a coupon allowing for one free drink. Customers may also gain a
sense of pride in using reusable cups by witnessing (via the smartphone application) the progress
one makes in saving the environment.

66
APPENDIX A. INSTITUTIONAL REVIEW BOARD APPROVAL

67

68

69
APPENDIX B. ATTACHMENTS FOR THE INTERVIEW & SURVEY
Attachment 1. Flyer for Interview Participants
PARTICIPANTS NEEDED to Interview for a Study of Sustainable & Disposable Beverage Cups. Are you willing to spend approximately
10 minutes to interview for a sustainable
beverage cup design? If you are age 18 or over and have experience ordering hot beverages from a coffee shop, and are interested in participating in this voluntary and confidential study, please contact:
Joongsup Lee / 515-509-5870

70
Attachment 1-1. Flyer for Survey Participants
PARTICIPANTS NEEDED to Survey for a Study of Sustainable & Disposable Beverage Cups. Are you willing to spend approximately
10 minutes to survey for a sustainable
beverage cup design? If you are age 18 or over and have experience ordering hot beverages from a coffee shop, and are interested in participating in this voluntary and confidential study, please contact:
Joongsup Lee / 515-509-5870

71
Attachment 2. Informed Consent Document
Informed Consent Document
Title of Study:
A Study for increasing reusable cup consumption in the coffee industry. Investigator: Joongsup Lee, MFA, Graduate student
This is a research study. Please take your time in deciding if you would like to participate.
Please feel free to ask questions at any time. No items will be purchased during the session. No personal
or financial information will be collected during the session.
INTRODUCTION
The purpose of this research is to understand the kinds of consumer experiences using disposal and non-
disposal cups when consumers purchase a hot beverage in a coffee shop. This research aims to answer the
survey or interview questions.
DESCRIPTION OF PROCEDURES
If you agree to participate in this study, participation will last for approximately 10 minutes.
During the study you may expect the following study procedures to be followed.
a. Survey participants
1) The principal investigator will send an email enclosed informed consent document to prospective
participants who were recruited as replying email. On the end of this document into email, there is a
checkbox to confirm whether you agree this document or not. If you agree, check the following
checkbox. And when you mark this checkbox, it will be regarded as you signed consent forms. Then you
can answer survey questions and reply email your completed survey to PI.
2) And also when the principal investigator meets a prospective participant directly, the informed
consent form will be read or explained to the subject to make sure that you understand what you have to
do and the importance of the study. If you agree and don't have any questions, you will be asked to sign the form to the start of the survey questions.
3) When you answer survey questions, you may skip any question that you do not wish to answer or that
makes you feel uncomfortable.
b. Interview participants
1) The PI will contact prospective participants to schedule a interview and will send informed consent document.
2) On the interview day, the introduction script will be read and the informed consent form will be read
or explained to the subject to make sure that you understand what you have to do and the importance of
the study. If you agree and don't have any questions, you will be asked to sign the form to the start of the interview. If you agree, and sign the Informed Consent Document the interview will begin.
3) The subject will be asked to answers to questions that will be voice recorded.
4) The interview questionnaire asking for the subject's demographic information such as age group and
gender will be obtained.

72
5) This interview will be conducted in private with a researcher to eliminate the influence of peer
pressure. Interview will last for 10 minutes and will be done in a convenient location. It will be audio-
recorded using digital voice recorders. Audio recordings will be transcribed to analyze the session.
6) The participants will answer interview questions. You may skip any question that you do not wish to answer or that makes you feel uncomfortable.
RISKS
There are no foreseeable risks in this study. However, you may leave the study at any time without penalty.
BENEFITS
Participants will not benefit directly. However, the findings and solutions of this research will serve as an
opportunity to world-wide coffee industries to change adverse images, such as using huge quantity of non-
environmental products. Also it will motivate people to change their behavior to more environmental
friendly. The final outcomes of this research will help consumers to build a more positive experience when
they are enjoying beverages.
COSTS AND COMPENSATION
You will not have any costs from participating in this study. There will not be any compensation to
participate in this study.
PARTICIPANT RIGHTS
Your participation in this study is completely voluntary and you may refuse to participate or leave the study
at any time. If you decide to not participate in the study or leave the study early, it will not result in any
penalty or loss of benefits to which you are otherwise entitled. During the interview, if you feel
uncomfortable at anytime you can quit.
CONFIDENTIALITY
Records identifying participants will be kept confidential to the extent permitted by applicable laws and
regulations and will not be made publicly available. However, federal government regulatory agencies and
the Institutional Review Board (a committee that reviews and approves human subject research studies) may
inspect and/or copy your records for quality assurance and data analysis. These records may contain private
information.
To ensure confidentiality to the extent permitted by law, the following measures will be taken.
The participant’s identity will be confidential throughout the study. Only the researcher will have
access to the data. The data will be entered and kept in a password-protected computer located on the
PI’s computers. The questionnaire will be shredded after all the information is entered into the computer. And
audio recordings also will be deleted after saving as digital data files into the computer for analysis. Other data
files will be destroyed once transcribed and entered in the computer for analysis.
QUESTIONS OR PROBLEMS
You are encouraged to ask questions at any time during this study. For further information about the study
contact Joongsup Lee, Principal Investigator, phone 515-509-5870, email [email protected] and Roger
Baer, Supervising Faculty, phone 515-294-0679, email [email protected].
If you have any questions about the rights of research subjects or research-related injury, please contact IRB
Administrator, (515) 294-4566, [email protected], or Director, Office for Responsible Research, (515) 294-
3115, 1138 Pearson Hall, Ames, IA 50011.

73
******************************************************************************
SUBJECT SIGNATURE
Your signature or marking below checkbox indicates that you voluntarily agree that you can participate in this
study, that the study has been explained to you, that you have been given the time to read the document and that
your questions have been satisfactorily answered. You will receive a copy of the signed and dated written
informed consent
prior to your participation in the study.
Subject’s Name (printed)
(Subject’s Signature) (Date)
By marking the checkbox, you indicate that Subject’s Name have read and accepted the terms of this
informed consent document. (Online survey only)
I agree.

74
Attachment 3. Email Script for Interview Participants
Dear xxxx,
I am looking for interview participants who have experience ordering hot beverages from a coffee
shop to share their consumer experiences with disposal and non-disposal cups when they purchase
hot beverages in a shop.
I will ask prepared interview questions about your personal experiences relevant to this topic using
audio recordings and it can be completed in 10 minutes at your convenience at the Starbucks on
Lincoln Way in Ames or another mutually agreeable place.
Participation is completely voluntary. All of the information participants provide will be kept
strictly confidential and reported in summary form only. No individual will be identified, nor will
participants’ names be attached to any data included audio recording. At the project's end,
researchers will destroy any identifying personal information.
Again, you may choose to withdraw from participating at any time without penalty.
If you have any questions or concerns, feel free to contact us at any time.
Joongsup Lee, Principal Investigator, phone 515-509-5870
Email: [email protected]
Thank you for your time and consideration.

75
Attachment 3-1. Email Script for Survey Participants
Dear xxxx,
I am looking for participants who have experience ordering hot beverages from a coffee shop to
share their consumer experiences with disposal and non-disposal cups when they purchase hot
beverages in a shop.
I will ask prepared survey questions to understand what people think about the topic, and it can be
completed in 10 minutes at your convenience at mutually agreeable place.
Participation is completely voluntary. All of the information participants provide will be kept
strictly confidential and reported in summary form only. No individual will be identified, nor will
participants’ names be attached to any data. At the project's end, researchers will destroy any
identifying personal information.
Again, you may choose to withdraw from participating at any time without penalty.
If you have any questions or concerns, feel free to contact us at any time.
Joongsup Lee, Principal Investigator, phone 515-509-5870
Email: [email protected]
Thank you for your time and consideration.

76
Attachment 4. Interview Questions for Reusable Cup User
* Demographic Questions
1. Age
18~29 30~49 50~64 65+
2. Gender
Male Female
3. Permanent Residence
North America Other Continents
4. On average, how many times do you purchase hot beverages each week? Less than once per week
1~2 3~4 5~6 More than 6
* Interview Questions
5. Have you ever brought your reusable cup to purchase your beverages? If you have, how frequently did
you bring the cup? And what are your main reasons to select the reusable cup?
6. When you bring your reusable cup, how do you carry the cup? Carrying in your backpack or cup holder
into your vehicle? Please describe why?
7. What do you have benefit with using your reusable cup?
8. What are your inconvenient aspects when you are using a reusable cup?
9. Do you believe that using disposable paper cups are a big problem to the environment? Can you describe
your opinion why it is problem or not. Additional comments:

77
Attachment 4-1. Interview Questions for Disposable Cup User
* Demographic Questions
1. Age
18~29 30~49 50~64 65+
2. Gender
Male Female
3. Permanent Residence
North America Other Continents
4. On average, how many times do you purchase hot beverages each week? Less than once per week
1~2 3~4 5~6 More than 6
* Interview Questions
5. Do you have reusable cup? Even though you have your reusable cup, why did you use a disposal cup?
6. Do you believe that using disposable paper cups are a big problem to the environment? Can you describe
your opinion why it is problem or not.
7. What can you expect benefit when you bring your reusable cup?
8. What are your inconvenient aspects when you are using a reusable cup? Additional comments:
Attachment 5. Survey Question form
1. Age
18~29 30~49 50~64 65+
2. Gender
Male Female
3. Permanent Residence
North America Other Continents
4. On average, how many times do you purchase hot beverages each week? Less than once per week
1~2 3~4 5~6 More than 6
5. Do you believe that using disposable paper cups are a big problem to the environment?

78
I know I do not mind
6. Do you use a reusable cup? (“Reusable cup is a non-disposable cup that is carried around, and available for repeated
use.”) Yes, go to 7-1 No, go to 8-1
7-1. What kind of reusable cup do you have?
Ceramic MUG Plastic Tumbler Stainless Tumbler
All of the above Other:_____________________
7-2. What are your main reasons to select the reusable cup?
Environmental Safety Economical
Trendy All of the above Other:____________________
7-3. How often do you use your own reusable cup?
1(never) 2 3 4 5(always)
7-4. Which one is the most inconvenient aspect when you are using a reusable cup.
Volume and weight Maintenance (cleaning cup and so on)
Appearance All of the above
Other:________________________
7-5. How much interest do you have regarding environmental issues?
1(never) 2 3 4 5(always)
8-1. Did you know that economic incentives are offered to consumers who use a reusable cup?”
Yes No
If yes, why you don’t use reusable cup even though the incentive:
___________________________
8-2. What are your main reasons for not carrying a reusable cup?
Didn’t buy hot beverages often enough to use own cup Inconvenience
Not aware of the economic incentives Lack of interest in environmental issues
Other:___________________________
8-3. Which one is the most inconvenient value when you carrying a reusable cup.
Volume and weight Maintenance (cleaning cup and so on)
Appearance All of the above
Other:________________________
8-4. If you decide to use a reusable cup, what kind of reusable cup do you select?
Ceramic MUG Plastic Tumbler Stainless Tumbler All of the above
Other:_____________________
8-5. What are your main reasons to select the reusable cup?
Safety Economic Trendy All of the above
Other:_____________________

79
Attachment 6. Word of Mouth Script
My name is Joongsup Lee, MFA graduate student in Graphic Design major.
The first aim of this research is to understand the kinds of consumer experiences with disposal
and non-disposal cups when people purchase hot beverages in a shop. And the final goal of this
research is to suggest an environmentally friendly packaging system based on result of this
survey and interview. So I am looking for survey or interview participants who have experience
ordering hot beverages from a coffee shop to share their consumer experiences with disposal
and non-disposal cups when they purchase hot beverages in a shop. I will ask prepared survey
questions to survey participants. And I will have interviews with interview participants using
audio recordings. Both of them can be completed in 10 minutes at your convenience at the
Starbucks on Lincoln Way in Ames or another mutually agreeable place.
Your Right
Your participation in this study is completely voluntary and you may refuse to participate or
leave the study at any time. If you decide to not participate in the study or leave the study
early, it will not result in any penalty or loss of benefits to which you are otherwise entitled.
During the study, if you feel uncomfortable at anytime you can quit. And all of the information
participants provide will be kept strictly confidential and reported in summary form only. No
individual will be identified, nor will participants’ names be attached to any data included audio
recording. At the project's end, researchers will destroy any identifying personal information.
If you know someone who may be interested in participating this study, please contact
Joongsup Lee at [email protected]
80
Attachment 7. Introduction Script
This interview will consist of three stages, 1) following introducing the concept of this research, 2)
filling out the demographic questions and 3) filling out the interview questions and discuss the open-
ended questions.
This study will last approximatelty 10 minutes.
Introduce a Concept
My name is Joongsup Lee,
Thank you very much for participating in the study, this research is to understand the kinds of consumer
experiences with disposal and non-disposal cups when they purchase hot beverages in a shop.
Your participation will contribute to improve the development of an environmentally friendly packaging
system.
Your participation in this interview is completely voluntary and you may refuse to participate or leave
the interview at any time. If you decide to not participate in the interview or leave the interview early, it
will not result in any penalty or loss of benefits to which you are otherwise entitled. During the
interview, if you feel uncomfortable at anytime you can quit.
If you have any questions, please let me know.

81
BIBLIOGRAPHY
Starbucks Corporation, Starbucks Corporation 2011 Annual Report, Form 10-K, Starbucks Corporation,
2011, p3
Starbucks Corporation, Starbucks Global Responsibility Report – Goals and Progress, Starbucks
Corporation, 2012, p4, p11
Specialty Coffee Association of America, 2012 Coffee Facts and Statistics, SCAA, 2012, P2
Starbucks Corporate, Social Responsibility Report, 2006.
CNN Money.com “Creating the Eco-Cup”. September 19th, 2006.
Environmental Defense. Starbucks Paper Project Goals and Results. July 20th, 2007.
http://www.environmentaldefense.org/page.cfm?tagID=2155
Stephen Wendel. (2013). Designing for Behavior Change. O’Reilly. page XV, p 150, p 22
Prochaska JO , Velicer WF , Rossi JS , et al. ( 1994 ) Stages of change and decisional balance for 12
problem behaviors . Health Psychology P13, P39 – 46.
The web page of UCLA Centre for Human Nutrition.,
http://www.cellinteractive.com/ucla/physcian_ed/stages_change.html
Prochaska, J. O., DiClemente, C. C., Velicer, W. F., & Rossi, J. S. (1993). Standardized, individualized,
interactive, and personalized self-help programs for smoking cessation. Health Psychology, 12, 399-
405.
Velicer, W. F., Redding, C. A., Sun, X., & Prochaska, J. O. (2007). Demographic variables, smoking
variables, and outcome across five studies. Health Psychology, 26, 278-287.
Evers, K. E., Prochaska, J. O., Johnson, J. L., Mauriello, L. M., Padula, J. A., & Prochaska, J. M.
(2006). A randomized clinical trial of a population- and transtheoretical model-based stress-
management intervention. Health Psychol., 25, 521-529.
Johnson, S. S., Driskell, M. M., Johnson, J. L., Prochaska, J. M., Zwick, W., & Prochaska, J. O.
(2006b). Efficacy of a transtheoretical model-based expert system for antihypertensive adherence.
Disease Management, 9, p102-114, p.291-301.
Levesque, D. A., Van Marter, D. F., Schneider, R. J., Bauer, M. R., Goldberg, D. N., Prochaska, J. O.,
& Prochaska, J.M. (in press). Randomized trial of a computer-tailored intervention for patients with
depression. American Journal of Health Promotion.
Moon, Youngme, and John Quelch. Starbucks: Delivering Customer Service. Harvard, College. Boston:
Harvard Business School, 2003. 1-20.

82
Starbucks: Starbucks Global Responsibility Report- Goals and Progress 2013. Starbucks, 2013. p16,17.
Mark Smiciklas . The Power of Infographics: Using Pictures to Communicate and Connect with Your
Audience. Pearson education, Inc. P3
South, David B. - "Planting longleaf pine at wide spacings", Native Plants Journal - Volume 7, Num1,
Spring 2006, pp. 79-8


