
FINAL REPORT
A STATISTICAL STUDY OF THE HYDROLOGICAL
CHARACTER OF THE EDWARDS AQUIFER
David Tomasko, Ann-Marie Fisher, Gustavious P. Williams,
and Edwin D. Pentecost
Argonne National Laboratory1
Argonne, Illinois
October 2001
1Argonne National Laboratory is operated by the University of Chicago for the U.S. Department of Energy under contract W-31-109-Eng-38.
A STATISTICAL STUDY OF THE HYDROLOGICAL CHARACTER OF THE EDWARDS AQUIFER
TABLE OF CONTENTS
1 INTRODUCTION .......................................................................................................................1 2 PRECIPITATION EVENT..........................................................................................................2 3 RIVER FLOWS...........................................................................................................................3 4 WATER-LEVELS IN MONITOR WELLS................................................................................4 5 SPRING DISCHARGES .............................................................................................................5 6 LAG TIMES TO ACHIEVE MAXIMUM INDICATOR PARAMETER VALUES.................6 7 CROSS-CORRELATIONS .........................................................................................................7 8 REGRESSION MODEL FOR SAN MARCOS SPRINGS.......................................................11 9 MODEL INFERENCE .............................................................................................................15 10 DISCUSSION..........................................................................................................................19 REFERENCES ..............................................................................................................................21

STATISTICAL STUDY OF THE HYDROLOGICAL CHARACTER OF THE
EDWARDS AQUIFER
By
David Tomasko, Ann-Marie Fisher, Gustavious P. Williams,
and Edwin D. Pentecost
1 INTRODUCTION
The Edwards Aquifer is located in south-central Texas and underlies all or parts of
Kinney, Uvalde, Medina, Bexar, Comal, and Hays counties, Texas (Figure 1). It has a length of
about 180 miles, and it varies in width from 5 to 40 miles. It is one of the most permeable and
productive artesian limestone aquifers in the United States.
In 1979, the U.S. Environmental Protection Agency (EPA) designated the Edwards as a
sole-source aquifer. Between the Balcones Fault Zone and the interface between fresh water and
saline water (Figure 2), the aquifer supplies drinking water to more than 1.5 million people in
San Antonio and the Austin-San Antonio corridor. Water from the aquifer is also vital to the
agricultural and light industrial economy of the region. Discharge from the aquifer provides
water to many springs in the area, including San Marocs and Comal Springs. Flows from the
these springs provide water for the tourist and recreation industry, critical habitat for several
endangered species, appropriated water use downstream on the Gulf Coastal Plain, and the San
Antonio Bay ecosystem.
This report describes the results of a statistical study performed by Argonne National
Laboratory (ANL) on the hydrological character of the Edwards Aquifer with respect to its
response to an extremely high precipitation event that occurred in October 1998. The purpose of
this project was to study the effects of the October 1998 precipitation event as the water and
increased hydrostatic pressure moved through the Edwards Aquifer system. The review and
analysis of empirical data will assist an Edwards Aquifer groundwater modeling project by
assisting with calibration decisions and providing information on the sources of water emanating
from San Marcos and Comal Springs.
1
Specific topics addressed by this study include the following:
• Precipitation in the area of the Edwards Aquifer,
• River responses,
• Water-level responses in monitor wells,
• Spring discharge responses,
• Lag times to achieve maximum indicator parameter values,
• Cross-correlation relationships between river flow, water-levels in monitor wells,
and spring discharges,
• Regression modeling of spring flow at San Marcos Springs, and
• Model inference.
2 PRECIPITATION EVENT
Severe flooding occurred in portions of south-central Texas because of a major storm that
occurred on October 17, 1998, through October 19, 1998. The meteorological conditions that
produced the storm were dominated by Hurricane Madeline in the Eastern Pacific near the tip of
Baja, California, and Hurricane Lester in the Eastern Pacific near Acapulco, Mexico (USGS
1999). Most of the precipitation fell within the first 24 hours of the storm. Isohyetals produced
by the United States Geological Survey (USGS) for the storm indicate two main centers of
rainfall. The largest documented rainfall occurred in southern Hays County, just south of San
Marcos, Texas, where at least 30 inches of rainfall was recorded. A second center was
documented at a site in western Comal County, where about 22 inches of rain fell. The USGS
report (USGS 1999) indicates that approximately 2,300 square miles in 12 counties received at
least 12 inches of rain, and about 5,000 square miles in 19 counties received at least 8 inches of
rain.
The October 1998 rainfall event produced flooding of major rivers and tributaries of the
San Jacinto, San Benard, Colorado, Lavaca, Guadalupe, and San Antonio River Basins, increases
in water levels in monitor wells, and increased flows in discharge springs. Substantial flood
peaks were recorded by 27 gaging stations operated by the USGS (USGS 1999). One gage in the
Guadalupe River measured a peak flow that was 2.6 times the previous maximum recorded in
1833.
2

Twenty-nine precipitation gages are located within the area of the Edwards Aquifer
(Figure 3). Information from 24 of these gages was useful for this study. A summary of
precipitation gage data obtained from the Edwards Aquifer Authority (EAA 2000) is given in
Table 1.
Figure 4 shows precipitation data from September 7, 1998, to February 19, 1999. The
large spike occurring on Julian dates 289 through 291, 1998, corresponds with the October
rainfall event. The rainfall event is shown in finer resolution in Figure 5, which plots daily
precipitation for the period October 17, 1998, through January 31, 1999. Most of rainfall during
this period was clustered around the October precipitation event; little rainfall of consequence
fell between October 19, 1998, and January 31, 1999. The total precipitation for the October
1998 event (sum of precipitation on October 17 through October 19, 1998) is shown in Figure 6.
Most of the rainfall occurred in the eastern region of the Edwards Aquifer. The maximum
recorded rainfall for the October event was 21.12 inches at the Bulverde gage (411215); the next
greatest precipitation was 20.95 inches at the New Braunfels gage (416276) (See Table 1). The
distribution of rainfall for the Edwards Aquifer region is consistent with the description
presented by the USGS (USGS 1999).
3 RIVER FLOWS
Twenty-four river-flow gages were considered in this study. These gages are located on
the following bodies of water: the Blanco River, Cibolo Creek, Frio River, Guadalupe River,
Hondo Creek, Medina Lake, Nueces River, Plum Creek, Salado Creek, Seco Creek, West
Nueces River, Dry Frio River, and Sabinal River. The locations of these gages are shown in
Figure 7 and listed in Table 2. Although many records of river flow were available, this study
concentrated on flows from the Blanco and Guadalupe Rivers because of their proximity to
Comal and San Marcos Springs.
Average daily flows for the bodies of water in the area of the Edwards Aquifer are shown
in Figure 8 for the period October 15, 1998, to November 15, 1998. More detailed plots of the
river flows are provided in Appendix A. The maximum recorded average daily flow
(approximately 37,500 cubic feet per second [cfs]) occurred in Comal County for stream gage
8168500 in the Guadalupe River at the confluence with Comal River at New Braunfels. Peak
3
flows occurred on about October 18, 1998, indicating that runoff from the land surface was very
rapid. Peak flows in the Blanco River near Kyle were about 26,000 cfs (Figure 8 and
Appendix A). For a given river (e.g., the Guadalupe River), all gages showed a maximum
average flow on the same day (Figures 8 and 9). Flow increased in a downstream direction along
the Guadalupe River from Comfort to Spring Branch and then from Sattler to New Braunfels.
Flow decreased in the Guadalupe River between Spring Branch and Sattler because of the
presence of Canyon Lake and the results of dam operations. Finer resolution of the storm surge
was not possible because hourly information was not available. Although the measured flows in
the rivers were very large, the high-flow period was short; flows returned to their normal values
in less than about four days.
4 WATER-LEVELS IN MONITOR WELLS
There are 39 monitor wells in the area of the Edwards Aquifer. These wells are used to
measure the elevation of groundwater (Figure 10). Of these wells, only 14 had daily data.
However, groundwater elevations in wells at the City of Sabinal and Knippa were not used in the
study because the data were either very incomplete over the period of interest (Knippa) or
showed anomalous trends (City of Sabinal). The 12 remaining wells used in the study are
summarized in Table 3 and shown in Figure 11. This figure also shows the locations of Comal
Springs and San Marcos Springs.
Figures 12 through 17 show the elevation of groundwater in the Edwards Aquifer for all
14 wells (including Knippa and the City of Sabinal) over the period October 11, 1998, through
January 31, 1999. A number of these wells have incomplete data over the full period of interest:
41301 – City of Castroville; 19806 – La Escondida; 43607 – Knippa; 45401; City of Sabinal; and
40102 – Quihi. Cubic splining (Davis 1986) was used to fill the missing data for all wells except
45401 (City of Sabinal) and 43607 (Knippa). Because of the very large data gaps for the City of
Sabinal and Knippa wells, they were excluded from further analyses. An International
Mathematics and Statistics Library (IMSL) subroutine (CSIEZ) was used to perform the cubic
spline interpolation (Visual Numerics 1997). IMSL subroutines are written in Fortran and in C,
4
and are typically used in Fortran or C programs to perform standard programming operations
efficiently.
After the data gaps were filled with information from the IMSL cubic spline subroutine, a
new set of monitor-well elevation figures was produced. For a quick comparison, the elevations
for all 12 wells are shown in Figure 18. Because trend analysis can not be performed easily
using Figure 18, the ordinate scale was expanded. The resulting plots are shown in Figures 19
through 24. In most cases, the response to the precipitation event is smooth, and peaks in
groundwater elevations occur a few weeks after the rainfall.
As indicated in Table 3, the responses in the wells ranged from very small (1.2 feet
change in water elevation for the Ehler well [51406] to more than 25 feet (29.8 feet – Trio –
36402; 29.7 feet – Hill Country – 29103; 28.6 feet – City of Castroville – 41301; 26.8 feet- City
of Hondo – 47306; and 24.7 feet- J-17 – 37203). The time to reach the maximum water
elevation ranged from 37 days at J-17 to 104 days at Quihi. Tabulated water elevations are given
in Appendix B. Because the precipitation in the vicinity of Trio was small for the October 1998
event (approximately 2 inches), it is possible that the response in this well was not related to the
rainfall.
5 SPRING DISCHARGES
Discharge measurements were available for two of the springs in the area of the Edwards
Aquifer: Comal Springs, and San Marcos Springs. The locations of these springs are shown in
Figure 10. Flow rate data from the springs were provided by the Edwards Aquifer Authority
(EAA 2001) and are shown in Figure 25. The estimated peak discharge at Comal Springs was
approximately 440 cfs for the October 1998 event; the estimated peak discharge at San Marcos
Springs was about 400 cfs.
Examination of Figure 25 indicates that (1) the peak discharge from San Marcos Springs
was less than that from Comal Springs for the October 1998 event, and (2) the response of the
San Marcos Springs was different. That is, the recession curve for San Marcos Springs appears
to have two recession slopes (Julian days 289 to 309 and after Julian day 346), both of which are
steeper than the recession curve for Comal Springs. The peak discharge at Comal Springs
occurred about 11 days after the start of the October 1998 event; peak discharge for San Marcos
5

Springs occurred two days earlier, approximately 9 days after the start of the rainfall. The earlier
peak at San Marcos Springs is attributed either to the smaller size of its watershed or a higher
underlying transmissivity in the Edwards Aquifer.
6 LAG TIMES TO ACHIEVE MAXIMUM INDICATOR PARAMETER VALUES
As discussed in Section 2, the October 1998 precipitation event was a high-intensity,
short-duration storm. Most of the rainfall occurred on the first day of the event, October 17,
1998, with lesser amounts on October 18 and 19. No additional precipitation occurred for
approximately 10 days, after which 1 inch of rainfall was recorded in gages near Comal and San
Marcos Springs (New Braunfels, Bulverde, Canyon Dam No. 1, Canyon Dam Daily, and
Wimberly 2 ESE) (Figure 26).
The October 1998 precipitation event produced immediate responses in river flows. Peak
flows, in general, occurred on October 18, 1998. Recession of the discharge took about two to
three days. By October 24, 1998, most of the river flows had returned to prestorm values.
Discharge from Comal and San Marcos Springs also responded rapidly to the
precipitation event. The peak discharge at San Marcos Springs occurred about 9 days after the
start of rainfall; peak discharge occurred about 2 days later at Comal Springs. As shown in
Figure 27, flow at San Marcos Springs returned to its prestorm value (approximately 215 cfs)
about 166 days later (mid-February 1999); average flow conditions (160 cfs) were reached
approximately 282 days after the event. Comal Springs returned to an average flow condition of
approximately 300 cfs after about 220 days (early May 1999) (Figure 27). Flow from Comal
Springs did not return to its prestorm value (270 cfs) for about one year. During recovery to
prestorm flow values, the recession curve for San Marcos Springs exhibited two steep slopes and
a flat period, during which time the spring discharge remained constant at about 370 cfs for
about 35 days (Figure 27). This constant flow period began about 11 days after peak flow was
achieved (approximately 20 days after the beginning of the rainfall event). This behavior may
indicate the presence of a significant storage capacity within the San Marcos Springs drainage at
a depth below the water level associated with peak discharge, or receipt of groundwater from
outside the San Marcos Springs watershed. For this case, the travel time to the springs would be
6
about 20 days.
As discussed in Section 4, the time required for monitor wells to achieve maximum water
elevations was considerably longer than the time to maximum spring discharges (Table 3).
Index well J-17 exhibited one of the quickest times-to-peak – 37 days. More typical peak times
were 50 to 60 days. Very long response times were observed in wells in the western portion of
the Edwards Aquifer area (Trio and Quihi). The anomalously large response observed at Trio
may not have been caused by the October rainfall event because of the location of the well and
the spatial distribution of rainfall.
Following the precipitation event of October 1998, water levels in the monitor wells
gradually returned towards their former values (Table 3 and Appendix A). The Ehler monitor
well had the quickest recovery period (90 days). Water levels in wells Trio, Quihi, and Hill
Country had not recovered to their former values by December 31, 1999, the cut-off date for this
analysis. Other wells included in this study recovered in about 225 days, except for the monitor
well at La Escondida which had a recovery time of about 309 days. No apparent trends are
evident in the recovery times, possibly because local precipitation modified the responses of the
water levels in the wells.
Figure 28 illustrates the time-dependent nature of the system responses to the rainfall
event for five nearby precipitation gages (New Braunfels, Bulverde, Canyon Dam No. 1, Canyon
Dam Daily, and Wimberly 2 ESE), monitor wells J-17 and Hondo City Well, and Comal and
San Marcos Springs. All previously discussed responses (except river flow) are shown. On the
basis of this figure, a period of time from October 11, 1998, through January 31, 1999, was
selected for statistical analyses.
7 CROSS-CORRELATIONS
A single time series can exhibit correlation with itself because of time-dependent
relationships. Similarly two time series can be compared to determine positions of pronounced
correspondence (Davis 1986). Two pieces of data can be estimated for a pair of time series: the
strength of the relationship between them (cross-correlation); and the offset (lag) at their times of
maximum correlation (largest cross-correlation parameter). Time series that exhibit a high
degree of cross-correlation may have an underlying, physical dependence.
7

For this study, cross-correlation coefficients were calculated between discharges from
Comal and San Marcos Springs; river flows in the same body of water at upstream and
downstream gages; and water levels in the 12 associated monitor wells, wells and springs, and
rivers and springs. Because of the short duration of the October rainfall event, no cross-
correlations were calculated between precipitation and river or spring flows or precipitation and
water levels in monitor wells. All calculations were performed with the IMSL subroutine CCF
(Visual Numerics 1997).
Figure 29 shows a plot of the cross-correlation parameter for discharge data for Comal
and San Marcos Springs as a function of lag time. This type of plot is referred to as a cross-
correlogram. Lag was varied over a range of -20 to 20 days. A maximum cross-correlation
parameter of 0.8326 was obtained for a zero-day lag using a data set that spanned the interval
October 11 through January 31, 1999. The results of cross-correlation analyses for lags greater
than about plus or minus 11 days are questionable because of the number of data points in the
time series (113 days); accuracy is questionable for lags that exceed the square root of the
number of sample points (Davis 1986). The questionable period is clearly seen in the cross-
correlogram shown in Figure 29 by the abrupt change in magnitude and sign of the first
derivative of the correlogram function. An attempt was made to improve the cross-correlation
coefficient between the flows at San Marcos Springs and Comal Springs by adding more data to
the time series. Increasing the time base of the calculation from 113 to 182 days (March 31,
1999) decreased the cross-correlation to 0.7253 because of a divergence in the shape of the
discharge profiles (Figure 28).
Two additional attempts were made to increase the cross-correlation between discharge
data from Comal and San Marcos Springs. First, a moving average filter was applied to the raw
data to reduce the variance and smooth the response (Davis 1986). With this method, the value
of a filtered point is the numerical average of a specified number of points in an assigned time
window. By sliding the window forward in time (adding one new data point at the next time
increment and dropping the earliest point in time within the window), a new set of filtered points
can be obtained.
Figures 30 through 32 show the results of filtering the Comal and San Marcos Springs
discharges for time windows of 3, 5, and 7 days. The effect of the filtering is apparent in the
8
figures, with high-frequency “noise “ (i.e., rapid fluctuations in the measured discharge) being
reduced by increasing the width of the window (i.e., including additional data points in the
averaging process). Although the noisiness of the data is reduced, there was no significant
improvement in the cross-correlation coefficient between the two time series. The cross-
correlation coefficients were 0.8328, 0.8318, and 0.8296 for window widths of 3, 5, and 7 days,
respectively. All cross-correlations had a maximum for a lag time of zero days.
In the second attempt at improving the cross-correlation coefficient between discharge
data at Comal and San Marcos Springs, the time series data were transformed by taking the
natural log of the measured values. The results of the logarithmic transform are shown in Figure
33. For this procedure, the cross-correlation increased to 0.8631 for an optimal lag of zero days.
Because this improvement in cross-correlation was not significant, untransformed data were used
in the remainder of the study.
The degree of cross-correlation was also investigated for two stream gages in the same
river (Gage 8171000 Blanco River at Wimberly, and 8171300 Blanco River near Kyle) (see
Appendix A). The optimum cross-correlation coefficient for these gages for the October 1998
precipitation event was 0.9998 for an optimal lag of zero days. The high degree of correlation
between data obtained from these two gages was expected, as was the zero-day lag time.
The statistical relationship between flow data in the Blanco River (Gage 8171300 near
Kyle) and San Marcos Springs was also established. The maximum cross-correlation coefficient
found was 0.2931 for a lag time of -9 days. This result was also expected because the Blanco
River responded very rapidly to the October 1998 precipitation event and returned to prestorm
flows after only about 4 days (Figure 8), whereas the discharge from San Marcos Springs did not
achieve a maximum flow for 9 days.
In a similar fashion, cross-correlation parameters were calculated for the 12 wells used in
this study (Table 3). Table 4 summarizes the maximum cross-correlation coefficients found and
their associated optimal lags. Correlograms for the 12 monitor wells are shown in Appendix A.
Cross-correlation coefficients of 1.0 and a zero-day lag correspond to an exact auto-correlation
of a time series (i.e., cross-correlation of a time series with itself with no lag). Cross-correlation
coefficients greater than 0.9 are highlighted in bold in Table 4. Although several wells had high
cross-correlation coefficients, there may be no physical basis for their correlation. The statistical
9
agreement may be simply fortuitous. Where possible, physical arguments are presented to
explain high or low correlations.
The following observations are derived from information presented in Table 4 for wells
that had a cross-correlation coefficient greater than 0.9:
• Water levels in Index Well J-17 only correlate very well with the City of Hondo
well (0.9147); other reasonable correlations are observed for Landa Park (0.8736)
and the City of Castroville (0.8658). The City of Hondo well also had a very high
correlation (0.9864) with the nearby City of Castroville well.
• Water levels in the La Escondia well correlate very well with water levels in
seven of the other wells, although it monitors water levels in the Trinity Aquifer.
Particularly high correlations were obtained for nearby wells at Hill Country and
North Uvalde.
• The highest cross-correlation coefficient found, 0.9949, was obtained for water
levels in the City of Uvalde and the Trio wells.
• Water levels in wells in the northern and western portions of the Edwards Aquifer
(La Escondida, Hill Country, Quihi, Trio, North Uvalde, Kyle North, and the City
of Uvalde) have very high cross-correlations. These wells are located in both the
Trinity and the Edwards Aquifers, and they are separated by almost the entire
length of the Edwards Aquifer.
• Water levels in wells in the artesian portion of the Edwards Aquifer (City of
Hondo, City of Castroville, and J-17) have very high cross-correlation
coefficients.
• Cross-correlation coefficients between water levels in wells located in the
recharge and artesian zones of the Edwards Aquifer area were not as high (e.g.,
Hill Country and J-17 – 0.5879; Quihi and the City of Hondo – 0.8212; and Quihi
and the City of Castroville – 0.8792).
• Water levels in Kyle North, the most northern and eastern well used in this study,
had high cross-correlation coefficients with water levels in wells at North Uvalde
(0.9416), the City of Castroville (0.9227), Hill Country (0.9046), and La
Escondida (0.9301).
10
• Water levels in the Landa Park monitor well did not correlate very well with
water levels in any of the other wells.
• All water levels had a maximum cross-correlation coefficient for a lag of zero
days, indicative of a quick response to the October 1998 rainfall event.
• Wells that had high cross-correlation coefficients for their water levels had similar
completions. For example, La Escondida, Hill Country, Quihi, and Trio are
located in the recharge zone of the Edwards Aquifer. Similarly, the City of
Hondo well, J-17, and the City of Castroville well are located in the fresh water
zone (Figure 3).
Two additional sets of cross-correlations were performed. The first set calculated the
relationships between San Marcos Springs and water levels in the 12 monitor wells used in this
study. The cross-correlations are summarized in Table 5. The largest cross-correlation
coefficient was obtained for water levels in Index Well J-17 (0.8789) with a lag time of zero
days.
The second set of cross-correlations was calculated for Comal Springs and water levels in
the 12 monitor wells used in this study. A summary of the cross-correlations is presented in
Table 6. The largest cross-correlation found was for water levels in the City of Hondo monitor
well (0.9430). Other excellent cross-correlations were found for Index Well J-17 (0.9393) and
the City of Castroville (0.9001). All of these cross-correlations were optimized for a lag time of
zero days.
8 REGRESSION MODEL FOR SAN MARCOS SPRINGS
An empirical, linear model was developed to predict flows emanating from San Marcos
Springs for the October 1998 precipitation event and to identify recharge sources for the springs.
Linear regression modeling has been performed previously for the Edwards Aquifer (Puente
1976; Jennings et al. 1992; Asquith and Jennings 1993). For the present study, the governing
model equation can be written:
11
SMi = B1 + B2CSi + B3Wi + B4Ri (1)
where:
B1 through B4 = regression coefficients to be determined,
CSi = discharge from Comal Springs,
Ri = flow in the Blanco River or level of water in a monitor well,
SMi = discharge from San Marcos Springs, and
Wi = water level in a well.
The subscript I in Equation 1 indicates that the parameter is a time series. For this
analysis, the time series spanned 113 days (October 11, 1998, through January 31, 1999).
As a first step, regression coefficient B2 was assumed to be equal to 1.0, and B3 and B4
were assumed to be equal to zero; flow from the San Marcos Springs was assumed to be a simple
translation of flow in Comal Springs. A computer program was written to estimate the B1
constant. A copy of this program is given in Appendix B. The constant was found by finding
the B1 that produced the minimum sum of squared residuals between the predicted and measured
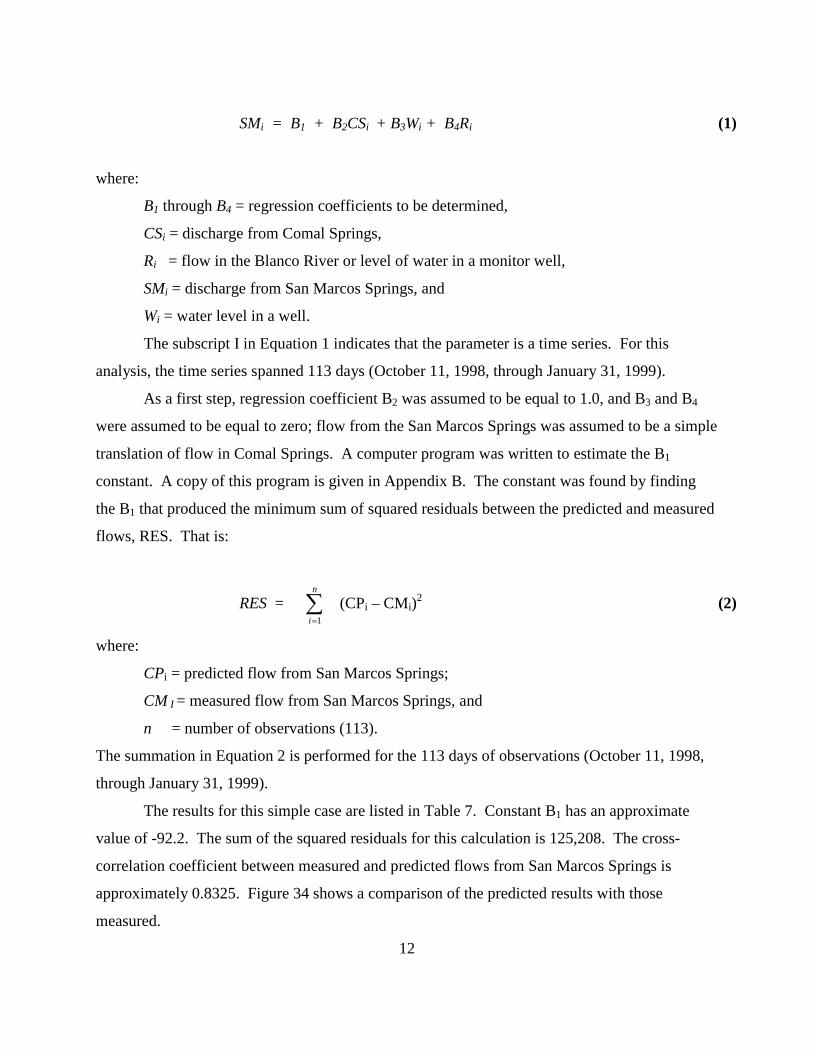
flows, RES. That is:
RES = ∑=
n
i 1
(CPi – CMi)2 (2)
where:
CPi = predicted flow from San Marcos Springs;
CM I = measured flow from San Marcos Springs, and
n = number of observations (113).
The summation in Equation 2 is performed for the 113 days of observations (October 11, 1998,
through January 31, 1999).
The results for this simple case are listed in Table 7. Constant B1 has an approximate
value of -92.2. The sum of the squared residuals for this calculation is 125,208. The cross-
correlation coefficient between measured and predicted flows from San Marcos Springs is
approximately 0.8325. Figure 34 shows a comparison of the predicted results with those
measured.
12

The second case involved replacing flow at Comal Springs with water levels in Index
Well J-17. The results of this case are given in Table 7, and a comparison of the predicted and
measured flows is shown in Figure 35. The constant for this calculation was about -360.0. The
sum of the squared residuals for the calculation was 188,624, and the cross-correlation
coefficient was 0.8789.
The next step in developing the empirical model was to calculate a two-parameter model,
using one constant (B1) plus a second constant (B2) times flow at Comal Springs or water levels
at Index Well J-17. The results of these analyses are presented in Table 7. A comparison
between the predicted and measured flows for the Comal Springs model is shown in Figure 36.
The sum of the squared residuals for this calculation decreases to 67,948, and the cross-
correlation coefficient is about 0.8326.
In finding the above constants, the response surface in the vicinity of the minimum of the
sum of the squared residuals is fairly flat, and many fine steps had to be made with the computer
program to isolate the minimum. This procedure can produce inaccurate results. In order to
expedite the process and improve the accuracy of the calculations, a linear regression model
(Draper and Smith 1981) was developed using subroutines in the IMSL computer package
(Visual Numerics 1997).
For the IMSL regression model, the regression coefficients in Equation 1 were calculated
by using matrix and vector manipulation subroutines. Specific subroutines included TRNRR
(matrix transpose), MURRV (multiply a matrix by a vector), MRRRR (multiply two matrices),
and LINRG (invert a square matrix). A copy of this program is provided in Appendix B.
As an initial step in using the IMSL regression model, the two-constant case discussed
above was implemented. The results of this calculation are listed in Table 7. As indicated, the
results for the sum of the squared residuals and the cross-correlation coefficient are essentially
the same as those discussed above. However, the computational time was significantly reduced.
As expected, the IMSL regression model experienced difficulties with the flatness of the
response curve in the vicinity of the minimum, and a warning was given that the data were ill-
conditioned. That is, the solutions are very sensitive to small changes in the coefficients of the
governing equations (Noble 1969). Because the IMSL computer model produced results that
were as good, if not better than, those of the trail-and-error search algorithm and because the
13
IMSL model ran much more quickly, the IMSL regression model was used for the remainder of
the calculations presented.
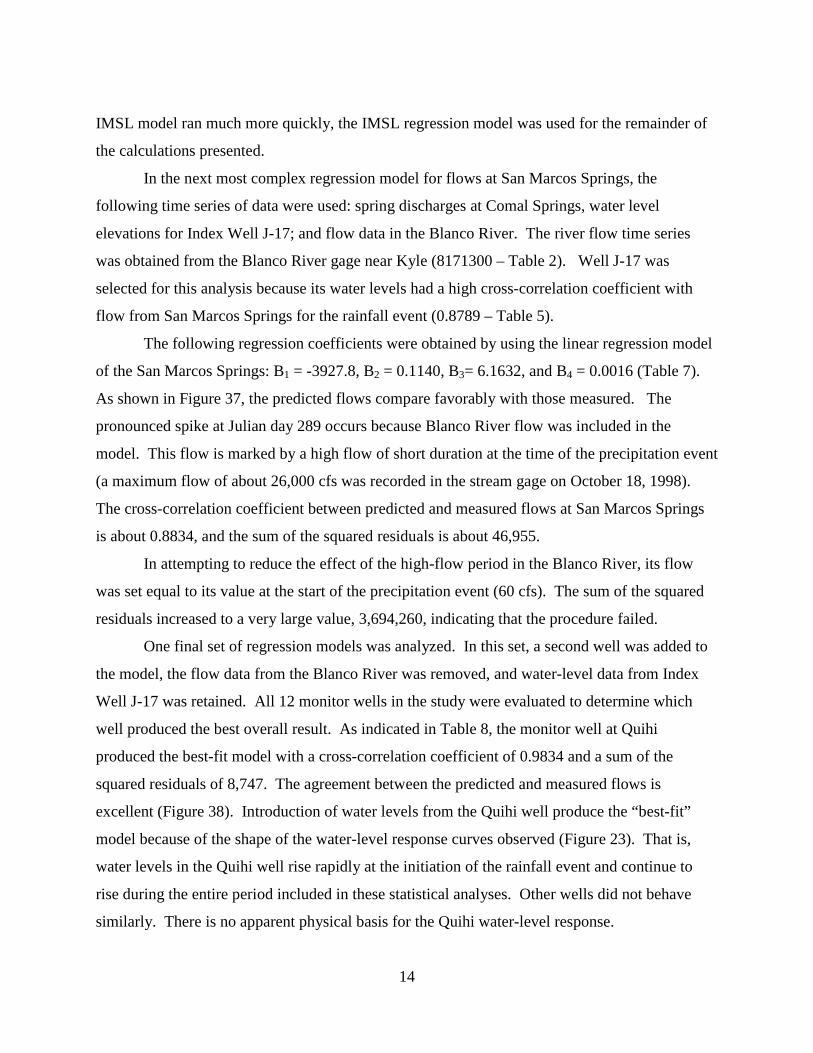
In the next most complex regression model for flows at San Marcos Springs, the
following time series of data were used: spring discharges at Comal Springs, water level
elevations for Index Well J-17; and flow data in the Blanco River. The river flow time series
was obtained from the Blanco River gage near Kyle (8171300 – Table 2). Well J-17 was
selected for this analysis because its water levels had a high cross-correlation coefficient with
flow from San Marcos Springs for the rainfall event (0.8789 – Table 5).
The following regression coefficients were obtained by using the linear regression model
of the San Marcos Springs: B1 = -3927.8, B2 = 0.1140, B3= 6.1632, and B4 = 0.0016 (Table 7).
As shown in Figure 37, the predicted flows compare favorably with those measured. The
pronounced spike at Julian day 289 occurs because Blanco River flow was included in the
model. This flow is marked by a high flow of short duration at the time of the precipitation event
(a maximum flow of about 26,000 cfs was recorded in the stream gage on October 18, 1998).
The cross-correlation coefficient between predicted and measured flows at San Marcos Springs
is about 0.8834, and the sum of the squared residuals is about 46,955.
In attempting to reduce the effect of the high-flow period in the Blanco River, its flow
was set equal to its value at the start of the precipitation event (60 cfs). The sum of the squared
residuals increased to a very large value, 3,694,260, indicating that the procedure failed.
One final set of regression models was analyzed. In this set, a second well was added to
the model, the flow data from the Blanco River was removed, and water-level data from Index
Well J-17 was retained. All 12 monitor wells in the study were evaluated to determine which
well produced the best overall result. As indicated in Table 8, the monitor well at Quihi
produced the best-fit model with a cross-correlation coefficient of 0.9834 and a sum of the
squared residuals of 8,747. The agreement between the predicted and measured flows is
excellent (Figure 38). Introduction of water levels from the Quihi well produce the “best-fit”
model because of the shape of the water-level response curves observed (Figure 23). That is,
water levels in the Quihi well rise rapidly at the initiation of the rainfall event and continue to
rise during the entire period included in these statistical analyses. Other wells did not behave
similarly. There is no apparent physical basis for the Quihi water-level response.
14
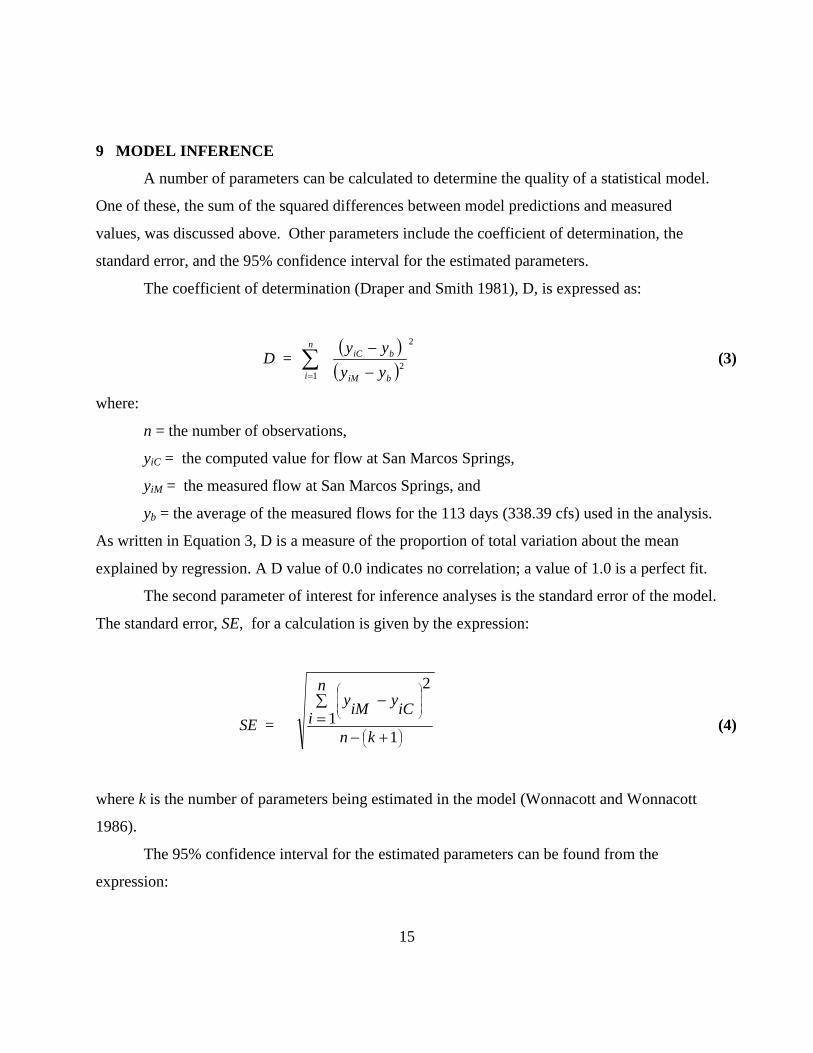
9 MODEL INFERENCE
A number of parameters can be calculated to determine the quality of a statistical model.
One of these, the sum of the squared differences between model predictions and measured
values, was discussed above. Other parameters include the coefficient of determination, the
standard error, and the 95% confidence interval for the estimated parameters.
The coefficient of determination (Draper and Smith 1981), D, is expressed as:
D = ∑=
n
i 1
( )( )
2
2biM
biC
yyyy
−
− (3)
where:
n = the number of observations,
yiC = the computed value for flow at San Marcos Springs,
yiM = the measured flow at San Marcos Springs, and
yb = the average of the measured flows for the 113 days (338.39 cfs) used in the analysis.
As written in Equation 3, D is a measure of the proportion of total variation about the mean
explained by regression. A D value of 0.0 indicates no correlation; a value of 1.0 is a perfect fit.
The second parameter of interest for inference analyses is the standard error of the model.
The standard error, SE, for a calculation is given by the expression:
SE = ⎟⎠⎞⎜
⎝⎛
⎟⎟⎟
⎠
⎞
⎜⎜⎜
⎝
⎛
+−
∑=
−
11
2
kn
n
i iCyiMy (4)
where k is the number of parameters being estimated in the model (Wonnacott and Wonnacott
1986).
The 95% confidence interval for the estimated parameters can be found from the
expression:
15

iiei SEt 025.0±= ββ (5)
where:
βi = estimated parameter for a 95% confidence limit,
βie = original parameter estimate,
SEi = standard error for parameter ∃ie, and
t0.025 = Student’s t parameter for a 95% confidence interval (approximately 1.982)
(Wonnacott and Wonnacott 1986).
Confidence intervals are only calculated for multiplicative regression constants; a confidence
interval is not calculated for an additive constant (B1).
The standard error for the first two regression parameters are given by the following
expressions:
SE 1 = ( )
∑
∑
∑
=
=
−
⎟⎠
⎞⎜⎝
⎛
−
−
n
ii
n
ii
n
iiCiM
X
Xn
yy
1
2
2
1
1
2
(6)
and:
SE2 = ( )
∑∑
∑
=
=
=
⎟⎠
⎞⎜⎝
⎛
−
−
n
i
n
ii
i
n
iiCiM
n
XX
yy
2
12
1
2
(7)
Standard errors for higher order parameters (i.e., SE3 and SE4) were found by dividing
the square root of the sum of the squared residuals by the square root of the corresponding
diagonal element of the variance-covariance matrix of the governing equations (Draper and
Smith 1981).
16
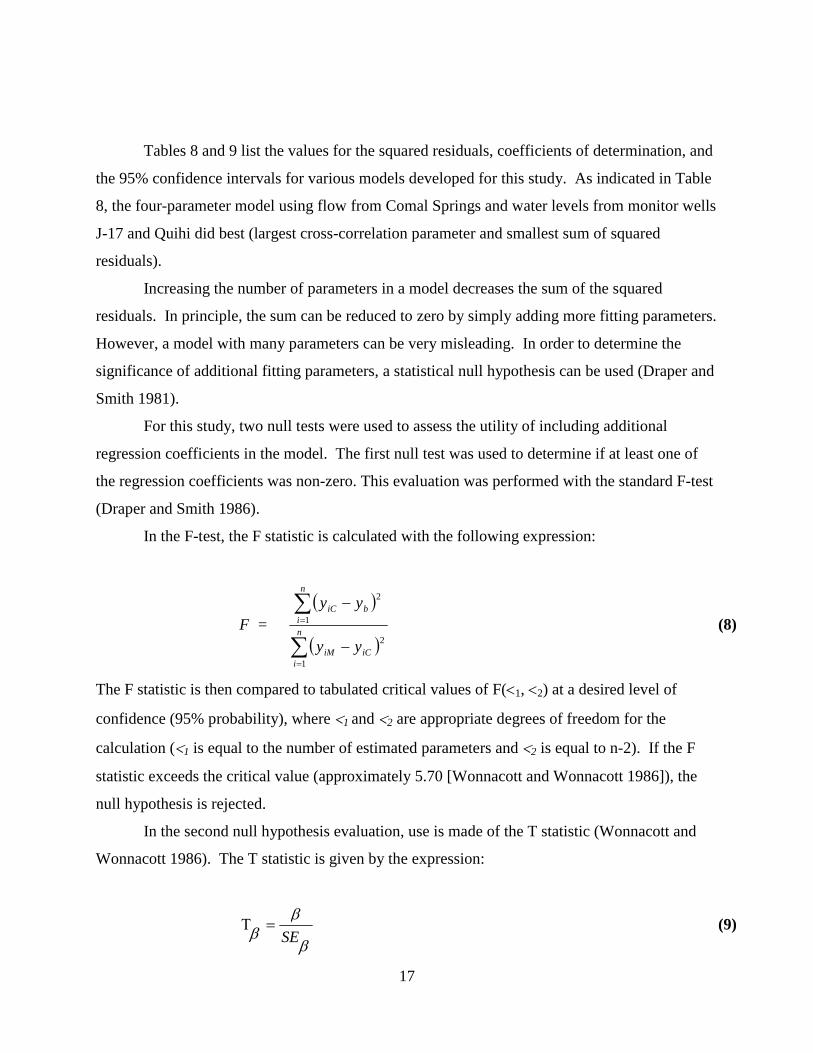
Tables 8 and 9 list the values for the squared residuals, coefficients of determination, and
the 95% confidence intervals for various models developed for this study. As indicated in Table
8, the four-parameter model using flow from Comal Springs and water levels from monitor wells
J-17 and Quihi did best (largest cross-correlation parameter and smallest sum of squared
residuals).
Increasing the number of parameters in a model decreases the sum of the squared
residuals. In principle, the sum can be reduced to zero by simply adding more fitting parameters.
However, a model with many parameters can be very misleading. In order to determine the
significance of additional fitting parameters, a statistical null hypothesis can be used (Draper and
Smith 1981).
For this study, two null tests were used to assess the utility of including additional
regression coefficients in the model. The first null test was used to determine if at least one of
the regression coefficients was non-zero. This evaluation was performed with the standard F-test
(Draper and Smith 1986).
In the F-test, the F statistic is calculated with the following expression:
F = ( )
( )∑
∑
=
=
−
−
n
iiCiM
n
ibiC
yy
yy
1
2
1
2
(8)
The F statistic is then compared to tabulated critical values of F(<1, <2) at a desired level of
confidence (95% probability), where <1 and <2 are appropriate degrees of freedom for the
calculation (<1 is equal to the number of estimated parameters and <2 is equal to n-2). If the F
statistic exceeds the critical value (approximately 5.70 [Wonnacott and Wonnacott 1986]), the
null hypothesis is rejected.
In the second null hypothesis evaluation, use is made of the T statistic (Wonnacott and
Wonnacott 1986). The T statistic is given by the expression:
β
ββ SE=Τ (9)
17

In performing the test, the T statistic is compared to tabulated critical values of Student’s t for the
desired confidence level (95% confidence) and degrees of freedom (n-[number of regression
parameters +1]). For a 95% confidence level and a one-sided null hypothesis test (increasing the
value of the regression coefficient increases spring flow), the critical Student’s t value is
approximately 1.661. If the T statistic exceeds the critical value, the null hypothesis is rejected
and the regression coefficient is retained.
Table 10 lists the values associated with both null hypothesis tests. As indicated in this
table, the null hypothesis is rejected for the four-parameter model using the F statistic; at least
one of the estimated parameters is non-zero. Examination of the T statistic for the four-
parameter models shows that inclusion of the fourth parameter is questionable (with the
exception of the model that includes data from the Ehler monitoring well). Although inclusion
of the fourth parameter in the model is questionable, it is retained because it significantly
decreases the sum of the squared residuals.
One additional calculation was performed with the “best-fit” J-17/Quihi model. This
operation involved calculating the 95% confidence envelope about the predicted flow. The 95%
confidence value for the predicted flow value is given by the expression (Draper and Smith
1981):
( ) 00025.0%95 1 XXXXStyy
nIttCii +±= (10)
where S is the square root of the sum of the squared residuals, X0 is a vector of parameter values,
and the superscripts t and I represent transpose and invert, respectively.
A plot of the 95% confidence envelope for the calculated flow at San Marcos Springs for
the four-parameter model including water levels in monitor well Quihi is shown in Figure 39.
As expected, the 95% confidence envelope does not contain the measured values throughout the
period of interest because of imprecision in the linear regression model.
18

10 DISCUSSION
An analysis was performed on data from the October 1998 precipitation in the area of the
Edwards Aquifer. Lag times and cross-correlation coefficients were found for the independent
variables, including spring flow and water levels in monitor wells. Conclusions derived from the
measured data include the following:
• Most of the precipitation from the October 1998 event fell on the eastern portion
of the Edwards Aquifer area. This finding is consistent with published
information from the USGS.
• Response of river and stream flow to the precipitation event were very rapid and
produced sharp peaks in flow with fast recession curves. Because hourly data
were not available for the rivers or streams, the storm surge could not be tracked
downstream.
• Responses of flows from San Marcos and Comal Springs were rapid, indicating a
strong connection with surface water. Peak flows were achieved at San Marcos
and Comal Springs in 9 and 11 days, respectively. Because hourly data were not
available, the peak could not be further delineated. The more rapid rise to peak
flow in San Marcos Springs is indicative of a smaller watershed or a higher
transmissivity aquifer.
• Flows in San Marcos and Comal Springs returned to their pre-event values after
166 and 220 days, respectively. The longer recession at Comal Springs may be
caused by a larger watershed, a lower transmissivity, or a combination of both.
• The recession curve for flow from San Marcos Springs has a pronounced flat
period that starts about 20 days after the rainfall event and lasts about 35 days.
The slope of the recession curve is about the same for earlier and later times. This
behavior may indicate that there is a substantial storage in the Edwards Aquifer at
a depth less than that of peak conditions, or that flow may be arriving from
outside its watershed. For the latter case, the travel time is about 20 days.
• Cross-correlation between flows from San Marcos and Comal Springs was very
good. Filtering the field data with a moving average window did not significantly
improve the results. Similarly, significant improvements were not produced by
19
taking a log transformation of the field data. Maximum cross-correlations were
obtained for a zero-day lag time. This finding is consistent with a conceptual
model in which there is strong communication with surface water (rivers, streams,
and runoff).
• Water levels in monitor wells in the northern portion of the Edwards Aquifer area
had very high cross-correlation coefficients, as did water levels in wells in the
southern portion of the area. Cross-correlations, however, between water levels in
wells in the northern and southern portions of the aquifer were, in general, low.
This finding is consistent with the wells’ being completed similarly in the
recharge and fresh-water zones, and, as with all statistical correlations, the results
may be fortuitous.
• A four-parameter linear regression model demonstrated that inclusion of time
series data from the Blanco River was not warranted because of its very high and
rapid runoff response to the precipitation event.
• The best overall four-parameter model included flow from Comal Springs and
water levels in monitor wells J-17 and Quihi.
• More complex models that include more than four estimated parameters could be
constructed, but the inclusion of additional parameters is questionable.
• Results of the model may not be applicable for analysis of other, lower flows
because the linear regression model was developed for flood conditions.
20
REFERENCES Asquith, W.H. and M.E. Jennings, 1993,”Generalized Statistical Model of the Edwards Aquifer,” Proceedings of Texas Sections Joint Spring Meeting and Texas Hydrology Roundup, University of Texas at Austin, April. Davis, J.C., 1986, Statistics and Data Analysis in Geology, John Wiley and Sons, New York, N.Y. Draper, N. and H. Smith, 1981, Applied Regression Analysis, Second Edition, John Wiley and Sons, Inc., New York, N.Y. Edwards Aquifer Authority (EAA), 2000, letter to David Tomasko (Argonne National Laboratory) from John Hoyt (Aquifer Science Program Manager, Edwards Aquifer Authority), October 12. Edwards Aquifer Authority (EAA), 2001, letter to David Tomasko (Argonne National Laboratory) from Steve Johnson (Edwards Aquifer Authority), February. Jennings, M.E., P.W. Bush, and G.M Nalley, 1992, “Generalized Hydrologic Characteristics of the Edwards Aquifer,” Proceedings, Texas Section American Water Resources Meeting, Irving, Texas. Maclay, R.W. and L.F. Land, 1988, Simulation of Flow in the Edwards Aquifer, San Antonio Region, Texas and Refinement of Storage and Flow Concepts, U.S. Geological Survey Water Supply Paper 2336. Maclay, R.W. and T.A. Small, 1983, “Hydrostratigraphic Subdivisions and Fault Barriers of the Edwards Aquifer, South-Central texas, U.S.A,” Journal of Hydrology, Vol. 61, pp127-146. Noble, B., 1969, Applied Linear Algebra, Prentice-Hall, Inc., Englewood Cliffs, N.J. Puente, C., 1976, Statistical Analysis of Water-Level, Springflow, and Streamflow Data for the Edwards Aquifer in South-Central Texas, U.S. Geological Survey, San Antonio, Texas. U.S. Geological Survey (USGS), 1999, “Floods in the Guadalupe and San Antonio River Basins in Texas, October 1998,” Available at http://water.usgs.gov/pubs/FS/FS-147-99/ (accessed February 12, 2001). Visual Numerics, 1997, IMSL Stat/Library Volume 1, Houston, Texas. Wonnacott, T.H. and R.J.Wonnacott, 1986, Regression: A Second Course in Statistics, Robert E. Krieger Publishing Company, Malabar, Fla.
21

Table 1. Summary of precipitation data. Gage*
Name
File name
Precipitation (sum of October 17-19,1998) (inches)
410832 Blanco 382995606dat.xls 7.31
410902 Boerne 382995606dat.xls 5.59
411007 Bracketville 382995606dat.xls 0.00
411215 Bulverde 382995606dat.xls 21.12
411398 Camp Wood 382995606dat.xls 1.11
411429 Canyon Dam Daily 382995606dat.xls 0.00
411431 Canyon Dam No. 1 382995606dat.xls 0.00
411492 Carta Valley 4 W 382995606dat.xls 2.10
414254 Hondo 382995606dat.xls 0.00
414374 Hunt 382995606dat.xls 2.10
414782 Kerrville 3 NNE 382885606dat.xls 2.46
415113 Leakey Daily 382995606dat.xls 1.68
415742 Medina 2 W 382995606dat.xls 2.55
415746 Medina Lake 966949462dat.xls 11.88
426276 New Braunfels 966949462dat.xls 20.95
417628 Rio Medina 966949462dat.xls 10.46
417706 Rocksprings 966949462dat.xls 0.20
417873 Sabinal 966949462dat.xls 0.00
417945 San Antonio International Airport
966949462dat.xls 15.61
418169 San Antonio Seaworld 966949462dat.xls 11.15
418845 Tarpley 966949462dat.xls 3.55
419260 Utopia 966949462dat.xls 3.36
22
419268 Uvalde Research Center 966949462dat.xls 1.79
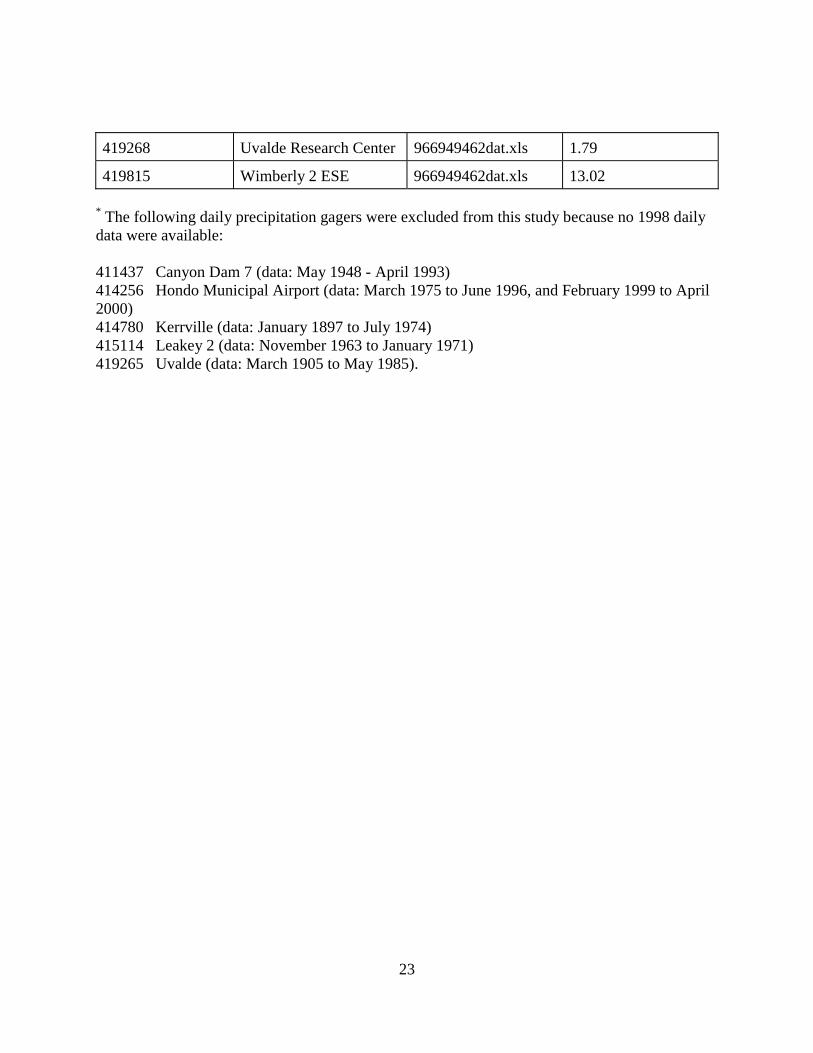
419815 Wimberly 2 ESE 966949462dat.xls 13.02 * The following daily precipitation gagers were excluded from this study because no 1998 daily data were available: 411437 Canyon Dam 7 (data: May 1948 - April 1993) 414256 Hondo Municipal Airport (data: March 1975 to June 1996, and February 1999 to April 2000) 414780 Kerrville (data: January 1897 to July 1974) 415114 Leakey 2 (data: November 1963 to January 1971) 419265 Uvalde (data: March 1905 to May 1985).
23

Table 2. River gage stations used in this study. Name Number County
Blanco River at Wimberly 8171000 Hays
Blanco River near Kyle 8171300 Hays
Cibolo Creek at 1H-10 above Bourne
8183850 Kendall
Cibolo Creek at Selma 8185000 Bexar
Frio River at Concan 8195000 Uvalde
Guadalupe River at Comal River at New Braunfels
8168500 Comal
Guadalupe River at Comfort 8167000 Kendall
Guadalupe River near Spring Branch
8167500 Comal
Hondo Creek at King Waterhole near Hondo
8200700 Medina
Hondo Creek near Tarpley 8200000 Medina
Medina Lake near San Antonio 8179500 Medina
Medina Lake at Bandera 8178880 Bandera
Nueces River at Laguna, 8190000 Uvalde
Nueces River below Uvalde 8192000 Uvalde
Plum Creek at Lockhart 8172400 Caldwell
Salado Creek (upper station) at San Anontio
8178700 Bexar
Seco Creek at Miller Ranch near Utopia
8201500 Medina
Seco Creek at Rowe Ranch near D’Hanis
8202700 Medina
West Nueces River near Bracketville
8190500 Kinney
Dry Frio River near Reagan 8196000 Uvalde
Sabinal River near Sabinal 8198000 Uvalde
Sabinal River at Sabinal 8198500 Uvalde
Guadalupe River at Sattler 8167800 Comal
24

Table 3. Monitor wells with daily data in the area of the Edwards Aquifer Well number
Name
Index Number
Highest water level (ft)
Changes in water level (ft)
Lag time to peak elevation (days)
Recovery time (days)
51406 Ehler (Trinity well) 1 846.8 1.2 50 90
50302 City of Uvalde 2 880.8 3.4 88 237
47306 City of Hondo 3 744 26.8 64 223
43409 North Uvalde 4 886.7 7.4 96 237
37203 J-17 5 689 24.7 37 233
36402 Trio 6 820 29.8 105 NR*
41301 City of Castroville 7 717 28.6 49 233
40102 Quihi 8 844 10.4 104 NR
01303 Kyle North 9 568.5 14.1 64 209
23302 Landa Park 10 565.5 4.3 63 244
29103 Hill Country 11 715 29.7 93 NR
19806 La Escondida (Trinity well)
12 1,066 15.9 98 307
* NR = not recovered by December 31, 1999.
25
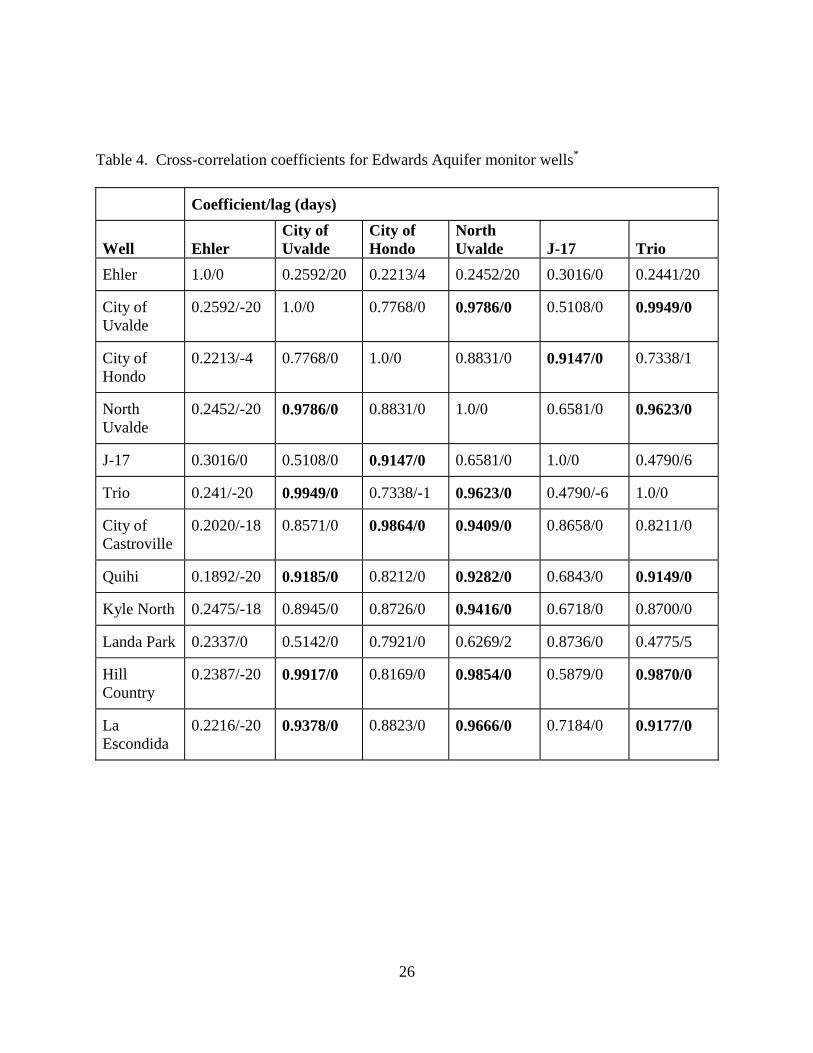
Table 4. Cross-correlation coefficients for Edwards Aquifer monitor wells* Coefficient/lag (days) Well
Ehler
City of Uvalde
City of Hondo
North Uvalde
J-17
Trio
Ehler 1.0/0 0.2592/20 0.2213/4 0.2452/20 0.3016/0 0.2441/20
City of Uvalde
0.2592/-20 1.0/0 0.7768/0 0.9786/0 0.5108/0 0.9949/0
City of Hondo
0.2213/-4 0.7768/0 1.0/0 0.8831/0 0.9147/0 0.7338/1
North Uvalde
0.2452/-20 0.9786/0 0.8831/0 1.0/0 0.6581/0 0.9623/0
J-17 0.3016/0 0.5108/0 0.9147/0 0.6581/0 1.0/0 0.4790/6
Trio 0.241/-20 0.9949/0 0.7338/-1 0.9623/0 0.4790/-6 1.0/0
City of Castroville
0.2020/-18 0.8571/0 0.9864/0 0.9409/0 0.8658/0 0.8211/0
Quihi 0.1892/-20 0.9185/0 0.8212/0 0.9282/0 0.6843/0 0.9149/0
Kyle North 0.2475/-18 0.8945/0 0.8726/0 0.9416/0 0.6718/0 0.8700/0
Landa Park 0.2337/0 0.5142/0 0.7921/0 0.6269/2 0.8736/0 0.4775/5
Hill Country
0.2387/-20 0.9917/0 0.8169/0 0.9854/0 0.5879/0 0.9870/0
La Escondida
0.2216/-20 0.9378/0 0.8823/0 0.9666/0 0.7184/0 0.9177/0
26

Table 4. Cross-correlation coefficients for Edwards Aquifer monitor wells (Continued) Coefficient/lag (days) Well
City of Castroville
Quihi
Kyle North
Landa Park
Hill Country
La Escondida
Ehler 0.2020/18 0.1892/20 0.2475/18 0.2337/0 0.2387/20 0.2216/20
City of Uvalde
0.8571/0 0.9185/0 0.8945/0 0.5142/0 0.9917/0 0.9378/0
City of Hondo
0.9864/0 0.8212/0 0.8726/0 0.7921/0 0.8169/0 0.8823/0
North Uvalde
0.9409/0 0.9282/0 0.9416/0 0.6269/-2 0.9854/0 0.9666/0
J-17 0.8658/0 0.6843/0 0.6718/0 0.8736/0 0.5879/0 0.7184/0
Trio 0.8211/0 0.9149/0 0.8700/0 0.4775/-5 0.9870/0 0.9177/0
City of Castroville
1.0/0 0.8792/0 0.9227/0 0.7869/0 0.8912/0 0.9409/0
Quihi 0.8792/0 1.0/0 0.8140/0 0.6678/-1 0.9557/0 0.9370/0
Kyle North 0.9227/0 0.8140/0 1.0/0 0.6769/0 0.9046/0 0.9301/0
Landa Park 0.7869/0 0.2278/1 0.6769/0 1.0/0 0.5867/0 0.7859/0
Hill Country
0.8912/0 0.9557/0 0.9046/0 0.5867/0 1.0/0 0.9632/0
La Escondida
0.9409/0 0.9370/0 0.9301/0 0.7589/0 0.9632/0 1.0/0
* Bold = Cross-corrleation coefficients greater than 0.9.
27
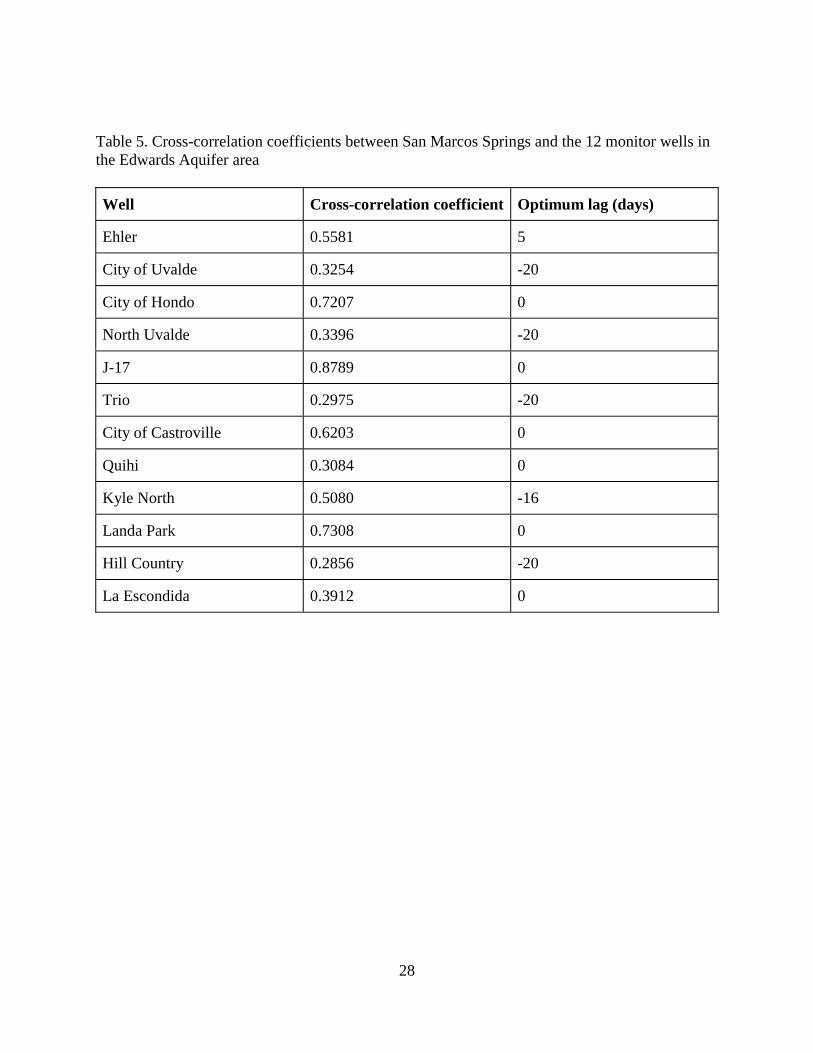
Table 5. Cross-correlation coefficients between San Marcos Springs and the 12 monitor wells in the Edwards Aquifer area
Well Cross-correlation coefficient Optimum lag (days)
Ehler 0.5581 5
City of Uvalde 0.3254 -20
City of Hondo 0.7207 0
North Uvalde 0.3396 -20
J-17 0.8789 0
Trio 0.2975 -20
City of Castroville 0.6203 0
Quihi 0.3084 0
Kyle North 0.5080 -16
Landa Park 0.7308 0
Hill Country 0.2856 -20
La Escondida 0.3912 0
28
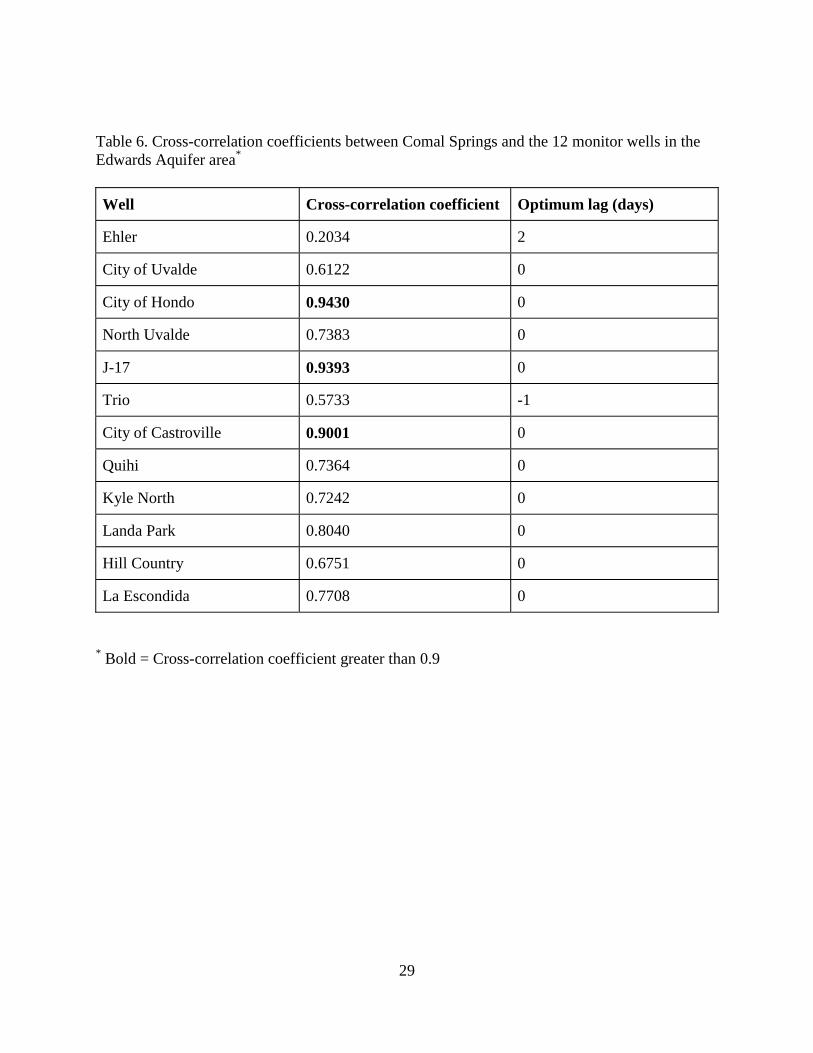
Table 6. Cross-correlation coefficients between Comal Springs and the 12 monitor wells in the Edwards Aquifer area*
Well Cross-correlation coefficient Optimum lag (days)
Ehler 0.2034 2
City of Uvalde 0.6122 0
City of Hondo 0.9430 0
North Uvalde 0.7383 0
J-17 0.9393 0
Trio 0.5733 -1
City of Castroville 0.9001 0
Quihi 0.7364 0
Kyle North 0.7242 0
Landa Park 0.8040 0
Hill Country 0.6751 0
La Escondida 0.7708 0 * Bold = Cross-correlation coefficient greater than 0.9
29

Table 7. Summary of linear regression models* Model
B1
B2
B3
B4
Sum of squared residuals
Correlation coefficient
Constant + Comal flow
-92.1951 - - - 125,208 0.8325
Constant + J-17
-360.002 - - - 188,624 0.8789
Constant + constant times Comal flow
-61.001 0.9769 - - 67,948 0.8326
IMSL constant + constant times Comal flow
-12.8405 0.8602 - - 65,205 0.8326
IMSL Comal + J-17 + Blanco River
-3927.8 0.1140 6.1632 0.0016 46,955 0.8834
IMSL Comal + J-17 + Quihi
6394.5 0.6468 5.8930 -12.3069 8,747 0.9834
* Bold = Cross-correlation coefficient greater than 0.9
30
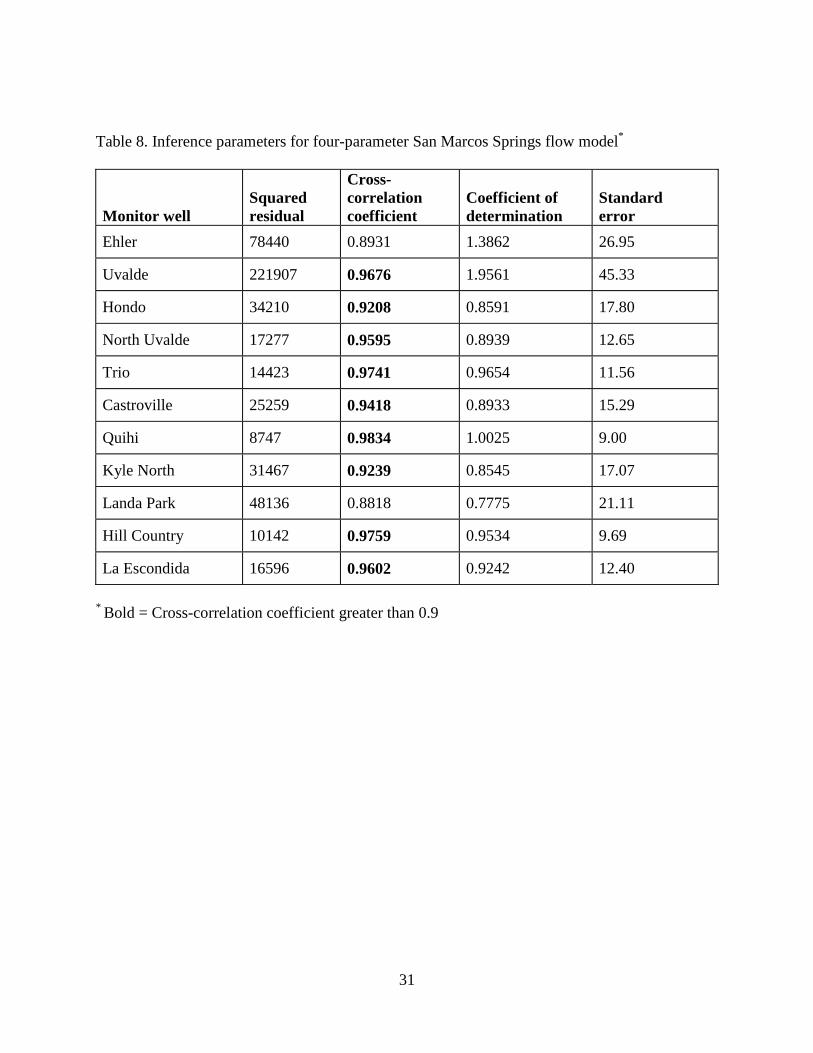
Table 8. Inference parameters for four-parameter San Marcos Springs flow model* Monitor well
Squared residual
Cross- correlation coefficient
Coefficient of determination
Standard error
Ehler 78440 0.8931 1.3862 26.95
Uvalde 221907 0.9676 1.9561 45.33
Hondo 34210 0.9208 0.8591 17.80
North Uvalde 17277 0.9595 0.8939 12.65
Trio 14423 0.9741 0.9654 11.56
Castroville 25259 0.9418 0.8933 15.29
Quihi 8747 0.9834 1.0025 9.00
Kyle North 31467 0.9239 0.8545 17.07
Landa Park 48136 0.8818 0.7775 21.11
Hill Country 10142 0.9759 0.9534 9.69
La Escondida 16596 0.9602 0.9242 12.40 * Bold = Cross-correlation coefficient greater than 0.9
31
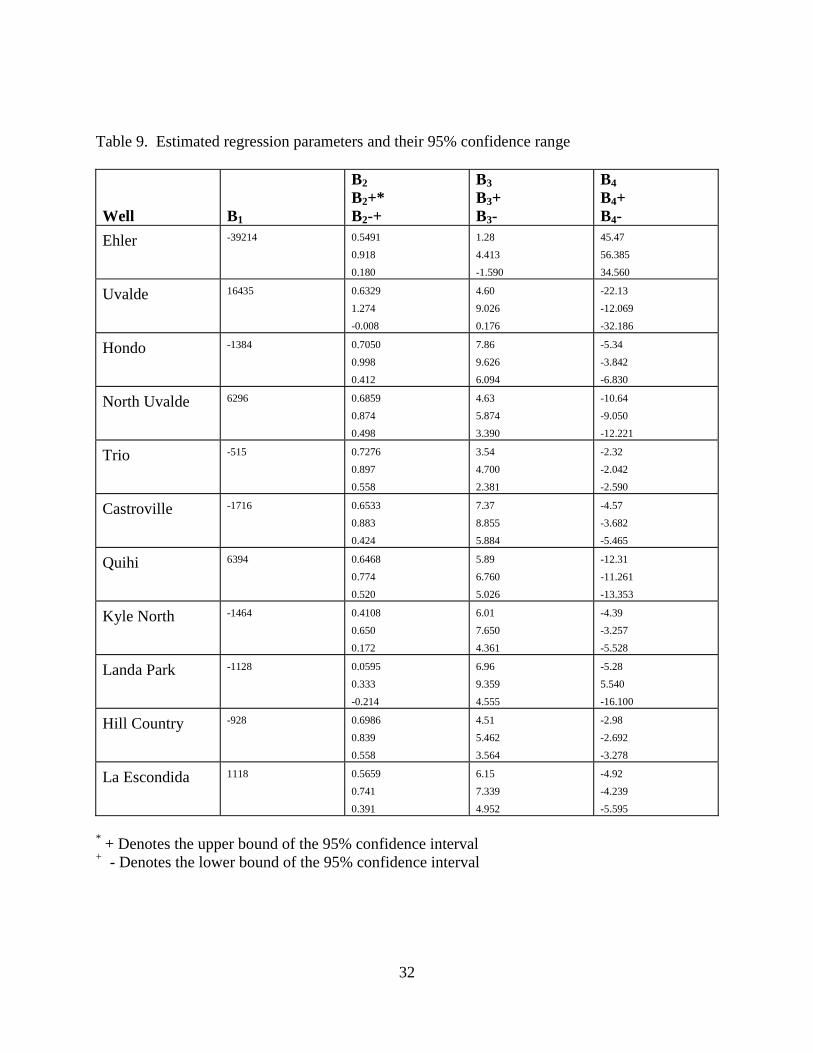
Table 9. Estimated regression parameters and their 95% confidence range Well
B1
B2 B2+* B2-+
B3 B3+ B3-
B4 B4+ B4-
Ehler -39214 0.5491
0.918
0.180
1.28
4.413
-1.590
45.47
56.385
34.560 Uvalde 16435 0.6329
1.274
-0.008
4.60
9.026
0.176
-22.13
-12.069
-32.186 Hondo -1384 0.7050
0.998
0.412
7.86
9.626
6.094
-5.34
-3.842
-6.830 North Uvalde 6296 0.6859
0.874
0.498
4.63
5.874
3.390
-10.64
-9.050
-12.221 Trio -515 0.7276
0.897
0.558
3.54
4.700
2.381
-2.32
-2.042
-2.590 Castroville -1716 0.6533
0.883
0.424
7.37
8.855
5.884
-4.57
-3.682
-5.465 Quihi 6394 0.6468
0.774
0.520
5.89
6.760
5.026
-12.31
-11.261
-13.353 Kyle North -1464 0.4108
0.650
0.172
6.01
7.650
4.361
-4.39
-3.257
-5.528 Landa Park -1128 0.0595
0.333
-0.214
6.96
9.359
4.555
-5.28
5.540
-16.100 Hill Country -928 0.6986
0.839
0.558
4.51
5.462
3.564
-2.98
-2.692
-3.278 La Escondida 1118 0.5659
0.741
0.391
6.15
7.339
4.952
-4.92
-4.239
-5.595 * + Denotes the upper bound of the 95% confidence interval + - Denotes the lower bound of the 95% confidence interval
32
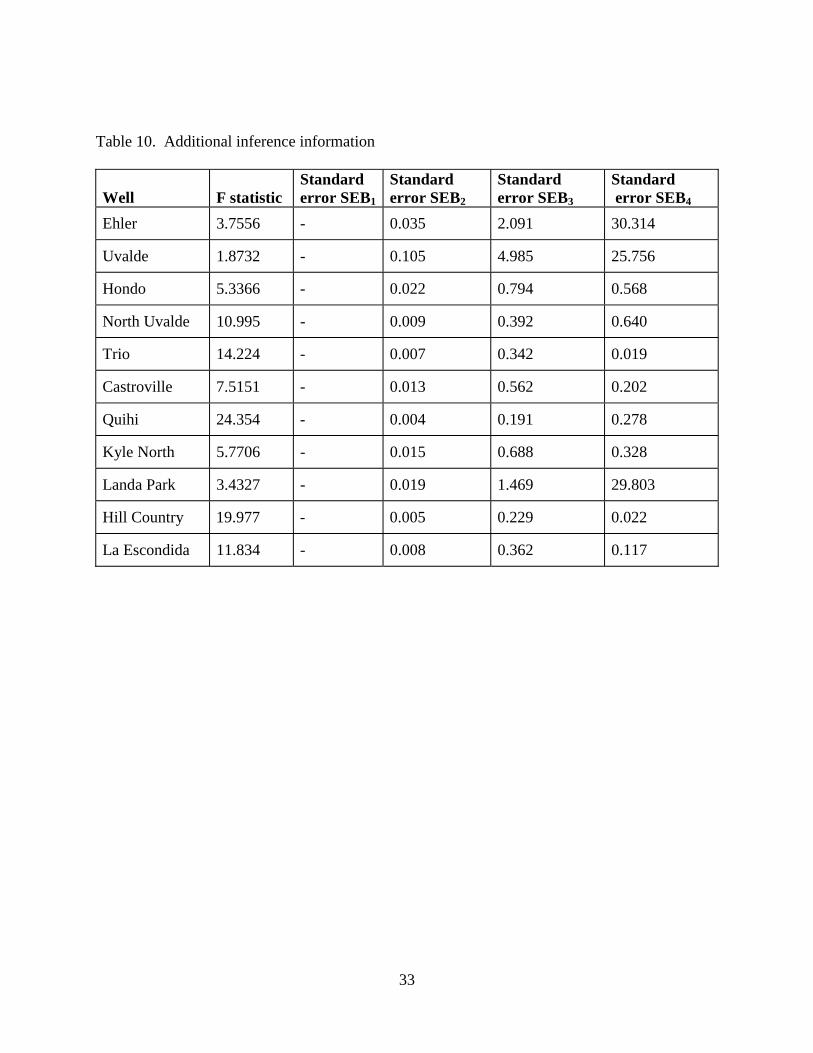
Table 10. Additional inference information Well
F statistic
Standard error SEB1
Standard error SEB2
Standard error SEB3
Standard error SEB4
Ehler 3.7556 - 0.035 2.091 30.314
Uvalde 1.8732 - 0.105 4.985 25.756
Hondo 5.3366 - 0.022 0.794 0.568
North Uvalde 10.995 - 0.009 0.392 0.640
Trio 14.224 - 0.007 0.342 0.019
Castroville 7.5151 - 0.013 0.562 0.202
Quihi 24.354 - 0.004 0.191 0.278
Kyle North 5.7706 - 0.015 0.688 0.328
Landa Park 3.4327 - 0.019 1.469 29.803
Hill Country 19.977 - 0.005 0.229 0.022
La Escondida 11.834 - 0.008 0.362 0.117
33

Table 10. Additional inference information (continued) Well
Test statistic TB1
Test statistic TB2
Test statistic TB3
Test statistic TB4
Ehler - 2.950 0.883 8.259
Uvalde - 1.958 2.061 -4.360
Hondo - 4.774 8.821 -7.079
North Uvalde - 7.225 7.394 -13.295
Trio - 8.519 6.053 -16.756
Castroville - 5.641 9.831 -10.169
Quihi - 10.104 13.474 -23.321
Kyle North - 3.407 7.238 -7.666
Landa Park - 0.431 5.740 -0.967
Hill Country - 9.865 9.423 -20.191
La Escondida - 6.401 10.208 -14.369
34

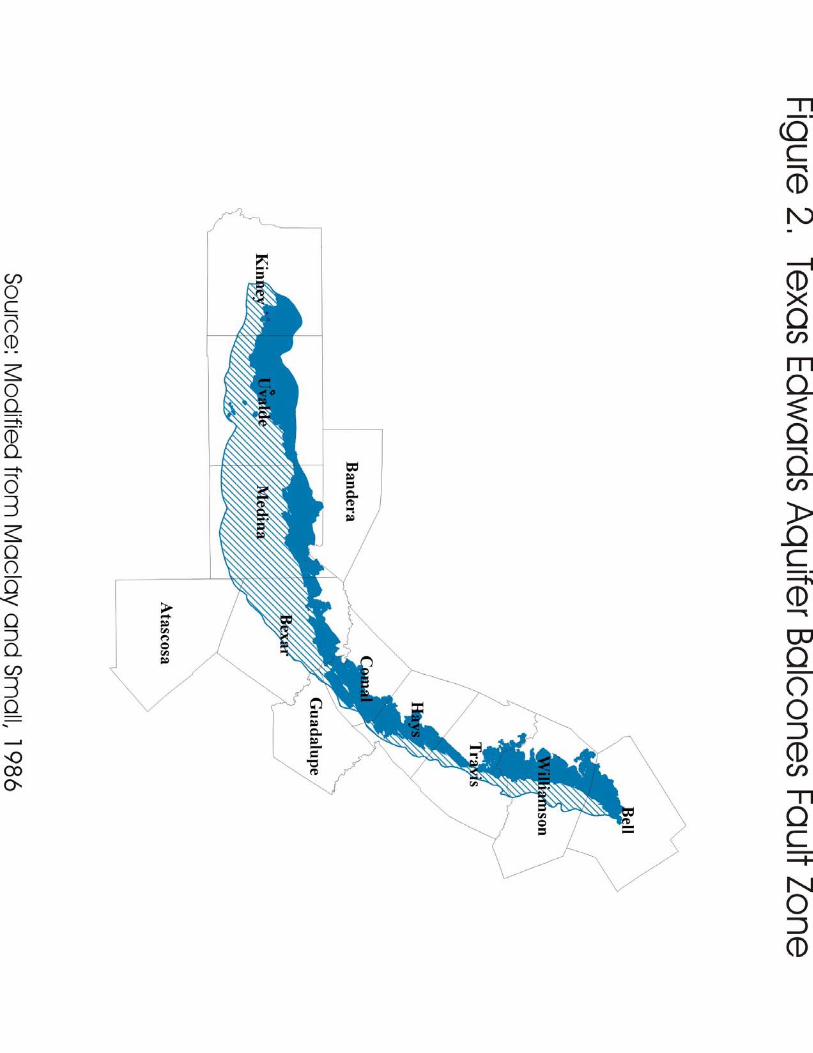
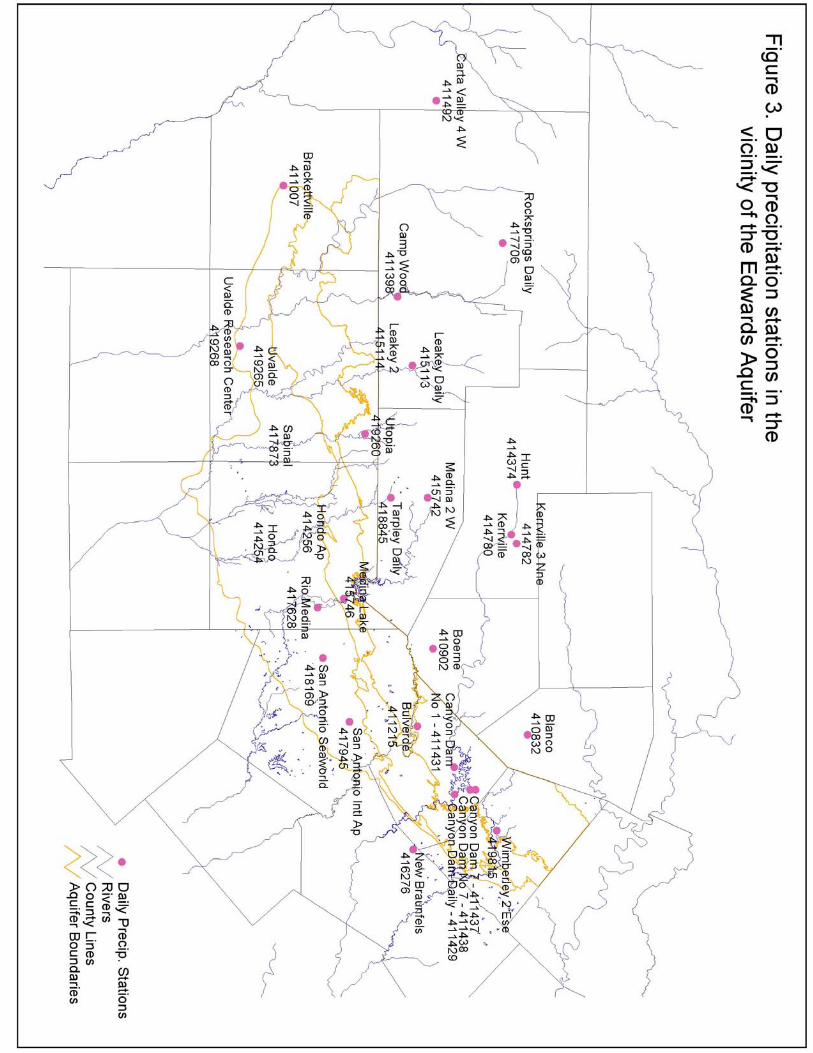

Figure 5. Daily precipitation in the vicinity of the Edwards Aquifer
(October 17, 1998 to January 31, 1999)
1
10
100
1000
1000029
0
292
294
296
298
300
302
304
306
308
310
312
314
316
318
320
322
324
326
328
330
332
334
336
338
340
342
344
346
348
350
352
354
356
358
360
362
364 1 3 5 7 9 11 13 15 17 19 21 23 25 27 29 31
Julian Date (1998 - 1999)
Dai
ly p
reci
pita
tion
(1/1
00 in
ch)
# 410832 - Blanco# 410902 - Boerne# 411007 - Brackettville# 411215 - Bulverde# 411398 - Camp Wood# 411429 - Canyon Dam Daily# 411492 - Carta Valley 4 W# 414254 - Hondo# 414374 - Hunt# 414782 - Kerrville 3 NNE# 415113 - Leakey Daily# 415742 - Medina 2 W# 415746 - Medina Lake# 416276 - New Braunfels# 417628 - Rio Medina# 417706 - Rockspirngs# 417873 - Sabinal# 417945 - San Antonio Intl Airport# 418169 - San Antonio Seaworld# 418845 - Tarpley# 419260 - Utopia# 419268 - Uvalde Research Center# 419815 - Wimberley 2 ESE# 411431 - Canyon Dam No 1
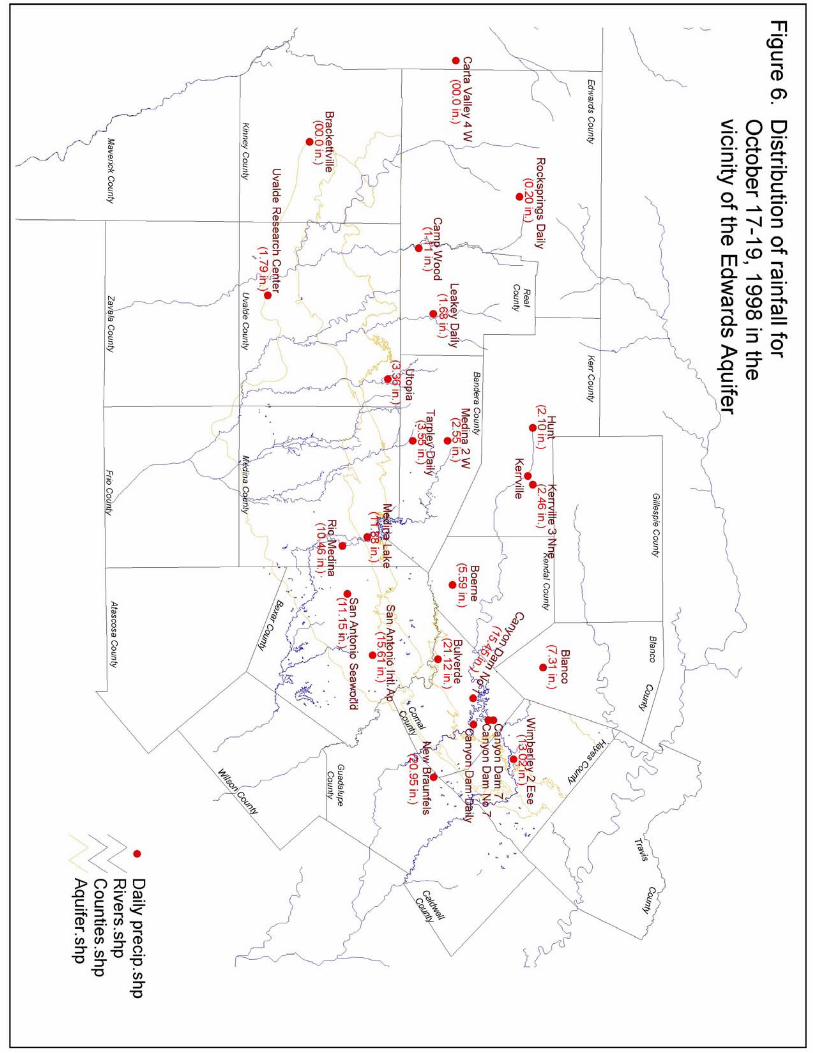

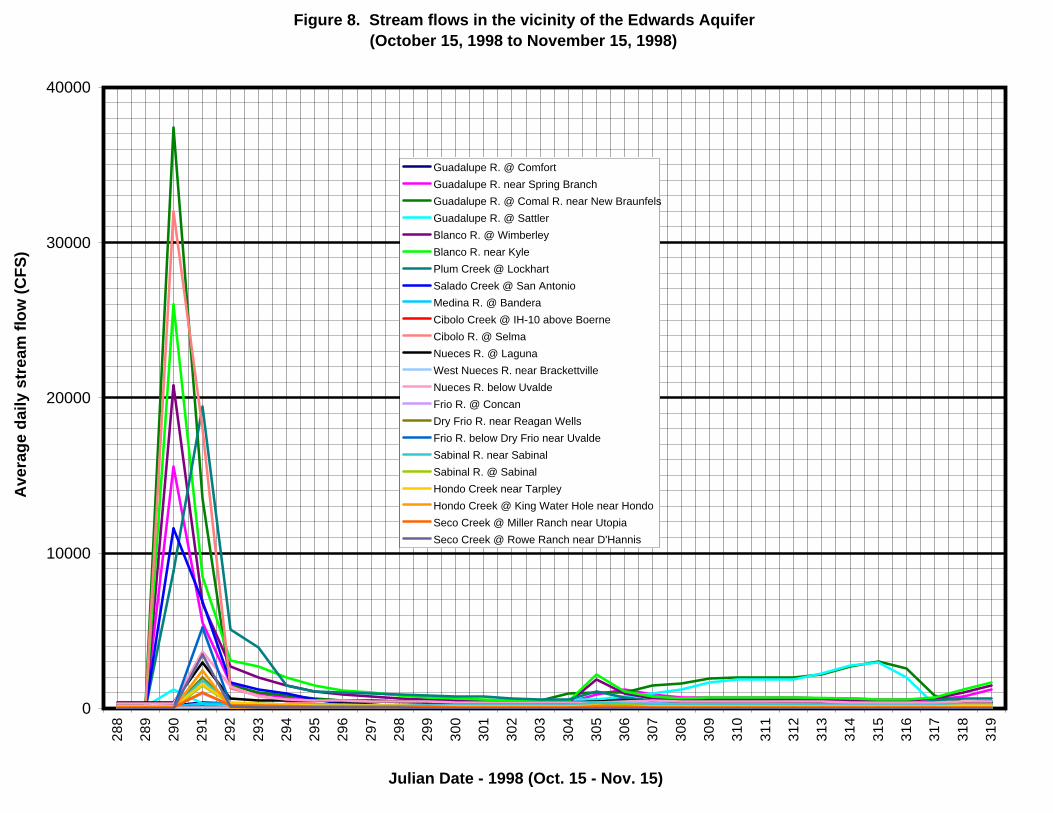
Figure 8. Stream flows in the vicinity of the Edwards Aquifer (October 15, 1998 to November 15, 1998)
0
10000
20000
30000
40000
288
289
290
291
292
293
294
295
296
297
298
299
300
301
302
303
304
305
306
307
308
309
310
311
312
313
314
315
316
317
318
319
Julian Date - 1998 (Oct. 15 - Nov. 15)
Ave
rage
dai
ly s
trea
m fl
ow (C
FS)
Guadalupe R. @ ComfortGuadalupe R. near Spring BranchGuadalupe R. @ Comal R. near New BraunfelsGuadalupe R. @ SattlerBlanco R. @ WimberleyBlanco R. near KylePlum Creek @ LockhartSalado Creek @ San AntonioMedina R. @ BanderaCibolo Creek @ IH-10 above BoerneCibolo R. @ SelmaNueces R. @ LagunaWest Nueces R. near BrackettvilleNueces R. below UvaldeFrio R. @ ConcanDry Frio R. near Reagan WellsFrio R. below Dry Frio near UvaldeSabinal R. near SabinalSabinal R. @ SabinalHondo Creek near TarpleyHondo Creek @ King Water Hole near HondoSeco Creek @ Miller Ranch near UtopiaSeco Creek @ Rowe Ranch near D'Hannis
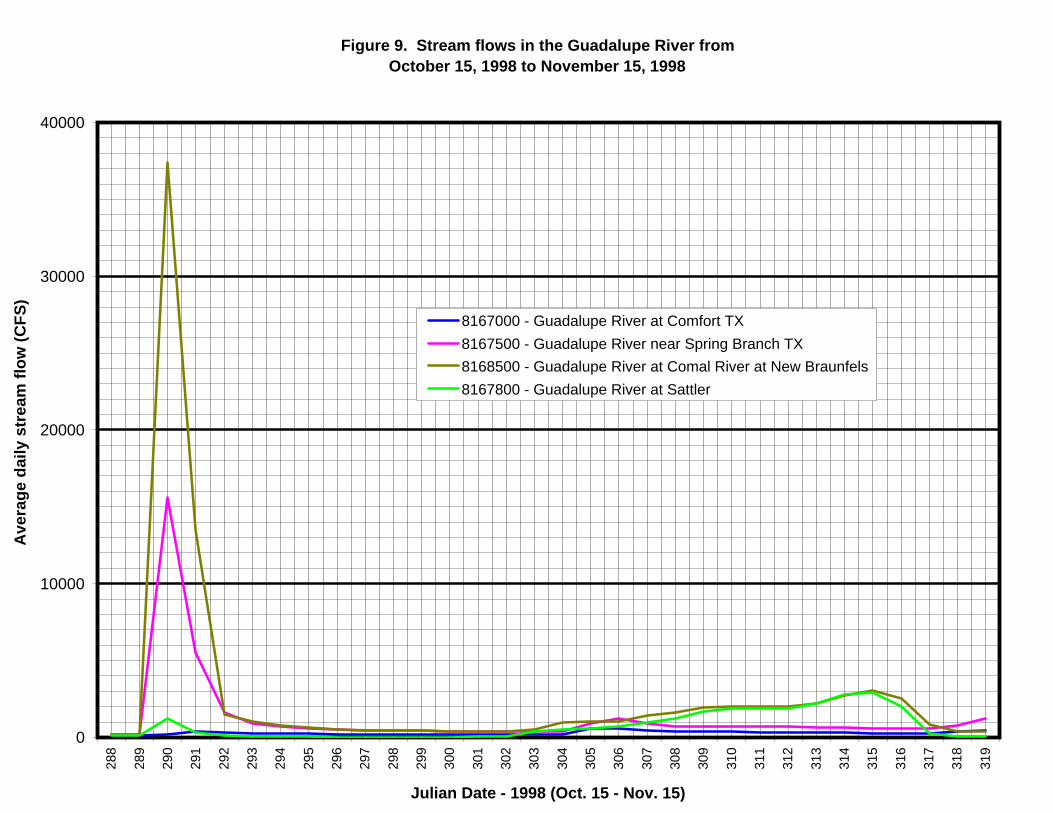
Figure 9. Stream flows in the Guadalupe River from October 15, 1998 to November 15, 1998
0
10000
20000
30000
4000028
8
289
290
291
292
293
294
295
296
297
298
299
300
301
302
303
304
305
306
307
308
309
310
311
312
313
314
315
316
317
318
319
Julian Date - 1998 (Oct. 15 - Nov. 15)
Ave
rage
dai
ly s
trea
m fl
ow (C
FS)
8167000 - Guadalupe River at Comfort TX8167500 - Guadalupe River near Spring Branch TX8168500 - Guadalupe River at Comal River at New Braunfels8167800 - Guadalupe River at Sattler
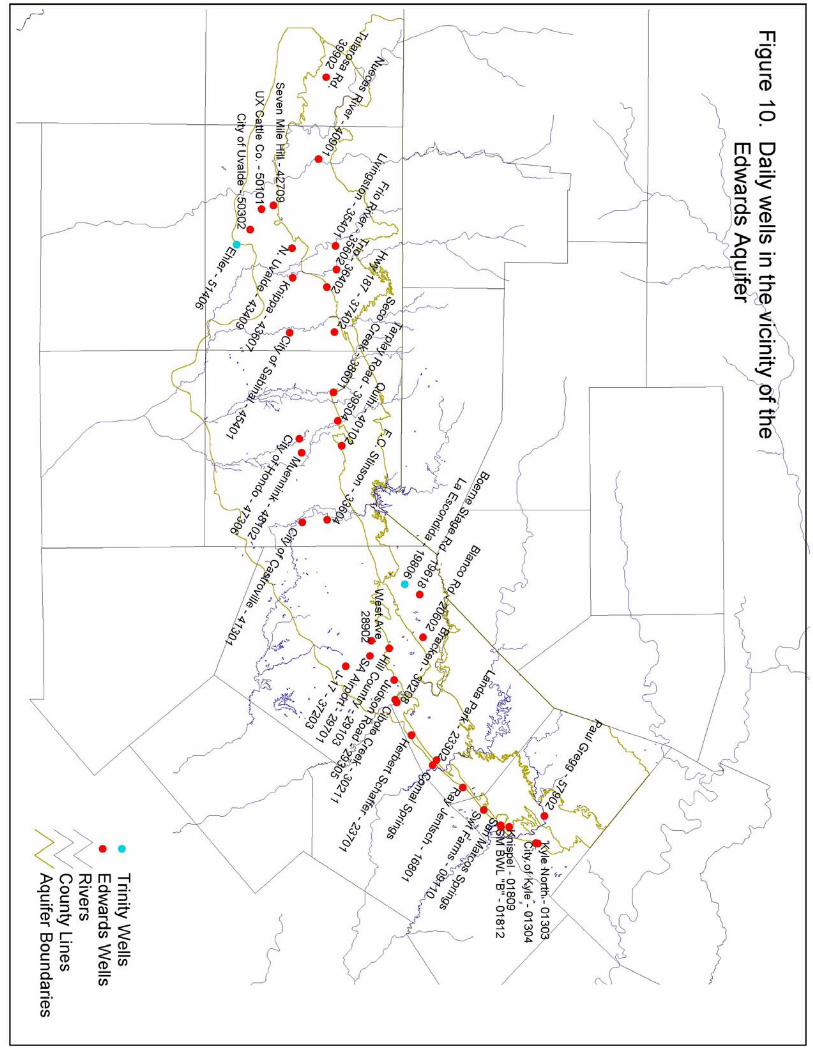


Figure 12. Daily water elevations in monitor wells Kyle North and Landa Park (October 11, 1998 to January 31, 1999)
550
555
560
565
57028
4
287
290
293
296
299
302
305
308
311
314
317
320
323
326
329
332
335
338
341
344
347
350
353
356
359
362
365 3 6 9 12 15 18 21 24 27 30
Julian Date (1998-1999)
Feet
abo
ve M
SL
625
626
628
629
630
Feet
abo
ve M
SL
LEFT Y-AXIS, 01303 - Kyle North
RIGHT Y-AXIS, 23302 - Landa Park
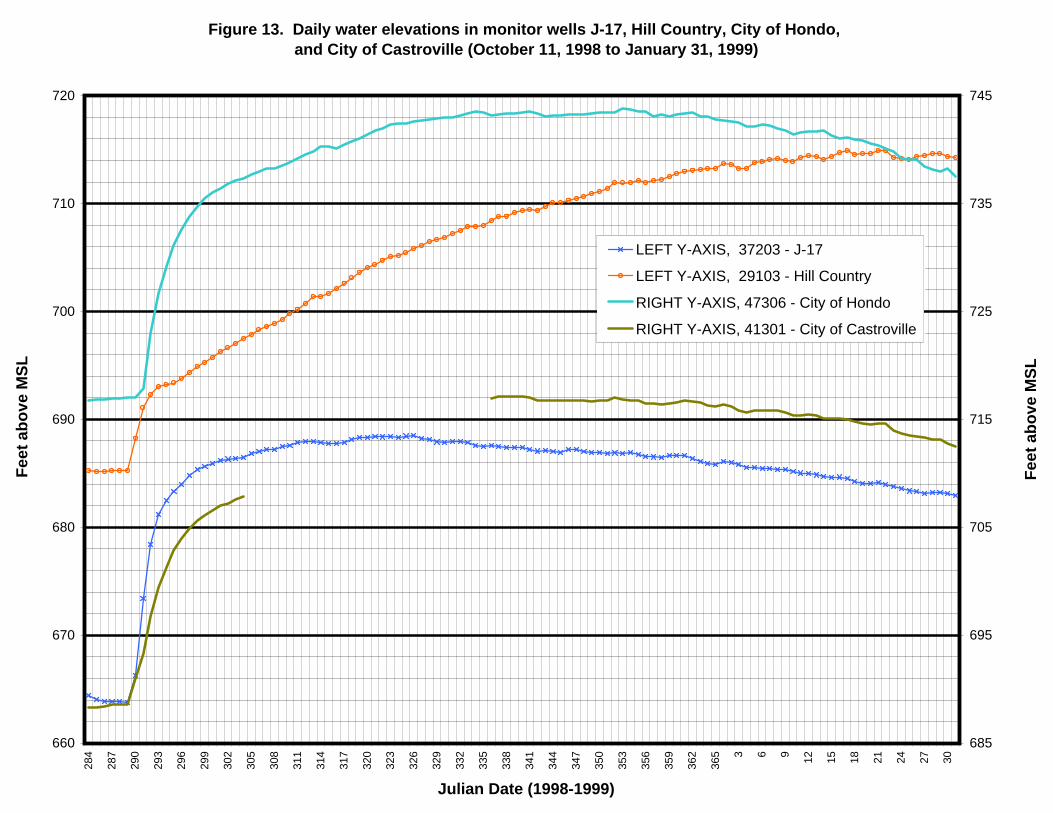
Figure 13. Daily water elevations in monitor wells J-17, Hill Country, City of Hondo, and City of Castroville (October 11, 1998 to January 31, 1999)
660
670
680
690
700
710
72028
4
287
290
293
296
299
302
305
308
311
314
317
320
323
326
329
332
335
338
341
344
347
350
353
356
359
362
365 3 6 9 12 15 18 21 24 27 30
Julian Date (1998-1999)
Feet
abo
ve M
SL
685
695
705
715
725
735
745
Feet
abo
ve M
SL
LEFT Y-AXIS, 37203 - J-17
LEFT Y-AXIS, 29103 - Hill Country
RIGHT Y-AXIS, 47306 - City of Hondo
RIGHT Y-AXIS, 41301 - City of Castroville
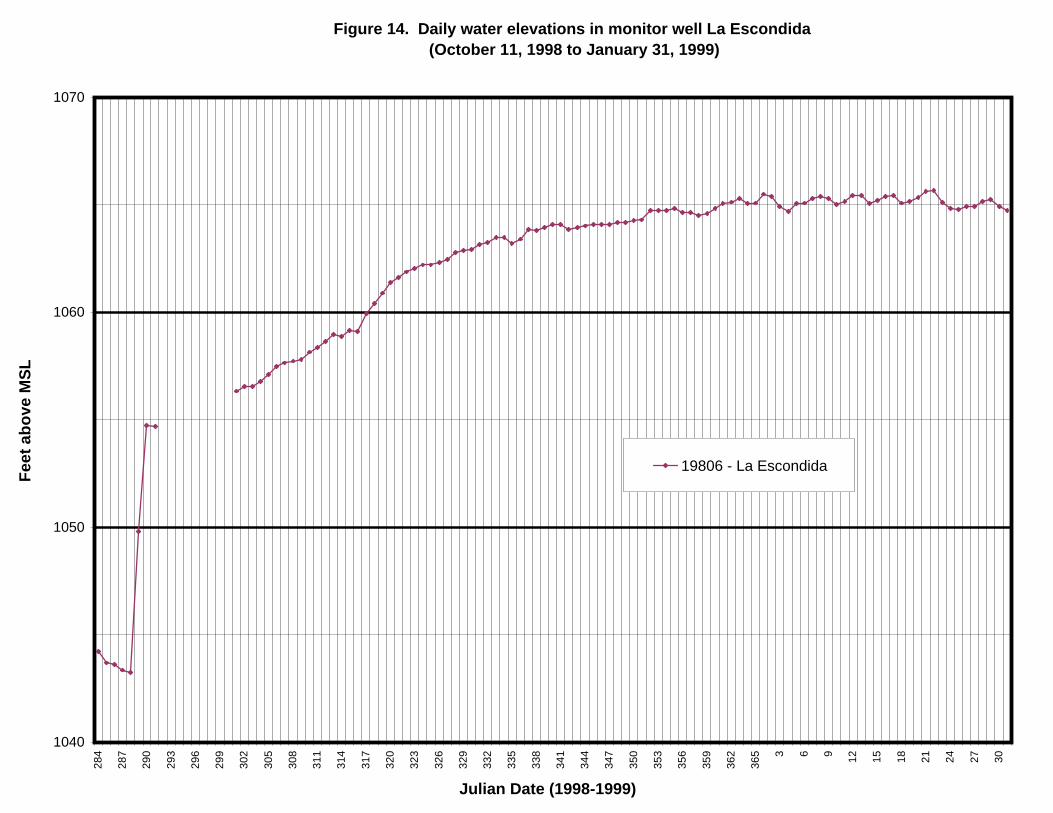
Figure 14. Daily water elevations in monitor well La Escondida (October 11, 1998 to January 31, 1999)
1040
1050
1060
107028
4
287
290
293
296
299
302
305
308
311
314
317
320
323
326
329
332
335
338
341
344
347
350
353
356
359
362
365 3 6 9 12 15 18 21 24 27 30
Julian Date (1998-1999)
Feet
abo
ve M
SL
19806 - La Escondida
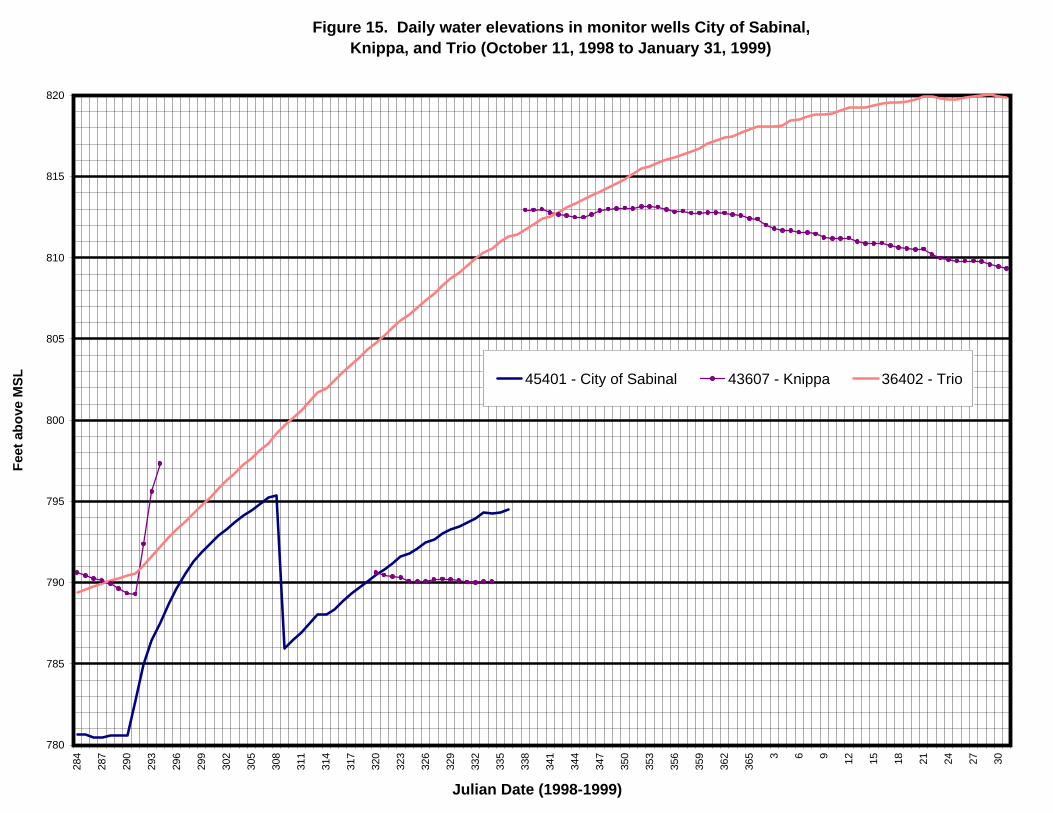
Figure 15. Daily water elevations in monitor wells City of Sabinal, Knippa, and Trio (October 11, 1998 to January 31, 1999)
780
785
790
795
800
805
810
815
820
284
287
290
293
296
299
302
305
308
311
314
317
320
323
326
329
332
335
338
341
344
347
350
353
356
359
362
365 3 6 9 12 15 18 21 24 27 30
Julian Date (1998-1999)
Feet
abo
ve M
SL 45401 - City of Sabinal 43607 - Knippa 36402 - Trio

Figure 16. Daily water elevations in monitor wells Ehler and Quihi (October 11, 1998 to January 31, 1999)
830
835
840
845
85028
4
287
290
293
296
299
302
305
308
311
314
317
320
323
326
329
332
335
338
341
344
347
350
353
356
359
362
365 3 6 9 12 15 18 21 24 27 30
Julian Date (1998-1999)
Feet
abo
ve M
SL
51405 - Ehler
40102 - Quihi
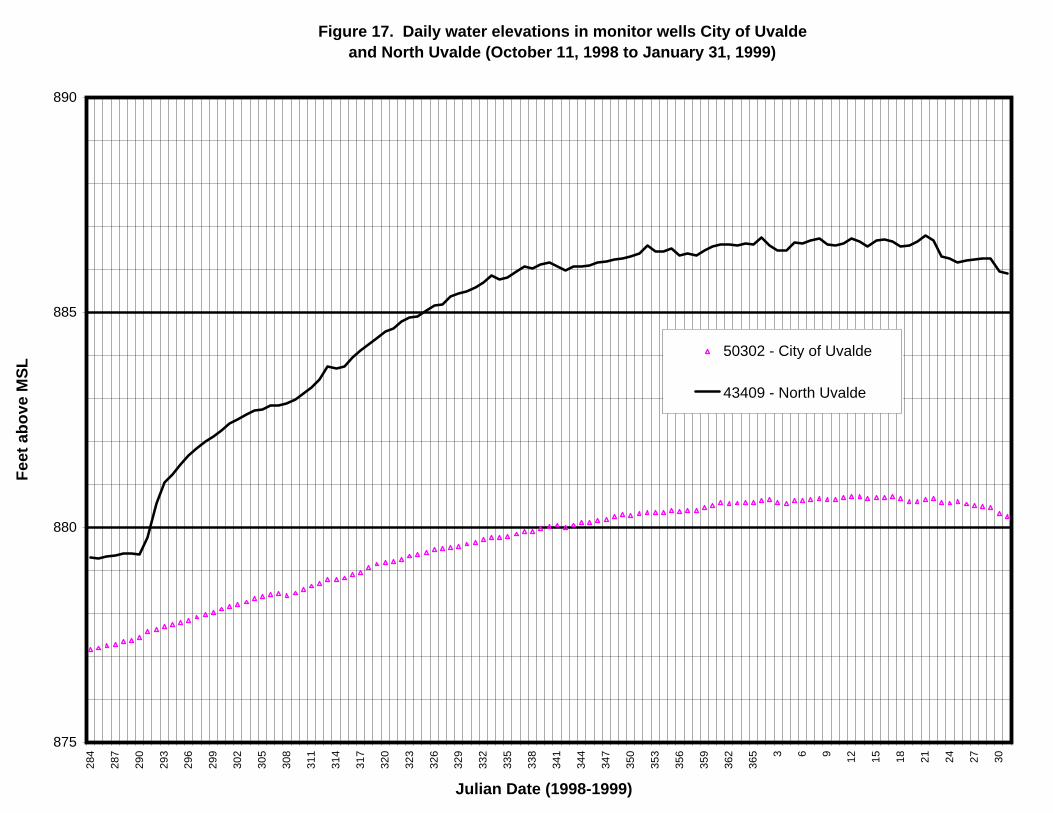
Figure 17. Daily water elevations in monitor wells City of Uvalde and North Uvalde (October 11, 1998 to January 31, 1999)
875
880
885
89028
4
287
290
293
296
299
302
305
308
311
314
317
320
323
326
329
332
335
338
341
344
347
350
353
356
359
362
365 3 6 9 12 15 18 21 24 27 30
Julian Date (1998-1999)
Feet
abo
ve M
SL
50302 - City of Uvalde
43409 - North Uvalde
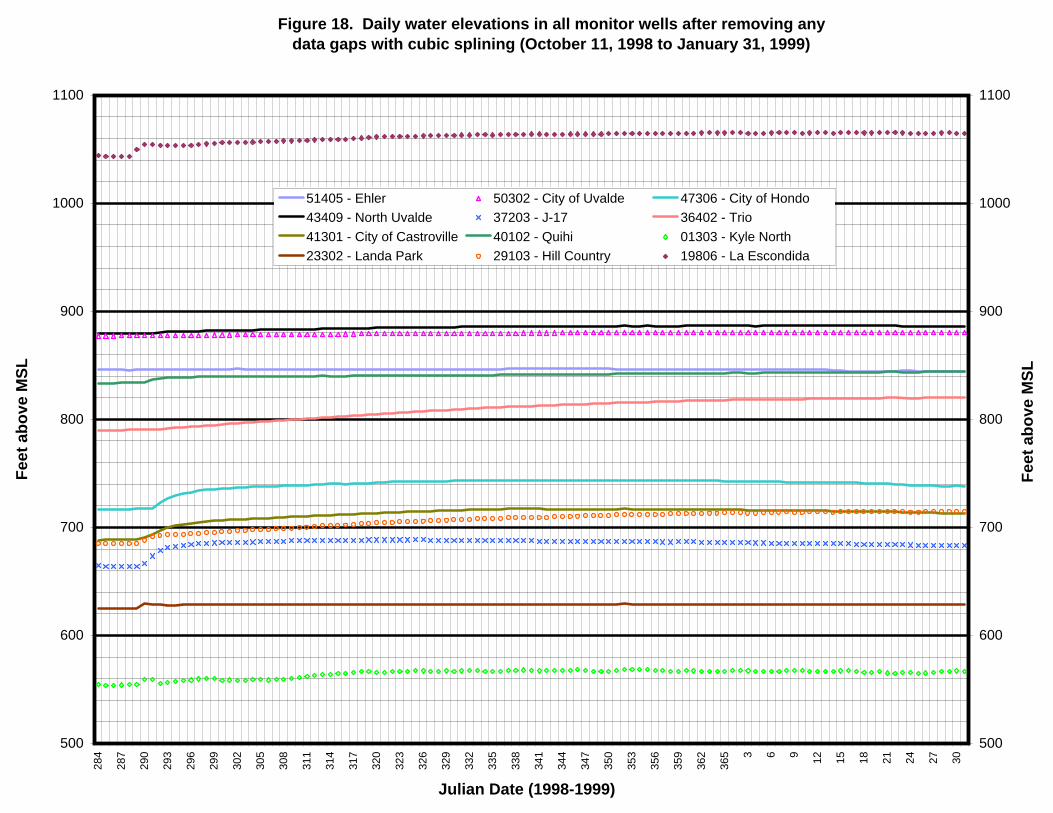
Figure 18. Daily water elevations in all monitor wells after removing any data gaps with cubic splining (October 11, 1998 to January 31, 1999)
500
600
700
800
900
1000
110028
4
287
290
293
296
299
302
305
308
311
314
317
320
323
326
329
332
335
338
341
344
347
350
353
356
359
362
365 3 6 9 12 15 18 21 24 27 30
Julian Date (1998-1999)
Feet
abo
ve M
SL
500
600
700
800
900
1000
1100
Feet
abo
ve M
SL
51405 - Ehler 50302 - City of Uvalde 47306 - City of Hondo43409 - North Uvalde 37203 - J-17 36402 - Trio41301 - City of Castroville 40102 - Quihi 01303 - Kyle North23302 - Landa Park 29103 - Hill Country 19806 - La Escondida
Figure 19. Daily water elevations in monitor wells Kyle North and Landa Park after removing any data gaps with cubic splining (October 11, 1998 to January 31, 1999)
550
555
560
565
57028
4
287
290
293
296
299
302
305
308
311
314
317
320
323
326
329
332
335
338
341
344
347
350
353
356
359
362
365 3 6 9 12 15 18 21 24 27 30
Julian Date (1998-1999)
Feet
abo
ve M
SL
625
626
628
629
630
Feet
abo
ve M
SL
LEFT Y-AXIS, 01303 - Kyle North
RIGHT Y-AXIS, 23302 - Landa Park

Figure 20. Daily water elevations in monitor wells J-17, Hill Country, City of Hondo, and City of Castroville after removing any data gaps with cubic splining (October 11, 1998 to January 31, 1999)
660
670
680
690
700
710
72028
4
287
290
293
296
299
302
305
308
311
314
317
320
323
326
329
332
335
338
341
344
347
350
353
356
359
362
365 3 6 9 12 15 18 21 24 27 30
Julian Date (1998-1999)
Feet
abo
ve M
SL
685
695
705
715
725
735
745
Feet
abo
ve M
SL
LEFT Y-AXIS, 37203 - J-17
LEFT Y-AXIS, 29103 - Hill Country
RIGHT Y-AXIS, 47306 - City of Hondo
RIGHT Y-AXIS, 41301 - City of Castroville

Figure 21. Daily water elevations in monitor well La Escondida after removing any data gaps with cubic splining (October 11, 1998 to January 31, 1999)
1040
1050
1060
107028
4
287
290
293
296
299
302
305
308
311
314
317
320
323
326
329
332
335
338
341
344
347
350
353
356
359
362
365 3 6 9 12 15 18 21 24 27 30
Julian Date (1998-1999)
Feet
abo
ve M
SL
19806 - La Escondida
Figure 22. Daily water elevations in monitor wells City of Sabinal, Knippa, and Trio afterremoving any data gaps with cubic splining (October 11, 1998 to January 31, 1999)
780
785
790
795
800
805
810
815
82028
4
287
290
293
296
299
302
305
308
311
314
317
320
323
326
329
332
335
338
341
344
347
350
353
356
359
362
365 3 6 9 12 15 18 21 24 27 30
Julian Date (1998-1999)
Feet
abo
ve M
SL
45401 - City of Sabinal43607 - Knippa36402 - Trio
Figure 23. Daily water elevations in monitor wells Ehler and Quihi after removing any data gaps with cubic splining (October 11, 1998 to January 31, 1999)
830
835
840
845
85028
4
287
290
293
296
299
302
305
308
311
314
317
320
323
326
329
332
335
338
341
344
347
350
353
356
359
362
365 3 6 9 12 15 18 21 24 27 30
Julian Date (1998-1999)
Feet
abo
ve M
SL
51405 - Ehler
40102 - Quihi

Figure 24. Daily water elevations in monitor wells City of Uvalde and North Uvalde after removing any data gaps with cubic splining (October 11, 1998 to January 31, 1999)
875
880
885
89028
4
287
290
293
296
299
302
305
308
311
314
317
320
323
326
329
332
335
338
341
344
347
350
353
356
359
362
365 3 6 9 12 15 18 21 24 27 30
Julian Date (1998-1999)
Feet
abo
ve M
SL
50302 - City of Uvalde
43409 - North Uvalde
Figure 25. USGS measured discharges (January 1, 1998 through December 31, 1999) from Comal and San Marcos Springs
100
150
200
250
300
350
400
4501 16 31 46 61 76 91 106
121
136
151
166
181
196
211
226
241
256
271
286
301
316
331
346
361 11 26 41 56 71 86 101
116
131
146
161
176
191
206
221
236
251
266
281
296
311
326
341
356
Julian Date (1998-1999)
Dai
ly d
isch
arge
(CFS
)
Comal Springs Daily Discharge (CFS)
San Marcos Springs Daily Discharge(CFS)

Figure 26. Preciptation in five stations in the vicinity of San Marcos Springs(October 17, 1998 to January 31, 1999)
1
10
100
1000
10000
290
292
294
296
298
300
302
304
306
308
310
312
314
316
318
320
322
324
326
328
330
332
334
336
338
340
342
344
346
348
350
352
354
356
358
360
362
364 1 3 5 7 9 11 13 15 17 19 21 23 25 27 29 31
Julian Date (1998 - 1999)
Dai
ly p
reci
pita
tion
(1/1
00 in
ch)
# 411215 - Bulverde
# 416276 - New Braunfels
# 417945 - San Antonio Intl Airport
# 419815 - Wimberley 2 ESE
# 411431 - Canyon Dam No 1

Figure 27. Responses of Comal Springs, San Marcos Springs, J-17, and the Hondo index well to the October 1998 precipitation event
0
50
100
150
200
250
300
350
400
45028
428
628
829
029
229
429
629
830
030
230
430
630
831
031
231
431
631
832
032
232
432
632
833
033
233
433
633
834
034
234
434
634
835
035
235
435
635
836
036
236
4 1 3 5 7 9 11 13 15 17 19 21 23 25 27 29 31
Julian Date (1998-1999), 1 tic mark = 1 day
Dai
ly d
isch
arge
(CFS
)
630
660
690
720
750
780
810
840
870
900
Wat
er e
leva
tion
(feet
abo
ve M
SL)
Comal Springs Daily Discharge (CFS)
San Marcos Springs Daily Discharge (CFS)
J-17 Well, Bexar County Well (feet above MSL)
Hondo Index Well (feet above MSL)
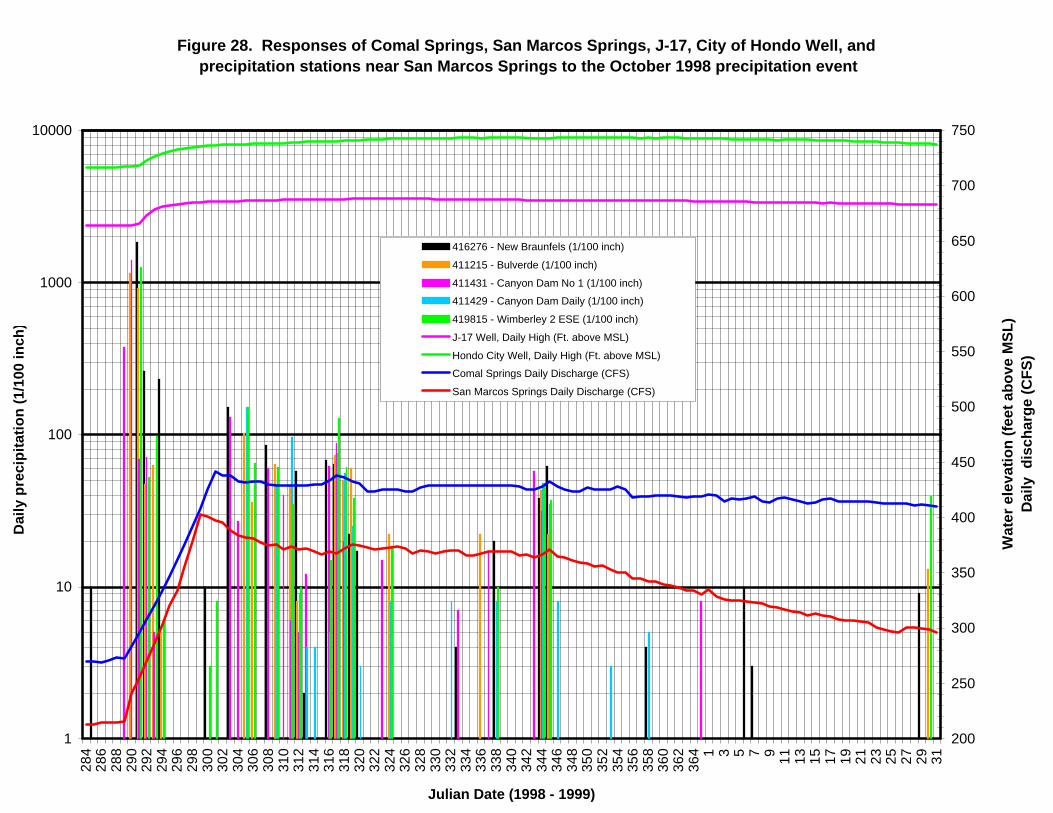
Figure 28. Responses of Comal Springs, San Marcos Springs, J-17, City of Hondo Well, and precipitation stations near San Marcos Springs to the October 1998 precipitation event
1
10
100
1000
10000
284
286
288
290
292
294
296
298
300
302
304
306
308
310
312
314
316
318
320
322
324
326
328
330
332
334
336
338
340
342
344
346
348
350
352
354
356
358
360
362
364 1 3 5 7 9 11 13 15 17 19 21 23 25 27 29 31
Julian Date (1998 - 1999)
Dai
ly p
reci
pita
tion
(1/1
00 in
ch)
200
250
300
350
400
450
500
550
600
650
700
750
Wat
er e
leva
tion
(feet
abo
ve M
SL)
Dai
ly d
isch
arge
(CFS
)
416276 - New Braunfels (1/100 inch)
411215 - Bulverde (1/100 inch)
411431 - Canyon Dam No 1 (1/100 inch)
411429 - Canyon Dam Daily (1/100 inch)
419815 - Wimberley 2 ESE (1/100 inch)
J-17 Well, Daily High (Ft. above MSL)
Hondo City Well, Daily High (Ft. above MSL)
Comal Springs Daily Discharge (CFS)
San Marcos Springs Daily Discharge (CFS)
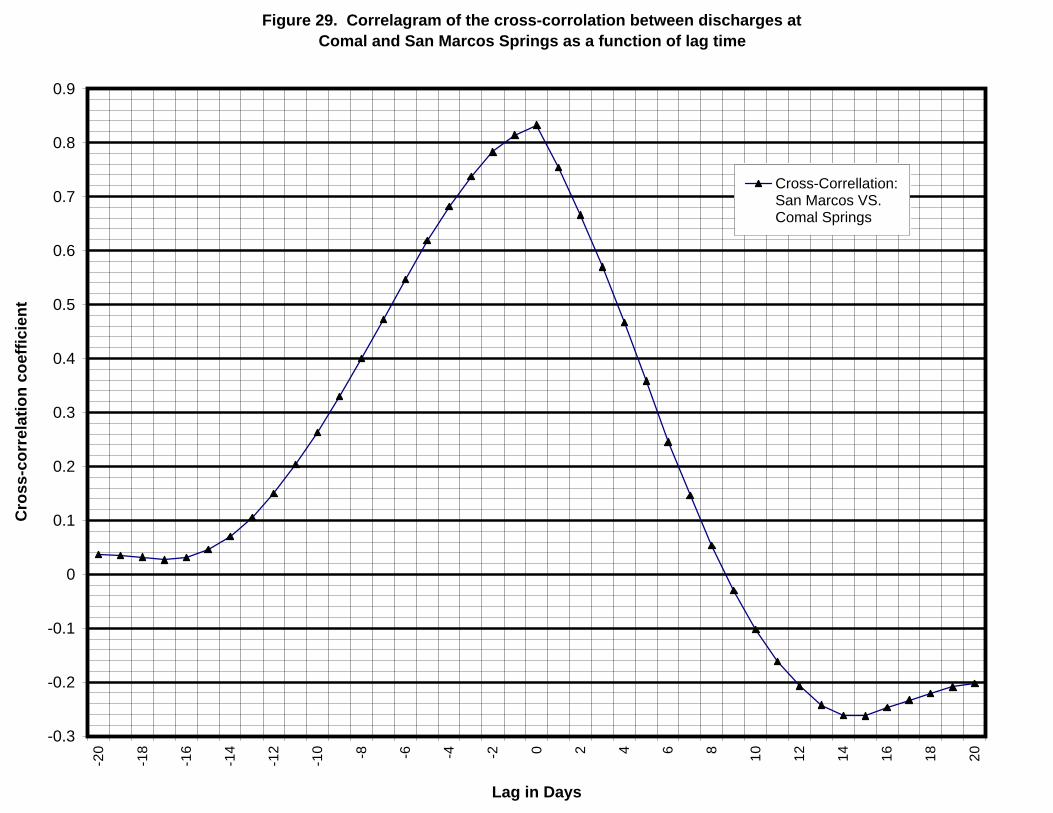
Figure 29. Correlagram of the cross-corrolation between discharges atComal and San Marcos Springs as a function of lag time
-0.3
-0.2
-0.1
0
0.1
0.2
0.3
0.4
0.5
0.6
0.7
0.8
0.9-2
0
-18
-16
-14
-12
-10 -8 -6 -4 -2 0 2 4 6 8 10 12 14 16 18 20
Lag in Days
Cro
ss-c
orre
latio
n co
effic
ient
Cross-Correllation: San Marcos VS.Comal Springs
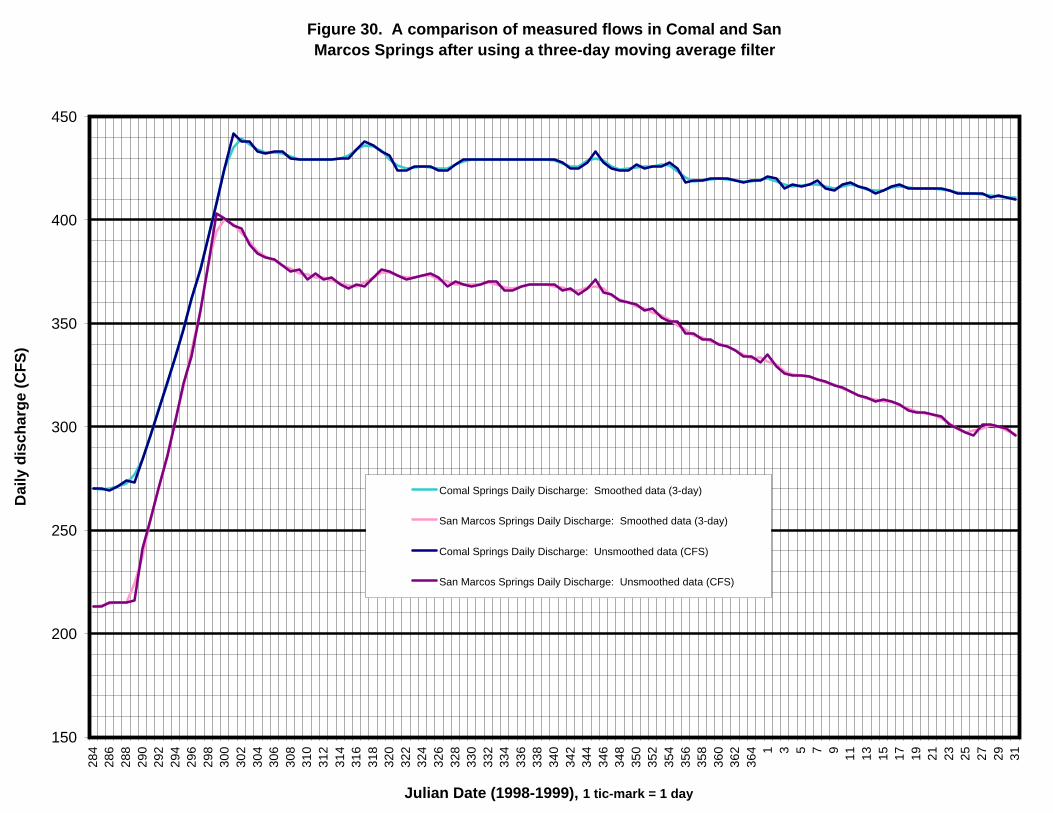
Figure 30. A comparison of measured flows in Comal and San Marcos Springs after using a three-day moving average filter
150
200
250
300
350
400
45028
428
628
829
029
229
429
629
830
030
230
430
630
831
031
231
431
631
832
032
232
432
632
833
033
233
433
633
834
034
234
434
634
835
035
235
435
635
836
036
236
4 1 3 5 7 9 11 13 15 17 19 21 23 25 27 29 31
Julian Date (1998-1999), 1 tic-mark = 1 day
Dai
ly d
isch
arge
(CFS
)
Comal Springs Daily Discharge: Smoothed data (3-day)
San Marcos Springs Daily Discharge: Smoothed data (3-day)
Comal Springs Daily Discharge: Unsmoothed data (CFS)
San Marcos Springs Daily Discharge: Unsmoothed data (CFS)
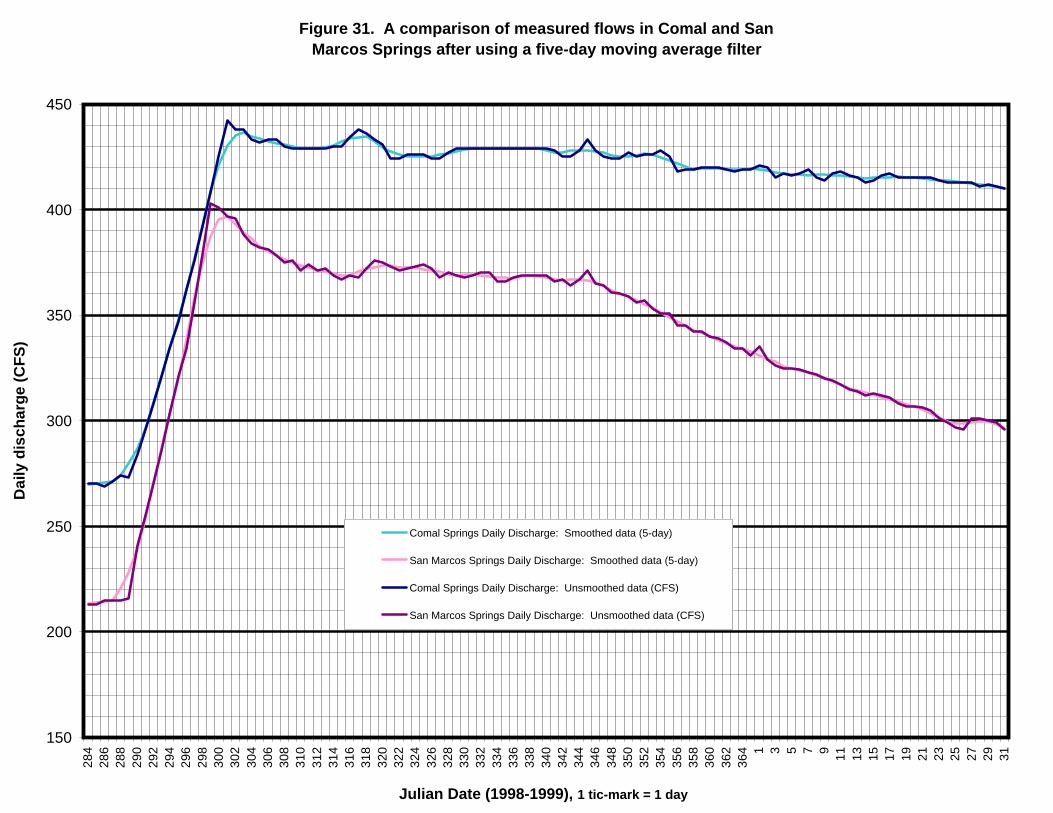
Figure 31. A comparison of measured flows in Comal and San Marcos Springs after using a five-day moving average filter
150
200
250
300
350
400
45028
428
628
829
029
229
429
629
830
030
230
430
630
831
031
231
431
631
832
032
232
432
632
833
033
233
433
633
834
034
234
434
634
835
035
235
435
635
836
036
236
4 1 3 5 7 9 11 13 15 17 19 21 23 25 27 29 31
Julian Date (1998-1999), 1 tic-mark = 1 day
Dai
ly d
isch
arge
(CFS
)
Comal Springs Daily Discharge: Smoothed data (5-day)
San Marcos Springs Daily Discharge: Smoothed data (5-day)
Comal Springs Daily Discharge: Unsmoothed data (CFS)
San Marcos Springs Daily Discharge: Unsmoothed data (CFS)
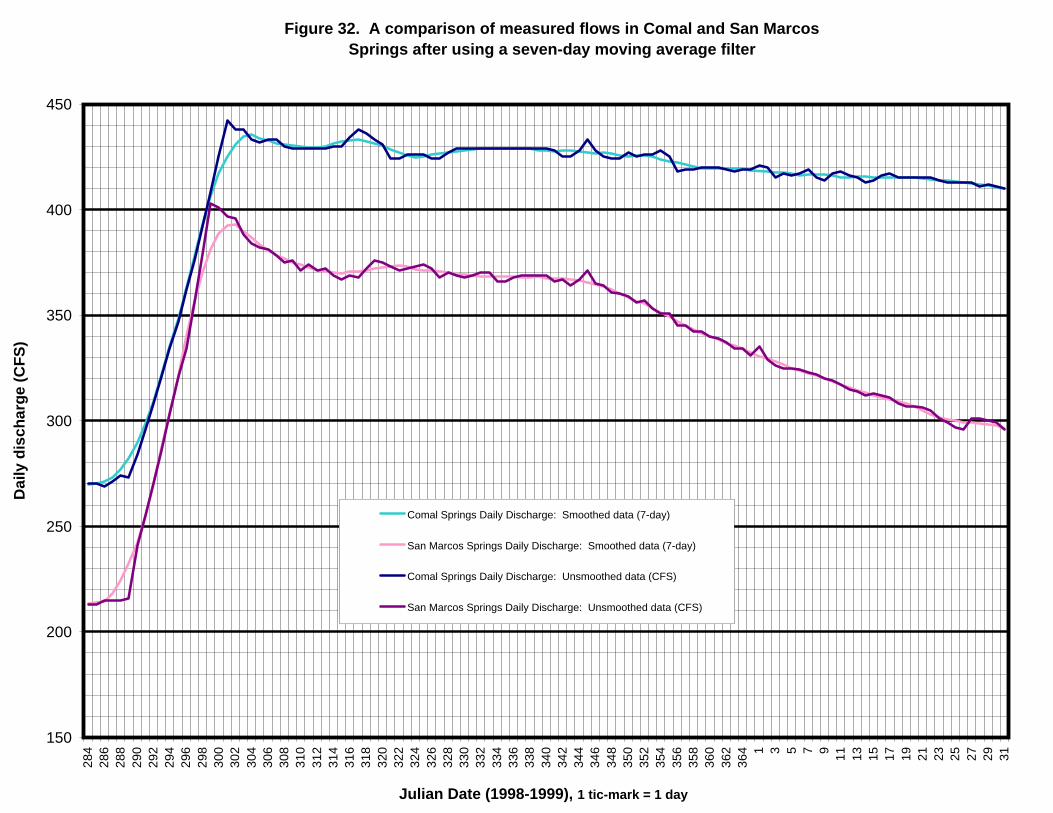
Figure 32. A comparison of measured flows in Comal and San Marcos Springs after using a seven-day moving average filter
150
200
250
300
350
400
45028
428
628
829
029
229
429
629
830
030
230
430
630
831
031
231
431
631
832
032
232
432
632
833
033
233
433
633
834
034
234
434
634
835
035
235
435
635
836
036
236
4 1 3 5 7 9 11 13 15 17 19 21 23 25 27 29 31
Julian Date (1998-1999), 1 tic-mark = 1 day
Dai
ly d
isch
arge
(CFS
)
Comal Springs Daily Discharge: Smoothed data (7-day)
San Marcos Springs Daily Discharge: Smoothed data (7-day)
Comal Springs Daily Discharge: Unsmoothed data (CFS)
San Marcos Springs Daily Discharge: Unsmoothed data (CFS)
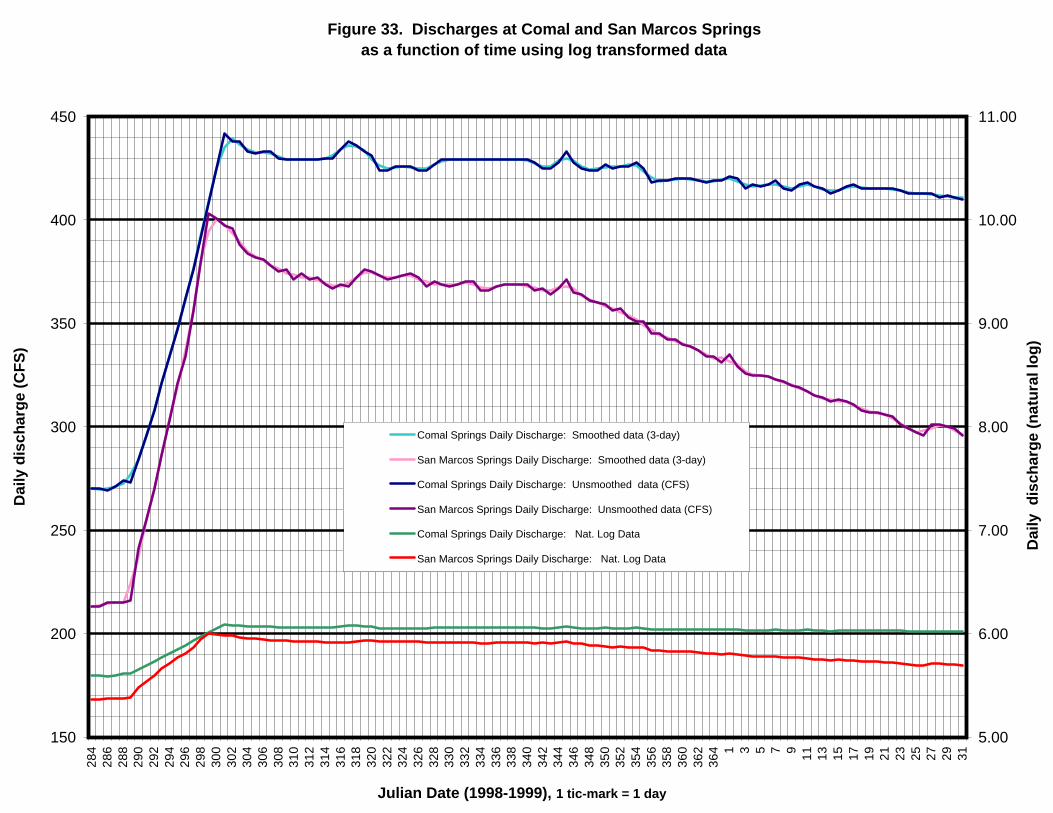
Figure 33. Discharges at Comal and San Marcos Springs as a function of time using log transformed data
150
200
250
300
350
400
450
284
286
288
290
292
294
296
298
300
302
304
306
308
310
312
314
316
318
320
322
324
326
328
330
332
334
336
338
340
342
344
346
348
350
352
354
356
358
360
362
364 1 3 5 7 9 11 13 15 17 19 21 23 25 27 29 31
Julian Date (1998-1999), 1 tic-mark = 1 day
Dai
ly d
isch
arge
(CFS
)
5.00
6.00
7.00
8.00
9.00
10.00
11.00
Dai
ly d
isch
arge
(nat
ural
log)
Comal Springs Daily Discharge: Smoothed data (3-day)
San Marcos Springs Daily Discharge: Smoothed data (3-day)
Comal Springs Daily Discharge: Unsmoothed data (CFS)
San Marcos Springs Daily Discharge: Unsmoothed data (CFS)
Comal Springs Daily Discharge: Nat. Log Data
San Marcos Springs Daily Discharge: Nat. Log Data

Figure 34. San Marcos Springs predicted discharges using oneestimated parameter and the discharge from Comal Springs
150
200
250
300
350
400
45028
4
287
290
293
296
299
302
305
308
311
314
317
320
323
326
329
332
335
338
341
344
347
350
353
356
359
362
365 3 6 9 12 15 18 21 24 27 30
Julian date (1998-1999)
Dai
ly fl
ow (C
FS)
San Marcos Springs flow: measured valuesSan Marcos Springs flow: predicted values

Figure 35. San Marcos Springs predicted discharges using oneestimated parameter and the water level in monitor well J-17
150
200
250
300
350
400
45028
4
288
292
296
300
304
308
312
316
320
324
328
332
336
340
344
348
352
356
360
364 3 7 11 15 19 23 27 31
Julian date (1998-1999)
Dai
ly fl
ow (C
FS)
San Marcos Springs flow: measured valuesSan Marcos Springs flow: predicted values
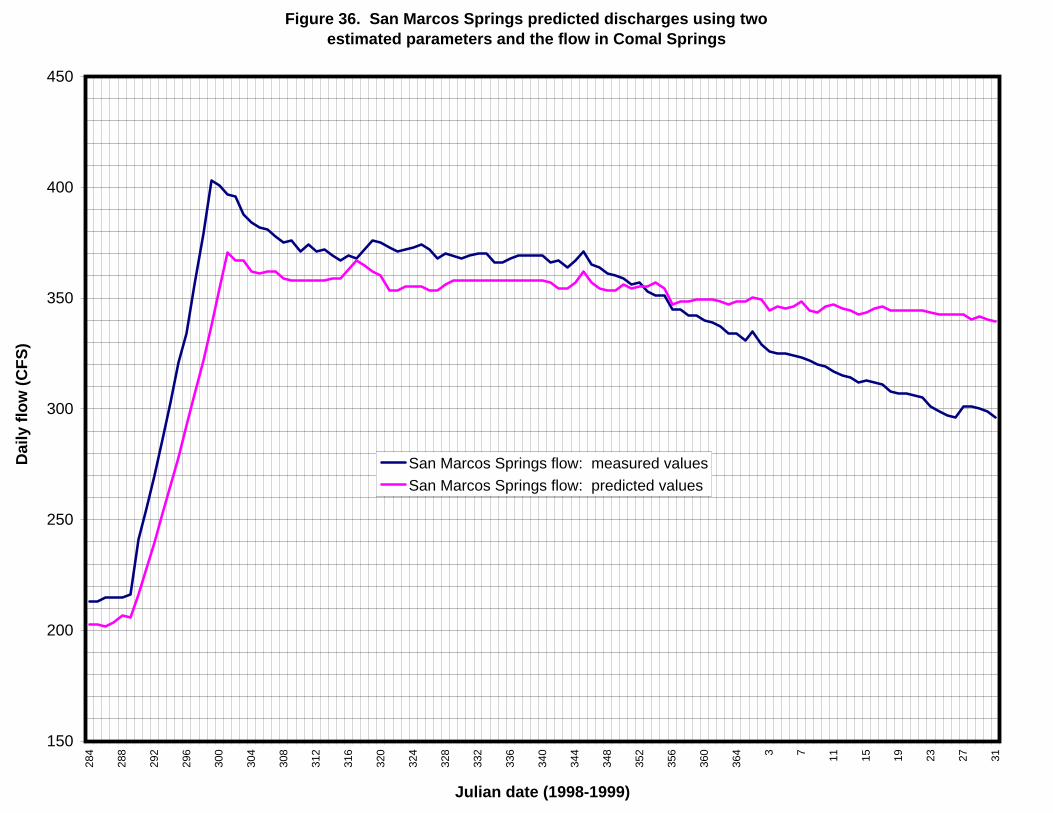
Figure 36. San Marcos Springs predicted discharges using two estimated parameters and the flow in Comal Springs
150
200
250
300
350
400
45028
4
288
292
296
300
304
308
312
316
320
324
328
332
336
340
344
348
352
356
360
364 3 7 11 15 19 23 27 31
Julian date (1998-1999)
Dai
ly fl
ow (C
FS)
San Marcos Springs flow: measured valuesSan Marcos Springs flow: predicted values

Figure 37. San Marcos Springs predicted discharges using four estimated parameters and the flow in Comal Springs, the flow in the Blanco River, and the water level in monitor well J-17
150
200
250
300
350
400
45028
4
288
292
296
300
304
308
312
316
320
324
328
332
336
340
344
348
352
356
360
364 3 7 11 15 19 23 27 31
Julian date (1998-1999)
Dai
ly fl
ow (C
FS)
San Marcos Springs flow: measured valuesSan Marcos Springs flow: predicted values
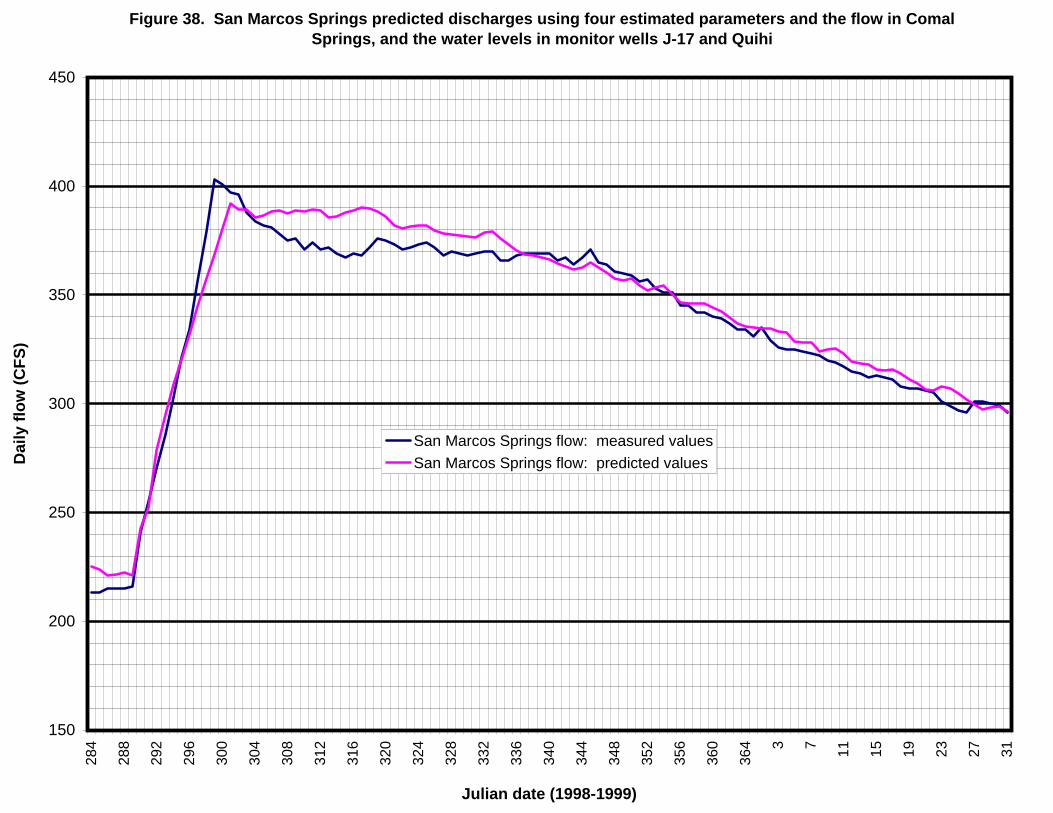
Figure 38. San Marcos Springs predicted discharges using four estimated parameters and the flow in Comal Springs, and the water levels in monitor wells J-17 and Quihi
150
200
250
300
350
400
45028
4
288
292
296
300
304
308
312
316
320
324
328
332
336
340
344
348
352
356
360
364 3 7 11 15 19 23 27 31
Julian date (1998-1999)
Dai
ly fl
ow (C
FS)
San Marcos Springs flow: measured valuesSan Marcos Springs flow: predicted values
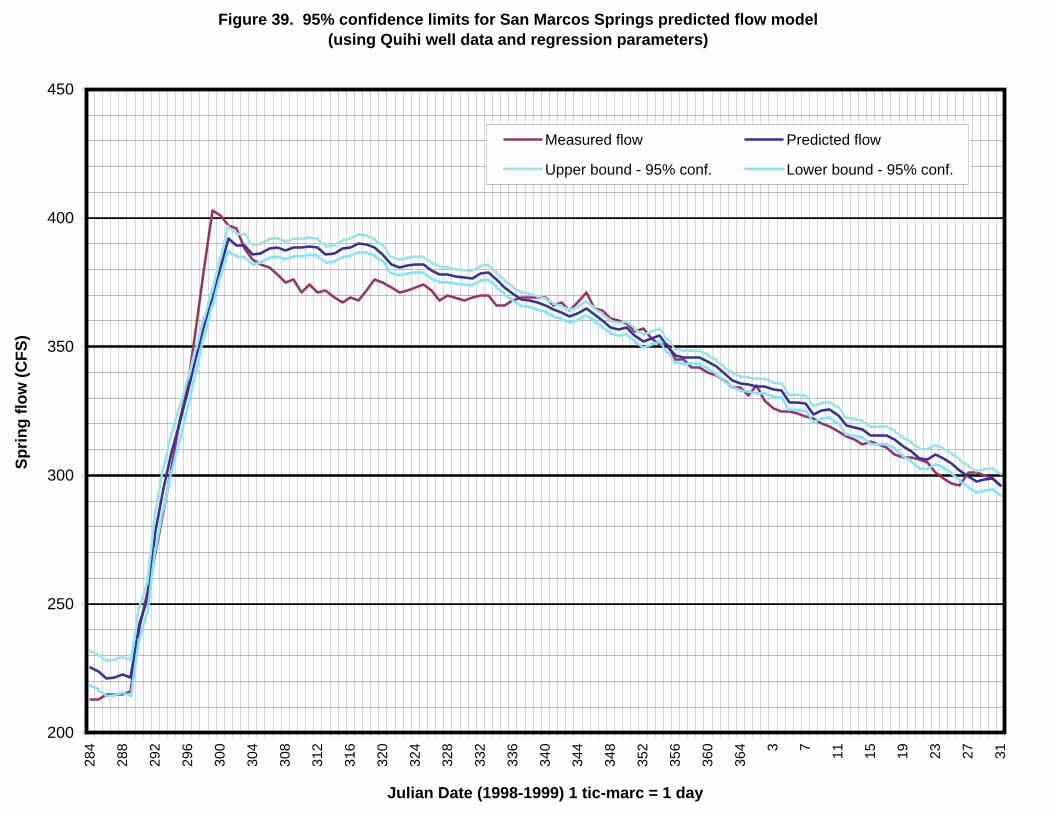
Figure 39. 95% confidence limits for San Marcos Springs predicted flow model(using Quihi well data and regression parameters)
200
250
300
350
400
45028
4
288
292
296
300
304
308
312
316
320
324
328
332
336
340
344
348
352
356
360
364 3 7 11 15 19 23 27 31
Julian Date (1998-1999) 1 tic-marc = 1 day
Sprin
g flo
w (C
FS)
Measured flow Predicted flow
Upper bound - 95% conf. Lower bound - 95% conf.
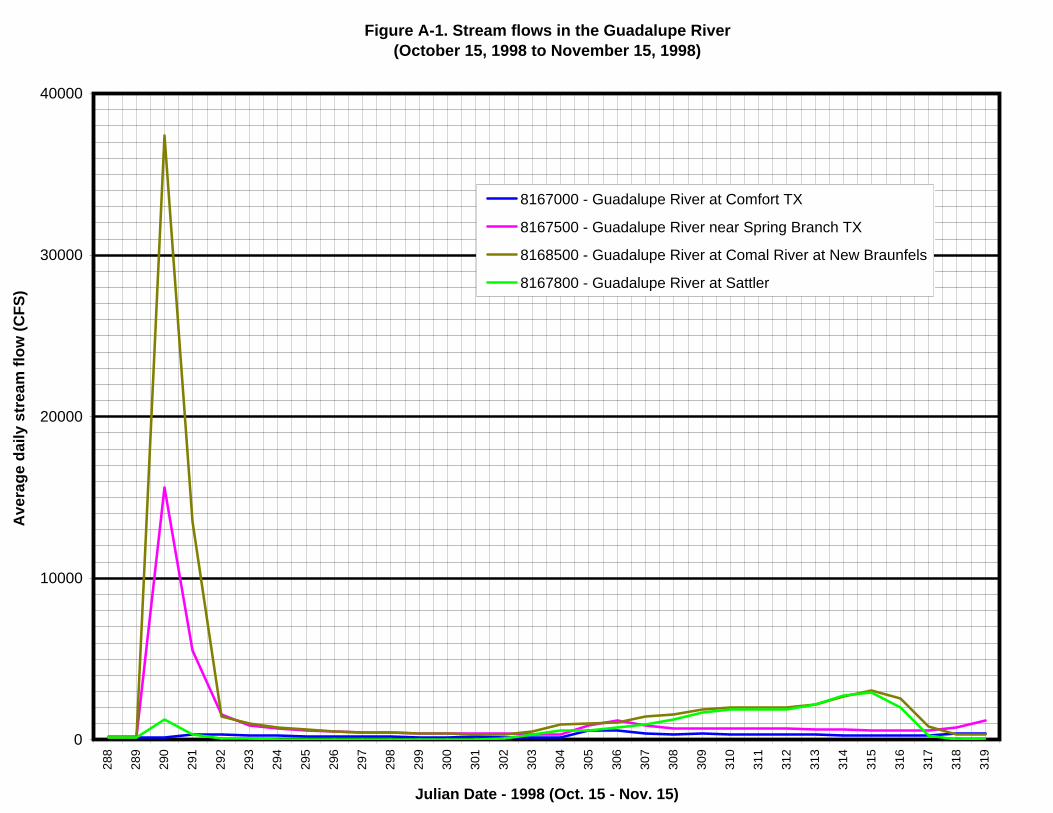
Figure A-1. Stream flows in the Guadalupe River (October 15, 1998 to November 15, 1998)
0
10000
20000
30000
4000028
8
289
290
291
292
293
294
295
296
297
298
299
300
301
302
303
304
305
306
307
308
309
310
311
312
313
314
315
316
317
318
319
Julian Date - 1998 (Oct. 15 - Nov. 15)
Ave
rage
dai
ly s
trea
m fl
ow (C
FS)
8167000 - Guadalupe River at Comfort TX
8167500 - Guadalupe River near Spring Branch TX
8168500 - Guadalupe River at Comal River at New Braunfels
8167800 - Guadalupe River at Sattler

Figure A-2. Stream flows in the Guadalupe River (October 15,1998 to November 15, 1998)
1
10
100
1000
10000
10000028
8
289
290
291
292
293
294
295
296
297
298
299
300
301
302
303
304
305
306
307
308
309
310
311
312
313
314
315
316
317
318
319
Julian Date - 1998 (Oct. 15 - Nov. 15)
Ave
rage
dai
ly s
trea
m fl
ow (C
FS)
8167000 - Guadalupe River at Comfort TX
8167500 - Guadalupe River near Spring Branch TX
8168500 - Guadalupe River at Comal River at New Braunfels
8167800 - Guadalupe River at Sattler
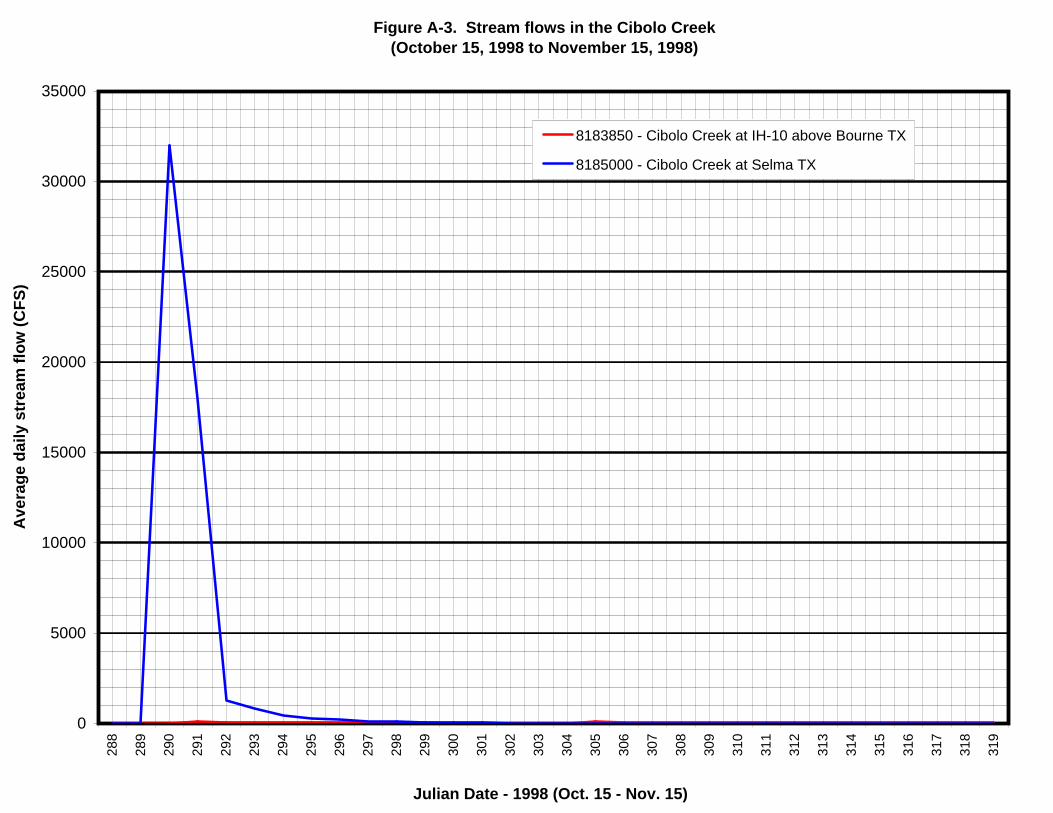
Figure A-3. Stream flows in the Cibolo Creek(October 15, 1998 to November 15, 1998)
0
5000
10000
15000
20000
25000
30000
3500028
8
289
290
291
292
293
294
295
296
297
298
299
300
301
302
303
304
305
306
307
308
309
310
311
312
313
314
315
316
317
318
319
Julian Date - 1998 (Oct. 15 - Nov. 15)
Ave
rage
dai
ly s
trea
m fl
ow (C
FS)
8183850 - Cibolo Creek at IH-10 above Bourne TX
8185000 - Cibolo Creek at Selma TX

Figure A-4. Stream flows in the Cibolo Creek(October 15, 1998 to November 15, 1998)
1
10
100
1000
10000
10000028
8
289
290
291
292
293
294
295
296
297
298
299
300
301
302
303
304
305
306
307
308
309
310
311
312
313
314
315
316
317
318
319
Julian Date - 1998 (Oct. 15 - Nov. 15)
Ave
rage
dai
ly s
trea
m fl
ow (C
FS)
8183850 - Cibolo Creek at IH-10 above Bourne TX
8185000 - Cibolo Creek at Selma TX
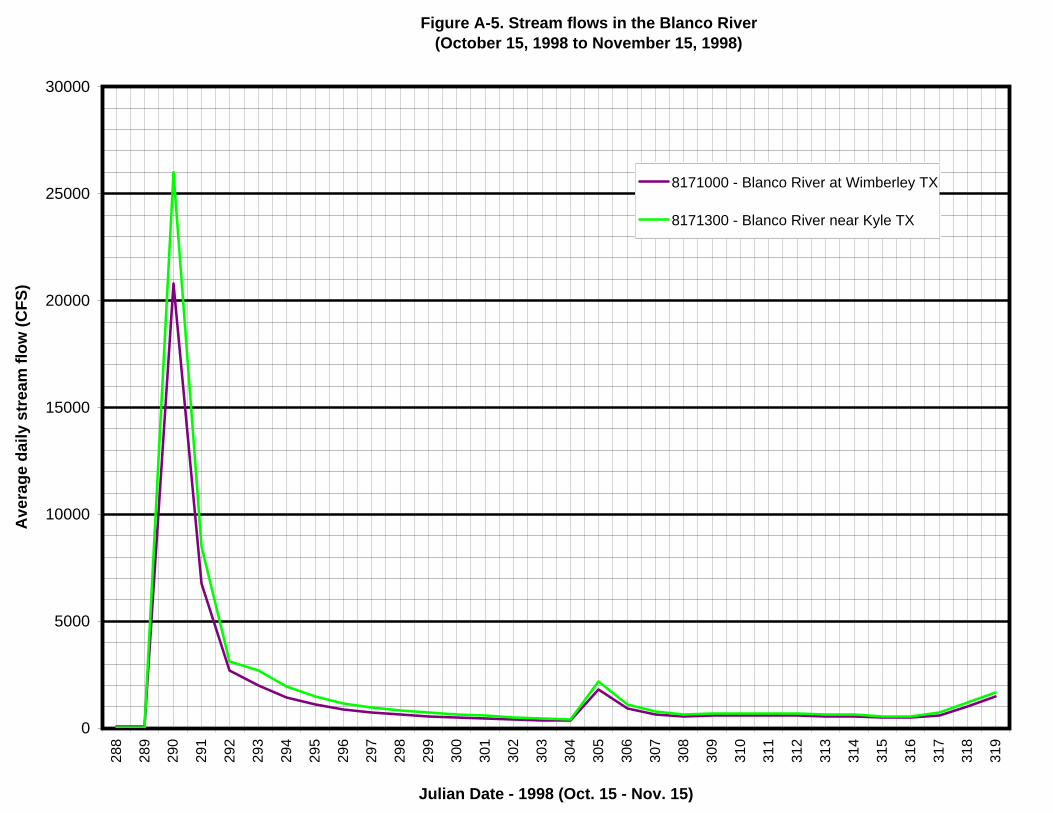
Figure A-5. Stream flows in the Blanco River(October 15, 1998 to November 15, 1998)
0
5000
10000
15000
20000
25000
30000
288
289
290
291
292
293
294
295
296
297
298
299
300
301
302
303
304
305
306
307
308
309
310
311
312
313
314
315
316
317
318
319
Julian Date - 1998 (Oct. 15 - Nov. 15)
Ave
rage
dai
ly s
trea
m fl
ow (C
FS)
8171000 - Blanco River at Wimberley TX
8171300 - Blanco River near Kyle TX
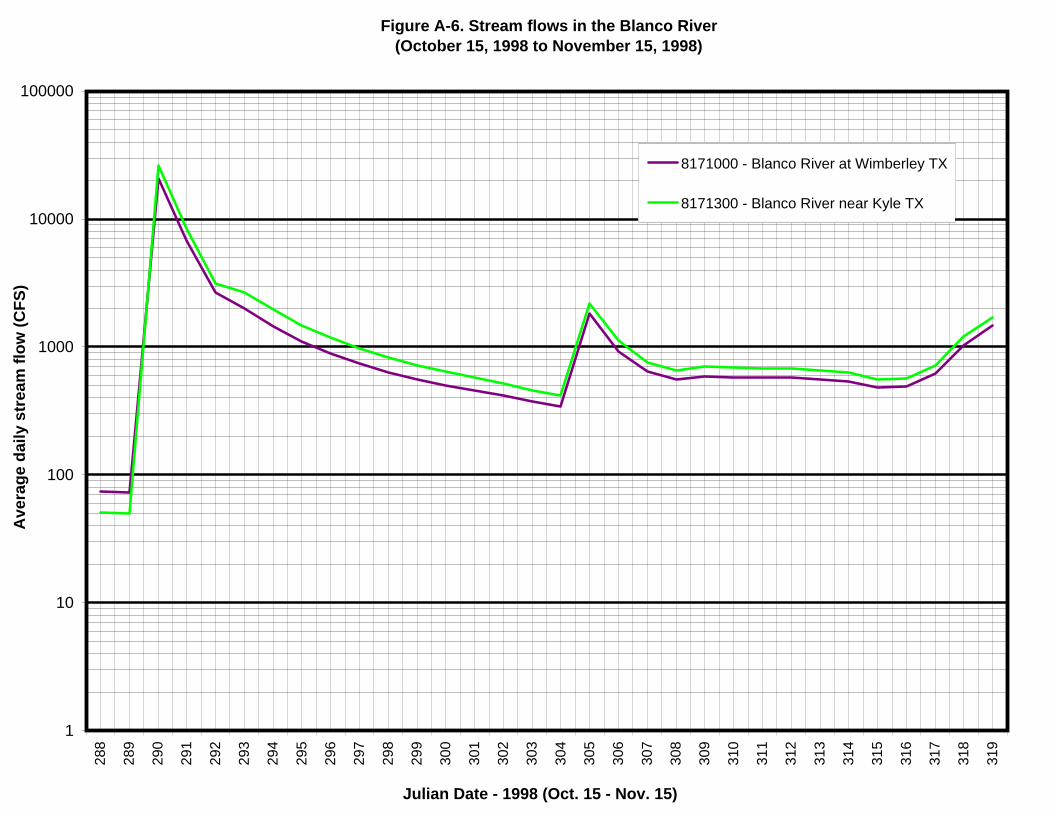
Figure A-6. Stream flows in the Blanco River(October 15, 1998 to November 15, 1998)
1
10
100
1000
10000
10000028
8
289
290
291
292
293
294
295
296
297
298
299
300
301
302
303
304
305
306
307
308
309
310
311
312
313
314
315
316
317
318
319
Julian Date - 1998 (Oct. 15 - Nov. 15)
Ave
rage
dai
ly s
trea
m fl
ow (C
FS)
8171000 - Blanco River at Wimberley TX
8171300 - Blanco River near Kyle TX
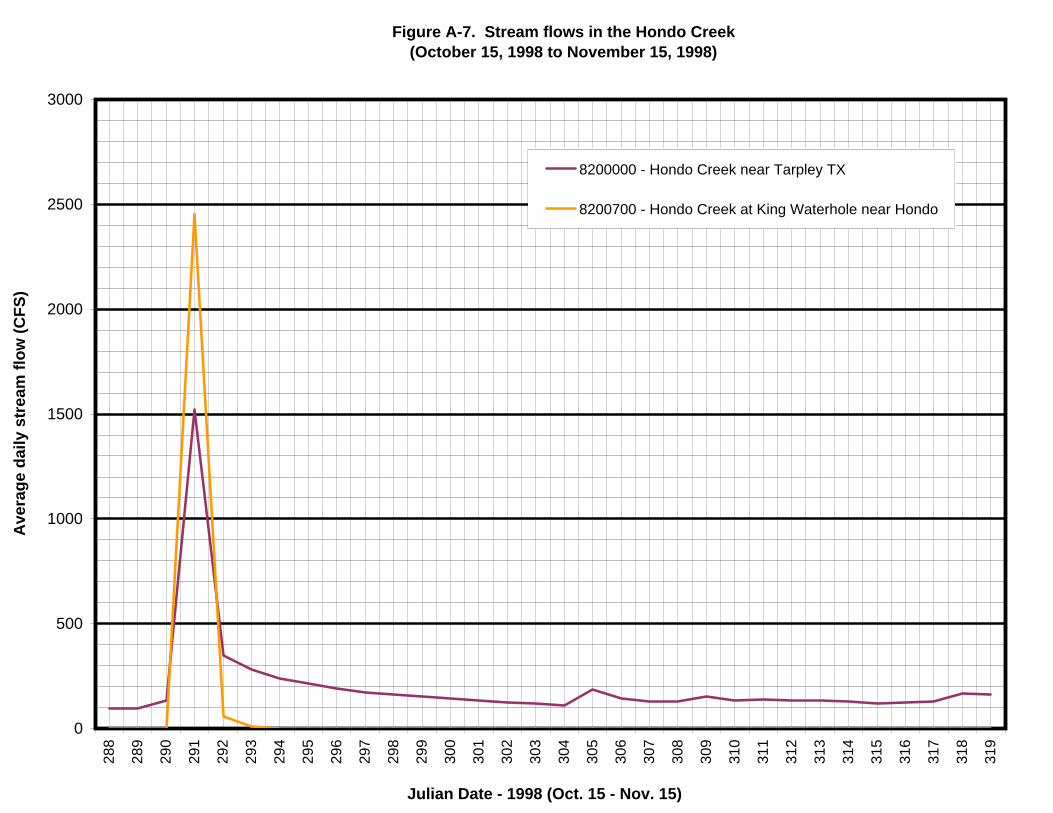
Figure A-7. Stream flows in the Hondo Creek(October 15, 1998 to November 15, 1998)
0
500
1000
1500
2000
2500
300028
8
289
290
291
292
293
294
295
296
297
298
299
300
301
302
303
304
305
306
307
308
309
310
311
312
313
314
315
316
317
318
319
Julian Date - 1998 (Oct. 15 - Nov. 15)
Ave
rage
dai
ly s
trea
m fl
ow (C
FS)
8200000 - Hondo Creek near Tarpley TX
8200700 - Hondo Creek at King Waterhole near Hondo
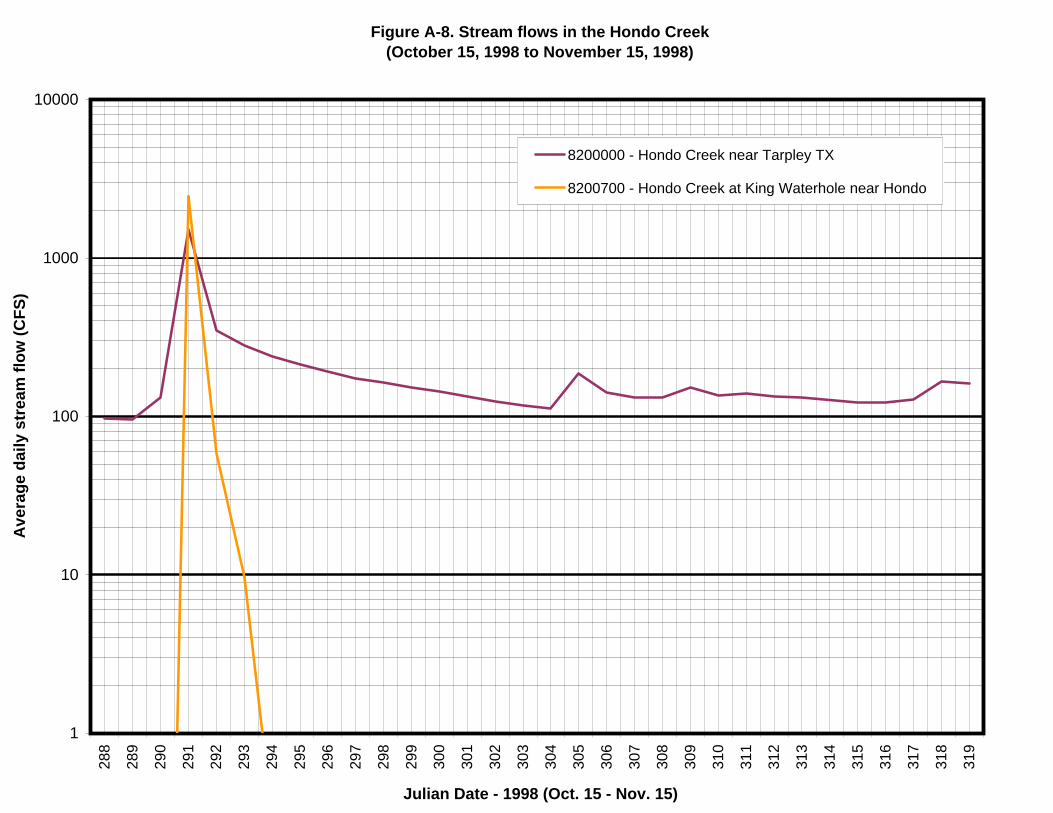
Figure A-8. Stream flows in the Hondo Creek(October 15, 1998 to November 15, 1998)
1
10
100
1000
1000028
8
289
290
291
292
293
294
295
296
297
298
299
300
301
302
303
304
305
306
307
308
309
310
311
312
313
314
315
316
317
318
319
Julian Date - 1998 (Oct. 15 - Nov. 15)
Ave
rage
dai
ly s
trea
m fl
ow (C
FS)
8200000 - Hondo Creek near Tarpley TX
8200700 - Hondo Creek at King Waterhole near Hondo

Figure A-9. Stream flows in the Nueces River(October 15, 1998 to November 15, 1998)
0
500
1000
1500
2000
2500
3000
3500
400028
8
289
290
291
292
293
294
295
296
297
298
299
300
301
302
303
304
305
306
307
308
309
310
311
312
313
314
315
316
317
318
319
Julian Date - 1998 (Oct. 15 - Nov. 15)
Ave
rage
dai
ly s
trea
m fl
ow (C
FS)
8190000 - Nueces River at Laguna TX
8190500 - West Nueces River near Brackettville TX
8192000 - Nueces River below Uvalde TX
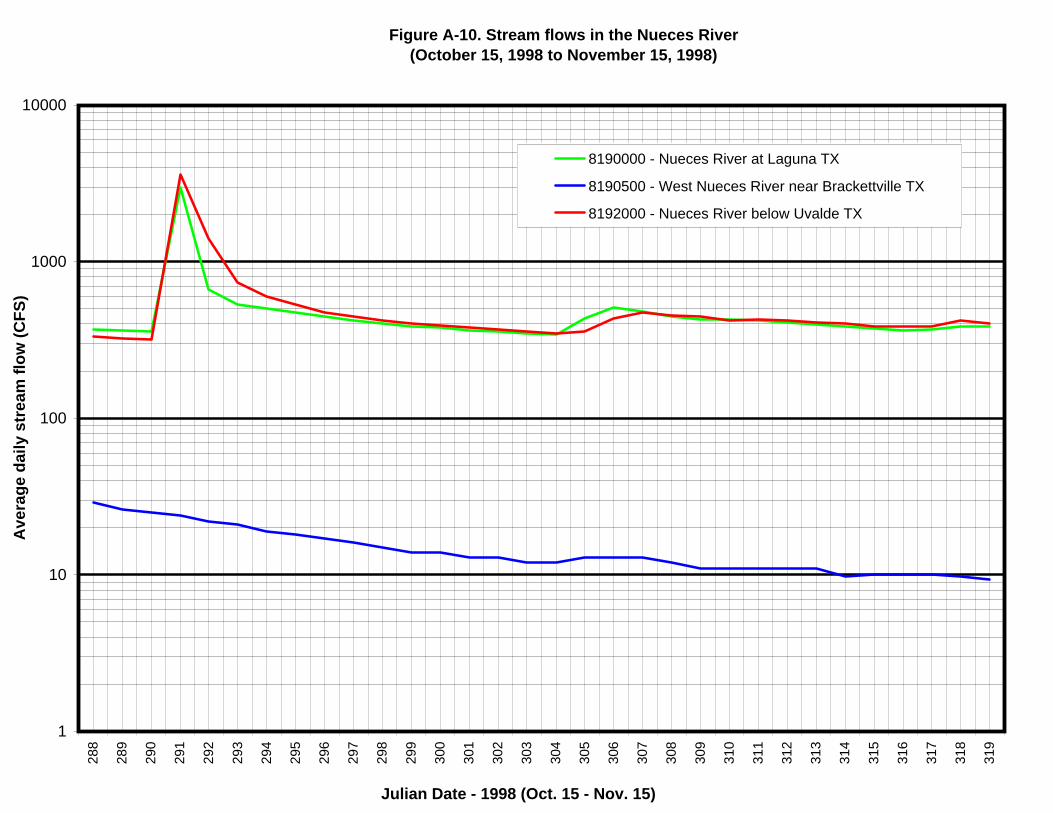
Figure A-10. Stream flows in the Nueces River(October 15, 1998 to November 15, 1998)
1
10
100
1000
1000028
8
289
290
291
292
293
294
295
296
297
298
299
300
301
302
303
304
305
306
307
308
309
310
311
312
313
314
315
316
317
318
319
Julian Date - 1998 (Oct. 15 - Nov. 15)
Ave
rage
dai
ly s
trea
m fl
ow (C
FS)
8190000 - Nueces River at Laguna TX
8190500 - West Nueces River near Brackettville TX
8192000 - Nueces River below Uvalde TX
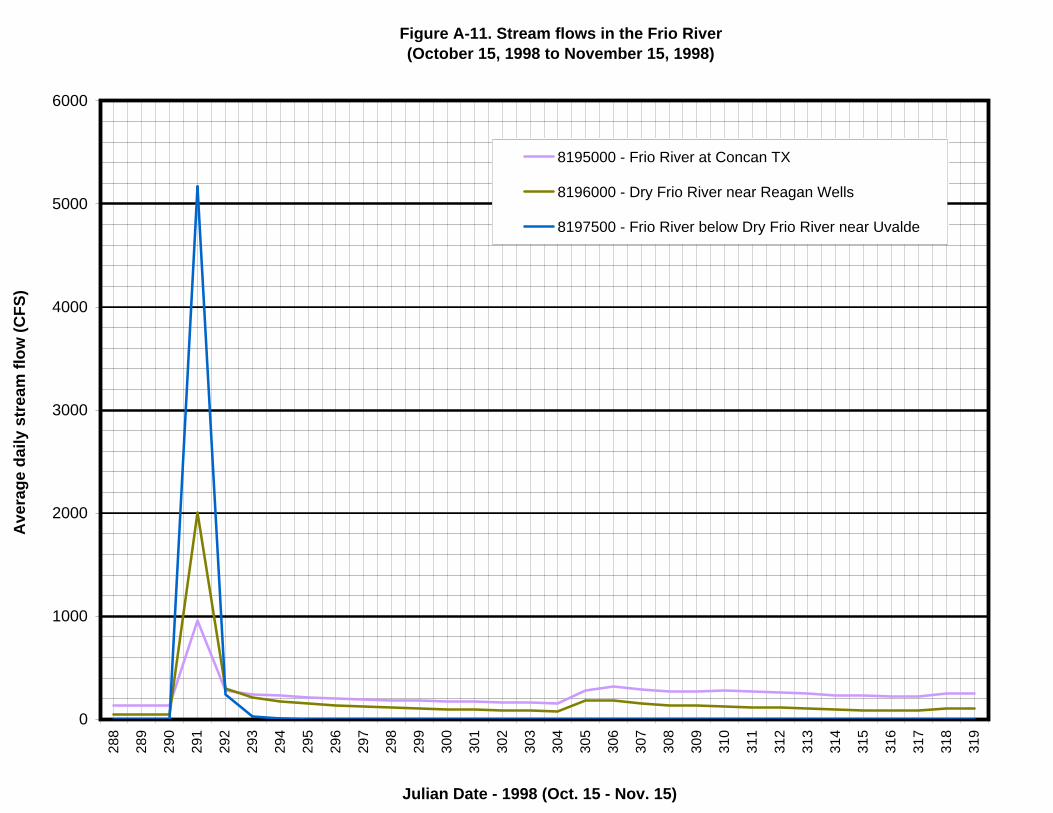
Figure A-11. Stream flows in the Frio River(October 15, 1998 to November 15, 1998)
0
1000
2000
3000
4000
5000
600028
8
289
290
291
292
293
294
295
296
297
298
299
300
301
302
303
304
305
306
307
308
309
310
311
312
313
314
315
316
317
318
319
Julian Date - 1998 (Oct. 15 - Nov. 15)
Ave
rage
dai
ly s
trea
m fl
ow (C
FS)
8195000 - Frio River at Concan TX
8196000 - Dry Frio River near Reagan Wells
8197500 - Frio River below Dry Frio River near Uvalde
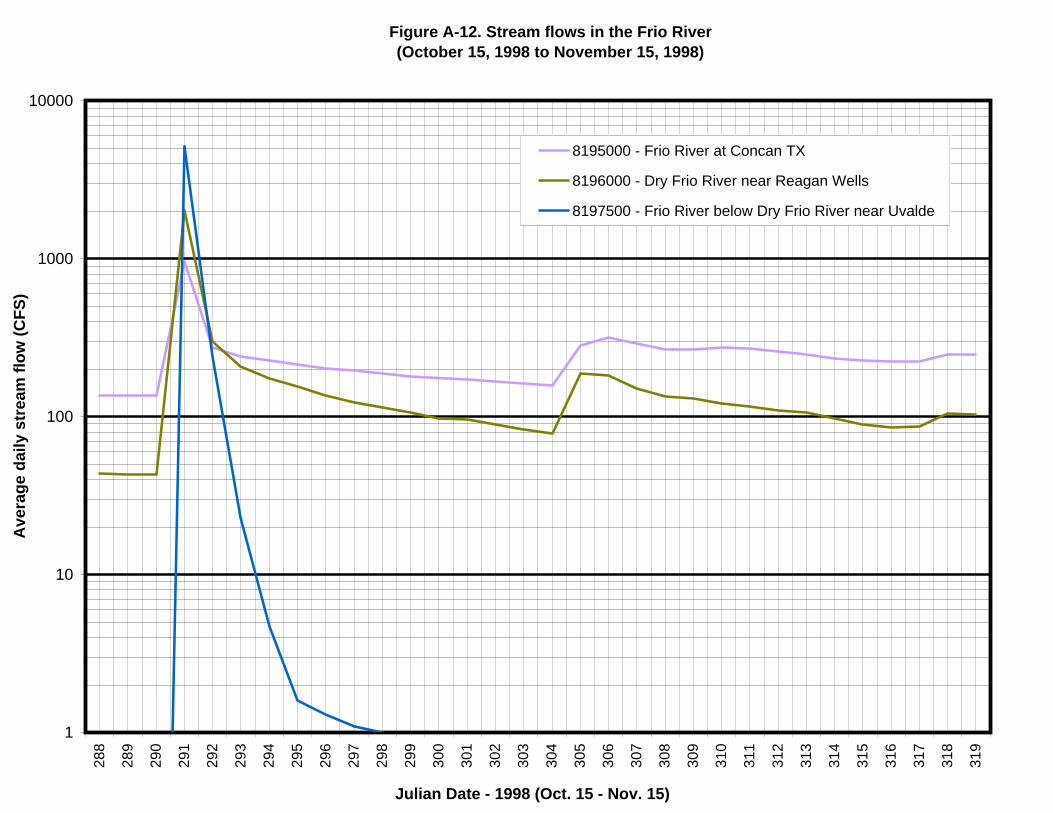
Figure A-12. Stream flows in the Frio River(October 15, 1998 to November 15, 1998)
1
10
100
1000
1000028
8
289
290
291
292
293
294
295
296
297
298
299
300
301
302
303
304
305
306
307
308
309
310
311
312
313
314
315
316
317
318
319
Julian Date - 1998 (Oct. 15 - Nov. 15)
Ave
rage
dai
ly s
trea
m fl
ow (C
FS)
8195000 - Frio River at Concan TX
8196000 - Dry Frio River near Reagan Wells
8197500 - Frio River below Dry Frio River near Uvalde
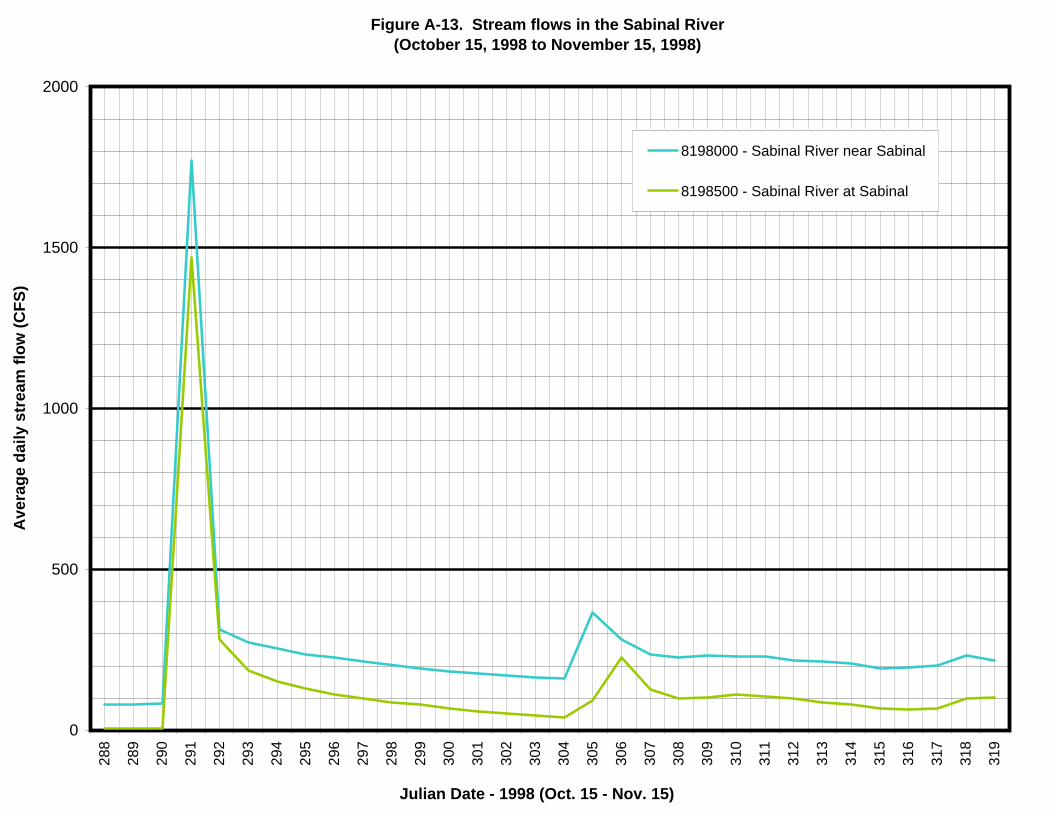
Figure A-13. Stream flows in the Sabinal River(October 15, 1998 to November 15, 1998)
0
500
1000
1500
200028
8
289
290
291
292
293
294
295
296
297
298
299
300
301
302
303
304
305
306
307
308
309
310
311
312
313
314
315
316
317
318
319
Julian Date - 1998 (Oct. 15 - Nov. 15)
Ave
rage
dai
ly s
trea
m fl
ow (C
FS)
8198000 - Sabinal River near Sabinal
8198500 - Sabinal River at Sabinal

Figure A-14. Stream flows in the Sabinal River(October 15, 1998 to November 15, 1998)
1
10
100
1000
1000028
8
289
290
291
292
293
294
295
296
297
298
299
300
301
302
303
304
305
306
307
308
309
310
311
312
313
314
315
316
317
318
319
Julian Date - 1998 (Oct. 15 - Nov. 15)
Ave
rage
dai
ly s
trea
m fl
ow (C
FS)
8198000 - Sabinal River near Sabinal
8198500 - Sabinal River at Sabinal

Figure A-15. Stream flows in the Medina River, Salado Creek, and Plum Creek (October 15, 1998 to November 15, 1998)
0
2000
4000
6000
8000
10000
12000
14000
16000
18000
2000028
8
289
290
291
292
293
294
295
296
297
298
299
300
301
302
303
304
305
306
307
308
309
310
311
312
313
314
315
316
317
318
319
Julian Date - 1998 (Oct. 15 - Nov. 15)
Ave
rage
dai
ly s
trea
m fl
ow (C
FS)
8172400 - Plum Creek at Lockhart TX
8178700 - Salado Creek (upper station) at San Antonio
8178880 - Medina River at Bandera TX
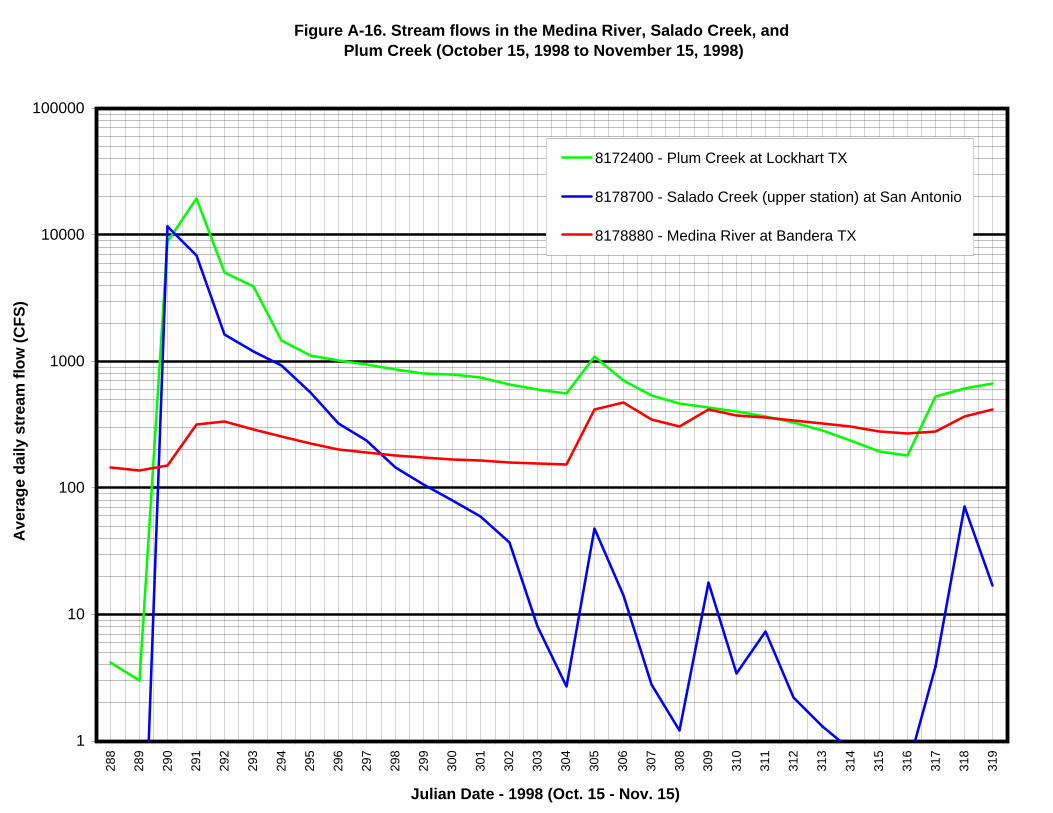
Figure A-16. Stream flows in the Medina River, Salado Creek, and Plum Creek (October 15, 1998 to November 15, 1998)
1
10
100
1000
10000
10000028
8
289
290
291
292
293
294
295
296
297
298
299
300
301
302
303
304
305
306
307
308
309
310
311
312
313
314
315
316
317
318
319
Julian Date - 1998 (Oct. 15 - Nov. 15)
Ave
rage
dai
ly s
trea
m fl
ow (C
FS)
8172400 - Plum Creek at Lockhart TX
8178700 - Salado Creek (upper station) at San Antonio
8178880 - Medina River at Bandera TX

Figure A-17. Stream flows in the Seco Creek(October 15, 1998 to November 15, 1998)
0
500
1000
1500
2000
2500
3000
350028
8
289
290
291
292
293
294
295
296
297
298
299
300
301
302
303
304
305
306
307
308
309
310
311
312
313
314
315
316
317
318
319
Julian Date - 1998 (Oct. 15 - Nov. 15)
Ave
rage
dai
ly s
trea
m fl
ow (C
FS)
8201500 - Seco Creek at Miller Ranch near Utopia TX
8202700 - Seco Creek at Rowe Ranch near D'Hanis TX
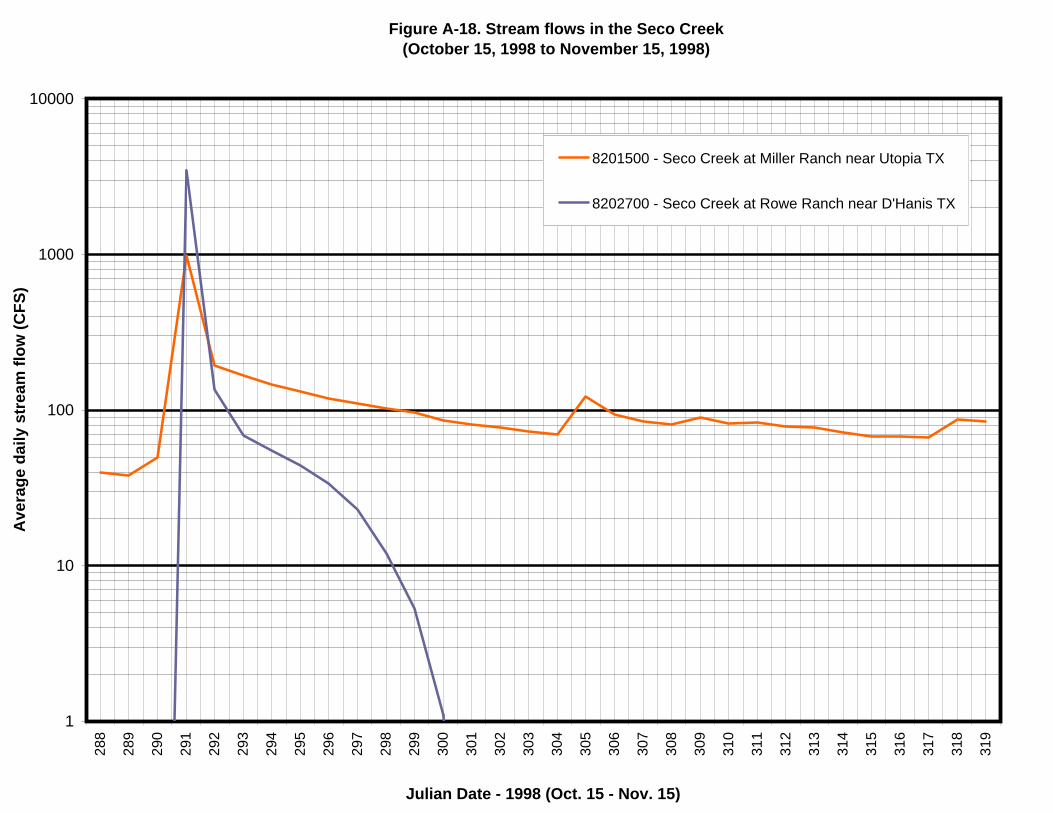
Figure A-18. Stream flows in the Seco Creek(October 15, 1998 to November 15, 1998)
1
10
100
1000
1000028
8
289
290
291
292
293
294
295
296
297
298
299
300
301
302
303
304
305
306
307
308
309
310
311
312
313
314
315
316
317
318
319
Julian Date - 1998 (Oct. 15 - Nov. 15)
Ave
rage
dai
ly s
trea
m fl
ow (C
FS)
8201500 - Seco Creek at Miller Ranch near Utopia TX
8202700 - Seco Creek at Rowe Ranch near D'Hanis TX
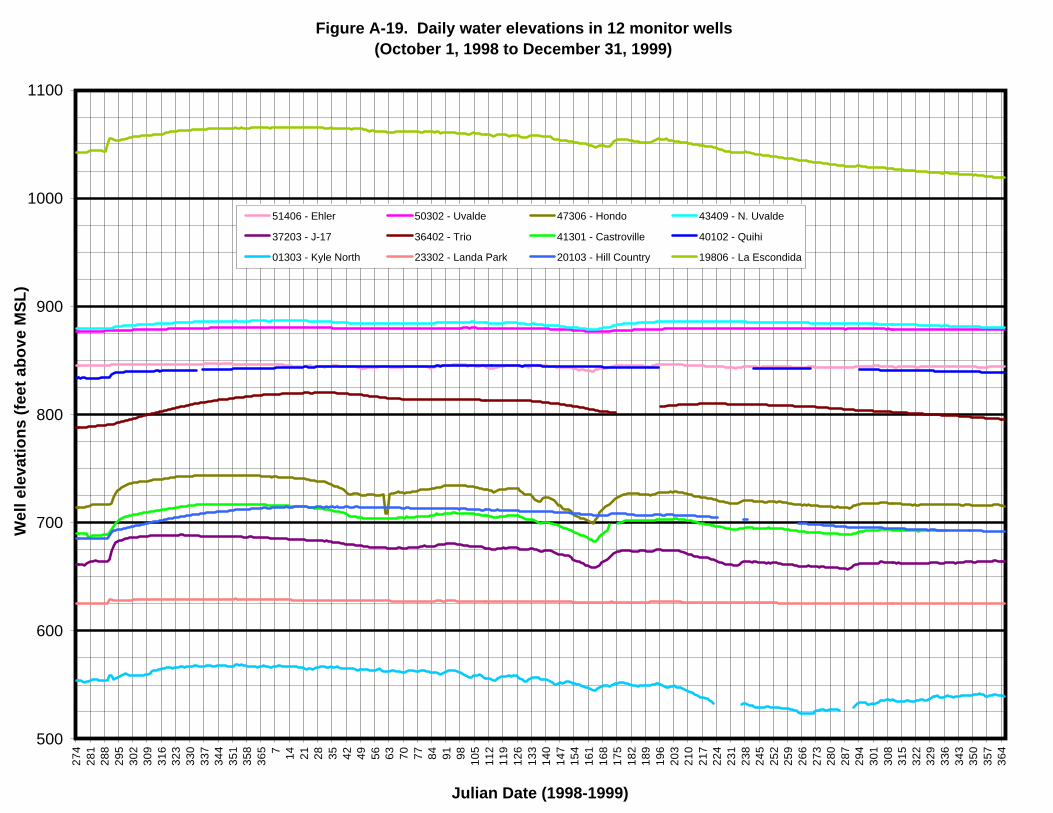
Figure A-19. Daily water elevations in 12 monitor wells(October 1, 1998 to December 31, 1999)
500
600
700
800
900
1000
110027
428
128
829
530
230
931
632
333
033
734
435
135
836
5 7 14 21 28 35 42 49 56 63 70 77 84 91 98 105
112
119
126
133
140
147
154
161
168
175
182
189
196
203
210
217
224
231
238
245
252
259
266
273
280
287
294
301
308
315
322
329
336
343
350
357
364
Julian Date (1998-1999)
Wel
l ele
vatio
ns (f
eet a
bove
MSL
)
51406 - Ehler 50302 - Uvalde 47306 - Hondo 43409 - N. Uvalde
37203 - J-17 36402 - Trio 41301 - Castroville 40102 - Quihi
01303 - Kyle North 23302 - Landa Park 20103 - Hill Country 19806 - La Escondida

Figure A-20. Daily water elevations in monitor well La Escondida(October 1, 1998 to December 31, 1999)
1010
1020
1030
1040
1050
1060
107027
428
128
829
530
230
931
632
333
033
734
435
135
836
5 7 14 21 28 35 42 49 56 63 70 77 84 91 98 105
112
119
126
133
140
147
154
161
168
175
182
189
196
203
210
217
224
231
238
245
252
259
266
273
280
287
294
301
308
315
322
329
336
343
350
357
364
Julian Date (1998-1999)
Wel
l ele
vatio
ns (f
eet a
bove
MSL
)
19806 - La Escondida

Figure A-21. Daily water elevations in monitor wells Ehler, Trio, and Quihi (October 1, 1998 to December 31, 1999)
775
800
825
85027
428
128
829
530
230
931
632
333
033
734
435
135
836
5 7 14 21 28 35 42 49 56 63 70 77 84 91 98 105
112
119
126
133
140
147
154
161
168
175
182
189
196
203
210
217
224
231
238
245
252
259
266
273
280
287
294
301
308
315
322
329
336
343
350
357
364
Julian Date (1998-1999)
Wel
l ele
vatio
ns (f
eet a
bove
MSL
)
51406 - Ehler 36402 - Trio 40102 - Quihi
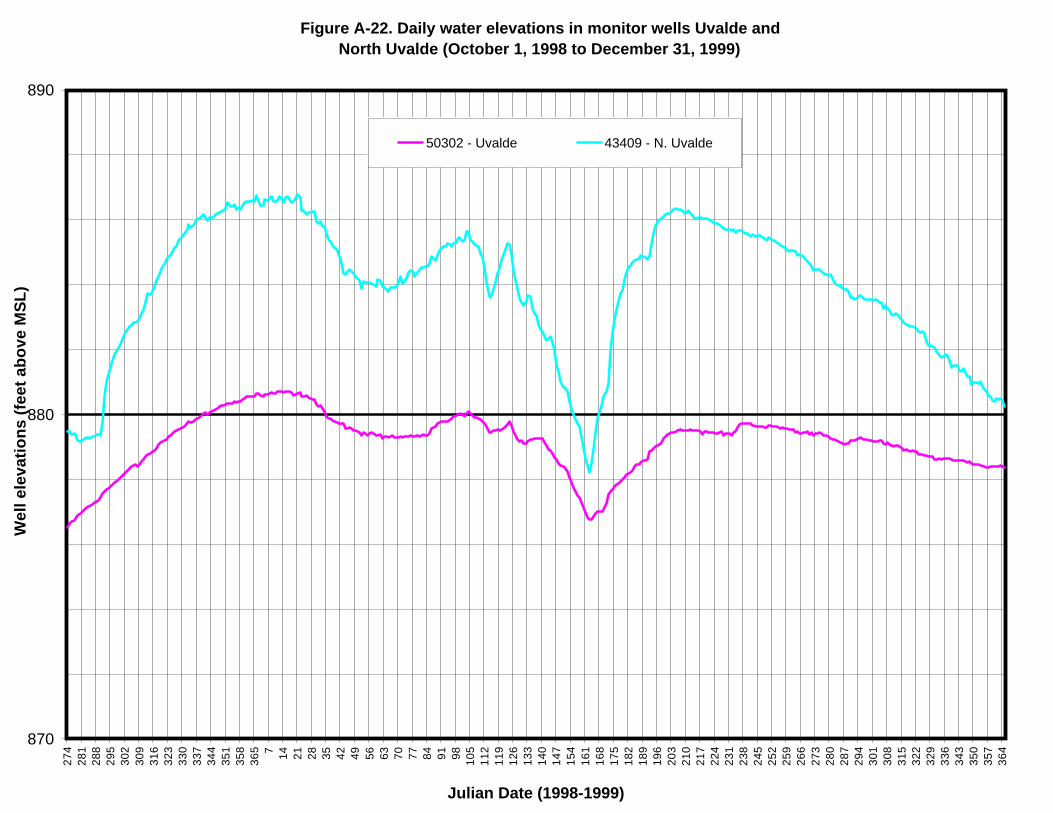
Figure A-22. Daily water elevations in monitor wells Uvalde and North Uvalde (October 1, 1998 to December 31, 1999)
870
880
89027
428
128
829
530
230
931
632
333
033
734
435
135
836
5 7 14 21 28 35 42 49 56 63 70 77 84 91 98 105
112
119
126
133
140
147
154
161
168
175
182
189
196
203
210
217
224
231
238
245
252
259
266
273
280
287
294
301
308
315
322
329
336
343
350
357
364
Julian Date (1998-1999)
Wel
l ele
vatio
ns (f
eet a
bove
MSL
)
50302 - Uvalde 43409 - N. Uvalde

Figure 23. Daily water elevations in monitor wells Ehler and Quihi after removing any data gaps with cubic splining (October 11, 1998 to January 31, 1999)
830
835
840
845
85028
4
287
290
293
296
299
302
305
308
311
314
317
320
323
326
329
332
335
338
341
344
347
350
353
356
359
362
365 3 6 9 12 15 18 21 24 27 30
Julian Date (1998-1999)
Feet
abo
ve M
SL
51405 - Ehler
40102 - Quihi

Figure A-24. Daily water elevations in monitor wells Hondo, J-17, Castroville,and Hill Country (October 1, 1998 to December 31, 1999)
650
660
670
680
690
700
710
720
730
740
75027
428
128
829
530
230
931
632
333
033
734
435
135
836
5 7 14 21 28 35 42 49 56 63 70 77 84 91 98 105
112
119
126
133
140
147
154
161
168
175
182
189
196
203
210
217
224
231
238
245
252
259
266
273
280
287
294
301
308
315
322
329
336
343
350
357
364
Julian Date (1998-1999)
Wel
l ele
vatio
ns (f
eet a
bove
MSL
)
47306 - Hondo 37203 - J-17 41301 - Castroville 20103 - Hill Country
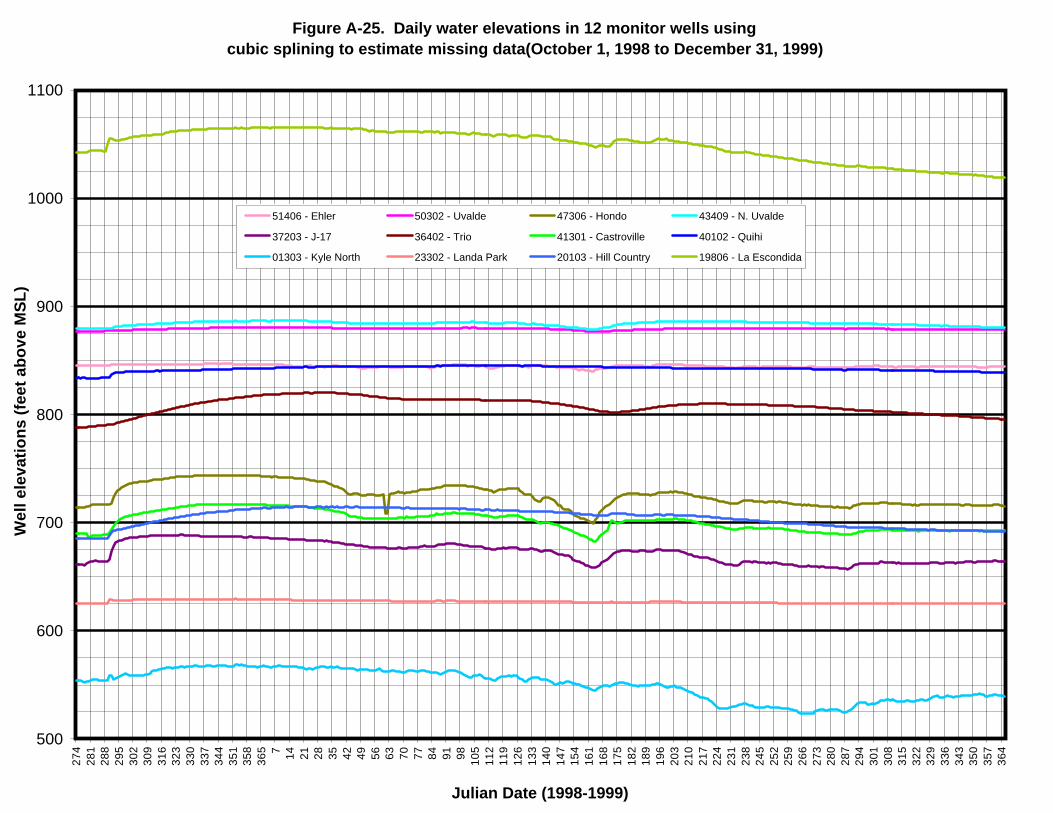
Figure A-25. Daily water elevations in 12 monitor wells using cubic splining to estimate missing data(October 1, 1998 to December 31, 1999)
500
600
700
800
900
1000
110027
428
128
829
530
230
931
632
333
033
734
435
135
836
5 7 14 21 28 35 42 49 56 63 70 77 84 91 98 105
112
119
126
133
140
147
154
161
168
175
182
189
196
203
210
217
224
231
238
245
252
259
266
273
280
287
294
301
308
315
322
329
336
343
350
357
364
Julian Date (1998-1999)
Wel
l ele
vatio
ns (f
eet a
bove
MSL
)
51406 - Ehler 50302 - Uvalde 47306 - Hondo 43409 - N. Uvalde
37203 - J-17 36402 - Trio 41301 - Castroville 40102 - Quihi
01303 - Kyle North 23302 - Landa Park 20103 - Hill Country 19806 - La Escondida

Figure A-26. Daily water elevations in 7 northern monitor wells using cubic splining to estimate missing data (October 1, 1998 to December 31, 1999)
500
600
700
800
900
1000
110027
428
128
829
530
230
931
632
333
033
734
435
135
836
5 7 14 21 28 35 42 49 56 63 70 77 84 91 98 105
112
119
126
133
140
147
154
161
168
175
182
189
196
203
210
217
224
231
238
245
252
259
266
273
280
287
294
301
308
315
322
329
336
343
350
357
364
Julian Date (1998-1999)
Wel
l ele
vatio
ns (f
eet a
bove
MSL
)
50302 - Uvalde 43409 - N. Uvalde 36402 - Trio 40102 - Quihi
01303 - Kyle North 20103 - Hill Country 19806 - La Escondida
Figure A-27. Daily water elevations in 3 southern monitor wells using cubic splining to estimate missing data (October 1, 1998 to December 31, 1999)
600
650
700
750
80027
428
128
829
530
230
931
632
333
033
734
435
135
836
5 7 14 21 28 35 42 49 56 63 70 77 84 91 98 105
112
119
126
133
140
147
154
161
168
175
182
189
196
203
210
217
224
231
238
245
252
259
266
273
280
287
294
301
308
315
322
329
336
343
350
357
364
Julian Date (1998-1999)
Wel
l ele
vatio
ns (f
eet a
bove
MSL
)
37203 - J-17 41301 - Castroville 47306 - Hondo

Figure A-28. Correlation of Blanco River flow gages(11 Oct., 1998 - 31 Jan., 1999)
0
5000
10000
15000
20000
25000
3000028
4
288
292
296
300
304
308
312
316
320
324
328
332
336
340
344
348
352
356
360
364 3 7 11 15 19 23 27 31
Julian Date (1998-1999)
Stre
am fl
ow (C
FS)
Blanco River flow (CFS) - 8171300Blanco River flow (CFS) - 8171000

Figure A-29. Correlogram for cross-correlation of Ehler well (51406) vs. 11 other monitor wells
-0.8
-0.6
-0.4
-0.2
0
0.2
0.4
0.6
0.8-2
0
-19
-18
-17
-16
-15
-14
-13
-12
-11
-10 -9 -8 -7 -6 -5 -4 -3 -2 -1 0 1 2 3 4 5 6 7 8 9 10 11 12 13 14 15 16 17 18 19 20
lag in days (+/-)
cros
s-co
rrel
atio
n va
lue
Ehler VS. 50302 Uvalde Ehler VS. 47306 HondoEhler VS. 43409 N. Uvalde Ehler VS. 37203 J-17Ehler VS. 36402 Trio Ehler VS. 41301 CastrovilleEhler VS. 40102 Quihi Ehler VS. 01303 Kyle NorthEhler VS. 23302 Landa Park Ehler VS. 29103 Hill CountryEhler VS. 19806 La Escondida

Figure A-30. Correlogram for cross-correlation of Uvalde well (51302) vs. 11 other monitor wells
-0.6
-0.4
-0.2
0
0.2
0.4
0.6
0.8
1-2
0
-19
-18
-17
-16
-15
-14
-13
-12
-11
-10 -9 -8 -7 -6 -5 -4 -3 -2 -1 0 1 2 3 4 5 6 7 8 9 10 11 12 13 14 15 16 17 18 19 20
lag in days (+/-)
cros
s-co
rrel
atio
n va
lue
Uvalde VS. 51406 Ehler Uvalde VS. 47306 HondoUvalde VS. 43409 N. Uvalde Uvalde VS. 37203 J-17Uvalde VS. 36402 Trio Uvalde VS. 41301 CastrovilleUvalde VS. 40102 Quihi Uvalde VS. 01303 Kyle NorthUvalde VS. 23302 Landa Park Uvalde VS. 29103 Hill CountryUvalde VS. 19806 La Escondida
Figure A-31. Correlogram for cross-correlation of Hondo well (47306) vs. 11 other monitor wells
-0.4
-0.2
0
0.2
0.4
0.6
0.8
1-2
0
-19
-18
-17
-16
-15
-14
-13
-12
-11
-10 -9 -8 -7 -6 -5 -4 -3 -2 -1 0 1 2 3 4 5 6 7 8 9 10 11 12 13 14 15 16 17 18 19 20
lag in days (+/-)
cros
s-co
rrel
atio
n va
lue
Hondo VS. 51406 Ehler Hondo VS. 50302 UvaldeHondo VS. 43409 N. Uvalde Hondo VS. 37203 J-17Hondo VS. 36402 Trio Hondo VS. 41301 CastrovilleHondo VS. 40102 Quihi Hondo VS. 01303 Kyle NorthHondo VS. 23302 Landa Park Hondo VS. 29103 Hill CountryHondo VS. 19806 La Escondida
Figure A-32. Correlogram for cross-correlation of North Uvalde well (43409) vs. 11 other monitor wells
-0.4
-0.2
0
0.2
0.4
0.6
0.8
1-2
0
-19
-18
-17
-16
-15
-14
-13
-12
-11
-10 -9 -8 -7 -6 -5 -4 -3 -2 -1 0 1 2 3 4 5 6 7 8 9 10 11 12 13 14 15 16 17 18 19 20
lag in days (+/-)
cros
s-co
rrel
atio
n va
lue
N. Uvalde VS. 51406 Ehler N. Uvalde VS. 50302 UvaldeN. Uvalde VS. 47306 Hondo N. Uvalde VS. 37203 J-17N. Uvalde VS. 36402 Trio N. Uvalde VS. 41301 CastrovilleN. Uvalde VS. 40102 Quihi N. Uvalde VS. 01303 Kyle NorthN. Uvalde VS. 23302 Landa Park N. Uvalde VS. 29103 Hill CountryN. Uvalde VS. 19806 La Escondida
Figure A-33. Correlogram for cross-correlation of J-17 well (37203) vs. 11 other monitor wells
-0.4
-0.2
0
0.2
0.4
0.6
0.8
1-2
0
-19
-18
-17
-16
-15
-14
-13
-12
-11
-10 -9 -8 -7 -6 -5 -4 -3 -2 -1 0 1 2 3 4 5 6 7 8 9 10 11 12 13 14 15 16 17 18 19 20
lag in days (+/-)
cros
s-co
rrel
atio
n va
lue
J-17 VS. 51406 Ehler J-17 VS. 50302 UvaldeJ-17 VS. 47306 Hondo J-17 VS. 43409 N. UvaldeJ-17 VS. 36402 Trio J-17 VS. 41301 CastrovilleJ-17 VS. 40102 Quihi J-17 VS. 01303 Kyle NorthJ-17 VS. 23302 Landa Park J-17 VS. 29103 Hill CountryJ-17 VS. 19806 La Escondida
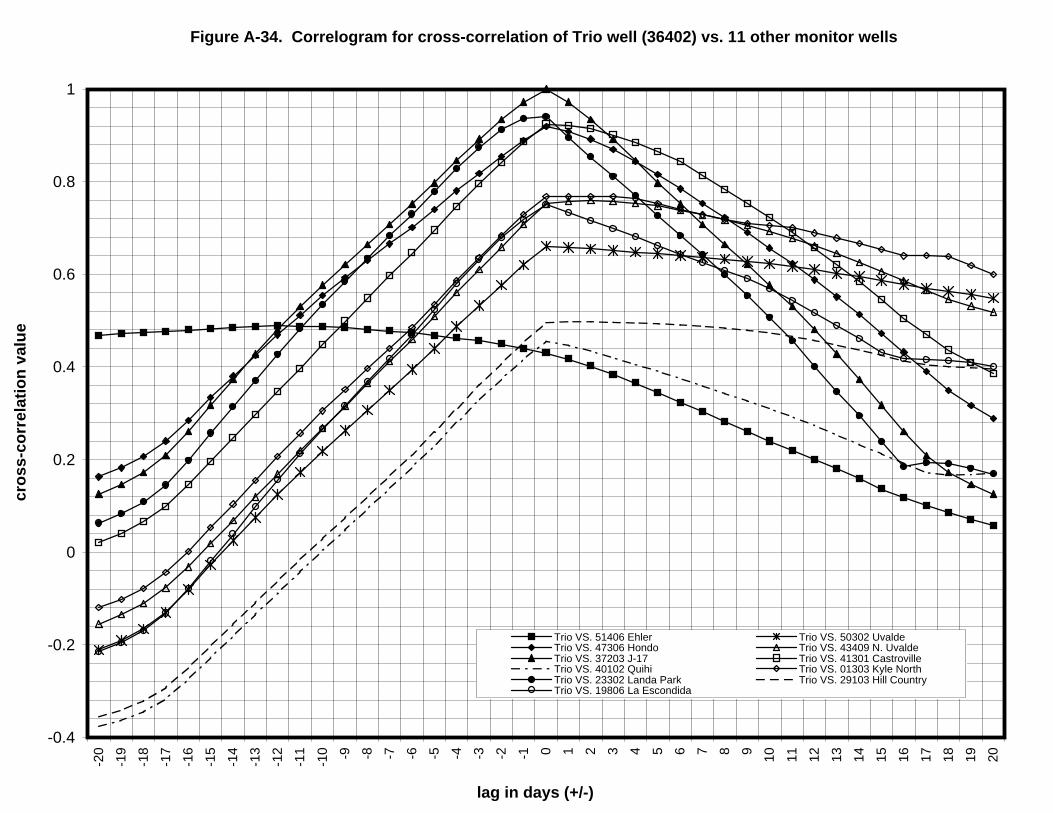
Figure A-34. Correlogram for cross-correlation of Trio well (36402) vs. 11 other monitor wells
-0.4
-0.2
0
0.2
0.4
0.6
0.8
1-2
0
-19
-18
-17
-16
-15
-14
-13
-12
-11
-10 -9 -8 -7 -6 -5 -4 -3 -2 -1 0 1 2 3 4 5 6 7 8 9 10 11 12 13 14 15 16 17 18 19 20
lag in days (+/-)
cros
s-co
rrel
atio
n va
lue
Trio VS. 51406 Ehler Trio VS. 50302 UvaldeTrio VS. 47306 Hondo Trio VS. 43409 N. UvaldeTrio VS. 37203 J-17 Trio VS. 41301 CastrovilleTrio VS. 40102 Quihi Trio VS. 01303 Kyle NorthTrio VS. 23302 Landa Park Trio VS. 29103 Hill CountryTrio VS. 19806 La Escondida
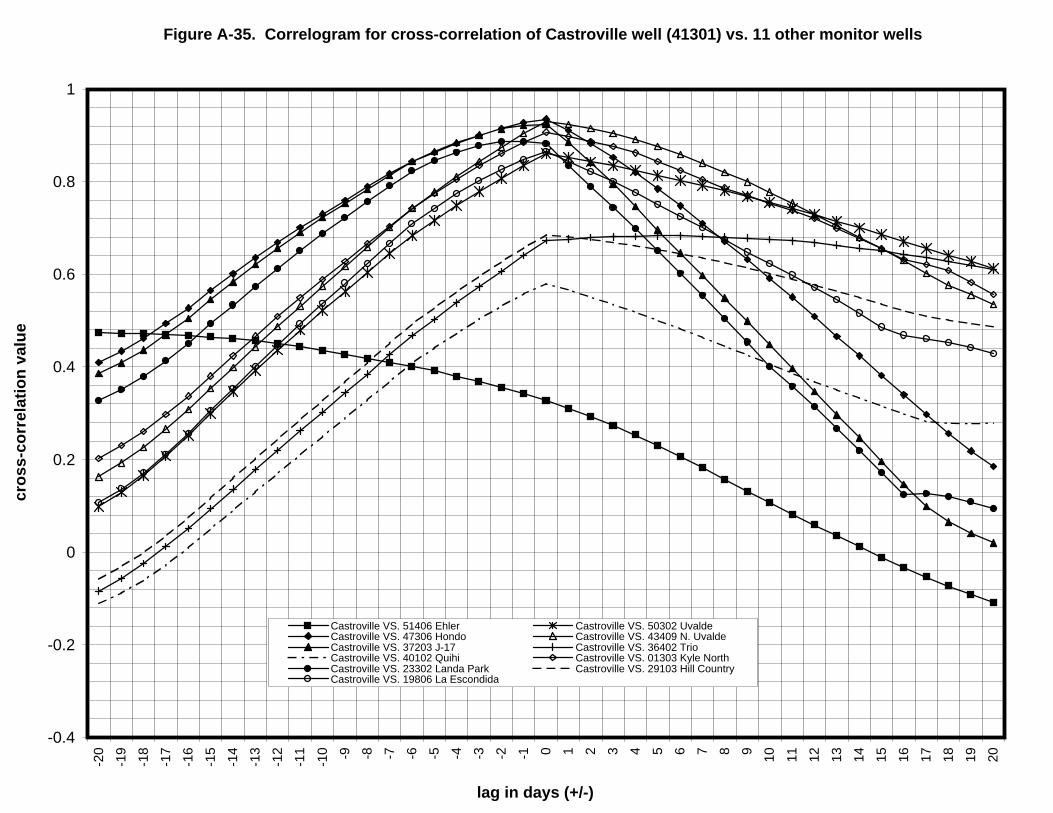
Figure A-35. Correlogram for cross-correlation of Castroville well (41301) vs. 11 other monitor wells
-0.4
-0.2
0
0.2
0.4
0.6
0.8
1-2
0
-19
-18
-17
-16
-15
-14
-13
-12
-11
-10 -9 -8 -7 -6 -5 -4 -3 -2 -1 0 1 2 3 4 5 6 7 8 9 10 11 12 13 14 15 16 17 18 19 20
lag in days (+/-)
cros
s-co
rrel
atio
n va
lue
Castroville VS. 51406 Ehler Castroville VS. 50302 UvaldeCastroville VS. 47306 Hondo Castroville VS. 43409 N. UvaldeCastroville VS. 37203 J-17 Castroville VS. 36402 TrioCastroville VS. 40102 Quihi Castroville VS. 01303 Kyle NorthCastroville VS. 23302 Landa Park Castroville VS. 29103 Hill CountryCastroville VS. 19806 La Escondida
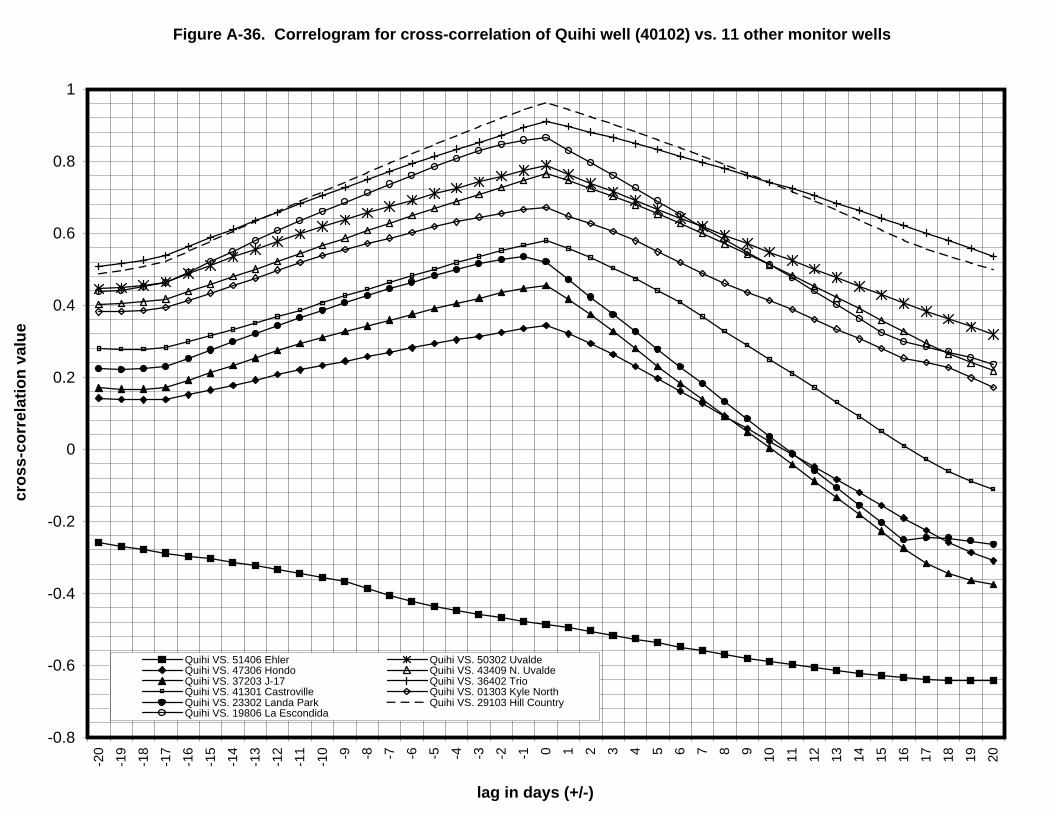
Figure A-36. Correlogram for cross-correlation of Quihi well (40102) vs. 11 other monitor wells
-0.8
-0.6
-0.4
-0.2
0
0.2
0.4
0.6
0.8
1-2
0
-19
-18
-17
-16
-15
-14
-13
-12
-11
-10 -9 -8 -7 -6 -5 -4 -3 -2 -1 0 1 2 3 4 5 6 7 8 9 10 11 12 13 14 15 16 17 18 19 20
lag in days (+/-)
cros
s-co
rrel
atio
n va
lue
Quihi VS. 51406 Ehler Quihi VS. 50302 UvaldeQuihi VS. 47306 Hondo Quihi VS. 43409 N. UvaldeQuihi VS. 37203 J-17 Quihi VS. 36402 TrioQuihi VS. 41301 Castroville Quihi VS. 01303 Kyle NorthQuihi VS. 23302 Landa Park Quihi VS. 29103 Hill CountryQuihi VS. 19806 La Escondida
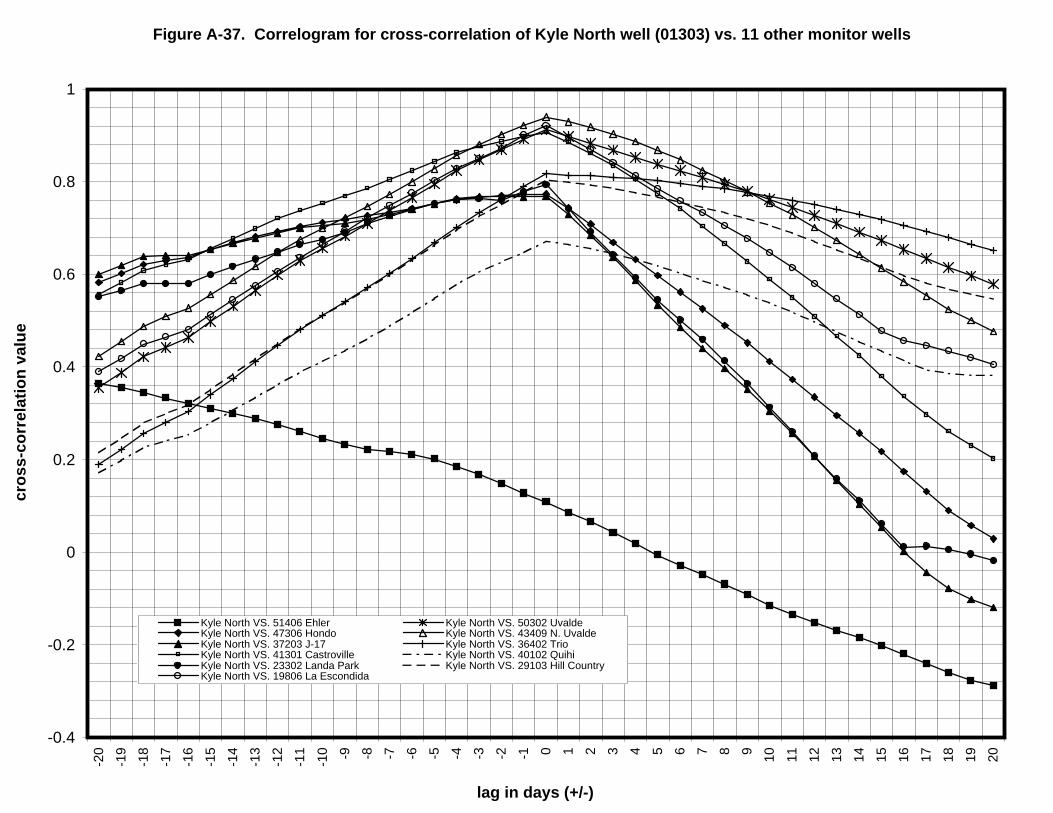
Figure A-37. Correlogram for cross-correlation of Kyle North well (01303) vs. 11 other monitor wells
-0.4
-0.2
0
0.2
0.4
0.6
0.8
1-2
0
-19
-18
-17
-16
-15
-14
-13
-12
-11
-10 -9 -8 -7 -6 -5 -4 -3 -2 -1 0 1 2 3 4 5 6 7 8 9 10 11 12 13 14 15 16 17 18 19 20
lag in days (+/-)
cros
s-co
rrel
atio
n va
lue
Kyle North VS. 51406 Ehler Kyle North VS. 50302 UvaldeKyle North VS. 47306 Hondo Kyle North VS. 43409 N. UvaldeKyle North VS. 37203 J-17 Kyle North VS. 36402 TrioKyle North VS. 41301 Castroville Kyle North VS. 40102 QuihiKyle North VS. 23302 Landa Park Kyle North VS. 29103 Hill CountryKyle North VS. 19806 La Escondida
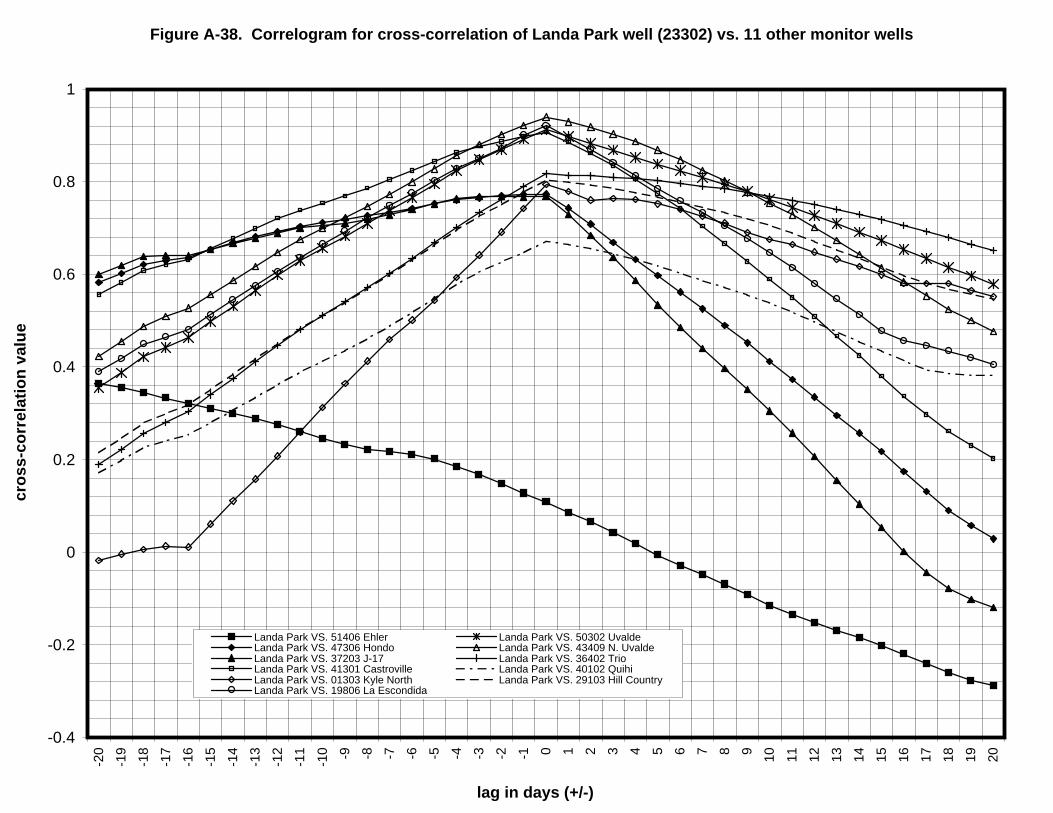
Figure A-38. Correlogram for cross-correlation of Landa Park well (23302) vs. 11 other monitor wells
-0.4
-0.2
0
0.2
0.4
0.6
0.8
1-2
0
-19
-18
-17
-16
-15
-14
-13
-12
-11
-10 -9 -8 -7 -6 -5 -4 -3 -2 -1 0 1 2 3 4 5 6 7 8 9 10 11 12 13 14 15 16 17 18 19 20
lag in days (+/-)
cros
s-co
rrel
atio
n va
lue
Landa Park VS. 51406 Ehler Landa Park VS. 50302 UvaldeLanda Park VS. 47306 Hondo Landa Park VS. 43409 N. UvaldeLanda Park VS. 37203 J-17 Landa Park VS. 36402 TrioLanda Park VS. 41301 Castroville Landa Park VS. 40102 QuihiLanda Park VS. 01303 Kyle North Landa Park VS. 29103 Hill CountryLanda Park VS. 19806 La Escondida
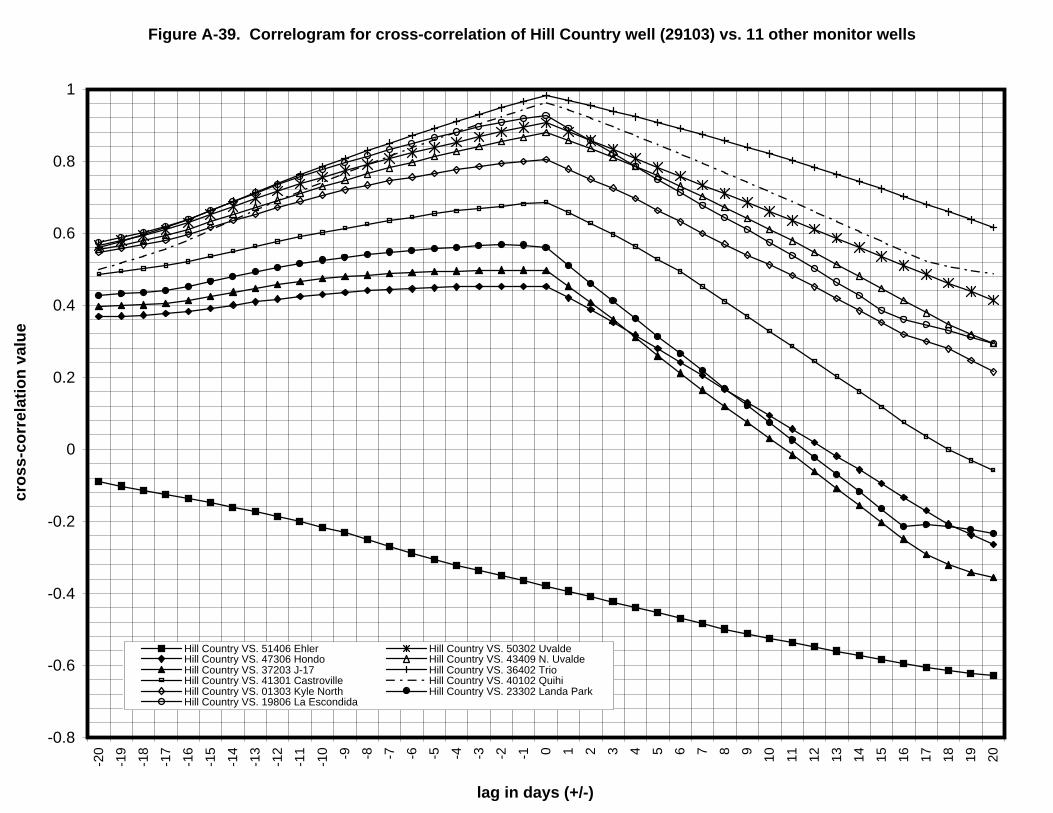
Figure A-39. Correlogram for cross-correlation of Hill Country well (29103) vs. 11 other monitor wells
-0.8
-0.6
-0.4
-0.2
0
0.2
0.4
0.6
0.8
1-2
0
-19
-18
-17
-16
-15
-14
-13
-12
-11
-10 -9 -8 -7 -6 -5 -4 -3 -2 -1 0 1 2 3 4 5 6 7 8 9 10 11 12 13 14 15 16 17 18 19 20
lag in days (+/-)
cros
s-co
rrel
atio
n va
lue
Hill Country VS. 51406 Ehler Hill Country VS. 50302 UvaldeHill Country VS. 47306 Hondo Hill Country VS. 43409 N. UvaldeHill Country VS. 37203 J-17 Hill Country VS. 36402 TrioHill Country VS. 41301 Castroville Hill Country VS. 40102 QuihiHill Country VS. 01303 Kyle North Hill Country VS. 23302 Landa ParkHill Country VS. 19806 La Escondida

Figure A-40. Correlogram for cross-correlation of La Escondida well (19806) vs. 11 other monitor wells
-0.6
-0.4
-0.2
0
0.2
0.4
0.6
0.8
1-2
0
-19
-18
-17
-16
-15
-14
-13
-12
-11
-10 -9 -8 -7 -6 -5 -4 -3 -2 -1 0 1 2 3 4 5 6 7 8 9 10 11 12 13 14 15 16 17 18 19 20
lag in days (+/-)
cros
s-co
rrel
atio
n va
lue
La Escondida VS. 51406 Ehler La Escondida VS. 50302 UvaldeLa Escondida VS. 47306 Hondo La Escondida VS. 43409 N. UvaldeLa Escondida VS. 37203 J-17 La Escondida VS. 41301 CastrovilleLa Escondida VS. 36402 Trio La Escondida VS. 40102 QuihiLa Escondida VS. 01303 Kyle North La Escondida VS. 23302 Landa ParkLa Escondida VS. 29103 Hill Country
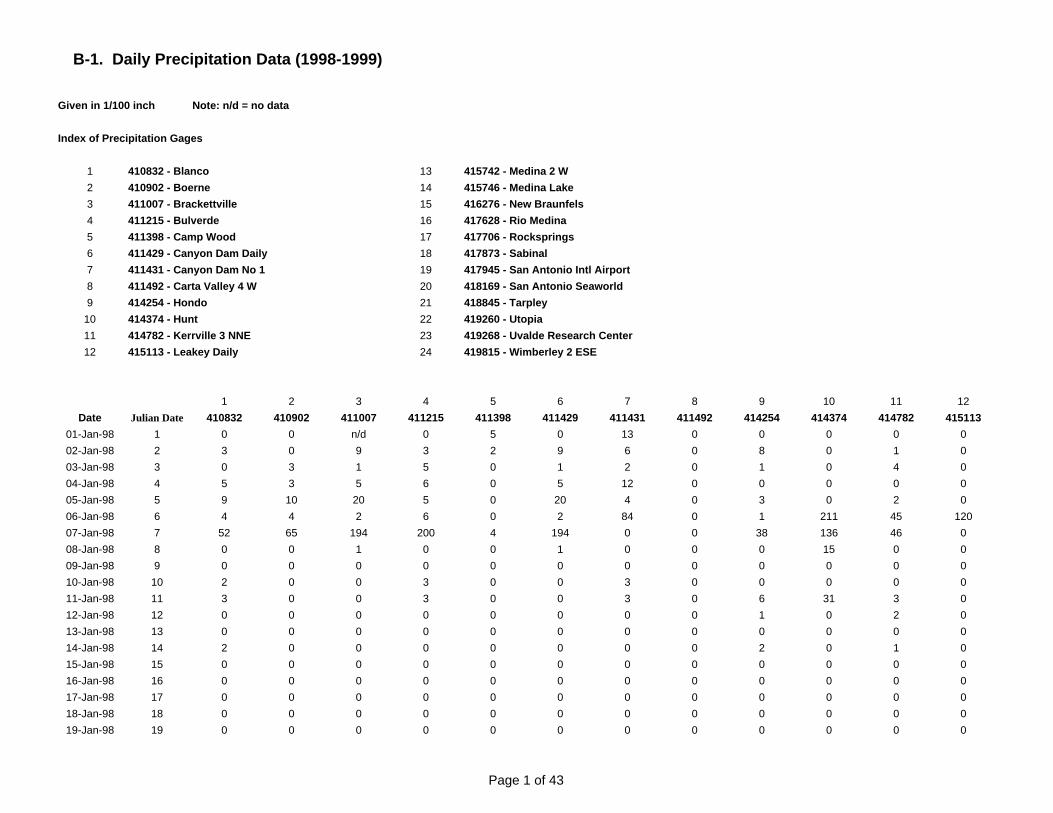
B-1. Daily Precipitation Data (1998-1999)
Given in 1/100 inch Note: n/d = no data
Index of Precipitation Gages
1 410832 - Blanco 13 415742 - Medina 2 W2 410902 - Boerne 14 415746 - Medina Lake3 411007 - Brackettville 15 416276 - New Braunfels4 411215 - Bulverde 16 417628 - Rio Medina5 411398 - Camp Wood 17 417706 - Rocksprings6 411429 - Canyon Dam Daily 18 417873 - Sabinal7 411431 - Canyon Dam No 1 19 417945 - San Antonio Intl Airport8 411492 - Carta Valley 4 W 20 418169 - San Antonio Seaworld9 414254 - Hondo 21 418845 - Tarpley
10 414374 - Hunt 22 419260 - Utopia11 414782 - Kerrville 3 NNE 23 419268 - Uvalde Research Center12 415113 - Leakey Daily 24 419815 - Wimberley 2 ESE
1 2 3 4 5 6 7 8 9 10 11 12Date Julian Date 410832 410902 411007 411215 411398 411429 411431 411492 414254 414374 414782 415113
01-Jan-98 1 0 0 n/d 0 5 0 13 0 0 0 0 002-Jan-98 2 3 0 9 3 2 9 6 0 8 0 1 003-Jan-98 3 0 3 1 5 0 1 2 0 1 0 4 004-Jan-98 4 5 3 5 6 0 5 12 0 0 0 0 005-Jan-98 5 9 10 20 5 0 20 4 0 3 0 2 006-Jan-98 6 4 4 2 6 0 2 84 0 1 211 45 12007-Jan-98 7 52 65 194 200 4 194 0 0 38 136 46 008-Jan-98 8 0 0 1 0 0 1 0 0 0 15 0 009-Jan-98 9 0 0 0 0 0 0 0 0 0 0 0 010-Jan-98 10 2 0 0 3 0 0 3 0 0 0 0 011-Jan-98 11 3 0 0 3 0 0 3 0 6 31 3 012-Jan-98 12 0 0 0 0 0 0 0 0 1 0 2 013-Jan-98 13 0 0 0 0 0 0 0 0 0 0 0 014-Jan-98 14 2 0 0 0 0 0 0 0 2 0 1 015-Jan-98 15 0 0 0 0 0 0 0 0 0 0 0 016-Jan-98 16 0 0 0 0 0 0 0 0 0 0 0 017-Jan-98 17 0 0 0 0 0 0 0 0 0 0 0 018-Jan-98 18 0 0 0 0 0 0 0 0 0 0 0 019-Jan-98 19 0 0 0 0 0 0 0 0 0 0 0 0
Page 1 of 43

B-1. Daily Precipitation Data (1998-1999)
1 2 3 4 5 6 7 8 9 10 11 12Date Julian Date 410832 410902 411007 411215 411398 411429 411431 411492 414254 414374 414782 415113
20-Jan-98 20 0 0 0 0 0 0 0 0 0 0 0 021-Jan-98 21 0 0 0 0 0 0 0 0 0 0 0 022-Jan-98 22 0 0 0 0 0 0 0 0 0 0 0 023-Jan-98 23 0 0 0 0 0 0 0 0 0 0 0 024-Jan-98 24 0 0 0 0 0 0 0 0 0 0 0 025-Jan-98 25 0 0 0 0 0 0 0 0 0 0 0 026-Jan-98 26 0 0 0 0 0 0 0 0 0 0 0 027-Jan-98 27 0 0 0 0 0 0 0 0 0 0 0 028-Jan-98 28 0 0 0 0 0 0 0 0 0 0 0 029-Jan-98 29 0 0 0 0 0 0 0 0 0 0 0 030-Jan-98 30 0 0 0 0 0 0 48 0 0 0 0 031-Jan-98 31 82 153 64 106 150 64 133 225 27 151 52 25001-Feb-98 32 215 184 259 128 0 259 0 5 129 25 85 002-Feb-98 33 0 0 0 0 0 0 0 0 0 0 0 003-Feb-98 34 0 0 0 0 0 0 0 0 0 0 0 004-Feb-98 35 0 0 0 0 0 0 14 0 0 0 0 005-Feb-98 36 22 17 4 7 9 4 33 18 10 0 24 006-Feb-98 37 0 0 14 8 0 14 0 0 0 2 3 007-Feb-98 38 0 0 1 0 0 1 0 0 0 0 0 008-Feb-98 39 0 0 0 0 0 0 0 0 0 0 0 009-Feb-98 40 0 0 0 0 0 0 13 0 0 0 0 010-Feb-98 41 6 12 10 5 20 10 15 15 14 34 84 5011-Feb-98 42 18 24 12 16 0 12 0 0 5 0 10 012-Feb-98 43 0 0 0 124 0 0 0 0 0 0 0 013-Feb-98 44 16 18 29 0 0 29 0 0 0 0 3 014-Feb-98 45 0 0 73 0 11 73 75 20 34 0 0 015-Feb-98 46 106 123 42 0 0 42 58 0 102 23 12 016-Feb-98 47 38 22 64 55 28 64 0 50 48 0 10 017-Feb-98 48 0 0 0 0 0 0 0 0 0 0 0 018-Feb-98 49 0 0 0 0 0 0 0 0 0 0 0 019-Feb-98 50 2 0 0 0 0 0 0 0 0 0 0 020-Feb-98 51 0 0 0 0 0 0 0 0 0 0 0 021-Feb-98 52 0 0 0 0 0 0 94 0 0 3 0 022-Feb-98 53 114 208 77 123 52 77 0 0 15 147 83 023-Feb-98 54 0 0 0 0 0 0 0 0 0 0 0 024-Feb-98 55 0 0 0 0 0 0 0 0 0 0 0 025-Feb-98 56 0 0 0 0 0 0 84 0 n/d 2 0 0
Page 2 of 43

B-1. Daily Precipitation Data (1998-1999)
1 2 3 4 5 6 7 8 9 10 11 12Date Julian Date 410832 410902 411007 411215 411398 411429 411431 411492 414254 414374 414782 415113
26-Feb-98 57 54 83 56 121 33 56 0 20 35 30 38 6727-Feb-98 58 0 0 0 0 0 0 0 0 0 0 0 028-Feb-98 59 0 0 0 0 0 0 0 0 0 0 0 001-Mar-98 60 0 0 0 0 0 0 0 0 0 0 0 002-Mar-98 61 0 0 0 0 0 0 0 0 0 0 0 004-Mar-98 62 0 0 0 0 0 0 0 0 0 0 0 005-Mar-98 63 0 0 0 0 0 0 0 0 0 0 0 006-Mar-98 64 4 0 2 0 0 2 0 0 0 1 1 007-Mar-98 65 1 2 0 0 0 0 3 0 0 0 0 008-Mar-98 66 4 5 2 7 3 2 33 0 3 0 2 009-Mar-98 67 8 14 40 0 7 40 0 0 2 9 4 010-Mar-98 68 0 0 0 0 0 0 0 0 0 0 0 011-Mar-98 69 0 0 0 0 0 0 0 0 0 0 0 012-Mar-98 70 0 0 0 0 0 0 0 0 0 0 0 013-Mar-98 71 0 0 0 0 0 0 20 0 0 0 0 014-Mar-98 72 2 18 19 25 15 19 42 0 28 4 5 014-Mar-98 73 23 59 42 95 10 42 40 0 36 9 20 015-Mar-98 74 37 68 38 0 15 38 215 0 33 0 24 23016-Mar-98 75 208 400 166 233 107 166 0 215 264 201 198 017-Mar-98 76 0 0 0 0 0 0 0 0 0 0 0 018-Mar-98 77 0 0 0 0 0 0 3 0 4 0 0 019-Mar-98 78 18 15 4 0 0 4 0 0 0 0 7 020-Mar-98 79 0 0 0 0 0 0 0 0 0 0 0 021-Mar-98 80 0 0 0 0 0 0 0 0 0 0 0 022-Mar-98 81 0 0 0 0 0 0 0 0 0 0 0 023-Mar-98 82 0 0 0 0 0 0 0 0 0 0 0 024-Mar-98 83 0 0 0 0 0 0 0 0 0 0 0 025-Mar-98 84 0 0 0 0 0 0 0 0 0 0 0 026-Mar-98 85 0 0 0 0 0 0 0 0 0 0 0 027-Mar-98 86 0 0 0 0 9 0 4 0 1 17 14 7028-Mar-98 87 0 9 6 4 0 6 0 0 0 0 0 029-Mar-98 88 0 0 0 0 0 0 0 0 0 0 0 030-Mar-98 89 0 0 0 14 1 0 39 0 0 0 0 031-Mar-98 90 198 105 25 0 0 25 0 0 2 0 0 001-Apr-98 91 0 0 0 0 0 0 0 0 0 0 0 002-Apr-98 92 0 0 0 0 0 0 0 0 0 0 0 003-Apr-98 93 0 0 0 0 0 0 0 0 0 0 0 0
Page 3 of 43

B-1. Daily Precipitation Data (1998-1999)
1 2 3 4 5 6 7 8 9 10 11 12Date Julian Date 410832 410902 411007 411215 411398 411429 411431 411492 414254 414374 414782 415113
04-Apr-98 94 0 0 0 0 0 0 0 0 0 0 0 005-Apr-98 95 0 0 0 0 0 0 0 0 0 0 0 006-Apr-98 96 0 0 0 0 0 0 0 0 0 0 0 007-Apr-98 97 0 0 0 0 0 0 4 0 0 0 0 008-Apr-98 98 65 0 11 0 0 11 0 0 0 0 25 009-Apr-98 99 0 0 0 0 0 0 0 0 0 0 0 010-Apr-98 100 0 0 0 0 0 0 0 0 0 0 0 011-Apr-98 101 0 0 0 0 0 0 0 0 0 0 0 012-Apr-98 102 0 0 0 0 0 0 4 0 0 0 0 013-Apr-98 103 2 0 3 0 0 3 0 0 0 0 0 014-Apr-98 104 0 0 0 0 0 0 0 0 0 0 0 015-Apr-98 105 0 0 0 0 0 0 0 0 0 0 0 016-Apr-98 106 0 0 0 0 0 0 0 0 0 0 0 017-Apr-98 107 0 0 0 0 0 0 3 0 0 0 0 018-Apr-98 108 0 0 1 0 0 1 0 0 2 0 0 019-Apr-98 109 0 0 0 0 0 0 0 0 0 0 0 020-Apr-98 110 0 0 0 0 0 0 0 0 0 0 0 021-Apr-98 111 0 0 0 0 0 0 0 0 0 0 0 022-Apr-98 112 0 0 0 0 0 0 0 0 0 0 0 023-Apr-98 113 0 0 0 0 0 0 0 0 0 0 0 024-Apr-98 114 0 0 0 0 0 0 0 0 0 0 0 025-Apr-98 115 0 0 0 3 0 0 0 0 0 0 0 026-Apr-98 116 0 0 0 4 0 0 13 0 0 0 0 027-Apr-98 117 0 57 20 0 0 20 0 0 4 0 3 028-Apr-98 118 0 0 0 0 0 0 0 0 0 0 0 029-Apr-98 119 0 0 0 0 0 0 0 0 0 0 0 030-Apr-98 120 0 0 0 0 0 0 0 0 0 0 0 001-May-98 121 0 0 0 0 0 0 0 0 0 0 0 002-May-98 122 3 0 7 0 0 7 0 0 0 0 0 003-May-98 123 0 0 0 0 0 0 0 0 0 0 0 004-May-98 124 0 0 0 0 0 0 0 0 0 0 0 005-May-98 125 0 0 0 0 0 0 0 0 0 0 0 006-May-98 126 0 0 0 0 0 0 0 0 0 0 0 007-May-98 127 0 0 0 0 0 0 0 0 0 0 0 008-May-98 128 0 0 0 0 0 0 0 0 0 0 0 009-May-98 129 0 0 0 0 0 0 0 0 0 0 0 010-May-98 130 0 0 0 0 0 0 0 0 0 0 0 0
Page 4 of 43

B-1. Daily Precipitation Data (1998-1999)
1 2 3 4 5 6 7 8 9 10 11 12Date Julian Date 410832 410902 411007 411215 411398 411429 411431 411492 414254 414374 414782 415113
11-May-98 131 0 0 0 0 0 0 0 0 0 0 0 012-May-98 132 0 0 0 0 0 0 0 0 0 0 0 013-May-98 133 0 0 0 0 0 0 0 0 0 0 0 014-May-98 134 0 0 0 0 0 0 0 0 0 0 0 015-May-98 135 0 0 0 0 0 0 0 0 0 0 0 016-May-98 136 0 0 0 0 0 0 0 0 0 0 0 017-May-98 137 0 0 0 0 0 0 0 27 0 0 0 018-May-98 138 0 0 0 0 0 0 0 0 0 0 0 019-May-98 139 0 0 0 0 0 0 0 0 0 0 0 020-May-98 140 0 0 0 0 0 0 0 0 0 0 0 021-May-98 141 0 0 0 0 0 0 0 0 0 0 0 022-May-98 142 0 0 0 0 0 0 0 0 0 0 0 023-May-98 143 0 0 0 0 0 0 0 0 0 0 0 024-May-98 144 0 0 0 0 0 0 0 0 0 0 0 025-May-98 145 0 0 0 0 0 0 0 0 0 0 0 026-May-98 146 0 0 0 0 3 0 41 0 0 103 7 7027-May-98 147 55 76 56 42 27 56 0 35 24 97 61 12628-May-98 148 0 0 0 0 0 0 0 0 0 0 0 029-May-98 149 0 0 0 0 0 0 0 0 0 0 0 030-May-98 150 0 0 0 0 0 0 0 0 0 0 0 031-May-98 151 0 0 0 0 0 0 0 0 0 0 0 001-Jun-98 152 0 0 0 0 0 0 0 0 0 0 0 002-Jun-98 153 0 0 0 0 0 0 0 0 0 0 0 003-Jun-98 154 0 0 0 0 0 0 0 0 0 0 0 004-Jun-98 155 0 0 0 0 0 0 0 0 0 0 0 005-Jun-98 156 0 0 0 0 0 0 57 0 0 0 0 006-Jun-98 157 14 0 74 0 0 74 0 0 0 0 0 007-Jun-98 158 0 0 0 0 0 0 0 0 0 3 0 008-Jun-98 159 0 0 0 0 0 0 0 0 0 0 0 009-Jun-98 160 0 0 0 0 0 0 0 0 0 0 0 010-Jun-98 161 0 0 0 0 0 0 91 0 0 41 0 1611-Jun-98 162 120 238 48 146 245 48 0 212 180 215 239 012-Jun-98 163 15 18 0 0 0 0 0 0 1 0 0 013-Jun-98 164 0 0 0 0 0 0 0 0 0 0 0 014-Jun-98 165 0 0 0 0 10 0 0 30 0 0 0 015-Jun-98 166 0 0 0 0 0 0 0 0 0 0 0 016-Jun-98 167 0 0 0 0 0 0 0 0 43 0 0 0
Page 5 of 43
B-1. Daily Precipitation Data (1998-1999)
1 2 3 4 5 6 7 8 9 10 11 12Date Julian Date 410832 410902 411007 411215 411398 411429 411431 411492 414254 414374 414782 415113
17-Jun-98 168 0 0 0 0 0 0 0 0 0 0 0 018-Jun-98 169 0 0 0 0 0 0 0 0 0 0 0 019-Jun-98 170 0 0 0 0 0 0 0 0 0 0 0 020-Jun-98 171 0 0 0 0 0 0 0 0 0 0 0 021-Jun-98 172 0 0 0 0 0 0 0 0 0 0 0 022-Jun-98 173 0 0 0 0 0 0 0 0 0 0 0 023-Jun-98 174 0 0 0 0 0 0 0 0 0 0 0 024-Jun-98 175 0 0 0 0 0 0 0 0 0 0 0 025-Jun-98 176 0 0 0 0 0 0 0 0 0 0 0 026-Jun-98 177 0 0 0 0 0 0 0 0 0 0 0 027-Jun-98 178 0 0 0 0 0 0 0 0 0 0 0 028-Jun-98 179 0 0 0 0 0 0 0 0 0 0 0 029-Jun-98 180 0 0 0 83 0 0 17 0 38 0 0 030-Jun-98 181 21 67 29 0 0 29 0 0 0 0 0 001-Jul-98 182 17 0 n/d 0 0 0 0 0 0 0 27 002-Jul-98 183 0 0 n/d 0 0 0 0 0 0 0 0 003-Jul-98 184 0 0 n/d 0 0 0 298 0 52 0 1 004-Jul-98 185 59 74 n/d 46 0 0 65 0 22 2 10 005-Jul-98 186 52 39 n/d 100 0 0 0 0 0 0 9 006-Jul-98 187 0 0 n/d 0 0 0 0 0 0 0 0 007-Jul-98 188 0 0 n/d 0 0 0 0 0 0 0 0 008-Jul-98 189 0 0 n/d 0 0 0 0 0 0 0 0 009-Jul-98 190 0 0 n/d 0 0 0 0 0 0 0 0 010-Jul-98 191 0 0 n/d 0 0 0 0 0 0 0 0 011-Jul-98 192 0 0 n/d 0 0 0 0 0 0 0 0 012-Jul-98 193 0 0 n/d 0 0 0 0 0 0 0 0 013-Jul-98 194 0 0 n/d 39 0 0 0 0 0 0 0 014-Jul-98 195 0 0 n/d 0 0 0 0 0 46 0 0 7615-Jul-98 196 0 0 n/d 0 50 0 0 0 0 35 10 016-Jul-98 197 0 0 n/d 0 0 0 0 0 0 0 0 017-Jul-98 198 0 0 n/d 0 0 0 0 0 0 0 95 018-Jul-98 199 0 0 n/d 0 0 0 0 0 0 0 0 019-Jul-98 200 0 0 n/d 0 0 0 0 0 0 0 0 020-Jul-98 201 0 0 n/d 0 0 0 0 0 0 0 0 021-Jul-98 202 0 0 n/d 0 0 0 0 0 0 0 0 022-Jul-98 203 0 0 n/d 0 0 0 0 0 0 0 0 023-Jul-98 204 0 0 n/d 0 0 0 0 0 0 0 0 0
Page 6 of 43
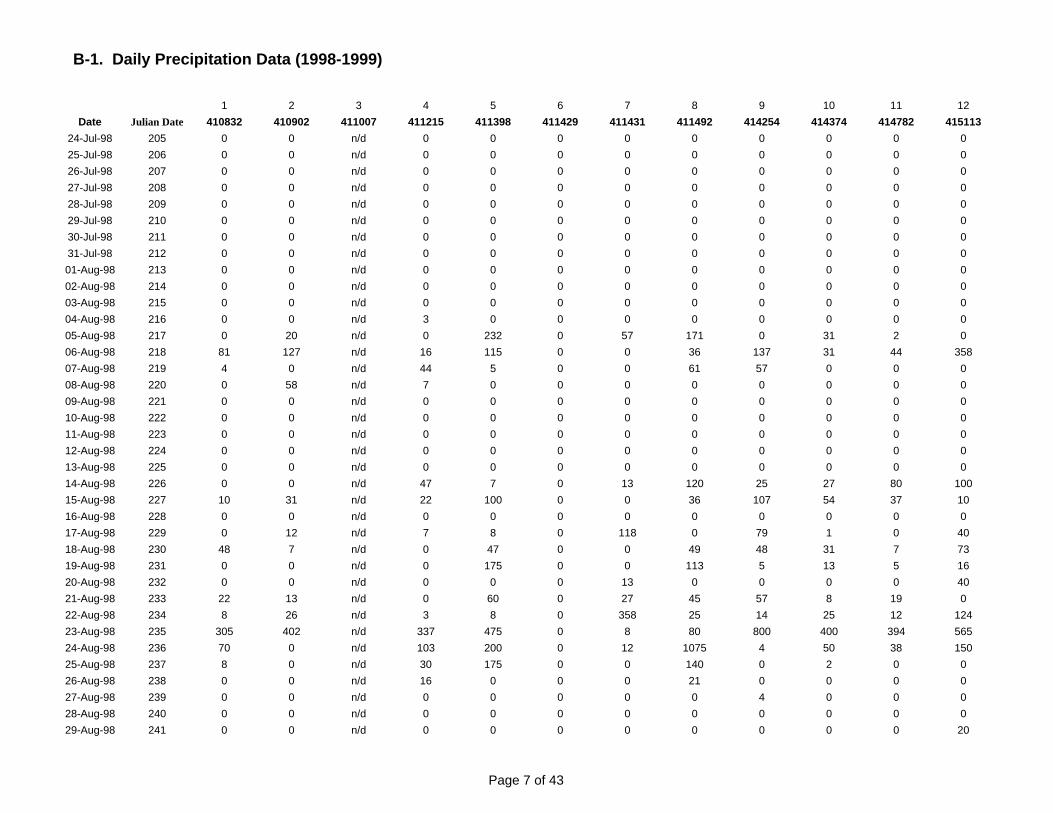
B-1. Daily Precipitation Data (1998-1999)
1 2 3 4 5 6 7 8 9 10 11 12Date Julian Date 410832 410902 411007 411215 411398 411429 411431 411492 414254 414374 414782 415113
24-Jul-98 205 0 0 n/d 0 0 0 0 0 0 0 0 025-Jul-98 206 0 0 n/d 0 0 0 0 0 0 0 0 026-Jul-98 207 0 0 n/d 0 0 0 0 0 0 0 0 027-Jul-98 208 0 0 n/d 0 0 0 0 0 0 0 0 028-Jul-98 209 0 0 n/d 0 0 0 0 0 0 0 0 029-Jul-98 210 0 0 n/d 0 0 0 0 0 0 0 0 030-Jul-98 211 0 0 n/d 0 0 0 0 0 0 0 0 031-Jul-98 212 0 0 n/d 0 0 0 0 0 0 0 0 001-Aug-98 213 0 0 n/d 0 0 0 0 0 0 0 0 002-Aug-98 214 0 0 n/d 0 0 0 0 0 0 0 0 003-Aug-98 215 0 0 n/d 0 0 0 0 0 0 0 0 004-Aug-98 216 0 0 n/d 3 0 0 0 0 0 0 0 005-Aug-98 217 0 20 n/d 0 232 0 57 171 0 31 2 006-Aug-98 218 81 127 n/d 16 115 0 0 36 137 31 44 35807-Aug-98 219 4 0 n/d 44 5 0 0 61 57 0 0 008-Aug-98 220 0 58 n/d 7 0 0 0 0 0 0 0 009-Aug-98 221 0 0 n/d 0 0 0 0 0 0 0 0 010-Aug-98 222 0 0 n/d 0 0 0 0 0 0 0 0 011-Aug-98 223 0 0 n/d 0 0 0 0 0 0 0 0 012-Aug-98 224 0 0 n/d 0 0 0 0 0 0 0 0 013-Aug-98 225 0 0 n/d 0 0 0 0 0 0 0 0 014-Aug-98 226 0 0 n/d 47 7 0 13 120 25 27 80 10015-Aug-98 227 10 31 n/d 22 100 0 0 36 107 54 37 1016-Aug-98 228 0 0 n/d 0 0 0 0 0 0 0 0 017-Aug-98 229 0 12 n/d 7 8 0 118 0 79 1 0 4018-Aug-98 230 48 7 n/d 0 47 0 0 49 48 31 7 7319-Aug-98 231 0 0 n/d 0 175 0 0 113 5 13 5 1620-Aug-98 232 0 0 n/d 0 0 0 13 0 0 0 0 4021-Aug-98 233 22 13 n/d 0 60 0 27 45 57 8 19 022-Aug-98 234 8 26 n/d 3 8 0 358 25 14 25 12 12423-Aug-98 235 305 402 n/d 337 475 0 8 80 800 400 394 56524-Aug-98 236 70 0 n/d 103 200 0 12 1075 4 50 38 15025-Aug-98 237 8 0 n/d 30 175 0 0 140 0 2 0 026-Aug-98 238 0 0 n/d 16 0 0 0 21 0 0 0 027-Aug-98 239 0 0 n/d 0 0 0 0 0 4 0 0 028-Aug-98 240 0 0 n/d 0 0 0 0 0 0 0 0 029-Aug-98 241 0 0 n/d 0 0 0 0 0 0 0 0 20
Page 7 of 43

B-1. Daily Precipitation Data (1998-1999)
1 2 3 4 5 6 7 8 9 10 11 12Date Julian Date 410832 410902 411007 411215 411398 411429 411431 411492 414254 414374 414782 415113
30-Aug-98 242 0 0 n/d 0 0 0 0 75 0 0 0 031-Aug-98 243 0 7 n/d 0 20 0 0 0 0 0 0 001-Sep-98 244 0 0 0 0 10 0 0 0 0 0 70 002-Sep-98 245 0 0 0 0 0 0 0 0 0 0 0 003-Sep-98 246 0 0 0 0 0 0 0 0 0 0 0 004-Sep-98 247 0 0 0 0 0 0 45 0 0 0 0 005-Sep-98 248 5 0 28 0 0 28 0 0 0 0 0 006-Sep-98 249 0 0 0 0 0 0 0 0 0 0 0 007-Sep-98 250 0 0 0 0 0 0 0 0 0 0 0 008-Sep-98 251 0 0 0 0 0 0 0 0 0 0 0 009-Sep-98 252 0 0 0 0 0 0 0 0 14 0 0 010-Sep-98 253 0 5 0 0 0 0 48 0 4 0 0 011-Sep-98 254 86 32 56 55 0 56 108 0 2 10 18 012-Sep-98 255 185 78 150 76 21 150 20 0 31 0 65 013-Sep-98 256 18 18 10 18 0 10 0 0 0 45 7 014-Sep-98 257 2 40 0 0 0 0 5 0 0 0 0 015-Sep-98 258 11 8 0 8 0 0 72 0 0 0 0 016-Sep-98 259 80 15 140 20 0 140 95 0 19 15 4 3917-Sep-98 260 26 46 168 0 265 168 0 24 43 65 31 018-Sep-98 261 0 0 0 0 42 0 0 75 0 15 0 019-Sep-98 262 0 0 0 0 5 0 0 0 0 25 0 020-Sep-98 263 0 6 0 0 0 0 0 0 0 0 0 021-Sep-98 264 0 0 0 0 0 0 0 0 0 0 0 022-Sep-98 265 0 0 0 0 0 0 0 0 0 0 0 023-Sep-98 266 0 0 0 0 0 0 0 0 0 0 0 024-Sep-98 267 0 0 0 0 0 0 0 30 0 0 0 025-Sep-98 268 0 0 0 0 0 0 0 0 0 0 0 026-Sep-98 269 0 0 0 0 0 0 0 0 2 0 0 027-Sep-98 270 0 0 0 0 0 0 0 0 0 0 1 028-Sep-98 271 0 0 0 0 0 0 0 0 0 0 0 029-Sep-98 272 0 0 0 0 0 0 0 0 0 0 0 030-Sep-98 273 0 0 0 0 0 0 0 0 0 0 0 001-Oct-98 274 0 0 n/d 0 0 0 0 0 n/d 0 0 6202-Oct-98 275 0 10 n/d 0 0 0 0 0 n/d 152 96 003-Oct-98 276 4 0 n/d 0 0 0 0 0 n/d 0 0 004-Oct-98 277 0 0 n/d 0 0 0 0 0 n/d 0 0 005-Oct-98 278 0 0 n/d 0 0 0 336 0 n/d 0 0 0
Page 8 of 43
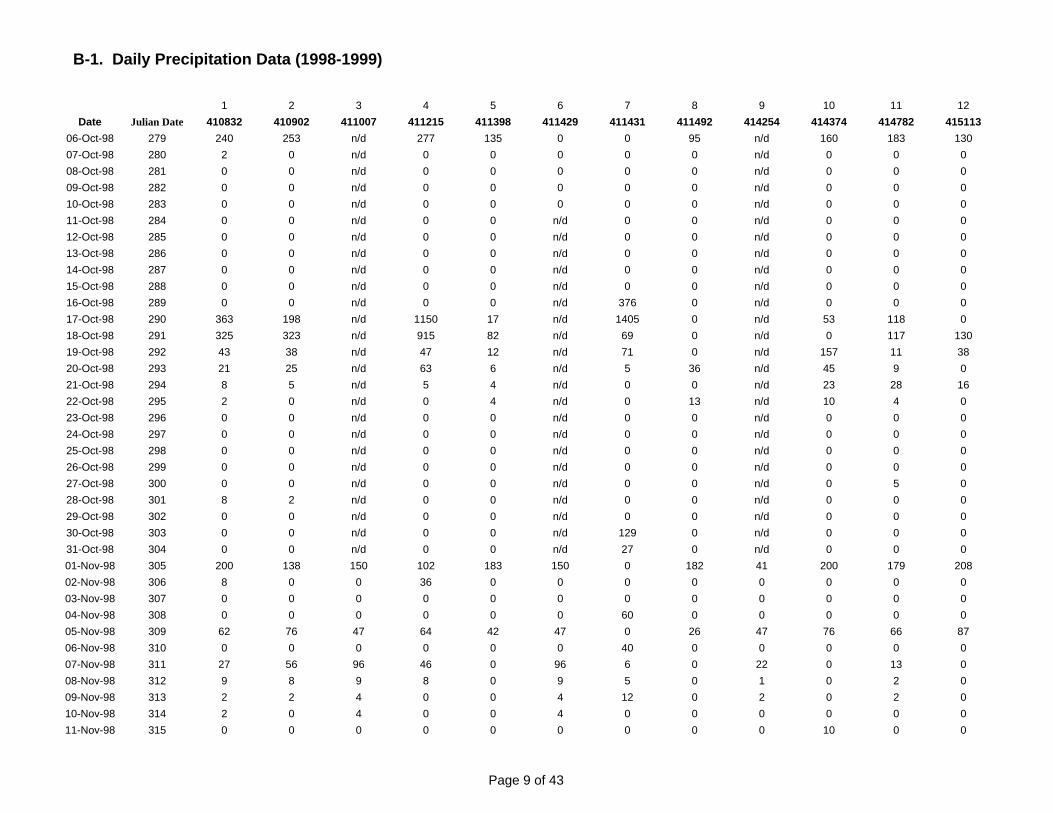
B-1. Daily Precipitation Data (1998-1999)
1 2 3 4 5 6 7 8 9 10 11 12Date Julian Date 410832 410902 411007 411215 411398 411429 411431 411492 414254 414374 414782 415113
06-Oct-98 279 240 253 n/d 277 135 0 0 95 n/d 160 183 13007-Oct-98 280 2 0 n/d 0 0 0 0 0 n/d 0 0 008-Oct-98 281 0 0 n/d 0 0 0 0 0 n/d 0 0 009-Oct-98 282 0 0 n/d 0 0 0 0 0 n/d 0 0 010-Oct-98 283 0 0 n/d 0 0 0 0 0 n/d 0 0 011-Oct-98 284 0 0 n/d 0 0 n/d 0 0 n/d 0 0 012-Oct-98 285 0 0 n/d 0 0 n/d 0 0 n/d 0 0 013-Oct-98 286 0 0 n/d 0 0 n/d 0 0 n/d 0 0 014-Oct-98 287 0 0 n/d 0 0 n/d 0 0 n/d 0 0 015-Oct-98 288 0 0 n/d 0 0 n/d 0 0 n/d 0 0 016-Oct-98 289 0 0 n/d 0 0 n/d 376 0 n/d 0 0 017-Oct-98 290 363 198 n/d 1150 17 n/d 1405 0 n/d 53 118 018-Oct-98 291 325 323 n/d 915 82 n/d 69 0 n/d 0 117 13019-Oct-98 292 43 38 n/d 47 12 n/d 71 0 n/d 157 11 3820-Oct-98 293 21 25 n/d 63 6 n/d 5 36 n/d 45 9 021-Oct-98 294 8 5 n/d 5 4 n/d 0 0 n/d 23 28 1622-Oct-98 295 2 0 n/d 0 4 n/d 0 13 n/d 10 4 023-Oct-98 296 0 0 n/d 0 0 n/d 0 0 n/d 0 0 024-Oct-98 297 0 0 n/d 0 0 n/d 0 0 n/d 0 0 025-Oct-98 298 0 0 n/d 0 0 n/d 0 0 n/d 0 0 026-Oct-98 299 0 0 n/d 0 0 n/d 0 0 n/d 0 0 027-Oct-98 300 0 0 n/d 0 0 n/d 0 0 n/d 0 5 028-Oct-98 301 8 2 n/d 0 0 n/d 0 0 n/d 0 0 029-Oct-98 302 0 0 n/d 0 0 n/d 0 0 n/d 0 0 030-Oct-98 303 0 0 n/d 0 0 n/d 129 0 n/d 0 0 031-Oct-98 304 0 0 n/d 0 0 n/d 27 0 n/d 0 0 001-Nov-98 305 200 138 150 102 183 150 0 182 41 200 179 20802-Nov-98 306 8 0 0 36 0 0 0 0 0 0 0 003-Nov-98 307 0 0 0 0 0 0 0 0 0 0 0 004-Nov-98 308 0 0 0 0 0 0 60 0 0 0 0 005-Nov-98 309 62 76 47 64 42 47 0 26 47 76 66 8706-Nov-98 310 0 0 0 0 0 0 40 0 0 0 0 007-Nov-98 311 27 56 96 46 0 96 6 0 22 0 13 008-Nov-98 312 9 8 9 8 0 9 5 0 1 0 2 009-Nov-98 313 2 2 4 0 0 4 12 0 2 0 2 010-Nov-98 314 2 0 4 0 0 4 0 0 0 0 0 011-Nov-98 315 0 0 0 0 0 0 0 0 0 10 0 0
Page 9 of 43
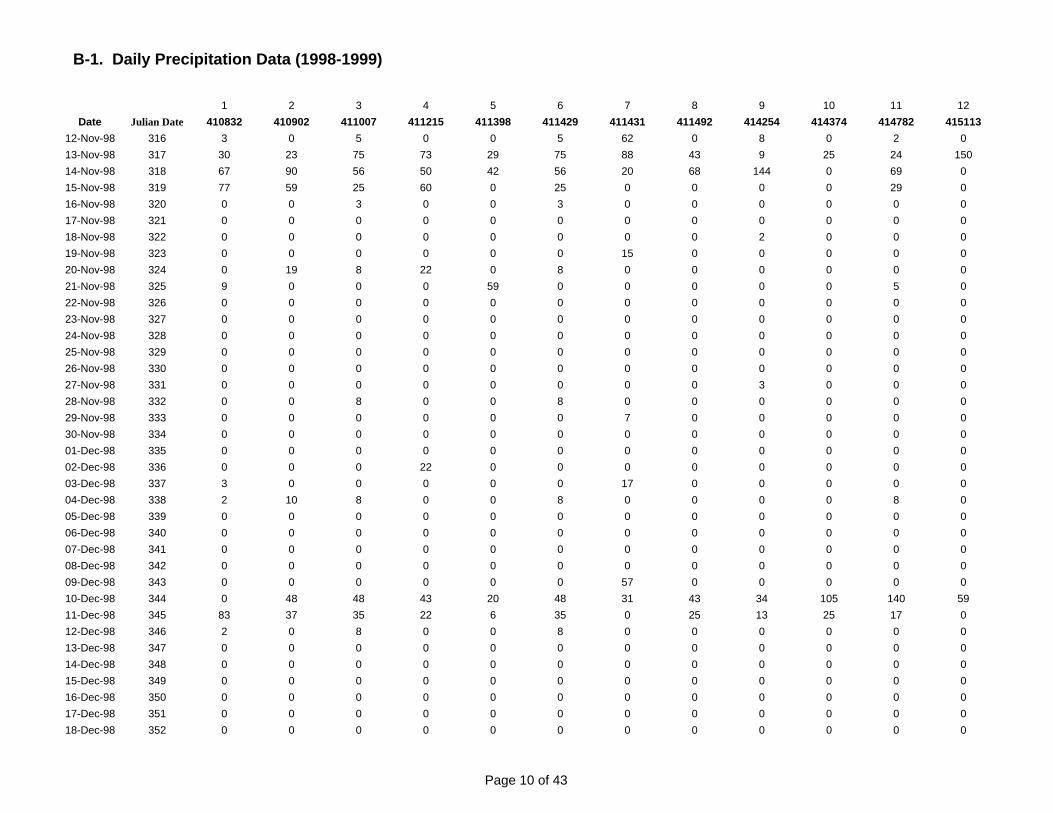
B-1. Daily Precipitation Data (1998-1999)
1 2 3 4 5 6 7 8 9 10 11 12Date Julian Date 410832 410902 411007 411215 411398 411429 411431 411492 414254 414374 414782 415113
12-Nov-98 316 3 0 5 0 0 5 62 0 8 0 2 013-Nov-98 317 30 23 75 73 29 75 88 43 9 25 24 15014-Nov-98 318 67 90 56 50 42 56 20 68 144 0 69 015-Nov-98 319 77 59 25 60 0 25 0 0 0 0 29 016-Nov-98 320 0 0 3 0 0 3 0 0 0 0 0 017-Nov-98 321 0 0 0 0 0 0 0 0 0 0 0 018-Nov-98 322 0 0 0 0 0 0 0 0 2 0 0 019-Nov-98 323 0 0 0 0 0 0 15 0 0 0 0 020-Nov-98 324 0 19 8 22 0 8 0 0 0 0 0 021-Nov-98 325 9 0 0 0 59 0 0 0 0 0 5 022-Nov-98 326 0 0 0 0 0 0 0 0 0 0 0 023-Nov-98 327 0 0 0 0 0 0 0 0 0 0 0 024-Nov-98 328 0 0 0 0 0 0 0 0 0 0 0 025-Nov-98 329 0 0 0 0 0 0 0 0 0 0 0 026-Nov-98 330 0 0 0 0 0 0 0 0 0 0 0 027-Nov-98 331 0 0 0 0 0 0 0 0 3 0 0 028-Nov-98 332 0 0 8 0 0 8 0 0 0 0 0 029-Nov-98 333 0 0 0 0 0 0 7 0 0 0 0 030-Nov-98 334 0 0 0 0 0 0 0 0 0 0 0 001-Dec-98 335 0 0 0 0 0 0 0 0 0 0 0 002-Dec-98 336 0 0 0 22 0 0 0 0 0 0 0 003-Dec-98 337 3 0 0 0 0 0 17 0 0 0 0 004-Dec-98 338 2 10 8 0 0 8 0 0 0 0 8 005-Dec-98 339 0 0 0 0 0 0 0 0 0 0 0 006-Dec-98 340 0 0 0 0 0 0 0 0 0 0 0 007-Dec-98 341 0 0 0 0 0 0 0 0 0 0 0 008-Dec-98 342 0 0 0 0 0 0 0 0 0 0 0 009-Dec-98 343 0 0 0 0 0 0 57 0 0 0 0 010-Dec-98 344 0 48 48 43 20 48 31 43 34 105 140 5911-Dec-98 345 83 37 35 22 6 35 0 25 13 25 17 012-Dec-98 346 2 0 8 0 0 8 0 0 0 0 0 013-Dec-98 347 0 0 0 0 0 0 0 0 0 0 0 014-Dec-98 348 0 0 0 0 0 0 0 0 0 0 0 015-Dec-98 349 0 0 0 0 0 0 0 0 0 0 0 016-Dec-98 350 0 0 0 0 0 0 0 0 0 0 0 017-Dec-98 351 0 0 0 0 0 0 0 0 0 0 0 018-Dec-98 352 0 0 0 0 0 0 0 0 0 0 0 0
Page 10 of 43
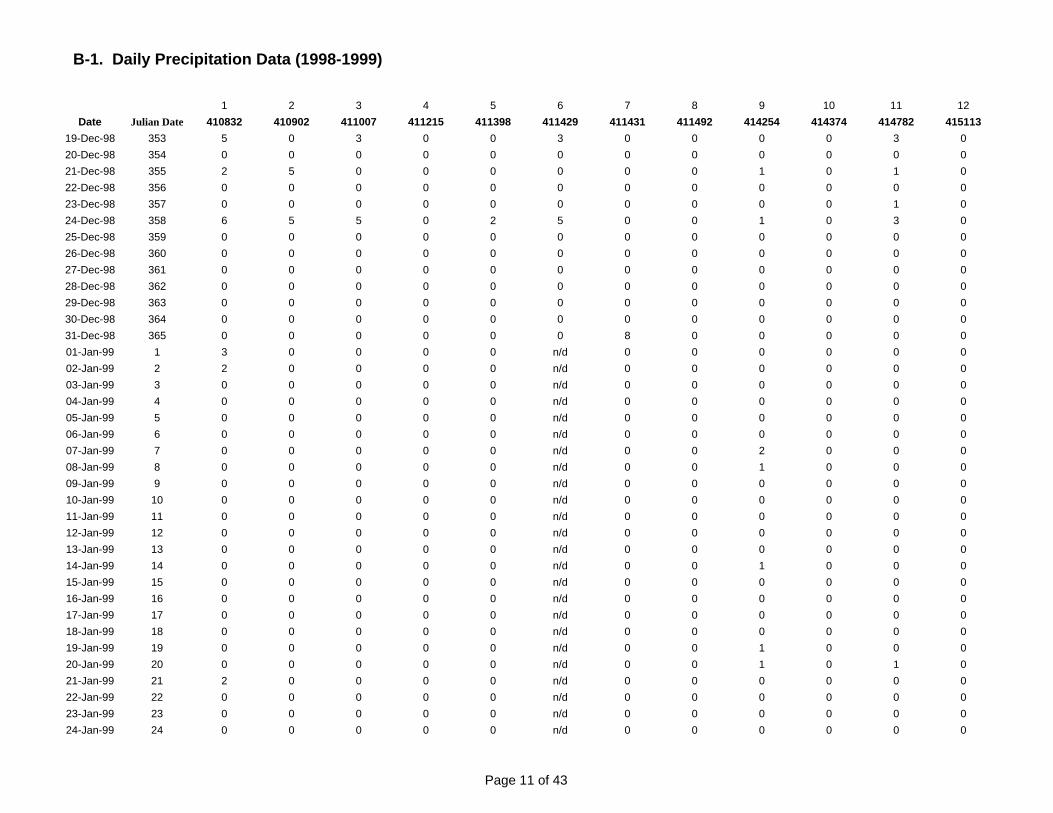
B-1. Daily Precipitation Data (1998-1999)
1 2 3 4 5 6 7 8 9 10 11 12Date Julian Date 410832 410902 411007 411215 411398 411429 411431 411492 414254 414374 414782 415113
19-Dec-98 353 5 0 3 0 0 3 0 0 0 0 3 020-Dec-98 354 0 0 0 0 0 0 0 0 0 0 0 021-Dec-98 355 2 5 0 0 0 0 0 0 1 0 1 022-Dec-98 356 0 0 0 0 0 0 0 0 0 0 0 023-Dec-98 357 0 0 0 0 0 0 0 0 0 0 1 024-Dec-98 358 6 5 5 0 2 5 0 0 1 0 3 025-Dec-98 359 0 0 0 0 0 0 0 0 0 0 0 026-Dec-98 360 0 0 0 0 0 0 0 0 0 0 0 027-Dec-98 361 0 0 0 0 0 0 0 0 0 0 0 028-Dec-98 362 0 0 0 0 0 0 0 0 0 0 0 029-Dec-98 363 0 0 0 0 0 0 0 0 0 0 0 030-Dec-98 364 0 0 0 0 0 0 0 0 0 0 0 031-Dec-98 365 0 0 0 0 0 0 8 0 0 0 0 001-Jan-99 1 3 0 0 0 0 n/d 0 0 0 0 0 002-Jan-99 2 2 0 0 0 0 n/d 0 0 0 0 0 003-Jan-99 3 0 0 0 0 0 n/d 0 0 0 0 0 004-Jan-99 4 0 0 0 0 0 n/d 0 0 0 0 0 005-Jan-99 5 0 0 0 0 0 n/d 0 0 0 0 0 006-Jan-99 6 0 0 0 0 0 n/d 0 0 0 0 0 007-Jan-99 7 0 0 0 0 0 n/d 0 0 2 0 0 008-Jan-99 8 0 0 0 0 0 n/d 0 0 1 0 0 009-Jan-99 9 0 0 0 0 0 n/d 0 0 0 0 0 010-Jan-99 10 0 0 0 0 0 n/d 0 0 0 0 0 011-Jan-99 11 0 0 0 0 0 n/d 0 0 0 0 0 012-Jan-99 12 0 0 0 0 0 n/d 0 0 0 0 0 013-Jan-99 13 0 0 0 0 0 n/d 0 0 0 0 0 014-Jan-99 14 0 0 0 0 0 n/d 0 0 1 0 0 015-Jan-99 15 0 0 0 0 0 n/d 0 0 0 0 0 016-Jan-99 16 0 0 0 0 0 n/d 0 0 0 0 0 017-Jan-99 17 0 0 0 0 0 n/d 0 0 0 0 0 018-Jan-99 18 0 0 0 0 0 n/d 0 0 0 0 0 019-Jan-99 19 0 0 0 0 0 n/d 0 0 1 0 0 020-Jan-99 20 0 0 0 0 0 n/d 0 0 1 0 1 021-Jan-99 21 2 0 0 0 0 n/d 0 0 0 0 0 022-Jan-99 22 0 0 0 0 0 n/d 0 0 0 0 0 023-Jan-99 23 0 0 0 0 0 n/d 0 0 0 0 0 024-Jan-99 24 0 0 0 0 0 n/d 0 0 0 0 0 0
Page 11 of 43

B-1. Daily Precipitation Data (1998-1999)
1 2 3 4 5 6 7 8 9 10 11 12Date Julian Date 410832 410902 411007 411215 411398 411429 411431 411492 414254 414374 414782 415113
25-Jan-99 25 0 0 0 0 0 n/d 0 0 0 0 0 026-Jan-99 26 0 0 0 0 0 n/d 0 0 0 0 0 027-Jan-99 27 0 0 0 0 0 n/d 0 0 0 0 0 028-Jan-99 28 0 0 0 0 0 n/d 0 0 0 0 0 029-Jan-99 29 37 6 12 0 0 n/d 0 23 1 15 0 1430-Jan-99 30 22 0 0 13 0 n/d 0 0 0 5 4 031-Jan-99 31 0 0 0 0 0 n/d 0 0 0 0 0 001-Feb-99 32 0 0 0 0 0 0 0 0 0 0 0 002-Feb-99 33 0 0 0 0 0 0 0 0 0 0 0 003-Feb-99 34 0 0 0 0 0 0 0 0 0 0 0 004-Feb-99 35 0 0 0 0 0 0 0 0 0 0 0 005-Feb-99 36 0 0 0 0 0 0 0 0 0 5 0 006-Feb-99 37 0 0 0 0 0 0 0 0 0 0 0 007-Feb-99 38 0 0 0 0 0 0 0 0 0 0 0 008-Feb-99 39 0 0 0 0 0 0 0 0 0 0 0 009-Feb-99 40 0 0 0 0 0 0 0 0 1 0 0 010-Feb-99 41 0 0 0 0 0 0 0 0 0 0 0 011-Feb-99 42 0 0 0 0 0 0 0 0 0 0 0 012-Feb-99 43 6 0 0 0 0 2 0 0 8 0 1 013-Feb-99 44 0 0 0 0 0 0 0 0 0 0 0 014-Feb-99 45 0 0 0 0 0 0 0 0 0 0 0 015-Feb-99 46 0 0 0 0 0 0 0 0 0 0 0 016-Feb-99 47 0 0 0 0 0 0 0 0 0 0 0 017-Feb-99 48 0 0 0 0 0 0 0 0 0 0 0 018-Feb-99 49 0 0 0 0 0 0 0 0 0 0 0 019-Feb-99 50 0 0 0 0 0 0 0 0 0 0 0 020-Feb-99 51 0 0 0 0 0 0 0 0 0 0 0 021-Feb-99 52 2 0 0 0 0 0 0 0 0 0 0 022-Feb-99 53 0 0 0 0 0 0 0 0 0 0 0 023-Feb-99 54 0 0 0 0 0 0 0 0 0 0 0 024-Feb-99 55 0 0 0 0 0 0 0 0 0 0 0 025-Feb-99 56 0 0 0 0 0 0 0 0 0 0 0 026-Feb-99 57 2 0 0 0 0 0 0 0 0 0 0 027-Feb-99 58 0 3 0 0 0 2 0 0 2 0 2 028-Feb-99 59 0 0 0 0 0 0 0 0 0 0 0 001-Mar-99 60 0 0 0 0 0 0 0 0 0 0 0 002-Mar-99 61 0 0 0 0 0 0 0 0 0 0 0 0
Page 12 of 43

B-1. Daily Precipitation Data (1998-1999)
1 2 3 4 5 6 7 8 9 10 11 12Date Julian Date 410832 410902 411007 411215 411398 411429 411431 411492 414254 414374 414782 415113
03-Mar-99 62 0 0 0 0 0 0 0 0 0 0 0 004-Mar-99 63 0 0 0 0 0 0 0 0 0 0 0 005-Mar-99 64 0 0 0 0 0 0 0 0 0 0 0 006-Mar-99 65 0 0 0 0 0 3 0 0 0 0 0 007-Mar-99 66 0 0 0 0 0 0 0 0 0 25 0 008-Mar-99 67 2 9 0 0 20 0 0 12 4 23 6 2009-Mar-99 68 12 0 0 0 0 0 0 0 0 0 0 010-Mar-99 69 0 0 0 0 0 0 0 0 0 0 0 011-Mar-99 70 0 0 0 0 0 0 16 0 0 0 0 012-Mar-99 71 5 14 0 0 0 7 23 0 0 0 1 013-Mar-99 72 62 45 102 30 35 18 0 20 35 0 20 014-Mar-99 73 0 0 0 0 0 0 0 0 0 0 0 015-Mar-99 74 0 0 30 0 0 0 0 0 0 0 0 016-Mar-99 75 0 0 0 0 0 0 0 0 0 0 0 017-Mar-99 76 0 0 0 0 0 0 3 0 0 0 0 018-Mar-99 77 3 7 17 143 32 0 100 176 3 115 17 6019-Mar-99 78 150 118 0 0 0 110 0 0 91 0 130 020-Mar-99 79 0 0 0 0 0 13 0 0 4 0 0 021-Mar-99 80 0 0 0 0 0 0 0 0 0 0 0 022-Mar-99 81 0 0 0 0 0 0 0 0 0 0 0 023-Mar-99 82 0 0 0 0 0 0 0 0 0 0 0 024-Mar-99 83 3 0 0 0 0 2 0 0 0 0 0 025-Mar-99 84 2 0 0 0 0 0 0 5 0 0 0 026-Mar-99 85 0 0 0 0 6 0 0 0 0 0 0 027-Mar-99 86 0 0 13 0 0 0 126 10 0 0 2 19328-Mar-99 87 98 140 170 134 143 127 0 178 207 165 143 029-Mar-99 88 0 0 0 0 0 0 0 0 0 0 0 030-Mar-99 89 0 0 0 0 0 0 0 0 0 0 0 031-Mar-99 90 0 0 0 0 0 0 0 0 0 0 0 001-Apr-99 91 0 0 0 0 0 0 0 0 2 0 0 002-Apr-99 92 3 0 0 0 0 4 0 0 1 0 0 003-Apr-99 93 4 0 0 0 0 0 0 0 0 0 0 004-Apr-99 94 1 0 0 0 0 0 5 0 0 0 0 005-Apr-99 95 2 0 0 0 0 0 0 0 0 0 0 006-Apr-99 96 0 0 0 0 0 0 0 0 0 0 0 007-Apr-99 97 0 0 0 0 0 0 0 0 0 0 0 008-Apr-99 98 0 0 0 0 0 0 0 6 0 0 0 0
Page 13 of 43
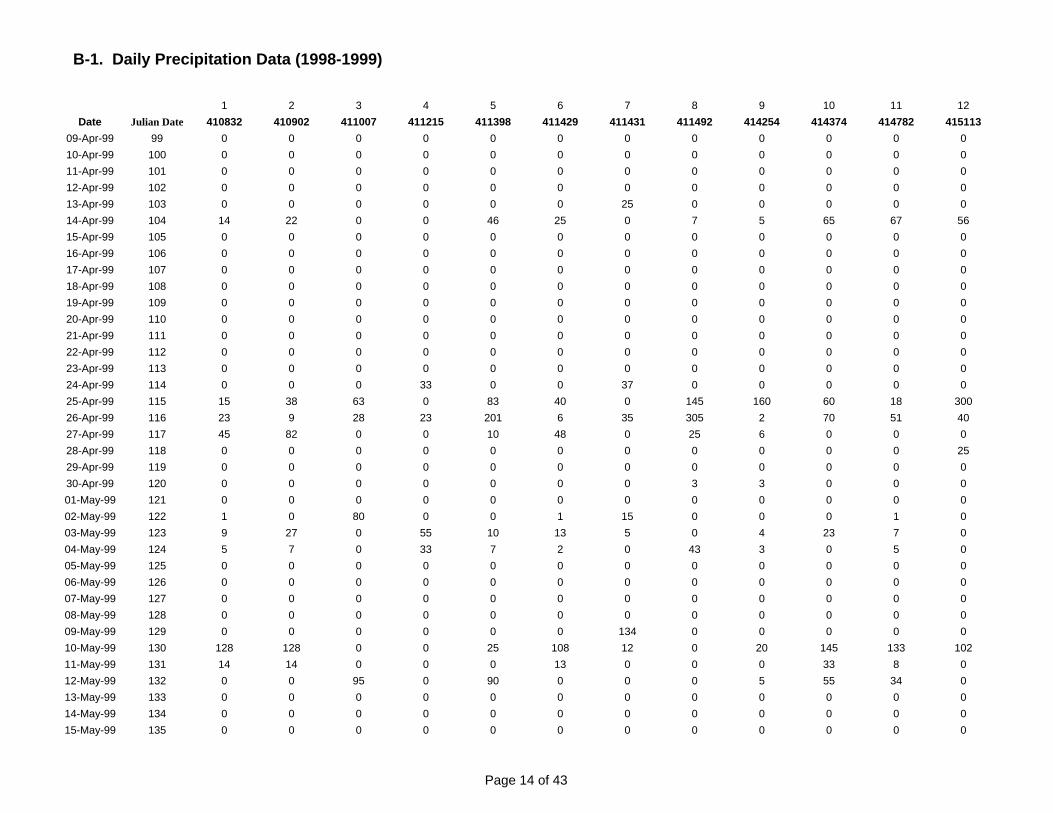
B-1. Daily Precipitation Data (1998-1999)
1 2 3 4 5 6 7 8 9 10 11 12Date Julian Date 410832 410902 411007 411215 411398 411429 411431 411492 414254 414374 414782 415113
09-Apr-99 99 0 0 0 0 0 0 0 0 0 0 0 010-Apr-99 100 0 0 0 0 0 0 0 0 0 0 0 011-Apr-99 101 0 0 0 0 0 0 0 0 0 0 0 012-Apr-99 102 0 0 0 0 0 0 0 0 0 0 0 013-Apr-99 103 0 0 0 0 0 0 25 0 0 0 0 014-Apr-99 104 14 22 0 0 46 25 0 7 5 65 67 5615-Apr-99 105 0 0 0 0 0 0 0 0 0 0 0 016-Apr-99 106 0 0 0 0 0 0 0 0 0 0 0 017-Apr-99 107 0 0 0 0 0 0 0 0 0 0 0 018-Apr-99 108 0 0 0 0 0 0 0 0 0 0 0 019-Apr-99 109 0 0 0 0 0 0 0 0 0 0 0 020-Apr-99 110 0 0 0 0 0 0 0 0 0 0 0 021-Apr-99 111 0 0 0 0 0 0 0 0 0 0 0 022-Apr-99 112 0 0 0 0 0 0 0 0 0 0 0 023-Apr-99 113 0 0 0 0 0 0 0 0 0 0 0 024-Apr-99 114 0 0 0 33 0 0 37 0 0 0 0 025-Apr-99 115 15 38 63 0 83 40 0 145 160 60 18 30026-Apr-99 116 23 9 28 23 201 6 35 305 2 70 51 4027-Apr-99 117 45 82 0 0 10 48 0 25 6 0 0 028-Apr-99 118 0 0 0 0 0 0 0 0 0 0 0 2529-Apr-99 119 0 0 0 0 0 0 0 0 0 0 0 030-Apr-99 120 0 0 0 0 0 0 0 3 3 0 0 001-May-99 121 0 0 0 0 0 0 0 0 0 0 0 002-May-99 122 1 0 80 0 0 1 15 0 0 0 1 003-May-99 123 9 27 0 55 10 13 5 0 4 23 7 004-May-99 124 5 7 0 33 7 2 0 43 3 0 5 005-May-99 125 0 0 0 0 0 0 0 0 0 0 0 006-May-99 126 0 0 0 0 0 0 0 0 0 0 0 007-May-99 127 0 0 0 0 0 0 0 0 0 0 0 008-May-99 128 0 0 0 0 0 0 0 0 0 0 0 009-May-99 129 0 0 0 0 0 0 134 0 0 0 0 010-May-99 130 128 128 0 0 25 108 12 0 20 145 133 10211-May-99 131 14 14 0 0 0 13 0 0 0 33 8 012-May-99 132 0 0 95 0 90 0 0 0 5 55 34 013-May-99 133 0 0 0 0 0 0 0 0 0 0 0 014-May-99 134 0 0 0 0 0 0 0 0 0 0 0 015-May-99 135 0 0 0 0 0 0 0 0 0 0 0 0
Page 14 of 43
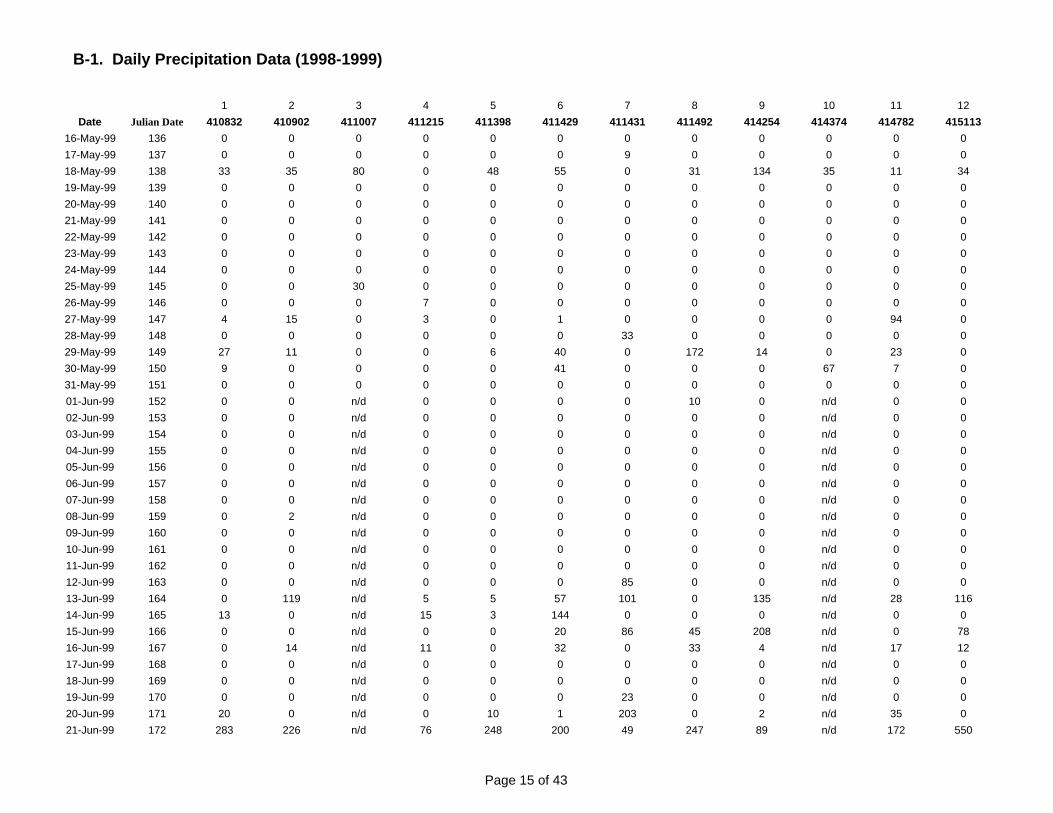
B-1. Daily Precipitation Data (1998-1999)
1 2 3 4 5 6 7 8 9 10 11 12Date Julian Date 410832 410902 411007 411215 411398 411429 411431 411492 414254 414374 414782 415113
16-May-99 136 0 0 0 0 0 0 0 0 0 0 0 017-May-99 137 0 0 0 0 0 0 9 0 0 0 0 018-May-99 138 33 35 80 0 48 55 0 31 134 35 11 3419-May-99 139 0 0 0 0 0 0 0 0 0 0 0 020-May-99 140 0 0 0 0 0 0 0 0 0 0 0 021-May-99 141 0 0 0 0 0 0 0 0 0 0 0 022-May-99 142 0 0 0 0 0 0 0 0 0 0 0 023-May-99 143 0 0 0 0 0 0 0 0 0 0 0 024-May-99 144 0 0 0 0 0 0 0 0 0 0 0 025-May-99 145 0 0 30 0 0 0 0 0 0 0 0 026-May-99 146 0 0 0 7 0 0 0 0 0 0 0 027-May-99 147 4 15 0 3 0 1 0 0 0 0 94 028-May-99 148 0 0 0 0 0 0 33 0 0 0 0 029-May-99 149 27 11 0 0 6 40 0 172 14 0 23 030-May-99 150 9 0 0 0 0 41 0 0 0 67 7 031-May-99 151 0 0 0 0 0 0 0 0 0 0 0 001-Jun-99 152 0 0 n/d 0 0 0 0 10 0 n/d 0 002-Jun-99 153 0 0 n/d 0 0 0 0 0 0 n/d 0 003-Jun-99 154 0 0 n/d 0 0 0 0 0 0 n/d 0 004-Jun-99 155 0 0 n/d 0 0 0 0 0 0 n/d 0 005-Jun-99 156 0 0 n/d 0 0 0 0 0 0 n/d 0 006-Jun-99 157 0 0 n/d 0 0 0 0 0 0 n/d 0 007-Jun-99 158 0 0 n/d 0 0 0 0 0 0 n/d 0 008-Jun-99 159 0 2 n/d 0 0 0 0 0 0 n/d 0 009-Jun-99 160 0 0 n/d 0 0 0 0 0 0 n/d 0 010-Jun-99 161 0 0 n/d 0 0 0 0 0 0 n/d 0 011-Jun-99 162 0 0 n/d 0 0 0 0 0 0 n/d 0 012-Jun-99 163 0 0 n/d 0 0 0 85 0 0 n/d 0 013-Jun-99 164 0 119 n/d 5 5 57 101 0 135 n/d 28 11614-Jun-99 165 13 0 n/d 15 3 144 0 0 0 n/d 0 015-Jun-99 166 0 0 n/d 0 0 20 86 45 208 n/d 0 7816-Jun-99 167 0 14 n/d 11 0 32 0 33 4 n/d 17 1217-Jun-99 168 0 0 n/d 0 0 0 0 0 0 n/d 0 018-Jun-99 169 0 0 n/d 0 0 0 0 0 0 n/d 0 019-Jun-99 170 0 0 n/d 0 0 0 23 0 0 n/d 0 020-Jun-99 171 20 0 n/d 0 10 1 203 0 2 n/d 35 021-Jun-99 172 283 226 n/d 76 248 200 49 247 89 n/d 172 550
Page 15 of 43

B-1. Daily Precipitation Data (1998-1999)
1 2 3 4 5 6 7 8 9 10 11 12Date Julian Date 410832 410902 411007 411215 411398 411429 411431 411492 414254 414374 414782 415113
22-Jun-99 173 47 115 n/d 44 276 181 51 180 64 n/d 29 023-Jun-99 174 4 6 n/d 12 0 9 0 0 17 n/d 11 024-Jun-99 175 0 0 n/d 0 0 0 0 0 0 n/d 0 025-Jun-99 176 0 0 n/d 0 0 1 0 0 0 n/d 0 4326-Jun-99 177 13 0 n/d 75 0 2 0 0 0 n/d 6 027-Jun-99 178 0 0 n/d 0 0 0 0 0 0 n/d 0 028-Jun-99 179 0 0 n/d 0 0 0 0 0 0 n/d 0 029-Jun-99 180 0 0 n/d 0 0 0 0 0 0 n/d 0 030-Jun-99 181 0 0 n/d 0 0 0 0 0 0 n/d 0 001-Jul-99 182 0 0 0 0 0 0 0 0 0 n/d 0 002-Jul-99 183 0 0 0 0 0 1 13 0 0 n/d 0 003-Jul-99 184 3 4 0 0 0 0 0 0 0 n/d 0 004-Jul-99 185 8 15 0 18 8 14 12 13 0 n/d 0 005-Jul-99 186 7 0 83 230 0 84 0 0 3 n/d 5 006-Jul-99 187 0 0 0 0 0 1 0 0 0 n/d 0 007-Jul-99 188 25 56 0 0 30 5 6 0 0 n/d 0 10008-Jul-99 189 0 0 0 0 0 0 0 116 0 n/d 0 009-Jul-99 190 2 0 0 0 0 0 0 35 0 n/d 0 010-Jul-99 191 0 0 0 0 0 0 10 0 0 n/d 0 11511-Jul-99 192 45 230 120 0 60 0 33 42 31 n/d 290 012-Jul-99 193 4 21 35 98 25 12 0 22 10 n/d 1 013-Jul-99 194 0 0 0 0 0 0 0 0 0 n/d 0 014-Jul-99 195 0 0 0 0 0 0 0 0 0 n/d 0 015-Jul-99 196 0 0 0 0 0 0 0 0 0 n/d 0 016-Jul-99 197 0 0 0 0 0 0 0 0 0 n/d 0 017-Jul-99 198 0 0 0 0 0 0 0 0 0 n/d 0 018-Jul-99 199 29 0 0 18 20 10 0 0 0 n/d 0 019-Jul-99 200 0 0 0 7 0 1 0 0 0 n/d 0 020-Jul-99 201 10 0 0 0 0 0 0 0 0 n/d 0 021-Jul-99 202 0 9 0 0 0 0 4 0 0 n/d 0 022-Jul-99 203 0 0 0 26 0 35 0 0 0 n/d 0 023-Jul-99 204 0 0 0 0 0 0 0 0 0 n/d 0 024-Jul-99 205 0 0 0 0 0 0 0 0 0 n/d 0 025-Jul-99 206 0 0 0 0 0 0 0 0 0 n/d 0 026-Jul-99 207 0 0 0 0 0 0 0 0 0 n/d 0 027-Jul-99 208 0 0 0 0 0 0 0 0 0 n/d 0 028-Jul-99 209 0 0 0 0 0 0 0 0 0 n/d 0 0
Page 16 of 43

B-1. Daily Precipitation Data (1998-1999)
1 2 3 4 5 6 7 8 9 10 11 12Date Julian Date 410832 410902 411007 411215 411398 411429 411431 411492 414254 414374 414782 415113
29-Jul-99 210 0 0 0 0 0 0 0 0 0 n/d 0 030-Jul-99 211 0 0 0 0 0 0 0 0 0 n/d 0 031-Jul-99 212 0 0 0 0 0 0 0 0 0 n/d 0 001-Aug-99 213 0 0 0 0 0 0 0 0 0 n/d 0 002-Aug-99 214 0 0 0 0 0 0 0 0 0 n/d 0 003-Aug-99 215 0 0 0 0 0 0 0 0 0 n/d 0 004-Aug-99 216 0 0 0 0 0 0 10 0 0 n/d 0 005-Aug-99 217 4 12 0 0 0 5 0 0 0 n/d 0 006-Aug-99 218 0 0 0 0 0 0 0 0 0 n/d 0 007-Aug-99 219 0 0 0 0 0 0 0 0 0 n/d 0 008-Aug-99 220 0 0 0 0 0 0 0 0 0 n/d 0 009-Aug-99 221 0 0 0 0 0 0 0 0 0 n/d 0 010-Aug-99 222 0 0 0 0 0 0 0 0 0 n/d 0 011-Aug-99 223 0 0 0 0 0 0 0 0 0 n/d 0 012-Aug-99 224 0 0 0 0 0 0 0 0 0 n/d 0 013-Aug-99 225 0 0 0 0 0 0 0 0 0 n/d 0 014-Aug-99 226 0 0 0 0 0 0 0 0 0 n/d 0 015-Aug-99 227 0 0 0 0 0 0 0 0 0 n/d 0 016-Aug-99 228 0 0 0 0 0 0 0 0 0 n/d 0 017-Aug-99 229 0 0 0 0 0 0 7 0 0 n/d 0 018-Aug-99 230 0 0 0 0 0 2 0 0 0 n/d 0 019-Aug-99 231 0 0 0 0 0 0 0 0 0 n/d 0 020-Aug-99 232 0 0 0 0 0 0 0 0 105 n/d 0 021-Aug-99 233 0 0 0 0 0 0 0 0 0 n/d 0 022-Aug-99 234 0 0 0 0 0 0 0 0 0 n/d 0 023-Aug-99 235 0 0 0 0 0 0 39 0 50 n/d 0 2224-Aug-99 236 0 57 40 0 8 8 0 0 0 n/d 24 025-Aug-99 237 0 0 45 0 0 30 0 0 0 n/d 0 026-Aug-99 238 0 0 0 0 0 0 0 0 0 n/d 0 027-Aug-99 239 0 0 0 0 0 0 0 0 0 n/d 0 028-Aug-99 240 0 0 0 0 0 0 0 0 0 n/d 0 029-Aug-99 241 0 0 0 0 0 0 0 0 15 n/d 0 030-Aug-99 242 6 0 0 26 0 10 0 30 0 n/d 0 031-Aug-99 243 0 0 0 0 0 0 0 0 0 n/d 0 001-Sep-99 244 0 0 0 0 0 0 0 0 0 n/d 0 002-Sep-99 245 0 0 0 0 0 0 0 0 0 n/d 0 003-Sep-99 246 0 0 0 0 0 0 0 0 0 n/d 0 0
Page 17 of 43

B-1. Daily Precipitation Data (1998-1999)
1 2 3 4 5 6 7 8 9 10 11 12Date Julian Date 410832 410902 411007 411215 411398 411429 411431 411492 414254 414374 414782 415113
04-Sep-99 247 0 0 0 0 0 0 0 0 0 n/d 0 005-Sep-99 248 0 0 0 0 0 0 0 0 0 n/d 0 006-Sep-99 249 0 0 0 0 0 0 0 0 0 n/d 0 007-Sep-99 250 0 0 0 0 20 0 0 0 0 n/d 0 008-Sep-99 251 0 0 0 0 0 0 0 0 4 n/d 0 009-Sep-99 252 0 15 0 2 0 0 0 0 0 n/d 0 010-Sep-99 253 0 7 50 0 11 0 0 86 0 n/d 89 011-Sep-99 254 0 0 0 0 0 0 0 0 0 n/d 0 012-Sep-99 255 0 0 0 0 0 0 0 0 0 n/d 0 013-Sep-99 256 0 0 0 0 0 0 0 0 0 n/d 0 014-Sep-99 257 0 0 35 0 0 0 0 0 23 n/d 0 015-Sep-99 258 0 0 0 0 0 0 0 0 0 n/d 0 016-Sep-99 259 0 0 0 0 0 0 0 0 0 n/d 0 017-Sep-99 260 0 0 0 0 0 0 0 0 0 n/d 0 018-Sep-99 261 0 0 0 0 0 0 0 0 0 n/d 0 019-Sep-99 262 0 0 0 0 0 0 0 0 0 n/d 0 020-Sep-99 263 0 0 0 0 0 0 0 0 0 n/d 0 021-Sep-99 264 0 0 0 0 0 0 0 0 0 n/d 7 022-Sep-99 265 0 0 0 0 0 0 0 0 0 n/d 1 023-Sep-99 266 0 0 0 0 0 0 0 0 0 n/d 0 024-Sep-99 267 0 0 0 0 0 0 0 0 0 n/d 0 025-Sep-99 268 0 0 0 0 0 0 0 0 0 n/d 0 026-Sep-99 269 0 0 0 0 0 0 0 0 2 n/d 0 027-Sep-99 270 0 0 0 0 0 0 0 0 0 n/d 0 028-Sep-99 271 0 0 0 0 0 0 0 0 0 n/d 0 029-Sep-99 272 0 0 0 0 0 9 0 0 0 n/d 0 030-Sep-99 273 0 0 0 0 0 0 0 0 0 n/d 0 001-Oct-99 274 0 0 n/d 0 0 0 0 0 0 n/d 0 002-Oct-99 275 0 0 n/d 0 0 0 0 0 0 n/d 0 003-Oct-99 276 0 0 n/d 0 0 0 0 0 0 n/d 0 004-Oct-99 277 0 0 n/d 0 0 0 0 0 0 n/d 0 005-Oct-99 278 0 0 n/d 0 0 0 0 0 0 n/d 0 006-Oct-99 279 0 0 n/d 0 0 0 0 0 0 n/d 0 007-Oct-99 280 0 0 n/d 0 0 0 0 0 0 n/d 0 008-Oct-99 281 0 0 n/d 0 0 0 0 0 0 n/d 0 009-Oct-99 282 0 0 n/d 0 0 0 0 0 0 n/d 0 010-Oct-99 283 0 0 n/d 0 0 0 0 0 0 n/d 0 0
Page 18 of 43
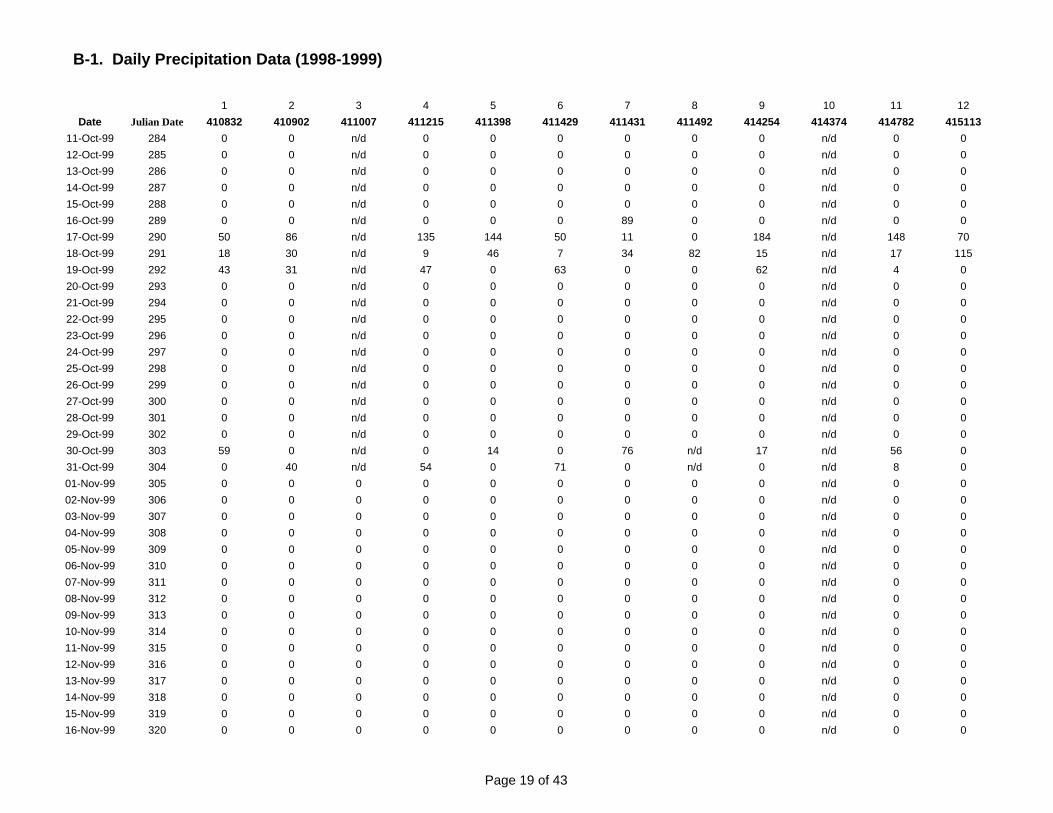
B-1. Daily Precipitation Data (1998-1999)
1 2 3 4 5 6 7 8 9 10 11 12Date Julian Date 410832 410902 411007 411215 411398 411429 411431 411492 414254 414374 414782 415113
11-Oct-99 284 0 0 n/d 0 0 0 0 0 0 n/d 0 012-Oct-99 285 0 0 n/d 0 0 0 0 0 0 n/d 0 013-Oct-99 286 0 0 n/d 0 0 0 0 0 0 n/d 0 014-Oct-99 287 0 0 n/d 0 0 0 0 0 0 n/d 0 015-Oct-99 288 0 0 n/d 0 0 0 0 0 0 n/d 0 016-Oct-99 289 0 0 n/d 0 0 0 89 0 0 n/d 0 017-Oct-99 290 50 86 n/d 135 144 50 11 0 184 n/d 148 7018-Oct-99 291 18 30 n/d 9 46 7 34 82 15 n/d 17 11519-Oct-99 292 43 31 n/d 47 0 63 0 0 62 n/d 4 020-Oct-99 293 0 0 n/d 0 0 0 0 0 0 n/d 0 021-Oct-99 294 0 0 n/d 0 0 0 0 0 0 n/d 0 022-Oct-99 295 0 0 n/d 0 0 0 0 0 0 n/d 0 023-Oct-99 296 0 0 n/d 0 0 0 0 0 0 n/d 0 024-Oct-99 297 0 0 n/d 0 0 0 0 0 0 n/d 0 025-Oct-99 298 0 0 n/d 0 0 0 0 0 0 n/d 0 026-Oct-99 299 0 0 n/d 0 0 0 0 0 0 n/d 0 027-Oct-99 300 0 0 n/d 0 0 0 0 0 0 n/d 0 028-Oct-99 301 0 0 n/d 0 0 0 0 0 0 n/d 0 029-Oct-99 302 0 0 n/d 0 0 0 0 0 0 n/d 0 030-Oct-99 303 59 0 n/d 0 14 0 76 n/d 17 n/d 56 031-Oct-99 304 0 40 n/d 54 0 71 0 n/d 0 n/d 8 001-Nov-99 305 0 0 0 0 0 0 0 0 0 n/d 0 002-Nov-99 306 0 0 0 0 0 0 0 0 0 n/d 0 003-Nov-99 307 0 0 0 0 0 0 0 0 0 n/d 0 004-Nov-99 308 0 0 0 0 0 0 0 0 0 n/d 0 005-Nov-99 309 0 0 0 0 0 0 0 0 0 n/d 0 006-Nov-99 310 0 0 0 0 0 0 0 0 0 n/d 0 007-Nov-99 311 0 0 0 0 0 0 0 0 0 n/d 0 008-Nov-99 312 0 0 0 0 0 0 0 0 0 n/d 0 009-Nov-99 313 0 0 0 0 0 0 0 0 0 n/d 0 010-Nov-99 314 0 0 0 0 0 0 0 0 0 n/d 0 011-Nov-99 315 0 0 0 0 0 0 0 0 0 n/d 0 012-Nov-99 316 0 0 0 0 0 0 0 0 0 n/d 0 013-Nov-99 317 0 0 0 0 0 0 0 0 0 n/d 0 014-Nov-99 318 0 0 0 0 0 0 0 0 0 n/d 0 015-Nov-99 319 0 0 0 0 0 0 0 0 0 n/d 0 016-Nov-99 320 0 0 0 0 0 0 0 0 0 n/d 0 0
Page 19 of 43

B-1. Daily Precipitation Data (1998-1999)
1 2 3 4 5 6 7 8 9 10 11 12Date Julian Date 410832 410902 411007 411215 411398 411429 411431 411492 414254 414374 414782 415113
17-Nov-99 321 0 0 0 0 0 0 0 0 0 n/d 0 018-Nov-99 322 0 0 0 0 0 0 0 0 0 n/d 0 019-Nov-99 323 0 0 0 0 0 0 0 0 0 n/d 0 020-Nov-99 324 0 0 0 0 0 0 0 0 0 n/d 0 021-Nov-99 325 0 0 0 0 0 0 0 0 0 n/d 0 022-Nov-99 326 0 0 0 0 0 0 3 0 0 n/d 0 023-Nov-99 327 0 37 0 0 0 0 0 0 0 n/d 0 024-Nov-99 328 0 0 0 20 0 0 16 0 0 n/d 0 025-Nov-99 329 7 5 0 0 0 4 0 0 4 n/d 0 026-Nov-99 330 0 0 0 0 0 0 0 0 0 n/d 0 027-Nov-99 331 0 0 0 0 0 0 0 0 0 n/d 0 028-Nov-99 332 0 0 0 0 0 0 0 0 0 n/d 0 029-Nov-99 333 0 0 0 0 0 0 0 0 0 n/d 0 030-Nov-99 334 0 0 0 0 0 0 0 0 0 n/d 0 001-Dec-99 335 0 0 0 0 0 0 0 0 0 n/d 0 002-Dec-99 336 0 0 0 0 0 0 0 0 0 n/d 0 003-Dec-99 337 0 0 0 0 0 0 0 0 0 n/d 0 004-Dec-99 338 0 0 0 0 0 0 0 0 0 n/d 0 005-Dec-99 339 0 0 0 0 0 0 0 0 0 n/d 0 006-Dec-99 340 0 0 0 0 0 0 0 0 0 n/d 0 007-Dec-99 341 0 0 0 0 0 0 0 0 0 n/d 0 008-Dec-99 342 0 0 0 0 0 0 5 0 0 n/d 0 009-Dec-99 343 0 0 0 0 0 2 0 0 3 n/d 2 010-Dec-99 344 0 0 0 0 0 0 0 0 0 n/d 0 011-Dec-99 345 0 0 0 0 0 9 49 0 0 n/d 0 012-Dec-99 346 70 0 0 45 0 13 0 0 9 n/d 40 013-Dec-99 347 0 0 0 0 0 0 0 0 0 n/d 0 014-Dec-99 348 0 0 0 0 0 0 0 0 0 n/d 0 015-Dec-99 349 0 0 0 0 0 0 0 0 0 n/d 0 016-Dec-99 350 0 0 0 0 0 0 0 0 0 n/d 0 017-Dec-99 351 0 0 0 0 0 0 0 0 0 n/d 0 018-Dec-99 352 0 0 0 0 0 0 0 0 0 n/d 0 019-Dec-99 353 0 0 0 0 0 0 0 0 0 n/d 0 020-Dec-99 354 0 0 0 0 0 2 19 0 0 n/d 0 021-Dec-99 355 8 0 0 0 0 20 0 0 4 n/d 0 022-Dec-99 356 0 0 0 12 0 0 0 0 9 n/d 0 023-Dec-99 357 0 0 0 0 0 0 0 0 4 n/d 0 0
Page 20 of 43

B-1. Daily Precipitation Data (1998-1999)
1 2 3 4 5 6 7 8 9 10 11 12Date Julian Date 410832 410902 411007 411215 411398 411429 411431 411492 414254 414374 414782 415113
24-Dec-99 358 0 0 0 0 0 0 0 0 0 n/d 0 025-Dec-99 359 0 0 0 0 0 0 0 0 0 n/d 0 026-Dec-99 360 0 0 0 0 0 0 0 0 0 n/d 0 027-Dec-99 361 0 0 0 0 0 0 0 0 0 n/d 0 028-Dec-99 362 0 0 0 0 0 0 0 0 0 n/d 0 029-Dec-99 363 0 0 0 0 0 0 0 0 0 n/d 0 030-Dec-99 364 0 0 0 0 0 0 0 0 0 n/d 0 031-Dec-99 365 0 0 0 0 0 0 0 0 0 n/d 0 0
Page 21 of 43

B-2. Daily Stream Gage Data (15 Oct. - 15 Nov., 1998)
Index of Stream Gages
1 Blanco River At Wimberley 8171000 13 Hondo Creek near Tarpley 82000002 Blanco River near Kyle 8171300 14 Medina River at Bandera 81788803 Cibolo Creek at IH-10 above Bourne 8183850 15 Nueces River at Laguna 81900004 Cibolo Creek at Selma 8185000 16 Nueces River below Uvalde 81920005 Frio River at Concan 8195000 17 West Nueces River near Bracketville 81905006 Frio River below Dry Frio River near Uvalde 8197500 18 Seco Creek at Miller Ranch near Utopia 82015007 Dry Frio River near Reagan Wells 8196000 19 Seco Creek at Rowe Ranch near D'Hanis 82027008 Guadalupe River at Comfort 8167000 20 Sabinal River near Sabinal 81980009 Guadalupe River near Spring Branch 8167500 21 Sabinal River at Sabinal 8198500
10 Guadalupe River at Sattler 8167800 22 Plum Creek at Lockhart 817240011 Guadalupe R. at Comal R. at New Braunfels 8168500 23 Salado Creek (upper Station) at San Antonio 817870012 Hondo Creek at King Waterhole near Hondo 8200700
1 2 3 4 5 6 7 8 9 10 11 12Date Julian Date 8167000 8167500 8167800 8168500 8171000 8171300 8172400 8178700 8178880 8183850 8185000 8190000
15-Oct-98 288 155 198 120 178 74 51 4.2 0 146 3.2 0 36916-Oct-98 289 150 188 120 174 73 50 3 0.01 138 3.1 0 36617-Oct-98 290 182 15600 1230 37400 20800 26000 8840 11600 150 21 32000 36118-Oct-98 291 346 5520 319 13500 6770 8500 19400 6860 316 97 18000 297019-Oct-98 292 339 1590 94 1470 2680 3110 5050 1640 335 83 1300 66520-Oct-98 293 272 920 64 1020 1990 2680 3900 1190 287 57 806 53621-Oct-98 294 251 720 44 795 1450 1960 1470 925 253 43 445 50222-Oct-98 295 227 595 35 628 1100 1480 1110 571 224 35 280 47523-Oct-98 296 205 515 30 532 884 1180 1020 326 203 31 190 44824-Oct-98 297 192 470 29 469 737 980 953 235 189 28 132 42425-Oct-98 298 185 440 30 432 636 830 860 146 181 24 91 40526-Oct-98 299 181 410 28 405 559 720 809 106 174 23 61 38827-Oct-98 300 180 400 27 378 500 640 787 80 169 22 40 37828-Oct-98 301 183 390 39 362 458 580 749 59 165 20 26 36629-Oct-98 302 182 385 58 360 419 520 660 37 160 18 15 35830-Oct-98 303 180 370 359 493 376 460 596 8 156 17 6.7 34831-Oct-98 304 175 367 549 946 344 420 557 2.7 152 16 1.6 3411-Nov-98 305 577 880 557 1030 1830 2190 1090 48 415 95 3.1 4332-Nov-98 306 605 1200 736 1050 928 1120 714 14 469 73 0.66 5103-Nov-98 307 424 867 967 1450 640 760 537 2.8 348 51 0.02 4824-Nov-98 308 349 690 1230 1600 554 660 464 1.2 305 43 0 4465-Nov-98 309 387 688 1690 1910 590 700 435 18 419 56 0 4316-Nov-98 310 361 721 1880 2010 580 690 404 3.4 375 47 0 4277-Nov-98 311 339 705 1870 2020 580 680 369 7.3 362 51 0 4248-Nov-98 312 319 698 1870 2010 580 680 331 2.2 342 48 0 412
Page 1 of 2
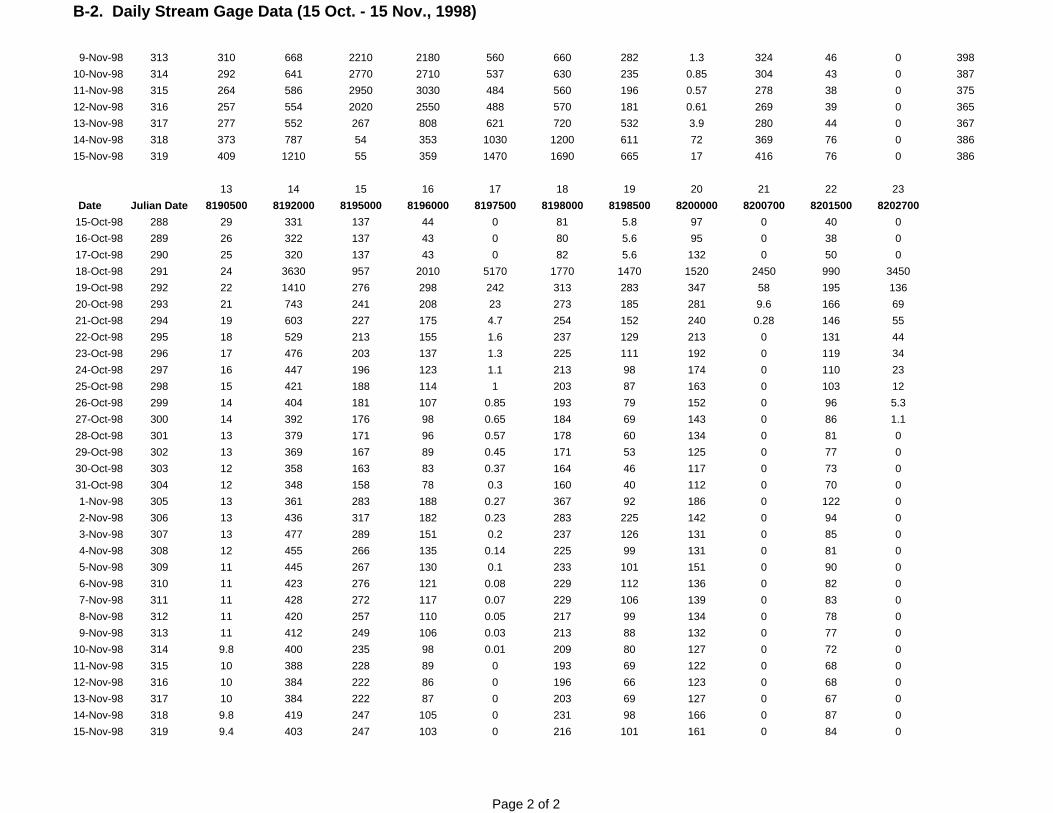
B-2. Daily Stream Gage Data (15 Oct. - 15 Nov., 1998)
9-Nov-98 313 310 668 2210 2180 560 660 282 1.3 324 46 0 39810-Nov-98 314 292 641 2770 2710 537 630 235 0.85 304 43 0 38711-Nov-98 315 264 586 2950 3030 484 560 196 0.57 278 38 0 37512-Nov-98 316 257 554 2020 2550 488 570 181 0.61 269 39 0 36513-Nov-98 317 277 552 267 808 621 720 532 3.9 280 44 0 36714-Nov-98 318 373 787 54 353 1030 1200 611 72 369 76 0 38615-Nov-98 319 409 1210 55 359 1470 1690 665 17 416 76 0 386
13 14 15 16 17 18 19 20 21 22 23Date Julian Date 8190500 8192000 8195000 8196000 8197500 8198000 8198500 8200000 8200700 8201500 8202700
15-Oct-98 288 29 331 137 44 0 81 5.8 97 0 40 016-Oct-98 289 26 322 137 43 0 80 5.6 95 0 38 017-Oct-98 290 25 320 137 43 0 82 5.6 132 0 50 018-Oct-98 291 24 3630 957 2010 5170 1770 1470 1520 2450 990 345019-Oct-98 292 22 1410 276 298 242 313 283 347 58 195 13620-Oct-98 293 21 743 241 208 23 273 185 281 9.6 166 6921-Oct-98 294 19 603 227 175 4.7 254 152 240 0.28 146 5522-Oct-98 295 18 529 213 155 1.6 237 129 213 0 131 4423-Oct-98 296 17 476 203 137 1.3 225 111 192 0 119 3424-Oct-98 297 16 447 196 123 1.1 213 98 174 0 110 2325-Oct-98 298 15 421 188 114 1 203 87 163 0 103 1226-Oct-98 299 14 404 181 107 0.85 193 79 152 0 96 5.327-Oct-98 300 14 392 176 98 0.65 184 69 143 0 86 1.128-Oct-98 301 13 379 171 96 0.57 178 60 134 0 81 029-Oct-98 302 13 369 167 89 0.45 171 53 125 0 77 030-Oct-98 303 12 358 163 83 0.37 164 46 117 0 73 031-Oct-98 304 12 348 158 78 0.3 160 40 112 0 70 01-Nov-98 305 13 361 283 188 0.27 367 92 186 0 122 02-Nov-98 306 13 436 317 182 0.23 283 225 142 0 94 03-Nov-98 307 13 477 289 151 0.2 237 126 131 0 85 04-Nov-98 308 12 455 266 135 0.14 225 99 131 0 81 05-Nov-98 309 11 445 267 130 0.1 233 101 151 0 90 06-Nov-98 310 11 423 276 121 0.08 229 112 136 0 82 07-Nov-98 311 11 428 272 117 0.07 229 106 139 0 83 08-Nov-98 312 11 420 257 110 0.05 217 99 134 0 78 09-Nov-98 313 11 412 249 106 0.03 213 88 132 0 77 0
10-Nov-98 314 9.8 400 235 98 0.01 209 80 127 0 72 011-Nov-98 315 10 388 228 89 0 193 69 122 0 68 012-Nov-98 316 10 384 222 86 0 196 66 123 0 68 013-Nov-98 317 10 384 222 87 0 203 69 127 0 67 014-Nov-98 318 9.8 419 247 105 0 231 98 166 0 87 015-Nov-98 319 9.4 403 247 103 0 216 101 161 0 84 0
Page 2 of 2
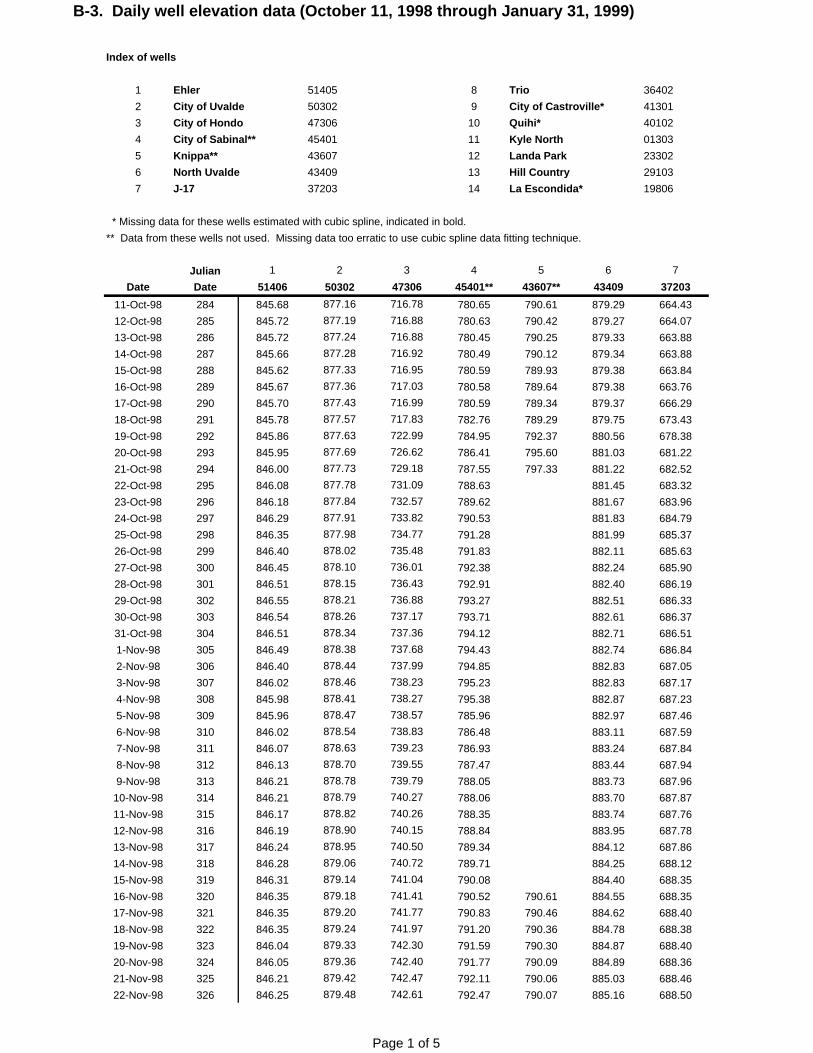
B-3. Daily well elevation data (October 11, 1998 through January 31, 1999)
Index of wells
1 Ehler 51405 8 Trio 364022 City of Uvalde 50302 9 City of Castroville* 413013 City of Hondo 47306 10 Quihi* 401024 City of Sabinal** 45401 11 Kyle North 013035 Knippa** 43607 12 Landa Park 233026 North Uvalde 43409 13 Hill Country 291037 J-17 37203 14 La Escondida* 19806
* Missing data for these wells estimated with cubic spline, indicated in bold.** Data from these wells not used. Missing data too erratic to use cubic spline data fitting technique.
Julian 1 2 3 4 5 6 7Date Date 51406 50302 47306 45401** 43607** 43409 37203
11-Oct-98 284 845.68 877.16 716.78 780.65 790.61 879.29 664.4312-Oct-98 285 845.72 877.19 716.88 780.63 790.42 879.27 664.0713-Oct-98 286 845.72 877.24 716.88 780.45 790.25 879.33 663.8814-Oct-98 287 845.66 877.28 716.92 780.49 790.12 879.34 663.8815-Oct-98 288 845.62 877.33 716.95 780.59 789.93 879.38 663.8416-Oct-98 289 845.67 877.36 717.03 780.58 789.64 879.38 663.7617-Oct-98 290 845.70 877.43 716.99 780.59 789.34 879.37 666.2918-Oct-98 291 845.78 877.57 717.83 782.76 789.29 879.75 673.4319-Oct-98 292 845.86 877.63 722.99 784.95 792.37 880.56 678.3820-Oct-98 293 845.95 877.69 726.62 786.41 795.60 881.03 681.2221-Oct-98 294 846.00 877.73 729.18 787.55 797.33 881.22 682.5222-Oct-98 295 846.08 877.78 731.09 788.63 881.45 683.3223-Oct-98 296 846.18 877.84 732.57 789.62 881.67 683.9624-Oct-98 297 846.29 877.91 733.82 790.53 881.83 684.7925-Oct-98 298 846.35 877.98 734.77 791.28 881.99 685.3726-Oct-98 299 846.40 878.02 735.48 791.83 882.11 685.6327-Oct-98 300 846.45 878.10 736.01 792.38 882.24 685.9028-Oct-98 301 846.51 878.15 736.43 792.91 882.40 686.1929-Oct-98 302 846.55 878.21 736.88 793.27 882.51 686.3330-Oct-98 303 846.54 878.26 737.17 793.71 882.61 686.3731-Oct-98 304 846.51 878.34 737.36 794.12 882.71 686.511-Nov-98 305 846.49 878.38 737.68 794.43 882.74 686.842-Nov-98 306 846.40 878.44 737.99 794.85 882.83 687.053-Nov-98 307 846.02 878.46 738.23 795.23 882.83 687.174-Nov-98 308 845.98 878.41 738.27 795.38 882.87 687.235-Nov-98 309 845.96 878.47 738.57 785.96 882.97 687.466-Nov-98 310 846.02 878.54 738.83 786.48 883.11 687.597-Nov-98 311 846.07 878.63 739.23 786.93 883.24 687.848-Nov-98 312 846.13 878.70 739.55 787.47 883.44 687.949-Nov-98 313 846.21 878.78 739.79 788.05 883.73 687.96
10-Nov-98 314 846.21 878.79 740.27 788.06 883.70 687.8711-Nov-98 315 846.17 878.82 740.26 788.35 883.74 687.7612-Nov-98 316 846.19 878.90 740.15 788.84 883.95 687.7813-Nov-98 317 846.24 878.95 740.50 789.34 884.12 687.8614-Nov-98 318 846.28 879.06 740.72 789.71 884.25 688.1215-Nov-98 319 846.31 879.14 741.04 790.08 884.40 688.3516-Nov-98 320 846.35 879.18 741.41 790.52 790.61 884.55 688.3517-Nov-98 321 846.35 879.20 741.77 790.83 790.46 884.62 688.4018-Nov-98 322 846.35 879.24 741.97 791.20 790.36 884.78 688.3819-Nov-98 323 846.04 879.33 742.30 791.59 790.30 884.87 688.4020-Nov-98 324 846.05 879.36 742.40 791.77 790.09 884.89 688.3621-Nov-98 325 846.21 879.42 742.47 792.11 790.06 885.03 688.4622-Nov-98 326 846.25 879.48 742.61 792.47 790.07 885.16 688.50
Page 1 of 5

B-3. Daily well elevation data (October 11, 1998 through January 31, 1999)
23-Nov-98 327 846.28 879.51 742.75 792.66 790.18 885.19 688.2224-Nov-98 328 846.32 879.53 742.76 793.06 790.22 885.36 688.1225-Nov-98 329 846.32 879.56 742.92 793.26 790.19 885.44 687.9226-Nov-98 330 846.29 879.61 743.00 793.46 790.13 885.48 687.8627-Nov-98 331 846.26 879.64 743.00 793.69 790.02 885.58 687.9628-Nov-98 332 846.24 879.71 743.17 793.97 790.00 885.70 687.9329-Nov-98 333 846.22 879.77 743.33 794.29 790.04 885.86 687.9030-Nov-98 334 846.19 879.75 743.51 794.25 790.06 885.75 687.621-Dec-98 335 846.22 879.78 743.42 794.29 885.82 687.512-Dec-98 336 846.28 879.84 743.18 794.48 885.96 687.543-Dec-98 337 846.76 879.89 743.30 886.06 687.504-Dec-98 338 846.76 879.90 743.39 812.95 886.03 687.435-Dec-98 339 846.78 879.96 743.39 812.94 886.11 687.436-Dec-98 340 846.78 880.02 743.45 812.98 886.15 687.427-Dec-98 341 846.77 880.05 743.54 812.79 886.07 687.188-Dec-98 342 846.69 880.00 743.37 812.64 885.97 687.079-Dec-98 343 846.67 880.05 743.08 812.58 886.07 687.1210-Dec-98 344 846.59 880.10 743.15 812.49 886.07 687.0411-Dec-98 345 846.65 880.11 743.21 812.49 886.08 686.9312-Dec-98 346 846.68 880.15 743.25 812.66 886.15 687.2113-Dec-98 347 846.71 880.18 743.22 812.90 886.18 687.2214-Dec-98 348 846.74 880.24 743.24 813.01 886.23 687.0215-Dec-98 349 846.73 880.29 743.36 813.03 886.24 686.9116-Dec-98 350 846.70 880.27 743.44 813.07 886.30 686.9117-Dec-98 351 846.47 880.31 743.48 813.02 886.36 686.8418-Dec-98 352 846.48 880.35 743.48 813.14 886.55 686.8919-Dec-98 353 846.42 880.35 743.82 813.14 886.42 686.8720-Dec-98 354 846.43 880.35 743.73 813.12 886.42 686.9121-Dec-98 355 846.47 880.39 743.51 812.97 886.47 686.7422-Dec-98 356 846.42 880.36 743.57 812.82 886.33 686.5723-Dec-98 357 846.44 880.39 743.12 812.86 886.37 686.5324-Dec-98 358 846.40 880.39 743.25 812.75 886.31 686.4825-Dec-98 359 846.41 880.45 743.11 812.75 886.43 686.6726-Dec-98 360 846.47 880.50 743.28 812.77 886.53 686.6827-Dec-98 361 846.51 880.57 743.32 812.76 886.57 686.6328-Dec-98 362 846.50 880.55 743.41 812.74 886.57 686.3829-Dec-98 363 846.49 880.56 743.10 812.64 886.56 686.0830-Dec-98 364 846.43 880.57 743.12 812.59 886.59 685.9331-Dec-98 365 846.35 880.57 742.76 812.41 886.58 685.861-Jan-99 1 846.29 880.63 742.68 812.38 886.75 686.082-Jan-99 2 846.25 880.64 742.59 812.02 886.56 685.973-Jan-99 3 846.23 880.58 742.54 811.78 886.44 685.794-Jan-99 4 846.26 880.55 742.19 811.68 886.43 685.575-Jan-99 5 846.25 880.62 742.13 811.69 886.62 685.526-Jan-99 6 846.21 880.62 742.30 811.57 886.59 685.487-Jan-99 7 846.04 880.64 742.27 811.54 886.66 685.448-Jan-99 8 845.89 880.66 741.93 811.47 886.71 685.389-Jan-99 9 845.78 880.65 741.80 811.24 886.58 685.39
10-Jan-99 10 845.77 880.64 741.41 811.20 886.56 685.2011-Jan-99 11 845.68 880.69 741.63 811.20 886.61 685.0312-Jan-99 12 845.70 880.72 741.68 811.21 886.72 684.9613-Jan-99 13 845.66 880.72 741.65 810.99 886.65 684.8514-Jan-99 14 845.54 880.67 741.74 810.86 886.54 684.7215-Jan-99 15 844.80 880.69 741.36 810.86 886.67 684.6416-Jan-99 16 844.47 880.69 741.06 810.90 886.70 684.6617-Jan-99 17 844.45 880.72 741.14 810.74 886.64 684.5418-Jan-99 18 844.27 880.66 740.98 810.63 886.53 684.2719-Jan-99 19 844.00 880.59 740.87 810.56 886.56 684.08
Page 2 of 5
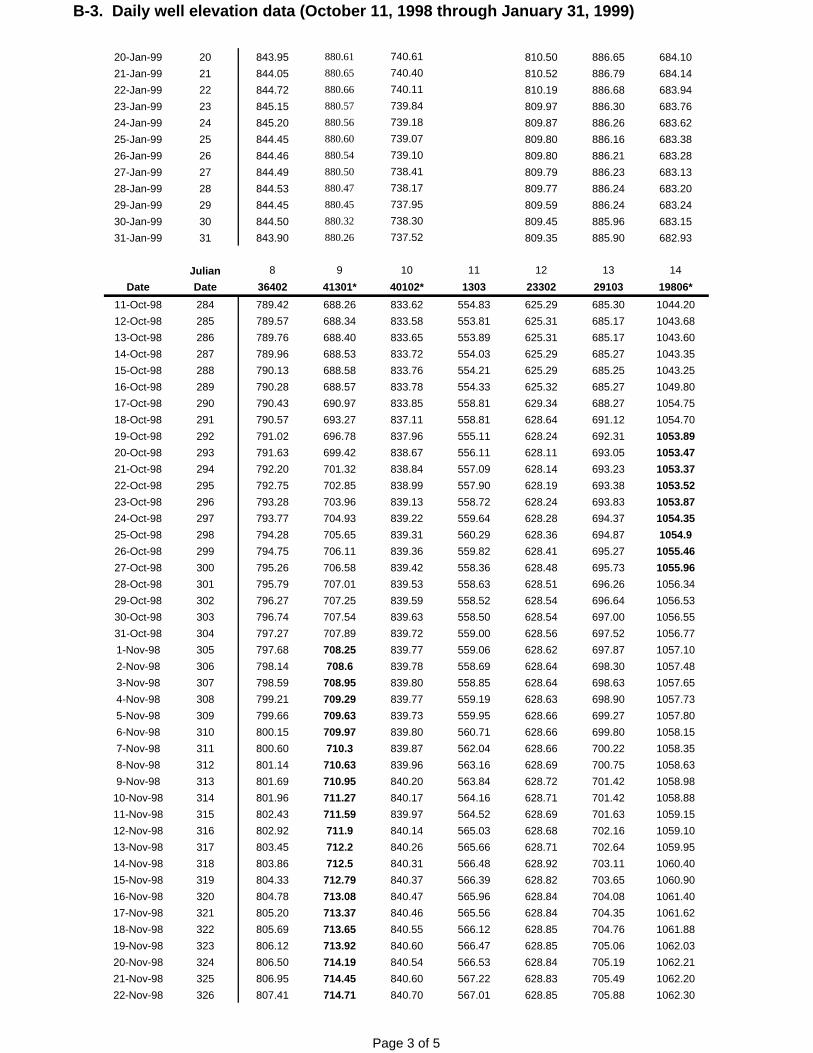
B-3. Daily well elevation data (October 11, 1998 through January 31, 1999)
20-Jan-99 20 843.95 880.61 740.61 810.50 886.65 684.1021-Jan-99 21 844.05 880.65 740.40 810.52 886.79 684.1422-Jan-99 22 844.72 880.66 740.11 810.19 886.68 683.9423-Jan-99 23 845.15 880.57 739.84 809.97 886.30 683.7624-Jan-99 24 845.20 880.56 739.18 809.87 886.26 683.6225-Jan-99 25 844.45 880.60 739.07 809.80 886.16 683.3826-Jan-99 26 844.46 880.54 739.10 809.80 886.21 683.2827-Jan-99 27 844.49 880.50 738.41 809.79 886.23 683.1328-Jan-99 28 844.53 880.47 738.17 809.77 886.24 683.2029-Jan-99 29 844.45 880.45 737.95 809.59 886.24 683.2430-Jan-99 30 844.50 880.32 738.30 809.45 885.96 683.1531-Jan-99 31 843.90 880.26 737.52 809.35 885.90 682.93
Julian 8 9 10 11 12 13 14Date Date 36402 41301* 40102* 1303 23302 29103 19806*
11-Oct-98 284 789.42 688.26 833.62 554.83 625.29 685.30 1044.2012-Oct-98 285 789.57 688.34 833.58 553.81 625.31 685.17 1043.6813-Oct-98 286 789.76 688.40 833.65 553.89 625.31 685.17 1043.6014-Oct-98 287 789.96 688.53 833.72 554.03 625.29 685.27 1043.3515-Oct-98 288 790.13 688.58 833.76 554.21 625.29 685.25 1043.2516-Oct-98 289 790.28 688.57 833.78 554.33 625.32 685.27 1049.8017-Oct-98 290 790.43 690.97 833.85 558.81 629.34 688.27 1054.7518-Oct-98 291 790.57 693.27 837.11 558.81 628.64 691.12 1054.7019-Oct-98 292 791.02 696.78 837.96 555.11 628.24 692.31 1053.8920-Oct-98 293 791.63 699.42 838.67 556.11 628.11 693.05 1053.4721-Oct-98 294 792.20 701.32 838.84 557.09 628.14 693.23 1053.3722-Oct-98 295 792.75 702.85 838.99 557.90 628.19 693.38 1053.5223-Oct-98 296 793.28 703.96 839.13 558.72 628.24 693.83 1053.8724-Oct-98 297 793.77 704.93 839.22 559.64 628.28 694.37 1054.3525-Oct-98 298 794.28 705.65 839.31 560.29 628.36 694.87 1054.926-Oct-98 299 794.75 706.11 839.36 559.82 628.41 695.27 1055.4627-Oct-98 300 795.26 706.58 839.42 558.36 628.48 695.73 1055.9628-Oct-98 301 795.79 707.01 839.53 558.63 628.51 696.26 1056.3429-Oct-98 302 796.27 707.25 839.59 558.52 628.54 696.64 1056.5330-Oct-98 303 796.74 707.54 839.63 558.50 628.54 697.00 1056.5531-Oct-98 304 797.27 707.89 839.72 559.00 628.56 697.52 1056.771-Nov-98 305 797.68 708.25 839.77 559.06 628.62 697.87 1057.102-Nov-98 306 798.14 708.6 839.78 558.69 628.64 698.30 1057.483-Nov-98 307 798.59 708.95 839.80 558.85 628.64 698.63 1057.654-Nov-98 308 799.21 709.29 839.77 559.19 628.63 698.90 1057.735-Nov-98 309 799.66 709.63 839.73 559.95 628.66 699.27 1057.806-Nov-98 310 800.15 709.97 839.80 560.71 628.66 699.80 1058.157-Nov-98 311 800.60 710.3 839.87 562.04 628.66 700.22 1058.358-Nov-98 312 801.14 710.63 839.96 563.16 628.69 700.75 1058.639-Nov-98 313 801.69 710.95 840.20 563.84 628.72 701.42 1058.98
10-Nov-98 314 801.96 711.27 840.17 564.16 628.71 701.42 1058.8811-Nov-98 315 802.43 711.59 839.97 564.52 628.69 701.63 1059.1512-Nov-98 316 802.92 711.9 840.14 565.03 628.68 702.16 1059.1013-Nov-98 317 803.45 712.2 840.26 565.66 628.71 702.64 1059.9514-Nov-98 318 803.86 712.5 840.31 566.48 628.92 703.11 1060.4015-Nov-98 319 804.33 712.79 840.37 566.39 628.82 703.65 1060.9016-Nov-98 320 804.78 713.08 840.47 565.96 628.84 704.08 1061.4017-Nov-98 321 805.20 713.37 840.46 565.56 628.84 704.35 1061.6218-Nov-98 322 805.69 713.65 840.55 566.12 628.85 704.76 1061.8819-Nov-98 323 806.12 713.92 840.60 566.47 628.85 705.06 1062.0320-Nov-98 324 806.50 714.19 840.54 566.53 628.84 705.19 1062.2121-Nov-98 325 806.95 714.45 840.60 567.22 628.83 705.49 1062.2022-Nov-98 326 807.41 714.71 840.70 567.01 628.85 705.88 1062.30
Page 3 of 5

B-3. Daily well elevation data (October 11, 1998 through January 31, 1999)
23-Nov-98 327 807.81 714.96 840.69 566.45 628.88 706.09 1062.4524-Nov-98 328 808.30 715.21 840.81 566.77 628.86 706.46 1062.7725-Nov-98 329 808.69 715.45 840.87 567.07 628.87 706.64 1062.8926-Nov-98 330 809.08 715.68 840.87 566.80 628.84 706.89 1062.9127-Nov-98 331 809.50 715.91 840.94 567.11 628.86 707.20 1063.1428-Nov-98 332 809.94 716.13 840.77 567.51 628.87 707.53 1063.2529-Nov-98 333 810.34 716.34 840.72 567.71 628.88 707.90 1063.4930-Nov-98 334 810.58 716.55 840.83 566.85 628.88 707.87 1063.501-Dec-98 335 810.97 716.75 841.02 566.82 628.85 707.95 1063.202-Dec-98 336 811.30 716.95 841.23 566.91 628.84 708.40 1063.413-Dec-98 337 811.42 717.11 841.38 567.25 628.85 708.78 1063.844-Dec-98 338 811.72 717.14 841.38 567.86 628.85 708.85 1063.825-Dec-98 339 812.08 717.12 841.47 568.03 628.84 709.14 1063.946-Dec-98 340 812.39 717.14 841.54 567.83 628.83 709.35 1064.087-Dec-98 341 812.53 717.03 841.52 567.02 628.84 709.42 1064.078-Dec-98 342 812.79 716.75 841.39 567.18 628.82 709.36 1063.879-Dec-98 343 813.11 716.72 841.54 567.49 628.79 709.76 1063.9210-Dec-98 344 813.34 716.78 841.57 567.64 628.79 710.09 1064.0211-Dec-98 345 813.59 716.74 841.60 567.86 628.79 710.13 1064.0712-Dec-98 346 813.85 716.77 841.67 568.20 628.79 710.32 1064.0913-Dec-98 347 814.09 716.72 841.71 567.85 628.79 710.47 1064.0814-Dec-98 348 814.33 716.72 841.77 566.76 628.80 710.64 1064.1715-Dec-98 349 814.57 716.69 841.80 566.80 628.80 710.92 1064.1716-Dec-98 350 814.81 716.72 841.89 566.84 628.77 711.15 1064.2617-Dec-98 351 815.16 716.72 841.99 567.31 628.77 711.42 1064.3018-Dec-98 352 815.47 717.04 842.27 568.37 629.60 711.93 1064.7419-Dec-98 353 815.61 716.90 842.16 568.41 628.79 711.91 1064.7320-Dec-98 354 815.85 716.77 842.19 568.31 628.79 711.93 1064.7321-Dec-98 355 816.05 716.78 842.29 568.37 628.79 712.14 1064.8322-Dec-98 356 816.16 716.51 842.14 567.81 628.76 711.98 1064.6523-Dec-98 357 816.34 716.48 842.23 567.50 628.75 712.17 1064.6224-Dec-98 358 816.53 716.41 842.20 566.70 628.74 712.25 1064.5125-Dec-98 359 816.76 716.43 842.34 566.56 628.73 712.54 1064.5826-Dec-98 360 817.02 716.61 842.50 567.30 628.73 712.82 1064.8527-Dec-98 361 817.20 716.74 842.63 567.05 628.73 713.02 1065.0528-Dec-98 362 817.40 716.65 842.68 566.75 628.73 713.10 1065.1329-Dec-98 363 817.48 716.56 842.68 566.47 628.68 713.17 1065.2730-Dec-98 364 817.72 716.33 842.77 566.73 628.67 713.22 1065.0731-Dec-98 365 817.87 716.25 842.77 566.85 628.66 713.28 1065.091-Jan-99 1 818.11 716.36 843.03 567.50 628.71 713.74 1065.502-Jan-99 2 818.11 716.21 842.92 567.40 628.71 713.64 1065.403-Jan-99 3 818.07 715.84 842.69 567.04 628.67 713.22 1064.924-Jan-99 4 818.18 715.65 842.72 566.42 628.65 713.25 1064.695-Jan-99 5 818.42 715.84 843.00 566.45 628.65 713.77 1065.056-Jan-99 6 818.53 715.83 843.05 566.60 628.64 713.86 1065.087-Jan-99 7 818.71 715.78 843.17 567.00 628.62 714.05 1065.278-Jan-99 8 818.83 715.80 843.26 567.44 628.62 714.18 1065.409-Jan-99 9 818.83 715.62 843.11 567.53 628.59 713.97 1065.27
10-Jan-99 10 818.89 715.39 843.14 567.28 628.59 713.88 1065.0311-Jan-99 11 819.08 715.37 843.31 566.61 628.59 714.25 1065.1512-Jan-99 12 819.24 715.49 843.48 566.80 628.59 714.44 1065.4213-Jan-99 13 819.27 715.40 843.43 566.80 628.57 714.35 1065.4314-Jan-99 14 819.27 715.09 843.31 566.99 628.54 714.11 1065.0515-Jan-99 15 819.39 715.06 843.53 567.15 628.51 714.35 1065.2216-Jan-99 16 819.52 715.09 843.65 567.41 628.51 714.77 1065.3917-Jan-99 17 819.55 714.98 843.63 566.97 628.51 714.95 1065.4218-Jan-99 18 819.55 714.76 843.54 565.90 628.49 714.52 1065.0919-Jan-99 19 819.63 714.61 843.67 565.79 628.48 714.66 1065.18
Page 4 of 5
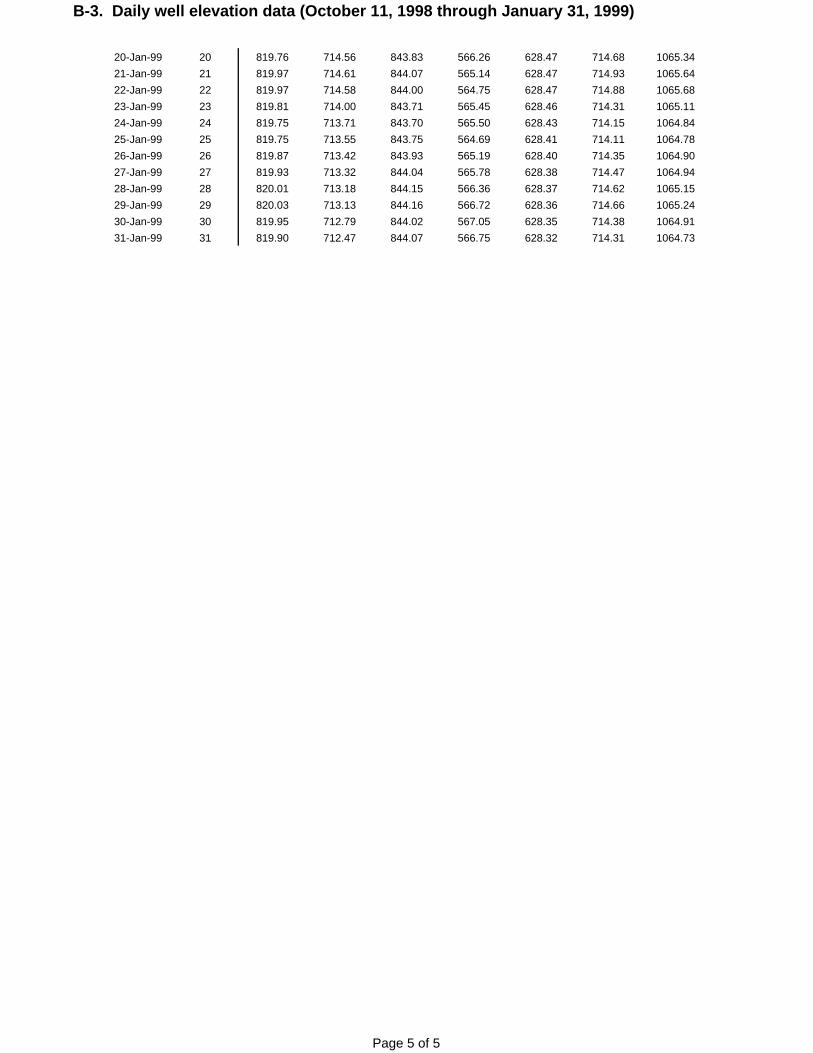
B-3. Daily well elevation data (October 11, 1998 through January 31, 1999)
20-Jan-99 20 819.76 714.56 843.83 566.26 628.47 714.68 1065.3421-Jan-99 21 819.97 714.61 844.07 565.14 628.47 714.93 1065.6422-Jan-99 22 819.97 714.58 844.00 564.75 628.47 714.88 1065.6823-Jan-99 23 819.81 714.00 843.71 565.45 628.46 714.31 1065.1124-Jan-99 24 819.75 713.71 843.70 565.50 628.43 714.15 1064.8425-Jan-99 25 819.75 713.55 843.75 564.69 628.41 714.11 1064.7826-Jan-99 26 819.87 713.42 843.93 565.19 628.40 714.35 1064.9027-Jan-99 27 819.93 713.32 844.04 565.78 628.38 714.47 1064.9428-Jan-99 28 820.01 713.18 844.15 566.36 628.37 714.62 1065.1529-Jan-99 29 820.03 713.13 844.16 566.72 628.36 714.66 1065.2430-Jan-99 30 819.95 712.79 844.02 567.05 628.35 714.38 1064.9131-Jan-99 31 819.90 712.47 844.07 566.75 628.32 714.31 1064.73
Page 5 of 5


