This article was downloaded by: [University of California Santa Cruz]On: 24 October 2014, At: 22:28Publisher: Taylor & FrancisInforma Ltd Registered in England and Wales Registered Number: 1072954 Registered office: Mortimer House,37-41 Mortimer Street, London W1T 3JH, UK
Journal of Biopharmaceutical StatisticsPublication details, including instructions for authors and subscription information:http://www.tandfonline.com/loi/lbps20
A SEQUENTIAL PROCEDURE FOR COMPARING TWOEXPERIMENTAL TREATMENTS WITH A CONTROLEmmanuelle Vincent a , Susan Todd b & John Whitehead ba Pfizer Global Research and Development , Fresnes Laboratories , 3 à 9 rue de la Loge,Fresnes Cedex, 94265, Franceb Medical and Pharmaceutical Statistics Research Unit , The University of Reading , EarleyGate, Reading, RG6 6FN, UKPublished online: 05 Oct 2011.
To cite this article: Emmanuelle Vincent , Susan Todd & John Whitehead (2002) A SEQUENTIAL PROCEDURE FOR COMPARINGTWO EXPERIMENTAL TREATMENTS WITH A CONTROL, Journal of Biopharmaceutical Statistics, 12:2, 249-265, DOI: 10.1081/BIP-120015747
To link to this article: http://dx.doi.org/10.1081/BIP-120015747
PLEASE SCROLL DOWN FOR ARTICLE
Taylor & Francis makes every effort to ensure the accuracy of all the information (the “Content”) containedin the publications on our platform. However, Taylor & Francis, our agents, and our licensors make norepresentations or warranties whatsoever as to the accuracy, completeness, or suitability for any purpose of theContent. Any opinions and views expressed in this publication are the opinions and views of the authors, andare not the views of or endorsed by Taylor & Francis. The accuracy of the Content should not be relied upon andshould be independently verified with primary sources of information. Taylor and Francis shall not be liable forany losses, actions, claims, proceedings, demands, costs, expenses, damages, and other liabilities whatsoeveror howsoever caused arising directly or indirectly in connection with, in relation to or arising out of the use ofthe Content.
This article may be used for research, teaching, and private study purposes. Any substantial or systematicreproduction, redistribution, reselling, loan, sub-licensing, systematic supply, or distribution in anyform to anyone is expressly forbidden. Terms & Conditions of access and use can be found at http://www.tandfonline.com/page/terms-and-conditions
A SEQUENTIAL PROCEDURE FOR COMPARINGTWO EXPERIMENTAL TREATMENTS
WITH A CONTROL
Emmanuelle Vincent,1,* Susan Todd,2 and John Whitehead2
1Pfizer Global Research and Development, Fresnes Laboratories,
3 a 9 rue de la Loge, 94265 Fresnes Cedex, France2Medical and Pharmaceutical Statistics Research Unit, The University
of Reading, Earley Gate, Reading RG6 6FN, UK
ABSTRACT
A procedure is described in which patients are randomized between two
experimental treatments and a control. At a series of interim analyses, each
experimental treatment is compared with control. One of the experimental
treatments might then be found sufficiently superior to the control for it to be
declared the best treatment, and the trial stopped. Alternatively, experimental
treatments might be eliminated from further consideration at any stage. It is
shown how the procedure can be conducted while controlling overall error
probabilities. Data concerning evaluation of different doses of riluzole in the
treatment of motor neurone disease are used for illustration.
Key Words: Clinical trials; Multiple comparisons; Sequential methods
INTRODUCTION
Sequential designs for clinical comparisons of two treatments are now well
established and widely implemented: for introductory accounts see Whitehead[1]
249
DOI: 10.1081/BIP-120015747 1054-3406 (Print); 1520-5711 (Online)Copyright q 2002 by Marcel Dekker, Inc. www.dekker.com
*Corresponding author. E-mail: [email protected]
JOURNAL OF BIOPHARMACEUTICAL STATISTICS
Vol. 12, No. 2, pp. 249–265, 2002
©2002 Marcel Dekker, Inc. All rights reserved. This material may not be used or reproduced in any form without the express written permission of Marcel Dekker, Inc.
MARCEL DEKKER, INC. • 270 MADISON AVENUE • NEW YORK, NY 10016
Dow
nloa
ded
by [
Uni
vers
ity o
f C
alif
orni
a Sa
nta
Cru
z] a
t 22:
28 2
4 O
ctob
er 2
014
and Jennison and Turnbull.[2] Much less developed is the methodology for
comparing more than two treatments. In practice, ad-hoc modifications to methods
for two treatments have often been used: see Whitehead and Thomas[3] for a
description of a comparison of two nonsteroidal anti-flammatory drugs with
placebo control in arthritis and Johnson et al.,[4] who compare low and high
intravenous doses of a drug with oral administration in prostatic cancer.
Amongst multiple treatment methods, three situations can be distinguished:
(a) The treatments comprise a control and two or more qualitatively
different experimental treatments;
(b) The treatments are all qualitatively different and none of them can be
considered to be a control;
(c) The treatments are different doses of the same drug, and if a control
group is present it can be characterized as being dose 0.
This paper concerns situation (a), which commonly arises in drug
development. The objective is to establish whether one or more of the
experimental treatments is significantly superior to a control. A series of interim
analyses will allow early elimination of inferior treatments or early selection of the
obvious best. The goal of early elimination and selection will be pursued in order
to minimize the exposure of patients to inferior treatments. Alternative approaches
might give precise estimation a greater priority, which would lead to an
avoidance of eliminating or selecting treatments early, but this strategy is not
adopted here.
Previous approaches to situation (a) include the method of Paulson[5] that
allowed elimination of inferior treatments, but did not consider whether the
remaining treatments were significantly better than control. Follmann, Proschan,
and Geller[6] consider an approach to sequential multiple treatment comparisons
that can be applied to either situation (a) or (b) (see also Ref. [7]). They apply an
a-spending function approach to the preservation of overall type I error rate, and
evaluate the associated critical stopping limits using simulation. Although the
approach taken here differs in detail, it can be viewed as building upon Follmann,
Proschan, and Geller’s work, adding to it methods for achieving set power that
react progressively to accumulating knowledge of the rate at which information is
acquired and of values of certain nuisance parameters. Numerical integration is
used for all calculations, rather than simulation. Tang and Geller[8] suggest an
alternative approach based on a closed testing procedure, as an application of a
method developed principally in the context of multiple endpoints. They present
procedures that preserve type I error, but do not explore the computation of power
in any detail.
The methods developed for case (a) may be applied when treatments are
actually alternative doses of the same drug. This is appropriate when it is not
desirable to make assumptions about the shape of the dose–response curve. The
principal illustration of this paper is a phase III comparison of placebo and daily
doses of 50, 100, and 200 mg bid of the drug riluzole in amyotrophic lateral
VINCENT, TODD, AND WHITEHEAD250
©2002 Marcel Dekker, Inc. All rights reserved. This material may not be used or reproduced in any form without the express written permission of Marcel Dekker, Inc.
MARCEL DEKKER, INC. • 270 MADISON AVENUE • NEW YORK, NY 10016
Dow
nloa
ded
by [
Uni
vers
ity o
f C
alif
orni
a Sa
nta
Cru
z] a
t 22:
28 2
4 O
ctob
er 2
014
sclerosis (ALS).[9] This condition is also known as motor neurone disease or Lou
Gehrig’s disease. The endpoint under consideration was survival time from
randomization to death, and at the design stage investigators were not prepared to
assume monotonicity of the dose–response relationship, let alone linearity. This
trial is described in greater detail in “A Trial Evaluating Riluzole in the Treatment
of Amyotrophic Lateral Sclerosis.”
Situation (b), in which no treatment acts as control, is less common in
clinical trials. Were it to occur, it is unlikely that the elimination procedure of
Paulson[10] or the sequential x 2- and F-tests of Siegmund[11] and Jennison and
Turnbull[12] would be suitable. The former seeks to select the best treatment,
without regard to it being significantly better than its rivals; the latter stop as soon
as it has been established that not all treatments are identical, regardless of the
pattern of treatment effects. Of greater practical interest for clinical trials is the
extension due to Siegmund[13] for the case of three treatments: once it has been
established that the treatments are not identical, a second stage is used to identify
the best. This approach is applied to three treatment survival studies by
Betensky.[14] As mentioned earlier, the approach due to Follmann, Proschan, and
Geller[6] can also be applied to case (b).
In case (c), the treatments are all doses of the same drug, and if a particular
form of dose–response relationship can be assumed, then specific methods can be
applied. Whitehead (see Ref. [1]; Section 8.4) describes a sequential trend test
applicable to binary responses which is a sequential version of the trend test of
Armitage.[15] Focusing on a single parameter such as slope allows the direct
application of univariate procedures.
The methodology described in this paper is based on the statistics comparing
each of the experimental treatments with control, and their joint, approximately
multivariate normal distribution. Especially important is the allowance for the
correlations between them. The approach builds on the methods of bivariate
sequential analysis developed for the simultaneous monitoring of safety and
efficacy in a comparison of two treatments by Jennison and Turnbull[16] and Cook
and Farewell.[17] More specifically, we extend the work of Todd[18,19] who allows
for updating the parameters underlying the design at each interim analysis in the
context of a more general formulation. This allows us to determine designs that
will achieve given overall power specifications, and enables appropriate
recomputation of future stopping limits in line with emerging patterns of
information accrual and correlation.
A TRIAL EVALUATING RILUZOLE IN THE TREATMENT OFAMYOTROPHIC LATERAL SCLEROSIS
Between December 1992 and November 1993, 959 patients suffering
from ALS were randomized in roughly equal proportions between a placebo
EXPERIMENTAL TREATMENTS WITH CONTROL 251
©2002 Marcel Dekker, Inc. All rights reserved. This material may not be used or reproduced in any form without the express written permission of Marcel Dekker, Inc.
MARCEL DEKKER, INC. • 270 MADISON AVENUE • NEW YORK, NY 10016
Dow
nloa
ded
by [
Uni
vers
ity o
f C
alif
orni
a Sa
nta
Cru
z] a
t 22:
28 2
4 O
ctob
er 2
014
control arm and daily doses 50, 100, and 200 mg bid of the drug riluzole.[9]
Treatment was administered to each patient for a period of up to 18 months,
after which open label treatment was allowed at the discretion of the treating
clinician. The primary efficacy response was time from randomization to
failure, where failure included death, tracheostomy, or intubation with artificial
ventilation. Survival times were censored at 18 months or at the analysis cut-
off date of 31 December 1994. The principal analysis was based on logrank
tests stratified by mode of disease onset (limb or bulbar). An intention-to-treat
approach was taken, and data from all 959 randomized patients were included.
Each dose group was separately compared with control, with primary attention
focused on the case of the 100 mg group because this dose had already been
found to have a significantly beneficial effect on survival in an earlier phase II
study. Although a trend test was planned in the protocol, this was not
identified as the primary analysis because no pre-trial assumption of linearity
(in log dose; placebo taken to be dose 1) could confidently be made. Indeed,
it was feared that adverse events might cause mortality to be higher on
200 mg than on 100 mg and so not even monotonicity could be taken for
granted.
The trial employed separate sequential “open top” designs[1] for each
pairwise comparison with placebo. Using this method, the logrank statistic, in the
form observed number of failures on control minus expected number and stratified
by mode of onset, was plotted against its null variance at each of a series of five
interim analyses. The null variance is approximately equal to one quarter of the
number of failures and the logrank statistic has expected value equal to the log
hazard ratio multiplied by the null variance. The log hazard ratio is expressed so as
to have positive values if riluzole is superior to control. The opentop design has a
single lower boundary, and if the logrank statistic ever falls below this, it can be
concluded that riluzole is significantly worse than control. Otherwise, the trial
proceeds to its planned conclusion and a final analysis that allows for the use of the
lower boundary is conducted.
This mild form of sequential procedure allowed stopping of the trial for
evidence of harm, but not for benefit. The investigators were reluctant to stop
early for benefit in this trial because of the complications of the eventual
multiple comparisons with control, and because of concern that the hazards in
the riluzole groups might converge to that in the control group over time. The
latter feature had already been suggested by the data from the phase II trial of
the 100 mg dose and, if true, it would invalidate the assumption of propor-
tional hazards. Consequently, a sequential design based on proportional hazards
would have an elevated probability of wrongly stopping at an early interim
analysis.
The method described in this paper allows properly for the multiple
comparison issue, but it must be acknowledged that it does depend for its validity
on proportional hazards. Retrospective reanalyzes of data from the riluzole trial
will nevertheless be used to illustrate the new methodology.
VINCENT, TODD, AND WHITEHEAD252
©2002 Marcel Dekker, Inc. All rights reserved. This material may not be used or reproduced in any form without the express written permission of Marcel Dekker, Inc.
MARCEL DEKKER, INC. • 270 MADISON AVENUE • NEW YORK, NY 10016
Dow
nloa
ded
by [
Uni
vers
ity o
f C
alif
orni
a Sa
nta
Cru
z] a
t 22:
28 2
4 O
ctob
er 2
014
A REVIEW OF SEQUENTIAL METHODS FOR TWOTREATMENTS
In this paper, the parameterizations and test statistics presented in Ref. [1]
will be combined with the error-spending approach of Slud and Wei.[20] In this
section, the approach will be reviewed in the simpler setting of two treatments: an
experimental (E ) and a control (C ).
The parameter u represents the true advantage of E over C (if u . 0; then E
is better than C ). For binary data, u could be a log-odds ratio; for survival data a
log-hazard ratio. The statistic Z is the efficient score statistic for u based on the
available data, while V represents Fisher’s (observed) information about u
contained in the data. In the survival case mentioned earlier, Z and V are the
logrank and its null variance, respectively. When u is small, conditionally on the
value of V, Z follows the normal distribution with mean uV and variance V.
Furthermore, in the cases of binary and survival data, and in many more situations,
Z has independent increments between consecutive interim analyses and values of
Z plotted against V at successive interim analyses resemble points on a
Brownian motion with drift u.[21] Note that, in this notation, the variance of Z is
not unity.
A sequential procedure consists of a series of interim analyses. At the mth
of these, the test statistics, denoted by Zm and Vm, are calculated, m ¼ 1; . . . ;M:If Zm � ð‘m; umÞ; where ‘m and um are critical bounds such that ‘m , um; then
the trial will be stopped. Usually the outcome Zm . um corresponds to evidence
that E is significantly better than C, while Zm , ‘m corresponds to evidence that
E is no better than or significantly worse than C. The values ‘m and um are
determined so that the null probability that Zj . uj; for any j # m; is equal to a
predetermined fraction of the overall one-sided type I error rate a. The critical
values ‘m and um are computed progressively, so that when they are to be found,
the values ‘j and uj ð j ¼ 1; . . . ;m 2 1Þ are already known. There remains a
constraint to be set, which can be done by requiring that ‘m ¼ 2um or by
specifying a second spending function concerning the null probability of Zj , ‘j;for any j # m; m ¼ 1; . . . ;M:
The power of the procedure is the probability that for some m, Zm . um
for a clinically relevant value uR (.0) of u. The value of VM is fixed in order
that the pre-specified power is achieved. The power does depend on the
sequence of values V1, V2, . . . actually observed, but it will be fixed for the
sequence that is anticipated at the design stage. In fact the power changes
little in response to minor departures from the anticipated schedule of V
values: the design can be progressively modified in order to preserve power if
there is a more substantial departure from the interim analysis schedule.
Jennison and Turnbull (see Ref. [2]: Section 7.2.2) discuss the robustness of
power to changes in the schedule of looks and Scharfstein and Tsiatis[22]
describe ways of modifying designs to preserve power when departures from
the schedule are more substantial.
EXPERIMENTAL TREATMENTS WITH CONTROL 253
©2002 Marcel Dekker, Inc. All rights reserved. This material may not be used or reproduced in any form without the express written permission of Marcel Dekker, Inc.
MARCEL DEKKER, INC. • 270 MADISON AVENUE • NEW YORK, NY 10016
Dow
nloa
ded
by [
Uni
vers
ity o
f C
alif
orni
a Sa
nta
Cru
z] a
t 22:
28 2
4 O
ctob
er 2
014
A SEQUENTIAL DESIGN FOR THE COMPARISON OF TWOEXPERIMENTAL TREATMENTS WITH A CONTROL
The procedure described in this section generalizes the univariate approach
of “A Review of Sequential Methods for Two Treatments,” enabling selection of
the best of several experimental treatments while controlling an overall type I error
rate and power. The sequential aspect of the procedure allows the selection of the
best experimental treatment at any of the planned interim inspections, provided
sufficient information has been gathered. Elimination of an experimental
treatment found to be worse than control is also permitted at any interim inspection
of the data. Thus, both a selection and an elimination process are carried out
simultaneously through this sequential procedure. The procedure developed here
is conducted using the statistics described in the previous section for pairwise
comparisons of treatments with control and derived as efficient for the respective
marginal null hypotheses. This allows the use of familiar test statistics and
becomes natural once treatments have been eliminated. For simplicity, the
procedure is developed for the case of just two experimental treatments and
control, but the principles involved can be extended to more.
Overall Type I Error Rate and Overall Power
An overall type I error rate v is defined as the probability that at least one of the
experimental treatments is found to be sufficiently better than the control under the
overall null hypothesis H0 that all experimental treatments are equivalent to control.
By definition, this type I error rate is one-sided: the probability that is controlled
under H0 is the probability of wrongly selecting one of the experimental treatments.
The word significantly and the notation p are avoided here since conventional levels
for these quantities may not be appropriate in this bivariate setting.
The overall power, 1 2 l; is defined as the probability of selecting the best
experimental treatment provided the latter is in truth better than control and better
than the other experimental treatment. The alternative hypothesis H1 considered
here and defined later has already been used by Dunnett,[23] who allows a more
general formulation and considers fixed sample sizes, and by Thall, Simon, and
Ellenberg[24] who develop two-stage procedures applied to oncology clinical trials.
Following “A Review of Sequential Methods for Two Treatments,” let the
parameter ui represent the true advantage of experimental Ei over the control
ði ¼ 1; 2Þ: The statistics ZðiÞm compare each experimental treatment Ei with the
control at each interim inspection m ðm ¼ 1; . . . ;MÞ : ZðiÞm is the efficient score
statistic for ui based on the data available from the control and the ith experimental
treatment. The statistics V ðiÞm represent Fisher’s (observed) information about ui at
the mth interim inspection ði ¼ 1; 2; m ¼ 1; . . . ;MÞ:At the mth interim inspection, the observed efficient scores ZðiÞ
m are compared
to the critical bounds cm
pV ðiÞ
m and dm
pV ðiÞ
m ; where cm and dm are critical values
VINCENT, TODD, AND WHITEHEAD254
©2002 Marcel Dekker, Inc. All rights reserved. This material may not be used or reproduced in any form without the express written permission of Marcel Dekker, Inc.
MARCEL DEKKER, INC. • 270 MADISON AVENUE • NEW YORK, NY 10016
Dow
nloa
ded
by [
Uni
vers
ity o
f C
alif
orni
a Sa
nta
Cru
z] a
t 22:
28 2
4 O
ctob
er 2
014
with cm . dm, common to the two dimensions ði ¼ 1 and 2Þ and chosen to
control the overall type I error rate and overall power. If both observed ZðiÞm lie
within the continuation region ðdm
pV ðiÞ
m ; cm
pV ðiÞ
m Þ then both pairwise comparisons
with control are considered again at the ðm þ lÞth interim inspection. The
sequential procedure stops if for at least one experimental treatment Ei, i ¼ 1; 2;the observed statistic ZðiÞ
m is greater than cm
pV ðiÞ
m ; in this case, experimental
treatment Ei is selected as the best treatment. However, if ZðiÞm is less than dm
pV ðiÞ
m ;then experimental treatment Ei is eliminated and will not be considered at any later
inspection. If both experimental treatments are found to be sufficiently better than
control, then the selection of the best experimental treatment is made according to
some predefined criterion, such as an ordering in ZðiÞm ; ZðiÞ
m =p
V ðiÞm ; or ZðiÞ
m =V ðiÞm : If, by
the end of the sequential procedure, neither of the experimental treatments has
been selected or both have been eliminated, then neither can be regarded as
superior to the control. This procedure is described in “A Review of Sequential
Methods for Two Treatments” and illustrated in Fig. 1(c) of Ref. [19].
Computation of the overall type I error rate v can be illustrated in the simple
situation in which only two looks at the data are planned: one interim and one final
inspection ðM ¼ 2Þ: The overall one-sided type I error rate v is then the probability
that at least one of the two experimental treatments is found to be sufficiently better
than control at either look at the data, under the overall null hypothesis H0 that both
experimental treatments are equivalent to control: H0 : u1 ¼ u2 ¼ 0: The
continuation region for treatment Ei at the first interim look at the data is defined as:
CðiÞ1 ¼ d1
ffiffiffiffiffiffiffiV ðiÞ
1
q; c1
ffiffiffiffiffiffiffiV ðiÞ
1
q� �; i ¼ 1; 2:
Then:
v ¼ P Zð1Þ1 $ c1
ffiffiffiffiffiffiffiffiV ð1Þ
1
qand=or Zð2Þ
1 $ c1
ffiffiffiffiffiffiffiffiV ð2Þ
1
q� �
þ P Zð1Þ2 $ c2
ffiffiffiffiffiffiffiffiV ð1Þ
2
qand=or Zð2Þ
2 $ c2
ffiffiffiffiffiffiffiffiV ð2Þ
2
q� ��
and�Zð1Þ
1 [ Cð1Þ1 and Zð2Þ
1 [ Cð2Þ1
��
þ P Zð1Þ2 $ c2
ffiffiffiffiffiffiffiffiV ð1Þ
2
qand Zð1Þ
1 [ Cð1Þ1 and Zð2Þ
1 # d1
ffiffiffiffiffiffiffiffiV ð2Þ
1
q� �� �
þ P Zð2Þ2 $ c2
ffiffiffiffiffiffiffiffiV ð2Þ
2
qand Zð2Þ
1 [ Cð2Þ1 and Zð1Þ
1 # d1
ffiffiffiffiffiffiffiffiV ð1Þ
1
q� �� �:ð1Þ
The alternative hypothesis H1 considered is based on two quantities, d1 and d 2,
ðd 2 . d1 . 0Þ: The value d1 corresponds to a marginal improvement over the
control, whereas d 2 represents a clinically relevant improvement. Suppose that only
one of the two experimental treatments achieves a clinically relevant improvement
ui ¼ d 2 over the control, the remaining experimental treatment brings only a
EXPERIMENTAL TREATMENTS WITH CONTROL 255
©2002 Marcel Dekker, Inc. All rights reserved. This material may not be used or reproduced in any form without the express written permission of Marcel Dekker, Inc.
MARCEL DEKKER, INC. • 270 MADISON AVENUE • NEW YORK, NY 10016
Dow
nloa
ded
by [
Uni
vers
ity o
f C
alif
orni
a Sa
nta
Cru
z] a
t 22:
28 2
4 O
ctob
er 2
014
marginal improvement d1 over the control. In this case, it is important that we select
the better treatment and that we do not select the other. The power of the procedure,
1 2 l; is defined as the probability of making the correct selection under this
alternative hypothesis, denoted by H1. The values d1 and d 2 thus define an
indifference zone. The number of patients per treatment group is calculated to
achieve a specified value of overall power.
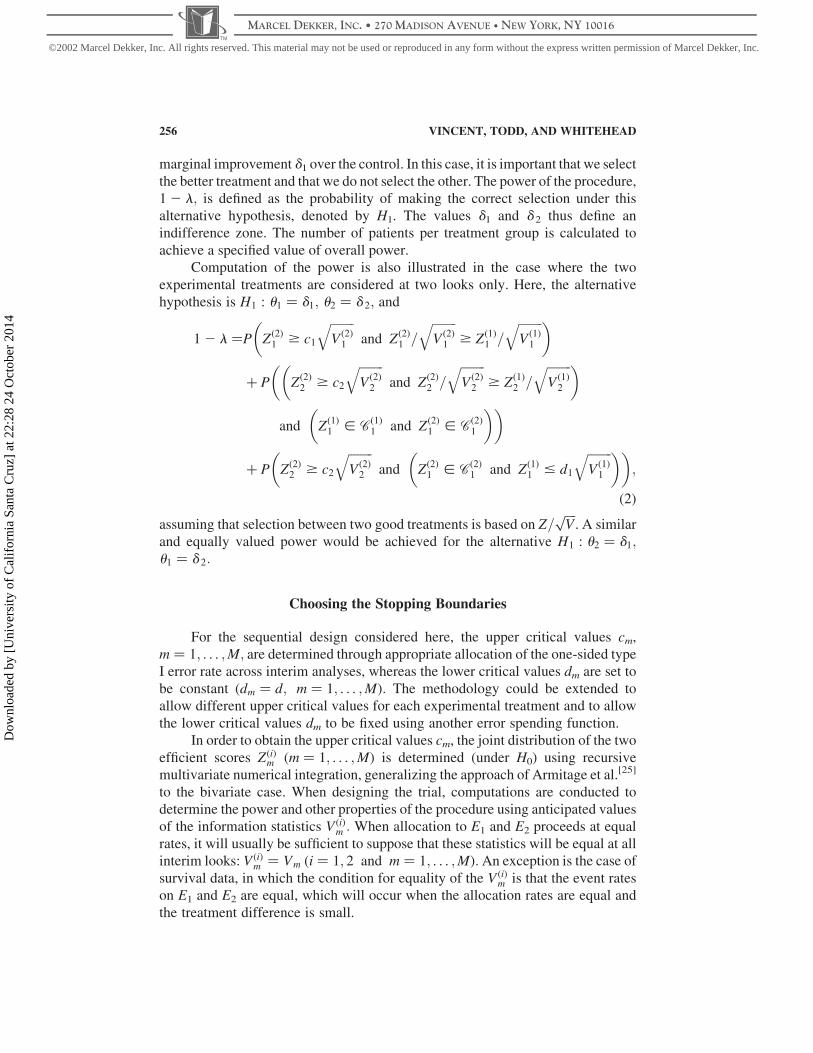
Computation of the power is also illustrated in the case where the two
experimental treatments are considered at two looks only. Here, the alternative
hypothesis is H1 : u1 ¼ d1; u2 ¼ d 2; and
1 2 l ¼P Zð2Þ1 $ c1
ffiffiffiffiffiffiffiffiV ð2Þ
1
qand Zð2Þ
1 =
ffiffiffiffiffiffiffiffiV ð2Þ
1
q$ Zð1Þ
1 =
ffiffiffiffiffiffiffiffiV ð1Þ
1
q� �
þ P Zð2Þ2 $ c2
ffiffiffiffiffiffiffiffiV ð2Þ
2
qand Zð2Þ
2 =
ffiffiffiffiffiffiffiffiV ð2Þ
2
q$ Zð1Þ
2 =
ffiffiffiffiffiffiffiffiV ð1Þ
2
q� ��
and
�Zð1Þ
1 [ Cð1Þ1 and Zð2Þ
1 [ Cð2Þ1
��
þ P Zð2Þ2 $ c2
ffiffiffiffiffiffiffiffiV ð2Þ
2
qand Zð2Þ
1 [ Cð2Þ1 and Zð1Þ
1 # d1
ffiffiffiffiffiffiffiffiV ð1Þ
1
q� �� �;
ð2Þ
assuming that selection between two good treatments is based on Z=ffiffiffiffiV
p. A similar
and equally valued power would be achieved for the alternative H1 : u2 ¼ d1;u1 ¼ d 2:
Choosing the Stopping Boundaries
For the sequential design considered here, the upper critical values cm,
m ¼ 1; . . . ;M; are determined through appropriate allocation of the one-sided type
I error rate across interim analyses, whereas the lower critical values dm are set to
be constant ðdm ¼ d; m ¼ 1; . . . ;MÞ: The methodology could be extended to
allow different upper critical values for each experimental treatment and to allow
the lower critical values dm to be fixed using another error spending function.
In order to obtain the upper critical values cm, the joint distribution of the two
efficient scores ZðiÞm ðm ¼ 1; . . . ;MÞ is determined (under H0) using recursive
multivariate numerical integration, generalizing the approach of Armitage et al.[25]
to the bivariate case. When designing the trial, computations are conducted to
determine the power and other properties of the procedure using anticipated values
of the information statistics V ðiÞm : When allocation to E1 and E2 proceeds at equal
rates, it will usually be sufficient to suppose that these statistics will be equal at all
interim looks: V ðiÞm ¼ Vm ði ¼ 1; 2 and m ¼ 1; . . . ;MÞ: An exception is the case of
survival data, in which the condition for equality of the V ðiÞm is that the event rates
on E1 and E2 are equal, which will occur when the allocation rates are equal and
the treatment difference is small.
VINCENT, TODD, AND WHITEHEAD256
©2002 Marcel Dekker, Inc. All rights reserved. This material may not be used or reproduced in any form without the express written permission of Marcel Dekker, Inc.
MARCEL DEKKER, INC. • 270 MADISON AVENUE • NEW YORK, NY 10016
Dow
nloa
ded
by [
Uni
vers
ity o
f C
alif
orni
a Sa
nta
Cru
z] a
t 22:
28 2
4 O
ctob
er 2
014
Since both pairwise comparisons of the experimental treatments are against
the same control group, the efficient scores ZðiÞm are correlated. The correlation
between the ZðiÞm statistics is allowed in the determination of their joint distribution. It
can be shown in the case of binary or normally distributed observations that when
the experimental treatment groups are of equal size the correlation between Zð1Þm and
Zð2Þm is approximately 0.5, m ¼ 1; . . . ;M: For binary data, this approximation is
valid when the success probabilities in the three groups are similar, and exact when
they are equal. For normally distributed data, the result assumes a common variance
in all three treatment groups and neglects the sampling distribution of its variance.
These results follow because, in each case, ZðiÞm is proportional to SðiÞm 2 SðCÞ
m where
SðiÞm and SðCÞ
m are the sums of the observations in the ith treated group ði ¼ 1; 2Þ and the
control group, respectively. Now var{SðiÞm 2 SðCÞm } < 2var{SðCÞ
m } under the
conditions stated earlier, and cov{Sð1Þm 2 SðCÞ
m ; Sð2Þm 2 SðCÞ
m } ¼ varSðCÞm : The case of
survival data is considered in the next section.
Given the critical values cm and dm, and planned information ratios Vm/VM,
m ¼ 1; . . . ;M; where VM is the information statistic at the last possible inspection,
the power of the procedure can be found. A search procedure can then be used to
find the value of VM that achieves the specified power level l 2 l: Recursive
numerical integration can also be used to compute expected final values of V and
to deduce the maximum sample size. This process is illustrated for survival data in
“Specifications for the Sequential Design.”
When interim analyses are conducted, the upper critical values will be
recomputed to allow for the actual (possibly unequal) values of V ð1Þm and V ð2Þ
m and
the estimated correlation between Zð1Þm and Zð2Þ
m :
Application to Survival Data
For survival data, the parameter ui can be taken to be minus the log of the ratio
of the hazard on Ei to that on C ði ¼ 1; 2Þ: Proportional hazards are assumed so that
the ui do not depend on time. The efficient score Z (i ) is the logrank statistic for
comparing Ei with C and V (i ) is its null variance, where in this section the subscript
m indicating the mth interim analysis has been suppressed for the sake of simplicity.
In order to derive an expression for the correlation between Z (1) and Z (2),
some notation must be introduced. Suppose there are f distinct event times,
tð1Þ , · · · , tðf Þ; at the jth of which o†j events occur, oCj on control and oij on Ei
ði ¼ 1; 2; o†j ¼ oCj þ o1j þ o2j; j ¼ 1; . . . ; f Þ: The total numbers of events on C
and Ei are oC† and oi†, respectively, ði ¼ 1; 2; o†† ¼ oC† þ o1† þ o2†Þ: The
numbers of patients at risk at time t( j ) on C and Ei are rCj and rij, respectively
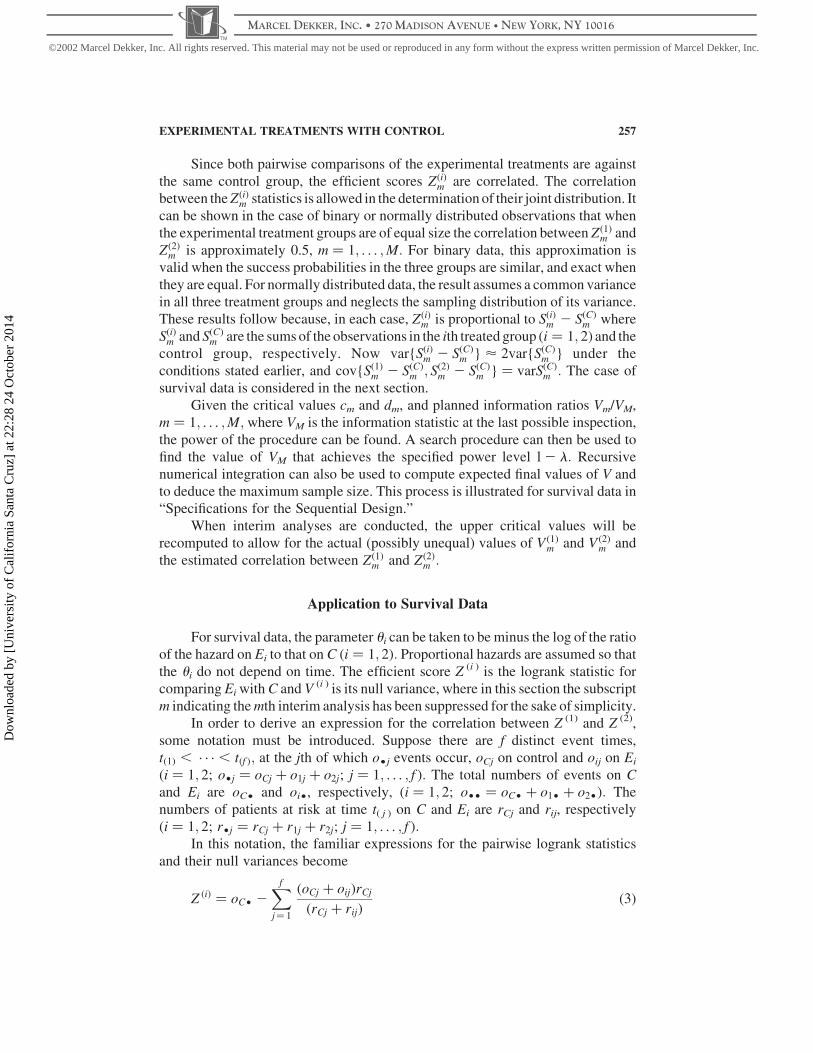
ði ¼ 1; 2; r†j ¼ rCj þ r1j þ r2j; j ¼ 1; . . . ; f Þ:In this notation, the familiar expressions for the pairwise logrank statistics
and their null variances become
Z ðiÞ ¼ oC† 2Xf
j¼ 1
ðoCj þ oijÞrCj
ðrCj þ rijÞð3Þ
EXPERIMENTAL TREATMENTS WITH CONTROL 257
©2002 Marcel Dekker, Inc. All rights reserved. This material may not be used or reproduced in any form without the express written permission of Marcel Dekker, Inc.
MARCEL DEKKER, INC. • 270 MADISON AVENUE • NEW YORK, NY 10016
Dow
nloa
ded
by [
Uni
vers
ity o
f C
alif
orni
a Sa
nta
Cru
z] a
t 22:
28 2
4 O
ctob
er 2
014
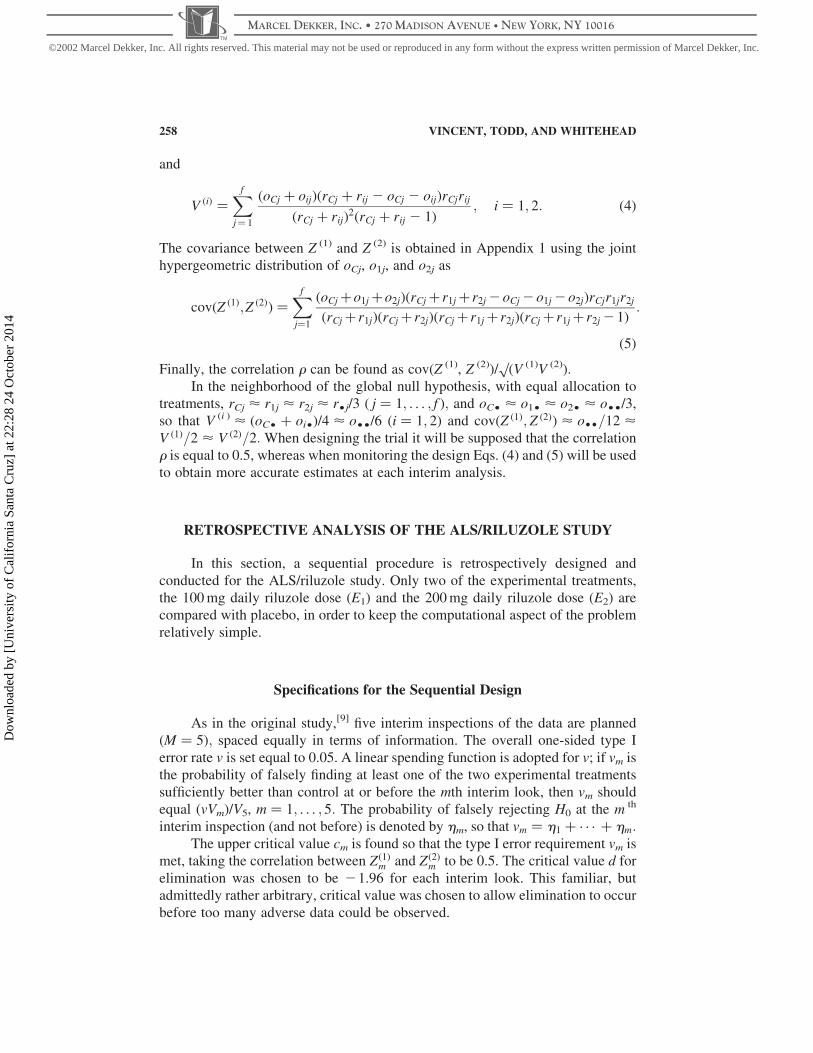
and
V ðiÞ ¼Xf
j¼ 1
ðoCj þ oijÞðrCj þ rij 2 oCj 2 oijÞrCjrij
ðrCj þ rijÞ2ðrCj þ rij 2 1Þ
; i ¼ 1; 2: ð4Þ
The covariance between Z (1) and Z (2) is obtained in Appendix 1 using the joint
hypergeometric distribution of oCj, o1j, and o2j as
covðZ ð1Þ;Z ð2ÞÞ ¼Xf
j¼1
ðoCj þo1j þo2jÞðrCj þ r1j þ r2j 2oCj 2o1j 2o2jÞrCjr1jr2j
ðrCj þ r1jÞðrCj þ r2jÞðrCj þ r1j þ r2jÞðrCj þ r1j þ r2j 21Þ:
ð5Þ
Finally, the correlation r can be found as cov(Z (1), Z (2))/p
(V (1)V (2)).
In the neighborhood of the global null hypothesis, with equal allocation to
treatments, rCj < r1j < r2j < r†j/3 ð j ¼ 1; . . . ; f Þ; and oC† < o1† < o2† < o††/3,
so that V (i ) < (oC† þ oi†)/4 < o††/6 ði ¼ 1; 2Þ and covðZ ð1Þ;Z ð2ÞÞ < o††=12 <V ð1Þ=2 < V ð2Þ=2: When designing the trial it will be supposed that the correlation
r is equal to 0.5, whereas when monitoring the design Eqs. (4) and (5) will be used
to obtain more accurate estimates at each interim analysis.
RETROSPECTIVE ANALYSIS OF THE ALS/RILUZOLE STUDY
In this section, a sequential procedure is retrospectively designed and
conducted for the ALS/riluzole study. Only two of the experimental treatments,
the 100 mg daily riluzole dose (E1) and the 200 mg daily riluzole dose (E2) are
compared with placebo, in order to keep the computational aspect of the problem
relatively simple.
Specifications for the Sequential Design
As in the original study,[9] five interim inspections of the data are planned
ðM ¼ 5Þ; spaced equally in terms of information. The overall one-sided type I
error rate v is set equal to 0.05. A linear spending function is adopted for v; if vm is
the probability of falsely finding at least one of the two experimental treatments
sufficiently better than control at or before the mth interim look, then vm should
equal (vVm)/V5, m ¼ 1; . . . ; 5: The probability of falsely rejecting H0 at the m th
interim inspection (and not before) is denoted by hm, so that vm ¼ h1 þ · · · þ hm:The upper critical value cm is found so that the type I error requirement vm is
met, taking the correlation between Zð1Þm and Zð2Þ
m to be 0.5. The critical value d for
elimination was chosen to be 21.96 for each interim look. This familiar, but
admittedly rather arbitrary, critical value was chosen to allow elimination to occur
before too many adverse data could be observed.
VINCENT, TODD, AND WHITEHEAD258
©2002 Marcel Dekker, Inc. All rights reserved. This material may not be used or reproduced in any form without the express written permission of Marcel Dekker, Inc.
MARCEL DEKKER, INC. • 270 MADISON AVENUE • NEW YORK, NY 10016
Dow
nloa
ded
by [
Uni
vers
ity o
f C
alif
orni
a Sa
nta
Cru
z] a
t 22:
28 2
4 O
ctob
er 2
014
The alternative hypothesis H1 was defined by setting d1 ¼ 0:20 and
d2 ¼ 0:43: The latter figure is the estimate of the treatment effect from the Cox
model for the primary comparison (100 mg/day riluzole) observed in the original
study. This estimate is used in this illustration to ensure sufficient power to the
statistical procedure proposed here. These choices seemed appropriate in the
context of the ALS/riluzole study where no effective treatment was available: d1
might be set closer to d2 in other situations. The overall power 1 2 l was chosen to
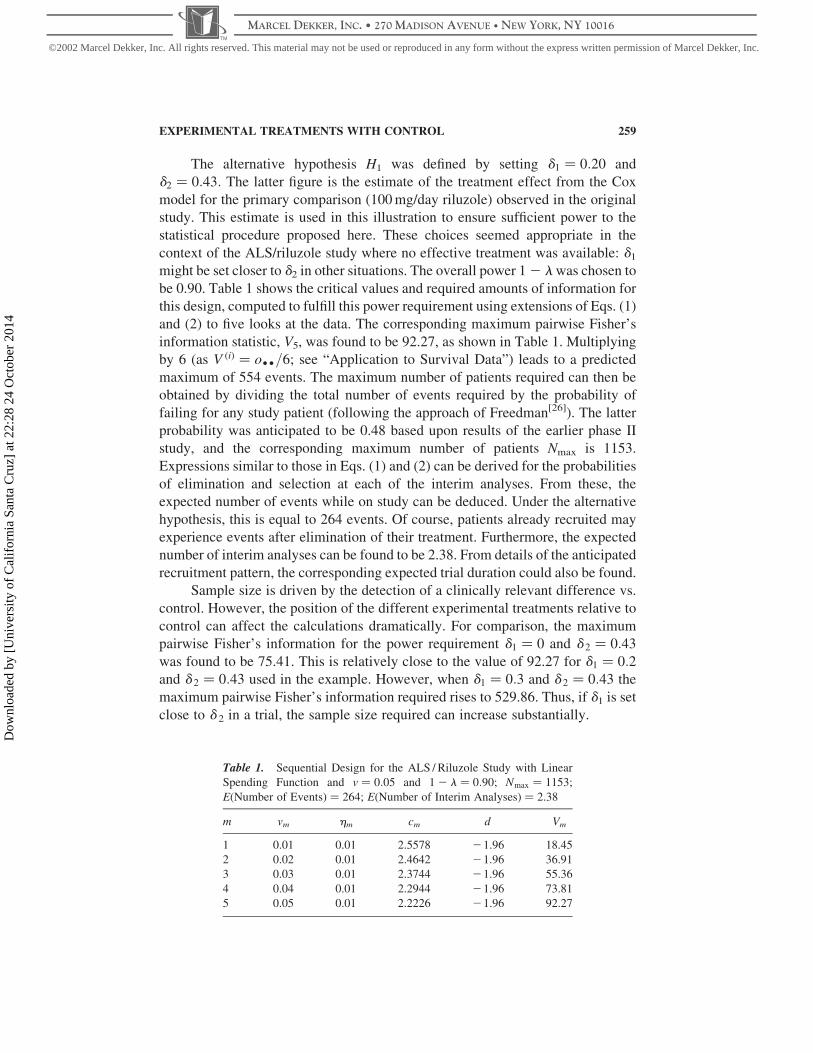
be 0.90. Table 1 shows the critical values and required amounts of information for
this design, computed to fulfill this power requirement using extensions of Eqs. (1)
and (2) to five looks at the data. The corresponding maximum pairwise Fisher’s
information statistic, V5, was found to be 92.27, as shown in Table 1. Multiplying
by 6 (as V ðiÞ ¼ o††=6; see “Application to Survival Data”) leads to a predicted
maximum of 554 events. The maximum number of patients required can then be
obtained by dividing the total number of events required by the probability of
failing for any study patient (following the approach of Freedman[26]). The latter
probability was anticipated to be 0.48 based upon results of the earlier phase II
study, and the corresponding maximum number of patients Nmax is 1153.
Expressions similar to those in Eqs. (1) and (2) can be derived for the probabilities
of elimination and selection at each of the interim analyses. From these, the
expected number of events while on study can be deduced. Under the alternative
hypothesis, this is equal to 264 events. Of course, patients already recruited may
experience events after elimination of their treatment. Furthermore, the expected
number of interim analyses can be found to be 2.38. From details of the anticipated
recruitment pattern, the corresponding expected trial duration could also be found.
Sample size is driven by the detection of a clinically relevant difference vs.
control. However, the position of the different experimental treatments relative to
control can affect the calculations dramatically. For comparison, the maximum
pairwise Fisher’s information for the power requirement d1 ¼ 0 and d 2 ¼ 0:43
was found to be 75.41. This is relatively close to the value of 92.27 for d1 ¼ 0:2and d 2 ¼ 0:43 used in the example. However, when d1 ¼ 0:3 and d 2 ¼ 0:43 the
maximum pairwise Fisher’s information required rises to 529.86. Thus, if d1 is set
close to d 2 in a trial, the sample size required can increase substantially.
Table 1. Sequential Design for the ALS / Riluzole Study with Linear
Spending Function and v ¼ 0:05 and 1 2 l ¼ 0:90; Nmax ¼ 1153;
E(Number of Events) ¼ 264; E(Number of Interim Analyses) ¼ 2.38
m vm hm cm d Vm
1 0.01 0.01 2.5578 21.96 18.45
2 0.02 0.01 2.4642 21.96 36.91
3 0.03 0.01 2.3744 21.96 55.36
4 0.04 0.01 2.2944 21.96 73.81
5 0.05 0.01 2.2226 21.96 92.27
EXPERIMENTAL TREATMENTS WITH CONTROL 259
©2002 Marcel Dekker, Inc. All rights reserved. This material may not be used or reproduced in any form without the express written permission of Marcel Dekker, Inc.
MARCEL DEKKER, INC. • 270 MADISON AVENUE • NEW YORK, NY 10016
Dow
nloa
ded
by [
Uni
vers
ity o
f C
alif
orni
a Sa
nta
Cru
z] a
t 22:
28 2
4 O
ctob
er 2
014
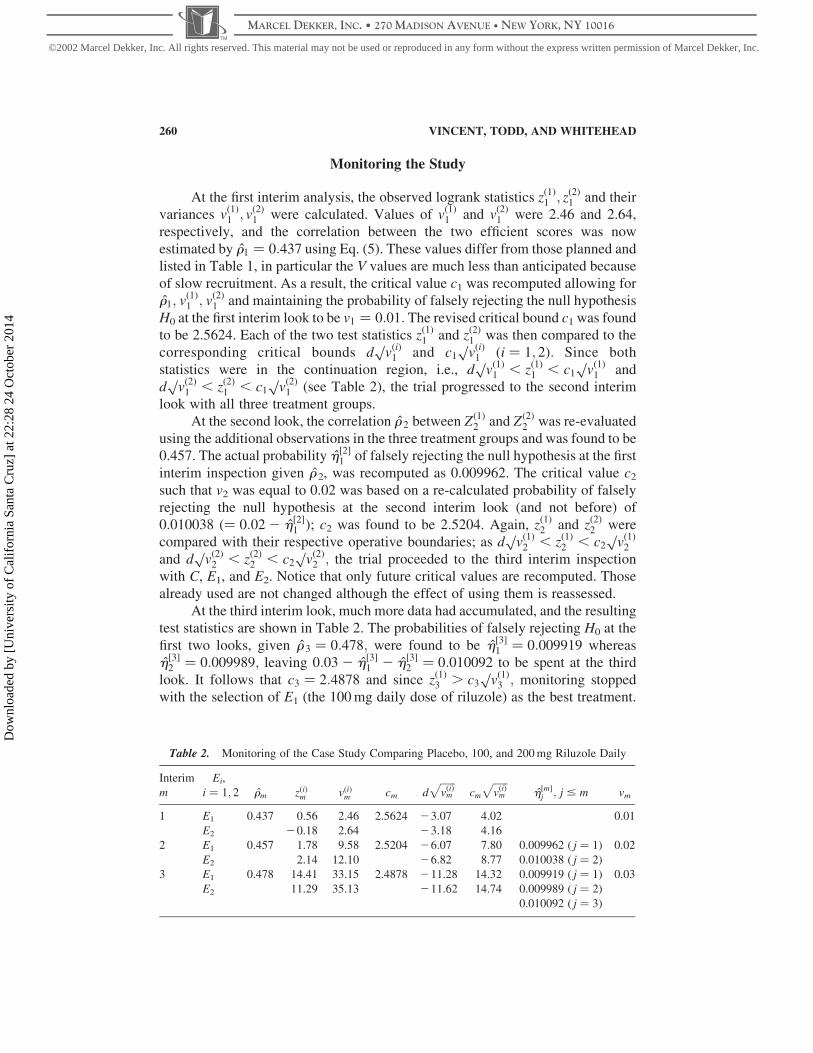
Monitoring the Study
At the first interim analysis, the observed logrank statistics zð1Þ1 ; zð2Þ1 and their
variances vð1Þ1 ; vð2Þ1 were calculated. Values of vð1Þ1 and vð2Þ1 were 2.46 and 2.64,
respectively, and the correlation between the two efficient scores was now
estimated by r1 ¼ 0:437 using Eq. (5). These values differ from those planned and
listed in Table 1, in particular the V values are much less than anticipated because
of slow recruitment. As a result, the critical value c1 was recomputed allowing for
r1; vð1Þ1 ; vð2Þ1 and maintaining the probability of falsely rejecting the null hypothesis
H0 at the first interim look to be v1 ¼ 0:01: The revised critical bound c1 was found
to be 2.5624. Each of the two test statistics zð1Þ1 and zð2Þ1 was then compared to the
corresponding critical bounds dp
vðiÞ1 and c1
pvðiÞ1 ði ¼ 1; 2Þ: Since both
statistics were in the continuation region, i.e., dp
vð1Þ1 , zð1Þ1 , c1
pvð1Þ1 and
dp
vð2Þ1 , zð2Þ1 , c1
pvð2Þ1 (see Table 2), the trial progressed to the second interim
look with all three treatment groups.
At the second look, the correlation r 2 between Zð1Þ2 and Zð2Þ
2 was re-evaluated
using the additional observations in the three treatment groups and was found to be
0.457. The actual probability h½2�1 of falsely rejecting the null hypothesis at the first
interim inspection given r 2, was recomputed as 0.009962. The critical value c2
such that v2 was equal to 0.02 was based on a re-calculated probability of falsely
rejecting the null hypothesis at the second interim look (and not before) of
0.010038 ð¼ 0:02 2 h½2�1 Þ; c2 was found to be 2.5204. Again, zð1Þ2 and zð2Þ2 were
compared with their respective operative boundaries; as dp
vð1Þ2 , zð1Þ2 , c2
pvð1Þ2
and dp
vð2Þ2 , zð2Þ2 , c2
pvð2Þ2 ; the trial proceeded to the third interim inspection
with C, E1, and E2. Notice that only future critical values are recomputed. Those
already used are not changed although the effect of using them is reassessed.
At the third interim look, much more data had accumulated, and the resulting
test statistics are shown in Table 2. The probabilities of falsely rejecting H0 at the
first two looks, given r 3 ¼ 0:478; were found to be h½3�1 ¼ 0:009919 whereas
h½3�2 ¼ 0:009989; leaving 0:03 2 h½3�
1 2 h½3�2 ¼ 0:010092 to be spent at the third
look. It follows that c3 ¼ 2:4878 and since zð1Þ3 . c3
pvð1Þ3 ; monitoring stopped
with the selection of E1 (the 100 mg daily dose of riluzole) as the best treatment.
Table 2. Monitoring of the Case Study Comparing Placebo, 100, and 200 mg Riluzole Daily
Interim
m
Ei,
i ¼ 1; 2 rm zðiÞm vðiÞm cm dffiffiffiffiffiffivðiÞm
pcm
ffiffiffiffiffiffivðiÞm
ph½m�
j ; j # m vm
1 E1 0.437 0.56 2.46 2.5624 23.07 4.02 0.01
E2 20.18 2.64 23.18 4.16
2 E1 0.457 1.78 9.58 2.5204 26.07 7.80 0.009962 ( j ¼ 1) 0.02
E2 2.14 12.10 26.82 8.77 0.010038 ( j ¼ 2)
3 E1 0.478 14.41 33.15 2.4878 211.28 14.32 0.009919 ( j ¼ 1) 0.03
E2 11.29 35.13 211.62 14.74 0.009989 ( j ¼ 2)
0.010092 ( j ¼ 3)
VINCENT, TODD, AND WHITEHEAD260
©2002 Marcel Dekker, Inc. All rights reserved. This material may not be used or reproduced in any form without the express written permission of Marcel Dekker, Inc.
MARCEL DEKKER, INC. • 270 MADISON AVENUE • NEW YORK, NY 10016
Dow
nloa
ded
by [
Uni
vers
ity o
f C
alif
orni
a Sa
nta
Cru
z] a
t 22:
28 2
4 O
ctob
er 2
014
Treatment E2 was not found to be sufficiently better than control at this third
interim look, but was not eliminated for being worse.
DISCUSSION
In this paper, a procedure has been described for comparing two
experimental treatments with a control while maintaining specified values for
the risks of type I and type II error. Calculation of a precise p-value, and of point
and interval estimates for the magnitude of the advantage of the chosen treatment
(and of the discarded treatment) over control remain an open problem.
This paper shows how a sequential procedure can be constructed so that the
upper critical values cm satisfy a prespecified error spending function, and the
lower critical values dm are either imposed or derived from a second spending
function. It is possible to compute the expected number of interim analyses for any
given design under any pair of treatment differences u1 and u2, and such calcula-
tions can provide the basis for choice between rival designs. The identification of
optimal designs, and indeed the identification of suitable optimality criteria,
remains to be explored. This paper has also shown how the design can be revised at
successive interim analyses to allow for the emerging pattern of increases in
information and value of the correlation between test statistics.
Here, the error spending approach of Slud and Wei[20] has been used for
simplicity. The better known a-spending approach of Lan and DeMets[27] is an
attractive alternative, as it allows the proportion of the error rate to be spent at any
look to be determined by the proportion of the maximum information collected so
far, rather than just by the look number. In the example in “Retrospective Analysis
of the ALS/Riluzole Study,” the amount of information available at the first look
was considerably less than anticipated, and it would have been desirable to spend
less than the 0.01 of the error rate at that stage. However, information is
accumulated on two endpoints, possibly at different rates, and it is not
straightforward to generalize the concept of information fraction to the bivariate
case.
Computation for the methodology introduced here, via a generalization of
the algorithm of Armitage, McPherson, and Rowe[25] is rather intensive and slow.
An executable program to perform the five-look design illustrated here is available
from the authors. The principles of the methodology extend easily to the case of
more than two experimental treatments, but the computational difficulties multiply
and become the limiting factor in such a generalization.
An alternative approach has been described by Stallard and Todd[28]
following the methods of Thall et al.[24] They allow selection of a single experi-
mental treatment from several competitors to be made once, at the first interim
analysis. The selected treatment then continues in one or more comparisons with
control. This simpler procedure allows more than two experimental treatments to
be considered, and a p-value to be computed, but its structure is rather inflexible.
EXPERIMENTAL TREATMENTS WITH CONTROL 261
©2002 Marcel Dekker, Inc. All rights reserved. This material may not be used or reproduced in any form without the express written permission of Marcel Dekker, Inc.
MARCEL DEKKER, INC. • 270 MADISON AVENUE • NEW YORK, NY 10016
Dow
nloa
ded
by [
Uni
vers
ity o
f C
alif
orni
a Sa
nta
Cru
z] a
t 22:
28 2
4 O
ctob
er 2
014
Sequential methodology for comparing more than two treatments is
presently at an early stage of development, comparable with that of designs for
two treatments 25 years ago. The problem is a special case of multivariate
sequential analysis that includes the simultaneous monitoring of multiple
endpoints for each patient, and the repeated conduct of both treatment
comparisons and goodness-of-fit assessments at consecutive interim analyses.
The need for such methods is becoming pressing as imaginative sequential
procedures are being attempted in practice, and it is hoped that this paper will
stimulate further research into suitable methodology.
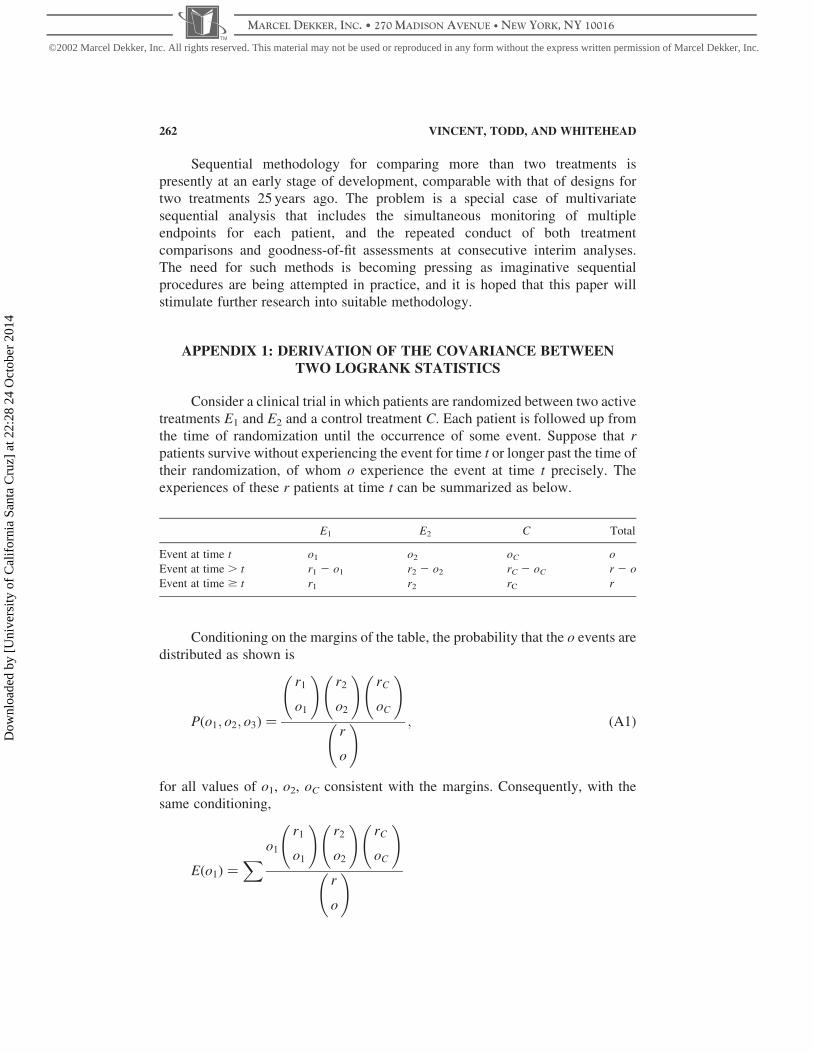
APPENDIX 1: DERIVATION OF THE COVARIANCE BETWEENTWO LOGRANK STATISTICS
Consider a clinical trial in which patients are randomized between two active
treatments E1 and E2 and a control treatment C. Each patient is followed up from
the time of randomization until the occurrence of some event. Suppose that r
patients survive without experiencing the event for time t or longer past the time of
their randomization, of whom o experience the event at time t precisely. The
experiences of these r patients at time t can be summarized as below.
E1 E2 C Total
Event at time t o1 o2 oC o
Event at time . t r1 2 o1 r2 2 o2 rC 2 oC r 2 o
Event at time $ t r1 r2 rC r
Conditioning on the margins of the table, the probability that the o events are
distributed as shown is
Pðo1; o2; o3Þ ¼
r1
o1
!r2
o2
!rC
oC
!
r
o
! ; ðA1Þ
for all values of o1, o2, oC consistent with the margins. Consequently, with the
same conditioning,
Eðo1Þ ¼X o1
r1
o1
!r2
o2
!rC
oC
!
r
o
!
VINCENT, TODD, AND WHITEHEAD262
©2002 Marcel Dekker, Inc. All rights reserved. This material may not be used or reproduced in any form without the express written permission of Marcel Dekker, Inc.
MARCEL DEKKER, INC. • 270 MADISON AVENUE • NEW YORK, NY 10016
Dow
nloa
ded
by [
Uni
vers
ity o
f C
alif
orni
a Sa
nta
Cru
z] a
t 22:
28 2
4 O
ctob
er 2
014

¼r1o
r
Xr1 2 1
o1 2 1
!r2
o2
!rC
oC
!
r 2 1
o 2 1
! ¼r1o
r; ðA2Þ
where the sums are over all possible values of o1, o2, oC consistent with the
margins. Similarly,
E{o1ðo1 2 1Þ} ¼X o1ðo1 2 1Þ
r1
o1
!r2
o2
!rC
oC
!
r
o
!
¼r1ðr1 2 1Þoðo 2 1Þ
rðr 2 1Þ; ðA3Þ
so that
Eðo21Þ ¼
r1ðr1 2 1Þoðo 2 1Þ
rðr 2 1Þþ
r1o
r; ðA4Þ
and
Eðo1o2Þ ¼X o1o2
r1
o1
!r2
o2
!rC
oC
!
r
o
! ¼r1r2oðo 2 1Þ
rðr 2 1Þ: ðA5Þ
Similar expressions apply for the expectations of squares and products of the other
observed numbers of events at time t. Now, as EðZ ð1ÞÞ ¼ EðZ ð2ÞÞ ¼ 0;
covðZ ð1Þ; Z ð2ÞÞ ¼ Er1oC 2 rCo1
r1 þ rC
� �r2oC 2 rCo2
r2 þ rC
� �� �:
Expanding the product within the braces and applying equations of the type (A4)
and (A5) yields
covðZ ð1Þ; Z ð2ÞÞ ¼oðr 2 oÞr1r2rC
rðr 2 1Þðr1 þ rCÞðr2 þ rCÞ: ðA6Þ
Summing such terms over similar 2 £ 3 tables for each event time leads to Eq. (5)
in “A Sequential Design for the Comparison of Two Experimental Treatments
with a Control.”
EXPERIMENTAL TREATMENTS WITH CONTROL 263
©2002 Marcel Dekker, Inc. All rights reserved. This material may not be used or reproduced in any form without the express written permission of Marcel Dekker, Inc.
MARCEL DEKKER, INC. • 270 MADISON AVENUE • NEW YORK, NY 10016
Dow
nloa
ded
by [
Uni
vers
ity o
f C
alif
orni
a Sa
nta
Cru
z] a
t 22:
28 2
4 O
ctob
er 2
014
Notice that, when Eq. (A6) is applied to find cov(Z (1), Z (1)), the result is not
the same as V (1) given by Eq. (6) and used as the variance of Z (1) in the logrank
test. Equation (4) follows from an argument similar to that above applied to 2 £ 2
tables concerning only the data from E1 and C. Here we retain the standard form of
the logrank test based on Eqs. (3) and (4) because these statistics are familiar, and
because they allow a direct comparison between any two treatments without
influence from data concerning the third and without assumptions concerning the
third. It would be straightforward to derive and use test statistics Z (1) and V (1)
from the series of 2 £ 3 tables instead.
ACKNOWLEDGMENT
During the development of this research, the first author was in receipt of a grant
from the University of Reading Research Endowment Trust Fund.
REFERENCES
1. Whitehead, J. The Design and Analysis of Sequential Clinical Trials, Revised 2nd
Ed.; Wiley: Chichester, 1997.
2. Jennison, J.; Turnbull, B.W. Group Sequential Methods with Applications to Clinical
Trials; Chapman and Hall/CRC: Boca Raton, USA, 2000.
3. Whitehead, J.; Thomas, P. A Sequential Trial of Pain Killers in Arthritis: Issues of
Multiple Comparisons with Control and of Interval-Censored Survival Data.
J. Biopharm. Stat. 1997, 7, 333–353.
4. Johnson, C.D.; Puntis, M.; Davidson, N.; Todd, S.; Bryce, R. A Randomised, Dose-
Finding Phase III Study of Litium Gamolenate (LiGLA) in Advanced Pancreatic
Adenocarcinoma. Br. J. Surg. 2001, 88(5), 662–668.
5. Paulson, E. A Sequential Procedure for Comparing Several Experimental Categories
with a Standard or Control. Ann. Math. Stat. 1962, 33, 438–443.
6. Follman, D.A.; Proschan, M.A.; Geller, N.L. Monitoring Pairwise Comparisons in
Multi-Armed Clinical Trials. Biometrics 1994, 50, 325–336.
7. Proschan, M.A.; Follmann, D.A.; Geller, N.L. Monitoring Multi-Armed Trials. Stat.
Med. 1994, 13, 1441–1452.
8. Tang, D-.I.; Geller, N.L. Closed Testing Procedures for Group Sequential Clinical
Trials with Multiple Endpoints. Biometrics 1999, 55, 1188–1192.
9. Lacomblez, L.; Bensimon, G.; Leigh, P.N.; Guillet, P.; Meininger, V. Dose-Ranging
Study of Riluzole in Amyotrophic Lateral Sclerosis. Lancet 1996, 347, 1425–1431.
10. Paulson, E. A Sequential Procedure for Selecting the Population with the Largest
Mean from k Normal Populations. Ann. Math. Stat. 1964, 35, 174–180.
11. Siegmund, D. Sequential x 2 and F Tests and the Related Confidence Intervals.
Biometrika 1980, 67, 389–402.
12. Jennison, C.; Turnbull, B.W. Exact Calculations for Sequential t, x 2 and F Tests.
Biometrika 1991, 78, 133–141.
13. Siegmund, D. A Sequential Clinical Trial for Comparing Three Treatments. Ann.
Stat. 1993, 21, 464–483.
VINCENT, TODD, AND WHITEHEAD264
©2002 Marcel Dekker, Inc. All rights reserved. This material may not be used or reproduced in any form without the express written permission of Marcel Dekker, Inc.
MARCEL DEKKER, INC. • 270 MADISON AVENUE • NEW YORK, NY 10016
Dow
nloa
ded
by [
Uni
vers
ity o
f C
alif
orni
a Sa
nta
Cru
z] a
t 22:
28 2
4 O
ctob
er 2
014
14. Betensky, R.A. Sequential Analysis of Censored Survival Data from Three
Treatment Groups. Biometrics 1997, 53, 807–822.
15. Armitage, P. Tests for Linear Trends in Proportions and Frequencies. Biometrics
1955, 11, 375–386.
16. Jennison, C.; Turnbull, B.W. Group Sequential Tests for Bivariate Response: Interim
Analyses of Clinical Trials with Both Efficacy and Safety Endpoints. Biometrics
1993, 49, 741–752.
17. Cook, J.C.; Farewell, V.T. Guidelines for Monitoring Efficacy and Toxicity
Responses in Clinical Trials. Biometrics 1994, 50, 1146–1152.
18. Todd, S. Sequential Designs for Monitoring Two Endpoints in a Clinical Trial. Drug
Inf. J. 1999, 33, 417–426.
19. Todd, S. A Flexible Information-Based Approach to the Design and Interim
Monitoring of Bivariate Group Sequential Trials, School of Applied Statistics
Technical Report 02/1; The University of Reading.
20. Slud, E.V.; Wei, L.J. Two-Sample Repeated Significance Tests Based on the
Modified Wilcoxon Statistic. J. Am. Stat. Assoc. 1982, 77, 862–868.
21. Scharfstein, D.O.; Tsiatis, A.A.; Robins, J.M. Semiparametric Efficiency and Its
Implication on the Design and Analysis of Group Sequential Studies. J. Am. Stat.
Assoc. 1997, 92, 1342–1350.
22. Scharfstein, D.O.; Tsiatis, A.A. The Use of Simulation and Bootstrap in Information-
Based Group Sequential Studies. Stat. Med. 1998, 17, 75–87.
23. Dunnett, C.W. Selection of the Best Treatment in Comparison to a Control with an
Application to a Medical Trial. In Design of Experiments: Ranking and Selection;
Santner, T.J., Tamhane, A.C., Eds.; Marcel Dekker: New York, 1984; 47–66.
24. Thall, P.F.; Simon, R.; Ellenberg, S.S. A Two-Stage Design for Choosing Among
Several Experimental Treatments and a Control in Clinical Trials. Biometrics 1989,
45, 537–547.
25. Armitage, P.; McPherson, C.K.; Rowe, B.C. Repeated Significance Tests on
Accumulating Data. J. R. Stat. Soc. Ser. A. 1969, 132, 235–244.
26. Freedman, L.S. Tables of the Number of Patients Required in Clinical Trials Using
the Logrank Test. Stat. Med. 1992, 1, 121–130.
27. Lan, K.K.G.; DeMets, D.L. Discrete Sequential Boundaries for Clinical Trials.
Biometrika 1983, 70, 659–663.
28. Stallard, N.; Todd, S. Sequential Designs for Phase III Clinical Trials Incorporating
Treatment Selection, 2002, accepted.
Received November 2001
Revised May 2002
Accepted June 2002
EXPERIMENTAL TREATMENTS WITH CONTROL 265
©2002 Marcel Dekker, Inc. All rights reserved. This material may not be used or reproduced in any form without the express written permission of Marcel Dekker, Inc.
MARCEL DEKKER, INC. • 270 MADISON AVENUE • NEW YORK, NY 10016
Dow
nloa
ded
by [
Uni
vers
ity o
f C
alif
orni
a Sa
nta
Cru
z] a
t 22:
28 2
4 O
ctob
er 2
014


