Download - A passive solar building for ecological research in Argentina: the first two years experience
Solar Energy Vol. 63, No. 2, pp. 105–115, 1998© 1998 Elsevier Science Ltd
All rights reserved. Printed in Great Britain0038-092X/98 $–See front matter.
PII: S0038-092X(98)00045-0
A PASSIVE SOLAR BUILDING FOR ECOLOGICAL RESEARCH INARGENTINA: THE FIRST TWO YEARS EXPERIENCE
C. FILIPPIN,* A. BEASCOCHEA,** A. ESTEVES,* C. DE ROSA,* L. CORTEGOSO* andD. ESTELRICH**
* CONICET, Spinetto 785, C.C. 302, 6300 Santa Rosa, La Pampa, Argentina** Universidad Nacional de La Pampa, Spinetto 785, C.C. 302, 6300 Santa Rosa, La Pampa, Argentina
Received 5 May 1997; revised version accepted 19 April 1998
Communicated by ANNE GRETE HESTNES
Abstract—An energy-efficient building, featuring energy conservation, passive solar heating, and naturalcooling strategies, was designed and built in La Pampa, a province in the temperate semi-arid region ofcentral Argentina. Of compact design, it houses 350 m2 of useful floor area in a roughly linear scheme,with the main spaces facing north and ancillary spaces (services) facing south. Solar windows runningfrom above spandrel and up to ceiling height are provided for all the main spaces, and clerestory windowsare provided for the solar gain to the south-facing spaces. An integrated sunspace is incorporated intothe centre bay of the north facade, providing additional heat to inner spaces as well as functional andvisual expansion. In the design stage, a simulation analysis was performed to assess the environmentaland energy performance of the alternatives. The main energy features of the resulting building are avolumetric loss coefficient of 1.09 W m−3 °C−1, and a predicted solar savings fraction of 70%. The summercooling strategy includes the passive induction of exterior air into the building through earth-coupledducts. Cooling by cross-ventilation is made possible during the night, but to preserve the security of thebuilding from sudden storms, this occurs only when the building is occupied. Shading devices protect allwindows in summer. Provisional monitoring, started during the 1995 winter period, showed encouragingpossibilities of energy savings with adequate comfort conditions, demonstrating the technical feasibilityof the scheme. © 1998 Elsevier Science Ltd. All rights reserved.
1. INTRODUCTION a conventional building. The architectural pro-ject was to answer the needs submitted by the
The province of La Pampa can be divided into Ecology and Physiology Department’s staff.two regions, namely east and west, according Design guidelines were adopted that addressedto a scheme that takes into account geomorpho- the building’s bioclimatic conditioning andlogical, altimetric, rainfall and plant-life data. energy use optimization. The strategies imple-The east has the greater socio-cultural develop- mented included the concepts of passive solarment, having major productive and economic heating, ventilation and cooling, thermal inertia,potential. With an average annual rainfall of and energy conservation.650 mm, it belongs to the semi-arid region ofArgentina, an area of forests, natural grass, and
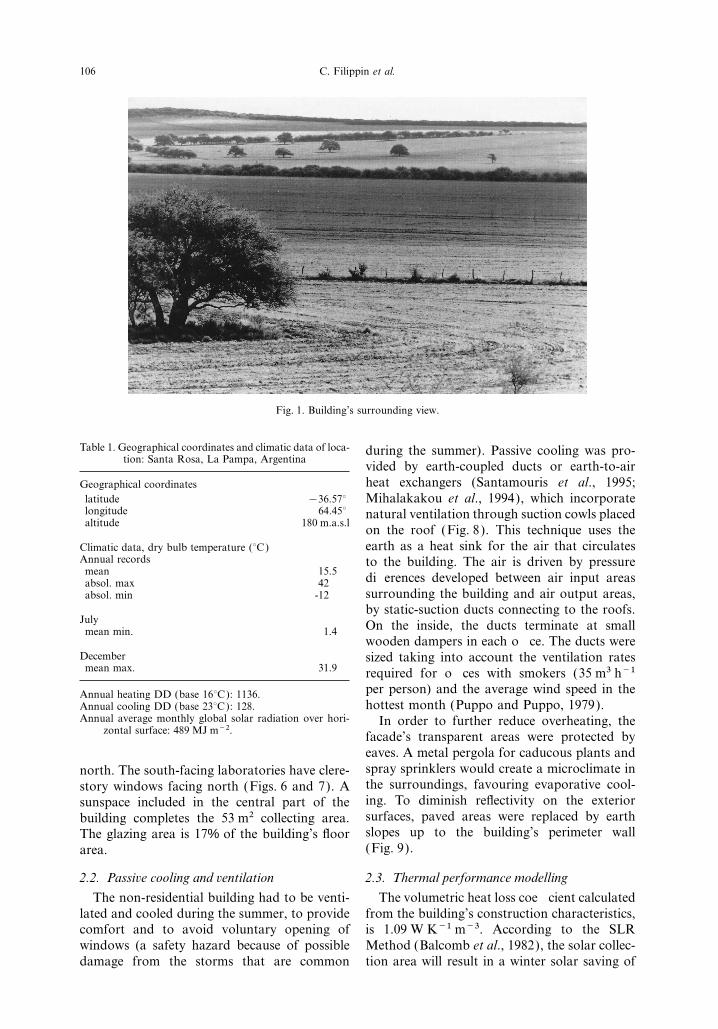
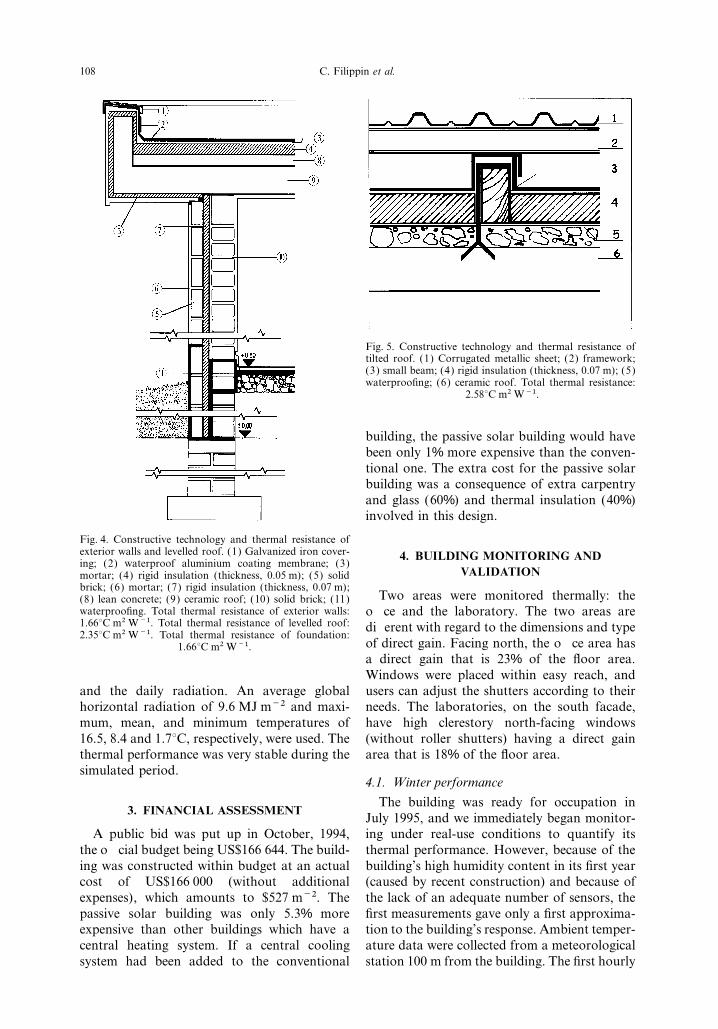
2. DESIGN FEATUREScrops that offer potential for the rural develop-ment (Filippın et al., 1988). Santa Rosa, the 2.1. Passive solar heating systemscapital city, is situated in this area (Fig. 1). The building’s compact design houses sixTable 1 shows the climatic data that characterize office rooms facing north, and the laboratoriesthe area (Fuerza Aerea Argentina, 1991). The and service areas facing south. It also includesCollege of Agronomical Engineering of the a sunspace as an area of thermal compensationNational University of La Pampa is located and physical and visual extension. The areanorth of the city, outside the urban area. Its covered is 315 m2 and the volume is 631.5 m3,campus consists of a number of separate build- as shown in Figs. 2 and 3 (Filippın et al., 1994).ings for teaching and research. The passive- Figures 4 and 5 show the construction technol-solar campus building relating to the present ogy used and the thermal resistance elements instudy was used for teaching and research in the building’s envelope.ecology and physiology. During the winter, the building is heated by
A major aim during the design of this building direct solar gain, with storage mass being pro-was for its cost not to exceed the budget the vided in floors and walls. The direct gain area
is enhanced by placing all office windows facingUniversity had allotted for the construction of
105
106 C. Filippin et al.
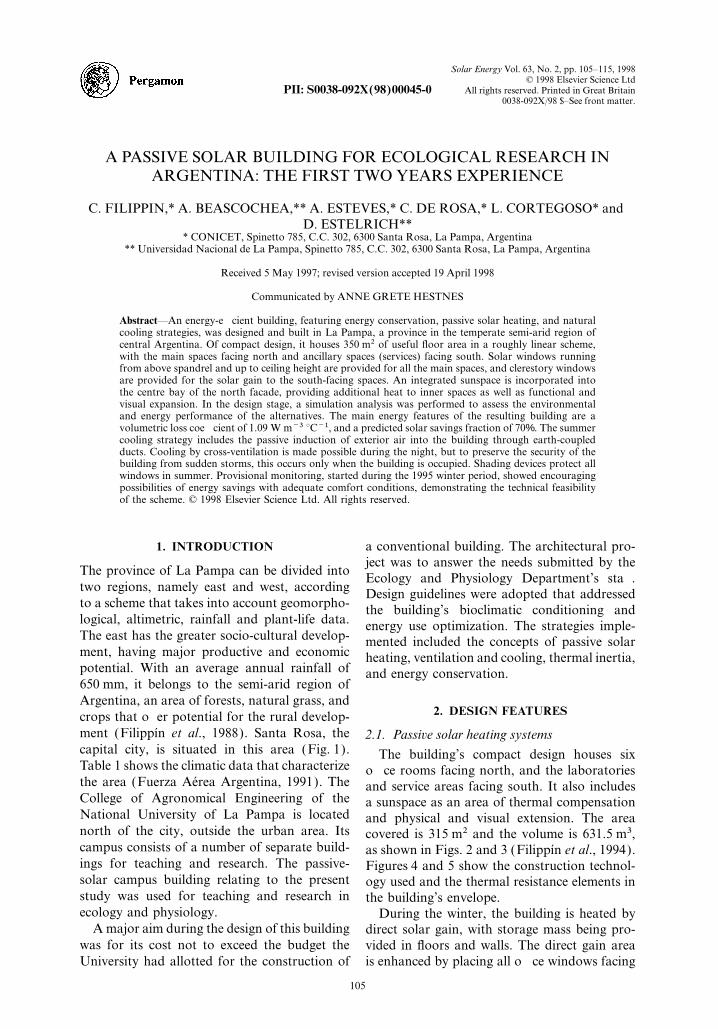
Fig. 1. Building’s surrounding view.
Table 1. Geographical coordinates and climatic data of loca- during the summer). Passive cooling was pro-tion: Santa Rosa, La Pampa, Argentina
vided by earth-coupled ducts or earth-to-airheat exchangers (Santamouris et al., 1995;Geographical coordinates
latitude −36.57° Mihalakakou et al., 1994), which incorporatelongitude 64.45° natural ventilation through suction cowls placedaltitude 180 m.a.s.l
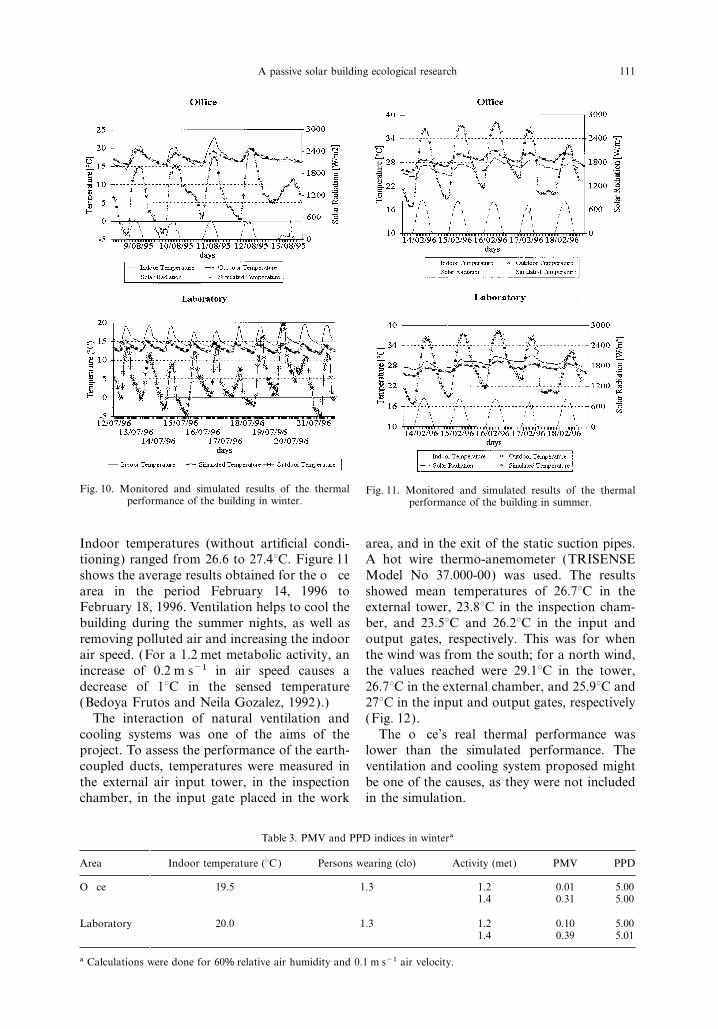
on the roof (Fig. 8). This technique uses theearth as a heat sink for the air that circulatesClimatic data, dry bulb temperature (°C)
Annual records to the building. The air is driven by pressuremean 15.5 differences developed between air input areasabsol. max 42
surrounding the building and air output areas,absol. min -12by static-suction ducts connecting to the roofs.
July On the inside, the ducts terminate at smallmean min. 1.4wooden dampers in each office. The ducts were
December sized taking into account the ventilation ratesmean max. 31.9 required for offices with smokers (35 m3 h−1
per person) and the average wind speed in theAnnual heating DD (base 16°C): 1136.hottest month (Puppo and Puppo, 1979).Annual cooling DD (base 23°C): 128.
Annual average monthly global solar radiation over hori- In order to further reduce overheating, thezontal surface: 489 MJ m−2. facade’s transparent areas were protected by
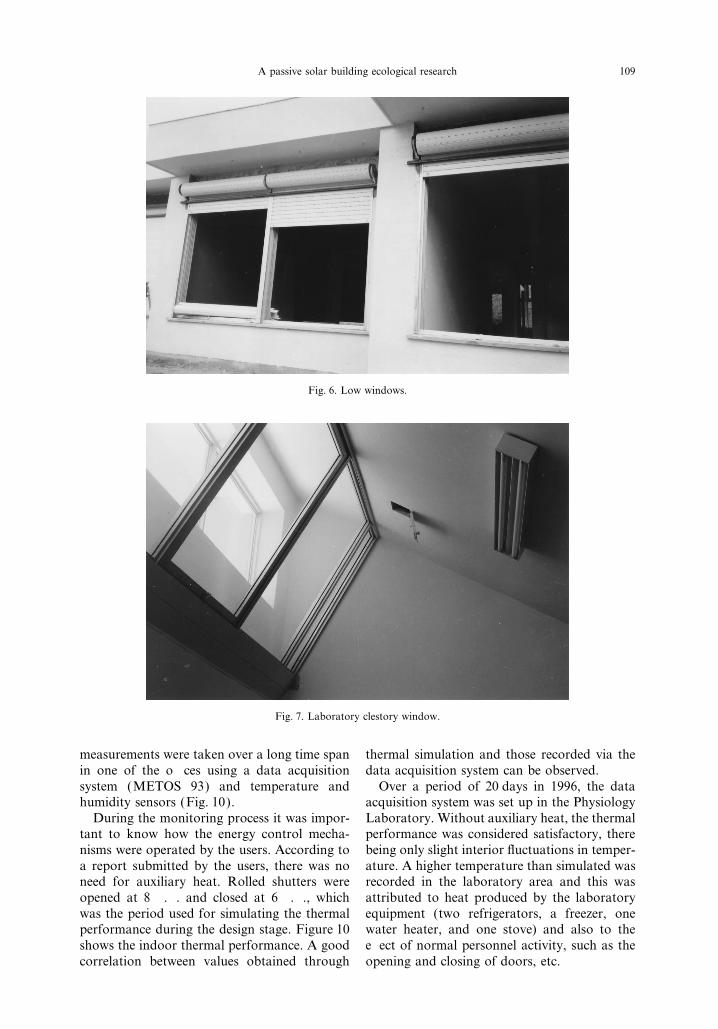
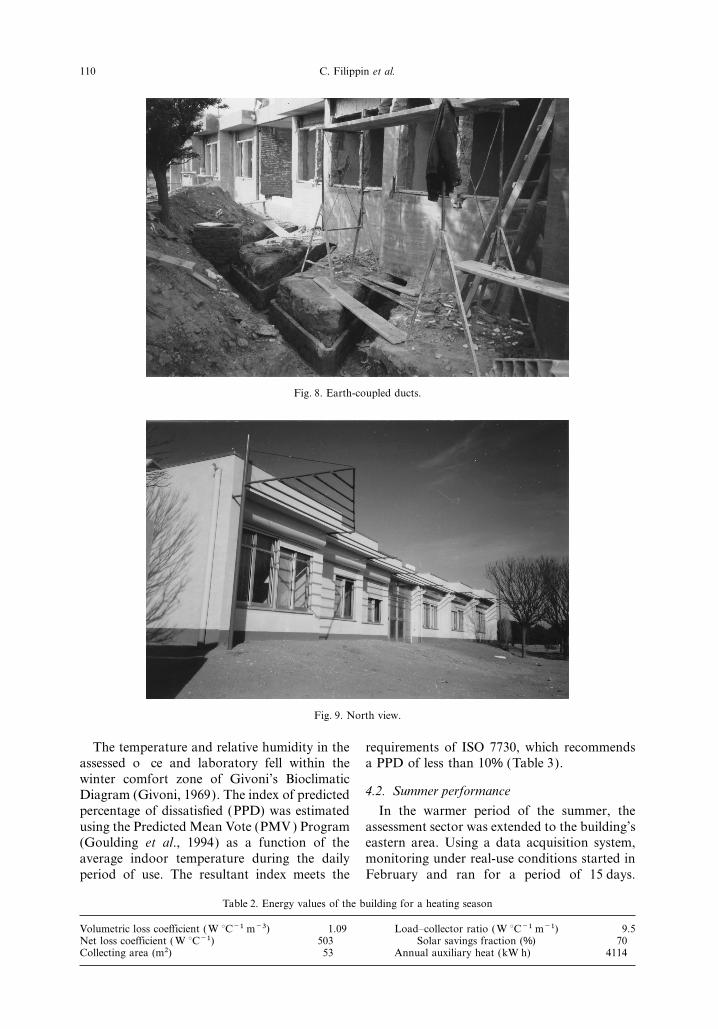
eaves. A metal pergola for caducous plants andspray sprinklers would create a microclimate innorth. The south-facing laboratories have clere-the surroundings, favouring evaporative cool-story windows facing north (Figs. 6 and 7). Aing. To diminish reflectivity on the exteriorsunspace included in the central part of thesurfaces, paved areas were replaced by earthbuilding completes the 53 m2 collecting area.slopes up to the building’s perimeter wallThe glazing area is 17% of the building’s floor(Fig. 9).area.
2.2. Passive cooling and ventilation 2.3. Thermal performance modelling
The volumetric heat loss coefficient calculatedThe non-residential building had to be venti-lated and cooled during the summer, to provide from the building’s construction characteristics,
is 1.09 W K−1 m−3. According to the SLRcomfort and to avoid voluntary opening ofwindows (a safety hazard because of possible Method (Balcomb et al., 1982), the solar collec-
tion area will result in a winter solar saving ofdamage from the storms that are common
107A passive solar building ecological research
Fig. 2. Plan: (1) office; (2) laboratory; (3) sunspace; (4) hall.
70%, corresponding to an annual auxiliary heat SIMEDIF allows the detailed estimation ofthe building’s behaviour. The building is dividedof 14 200 MJ (4114 kW h), based on degree-
days taken over a 24 h period (Table 2). The into zones, each with a specified temperature.The time evolution of the temperature is deter-building’s thermal performance was simulated
for August using the computer model mined by the program from the variations ofexternal temperature and radiation. The spacesSIMEDIF, a predictive computational tool that
can simulate the thermal performance of a are thermally connected to each other and tothe exterior through walls, windows, etc., thebuilding, its internal zones, and its individual
spaces. The program calculates the evolution of data for which can be entered in detail. Roomand wall temperatures are calculated by finitetemperatures inside the building over several
days, and provides a complementary design tool difference methods (Casermeiro and Saravia,1984). Owing to the lack of hourly data ofto methods that estimate the mean annual per-
formance, such as the SLR Method developed external temperature and radiation, these quan-tities are estimated by the program, from theby Balcomb et al. (1982) at the Los Alamos
National Laboratory. maximum, mean, and minimum temperatures
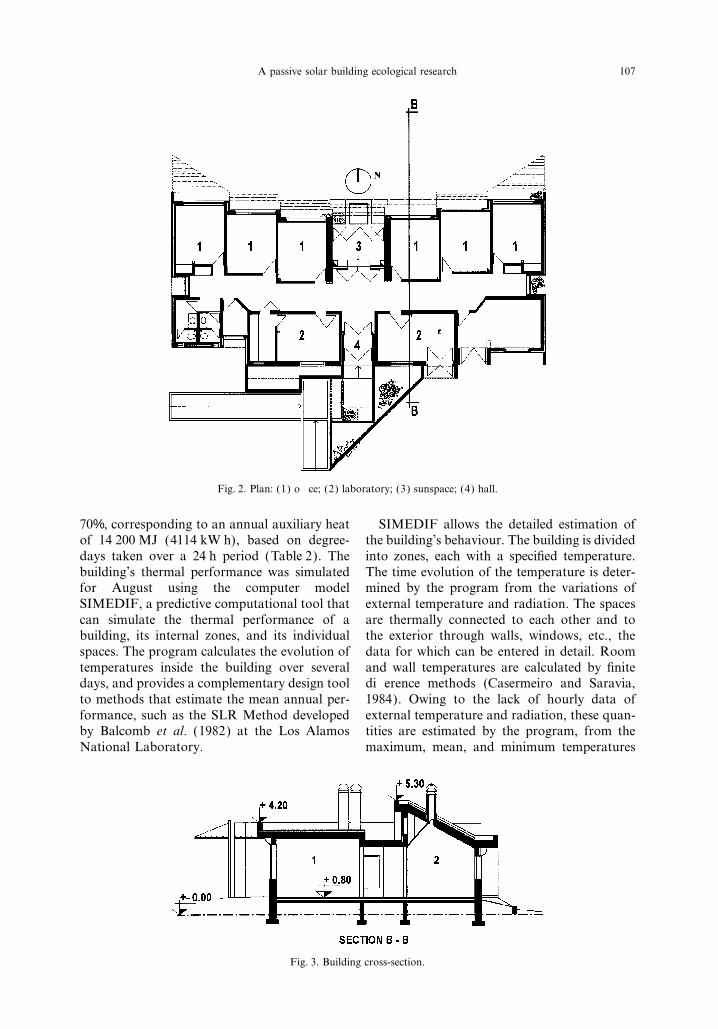
Fig. 3. Building cross-section.
108 C. Filippin et al.
Fig. 5. Constructive technology and thermal resistance oftilted roof. (1) Corrugated metallic sheet; (2) framework;(3) small beam; (4) rigid insulation (thickness, 0.07 m); (5)waterproofing; (6) ceramic roof. Total thermal resistance:
2.58°C m2 W−1.
building, the passive solar building would havebeen only 1% more expensive than the conven-tional one. The extra cost for the passive solarbuilding was a consequence of extra carpentryand glass (60%) and thermal insulation (40%)involved in this design.
Fig. 4. Constructive technology and thermal resistance ofexterior walls and levelled roof. (1) Galvanized iron cover- 4. BUILDING MONITORING ANDing; (2) waterproof aluminium coating membrane; (3)
VALIDATIONmortar; (4) rigid insulation (thickness, 0.05 m); (5) solidbrick; (6) mortar; (7) rigid insulation (thickness, 0.07 m);
Two areas were monitored thermally: the(8) lean concrete; (9) ceramic roof; (10) solid brick; (11)waterproofing. Total thermal resistance of exterior walls: office and the laboratory. The two areas are1.66°C m2 W−1. Total thermal resistance of levelled roof: different with regard to the dimensions and type2.35°C m2 W−1. Total thermal resistance of foundation:
of direct gain. Facing north, the office area has1.66°C m2 W−1.a direct gain that is 23% of the floor area.Windows were placed within easy reach, andusers can adjust the shutters according to theirand the daily radiation. An average global
horizontal radiation of 9.6 MJ m−2 and maxi- needs. The laboratories, on the south facade,have high clerestory north-facing windowsmum, mean, and minimum temperatures of
16.5, 8.4 and 1.7°C, respectively, were used. The (without roller shutters) having a direct gainarea that is 18% of the floor area.thermal performance was very stable during the
simulated period.4.1. Winter performance
The building was ready for occupation in3. FINANCIAL ASSESSMENT
July 1995, and we immediately began monitor-ing under real-use conditions to quantify itsA public bid was put up in October, 1994,
the official budget being US$166 644. The build- thermal performance. However, because of thebuilding’s high humidity content in its first yearing was constructed within budget at an actual
cost of US$166 000 (without additional (caused by recent construction) and because ofthe lack of an adequate number of sensors, theexpenses), which amounts to $527 m−2. The
passive solar building was only 5.3% more first measurements gave only a first approxima-tion to the building’s response. Ambient temper-expensive than other buildings which have a
central heating system. If a central cooling ature data were collected from a meteorologicalstation 100 m from the building. The first hourlysystem had been added to the conventional
109A passive solar building ecological research
Fig. 6. Low windows.
Fig. 7. Laboratory clestory window.
measurements were taken over a long time span thermal simulation and those recorded via thedata acquisition system can be observed.in one of the offices using a data acquisition
system (METOS 93) and temperature and Over a period of 20 days in 1996, the dataacquisition system was set up in the Physiologyhumidity sensors (Fig. 10).
During the monitoring process it was impor- Laboratory. Without auxiliary heat, the thermalperformance was considered satisfactory, theretant to know how the energy control mecha-
nisms were operated by the users. According to being only slight interior fluctuations in temper-ature. A higher temperature than simulated wasa report submitted by the users, there was no
need for auxiliary heat. Rolled shutters were recorded in the laboratory area and this wasattributed to heat produced by the laboratoryopened at 8 .. and closed at 6 .., which
was the period used for simulating the thermal equipment (two refrigerators, a freezer, onewater heater, and one stove) and also to theperformance during the design stage. Figure 10
shows the indoor thermal performance. A good effect of normal personnel activity, such as theopening and closing of doors, etc.correlation between values obtained through
110 C. Filippin et al.
Fig. 8. Earth-coupled ducts.
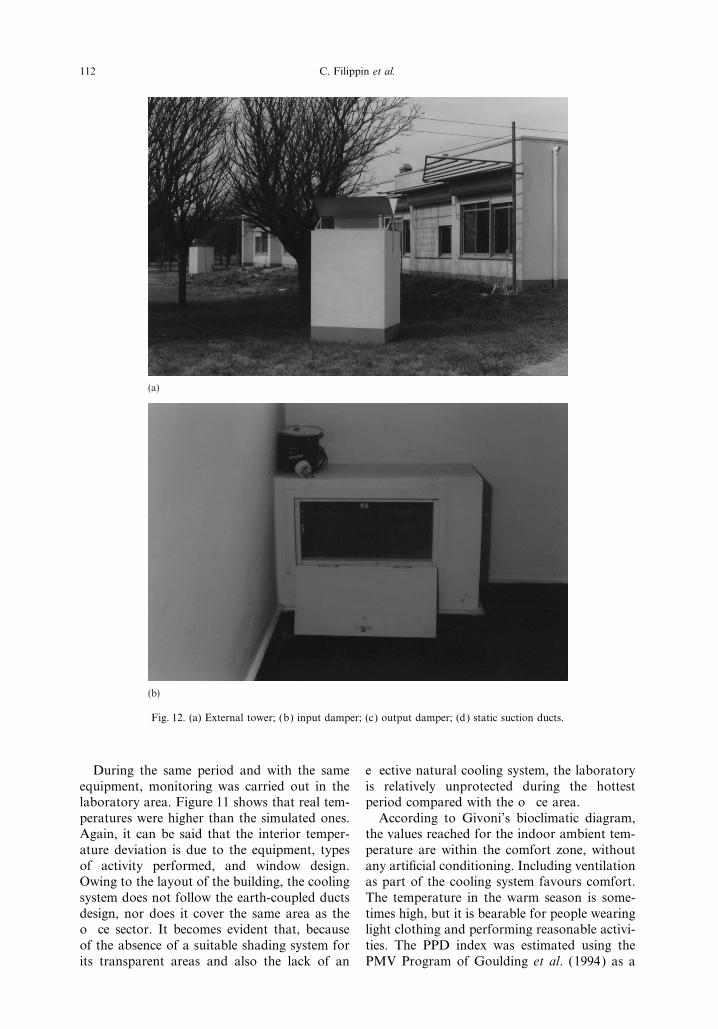
Fig. 9. North view.
The temperature and relative humidity in the requirements of ISO 7730, which recommendsa PPD of less than 10% (Table 3).assessed office and laboratory fell within the
winter comfort zone of Givoni’s Bioclimatic4.2. Summer performanceDiagram (Givoni, 1969). The index of predicted
percentage of dissatisfied (PPD) was estimated In the warmer period of the summer, theassessment sector was extended to the building’susing the Predicted Mean Vote (PMV ) Program
(Goulding et al., 1994) as a function of the eastern area. Using a data acquisition system,monitoring under real-use conditions started inaverage indoor temperature during the daily
period of use. The resultant index meets the February and ran for a period of 15 days.
Table 2. Energy values of the building for a heating season
Volumetric loss coefficient (W °C−1 m−3) 1.09 Load–collector ratio (W °C−1 m−1) 9.5Net loss coefficient ( W °C−1) 503 Solar savings fraction (%) 70Collecting area (m2) 53 Annual auxiliary heat (kW h) 4114
111A passive solar building ecological research
Fig. 10. Monitored and simulated results of the thermal Fig. 11. Monitored and simulated results of the thermalperformance of the building in winter. performance of the building in summer.
area, and in the exit of the static suction pipes.Indoor temperatures (without artificial condi-tioning) ranged from 26.6 to 27.4°C. Figure 11 A hot wire thermo-anemometer (TRISENSE
Model No 37.000-00) was used. The resultsshows the average results obtained for the officearea in the period February 14, 1996 to showed mean temperatures of 26.7°C in the
external tower, 23.8°C in the inspection cham-February 18, 1996. Ventilation helps to cool thebuilding during the summer nights, as well as ber, and 23.5°C and 26.2°C in the input and
output gates, respectively. This was for whenremoving polluted air and increasing the indoorair speed. (For a 1.2 met metabolic activity, an the wind was from the south; for a north wind,
the values reached were 29.1°C in the tower,increase of 0.2 m s−1 in air speed causes adecrease of 1°C in the sensed temperature 26.7°C in the external chamber, and 25.9°C and
27°C in the input and output gates, respectively(Bedoya Frutos and Neila Gozalez, 1992).)The interaction of natural ventilation and (Fig. 12).
The office’s real thermal performance wascooling systems was one of the aims of theproject. To assess the performance of the earth- lower than the simulated performance. The
ventilation and cooling system proposed mightcoupled ducts, temperatures were measured inthe external air input tower, in the inspection be one of the causes, as they were not included
in the simulation.chamber, in the input gate placed in the work
Table 3. PMV and PPD indices in wintera
Area Indoor temperature (°C) Persons wearing (clo) Activity (met) PMV PPD
Office 19.5 1.3 1.2 0.01 5.001.4 0.31 5.00
Laboratory 20.0 1.3 1.2 0.10 5.001.4 0.39 5.01
a Calculations were done for 60% relative air humidity and 0.1 m s−1 air velocity.
112 C. Filippin et al.
(a)
(b)
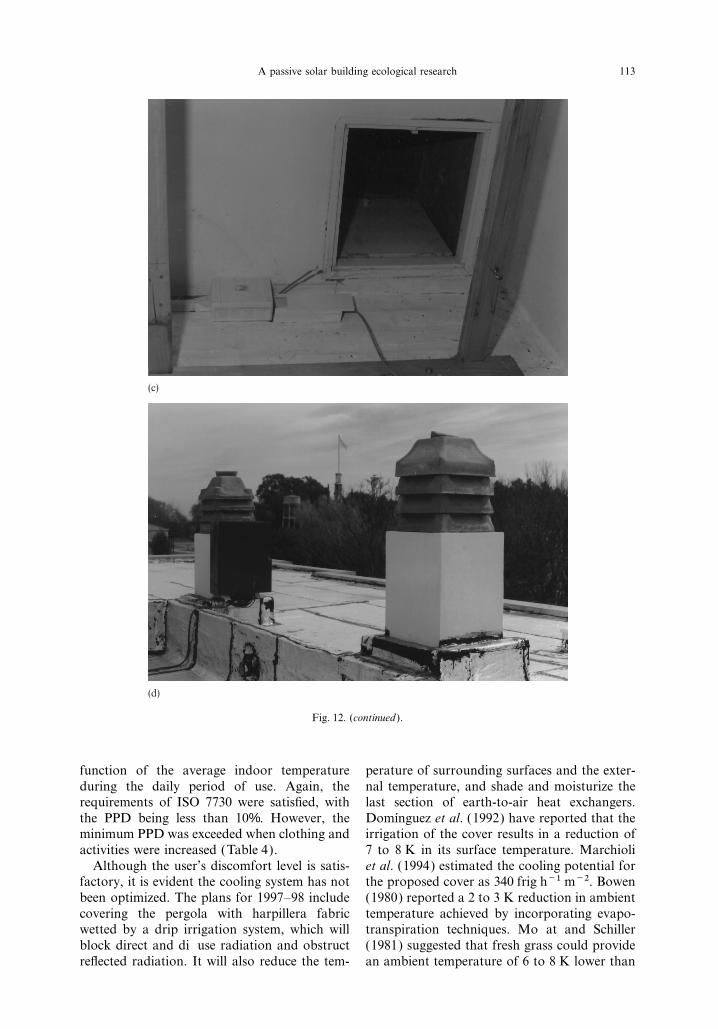
Fig. 12. (a) External tower; (b) input damper; (c) output damper; (d) static suction ducts.
During the same period and with the same effective natural cooling system, the laboratoryis relatively unprotected during the hottestequipment, monitoring was carried out in the
laboratory area. Figure 11 shows that real tem- period compared with the office area.According to Givoni’s bioclimatic diagram,peratures were higher than the simulated ones.
Again, it can be said that the interior temper- the values reached for the indoor ambient tem-perature are within the comfort zone, withoutature deviation is due to the equipment, types
of activity performed, and window design. any artificial conditioning. Including ventilationas part of the cooling system favours comfort.Owing to the layout of the building, the cooling
system does not follow the earth-coupled ducts The temperature in the warm season is some-times high, but it is bearable for people wearingdesign, nor does it cover the same area as the
office sector. It becomes evident that, because light clothing and performing reasonable activi-ties. The PPD index was estimated using theof the absence of a suitable shading system for
its transparent areas and also the lack of an PMV Program of Goulding et al. (1994) as a
113A passive solar building ecological research
(c)
(d)
Fig. 12. (continued ).
function of the average indoor temperature perature of surrounding surfaces and the exter-nal temperature, and shade and moisturize theduring the daily period of use. Again, the
requirements of ISO 7730 were satisfied, with last section of earth-to-air heat exchangers.Domınguez et al. (1992) have reported that thethe PPD being less than 10%. However, the
minimum PPD was exceeded when clothing and irrigation of the cover results in a reduction of7 to 8 K in its surface temperature. Marchioliactivities were increased (Table 4).
Although the user’s discomfort level is satis- et al. (1994) estimated the cooling potential forthe proposed cover as 340 frig h−1 m−2. Bowenfactory, it is evident the cooling system has not
been optimized. The plans for 1997–98 include (1980) reported a 2 to 3 K reduction in ambienttemperature achieved by incorporating evapo-covering the pergola with harpillera fabric
wetted by a drip irrigation system, which will transpiration techniques. Moffat and Schiller(1981) suggested that fresh grass could provideblock direct and diffuse radiation and obstruct
reflected radiation. It will also reduce the tem- an ambient temperature of 6 to 8 K lower than
114 C. Filippin et al.
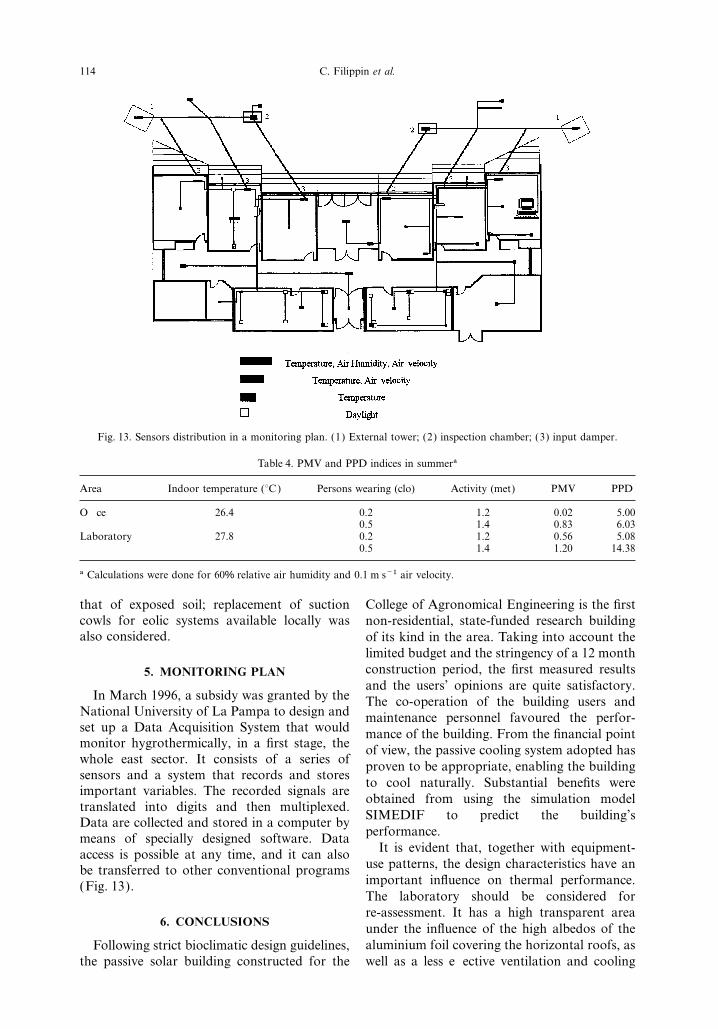
Fig. 13. Sensors distribution in a monitoring plan. (1) External tower; (2) inspection chamber; (3) input damper.
Table 4. PMV and PPD indices in summera
Area Indoor temperature (°C) Persons wearing (clo) Activity (met) PMV PPD
Office 26.4 0.2 1.2 0.02 5.000.5 1.4 0.83 6.03
Laboratory 27.8 0.2 1.2 0.56 5.080.5 1.4 1.20 14.38
a Calculations were done for 60% relative air humidity and 0.1 m s−1 air velocity.
that of exposed soil; replacement of suction College of Agronomical Engineering is the firstcowls for eolic systems available locally was non-residential, state-funded research buildingalso considered. of its kind in the area. Taking into account the
limited budget and the stringency of a 12 monthconstruction period, the first measured results5. MONITORING PLANand the users’ opinions are quite satisfactory.
In March 1996, a subsidy was granted by the The co-operation of the building users andNational University of La Pampa to design and maintenance personnel favoured the perfor-set up a Data Acquisition System that would mance of the building. From the financial pointmonitor hygrothermically, in a first stage, the of view, the passive cooling system adopted haswhole east sector. It consists of a series of proven to be appropriate, enabling the buildingsensors and a system that records and stores to cool naturally. Substantial benefits wereimportant variables. The recorded signals are
obtained from using the simulation modeltranslated into digits and then multiplexed.
SIMEDIF to predict the building’sData are collected and stored in a computer byperformance.means of specially designed software. Data
It is evident that, together with equipment-access is possible at any time, and it can alsouse patterns, the design characteristics have anbe transferred to other conventional programsimportant influence on thermal performance.(Fig. 13).The laboratory should be considered forre-assessment. It has a high transparent area
6. CONCLUSIONS under the influence of the high albedos of thealuminium foil covering the horizontal roofs, asFollowing strict bioclimatic design guidelines,
the passive solar building constructed for the well as a less effective ventilation and cooling
115A passive solar building ecological research
nologıa Arquitectonicas, Fundacion General de la Uni-system and an important supply of indoorversidad Politecnica de Madrid, pp. 59–89.
energy. An increase of the ventilation area and Bowen A. (1980) Heating and cooling of building sitesthrough landscape planning. Passive Solar Handbook.replacement of static sprinklers could improveAS/ISES, Newark, DE.summer thermal performance. Future studies
Casermeiro M. and Saravia L. (1984) Calculo termico hora-will comprise duct characteristics and design, as rio de edificios solares pasivos. In: Actas de la 9a.
Reunion de Trabajo de ASADES, Vol. II, San Juan,well as air input towers. Optimization of theArgentina, pp. 7–12.cooling system has become a major item that
Domınguez A. et al. (1992) Control climatico en espacioscan be transferred to other buildings on the abiertos, El Proyecto EXPO’92, Secretarıa General Tec-
nica del CIEMAT, Madrid, pp. 103–121.campus, to reduce or eliminate their artificialFilippın C., Rapallini A. and Casagrande G. (1988) Analisiscooling systems. Plant growth on the pergola
de restricciones ambientales y socio-economicas para eland sprinklers on the building’s north facade desarrollo de proyectos solares en la Provincia de La
Pampa. Actas de la XIII Reunion de Trabajo de ASADES,will help provide a microclimate in the sur-Tomo I, Salta, Argentina, pp. 123–132.roundings, producing greater comfort inside the
Filippın C., Esteves A., de Rosa C. and Pattini A. (1994)building in summer. Diseno bioclimatico de un gabinete de investigacion eco-
logica para la Universidad Nacional de La Pampa. ActasIn light of the results obtained in the firstde la XVII Reunion de Trabajo de ASADES, Tomo I,2 yr of operation (e.g. an energy saving inRosario, Argentina, pp. 119–126.
heating of the order of 80%, which is higher Fuerza Aerea Argentina (1991) Estadısticas Meteorologicas1981–1990. Comando de Regiones Aereas, Serviciothan predicted), and given the energy and envi-Meteorologico Nacional.ronmental requirements of the future genera-
Givoni B. (1969) Man, Climate and Architecture. Elsevier,tions, education of and technology transfer to UK.
Goulding J., Lewis J. and Steemers T. (Eds) (1994) Energythe remaining community constitute one of ourin Architecture. The European Passive Solar Handbook.next challenges.Commission of the European Communities,pp. 335–336.
Acknowledgements—The authors would like to thank the Marchioli J. et al. (1994) Determinacion de los parametrosPresident of the National University of La Pampa, Ing. higrotermicos de superficies para refrescamiento. ActasCarlos Arenzo and the Dean of the College of Agronomical de la XVII Reunion de Trabajo de ASADES, Tomo I,Engineering, Eng. Hector Troiani for their trust leading to Rosario, Argentina, pp. 149–155.the construction of the building following bioclimatic Mihalakakou M., Santamouris M. and Asimakopoulos D.guidelines. (1994) On the cooling potential of earth to air heat
exchangers. Energy Convers. Manage 35, 5, 395–402.Moffat A. and Schiller M. (1981) Landscape Design Hot
Save Energy. William Norrow and Company, NewYork.REFERENCES
Puppo E. and Puppo G. (1979) Acondicionamiento Naturaly Arquitectura. Marcombo Boixareu Editores, Barce-Balcomb J. D., Jones R. W., Kosiewicz C. E., Lazarus
G. S., McFarland R. D. and Wray W. O. (1982) Passive lona, pp. 125–140.Santamouris G., Mihalakakou A., Argiriou A. and Asima-Solar Design Handbook, Vol. 3. ASES Inc., Boulder, NY.
Bedoya Frutos C. and Neila Gozalez J. F. (1992) Las kopoulos D. N. (1995) On the perfomance of buidingcoupled with earth to air heat exchangers. Solar Energytecnicas de acondicionamiento ambiental: fundamentos
arquitectonicos, Departamento de Construccion y Tec- 54, 6, 375–380.


