1.1
Abstract
Unmanned Aircraft Systems (UAS), also known as drones, are capable of autonomously carrying out an increasing number of duties with substantially greater efficiency compared to human intervention. UAS researchers aim to enhance the levels of safety, mission effectiveness and autonomy, as well as explore additional capabilities. Crop health monitoring is a very promising application of UAS as the early detection of plant diseases can supplement traditional crop monitoring techniques (such as visual observation) to support timely mitigation, thereby offering substantial benefits to crop yield and quality. This paper presents new UAS-borne Electro-Optics/Infrared (EO/IR) systems based on bistatic Light Detection and Ranging (LIDAR) for early detection of crop diseases. The proposed bistatic LIDAR system measures over extended observation periods above the crop canopy anomalies in carbon dioxide (CO2) concentration potentially associated with disruptions in the plant photosynthesis. In particular, this paper discusses the application of the bistatic LIDAR to the early detection of powdery mildew in strawberry crops and presents the initial modelling and simulation activities performed to predict the sensor performance. Based on the results of this analysis, a plan for future experimental activities is also developed.
1. Introduction
Agricultural crops are affected by a variety of plant diseases, weeds and pests that cause a remarkable yield loss and quality degradations. Crops can be protected from diseases, weeds and pests by pesticides, which increase costs and the risk of toxic residues in the products. A
variety of remote sensing technologies have therefore been developed to characterise the spatial and temporal evolution of diseases, weeds and pests over wide areas. Remote sensing is advantageous to conventional manual assessment techniques as it does not require physical proximity to the individual plants [1]. Modifications in pigment, nutrient, gas exchange, water uptake, cell structure and chemical concentrations are affected by the presence of diseases and thus can potentially be exploited for remote sensing. Current remote sensing technologies can detect and evaluate crop stress from variations in the spectral and shape characteristics of canopy, which are influenced by biotic and abiotic stress agents. For instance, canopy reflectance variations can be induced by pests and diseases, inducing variances in colour and temperature of the canopy which can be detected across the visible and infrared spectrum [2].
The utilisation of remote sensing for assessing crop diseases has been researched since last century. Specifically, in the 1950’s, the presence of certain cereal crop diseases was detected using infrared photographs [3]. In the 1980s, crop conditions were also estimated by aerial photography [4]. In these studies, broad spectral bands were recorded by airborne cameras on analogue films. Remote sensing technology has evolved significantly ever since. Plant pathogens have been observed and quantified by many spectroscopic and imaging techniques [5-8]. These sensors have been used to identify changes in plant physiology as early-detection of disease, i.e. visible (VIS)/multiband spectroscopy [9], multispectral or hyperspectral imaging [10, 11], fluorescence spectroscopy [12], infrared (IR) spectroscopy [13] and fluorescence imaging [14]. Satellite platforms
A NOVEL BISTATIC LIDAR SYSTEM FOR EARLY-DETECTION OF PLANT DISEASES
FROM UNMANNED AIRCRAFT
Hai Pham*, Yixiang Lim*, Alessandro Gardi*, Roberto Sabatini*, Eddie Pang* *RMIT University, Bundoora, VIC 3083, Australia
Keywords: agricultural drone; carbon dioxide; crop diseases; infrared; laser; photosynthesis; spectroscopy; unmanned aircraft systems
2
A NOVEL BISTATIC LIDAR SYSTEM FOR EARLY-DETECTION OF PLANT DISEASES FROM UNMANNED AIRCRAFT
equipped with enhanced spectral and/or radiometric detectors offer much greater capabilities. Satellite remote sensing is however costly and does not offer the sufficient time and space resolution to timely detect small outbreak areas. Therefore, a great opportunity is emerging for Unmanned Aircraft Systems (UAS) to perform less-expensive and better-resolution mapping.
The aim of this research is therefore to develop UAS-borne remote sensing techniques for early detection of crop diseases. To support the sensor design and integration on a suitable UAS, various numerical and experimental activities are planned in controlled conditions to identify the most suitable combination of sensors/systems for specific diseases. Subsequent ground and flight test activities will support a full system validation in real conditions and test/training on actual plantations.
1.1. Strawberry powdery mildew
Most of the literature on early detection of plant diseases focusses on Multispectral and Hyperspectral Imaging (MSI/HSI) techniques due to technological maturity. These two methods focus on the differences in the spectral signatures of infected and healthy plant leaves. However, there are a significant number of major diseases that cannot be detected at early stages due to the similarities of spectral signatures. Powdery mildew (PM) is one of the major diseases on strawberry crops in Australia, which cannot be timely detected by MSI/HSI, causing significant yield damage or extensive spraying of fungicides. PM fungi is initially located on the abaxial leave surface and takes roughly 6 days after inoculation (DAI) to completely cover the adaxial leave surface [15]. The photosynthesis process is carried out by plants to produce food and energy for their growth and cellular respiration. Photosynthesis is carried out by chlorophyll, which is responsible for the green colour of plants. In infected plants, the green parts are damaged and/or faded, so that the plant reduces its capability to uptake CO2. In the case of PM, fungus filament may enter the stomata and
block up the entrance of CO2, so photosynthesis is reduced [15]. Therefore, by measuring CO2 concentrations it is possible to early-detect strawberry PM.
1.2. CO2 up-take by plants
Sources and sinks of CO2 in a crop are carefully taken into account in this project, because they possibly indicate plants stress on canopy, symptomatic of PM and other diseases. CO2 concentrations around the canopy are very dynamic due to diffusion and turbulence processes. In field conditions, CO2 concentrations around the canopy are significantly lower than the atmospheric sea-level averages during photosynthetic activity periods (sunlight) and usually higher than average outside these (night-time) [16-20]. Leaf Area Index (LAI) and foliage density impact below-canopy CO2 profiles noticeably [21]. Soil and vegetation respiration processes lead to increase below-canopy CO2 concentrations in night-time [22]. Moreover, the air around the canopy is regularly refilled with drier air during night-time, reducing the water vapour below the canopy. The complex interactions of the soil, vegetation and boundary layer atmosphere are the reason of dynamic and progressive changes in CO2/H2O concentrations within the canopy.
In Prueger et al. [22], average CO2 fluxes were measured in three days within 30 minutes over corn and soybean from three different periods during the growing season (16 June, 17 July and 17 August 2002). Positive CO2 fluxes (away from the surface) normally happened daily with two periods of time, i.e. from 0 to about 700 CST and from 1700 to 2400 CST, corresponding with night plant respiration. Whereas, negative CO2 fluxes occurred during the remaining time of day relating with main sinks.
2. Bistatic LIDAR system concept
Light detection and ranging (LIDAR) systems have been proposed as a very viable method to remotely sense atmospheric constituents because the characteristics of the laser beam at the receiver can provide information on the medium through which the
3
A NOVEL BISTATIC LIDAR SYSTEM FOR EARLY-DETECTION OF PLANT DISEASES FROM UNMANNED AIRCRAFT
laser passed. The Differential Absorption LIDAR (DIAL) measurement principle, extensively used for remote sensing, exploits the wavelength-selective absorption properties of molecular species [23, 24]. Most common DIAL systems are monostatic, but these require complex and expensive components to detect the very weak back-scatter by aerosol particles. For this research, we therefore focus on the bistatic LIDAR developed in previous research [25, 26], which is a cost-effective solution that can be integrated on small drones for early detection of crop diseases. However, the extension of this method to the agricultural sector was not evaluated and in particular for measuring CO2 concentrations associated with photosynthesis and respiration.
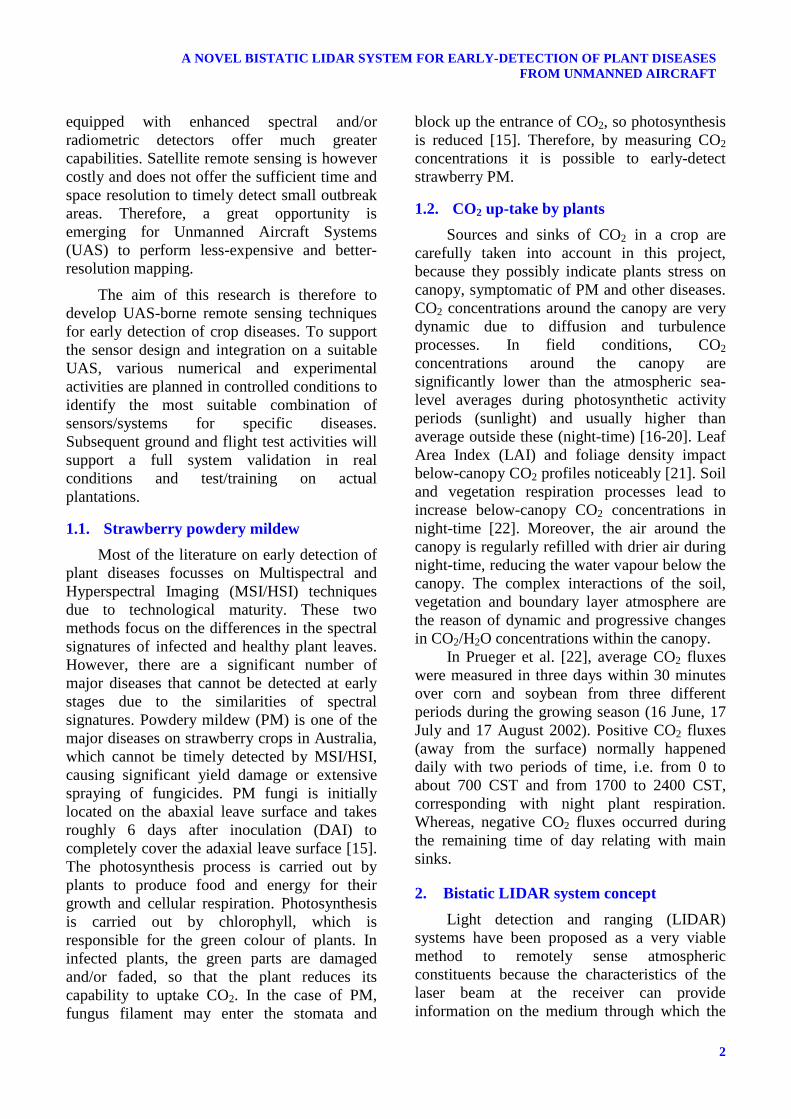
The proposed bistatic LIDAR system is conceptually depicted in Fig. 1. The bistatic LIDAR has transmitter (Tx) and receiver (Rx) separately at a certain distance. The Tx of the bistatic LIDAR normally emits a continuous wave or pulsed laser beam of precisely known power characteristics. The bistatic LIDAR Rx measures the amount of laser energy that reaches the Rx, which is less than the emitted LIDAR radiation because atmospheric molecular/aerosol concentrations absorb or scatter the radiation.
RxAtmospheric factors
Tx
Fig. 1. Overview of the bistatic LIDAR system concept
and parasite irradiance contributions (including background).
Generally, the power of a transmitted laser beam is attenuated and scattered by the atmosphere before it is received by the detector. Direct and scattered light from the sun or other
sources also affects the bistatic LIDAR Rx (Fig. 1). However, the DIAL principle allows neglecting these parasite factors as they affect both wavelengths used by the system.
In this project, only the CO2 concentration is measured by the bistatic LIDAR. Gas Chromatography (GC) devices are used to measure the concentrations of other molecular concentrations including oxygen (O2), nitrogen (N2) and water vapour (H2O). Experimental activities are conducted under different conditions (for example moisture) to build an extensive database, as the particular variations in CO2 concentrations associated with the PM disease may be affected by other factors. The continuous monitoring by the UAS bistatic LIDAR allows to properly mitigate the variability in the field conditions due to advection and turbulence processes, so to obtain reliable measurements.
2.1. Measurement principle
The transmittance coefficient � is affected by absorption and scattering of molecules and aerosols along the transmission path, and can be calculated based on the Beer-Lambert’s law as given by:
� = ������ = �� ��,������ (1)
where PTX is the transmitted beam power, PRX is the received beam power, � is the attenuation coefficient, � is the wavelength of the transmitted beam and � is the distance along the transmitted path. Assuming the superposition principle, ���, �� can be expressed to separately account for the attenuation effects of different aerosol and molecular species, as:
���, �� =������ ∙ ������ (2)
where ����� is the cross-section and ����� is the volume density of the ith species. However, measurements based on (2) assuming a homogenous medium are inaccurate because collision-induced absorption (CIA) and second-order scattering effects introduce measurement errors. Hence, it is essential to determine these extra impacts to accurately measure the CO2
4
A NOVEL BISTATIC LIDAR SYSTEM FOR EARLY-DETECTION OF PLANT DISEASES FROM UNMANNED AIRCRAFT
concentrations. The equation is nonetheless used for most of the system design activities. In particular, the DIAL technique is based on two predefined wavelengths, selected based on the response of measured atmospheric constituent. The first wavelength, λON, is selected in relation to one major vibrational band of the molecular species being measured. The second wavelength, λOFF, is selected in proximity to the first, but outside the vibrational band of the molecular species, in order to maximise the difference in molecular cross-section ∆� =������ − ���� �. Therefore, the relation between transmitted energy associated with the on-transmission (τON) and the off-transmission line (τOFF) for determining the CO2 concentration is [27]:
!�� � ⁄ ≜ ����� =
= ��$%��&'��%��&((�)∙ *+&,�����-�
(3)
Hence, for an ON/OFF beam pair with the same path length � and transmitted power ���, the average CO2 concentration (./0�,) over the beam column can be determined using the following equation:
./0�, = −1�$���/�� )�$���� � − ������) =
= ln��� � − ln������ ∙ Δ�
(4)
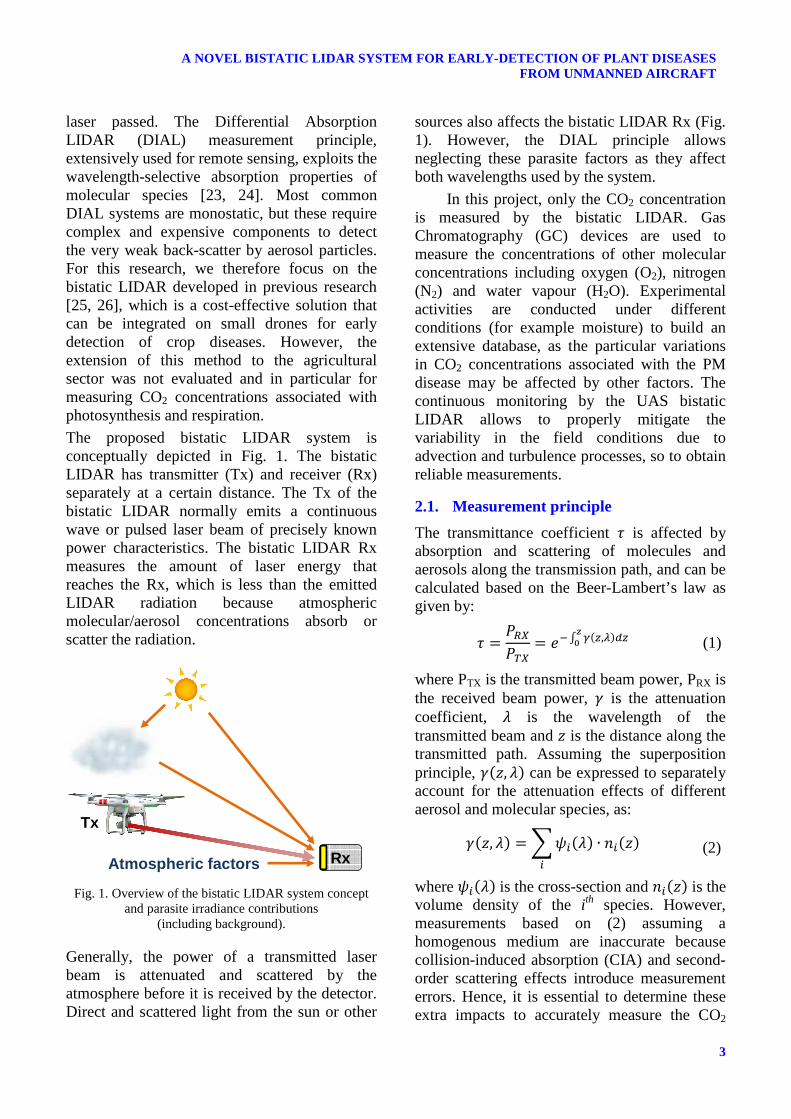
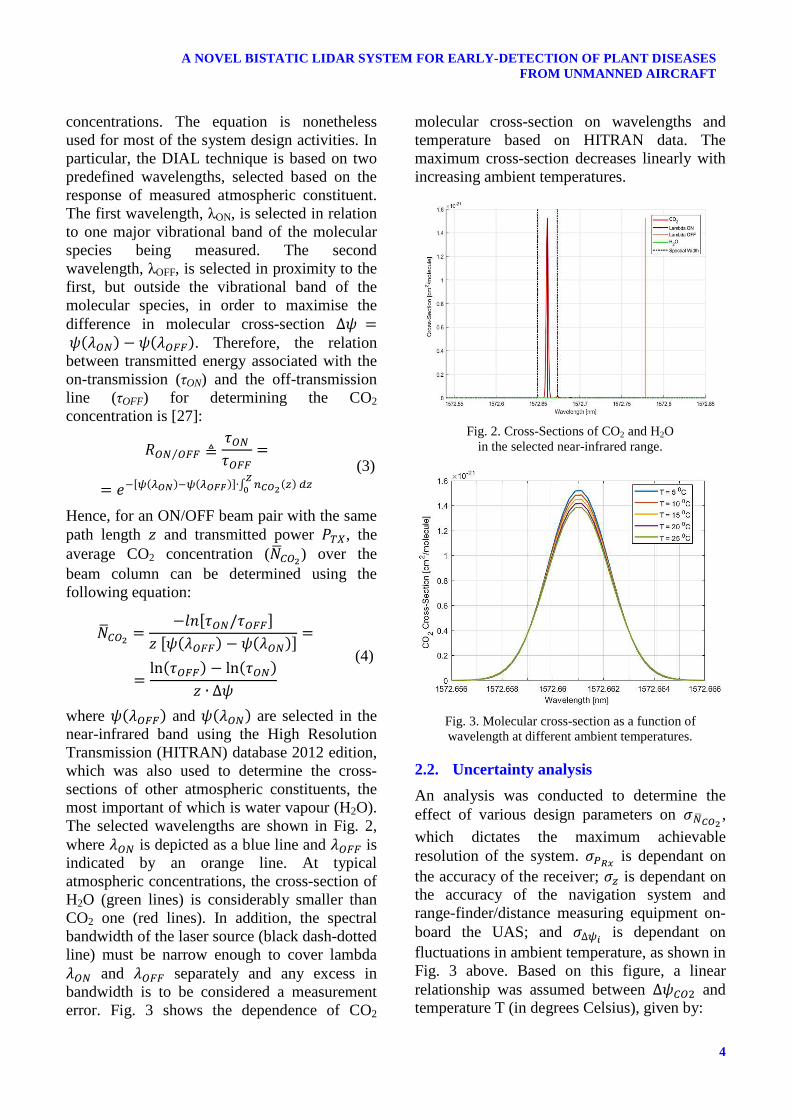
where ���� � and ������ are selected in the near-infrared band using the High Resolution Transmission (HITRAN) database 2012 edition, which was also used to determine the cross-sections of other atmospheric constituents, the most important of which is water vapour (H2O). The selected wavelengths are shown in Fig. 2, where ��� is depicted as a blue line and �� is indicated by an orange line. At typical atmospheric concentrations, the cross-section of H2O (green lines) is considerably smaller than CO2 one (red lines). In addition, the spectral bandwidth of the laser source (black dash-dotted line) must be narrow enough to cover lambda ��� and �� separately and any excess in bandwidth is to be considered a measurement error. Fig. 3 shows the dependence of CO2
molecular cross-section on wavelengths and temperature based on HITRAN data. The maximum cross-section decreases linearly with increasing ambient temperatures.
Fig. 2. Cross-Sections of CO2 and H2O
in the selected near-infrared range.
Fig. 3. Molecular cross-section as a function of wavelength at different ambient temperatures.
2.2. Uncertainty analysis
An analysis was conducted to determine the effect of various design parameters on 6�/+&, ,
which dictates the maximum achievable resolution of the system. 6789 is dependant on the accuracy of the receiver; 6� is dependant on the accuracy of the navigation system and range-finder/distance measuring equipment on-board the UAS; and 6∆%: is dependant on fluctuations in ambient temperature, as shown in Fig. 3 above. Based on this figure, a linear relationship was assumed between ∆�0�; and temperature T (in degrees Celsius), given by:
5
A NOVEL BISTATIC LIDAR SYSTEM FOR EARLY-DETECTION OF PLANT DISEASES FROM UNMANNED AIRCRAFT
∆�0�; = ±6.135 ⋅ 10�;D ∙ ΔE (5)
Therefore, given a range of sigma T, sigma psi can be determined from (5). There is also inverse relationship between these two parameters. Based on Eq. (4), the uncertainty in the measured CO2 concentration 6�/+&, is:
6�/+&, = F 1� ∙ ∆�0�;G∙ HI; + K; + L; + M;
(6)
where
I =6N&(( ⋅ O 1�� − 1������P
K =6N&' ⋅ F1���� � − 1���G L = 6� ⋅ Q1������ − 1���� �� R
M =6S% ⋅ Q1������ − 1���� �T� R
σV/WX, , σYXZ, σYX[[, σ\]^, σ_ and σ∆`a are
uncertainties in CO2 concentration, received power, beam column length and absorption coefficient cross-section, respectively. We assume that the receiver characteristics do not vary among the two narrowly-spaced wavelengths, so that σ\]^,bV = σ\]^,bcc =σ\]^. Moreover, σYXZ and σYX[[ are:
σYXZ = dQ σ\]^��e,�*R; +Q−67f9,&g ⋅ ��e,�*��e,�* R; (7)
σYX[[ = dQ σ\]^��e,�hhR; +Q−67f9,&ii ⋅ ��e,�hh��e,�hh R; (8)
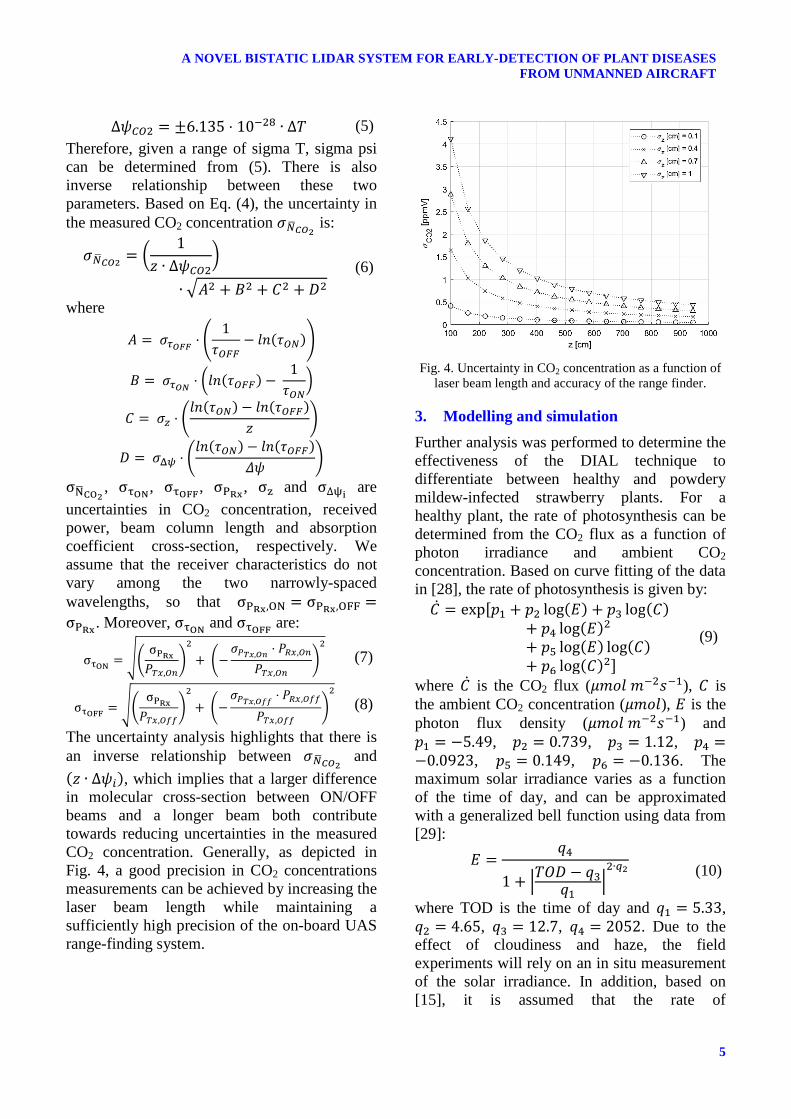
The uncertainty analysis highlights that there is an inverse relationship between 6�/+&, and �� ∙ ∆���, which implies that a larger difference in molecular cross-section between ON/OFF beams and a longer beam both contribute towards reducing uncertainties in the measured CO2 concentration. Generally, as depicted in Fig. 4, a good precision in CO2 concentrations measurements can be achieved by increasing the laser beam length while maintaining a sufficiently high precision of the on-board UAS range-finding system.
Fig. 4. Uncertainty in CO2 concentration as a function of
laser beam length and accuracy of the range finder.
3. Modelling and simulation
Further analysis was performed to determine the effectiveness of the DIAL technique to differentiate between healthy and powdery mildew-infected strawberry plants. For a healthy plant, the rate of photosynthesis can be determined from the CO2 flux as a function of photon irradiance and ambient CO2 concentration. Based on curve fitting of the data in [28], the rate of photosynthesis is given by: Lj = exp$no + n; log�r� + ns log�L�+ nt log�r�;+ nu log�r� log�L�+ nv log�L�;)
(9)
where Lj is the CO2 flux (wxy1x�;z�o), L is the ambient CO2 concentration (wxy1), r is the photon flux density (wxy1x�;z�o) and no = −5.49, n; = 0.739, ns = 1.12, nt =−0.0923, nu = 0.149, nv = −0.136. The maximum solar irradiance varies as a function of the time of day, and can be approximated with a generalized bell function using data from [29]: r = �t
1 + �E�M − �s�o �;∙�, (10)
where TOD is the time of day and �o = 5.33, �; = 4.65, �s = 12.7, �t = 2052. Due to the effect of cloudiness and haze, the field experiments will rely on an in situ measurement of the solar irradiance. In addition, based on [15], it is assumed that the rate of
6
A NOVEL BISTATIC LIDAR SYSTEM FOR EARLY-DETECTION OF PLANT DISEASES FROM UNMANNED AIRCRAFT
photosynthesis of infected plants follows the linear relation given by:
� = Lj�*h�����Lj������� = min��o ∙ MI� + �;, 1� (11)
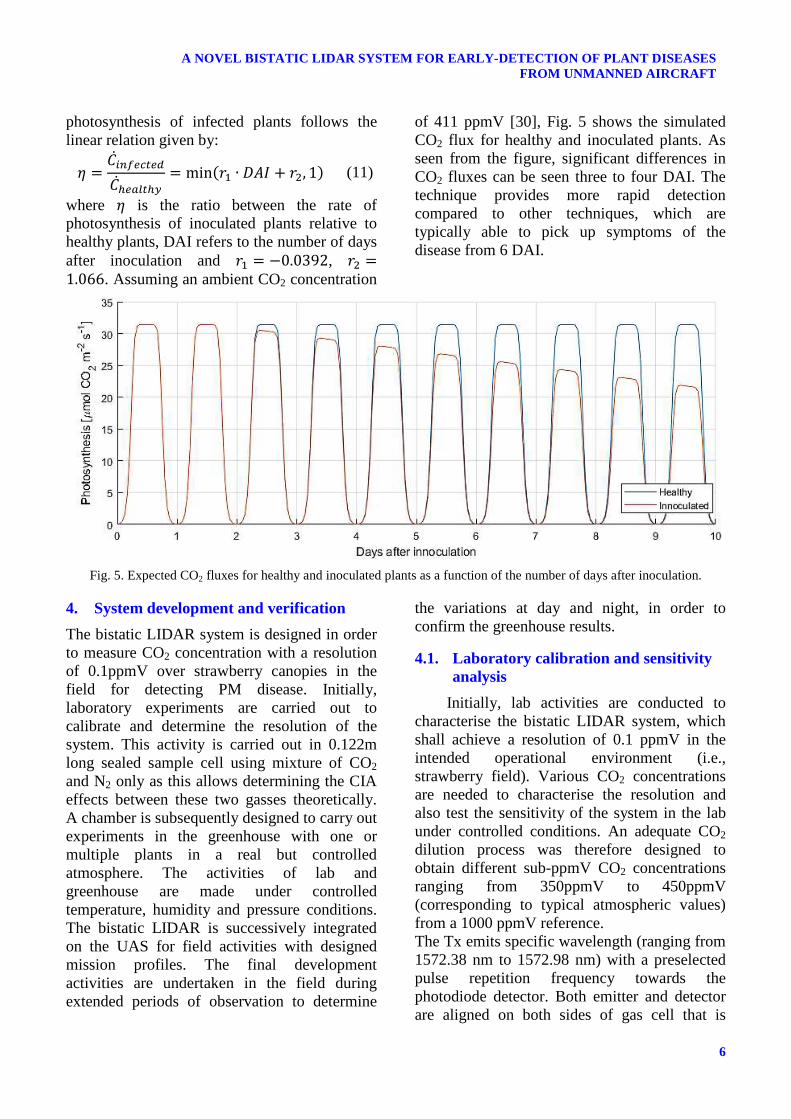
where � is the ratio between the rate of photosynthesis of inoculated plants relative to healthy plants, DAI refers to the number of days after inoculation and �o = −0.0392, �; =1.066. Assuming an ambient CO2 concentration
of 411 ppmV [30], Fig. 5 shows the simulated CO2 flux for healthy and inoculated plants. As seen from the figure, significant differences in CO2 fluxes can be seen three to four DAI. The technique provides more rapid detection compared to other techniques, which are typically able to pick up symptoms of the disease from 6 DAI.
Fig. 5. Expected CO2 fluxes for healthy and inoculated plants as a function of the number of days after inoculation.
4. System development and verification
The bistatic LIDAR system is designed in order to measure CO2 concentration with a resolution of 0.1ppmV over strawberry canopies in the field for detecting PM disease. Initially, laboratory experiments are carried out to calibrate and determine the resolution of the system. This activity is carried out in 0.122m long sealed sample cell using mixture of CO2 and N2 only as this allows determining the CIA effects between these two gasses theoretically. A chamber is subsequently designed to carry out experiments in the greenhouse with one or multiple plants in a real but controlled atmosphere. The activities of lab and greenhouse are made under controlled temperature, humidity and pressure conditions. The bistatic LIDAR is successively integrated on the UAS for field activities with designed mission profiles. The final development activities are undertaken in the field during extended periods of observation to determine
the variations at day and night, in order to confirm the greenhouse results.
4.1. Laboratory calibration and sensitivity analysis
Initially, lab activities are conducted to characterise the bistatic LIDAR system, which shall achieve a resolution of 0.1 ppmV in the intended operational environment (i.e., strawberry field). Various CO2 concentrations are needed to characterise the resolution and also test the sensitivity of the system in the lab under controlled conditions. An adequate CO2 dilution process was therefore designed to obtain different sub-ppmV CO2 concentrations ranging from 350ppmV to 450ppmV (corresponding to typical atmospheric values) from a 1000 ppmV reference. The Tx emits specific wavelength (ranging from 1572.38 nm to 1572.98 nm) with a preselected pulse repetition frequency towards the photodiode detector. Both emitter and detector are aligned on both sides of gas cell that is
7
A NOVEL BISTATIC LIDAR SYSTEM FOR EARLY-DETECTION OF PLANT DISEASES FROM UNMANNED AIRCRAFT
0.122m long and is equipped with Sodium Chloride (NaCl) windows with very high transparency in the infrared. The laboratory experiment is used to determine the resolution of the system by lab-cell-detector system. The parameters that are considered in the gas cell are isolated mixture of CO2 and N2, in which the attenuation coefficients include absorption cross-section of CO2 and N2 and CIA of CO2 and N2 as calculated from [31]. The bistatic LIDAR Tx and Rx are set up as close as possible to the sample cell windows with fixed distances. The tank with the N2-CO2 mixture (350ppmV, 351ppmV, 352ppmV,…450ppmV) is connected to one valve of the gas cell, the other valve of the gas cell is free to release the purged gas from the gas cell to the environment. Initially, nitrogen-only is used to flush the gas cell and its reading (concentration) is measured by the bistatic LIDAR system.
4.2. Greenhouse experiments
A custom chamber is designed with specific dimensions and components, according to [32]. Two uncoated fused Silica broadband windows are aligned and sealed on both sides of the chamber. A temperature and humidity sensor is used to track the current temperature and humidity during the experiments. Two three-ways stopcocks are sealed on the top of the chamber. A syringe, a needle and a glass vial are used to collect the gas sample. A computer fan is activated to mix the air in the chamber. The length (width) of the chamber is: z=0.6m (from emitter to detector), and the volume is 242.4 L. The chamber covers a pot of healthy or inoculated plant to measure CO2 concentrations above canopy in extended period of time from 1 DAI to 10 DAI in day and night-time. The plant disease can be early detected by tracking CO2 concentration during this period.
4.3. UAS integration and flight testing
The selected UAS is a hexacopter custom-designed and assembled by RMIT, with capabilities of automatic take-off, landing and flight with a user-based set of flight patterns. The maximum payload is roughly 2.5 kg yielding 20 minutes of continuous operation. The UAS is also equipped with Inertial
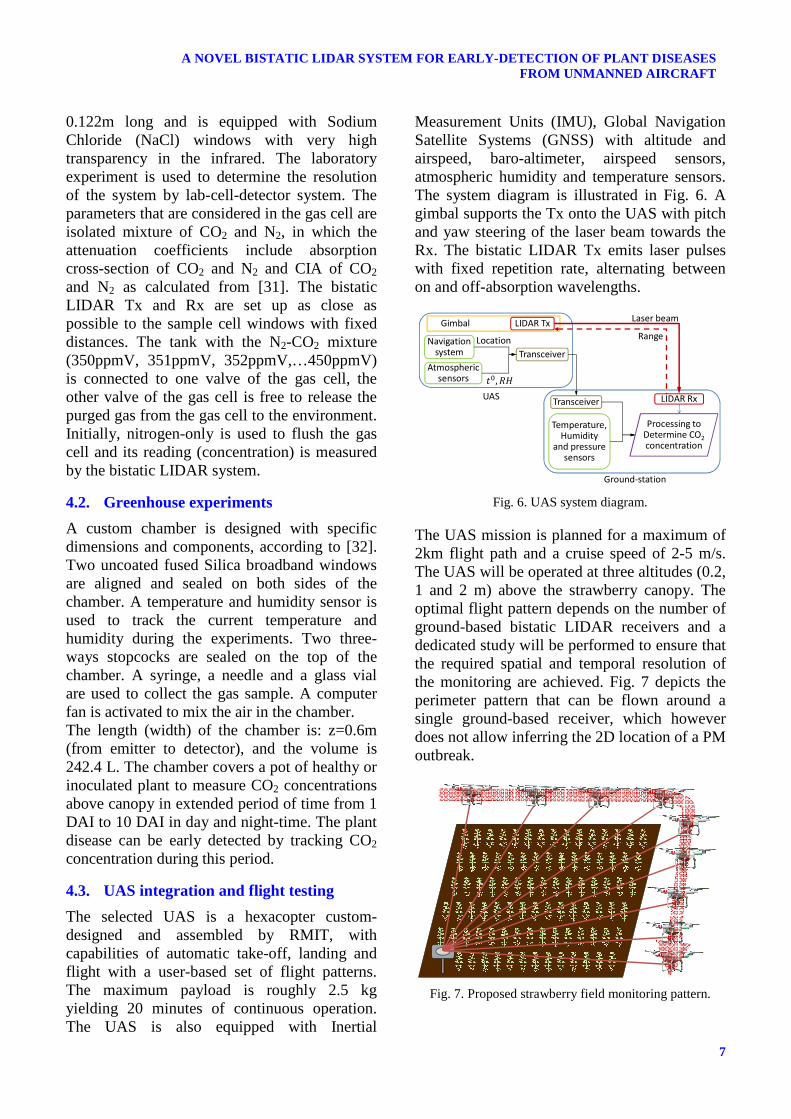
Measurement Units (IMU), Global Navigation Satellite Systems (GNSS) with altitude and airspeed, baro-altimeter, airspeed sensors, atmospheric humidity and temperature sensors. The system diagram is illustrated in Fig. 6. A gimbal supports the Tx onto the UAS with pitch and yaw steering of the laser beam towards the Rx. The bistatic LIDAR Tx emits laser pulses with fixed repetition rate, alternating between on and off-absorption wavelengths.
Gimbal LIDAR Tx
Navigation
system Transceiver
Atmospheric
sensors
Location
��, !�LIDAR Rx
Processing to
Determine CO2
concentration
Transceiver
Temperature,
Humidity
and pressure
sensors
Laser beam
UAS
Ground-station
Range
Fig. 6. UAS system diagram.
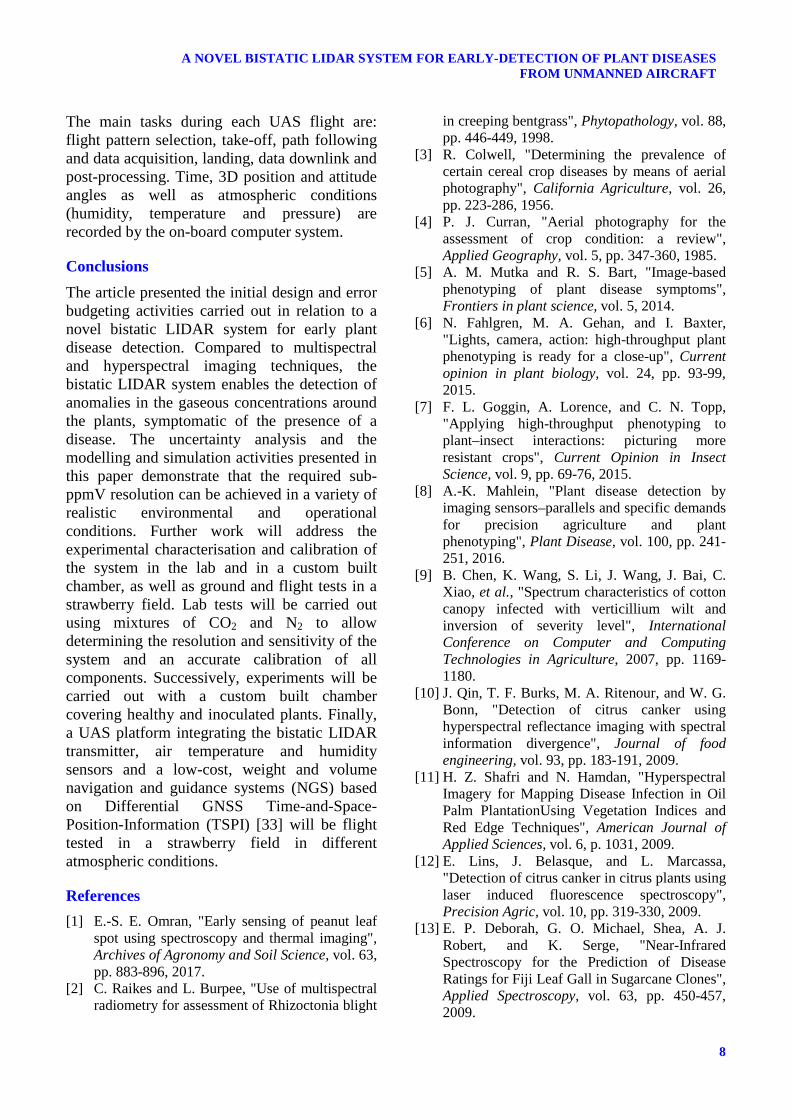
The UAS mission is planned for a maximum of 2km flight path and a cruise speed of 2-5 m/s. The UAS will be operated at three altitudes (0.2, 1 and 2 m) above the strawberry canopy. The optimal flight pattern depends on the number of ground-based bistatic LIDAR receivers and a dedicated study will be performed to ensure that the required spatial and temporal resolution of the monitoring are achieved. Fig. 7 depicts the perimeter pattern that can be flown around a single ground-based receiver, which however does not allow inferring the 2D location of a PM outbreak.
Fig. 7. Proposed strawberry field monitoring pattern.
8
A NOVEL BISTATIC LIDAR SYSTEM FOR EARLY-DETECTION OF PLANT DISEASES FROM UNMANNED AIRCRAFT
The main tasks during each UAS flight are: flight pattern selection, take-off, path following and data acquisition, landing, data downlink and post-processing. Time, 3D position and attitude angles as well as atmospheric conditions (humidity, temperature and pressure) are recorded by the on-board computer system.
Conclusions
The article presented the initial design and error budgeting activities carried out in relation to a novel bistatic LIDAR system for early plant disease detection. Compared to multispectral and hyperspectral imaging techniques, the bistatic LIDAR system enables the detection of anomalies in the gaseous concentrations around the plants, symptomatic of the presence of a disease. The uncertainty analysis and the modelling and simulation activities presented in this paper demonstrate that the required sub-ppmV resolution can be achieved in a variety of realistic environmental and operational conditions. Further work will address the experimental characterisation and calibration of the system in the lab and in a custom built chamber, as well as ground and flight tests in a strawberry field. Lab tests will be carried out using mixtures of CO2 and N2 to allow determining the resolution and sensitivity of the system and an accurate calibration of all components. Successively, experiments will be carried out with a custom built chamber covering healthy and inoculated plants. Finally, a UAS platform integrating the bistatic LIDAR transmitter, air temperature and humidity sensors and a low-cost, weight and volume navigation and guidance systems (NGS) based on Differential GNSS Time-and-Space-Position-Information (TSPI) [33] will be flight tested in a strawberry field in different atmospheric conditions.
References
[1] E.-S. E. Omran, "Early sensing of peanut leaf spot using spectroscopy and thermal imaging", Archives of Agronomy and Soil Science, vol. 63, pp. 883-896, 2017.
[2] C. Raikes and L. Burpee, "Use of multispectral radiometry for assessment of Rhizoctonia blight
in creeping bentgrass", Phytopathology, vol. 88, pp. 446-449, 1998.
[3] R. Colwell, "Determining the prevalence of certain cereal crop diseases by means of aerial photography", California Agriculture, vol. 26, pp. 223-286, 1956.
[4] P. J. Curran, "Aerial photography for the assessment of crop condition: a review", Applied Geography, vol. 5, pp. 347-360, 1985.
[5] A. M. Mutka and R. S. Bart, "Image-based phenotyping of plant disease symptoms", Frontiers in plant science, vol. 5, 2014.
[6] N. Fahlgren, M. A. Gehan, and I. Baxter, "Lights, camera, action: high-throughput plant phenotyping is ready for a close-up", Current opinion in plant biology, vol. 24, pp. 93-99, 2015.
[7] F. L. Goggin, A. Lorence, and C. N. Topp, "Applying high-throughput phenotyping to plant–insect interactions: picturing more resistant crops", Current Opinion in Insect Science, vol. 9, pp. 69-76, 2015.
[8] A.-K. Mahlein, "Plant disease detection by imaging sensors–parallels and specific demands for precision agriculture and plant phenotyping", Plant Disease, vol. 100, pp. 241-251, 2016.
[9] B. Chen, K. Wang, S. Li, J. Wang, J. Bai, C. Xiao, et al., "Spectrum characteristics of cotton canopy infected with verticillium wilt and inversion of severity level", International Conference on Computer and Computing Technologies in Agriculture, 2007, pp. 1169-1180.
[10] J. Qin, T. F. Burks, M. A. Ritenour, and W. G. Bonn, "Detection of citrus canker using hyperspectral reflectance imaging with spectral information divergence", Journal of food engineering, vol. 93, pp. 183-191, 2009.
[11] H. Z. Shafri and N. Hamdan, "Hyperspectral Imagery for Mapping Disease Infection in Oil Palm PlantationUsing Vegetation Indices and Red Edge Techniques", American Journal of Applied Sciences, vol. 6, p. 1031, 2009.
[12] E. Lins, J. Belasque, and L. Marcassa, "Detection of citrus canker in citrus plants using laser induced fluorescence spectroscopy", Precision Agric, vol. 10, pp. 319-330, 2009.
[13] E. P. Deborah, G. O. Michael, Shea, A. J. Robert, and K. Serge, "Near-Infrared Spectroscopy for the Prediction of Disease Ratings for Fiji Leaf Gall in Sugarcane Clones", Applied Spectroscopy, vol. 63, pp. 450-457, 2009.
9
A NOVEL BISTATIC LIDAR SYSTEM FOR EARLY-DETECTION OF PLANT DISEASES FROM UNMANNED AIRCRAFT
[14] S. Sankaran, A. Mishra, R. Ehsani, and C. Davis, "A review of advanced techniques for detecting plant diseases", Computers and Electronics in Agriculture, vol. 72, pp. 1-13, 2010.
[15] T. R. Gordon and J. M. Duniway, "Effects of powdery mildew infection on the efficiency of CO2 fixation and light utilization by sugar beet leaves", Plant Physiology, vol. 69, pp. 139-142, 1982.
[16] C. D. Keeling, "The concentration and isotopic abundances of atmospheric carbon dioxide in rural areas", Geochimica et cosmochimica acta, vol. 13, pp. 322-334, 1958.
[17] J. L. Wright and E. Lemon, "Photosynthesis under Field Conditions. IX. Vertical Distribution of Photosynthesis Within a Corn Crop 1", Agronomy Journal, vol. 58, pp. 265-268, 1966.
[18] L. Allen Jr, "Variations in carbon dioxide concentration over an agricultural field", Agricultural meteorology, vol. 8, pp. 5-24, 1971.
[19] D. Reicosky, "Diurnal and seasonal trends in carbon dioxide concentrations in corn and soybean canopies as affected by tillage and irrigation", Agricultural and forest meteorology, vol. 48, pp. 285-303, 1989.
[20] N. Buchmann, W. Y. KAO, and J. R. Ehleringer, "Carbon dioxide concentrations within forest canopies—variation with time, stand structure, and vegetation type", Global Change Biology, vol. 2, pp. 421-432, 1996.
[21] E. Lemon and J. Wright, "Photosynthesis Under Field Conditions. XA. Assessing Sources and Sinks of Carbon Dioxide in a Corn (Zea mays L.) Crop Using a Momentum Balance Approach 1", Agronomy Journal, vol. 61, pp. 405-411, 1969.
[22] J. Prueger, J. Hatfield, T. Parkin, W. Kustas, and T. Kaspar, "Carbon dioxide dynamics during a growing season in midwestern cropping systems", Environmental management, vol. 33, pp. S330-S343, 2004.
[23] R. M. Schotland, "Errors in the lidar measurement of atmospheric gases by differential absorption", Journal of Applied Meteorology, vol. 13, pp. 71-77, 1974.
[24] E. V. Browell, S. Ismail, and W. B. Grant, "DIAL", in Encyclopedia of Atmospheric Sciences, 2003.
[25] A. Gardi, R. Sabatini, and G. Wild, "Unmanned Aircraft bistatic LIDAR for CO2 column density determination", 2014 IEEE
International Workshop on Metrology for Aerospace, MetroAeroSpace 2014 Proceedings, Benevento, Italy, 2014, pp. 44-49.
[26] A. Gardi, R. Sabatini, and S. Ramasamy, "Stand-off measurement of industrial air pollutant emissions from unmanned aircraft", 2016 International Conference on Unmanned Aircraft Systems, ICUAS 2016, 2016, pp. 1162-1171.
[27] R. Sabatini, M. A. Richardson, H. Jia, and D. Zammit-Mangion, "Airborne laser systems for atmospheric sounding in the near infrared", SPIE 8433 Laser Sources and Applications, Photonics Europe 2012, Brussels, Belgium, 2012.
[28] B. J. Atwell, Plants in action: adaptation in nature, performance in cultivation, Macmillan Education AU, 1999.
[29] Y. Li, G. Jiang, S. Niu, M. Liu, Y. Peng, S. Yu, et al., "Gas exchange and water use efficiency of three native tree species in Hunshandak Sandland of China", Photosynthetica, vol. 41, pp. 227-232, 2003.
[30] K. Loria. (2018, June 13). The amount of carbon dioxide in the atmosphere just hit its highest level in 800,000 years, and scientists predict deadly consequences. Available: https://www.businessinsider.com.au/carbon-dioxide-record-human-health-effects-2018-5
[31] Y. I. Baranov, "On the significant enhancement of the continuum-collision induced absorption in H 2 O+ CO 2 mixtures", Journal of Quantitative Spectroscopy and Radiative Transfer, vol. 175, pp. 100-106, 2016.
[32] T. Parkin, R. Venterea, and R. Follett, "Chamber-based trace gas flux measurements", Sampling protocols, vol. 3, pp. 3-1, 2010.
[33] F. Cappello, S. Ramasamy, and R. Sabatini, "A low-cost and high performance navigation system for small RPAS applications", Aerospace Science and Technology, vol. 58, pp. 529-545, 2016.
Copyright Statement
The authors confirm that they, and/or their company or organization, hold copyright on all of the original material included in this paper. The authors also confirm that they have obtained permission, from the copyright holder of any third party material included in this paper, to publish it as part of their paper. The authors confirm that they give permission, or have obtained permission from the copyright holder of this paper, for the publication and distribution of this paper as part of the ICAS proceedings or as individual off-prints from the proceedings.


