
University of ConnecticutDigitalCommons@UConn
Honors Scholar Theses Honors Scholar Program
Spring 5-2-2014
A First-Principles Examination of Dopants inHfO2Daniel CunninghamUniversity of Connecticut - Storrs, [email protected]
Follow this and additional works at: http://digitalcommons.uconn.edu/srhonors_theses
Part of the Other Materials Science and Engineering Commons
Recommended CitationCunningham, Daniel, "A First-Principles Examination of Dopants in HfO2" (2014). Honors Scholar Theses. 359.http://digitalcommons.uconn.edu/srhonors_theses/359

A First-‐Principles Examination of Dopants in HfO2
Daniel Cunningham
University of Connecticut Department of Materials Science and Engineering
Honors Thesis May 2014
Honors Thesis Advisor: Dr. Rampi Ramprasad

i
Table of Contents Abstract .......................................................................................................................................................... ii Acknowledgments .................................................................................................................................... iii
List of Figures ............................................................................................................................................. iv List of Tables ............................................................................................................................................... iv
1 Introduction .......................................................................................................................................... 1 1.1 HfO2 as gate dielectric ............................................................................................................................. 1 1.2 Crystal Structures of HfO2 ..................................................................................................................... 3 1.3 Dopants in HfO2 ......................................................................................................................................... 4 1.4 Objectives of Research ............................................................................................................................ 5
2 Computational Methods .................................................................................................................. 7 2.1 Density Functional Theory ................................................................................................................... 7 2.2 Details of Study ....................................................................................................................................... 10 2.3 Calculation and Definitions of Relative Energies ..................................................................... 13
3 Results and Discussion ................................................................................................................. 15
4 Conclusions and Outlook ............................................................................................................. 20 4.1 Summary .................................................................................................................................................... 20 4.2 Future Directions ................................................................................................................................... 21 4.3 Reflections ................................................................................................................................................ 23
5 References .......................................................................................................................................... 24

ii
Abstract
A systematic first-‐principles study using density functional theory was
performed on dopants in HfO2, a material with great importance as a high-‐k
dielectric. Sixteen dopants were tested, most of which came from the fourth period
of the periodic table (K-‐Ge, Al and Si). The relative stability of the monoclinic,
tetragonal, and cubic phases were calculated for HfO2 with each dopant in order to
determine which dopants tend to stabilize which phases. It was found that the most
important factor in determining relative phase stability of doped HfO2 was the ionic
radius of the dopant, where dopants smaller than Hf tend to stabilize the tetragonal
phase and dopants larger than Hf tend to stabilize the cubic phase. The results and
methods of this study show a viable computational way to select dopants in HfO2 or
in other materials.

iii
Acknowledgments
First and foremost, I would like to thank my Honors thesis advisor, Dr. Rampi
Ramprasad. He originally introduced me to the field of computational materials
science and quantum mechanical modeling. He was extremely helpful and
supportive over the course of the entire year, as he helped me learn all of the
necessary theory and background for the project and was always available for
discussion. His knowledge of and passion for his field and his research is inspiring
and I could not have hoped for a better advisor.
I would also like to thank all of Dr. Ramprasad’s group members, especially
Chenchen Wang and Vinit Sharma. They helped me learn how to actually run
calculations and were always able to answer any questions I had.
Lastly, I would like to thank the faculty, staff, and students in the Materials
Science and Engineering program. Our program is very supportive of its students
and many people helped me over my four years at UConn and allowed me to get to
this point.

iv
List of Figures
Figure 1: A schematic diagram of a MOSFET [2]. ......................................................................... 2 Figure 2: Standard 12-‐atom unit cells for HfO2 in the (a) monoclinic, (b) tetragonal,
and (c) cubic phases. ....................................................................................................................... 3
Figure 3: The dopants investigated in this study, highlighted in yellow. Hafnium is highlighted in red. ............................................................................................................................ 6
Figure 4: The k-‐point convergence (left) tests for the unit cells of all three phases of HfO2 and the plane wave energy cutoff convergence test (right) performed on a cubic unit cell. It was found that a 4 × 4 × 4 k-‐point mesh and a 600 eV energy cutoff gave sufficient accuracy for a 12-‐atom unit cell. ................................................ 11
Figure 5: Supercells of HfO2 containing one dopant atom (blue) in the (a) monoclinic, (b) tetragonal, and (c) cubic phases. ............................................................ 13
Figure 6: A plot of ΔEc-‐mD and ΔEt-‐mD for each dopant studied. The horizontal dotted lines correspond to ΔEc-‐mHf and ΔEt-‐mHf. Other theory data is from Reference [10]. ............................................................................................................................... 17
Figure 7: A plot of ΔEc-‐mD-‐ΔEc-‐mHf and ΔEt-‐mD-‐ΔEt-‐mHf against the relative ionic radius of each dopant compared to Hf. The horizontal and vertical dotted lines represent the values for pure HfO2 and intercept their respective axes at zero. ............................................................................................................................................................... 18
Figure 8: A plot of ΔEc-‐mD-‐ΔEc-‐mHf and ΔEt-‐mD-‐ΔEt-‐mHf against the oxidation state for all dopants. Dopants with oxidation states closest to that of Hf (+4) tend to stabilize the tetragonal phase and destabilize the cubic phase. ............... 20
List of Tables
Table 1: Calculated structural parameters and comparison to other theory and experimental values. .................................................................................................................... 12
Table 2: A summary of dopant properties and calculated values. ..................................... 15

1
1 Introduction
1.1 HfO2 as gate dielectric
Hafnium oxide (HfO2), or hafnia, is a dielectric material with several
applications. Perhaps the most important contemporary application of hafnia is as
an emerging replacement for the silicon dioxide (SiO2) as the gate dielectric material
in metal-‐oxide-‐semiconductor field-‐effect-‐transistors (MOSFETs). A MOSFET
consists of several layers, including a metal gate electrode, a gate dielectric, and a
semiconductor substrate, as seen in Figure 1. Si and SiO2 are commonly used as the
substrate and gate dielectric material, respectively. As MOSFETs become smaller,
following the trend of Moore’s Law, the capacitance of the gate dielectric must
remain the same. Since capacitance varies with the thickness of a material, the gate
dielectric must become thinner as devices become smaller. However, there comes a
point when the oxide layer cannot be made any thinner. When an SiO2 layer is about
1 nm thick, the leakage current due to quantum tunneling of electrons becomes too
high. The absolute limiting thickness of an SiO2 layer is about 7 Å, at which point
SiO2 loses its bulk behavior, such as its full energy gap [1]. The limiting thickness has
very nearly been reached with SiO2 as the gate dielectric material [2] , so a different
approach must be taken in order to continue the advancement of MOSFET
technology.

2
Figure 1: A schematic diagram of a MOSFET [3].
One potential approach is the use of high-‐k dielectrics, where k stands for the
dielectric constant of a material. A material with a high dielectric constant can have
a higher thickness while maintaining the same capacitance as a material with a low
dielectric constant. If such a material were used as the gate dielectric in a MOSFET,
the transistor could become smaller before being limited by the thickness of the
dielectric. One of the most promising high-‐k dielectrics is HfO2, which has a
dielectric constant of approximately 25 in an amorphous state compared to
approximately 4 for SiO2. HfO2 is also a promising replacement for other reasons,
such as a large enough band gap and favorable stability and interface quality with Si,
compared to other high-‐k dielectrics [3].
Hafnia is also used in other applications that make use of its high melting
point, chemical stability, and low thermal conductivity. For example, hafnia is often
used as a refractory material and in thermal barrier coatings [4].
3
1.2 Crystal Structures of HfO2
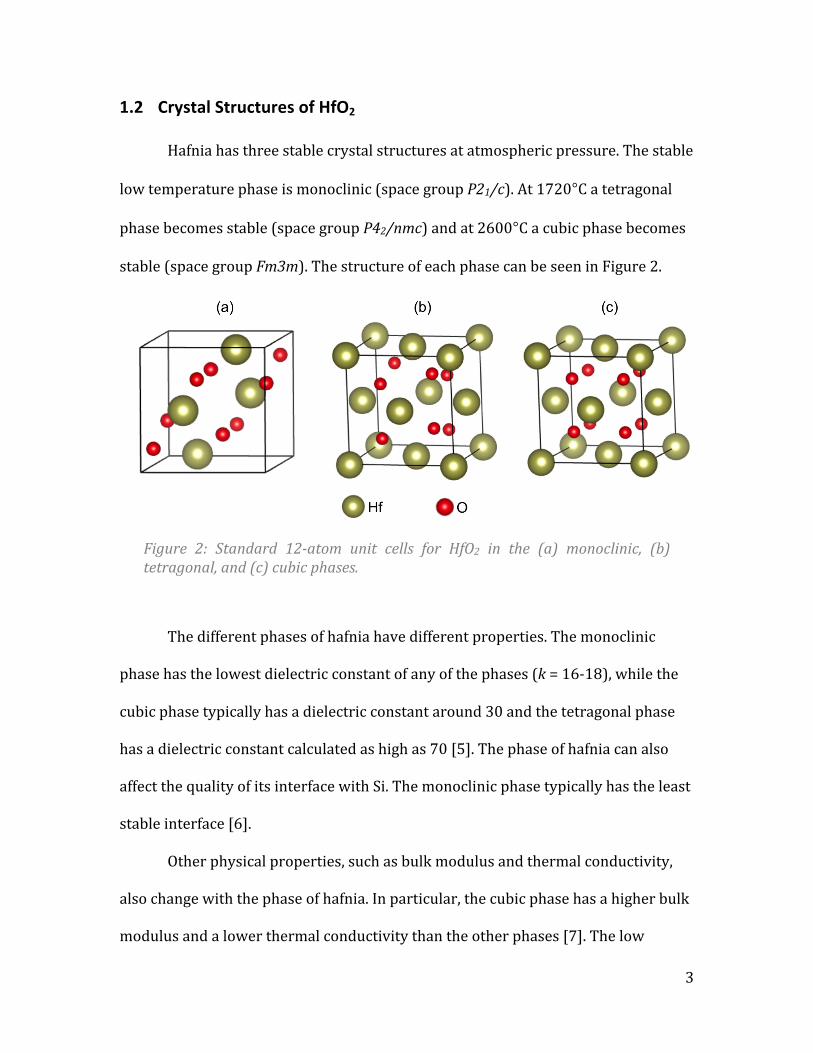
Hafnia has three stable crystal structures at atmospheric pressure. The stable
low temperature phase is monoclinic (space group P21/c). At 1720°C a tetragonal
phase becomes stable (space group P42/nmc) and at 2600°C a cubic phase becomes
stable (space group Fm3m). The structure of each phase can be seen in Figure 2.
Figure 2: Standard 12-‐atom unit cells for HfO2 in the (a) monoclinic, (b) tetragonal, and (c) cubic phases.
The different phases of hafnia have different properties. The monoclinic
phase has the lowest dielectric constant of any of the phases (k = 16-‐18), while the
cubic phase typically has a dielectric constant around 30 and the tetragonal phase
has a dielectric constant calculated as high as 70 [5]. The phase of hafnia can also
affect the quality of its interface with Si. The monoclinic phase typically has the least
stable interface [6].
Other physical properties, such as bulk modulus and thermal conductivity,
also change with the phase of hafnia. In particular, the cubic phase has a higher bulk
modulus and a lower thermal conductivity than the other phases [7]. The low

4
thermal conductivity of the cubic phase makes it the most favorable phase for use in
some applications, such as thermal barrier coatings for jet engines [4]. Since certain
phases of hafnia can be more favorable for some applications, it is desirable to be
able to change the relative stability of the three phases. One way of achieving this is
through doping.
1.3 Dopants in HfO2
Doping is the introduction of trace impurity elements in order to tune the
properties of a material. It has been shown that certain dopants in hafnia can
stabilize either the cubic or tetragonal phase over the monoclinic phase, which is
typically stable at low temperatures. Many studies, both experimental and
computational, have been performed on hafnia investigating the effect of a wide
variety of dopants. It has been shown experimentally that some dopants, including
Y, Gd, and Mn, stabilize the cubic phase at high enough dopant concentrations,
typically around 10-‐20% [4, 8-‐10]. Computationally, it has been shown that dopants
can stabilize either the cubic or tetragonal phase. One study in particular [11] found
that some dopants (Si, Ge, Sn, Ti, P, Al) stabilize the tetragonal phase while others (Y,
Sc, Gd) stabilize the cubic phase. This study identified the ionic radius as a property
that affected the stable phase, where dopants with small ionic radii stabilize the
tetragonal phase and dopants with large ionic radii stabilize the cubic phase.
Other interesting properties of doped hafnia have also been observed,
unrelated to the relative stability of its phases. Experimentally, it has been shown
that Gd-‐doped hafnia changes from an n-‐type to a p-‐type semiconductor with

5
increasing dopant concentration [8] and that Co-‐doped hafnia is paramagnetic [12].
Computationally, it has been predicted that Mn-‐doped hafnia is ferromagnetic and
half-‐metallic, meaning it behaves as a conductor for electrons of one spin and an
insulators for electrons with the opposite spin [13]. These studies are not
particularly relevant to the current study, but they demonstrate some other types of
properties that doping can affect and they show some potential future extensions or
applications of this work.
1.4 Objectives of Research
The main objective of this study is to conduct a systematic examination of the
role of dopants on the structure and relative stability of the phases of HfO2. A large
number of dopants were tested using modern quantum mechanical modeling
techniques. This type of study is infeasible experimentally with such a high number
of dopants in such a small time frame, and modern computational techniques have
the predictive power necessary to yield valuable and accurate results. The dopants
were chosen primarily from a single period from the periodic table, as seen in
Figure 3. Dopants were chosen in this way so that trends in the data might be
observed and used to find relationships between dopant properties and phase
stability, analogous to the empirical Hume-‐Rothery rules for solid solutions.

6
Figure 3: The dopants investigated in this study, highlighted in yellow. Hafnium is highlighted in red.
Another objective of this study is to develop and demonstrate a method for
designing materials with desired properties through the use of first-‐principles
modeling. A large number of calculations can be done on a wide variety of materials
in order to create a comprehensive “library” of materials data. The creation of such a
library would have a widespread impact on the field of materials science. The
library would expedite the process of materials design by reducing the need for
experimental testing and development. A similar computational study has
previously been done on BaTiO3 [14] and more studies are expected to be done in
the future on other materials.

7
2 Computational Methods
2.1 Density Functional Theory
Density functional theory (DFT) is a first-‐principles method that is used to
perform quantum mechanical modeling of many-‐body systems. DFT was first
developed in the 1960s by Walter Kohn and others [15, 16]. It has since grown
considerably in popularity. Today, DFT is used extensively in physics, chemistry, and
materials science to model atoms, molecules, and solids containing up to a few
hundred atoms.
The basis for DFT lies in quantum mechanics, specifically with the many-‐
body Schrodinger equation. The Schrodinger equation is the most fundamental
equation to quantum mechanics and it is written
𝐻𝛹 = 𝐸𝛹
where H is the Hamiltonian operator, 𝛹 is the wave function that describes the
quantum state of the system, and E is the energy of the system. In a three-‐
dimensional system with N electrons, 𝛹 is a function of 3N variables, the positions
of each electron with three degrees of freedom. The many-‐electron Schrodinger
equation is
𝐻!"!#𝛹 𝑟!, 𝑟!,… , 𝑟! = 𝐸!"!#𝛹(𝑟!, 𝑟!,… 𝑟!)
where each 𝑟! represents the position of an electron in three dimensions. The
Hamiltonian operator takes the form
𝐻!"!# = −ℏ!
2𝑚 𝛻!!!
!!!
+12
𝑒!
𝑟! − 𝑟!
!
!!𝑖
!
!!!
−𝑍!𝑒!
|𝑅! − 𝑟!|
!
!!!
!
!!!
8
where the terms from left to right represent the kinetic energy of the electrons, the
electron-‐electron interaction energy, and the potential energy from the external
field from the positively charged nuclei. This equation quickly becomes impossible
to solve analytically and extremely difficult to solve numerically as the size of the
system increases due to the large number of variables.
DFT provides a more feasible way to solve such electronic structure
problems. The key ideas behind DFT are the two Hohenberg-‐Kohn theorems [15].
The first Hohenberg-‐Kohn theorem states that the ground state energy from the
many-‐electron Schrodinger equation is a unique functional of the electron density of
the system. Thus, the many-‐electron Schrodinger problem, which depends on the
wave functions of all electrons involved, can be mapped to a problem that depends
only on the charge density 𝑛(𝑟) of the system without electron-‐electron
interactions. By looking at this problem instead, it becomes necessary to find a
function of three variables, 𝑛(𝑟), rather than a function of 3𝑁 variables,
𝛹(𝑟!, 𝑟!,… , 𝑟!). This first theorem implies that if the ground state electron density is
known, then wave function (along with all properties of the system) is also known.
The second Hohenberg-‐Kohn theorem [16] provides more information about
the functional of electron density. This theorem states that the electron density that
minimizes the energy functional proven to exist by the first theorem is the true
ground state electron density of the system. Thus, it becomes a minimization
problem to determine the ground state electron density or, equivalently, the ground
state energy. Using the assumptions of DFT, it can be shown that the ground state
energy of the system is related to the ground state electron density by the equation

9
𝐸!"!# = 𝑇 𝑛 𝑟 +𝑒!
2𝑛 𝑟 𝑛 𝑟!
𝑟 − 𝑟! 𝑑!𝑟𝑑!𝑟′+ 𝑉 𝑟 𝑛 𝑟 𝑑!𝑟 + 𝐸!" 𝑛 𝑟
where the terms from left to right represent the electron kinetic energies, the
Coulomb interactions between pairs of electrons, the Coulomb interactions between
electrons and nuclei, and a term called the exchange correlation functional. All terms
except the exchange correlation term are known and can be calculated more or less
exactly. The exchange correlation functional is defined to include all quantum
mechanical effects that are not accounted for by the other terms. In theory, DFT
represents an exact solution of the many-‐body Schrodinger equation, but in practice
the exact form of the exchange correlation functional is not known.
DFT does not provide a way to find the exact functional form of the exchange
correlation interaction, so approximations must be used. Many approximations of
various complexity for the exchange correlation functional have been developed.
The simplest approximation of the exchange correlation is the local density
approximation (LDA). This approximation uses only the local electron density to
approximate the exchange correlation functional. The next step above LDA is the
generalized gradient approximation (GGA). In addition to using local electron
density, GGA uses the gradient of the local electron density to approximate the
exchange correlation. It is possible to use more complex approximations by adding
additional information, such as the second or third gradients of local electron
density.

10
2.2 Details of Study
All calculations in this study were performed with the Vienna ab initio
simulation package (VASP). The exchange correlation interaction was treated with
the generalized gradient approximation (GGA) using the Perdew-‐Burke-‐Ernzerhoff
(PBE) functional.
Before dopants were examined, DFT calculations were performed on bulk
hafnia. First, convergence tests were performed in order to determine the choice of
necessary parameters such as the size of the k-‐point mesh and the plane wave cutoff
energy for all calculations. These convergence tests were performed on 12-‐atom
unit cells of each of the three phases of HfO2. Both the k-‐point and energy cutoff
convergence tests were performed in order to obtain an energy value converged
within 0.02 eV. It was found that 4 k-‐points in each direction (i.e., a 4 × 4 × 4
Monkhorst-‐Pack mesh) and a plane wave cutoff energy of 600 eV were sufficient, as
seen in Figure 4.

11
Figure 4: The k-‐point convergence (left) tests for the unit cells of all three phases of HfO2 and the plane wave energy cutoff convergence test (right) performed on a cubic unit cell. It was found that a 4 × 4 × 4 k-‐point mesh and a 600 eV energy cutoff gave sufficient accuracy for a 12-‐atom unit cell.
After the k-‐point mesh and plane wave cutoff energy were determined, the
structural parameters of each phase of HfO2 were calculated. For each crystal
structure, the cell volume and parameters and the ion positions within the cell were
allowed to relax in order to minimize the energy of the structure. The structural
parameters of each relaxed structure were calculated. The calculated values are
reported in Table 1, where they are compared with experimental data and other
computational studies. The values calculated in the present study agree very well
with the values from other sources.

12
Present Study
Other theory (GGA)a
Other theory (LDA)b
Experimentc
Cubic a 5.06 5.05 5.04 5.08
Tetragonal a 5.07 5.06 5.06 5.15 c 5.20 5.20 5.13 5.29
Monoclinic a 5.14 5.12 5.11 5.12 b 5.19 5.20 5.17 5.17 c 5.32 5.28 5.28 5.30 beta 99.7 99.7 99.4 99.2 a Reference [11] b Reference [17] c Reference [18] (cubic, tetragonal) and Reference [19] (monoclinic)
Table 1: Calculated structural parameters and comparison to other theory and experimental values.
After the accuracy of the structural calculations had been confirmed by
comparing with existing data, calculations with dopants were performed. All
calculations with dopants were done using 2×2×2 supercells containing a total of
eight HfO2 unit cells (96 total atoms). Supercells were constructed by expanding the
unit cell for a given phase twice in each direction. Since the size of the cell was
doubled in each direction, the necessary number of k-‐points in each direction was
halved. Thus, supercell calculations were performed using a 2×2×2 Monkhorst-‐
Pack k-‐point mesh.
Dopants from across the periodic table (see Figure 3) were put into the
supercells, with a single dopant atom replacing a single Hf atom. Each supercell
contains 96 atoms with 32 Hf sites and 64 O sites, so the dopant concentration for

13
all calculations was 3.125% with respect to Hf. The generic doped supercells for
each phase are shown in Figure 5.
Figure 5: Supercells of HfO2 containing one dopant atom (blue) in the (a) monoclinic, (b) tetragonal, and (c) cubic phases.
The supercells of doped HfO2 were relaxed in exactly the same manner as
described above for the structural calculations of the unit cells. The ion locations
and cell volume were relaxed until the minimum energy configuration was found.
These structural calculations were performed for all dopants in Figure 3 in each of
the three phases of hafnia.
2.3 Calculation and Definitions of Relative Energies
When a structural calculation was performed with DFT, the equilibrium
energy of the relaxed structure was calculated. Using this equilibrium energy,
several relative energies were defined in order compare different doped structures
with each other and with the undoped structures. For each dopant (and for undoped
HfO2), three DFT energies were calculated: the energies for the monoclinic,
tetragonal, and cubic phases. The relative values of those energies compared to one

14
another are more meaningful than the actual values. Since the monoclinic structure
is the stable low-‐temperature phase, it had the lowest equilibrium energy. The first
set of relative energies was calculated by finding the difference between the
monoclinic and the tetragonal or cubic phases. Thus, the relative tetragonal energy
was defined as
𝛥𝐸!!!! = 𝐸!"!#$%&'$(! − 𝐸!"#"$%&#&$!
and the relative cubic energy was defined as
𝛥𝐸!!!! = 𝐸!"#$!! − 𝐸!"#"$%&#&$! ,
where 𝐸!"!#$%&'$(! and 𝐸!"#$!! are the DFT energies of the relaxed structures of HfO2
doped with the dopant 𝐷 in the tetragonal and cubic phases, respectively. The
relative energies for undoped hafnia were defined as 𝛥𝐸!!!!" and 𝛥𝐸!!!
!" .
If 𝛥𝐸!!!! < 𝛥𝐸!!!!" for some dopant D, then D tends to stabilize the tetragonal
phase (or the cubic phase if 𝛥𝐸!!!! < 𝛥𝐸!!!!" ). In order to more clearly visualize
which dopants stabilize (and destabilize) which phase, a second set of relative
energies was developed using the first set of relative energies. These relative
energies are defined as 𝛥𝐸!!!! − 𝛥𝐸!!!!" and 𝛥𝐸!!!! − 𝛥𝐸!!!
!" for the tetragonal and
cubic phases, respectively. If 𝛥𝐸!!!! − 𝛥𝐸!!!!" < 0 (or 𝛥𝐸!!!! − 𝛥𝐸!!!
!" < 0), then the
dopant D tends to stabilize the tetragonal (or cubic) phase.
The relative energies were plotted against two dopant properties: ionic
radius and oxidation state. The values used for ionic radius [20] and oxidation state
of each dopant were the appropriate values for the most stable 0 K oxide of that
dopant. Ionic radius and oxidations state were chosen because previous research

15
has shown strong trends between these properties and relative stability of
structures [14].
3 Results and Discussion
Dopant Ionic Radius (Å)
Oxidation State
𝛥𝐸!!!! (eV)
𝛥𝐸!!!! (eV) 𝛥𝐸!!!! − 𝛥𝐸!!!
!" 𝛥𝐸!!!! − 𝛥𝐸!!!!"
Hf (pure) 0.71 +4 5.479 8.013 0.000 0.000
K 1.64 +1 5.378 7.453 -‐0.101 -‐0.560 Ca 1.34 +2 5.517 7.428 0.038 -‐0.585 Sc 0.75 +3 5.704 7.891 0.226 -‐0.122 Ti 0.61 +4 5.286 8.502 -‐0.192 0.490 V 0.58 +4 5.077 8.494 -‐0.401 0.481 Cr 0.55 +4 5.458 8.072 -‐0.021 0.059 Mn 0.53 +4 5.162 9.571 -‐0.317 1.559 Fe 0.65 +3 5.950 8.903 0.471 0.890 Co 0.53 +2 5.163 8.580 -‐0.316 0.567 Ni 0.69 +2 5.652 8.538 0.174 0.525 Cu 0.77 +2 5.482 7.921 0.003 -‐0.092 Zn 0.74 +2 5.366 7.820 -‐0.113 -‐0.193 Ga 0.62 +3 5.085 8.416 -‐0.394 0.403 Ge 0.53 +4 4.487 9.129 -‐0.991 1.116 Al 0.54 +3 4.967 8.706 -‐0.512 0.693 Si 0.40 +4 3.828 10.315 -‐1.651 2.302
a Reference [20] Table 2: A summary of dopant properties and calculated values.
After calculations were run for each dopant in each phase of HfO2, the
relative energies were calculated for each dopant as described in Section 2.3. The
relative energies and the dopant properties (ionic radius and oxidation state) are

16
reported in Table 2. The relative energies 𝛥𝐸!!!! and 𝛥𝐸!!!! were plotted against
the dopants in order to visualize trends moving across the periodic table. This plot is
shown in Figure 6. Other computational data is included when available for
comparison [11]. The strong agreement between the present study and existing
data suggests that the current calculations are accurate and reliable. The leftmost
data point in each series on this plot represents pure HfO2. Moving to the right, the
period 4 dopants are shown in order followed by Al and Si. Data points connected by
a solid line represent dopants adjacent to each other on the periodic table. In this
plot, if a data point falls below the horizontal dashed line for either the relative cubic
or tetragonal phase, then that dopant tends to stabilize that phase relative to the
monoclinic phase. It becomes clear from Figure 6 that dopants that tend to stabilize
either the cubic or tetragonal phase usually tend to destabilize the other phase.
It should be noted that none of the dopants changed the relative 0 K stability
of the phases. For each dopant, the most stable (lowest energy) phase was the
monoclinic phase, followed by the tetragonal phase, and finally the cubic phase. If a
dopant tended to stabilize either the cubic or tetragonal phase, then the energy of
that phase was lowered relative to the monoclinic phase without actually dropping
below the energy of the monoclinic phase. The dopant concentration in this study
was 3.125% with respect to Hf. It is expected that at higher dopant concentrations, a
higher degree of stabilization (or destabilization) would occur. For example, Si
stabilized the tetragonal phase more than any other dopant in this study. This result
was expected because Si strongly prefers a tetrahedral environment, which is
present in the tetragonal phase of HfO2. At some higher dopant concentration (say,

17
around 10-‐15%), Si may stabilize the tetragonal phase to the point where the
tetragonal phase is more stable than the monoclinic phase. I has been shown
experimentally that mixing HfO2 with 10% SiO2 can fully stabilize the tetragonal
phase [21].
Figure 6: A plot of 𝛥𝐸!!!! and 𝛥𝐸!!!! for each dopant studied. The horizontal dotted lines correspond to 𝛥𝐸!!!
!" and 𝛥𝐸!!!!" . Other theory data is from
Reference [11].
In the next series of plots, the second set of relative energies, 𝛥𝐸!!!! − 𝛥𝐸!!!
!"
and 𝛥𝐸!!!! − 𝛥𝐸!!!!" , were plotted against the properties of the dopants. The
objective of these plots was to visualize how certain properties affect the relative
stability of the phases, if at all. If clear trends emerge from these plots, they could be
used to predict the effect of other dopants in HfO2 based on their known properties.
The first property examined was ionic radius. Figure 7 shows a plot of
𝛥𝐸!!!! − 𝛥𝐸!!!!" and 𝛥𝐸!!!! − 𝛥𝐸!!!
!" against a relative measure of ionic radius,

18
defined as 𝑟! − 𝑟!" /𝑟!" , where 𝑟! is the ionic radius of a dopant and 𝑟!" = 0.71 Å
is the ionic radius of Hf. Note, by this metric the relative radius of Hf is zero. In
Figure 7, points to the left of the vertical dotted line represent dopants with a
smaller ionic radius than Hf and points to the right represent dopants with a larger
ionic radius. If a point has a negative relative energy value (below the horizontal
dotted line), then that phase tends to be stabilized, as explained in Section 2.3. There
is a very clear trend that dopants with a smaller ionic radius tend to stabilize the
tetragonal phase and destabilize the cubic phase. The smaller the ionic radius of the
dopant relative to Hf, the more the tetragonal phase is stabilized. It also appears that
dopants with larger ionic radii tend to stabilize the cubic phase. This trend is less
clear because this region of the plot is less populated. More dopants with larger
ionic radii than Hf should be examined in order to confirm this trend.
Figure 7: A plot of 𝛥𝐸!!!! − 𝛥𝐸!!!
!" and 𝛥𝐸!!!! − 𝛥𝐸!!!!" against the relative
ionic radius of each dopant compared to Hf. The horizontal and vertical dotted lines represent the values for pure HfO2 and intercept their respective axes at zero.

19
The trend that smaller dopants tend to stabilize the tetragonal phase and
larger dopants tend to stabilize the cubic phase was observed in another
computational study on dopants in HfO2 [11]. The present study confirms that trend
and provides stronger evidence for it. Our study also examines more dopants and
chooses them in a more systematic manner by moving across a period of the
periodic table, which gives more reliability to the trend. Some overlap of dopants
between the two studies occurred. For the dopants that were tested in both studies
(Sc, Ti, Ge, Al, Si), the same results were obtained with respect to the stabilization of
the tetragonal or cubic phases.
The second dopant property examined was oxidation state. Figure 8 shows a
plot of 𝛥𝐸!!!! − 𝛥𝐸!!!!" and 𝛥𝐸!!!! − 𝛥𝐸!!!
!" against oxidation state. Once again, data
points below the horizontal line represent a dopant that tends to stabilize the given
phase. Trends in this plot are not as clear as they were in the plot against ionic
radius, but some observations can be made. It is clear that dopants whose most
stable oxide has a +4 oxidation state, the same oxidation state as Hf, tend to stabilize
the tetragonal phase. All dopants tested with oxidation state +4 tended to stabilize
the tetragonal phase and destabilize the cubic phase. As the oxidation state moved
further from the oxidation state of Hf, the cubic phase tended to be stabilized.
However, this validity of this trend is questionable. A small number of dopants with
oxidation states of +1 or +2 were tested compared with dopants with oxidation
states of +3 or +4. Also, the only dopant tested with oxidation state +1 (K) tended to
stabilize both the cubic and tetragonal phase. This observation casts some doubt on
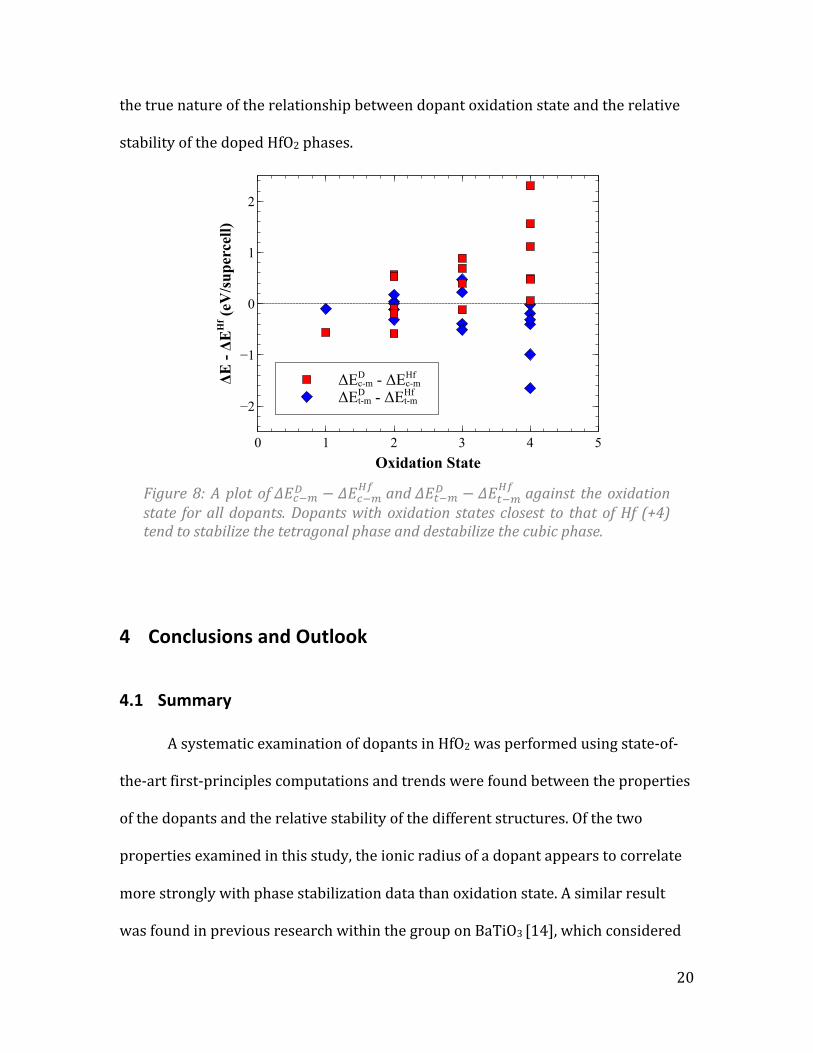
20
the true nature of the relationship between dopant oxidation state and the relative
stability of the doped HfO2 phases.
Figure 8: A plot of 𝛥𝐸!!!! − 𝛥𝐸!!!
!" and 𝛥𝐸!!!! − 𝛥𝐸!!!!" against the oxidation
state for all dopants. Dopants with oxidation states closest to that of Hf (+4) tend to stabilize the tetragonal phase and destabilize the cubic phase.
4 Conclusions and Outlook
4.1 Summary
A systematic examination of dopants in HfO2 was performed using state-‐of-‐
the-‐art first-‐principles computations and trends were found between the properties
of the dopants and the relative stability of the different structures. Of the two
properties examined in this study, the ionic radius of a dopant appears to correlate
more strongly with phase stabilization data than oxidation state. A similar result
was found in previous research within the group on BaTiO3 [14], which considered

21
the dopant formation energy. In that study it was found that ionic radius was the
most important property for determining the favored dopant site (Ba or Ti),
followed by oxidation state.
The method used in this study has the potential to be applied to other
material systems. Other systematic studies can be done following almost an
identical procedure to create data that can be used for materials selection and
design experiments. The relative energies defined in this study might be directly
applicable to future studies or might be able to be modified to meet the needs of a
particular study.
4.2 Future Directions
The work done in this study could be continued in several future directions.
The most straightforward future direction is to continue the exact same study to
examine more dopants. In particular, the elements across periods 5 and 6 of the
periodic table could be tested as dopants in order to verify the results found with
the period 4 elements in this study. More data is especially needed for elements with
larger ionic radii than Hf, as the majority of dopants considered in this study had
smaller ionic radii. Another future direction that should be taken to continue this
study is the examination of oxygen vacancies. Some dopants replacing a Hf ion in
HfO2 may be more stable (lower energy) when accompanied by a neighboring O
vacancy. This is especially likely to be the case for dopants with lower oxidation
states than Hf, several of which were studied in this work. For example, a dopant

22
with a +2 oxidation state replacing a Hf atom (+4 oxidation state) can be expected to
be accompanied by an O2-‐ vacancy to preserve charge neutrality. A well-‐known
example of this phenomenon occurs in yttria-‐doped zirconia. In this case, the when
two Y3+ replace two Zr4+ atoms in the zirconia lattice, an oxygen vacancy is formed.
Hafnia has a nearly identical structure to zirconia, so a similar result is expected. In
order to complete this study, oxygen vacancies must be considered.
A future direction that represents an extension rather than a continuation of
this work would be to look at the effect of higher dopant concentrations. The
dopant concentration in this study (3.125%) was too low to change the relative
stability of the 0 K phases of hafnia. That is, the monoclinic phase was most stable,
followed by the tetragonal phase and then the cubic phase for each dopant. It is
expected that at some higher dopant concentrations, certain dopants would be able
to change the most stable 0 K phase of hafnia. For example, Si is expected to stabilize
the tetragonal phase over the monoclinic phase at some dopant concentration,
probably in the range of 10-‐15%. A future study could be performed on Si-‐doped
hafnia to pinpoint exactly what the dopant concentration must be for the switch to
occur.
Another possible extension of this study would be to confirm other types of
properties observed in doped hafnia, as described in Section 1.3. For example, the
electronic band structures could be calculated in order to confirm whether Mn-‐
doped HfO2 is half-‐metallic [13] or Co-‐doped HfO2 is paramagnetic [12]. In addition
to confirming existing experimental and theoretical work, new properties might be
discovered for some dopants in hafnia.

23
4.3 Reflections
This Honors Thesis gave me the opportunity to experience academic
research in the very exciting field of computational materials science. I wanted to
work on a project more on the theoretical side of materials science, different from
the typical work we do within the curriculum, and I am very glad I ended up
working with Dr. Ramprasad and his research group. I was fortunate to work with a
group of smart and supportive people who helped me over the course of the year
when I had questions. It was a learning experience throughout the entire year, from
learning the basics of DFT and VASP in the fall semester to learning how to run
calculations and analyze the results in the spring. I was able to learn about and
actively participate in one of the most interesting fields of materials science, and I
am very thankful for that opportunity.
24
5 References 1. Muller, D.A., et al., The electronic structure at the atomic scale of ultrathin gate
oxides. Nature, 1999. 399(6738): p. 758-‐761. 2. Chau, R., et al., Integrated nanoelectronics for the future. Nat Mater, 2007.
6(11): p. 810-‐812. 3. Wilk, G.D., R.M. Wallace, and J.M. Anthony, High-‐kappa gate dielectrics:
Current status and materials properties considerations. Journal of Applied Physics, 2001. 89(10): p. 5243-‐5275.
4. Matovic, B., et al., Synthesis and characterization of nanometric yttrium-‐doped hafnia solid solutions. Journal of the European Ceramic Society, 2012. 32(9): p. 1971-‐1976.
5. Zhao, X. and D. Vanderbilt, First-‐principles Study of Electronic and Dielectric Properties of ZrO2 and HfO2. MRS Online Proceedings Library, 2002. 747: p. null-‐null.
6. Tang, C., First principles studies of point defects in HfO2 and Si-‐HfO2 interfaces. Doctoral Dissertations, 2009. Paper AAI3383932.
7. Debernardi, A., Ab initio study of phase transition and dielectric constants of high-‐kappa HfO2 as a function of Ge alloying. Physical Review B, 2012. 85(2): p. 6.
8. Losovyj, Y.B., et al., The electronic structure change with Gd doping of HfO2 on silicon. Applied Physics Letters, 2007. 91(13): p. 3.
9. Gao, L., et al., Stabilization of cubic structure in Mn-‐doped hafnia. Ceramics International, 2012. 38(3): p. 2305-‐2311.
10. Ortega, A., et al., Correlation between phase and optical properties of yttrium-‐doped hafnium oxide nanocrystalline thin films. Optical Materials, 2013. 35(9): p. 1728-‐1734.
11. Lee, C.K., et al., First-‐principles study on doping and phase stability of HfO2. Physical Review B, 2008. 78(1): p. 4.
12. Buha, J., et al., Solvothermal and surfactant-‐free synthesis of crystalline Nb2O5, Ta2O5, HfO2, and Co-‐doped HfO2 nanoparticles. Physical Chemistry Chemical Physics, 2010. 12(47): p. 15537-‐15543.
13. Maznichenko, I.V., et al., First-‐principles study of manganese-‐stabilized hafnia. Journal of Magnetism and Magnetic Materials, 2009. 321(7): p. 913-‐916.
14. Sharma, V., et al., Comprehensive examination of dopants and defects in BaTiO3 from first principles. Physical Review B, 2013. 87(13): p. 7.
15. Hohenberg, P. and W. Kohn, Inhomogeneous Electron Gas. Physical Review, 1964. 136(3B): p. B864-‐B871.
16. Kohn, W. and L.J. Sham, Self-‐Consistent Equations Including Exchange and Correlation Effects. Physical Review, 1965. 140(4A): p. A1133-‐A1138.
17. Zhao, X.Y. and D. Vanderbilt, First-‐principles study of structural, vibrational, and lattice dielectric properties of hafnium oxide. Physical Review B, 2002. 65(23): p. 4.
18. Wang, J., H.P. Li, and R. Stevens, HAFNIA AND HAFNIA-‐TOUGHENED CERAMICS. Journal of Materials Science, 1992. 27(20): p. 5397-‐5430.

25
19. Adam, J. and M.D. Rogers, The crystal structure of ZrO2 and HfO2. Acta Crystallographica, 1959. 12(11): p. 951.
20. Shannon, R.D., REVISED EFFECTIVE IONIC-‐RADII AND SYSTEMATIC STUDIES OF INTERATOMIC DISTANCES IN HALIDES AND CHALCOGENIDES. Acta Crystallographica Section A, 1976. 32(SEP1): p. 751-‐767.
21. Böscke, T.S., et al., Stabilization of higher-‐κ tetragonal HfO2 by SiO2 admixture enabling thermally stable metal-‐insulator-‐metal capacitors. Applied Physics Letters, 2007. 91(7): p. -‐.


