
{Page 1}
INTRODUCTION
Accounting serves the purpose of providing financial information relating a business. such information
is provided to people who have interest in the organization , such as shareholders, managers, creditors,
debenture holders, bankers, tax authorities and others, broadly speaking, on the basis of type of
accounting information and the purpose for which such information is used, accounting may be divided
into three categories:
1. Financial accounting (or General accounting),
2. Cost accounting, and
3. Management accounting
FINANCIAL ACCOUNTING:
Financial accounting is mainly concerned with recording business transaction in the books of account
for the purpose presenting financial accounts to management, share holders, creditors, investors and tax
authorities, etc.
It is defined as “The art of recording, classifying and summarizing in a significant manner and in terms
of money, transactions and events, which are in part at least, of a financial character and interpreting the
results thereof”.
The information supplied by financial accounting is summarized in the following two statements at the
end of the accounting period, generally one year.
Profit and loss account showing the net profit or loss during the period.
Balance Sheet showing the financial position of the firm at the point of time.
OBJECTIVE OF FINANCIAL ACCOUNTING:
Financial accounting is to present a true and fair view of company’s income and financial position at
regular intervals of one year mainly for use by parties who are external to business.
COST ACCOUNTING:
Cost accounting is a branch of accounting which specializes in providing information about the detailed
cost of products or services being supplied by the undertaking. Compared with financial accounting, cost
accounting is relatively a recent development. It has primarily developed to meet the needs of
management. Profit and loss Account of balance sheet are presented to management by the financial
accountant.
{Page 2}
The terms ‘costing’ and ‘cost accounting’ are often used interchangeably. The chartered institute of
Management Accountants (CIMA) of UK has defined costing as, “the techniques and process of
ascertaining costs”. Thus, costing simply means cost finding by any process or technique. It consists of
principles and rules which are used for determining:
(a) The cost of manufacturing a product; e.g., motor car, furniture, chemical steel, paper etc.
(b) The cost of providing a services; e.g., electricity, transport, education, etc.
Cost accounting information is mainly for internal use i.e. management. It is not to be provided to
external parties such as shareholder, creditors, potential investors, etc. neither do they have any claim on
this information, excepting government, to whom cost information may have to be submitted.
MANAGEMENT ACCOUNTING:
Meaning and Definitions
The terms ‘management accounting’ is the modern concept of accounts as a tool of management.
It is a board term and is concerned with all such accounting information that is useful to management. In
simple words, the term management accounting is applied to the provision of accounting information for
management activities such as planning, controlling and decision making, etc.
According to the Institute of Chartered Accountants of England, “any form of accounting which
enables a business to be conducted more efficiently” may be regarded as management accounting”.
Relationship of Management Accounting to Cost Accounting and Financial Accounting:
The three types of accounting, i.e., financial accounting, cost accounting and management accounting
are closely linked. The management accounting uses the principles and practices not only of cost
accounting but also of financial accounting. Information provided by financial accounting proves
extremely useful for management accounting. For example, profit and loss account and balance sheet
become the basis of ratio analysis and comparative financial statements, etc, which are used by the
management accounting as important tools of planning and control.

{Page 3}
Financial accounting records also become basis of preparing detailed cost computation and reports. Cost
accounting is a more detailed application of financial accounting and provides detailed cost information
about products, services, departments, etc. This information is used by management accounting for
planning, controlling and decision making purposes.
Fig. 1.1 shows the evolution of management accounting and its relationship to cost accounting and
financial accounting.
Fig.1.1. Relationship of financial, cost and management accounting.
PREPARING
PROFIT & LOSS
ACCOUNT AND
BALANCE SHEET
FINANCIAL
ACCOUNTING
ANALYSING
COST FOR
CONTROL AND
MAXIMISING
EFFICIENCY
COST
ACCOUNTING
ASSISTING
MANAGEMENT
FOR PLANNING,
DECISION
MAKING AND
CONTROL
MANAGEMENT
ACCOUNTING
{Page 4}
MANAGEMENT ACCOUNTANT – THE CONTROLLER
Management accountant plays a very important role in an organization. He analyses and interprets
accounting information and meets the informational needs of management at different levels. In an
organization, a management accountant generally performs a staff function i.e. advisory role. But if he is
permitted to participate in planning and decision making, he is a part of the management team and thus
becomes a part of the line function. It is very important that status of the management accountant in the
organization is clearly defined so that the scope of his work and responsibilities are accordingly
determined.
ORIGIN
The first basic principles of management accounting emerged during the period 1400 to 1600 in the
form of standards for materials, employee productivity, job cost system and budgets. But no
standardized management accounting was in practice until 1885 when Henry Metcalf published the
‘cost manufacture’. The real growth of management accounting was in 20 th century in USA due to the
emergence of large and integrated companies such as DuPont and general motors.
In fact the growth of management accounting is because of the need to overcome the limitations of
financial and cost accounting.
LIMITATIONS OF FINANCIAL ACCOUNTING:
Financial accounting is extremely useful to different categories of users. But it also suffers from the
following limitations.
1. Shows only overall performance. Financial accounting provides information about profit, loss,
cost etc., of the collective activities of the business as a whole. It does not give data regarding
costs by departments, products, processes and sales territories, etc.
2. Historical in nature. Financial accounting is historical, since the data are summarized only at
the end of the accounting period. There is no system of computing day to day cost and also
computing pre- determined costs.
{Page 5}
3. No performance appraisal. In financial accounting, there is no system of developing norms and
standards to appraise the efficiency in the use of materials, labour and other costs by comparing
the actual performance with what should have been accomplished during a given period of time.
4. No material control system. Generally, there is no proper system of control of materials losses
which may arise in the form of obsolescence, deterioration, excessive scrap and
misappropriation, etc.
5. No labour cost control. In financial accounting, there is no system of recording loss of labour
time; i.e., idle time. Labour cost is not recorded by jobs, processes or departments and as such no
system of incentives may be easily used to compensate workers for their above – standard
performance.
CHARACTERISTICS OR NATURE OF MANAGEMENT ACCOUNTING:
It is clear from the above definitions that management accounting is concerned with accounting data that
is useful in decision making. The main characteristics of management accounting are as follows:
1. Useful in decision making. The essential aim of management accounting is to assist
management in decision making and control. It is concerned with all such information which can
prove useful to management in decision making.
2. Financial and cost accounting information. Basic accounting information useful for
management accountings derived from cost accounting records.
3. Internal use. Information provided by management accounting is exclusively for use by
management for internal use. Such information is not to be given to parties external to the
business like shareholders, creditors, banks etc.
4. Purely optional. Management accounting is a purely voluntary technique and there is no
statutory obligation. Its adoption by any firm depends upon its utility and desirability.
5. Concerned with future. As management accounting is concerned with decision making, it is
related with future because decision is taken for future course of action and not the past.

{Page 6}
CHARACTERISTICS OR NATURE OF MANAGEMENT ACCOUNTING:
It is clear from the above definitions that management accounting is accounting is concerned with
accounting data that is useful in decision making. The main characteristics of management accounting as
follows:
* Useful in decision making. The essential aim of management accounting is to assist
management in decision making and control. It is concerned with all such information which can
prove useful to management in decision making.
* Financial and cost accounting information. Basic accounting information useful for
management accountings derived from financial and cost accounting records.
* Internal use. Information provided by management accounting is exclusively for use by
management for internal use. Such information is not to be given to parties external to the
business like shareholders, creditors, banks, etc.
* Purely optional. Management accounting is a purely voluntary technique and there is no
statutory obligation. Its adoption by any firm depends upon its utility and desirability.
* Concerned with future. As management accounting is concerned with decision making, it is
related with future because decisions are taken for future course of action and not the past.
SCOPE OF MANAGEMENT ACCOUNTING:
Management accounting has a very wide scope. It includes not only financial accounting and cost
accounting but all type of internal control, internal audit, tax accounting, office services, cost control and
other methods and control procedures. Thus scope of management accounting inter alia includes the
following:
1. FINANCIAL ACCOUNTING.
Financial accounting provides basic historical data which helps management to forecast and plan
its financial activities for the future period. Thus for an effective and successful management
accounting, there should be a proper and well designed financial accounting system.
{Page 7}
2. COST ACCOUNTING:
Many of the techniques of profit planning and decision-making like marginal costing, CVP
analysis and differential cost analysis are used by the management accounting.
3. BUDGETING AND FORECASTING:
In order to plan business activities for the future, forecasting and budgeting play a very
significant role. Forecasting helps in the preparation of budgets and budgeting helps management
accountant in exercising budgetary control.
4. TAX PLANNING:
In order to take advantage of various provisions of tax laws, management accountant has to
depend upon tax accounting and planning to minimize its tax liabilities and save more funds for
the business.
5. REPORTING TO MANAGEMENT:
For effective and timely decision, there should be a system of prompt and intelligent reporting
into management both routine and special reports are prepared for submission to top
management, middle order management and operating level management depending and their
requirements.
TOOLS AND TECHNIQUES USED IN MANAGEMENT ACCOUNTING
Management accounting uses a number of tools and techniques to help management in achieving
business goals. Some of the important tools and techniques are as follows:
1. Budgeting
2. Standard costing and variance analysis.
3. Marginal costing and costing volume profit analysis.
4. Ratio analysis.
5. Comparative financial statements
6. Differential cost analysis.

{Page 8}
FINANCIAL ACCOUNTING AND MANAGEMENT ACCOUNTING-COMPARISON
Financial accounting and management accounting are two major sub – systems of accounting
information system. Both are concerned with revenues and expenses, assets and liabilities and cash
flows. Both therefore involve financial statements. But the major differences between the two arise
because they serve different audiences. The main points of difference the two are as follows:
Basis Financial Accounting Management Accounting
1. External &
internal users
Financial accounting information is
mainly intended for external users
like investors, shareholders,
creditors, govt. authorities, etc,:
Management accounting
information meant for internal
users, i.e., management.
2. Accounting
method
It is based on double entry system
for recording business transactions.
It is not based on double entry
system.
3. Statement
requirements
Under company law and tax laws,
financial accounting is obligatory to
satisfy various statutory provisions.
Management accounting
provides detailed information
about individual products,
plants, departments or any other
responsibility centre.
4. Analysis of cost
& profit
Financial accounting shows the
profit/loss of the business as a
whole. It does not show the cost &
profit for individual products,
processes or departments are.
Management accounting
provides detailed information
about individual products,
plants, departments or any other
responsibility centre.
5. Past and future
data.
It is concerned with recording
transitions which have already taken
place, i.e., it represents past or
historical records.
It is future oriented and
concentrates on what is likely to
happen in future though it may
use past data for future
projections.

{Page 9}
COST ACCOUNTING AND MANAGENT ACCOUNTING:
An examination of the meaning and definitions of cost accounting and management accounting indicates
that the distinction between the two is quit vague. Some writers even consider these two areas as
synonymous while others distinguish between the two. horngren, a renowned author on the subject, has
gone to the extent of saying, “modern cost accounting is often called management accounting. Why?
Because cost accountings look at their organization through manager’s eyes”. Thus managerial aspects
of cost accounting are inseparable from management accounting. One point on which all agree is that
these two types of accounting do not have clear cut territorial boundaries. However, distinction between
cost accounting and management accounting may be made on the following point:
BASIS COST ACCOUNTING MANAGEMENT ACCOUNTING
1. Scope Scope of cost accounting is limited
to providing cost information for
managerial uses.
Scope of management accounting is
broader than that of cost accounting
as it provides all types of
information, i.e...Cost accounting
information for managerial uses.
2. Emphasis Main emphasis is on cost
ascertainment and cost control to
ensure maximum profit.
Main emphasis is on planning
controlling and decision-making to
maximize profit.
3. Technique
employed
Various technique used by cost
accounting include standard
costing and variance analysis,
marginal costing and cost volume
profit analysis, budgetary control,
uniform costing and inter-firm
comparison, etc.
Management accounting also uses
all these techniques used in cost
accounting but in addition it also
uses techniques like ratio analysis,
funds flow statement, statistical
analysis, operations research and
certain techniques from various
branches of knowledge like
mathematics, economics, etc.,
which so ever can help
management in its tasks.

{Page 10}
LIMITATION ON MANAGEMENT ACCOUNTING
Management accounting is very useful tool of management. However, it suffers from certain limitations
as stated below:
1) Based on historical data:
Management accounting helps management in making decisions for the future but it is mainly
based on the historical data supplied by financial accounting and cost accounting. This implies
that historical data is used for making future decisions. The accuracy and dependability of such
data will leave their mark on the quality of managerial decisions.
2) Lack of wide knowledge:
The management accountant should have knowledge of not only financial and cost accounting
but also many allied subjects like economics, management, taxation, statistical and mathematical
techniques etc. lack of knowledge of these subjects on the part of management accountant limits
the quality of management accounting.
3) Complicated approach:
Management accounting provides mass of data using various accounting and non-accounting
subjects for decision making purpose. But sometimes management avoided this complicated and
lengthy course of decision making and makes decisions based on intuition. This leads to
unscientific approach to decision making.
4) Not a substitute of management:
Management accounting only provides information to management for decision making but it is
not a substitute of management and administration.
5) Costly system:
The installation of management accounting system in an organization is costly affair as it
requires a wide net-work of management information system, rules and regulations. All this
requires heavy investment and small concerns may not be able to afford it.
{Page 11}
RATIO ANALYSIS
MEANING OF FINANCIAL STATEMENT:
The term financial statements refer to two basic statements which an accounting prepares at the end of
an accounting period for a business enterprise. These are:
1. Balance sheet (or Income statement of financial position ) which reflects the assets, Liabilities
and capital as on a certain date, and
2. Profit and Loss Account (or Income Statement) which shows the results of operations i.e. profit
or loss during a certain period.
RATIO ANALYSIS:
Ratio analysis is the process of determining and interpreting numerical relationship based on financial
statements. It is the technique of interpretation of financial statements with the help of accounting ratios
derived from the balance sheet and profit and loss account.
Ratio analysis is a very important tool of financial analysis. It is the process of establishing the
significant relationship between the items of financial statement to provide a meaningful understanding
of the performance and financial position of a firm. Ratio when calculated on the Basis of accounting
information are called ‘Accounting Ratio’.
DEFINITIONS:
Kennedy and Mc Mullah. “The relationship of one to another, expressed in simple term of
mathematical is known as ratio”
According to Accountant’s Handbook by Wixom, kell and Bedford, a ratio “is an expression of the
quantitative relationship between two numbers”.
{Page 12}
Ratio analysis is very powerful and most commonly used tool of analysis and interpretation of financial
statements. It concentrates on the inter-relation among the figures appearing in the financial statements.
Ratio analysis helps to analyze the part performance of a company and to make future projections. It
allows various interested parties like management, shareholders, potential investors, creditors,
government and other analysts to make an evaluation of the various aspects of company’s performance
from their own point of view and interest. For example, management and shareholders may be interested
in the company’s profitability while creditors and debenture holders may be interested in solvency of the
company.
BASIS OF COMPARISON:
Trend Analysis involves comparison of a firm over a period of time, that is, present ratios are compared
with past ratios for the same firm. It indicates the direction of change in the performance –
improvement, deterioration or constancy – over the years.
Inter-firm Comparison involves comparing the ratios of a firm with those of others in the same lines of
business or for the industry as a whole. It reflects the firm’s performance in relation to its competitors.
WAYS TO INTERPRET ACCOUNTING RATIOS:
Single absolute ratio.
Group ratio.
Historical comparison.
Inter-firm comparison.
Projected ratios.
CLASSIFICATION OF RATIOS:
Analysis of Short Term Financial Position or Test of Liquidity.
Analysis of Long Term Financial Position or Test of Solvency.
Activity Ratios.
Profitability Ratios.
{Page 13}
TEST OF LIQUIDITY:
The liquidity ratios are used to test the short term solvency or liquidity position of the business.
It enables to know whether short term liabilities can be paid out of short term assets.
It indicates whether a firm has adequate working capital to carry out routine business activity.
It is a valuable aid to management in checking the efficiency with which working capital is being
employed.
It is also of importance to shareholders and long term creditors in determining to some extent the
prospects of dividend and interest payment.
IMPORTANT RATIOS IN TEST OF LIQUIDITY:
1. Current ratio.
2. Quick ratio.
3. Absolute liquid ratio.
CURRENT RATIO
It is the most widely used of all analytical devices based on the balance sheet. It establishes relationship
between total current assets and current liabilities.
Current assets
Current ratio =
Current liabilities
IDEAL RATIO: 2:1
High ratio indicates under trading and over capitalization.
Low ratio indicates over trading and under capitalization.
ABSOLUTE LIQUIDITY RATIO
This ratio establishes a relationship between absolute liquid assets to quick liabilities.
Absolute liquid assets
Absolute liquid ratio=
Quick liabilities

{Page 14}
IDEAL RATIO: 1:2
It means that if the ratio is 1:2 or more than this the concern can be taken as liquid. If the ratio is less
than the standard of 1:2, it means the concern is not liquid.
Notes: - {Quick assets = Current asset-(inventories + prepaid expenses)
Quick Liabilities = Current liabilities – Bank overdraft
Absolute liquid assets include cash in hand, cash at bank, marketable securities, Temporary
investments.}
II. TEST OF SOLVENCY
Solvency indicates that position of an enterprise where it is capable of meeting long term
obligations.
When an organization's assets are more than its liabilities is known as solvent organization.
Long term solvency ratios denote the ability of the organization to repay the loan and interest.
IMPORTANT RATIOS IN TEST OF SOLVENCY:
Debt-equity ratio.
Proprietary ratio.
Solvency ratio.
Fixed assets to net worth ratio.
Current assets to net worth ratio.
Current liabilities to net worth ratio.
Capital gearing ratio.
Fixed assets ratio
Debt servicing ratio.
Dividend coverage ratio.
{Page 15}
DEBT EQUITY RATIO:
It is calculated to measure the relative claims of outsiders and the owners against the firm’s assets. This
ratio indicates the relationship between the outsider’s funds and the shareholders’ funds.
Outsider’s funds Debt equity ratio=
Shareholders’ funds
IDEAL RATIO: 2:1;
It means for every 2 shares there is 1 debt. If the debt is less than 2 times the equity, it means the
creditors are relatively less and the financial structure is sound. If the debt is more than 2 times the
equity, the state of long term creditors are more and indicate weak financial structure.
Notes: - {Components of Debt Equity Ratio Outsider’s funds include all debts/liabilities to outsiders,
whether long term or short term or whether in the form of debentures, bonds, mortgages or bills.
Shareholders’ funds consists of equity share capital, preference share capital, capital
reserves, revenue reserves and reserves representing accumulated profits and surpluses like
reserve for contingencies sinking funds. The accumulated losses and deferred expenses, if any
should be deducted from the total to find out shareholders’ funds, it is called net worth and the
ratio may be termed as debt to net worth ratio. }
PROPRIETARY RATIO OR NET WORTH RATIO:
It establishes relationship between the proprietors fund or shareholders funds and the total assets
Proprietary funds Capital employed
Proprietary ratio = or
Total assets Total liabilities
{Page 16}
IDEAL RATIO: 0.5:1
Higher the ratio betters the long term solvency (financial) position of the company. This ratio indicates
the extent to which the assets of the company can be lost without affecting the interest of the creditors of
the company
Notes:-
{Components of Proprietary Ratio: Shareholders’ funds or Proprietary funds are equity share
capital, preference share capital, undistributed profits, reserves and surpluses. Out of this amount
accumulated losses should be deducted. Total assets on other hand denote total resources of the
concern.}
SOLVENCY RATIO:
It expresses the relationship between total assets and total liabilities of a business. This ratio is a small
variant of equity ratio and can be simply calculated as 100-equity ratio
Total assets
Solvency ratio=
Total liabilities
No standard ratio is fixed in this regard. It may be compared with similar, such organizations to evaluate
the solvency position. Higher the solvency ratio, the stronger is its financial position and vice-versa.
FIXED ASSETS TO NET WORTH:
It is obtained by dividing the depreciated book value of fixed assets by the amount of proprietor’s funds.
Net fixed assets
Fixed assets to net worth ratio=
Net worth
{Page 17}
IDEAL RATIO: 0.75:1
A higher ratio, say, 100% means that there are no outside liabilities and all the funds employed are those
of shareholders. In such a case the return to shareholders would be lower rate of dividend and this is also
a sign of over capitalization.
This ratio shows the extent to which ownership funds are sunk into assets with relatively low turnover.
When the amount of proprietor's funds exceed the value of fixed assets, a part of the net working capital
is provided by the shareholders, provided there are no other non-current assets, and when proprietor’s
funds are less than the fixed assets, creditors obligation have been used to finance a part of fixed assets.
The Yardstick for this measure is 65% for industrial undertakings.
CURRENT ASSETS TO NET WORTH RATIO:
It is obtained by dividing the value of current assets by the amount of proprietor’s funds. The purpose of
this ratio is to show the percentage of proprietor’s fund investment in current assets.
Current assets
Current assets to net worth ratio=
Proprietor’s fund
A higher proportion of current assets to proprietor’s fund, as compared with the proportion of fixed
assets to proprietor’s funds are advocated, as it is an indicator of the financial strength of the business,
depending on the nature of the business there may be different ratios for different firms. This ratio must
be read along with the results of fixed assets to proprietor’s funds ratio.
CURRENT LIABILITIES TO NET WORTH:
It is expressed as a proportion and is obtained by dividing current liabilities by proprietor's fund.
Current liabilities
Current liabilities to net worth ratio = Net worth
{Page 18}
IDEAL RATIO: 1:3
This ratio indicates the relative contribution of short term creditors and owners to the capital of an
enterprise. If the ratio is high, it means it is difficult to obtain long term funds by the business.
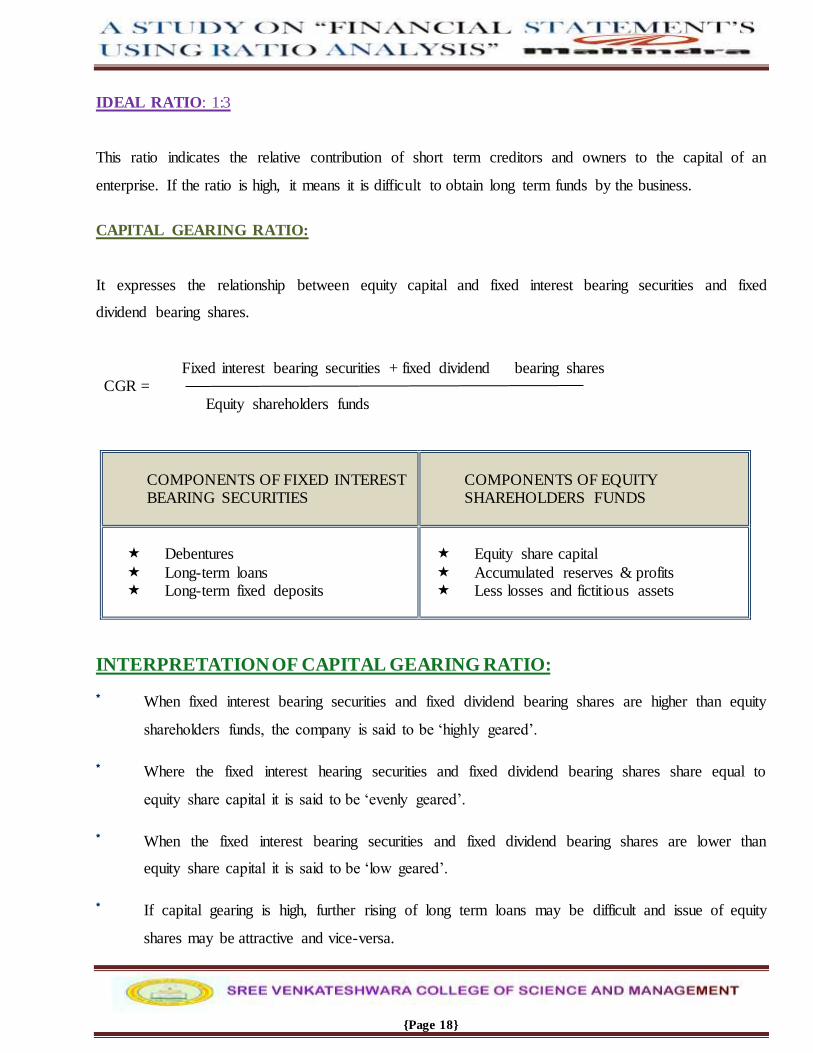
CAPITAL GEARING RATIO:
It expresses the relationship between equity capital and fixed interest bearing securities and fixed
dividend bearing shares.
Fixed interest bearing securities + fixed dividend bearing shares CGR =
Equity shareholders funds
COMPONENTS OF FIXED INTEREST BEARING SECURITIES
COMPONENTS OF EQUITY SHAREHOLDERS FUNDS
Debentures
Long-term loans Long-term fixed deposits
Equity share capital
Accumulated reserves & profits Less losses and fictitious assets
INTERPRETATION OF CAPITAL GEARING RATIO:
* When fixed interest bearing securities and fixed dividend bearing shares are higher than equity
shareholders funds, the company is said to be ‘highly geared’.
* Where the fixed interest hearing securities and fixed dividend bearing shares share equal to
equity share capital it is said to be ‘evenly geared’.
* When the fixed interest bearing securities and fixed dividend bearing shares are lower than
equity share capital it is said to be ‘low geared’.
* If capital gearing is high, further rising of long term loans may be difficult and issue of equity
shares may be attractive and vice-versa.
{Page 19}
FIXED ASSETS RATIO:
It establishes the relationship between fixed assets and capital employed
Fixed assets
Fixed assets ratio=
Capital employed
IDEAL RATIO: 0.67:1
This ratio enables to know how fixed assets are financed i.e. by use of short term funds or by long term
funds. This ratio should not be more than 1.
FIXED CHARGES COVER OR DEBT SERVICE RATIO:
This ratio is determined by dividing net profit by fixed interest charges.
Net profit before deduction of interest and income tax
Debt service ratio =
Fixed interest charges
IDEAL RATIO: 6 OR 7 TIMES;
If the ratio is high it means there is higher margin of safety for the long term lenders and as such it is not
difficult for the business to obtain further long term funds and vice-versa.
This ratio indicates the financial ability of the enterprise to meet interest payment out of current earnings
DIVIDEND COVER RATIO:
It is the ratio between disposable profit and dividend. Disposable profit refers to profit left over after
paying interest on long term borrowing and income tax.
Net profit after interest and tax
Dividend cover ratio= Dividend declared
{Page 20}
This ratio indicates the ability of the business to maintain the dividend on shares in future. If this ratio is
higher is indicates that there is sufficient amount of retained profit. Even if there is slight decrease in
profit in the future it will not affect payment of dividend in future.
III. ACTIVITY RATIO:
Activity ratios indicate the performance of an organization.
This indicates the effective utilization of the various assets of the organization.
Most of the ratio falling under this category is based on turnover and hence these ratios are called
as turnover ratios.
IMPORTANT RATIOS IN ACTIVITY RATIO:
Stock turnover ratio.
Debtor’s turnover ratio.
Creditor’s turnover ratio.
Wording capital turnover ratio.
Fixed assets turnover ratio.
Current assets turnover ratio.
Total assets turnover ratio.
Sales to net worth ratio.
STOCK TURNOVER RATIO:
This ratio establishes the relationship between the cost of goods sold during a given period and the
average sock holding during that period. It tells us as to how many times stock has turned over (sold)
during the period. Indicates operational and marketing efficiency. Helps in evaluating inventory policy
to avoid over stocking.
{Page 21}
Cost of goods sold
Inventory turnover ratio =
Average stock
Cost of goods sold = sales - gross profit
= opening stock + purchases – closing stock
Opening stock + Closing stock
Average stock =
2
INTERPRETATION OF STOCK TURNOVER RATIO:
IDEAL RATIO: 8 times; a low inventory turnover may reflect dull business, over investment in
inventory, accumulation of stock and excessive quantities of certain inventory items in relation to
immediate requirements.
A high ratio may not be accompanied by a relatively high net income as; profits may be sacrificed in
obtaining a large sales volume (unless accompanied by a larger total gross profit). It may indicate under
investment in inventories. But generally, a high stock turnover ratio means that the concern is efficient
and hence it sells its goods quickly.
DEBTOR TURNOVER RATIO:
This ratio explains the relationship of net credit sales of a firm to its book debts indicating the rate at
which cash is generated by turnover of receivables or debtors.
The purpose of this ratio is to measure the liquidity of the receivables or to find out the period over
which receivables remain uncollected.
Net credit sales
Debtor turnover ratio =
Average Debtors
{Page 22}
Opening balance + closing balance
Average debtors =
2
Debtors include bills receivables along with book debts
Notes: - {when information about opening and closing balances of trade debtors is not
Available then the debtor turnover ratio can be calculated by dividing the total
Sales by the balances of debtors. Debtor turnover ratio = total sales/debtors}
AVERAGE COLLECTION PERIOD:
The average collection period represents the average number of days for which a firm has to wait before
its receivables are converted into cash
Number of working day in year
Average collection period =
Debtor turnover ratio
INTERPRETATION OF DEBTOR TURNOVER RATIO:
Ideal ratio: 10 to 12 times; debt collection period of 30 to 36 days is considered ideal.
A high debtor turnover ratio or low collection period is indicative of sound management policy.
The amount of trade debtors at the end of period should not exceed a reasonable proportion of
net sales. Larger the trade debtors greater the expenses of collection.
CREDITORS TURNOVER RATIO:
This ratio indicates the number of times the creditors are paid in a year. It is useful for creditors in
finding out how much time the firm is likely to take in repaying its trade creditors.
Net credit purchases
Creditors turnover ratio =
Average creditors

{Page 23}
Opening balance + closing balance
Average creditors =
2
Number of working days
Average payment period = Creditor’s turnover ratio
Notes: - {if information about credit purchases is not available, total purchases may be
Taken, if opening and closing balances of creditors are not given the balances of
Creditors may be taken. Trade creditors include sundry creditors and bills
Payable.}
INTERPRETATION OF CREDITOR TURNOVER RATIO:
Ideal ratio: 12 times; debt payment period of 30 days is considered ideal.
Very less creditor’s turnover ratio or a high debt payment period may indicate the firm’s inability
in meeting its obligation in time.
WORKING CAPITAL TURNOVER RATIO:
This ratio indicates the number of times the working capital is turned over in the course of the year.
Measures efficiency in the working capital usage. It establishes relationship between cost of sales and
working capital.
Cost of sales
Working capital turnover ratio = Average working capital
Opening + closing working capital
Average working capital = 2
If cost of sales is not given, then sales can be used. If opening working capital is not disclosed then
working capital at the yearend will be used.
Working capital turnover ratio= cost of sales (sales)/net working capital.
{Page 24}
INTERPRETATION OF WORKING CAPITAL TURNOVER RATIO:
* A higher ratio indicates efficient utilization of working capital and a low ratio indicates
inefficient utilization of working capital.
* But a very high ratio is not a good situation for any firm and hence care must be taken while
interpreting the ratio.
FIXED ASSETS TURNOVER RATIO:
This ratio establishes a relationship between fixed assets and sales.
Net sales Fixed assets turnover ratio =
Fixed assets
Ideal ratio: 5 times
A high ratio indicates better utilization of fixed assets.
A low ratio indicates under utilization of fixed assets.
TOTAL ASSET TURNOVER RATIO:
This ratio establishes a relationship between total assets and sales. This ratio enables to know the
efficient utilization of total assets of a business.
Net sales
Total assets turnover ratio = Total assets
Ideal ratio: 2 times
High ratio indicates efficient utilization and ratio less than 2 indicates under utilization.
IV. PROFITABILITY RATIO: Profitability ratios indicate the profit earning capacity of a business.
Profitability ratios are calculated either in relation to sales or in relation to investments.
Profitability ratios can be classified into two categories.
{Page 25}
a) General Profitability Ratios.
b) Overall Profitability Ratios.
GENERAL PROFITABILITY RATIOS:
Gross profit ratio.
Net profit ratio.
Operating ratio.
Operating profit ratio.
Expense ratio.
GROSS PROFIT RATIO:
It expresses the relationship of gross profit to net sales and is expressed in terms of percentage. This
ratio is a tool that indicates the degree to which selling price of goods per unit may decline without
resulting in losses.
Gross profit
Gross profit ratio = X 100
Net sales
A low gross profit ratio may indicate unfavorable purchasing; the instability of management to develop
sales volume thereby making it impossible to buy goods in large volume. Higher the gross profit ratio
betters the results.
NET PROFIT RATIO:
It expresses the relationship between net profits after taxes to sales. Measure of overall profitability
useful to proprietors, as it gives an idea of the efficiency as well as profitability of the business to a
limited extent.
Net profit after taxes
Net profit ratio = X 100
Net sales
Higher the ratio better is the profitability

{Page 26}
OPERATING RATIO:
This ratio establishes a relationship between cost of goods sold plus other operating expenses and net
sales. This ratio is calculated mainly to ascertain the operational efficiency of the management in their
business operations.
Cost of goods sold + operating expenses
Operating ratio =
Net sales
Higher the ratio the less favorable it is because it would leave a smaller margin to meet interest,
dividend and other corporate needs. For a manufacturing concern it is expected to touch a percentage of
75% to 85%. This ratio is partial index of overall profitability.
OPERATING PROFIT RATIO:
This ratio establishes the relationship between operation profit and net sales.
Operating profit
Operating profit ratio= X 100
Net sales
Operating profit ratio = 100 - operating ratio
Operating profit = Net sales – (cost of goods sold + Administrative and office expenses + selling and
distributive expenses.
EXPENSES RATIO:-
It establishes relationship between individual operation expenses and net sales revenue.
Cost of goods sold
1. Cost of goods sold ratio = X 100
Net sales

{Page 27}
Office and admin exp
2. Admin. And office exp ratio= X100
Net sales
Selling and dist. exp
3. Selling and distribution ratio= X 100
Net sales
Non operating expense
4. Non-operating expense ratio= X 100
Net sales
TEST OF OVERALL PROFITABILITY:
Return on shareholders’ investment or Net worth ratio.
Return on equity capital.
Return on capital employed.
Return on total resources.
Dividend yield ratio.
Preference dividend cover ratio.
Equity dividend cover ratio.
Price covering ratio.
Dividend payout ratio.
Earnings per share.
RETURN ON SHAREHOLDERS’ INVESTMENT:
Shareholders’ investment also called return on proprietor’s funds is the ratio of net profit to proprietor’s
funds. It is calculated by the prospective investor in the business to find out whether the investment
would be worth-making in terms of return as compared to the risk involved in the business.
Net profit (After tax and interest)
Return on shareholders’ investment= Proprietor’s funds
{Page 28}
RETURN ON SHAREHOLDERS’ INVESTMENT:
This ratio is of great importance to the present and prospective shareholders as well as the management
of the company. As this ratio reveals how well the resources of a firm are being used, higher the ratio,
better are the results. The return on shareholders’ investment should be compared with the return of
other similar firms in the same industry. The inter- firm comparison of this ratio determines whether
their investments in the firm are attractive or not as the investors would like to invest only where their
return is higher. Similarly, trend ratios can also be calculated for a number of years to get5 and idea of
the prosperity, growth of deterioration in the company’s profitability and efficiency.
RETURN ON EQUITY CAPITAL:
This ratio establishes the relationship between net profit available to equity shareholders and the amount
of capital invested by them. It is used to compare the performance of company's equity capital with
those of other companies, and thus help the investor in choosing a company with higher return on equity
capital.
Net profit – preference dividend
Return on equity capital =
Equity share capital (paid up)
RETURN ON CAPITAL EMPLOYED:
This ratio is the most appropriate indicator of the earning power of the capital employed in the business.
It also acts as a pointer to the management showing the progress or deterioration in the earning capacity
and efficiency of the business.
Net profit before taxes and interest on long – term loans and
debentures
Return on capital employed=
Capital employed

{Page 29}
IDEAL RATIO: 15%
If the actual ratio is equal ratio is equal to or above 15% it indicates higher productivity of the capital
employed and vice versa
Proprietors net capital employed = fixed assets + current assets – outside liabilities (both long and short
term)
SIGNIFICANCE OF THE RATIO:
* It is a prime test of the efficiency of business. It measures not only the overall efficiency of
business but also helps in evaluating the performance of various departments.
* The owners are interested in knowing the profitability of the business in relation to amounts
invested in it. A higher percentage of return on capital employed will satisfy the owners that their
money is profitably utilized.
RETURN OF TOTAL RESOURCES:
This ratio acts as a yardstick to assess the efficiency of the efficiency of the operations of the business as
it indicates the extent to which assets employed in the business are utilized to results in net profit.
Net profit
Return on total recourses = X 100
Total assets
DIVIDEND YIELD RATIO:
It refers to the percentage or ratio of dividend paid per share to the market price per share. This ratio
throws light on the effective rate of return on investment, which potential investors may hope to earn.
Dividend paid per equity share
Dividend yield ratio =
Market price per equity share
{Page 30}
PREFERENCE DIVIDEND COVERS:
It indicates how many times the preference dividend is covered by profits after tax. This ratio measures
the margin o safety for preference shareholders. Such investors normally expect their dividend to be
covered about 3 times by profits available for dividend purpose.
Profit after tax
Preference dividend cover =
Annual program me dividend
EQUITY DIVIDEND COVERS:
This ratio indicates the number of times the dividend is covered by the amount of profit available for
equity shareholders.
Net profit after tax - prefer dividend
Equity dividend cover =
Dividend paid on equity capital
Earning per equity share
=
Dividend per equity share
Ideal ratio: 2 times; i.e. for every Rs. 100 profits available for dividend, Rs. 50 is retained in
The business and Rs. 50 is distributed. Higher the ratio higher is extent
Of retained earnings and higher is the degree of certainty that dividend
Will be repeated in future.
PRICE EARNINGS RATIO:
It shows how many times the annual earnings the present shareholders are willing to pay to get a share.
This ratio helps investors to know the effect of earnings per share on the market price of the share. This
ratio when calculated for several years can be used as term analysis for predicting future price earnings
ratios and therefore, future stock prices.
{Page 31}
Average market price per share
Price earnings ratio =
Earnings per share
DIVIDEND PAYOUT RATIO:
This ratio indicates the proportion of earnings available which equity share holders actually receive in
the form of dividend.
Dividend paid per share
Payout ratio =
Earnings per share
An investor primarily interested should invest in equity share of a company with high payout ratio. A
company having low payout ratio need not necessarily be a bad company. A company having income
may like to finance expansion out of the income, thus low payout ratio. Investor interested in stock price
appreciation may well invest in such a company though the payout ratio is low.
EARNINGS PER SHARE:
This ratio indicates the earning per equity share. It establishes the relationship between net profit
available for equity shareholders and the number of equity shares.
Net profit available for equity share holders
Earnings per share =
Number of equity shares

{Page 32}
~~~~~~~~~~~~~~~~~~~~~~~~~~~~~~~~~~~~~~~~~
@@@@@@@@@@@@@@@@@@@@@@@@@@@@@@@@@@@@@

{Page 33}
RESEARCH DESIGN:-
TITLE OF THE STUDY
A study on “financial position using ratio analysis” at Mahindra & Mahindra.
INTRODUCTION OF RATIOS:
Ratio analysis is a technique of analysis and interpretation of financial position. It is the process of
establishing and interpretation various for helping in making certain decisions, however ratio analysis is
not an end in itself. It is only a mean of better understanding of financial strengths and weakened of a
firm. Calculated of mere ratio does not serve4 any purpose unless several appropriate ratios are analyses
and interpreted. There are a number of ratios which can be calculated from the information given in the
financial position, but the analysis has to select the appropriate data and calculated only a few
appropriate ratios from the same keeping in mind.
STATEMENT OF PROBLEM:
{Page 34}
In the present global scenario financial position of an organization plays an important role on its
survival. So analyzing financial position of organization has becoming a little bit of difficult to financial
analysis. Financial position of an organization can be analyzed by using compound and discounting
techniques and ratio analysis plays an vital by analyzing the financial position of an organization this
study mainly focuses on the financial position through analyzing various ratio’s.
SCOPE OF THE STUDY:
The research study covers the area of ratios analysis and the research is restricted to the coverage of ratio
analysis concept and to respected organization study covers all the aspects of ratio analysis with respect
to the organization.
NEED OF THE STUDY:
The study has significant and provide benefits to various parties whim directly or indirectly
interest with the company.
It is beneficial to management of the company by providing crystal clear picture regarding
important aspects like liquidity, leverage, activity and profitability.
The study is also beneficial to employees and offers motivation by showing how actively they
are contributing for company’s growth.
The investors who are interested in investing company’s shares will also get benefited by setting
through the study and can easily take a decision whether to invest or not to invest the company’s
share.
OBJECTIVES OF THE STUDY:-
The objectives of the recent study known about the financial strength and weakness of MAHINDRA &
MAHINDRA through financial ratio analysis.
To evaluate the performance of the company by using ratio as yard stick and to measure the
efficiency of the company.
To understand the liquidity, profitability and efficiency position of the company during the study
period.
To make comparison between the ratios by using different periods.

{Page 35}
To study the present financial system at MAHINDRA & MAHINDRA.
To analyze the capital structure of the company with help of leverage ratio.
RESEARCH METHODOLOGY:-
Research methodology is a way to systematic search pertinent information on a specific topic and solves
the research problem research. It is a scientific investigation. It may be understood as a science of
studying how research is done science of studying how research is done scientifically. Research is a
systematized effort to gain new knowledge.
There are two sources of data:-
primary data
secondary data
1. PRIMARY DATA: - This data was collected through discussion with concerned officers using
the interview schedule.
2. SECONDARY DATA: - Secondary data refers to the data that has been complied by some
agency other than the user.
SECONDARY DATA’S ARE:-
Annual report of the company
Published financial statement of the company
Financial reports of the company
Text books
TOOLS AND TECHNIQUES:-
The tools and techniques used in the study are following ratio analysis for data analysis and
interpretation.
PLAN OF ANALYSIS:-
The primary data was collected through the interview schedule. This data was obtained to study the
procedure of the company relating to inventory and also includes various ratio analysis techniques used
by the company.

{Page 36}
The data collected secondary sources were processed and presented in the data analysis of various table
and explanations. The tables thus obtained were analyzed by calculating percentage’s, ratio’s and they
are followed by graphs in respect of current assets, current liability, sales, capital, net profit, gross profit
etc and thus to draw conclusion from the analysis done.
LIMITATIONS OF THE STUDY:-
Certain information was not revealed by the organization.
A thorough discussion with officials was not possible due to their busy schedule.
A study provides an insight into financial, personal, marketing and other aspects of MAHINDRA
& MAHINDRA every study will be bound with certain limitation.
One of the factors of the study was lack of availability of sample information most of the information
has been kept confidential and as such as not assed as art of policy of company.
{Page 37}
COMPANY PROFILE
MAHINDRA & MAHINDRA
HISTORY
Mahindra & Mahindra Limited (BSE: 500520) is part of the Indian Industrial Conglomerate Mahindra
Group based in Mumbai. The company was set up in 1945 in Ludhiana as Mahindra & Mohammed by
brothers K.C. Mahindra and J.C. Mahindra along with Malik Ghulam Mohammed.
After India gained independence and Pakistan was formed; Malik Ghulam Mohammed moved to
Pakistan where he became the nation's first finance minister.
{Page 38}
Now, with the Mahindra brothers as the whole sole of the company, its name was changed to Mahindra
& Mahindra in 1948. Initially set up to manufacture general-purpose utility vehicles, Mahindra &
Mahindra (M&M) was first known for assembly under license of the iconic Willis Jeep in India.
M&M introduced Jeeps to India and in no time they established themselves as the Jeep manufacturers
of India. The company later branched out into the manufacture of light commercial vehicles (LCVs) and
agricultural tractors, rapidly growing from being a manufacturer of army vehicles and tractors to an
automobile major with a growing global market presence.
At present, M&M is the leader in the utility vehicle segment in India with its flagship UV Scorpio.
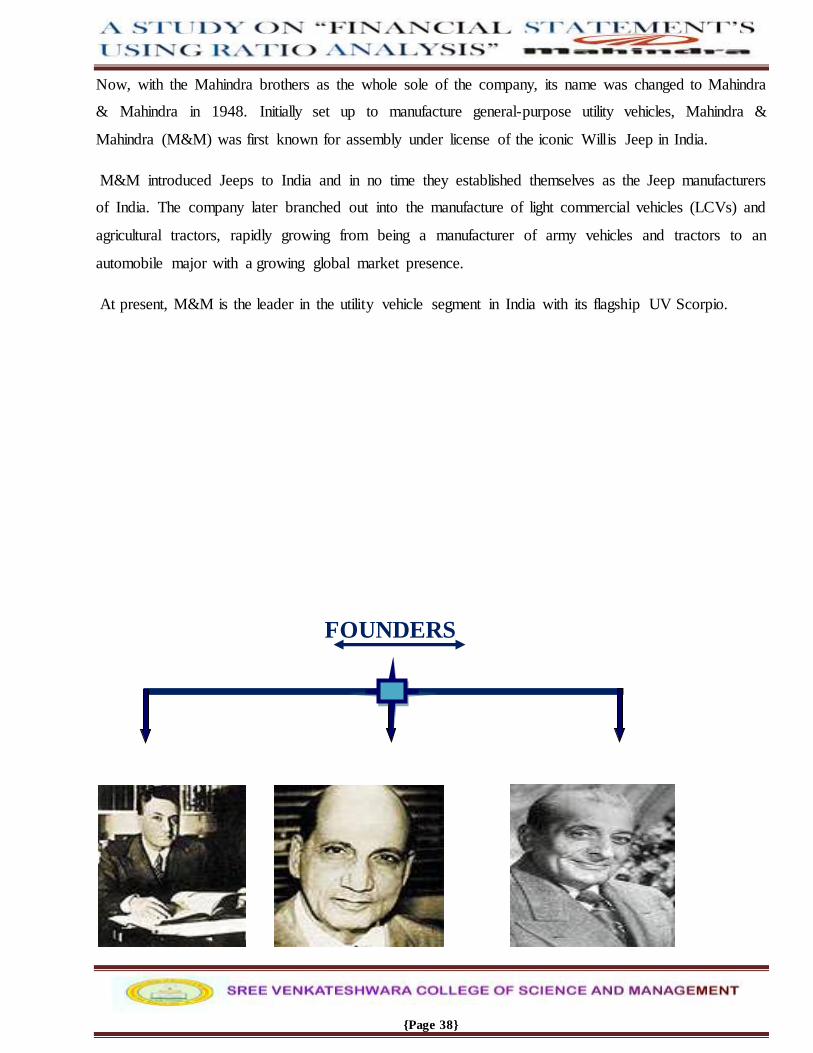
FOUNDERS

{Page 39}
J.C.MAHINDRA K.C.MAHINDRA G. MOHAMMAD
CHAIRMAN
V.CHAIRMAN M.D
In recent times the company is engaged in spreading its reach beyond its traditional markets. They
entered into the two-wheeler segment by taking over the Kinetic Motors in India. M&M also has
controlling stake in REVA Electric Car Company. M&M has also been selected as the preferred bidder
for the acquisition of South Korea's sangYong Motor Company.
M&M is one of the leading tractor brands in the world. It is also the largest manufacturer of tractors in
India with sustained market leadership of over 25 years. It designs, develops, manufactures and markets
tractors as well as farm implements. Mahindra Tractors (China) Co. Ltd. manufactures tractors for the
growing Chinese market and is a hub for tractor exports to the USA and other nations. M&M has a
100% subsidiary, Mahindra USA, which assembles products for the American market.
MILESTONES OF M&M
KESHUB MAHINDRA
ANAND MAHINDRA

{Page 40}
M&M established its business connections in the USA through Mahindra Wallace.
It started steel trading on behalf of European suppliers
M&M was converted into a public limited company on June 15, 1955.
VISION AND MISSION
VISION:
To create a fully collaborative environment in which suppliers can deliver exactly what the
company needs, when it needs it, and at a competitive cost.
“We don’t have a group-wide mission statement. Our core purpose is what makes all of us want
to get up and come to work in the morning” -Anand Mahindra
MISSION:
To create India's largest automobile and automobile-related products distribution network by
providing dealers and customers with the largest choice of unique world-class products and
services.
RECENT /CURRENT VENTURES:
Mahindra Navistar Automotives Ltd. (MNAL), the commercial vehicle joint venture between
Mahindra & Mahindra Ltd. (M&M) and Navistar Inc. of USA, unveiled its 25 tone and 31 tone
trucks for the Indian market.
Mahindra & Mahindra Ltd announced the launch of the Maxximo, the world’s first mini-truck to
be powered by a 2-cylinder CRDe engine with DOHC technology and 4 valves per cylinder.

{Page 41}
PRODUCT OF MAHINDRA AND MAINDRA
MAHINDRA BOLERO
Mahindra Bolero is one of the most successful and popular utility vehicle of the Mahindra and Mahindra
Group. The car is robust in appearance and it has been elegantly designed, keeping in mind the
conditions of the Indian roads. Mahindra Bolero is also among the best fuel-efficient cars of India as the
manufacturer has equipped it with a 2500 cc diesel engine with5- speed transmission.
MAHINDRA SCORPIO
Mahindra & Mahindra Limited launched Mahindra Scorpio as its first Sports Utility Vehicle in India in
2002.
This SUV has redefined the expectations for the design of SUVs with its sturdy looks and powerful
performance, the sophisticated interior design adds to the further glory to the appearance.
{Page 42}
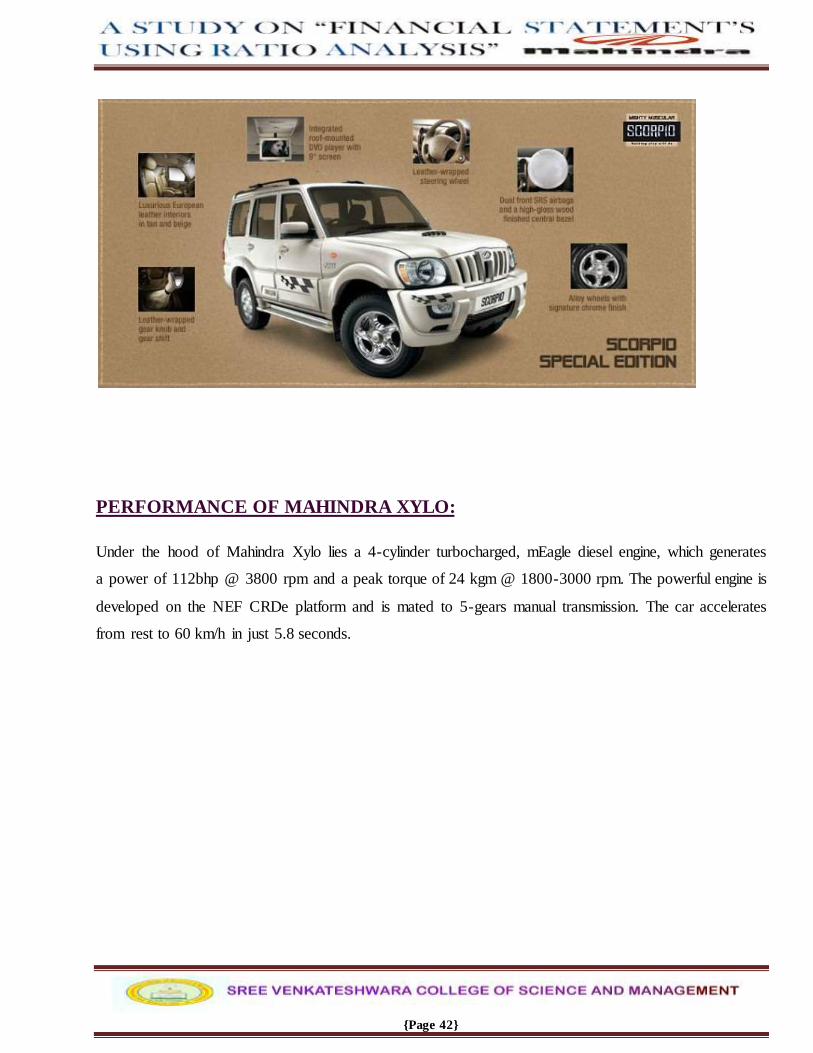
PERFORMANCE OF MAHINDRA XYLO:
Under the hood of Mahindra Xylo lies a 4-cylinder turbocharged, mEagle diesel engine, which generates
a power of 112bhp @ 3800 rpm and a peak torque of 24 kgm @ 1800-3000 rpm. The powerful engine is
developed on the NEF CRDe platform and is mated to 5-gears manual transmission. The car accelerates
from rest to 60 km/h in just 5.8 seconds.

{Page 43}
MILSTONE, AWARDS AND ACCOLADES:
M&M’s 61st year was studded with a number of noteworthy achievements, prestigious prizes and
glittering awards.
DUAL HONOURS FOR CHAIRMAN MR. KESHUB MAHINDRA
Chairman, Mr. Keshub Mahindra was awarded the “Business Visionary Award 2012” instituted by the
National Institute of Industrial Engineering (NITIE), Mumbai. Chairman, Mr. Keshub Mahindra was
{Page 44}
also awarded the prestigious IBS Kolkata Lifetime Achievement Award for his ‘unparalleled
contribution to industrial growth and social and economic development of the community’.
The Institute of Chartered Financial Analysts of India’s (ICFAI) India Business School (IBS) presented
it, Kolkata, at the Strategy Summit 2013, held in Kolkata.
SLEW OF HONOURS FOR MR. ANAND MAHINDRA
Mr. Anand Mahindra, VC & MD, Mahindra Group, received a number of prestigious awards in 2012-
13, including:
The prestigious CNBC Asia Business Leader of the Year Award for the Year 2012 as well as the
CNBC TV India “Business Leader of the Year Award”.
The ‘CEO of the Year’ award at the India Brand Summit 2012 co-sponsored by Business
Standard and ITM Business School in association with Times Now and DNA newspaper.
The LMA Entrepreneur of the Year 2013 award, instituted by the Ludhiana Management
Association (LMA).
The Most Inspiring Corporate Leader of the Year’ Award by NDTV Profit
The NDTV Profit – Car & Bike Award 2014 for Automobile Man of the Year.
Mr. Anand Mahindra was also nominated as a Member of the Council of the Executive Committee of
the National Sports Development Fund (NSDF) of the Govt. of India. He was featured in the list of 50
Most Influential Indians in Business Week’s edition dated August 13, 2013
HIGHEST CRISIL RATING FOR M&M
M&M has received the highest Governance & Value Creation rating, CRISIL GVC Level - I from
CRISIL for the ability to create value for all stakeholders, while adopting sound corporate governance
practices.
DUN & BRADSTREET AMERICAN EXPRESS CORPORATE AWARDS 2012
Mahindra & Mahindra was rated as the leading Indian company in the Automobile - Tractors sector in
the ‘Dun & Bradstreet – American Express Corporate Awards 2012’. The Automobile Sector comprises

{Page 45}
of three categories – Passenger Vehicles, Commercial Vehicles and Tractors. These awards recognize
the virtues of size and growth in the awards methodology. M&M ranked No. 1 in these two segments in
the premier Dun & Bradstreet India publication, India’s Top 500 Companies 2012.
MAHINDRA RECEIVES AMITY HR EXCELLENCE AWARD:
Mahindra & Mahindra was honored with the Amity HR Excellence Award at the Fourth Amity Global
HR Summit 2013 held at the Amity International Business School, Noida. The Amity HR Excellence
Award recognized Mahindra as one the most admired companies across the global on account of its
innovative strategies for Human Resources Management and Development.
GLOBAL HR EXCELLENCE AWARD FOR M&M;
Mahindra & Mahindra won the Global HR Excellence Award for Innovative HR practices
(Manufacturing Sector), in the Asia Pacific HRM Congress, held in Mumbai. These awards recognize
organizations and individuals who have embraced change, encouraged constructive challenges and
demonstrated entrepreneurial skills in the corporate world.

{Page 46}

{Page 47}
M&M WINS BOMBAY CHAMBER GOOD CORPORATE CITIZEN AWARD
2012-13
M&M was presented with the coveted Bombay Chamber Good Corporate Citizen Award 2012-13 at a
glittering ceremony held to celebrate the Chamber’s 172nd Foundation Day on September 21, 2012.
Mr. Bharat Doshi, Executive Director, M&M Ltd. and Mr. Rajeev Dubey, Member of the Group
Management Board and Chairman, Mahindra & Mahindra CSR Council, received the award on behalf
of the company.
This Award recognizes and honors conspicuous achievement by corporate organizations by way of
service to the civic community, in addition to outstanding operational performance. It takes into account
several parameters, including Business Performance, Corporate Interests, Employee Welfare, Customer
and Stakeholder Satisfaction and Social Investment.
GOLDEN PEACOCK AWARD FOR EXCELLENCE IN CORPORATE
GOVERNANCE
Mahindra & Mahindra won the coveted Golden Peacock Award for Excellence in Corporate
Governance 2006. This award validates the company’s ‘Best-in-Class’ corporate governance practices
and reflects its transparent and ethical dealings with stakeholders across the entire value chain. It
recognizes the Management’s commitment to the highest standards of corporate conduct and its
commitment to Corporate Social Responsibility as a distinct activity that helps build commendable
social values and adds to the ethical fiber of the organization.

{Page 48}
BEST AUTOMOTIVE MANUFACTURING SUPPLY CHAIN EXCELLENCE
AWARD
Mahindra & Mahindra has been awarded as the organization with the “Best Automotive Manufacturing
Supply Chain Excellence”. The awards were presented by India Times Mindscape (Times of India
Group) along with the Business India Group at the Express, Logistics & Supply Chain Awards held in
Mumbai on September 28, 2012. A. C. Neilson is accredited with the research for the award nominees
and winners.
HIGH RANKINGS FOR MAHINDRA;
M&M was ranked second in the prestigious e Most Trusted Car Company in India study conducted by
TNS. M&M scored 127 points, just seven points below the top ranking company, according to a TNS
communiqué.
M&M was ranked 14th in The Economic Times prestigious ‘ET 500’ list of top achieving
companies in India. The company has moved up four ranks from last year. To quote from the
‘ET 500’ write-up: “M&M’s ‘art-to-part’ strategy of diversification into the auto parts value
chain and its plans for new platforms for utility vehicles and joint venture with Renault for
Logan have led to a gain in ranks.”
M&M was ranked 22nd in Business India’s annual survey of the country’s top companies -
Super 100
{Page 49}

{Page 50}
{Page 51}
INTRODUCTION TO THE TOPIC
DATA ANALYSIS AND INTERPRETATION OF FINANCIAL STATEMENT
USING RATIO ANALYSIS:
Financial statements provide summarized view of the financial position and operation of the company.
Many parties are interested in financial statement analysis to know about the financial position of the
firm. They include investors, creditors, lenders, suppliers etc it is process of establishing the meaningful
relationship between the items of financial statements. To know financial position of the company with
the help of past and present performance of the company, Items include Balance sheet, Profit and loss
account, Reports and Explanatory notes.
THE FINANCIAL ANALYSIS AND INTERPRETATION:
The significance of financial statement not lies in their preparation but in their analysis and
interpretation. Therefore analysis and interpretation is an attempt to determine the importance of
financial statements. It increases the meaning of accounting data, to provide more understanding in
Layman’s language. That helps to forecast the future earnings, ability to pay dividend policy etc. the
analysis and interpretation are 2 terms complementary to each other. For interpretation analysis is
necessary. And analysis without interpretation is meaningless.
ANALYSIS : “A process of grouping or sub grouping of a given data for the purpose of developing
some relationships among the groups either for decisions or for future prediction”
The financial analysis involves the division of facts or information on the basis of some definite plans
and to classify them into groups on the basis of some conditions and presenting them in most
convenient, simple and understandable. Therefore analysis involves the following:
{Page 52}
Study and understanding of the data presented in the financial statements.
Collection of additional information necessary for interpretation.
presentation of the financial data in logical and simple manner
Grouping and sub grouping of the items given in the financial statements on the basis of common
characteristics.
Development relationship from one group to another group for further study.
The data provided in the financial statements is re arranged and methodically classified for
comparisons. For this purpose some standards are established for comparison such as:
a. Past year figures may be used as standard for comparison with the present year
figures.
b. Future year estimated figures may be used as standards.
c. Another progressive or successful firm’s figures may be used as standards.
d. Over all industry figures may be used as standards for a comparison.
The relationship can also be established from one item of statement to the other item of statement.
E.g.Net profit or gross profit to sales, current assets to current liabilities, cost of sales to inventory, fixed
assets to capital etc.
INTERPRETATION:
To interpret means to put the meaning of data in simple and understandable manner to a layman.
Interpretation can be made only after analysis. It is the explanation of the conclusion drawn from
analysis in simple terms. The interpretation involves the following.
1) Study of relationship among the items of financial statements.
2) Study of trend over a period or actual data with the standard data used for comparison
3) Conclusions or inferences are put in simple terms for easy and more understanding for a
common man.
{Page 53}
USES OR ADVANTAGES OF ANALYSIS:
1) It helps to determine financial strength or weakness of the business firm.
2) It highlights the significant facts and relations which cannot be understood by mere reading of
financial statements.
3) It is based on some logical and scientific method and is useful for decisions.
4) It is useful to understood multidirectional relationships of the various items of financial statements.
5) It minimizes the threat of wrong or delayed decisions.
6) It helps to evaluate correctness and accuracy of the decisions.
CLASSIFICATION OF RATIOS:
Ratio may be classified as given below:
A. Classification according to the nature of accounting statement from which the ratios are
derived
1. Balance Sheet Ratios. These ratios deal with the relationship between two items appearing in
the balance sheet, e.g., current ratio, liquid ratio, debt equity ratio, etc.
2. Profit and loss Account Ratios. This type of ratios show the relationship between two items
which are in the profit and loss account itself, e.g. gross profit ratio, net profit ratio, operating
ratio, etc.
3. Combined or Composite ratios. These ratios show the relationship between items one of which
is taken from profit and loss account and the other from the balance sheet, e.g., Ratio of return on
capital employed, debtor’s turnover ratio, stock turnover ratio, capital turnover ratio, etc.
B. Classification from the point of view of financial management or objective
1. Liquidity Ratios.
2. Capital Structure Ratios.
3. Turnover Ratios.
4. Profitability Ratios.
{Page 54}
1. LIQUIDITY RATIOS (short term solvency):
‘Liquidity’ means ability of a firm to meet its current liabilities. the liquidity ratios, therefore ,try to
establish a relationship between current liabilities, which are the obligations soon becoming due and
current assets, which presumably provide the source from which these obligations will be met. In other
words, the liquidity ratios answer the question : “will the company probably be able to meet its
obligations when they become due?” the failure of a company to meet its obligations due to lack of
adequate liquidity will result in bad credit ratings, loss of creditors confidence or even in law suits
against the company. The following ratios are commonly used to indicate the liquidity of business.
IMPORTANT LIQUIDITY RATIOS:
i. Current Ratio.
ii. Quick Ratio.
iii. Absolute liquid ratio.
1. CAPITAL STRUCTURE RATIOS OR GEARING RATIOS(long term solvency):
Capital structure ratios are also known as gearing ratios or solvency ratios or leverage ratios. These are
used to analyze the long term solvency of any particular business concern. There are two aspects of long
term solvency of a firm
(i) Ability to repay the principal amount when due, and
(ii) Regular payment of interest. In other words long term creditors like debenture holders,
financial institution etc. are interested in the security of their loan amount as well as the ability
of the company to meet interest costs. They, therefore, also consider the earning capacity of
the company to know whether it will be able to pay off interest on loan amount. Liquidity
ratios discussed earlier indicate short term financial strength whereas solvency ratios judge the
ability of a firm to pay off its long term liabilities. Important solvency ratios are discussed
below :

{Page 55}
IMPORTANT CAPITAL STRUCTURE RATIOS:
1. Debt equity ratio
2. Proprietary ratio.
3. Interest coverage ratio.
4. Debt to total funds ratio.
5. Capital gearing ratio.
3. TURNOVER RATIOS (Performance ratios or Activity Ratios):
Turnover ratios are used to indicate the efficiency with which assets and resources of the firm are
being utilized. These ratios are known as turnover ratios because they indicate the speed with which
assets are being converted or turnover over into sales. These ratios, thus express the relationship
between sales and various assets. A higher turnover ratio generally indicates better use of capital
resources which in turn has a favorable effect on the profitability of the firm.
IMPORTANT TURNOVER RATIOS:
1. Inventory turnover ratio
2. Debtors turnover ratio
3. Fixed assets turnover ratio
4. Working capital turnover ratio.
5. Capital turnover ratio.
6. Creditor’s turnover ratio.
4. PROFITABILITY RATIOS:
Every business should earn sufficient profits to survive and grow over a long period of time. In
fact efficiency of a business is measured in terms of profits. Profitability ratios are calculated to
measure the efficiency of a business.

{Page 56}
Profitability of a business may be measured in two ways:
1. Profitability in relation to sales.
2. Profitability in relation to investment.
Profitability in relation to sales indicated the amount of profit per rupee of sales. Similarly, profitability
in relation to investment indicates the amount of profit per rupee invested in assets. If a company is not
able to earn a satisfactory return on investment, it will not be able to pay a reasonable return to investors
and the survival of the company may be threatened.
IMPORTANT PROFITABILITY RATIOS:
1. Gross profit ratio.
2. Net profit ratio.
3. Operating ratio and expense ratios.
4. Return on investment
5. Return on equity.
6. Earnings per share (EPS).
7. Dividend payout ratio.
8. Dividend yield ratio.
9. Price earnings ratio.

{Page 57}
DATA ANALYSIS AND INTERPRETATION
RATIO ANALYSIS:
TABLE NO: 1
TABLE SHOWS THE CURRENT RATIO
Particular 2011-12 (in cr) 2012-13 (in cr) 2013-14(in cr) Current assets
8520.77
9798.79
12803.41
Current liabilities
8566.67
9567.60
10752.30
Current Ratio
99.46
102.41
121.10
ANALYSIS:-
By analyzing the above tables the current ratio are below:-
In the year 2011-12 Current ratio is 99.46, current assets is Rs 8520.77 and current liabilities is
Rs 8566.67.
In the year 2012-13 Current ratio is 102.41, current assets is Rs 9798.79 and current liabilities is
Rs 9567.60.
In the year 2013-14 Current ratio is 121.10, current assets is Rs 12803.41 and current liabilities is
Rs 10752.30.
{Page 58}
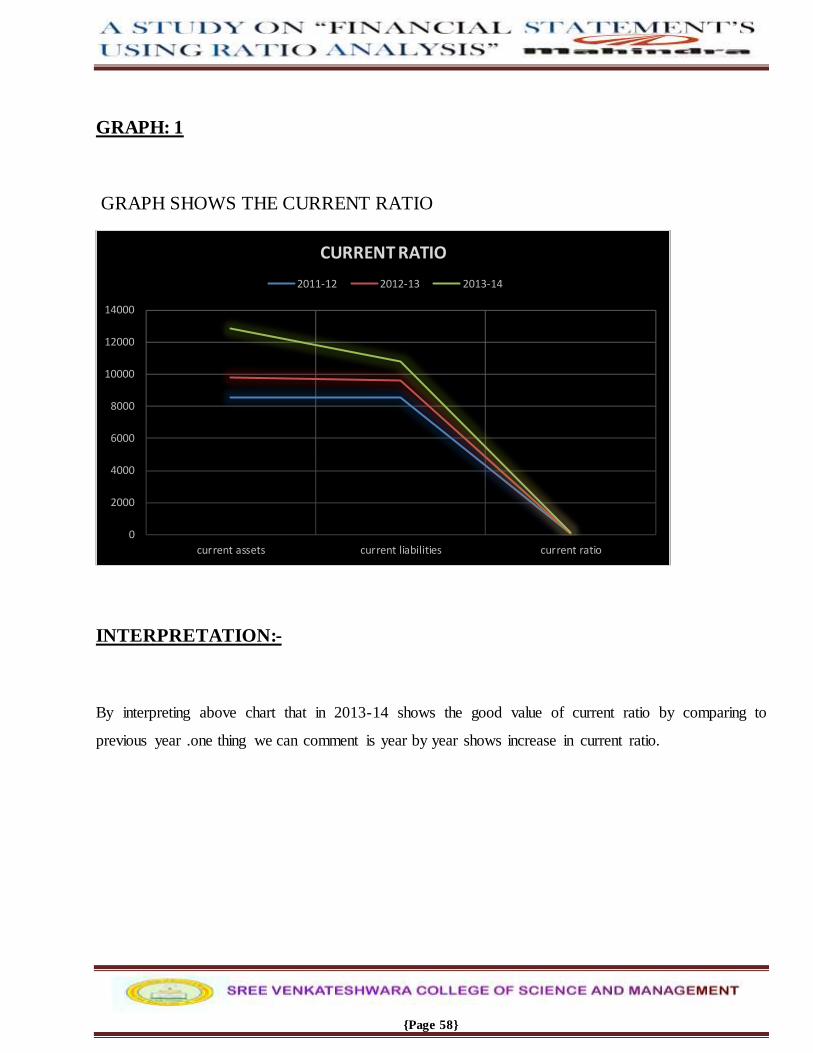
GRAPH: 1
GRAPH SHOWS THE CURRENT RATIO
INTERPRETATION:-
By interpreting above chart that in 2013-14 shows the good value of current ratio by comparing to
previous year .one thing we can comment is year by year shows increase in current ratio.
0
2000
4000
6000
8000
10000
12000
14000
current assets current liabilities current ratio
CURRENT RATIO
2011-12 2012-13 2013-14
{Page 59}
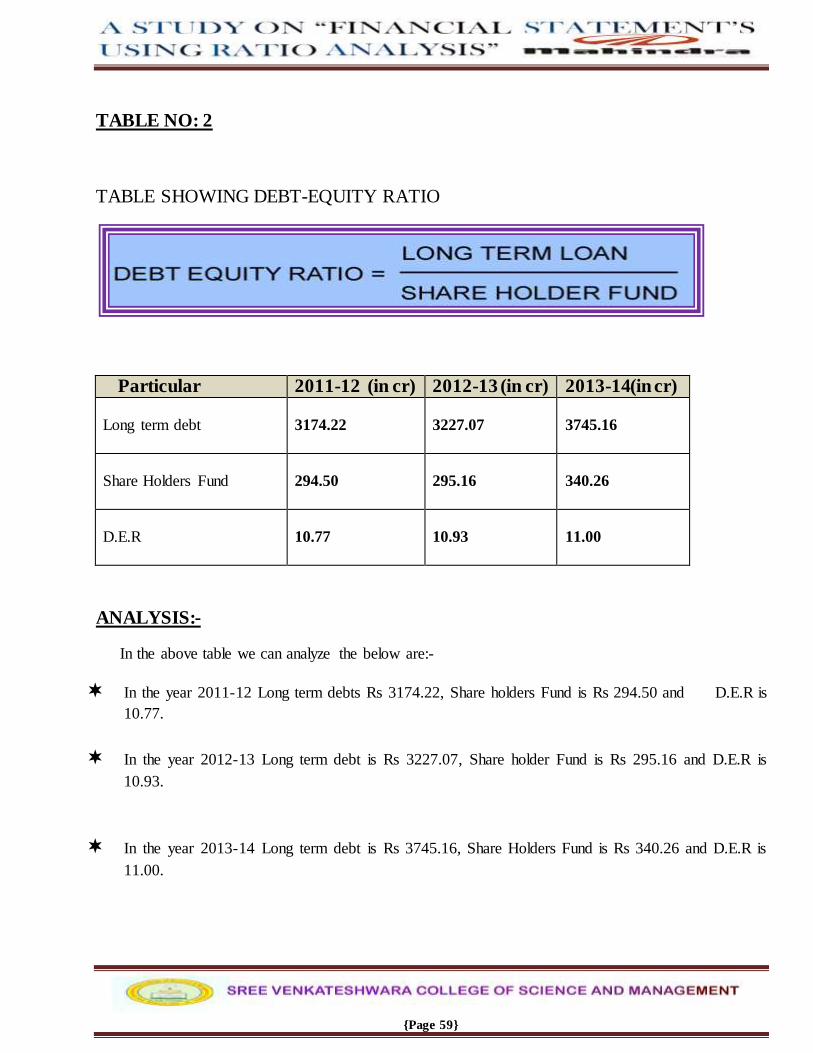
TABLE NO: 2
TABLE SHOWING DEBT-EQUITY RATIO
Particular 2011-12 (in cr) 2012-13 (in cr) 2013-14(in cr) Long term debt
3174.22
3227.07
3745.16
Share Holders Fund
294.50
295.16
340.26
D.E.R
10.77
10.93
11.00
ANALYSIS:-
In the above table we can analyze the below are:-
In the year 2011-12 Long term debts Rs 3174.22, Share holders Fund is Rs 294.50 and D.E.R is
10.77.
In the year 2012-13 Long term debt is Rs 3227.07, Share holder Fund is Rs 295.16 and D.E.R is
10.93.
In the year 2013-14 Long term debt is Rs 3745.16, Share Holders Fund is Rs 340.26 and D.E.R is
11.00.

{Page 60}
GRAPH: 2
GRAPH SHOWS DEBT-EQUITY RATIO:
INTERPRETATION:-
By the graph we can interpret that in 2011-12 shows good results in long term debt and debt equity ratio
.in the year 2012-13 shows increase in all the sectors again in the year 2013-14 shows good increase in
D.E.R, Share Holders Fund and Long term debt.
0%
10%
20%
30%
40%
50%
60%
70%
80%
90%
100%
Long term Debt Share Holders Fund D.E.R
2013-14
2012-13
2011-12
{Page 61}
TABLE NO: 3
TABLE SHOWING INTERSET COVERAGE RATIO:
Particular 2011-12 (in cr) 2012-13 (in cr) 2013-14(in cr) Net Profit after tax
32319
33528.20
37583.50
Fixed interest Charges
168.30
191.19
259.22
Interest Coverage Ratio
192.03
175.36
144.98
ANALYSIS:-
The above table shows interest coverage ratio in the year 2011-12 is 192.03, net profit after tax Rs
32319 and fixed interest charge is Rs 168.30.in the year 2012-13 interest coverage ratio is 175.36 and
finally in 2013-14 interest coverage ratios is Rs 144.98.
{Page 62}
GRAPH: 3
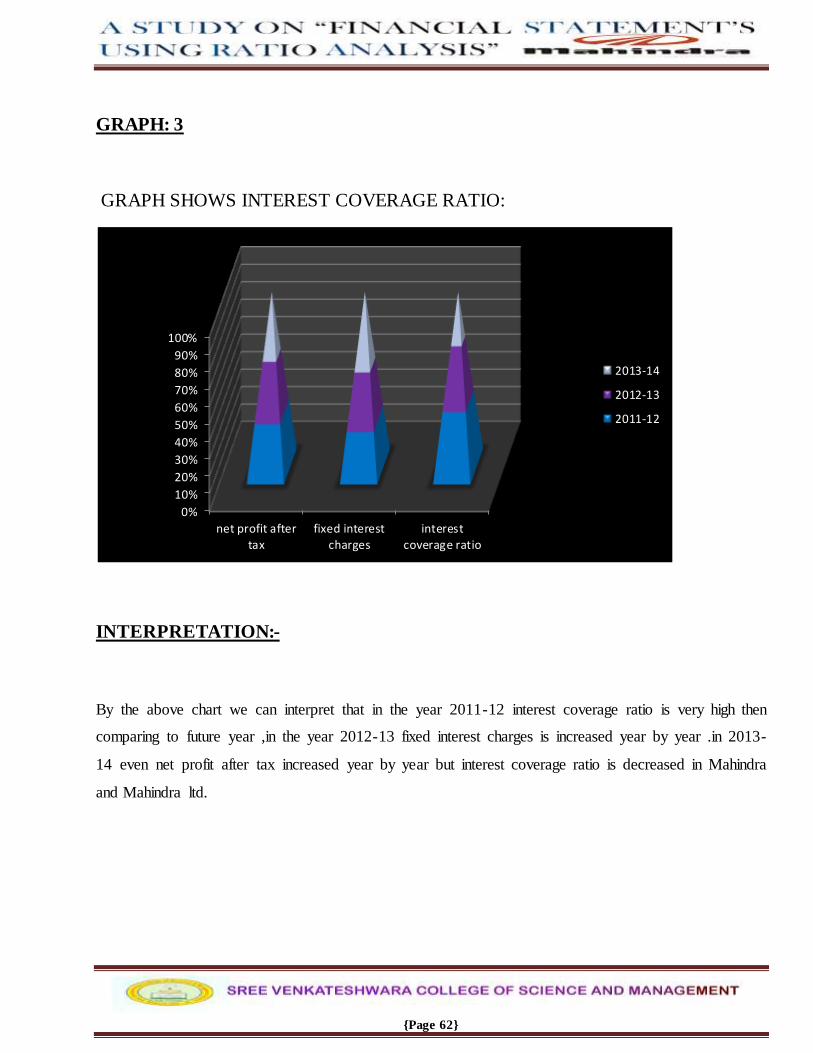
GRAPH SHOWS INTEREST COVERAGE RATIO:
INTERPRETATION:-
By the above chart we can interpret that in the year 2011-12 interest coverage ratio is very high then
comparing to future year ,in the year 2012-13 fixed interest charges is increased year by year .in 2013-
14 even net profit after tax increased year by year but interest coverage ratio is decreased in Mahindra
and Mahindra ltd.
0%
10%
20%
30%
40%
50%
60%
70%
80%
90%
100%
net profit after
tax
fixed interest
charges
interest
coverage ratio
2013-14
2012-13
2011-12

{Page 63}
TABLE NO: 4
DEBTORS TURNOVER RATIO:-
Particular 2011-12 (in cr) 2012-13 (in cr) 2013-14(in cr)
Net Sales
40441.16
40508.50
31853.52
Average Debtors
1988.36
2208.35
2509.84
D.T.R
20.33
18.34
12.69
ANALYSIS:-
In the above table we can analyze the below are:-
In the year 2011-12 Mahindra and Mahindra ltd debtors turnover ratio is 20.33
,net sales is Rs 40441.16 and average Debtors is Rs 1988.36.
In the year 2012-13 Debtors turnover ratio is 18.34, Net sales is Rs 40508.50 and
average Debtors is Rs 31853.52.
In the year 2013-14 Debtors turnover ratio is 12.69, Net sales is Rs 31853.52 and
average Debtors is Rs 2509.84.

{Page 64}
GRAPH: 4
GRAPH SHOWS DEBTOR TURNOVER RATIO:
INTERPRETATION:-
By above chart we can interpret ate that Mahindra and Mahindra ltd Debtor turnover Ratio in 2011-12
is better but in 2012-13 & 2013-14 very less performance there raid decrease due to less net sales.
2011-12
2012-13
2013-14
0
10000
20000
30000
40000
50000
NET SALES AVERAGE DEBT D.T.R
DEBTOR TURNOVER RATIO
2011-12 2012-13 2013-14

{Page 65}
TABLE NO: 5
TABLE SHOWS FIXED ASSETS TURNOVER RATIO:-
Particular 2011-12 (in cr) 2012-13 (in cr) 2013-14(in cr)
Net Fixed assets
15345.31
17885.99
20536.35
Net Sales
40441.16
40508.50
31853.52
F.T.R
0.37
0.44
0.64
ANALYSIS:-
In the above table we can analyze the below are:-
In the year 2011-12 net fixed assets is Rs 15345.31, net sales is Rs 40441.16 and fixed turnover
ratio is 0.37.
In the year 2012-13 net fixed assets is Rs 17885.99, net sales is Rs 40508.50 and fixed turnover
ratio is 0.44.
In the year 2013-14 net fixed assets is Rs 20536.35, net Sales is Rs 31853.52 and fixed turnover
ratio is 0.64.
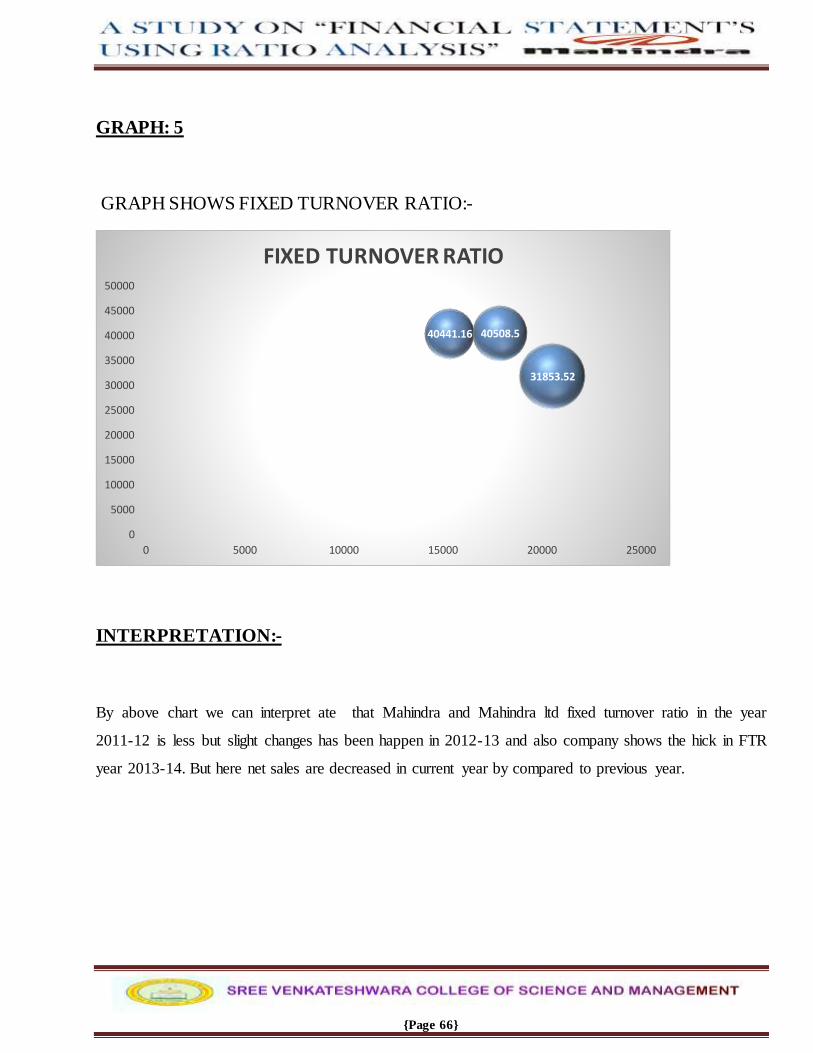
{Page 66}
GRAPH: 5
GRAPH SHOWS FIXED TURNOVER RATIO:-
INTERPRETATION:-
By above chart we can interpret ate that Mahindra and Mahindra ltd fixed turnover ratio in the year
2011-12 is less but slight changes has been happen in 2012-13 and also company shows the hick in FTR
year 2013-14. But here net sales are decreased in current year by compared to previous year.
40441.16 40508.5
31853.52
0
5000
10000
15000
20000
25000
30000
35000
40000
45000
50000
0 5000 10000 15000 20000 25000
FIXED TURNOVER RATIO
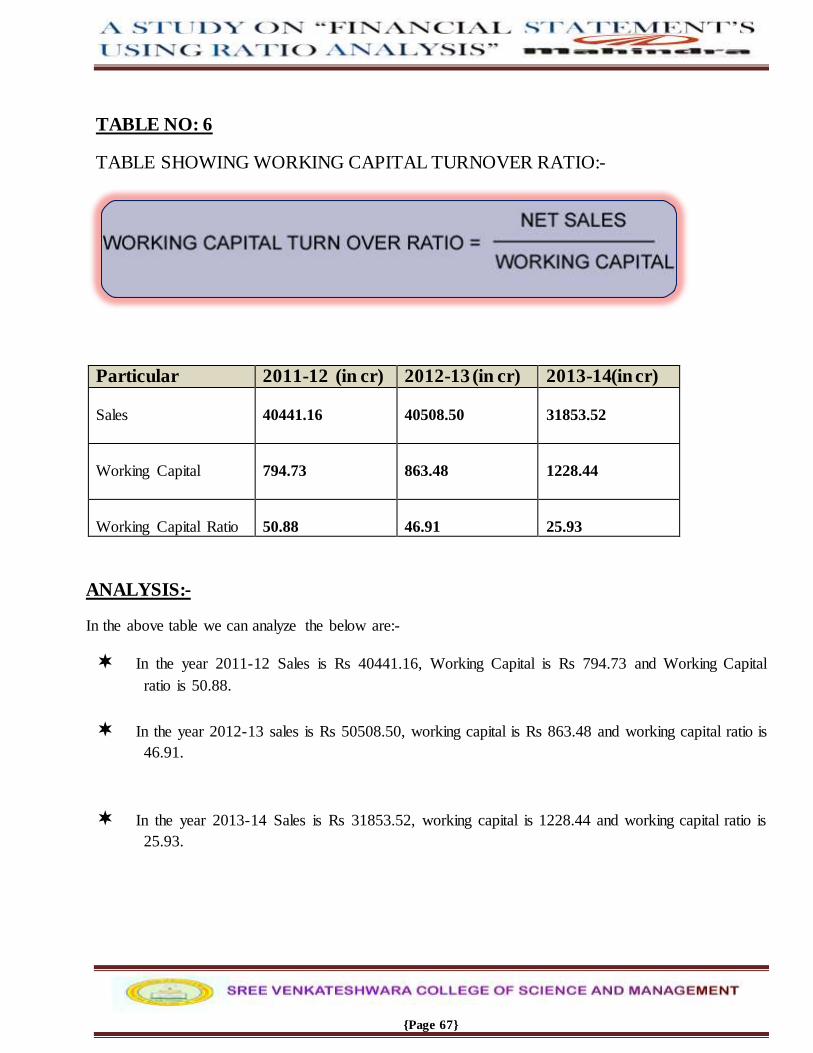
{Page 67}
TABLE NO: 6
TABLE SHOWING WORKING CAPITAL TURNOVER RATIO:-
Particular 2011-12 (in cr) 2012-13 (in cr) 2013-14(in cr) Sales
40441.16
40508.50
31853.52
Working Capital
794.73
863.48
1228.44
Working Capital Ratio
50.88
46.91
25.93
ANALYSIS:-
In the above table we can analyze the below are:-
In the year 2011-12 Sales is Rs 40441.16, Working Capital is Rs 794.73 and Working Capital
ratio is 50.88.
In the year 2012-13 sales is Rs 50508.50, working capital is Rs 863.48 and working capital ratio is
46.91.
In the year 2013-14 Sales is Rs 31853.52, working capital is 1228.44 and working capital ratio is
25.93.
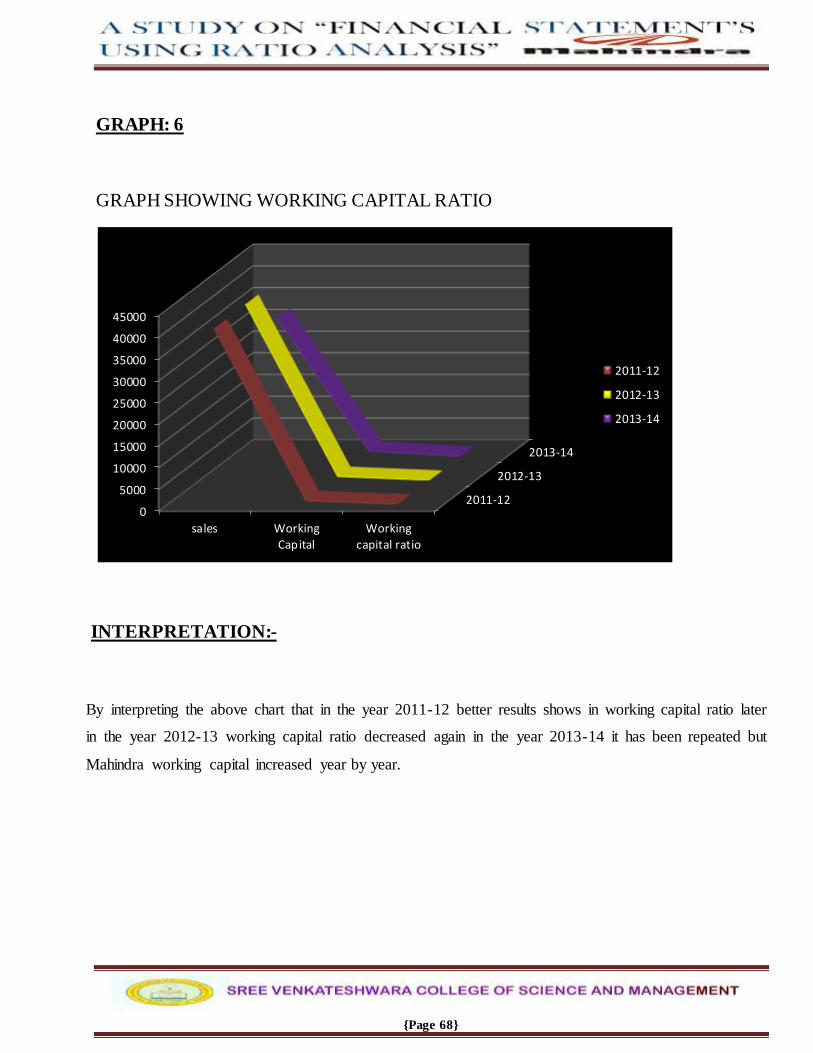
{Page 68}
GRAPH: 6
GRAPH SHOWING WORKING CAPITAL RATIO
INTERPRETATION:-
By interpreting the above chart that in the year 2011-12 better results shows in working capital ratio later
in the year 2012-13 working capital ratio decreased again in the year 2013-14 it has been repeated but
Mahindra working capital increased year by year.
2011-12
2012-13
2013-14
0
5000
10000
15000
20000
25000
30000
35000
40000
45000
sales Working
Capital
Working
capital ratio
2011-12
2012-13
2013-14
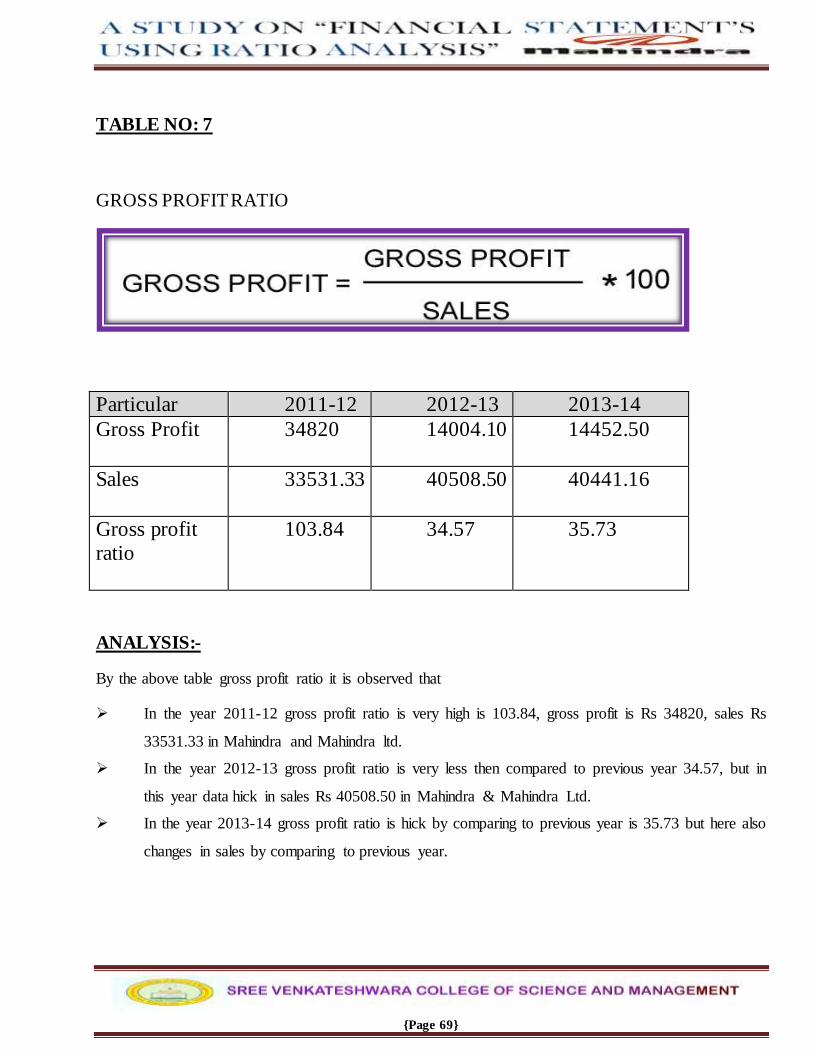
{Page 69}
TABLE NO: 7
GROSS PROFIT RATIO
Particular 2011-12 2012-13 2013-14
Gross Profit
34820 14004.10 14452.50
Sales
33531.33 40508.50 40441.16
Gross profit
ratio
103.84 34.57 35.73
ANALYSIS:-
By the above table gross profit ratio it is observed that
In the year 2011-12 gross profit ratio is very high is 103.84, gross profit is Rs 34820, sales Rs
33531.33 in Mahindra and Mahindra ltd.
In the year 2012-13 gross profit ratio is very less then compared to previous year 34.57, but in
this year data hick in sales Rs 40508.50 in Mahindra & Mahindra Ltd.
In the year 2013-14 gross profit ratio is hick by comparing to previous year is 35.73 but here also
changes in sales by comparing to previous year.
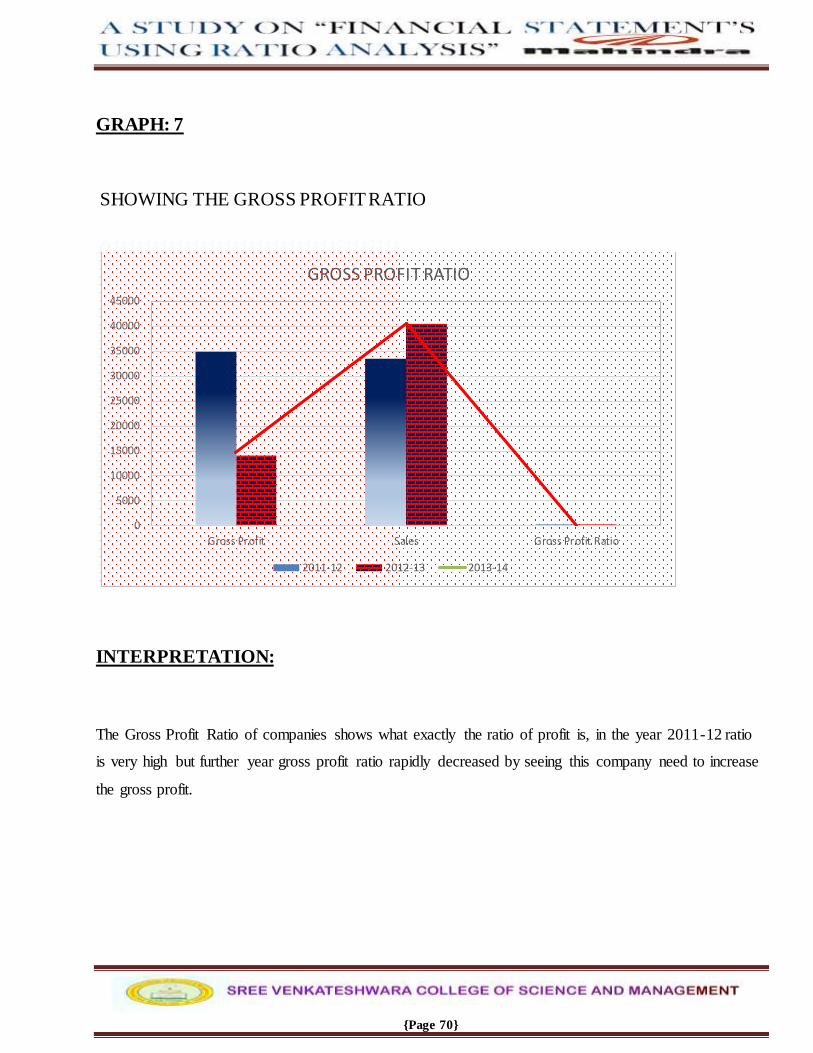
{Page 70}
GRAPH: 7
SHOWING THE GROSS PROFIT RATIO
INTERPRETATION:
The Gross Profit Ratio of companies shows what exactly the ratio of profit is, in the year 2011-12 ratio
is very high but further year gross profit ratio rapidly decreased by seeing this company need to increase
the gross profit.
0
5000
10000
15000
20000
25000
30000
35000
40000
45000
Gross Profit Sales Gross Profit Ratio
GROSS PROFIT RATIO
2011-12 2012-13 2013-14
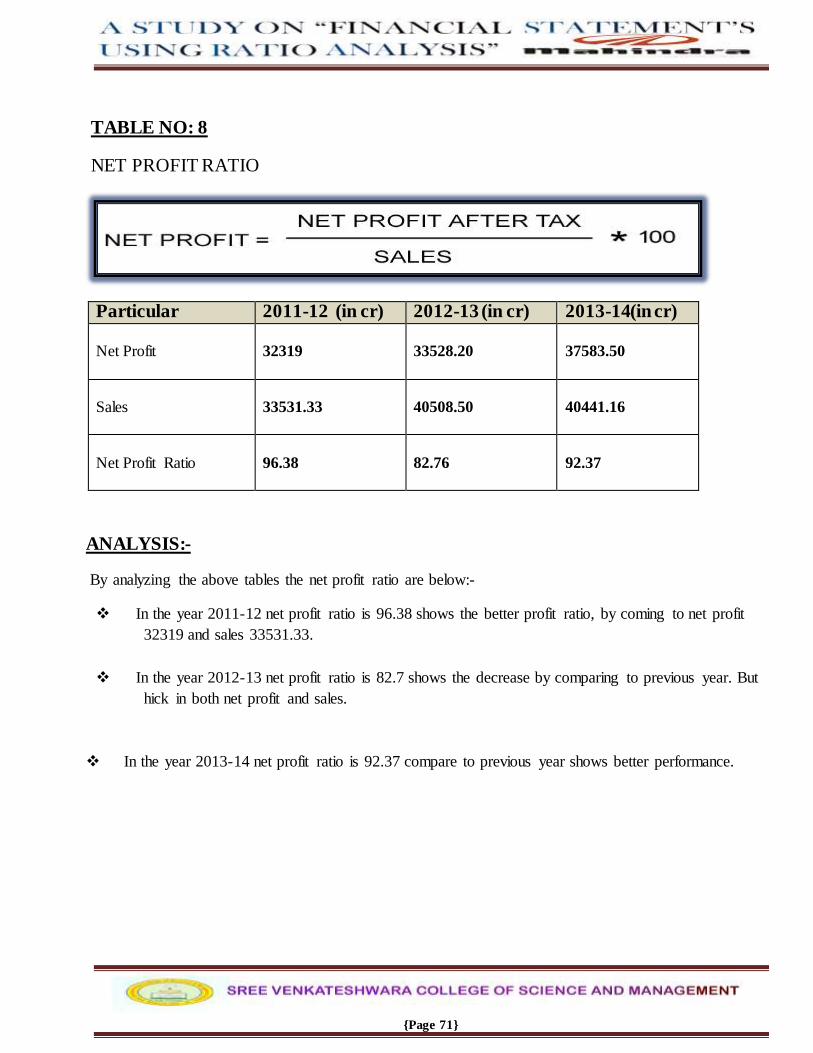
{Page 71}
TABLE NO: 8
NET PROFIT RATIO
Particular 2011-12 (in cr) 2012-13 (in cr) 2013-14(in cr)
Net Profit
32319
33528.20
37583.50
Sales
33531.33
40508.50
40441.16
Net Profit Ratio
96.38
82.76
92.37
ANALYSIS:-
By analyzing the above tables the net profit ratio are below:-
In the year 2011-12 net profit ratio is 96.38 shows the better profit ratio, by coming to net profit
32319 and sales 33531.33.
In the year 2012-13 net profit ratio is 82.7 shows the decrease by comparing to previous year. But
hick in both net profit and sales.
In the year 2013-14 net profit ratio is 92.37 compare to previous year shows better performance.

{Page 72}
GRAPH: 8
SHOWING THE NET PROFIT RATIO
INTERPRETATION:-
By the above chart we can interpret that fluctuation in net profit ratio in 2011-12 shows the better
performance but in the year 2012-13 down in net profit ratio, in 2013-14 shows the better recovery
.company need to stable the profit.
0
5000
10000
15000
20000
25000
30000
35000
40000
45000
NET PROFIT SALES NET PROFIT RATIO
2011-12
2012-13
2013-14

{Page 73}
TABLE NO: 9
RETURN ON INVESTMENT
Particular 2011-12 (in cr) 2012-13 (in cr) 2013-14(in cr)
Operating profit
3962.45
5439.20
5258.47
Capital employed
295.16
295.16
295.16
ROI
1342.47
1842.79
1781.56
ANALYSIS:-
By analysis the above table ,return on investment in the year 2012 is Rs 1342.47,then it
was increase in the year of 2013 Rs1842.79 but company ROI was decreased in 2014 Rs
1781.56.

{Page 74}
GRAPH: 9
SHOWING THE RETURN ON INVESTMENT
INTERPRETATION:
The above chart shows that return on investment of the company is fluctuated from the year to year .there is
a slight changes in 2014 by comparing to previous year 2013. Company need to focus on operating profit.
0
1000
2000
3000
4000
5000
6000
Oerating profitcapital employed
ROI
2011-12
2013-14
2012-13
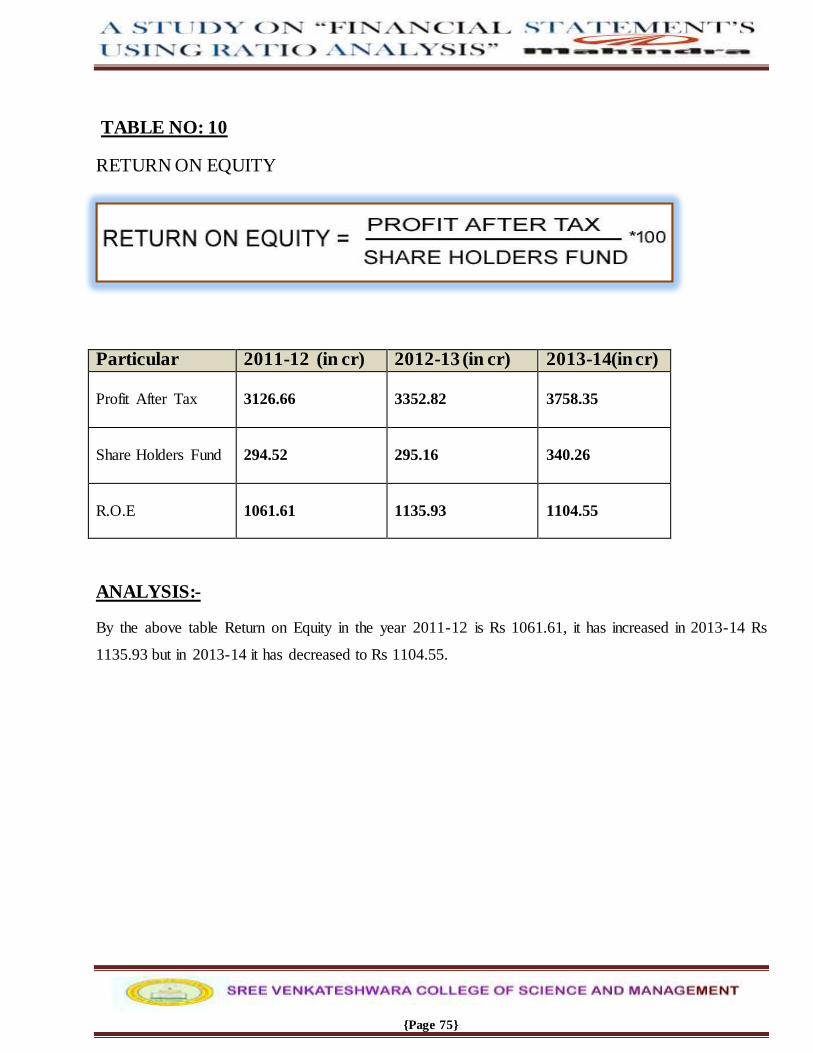
{Page 75}
TABLE NO: 10
RETURN ON EQUITY
Particular 2011-12 (in cr) 2012-13 (in cr) 2013-14(in cr) Profit After Tax
3126.66
3352.82
3758.35
Share Holders Fund
294.52
295.16
340.26
R.O.E
1061.61
1135.93
1104.55
ANALYSIS:-
By the above table Return on Equity in the year 2011-12 is Rs 1061.61, it has increased in 2013-14 Rs
1135.93 but in 2013-14 it has decreased to Rs 1104.55.
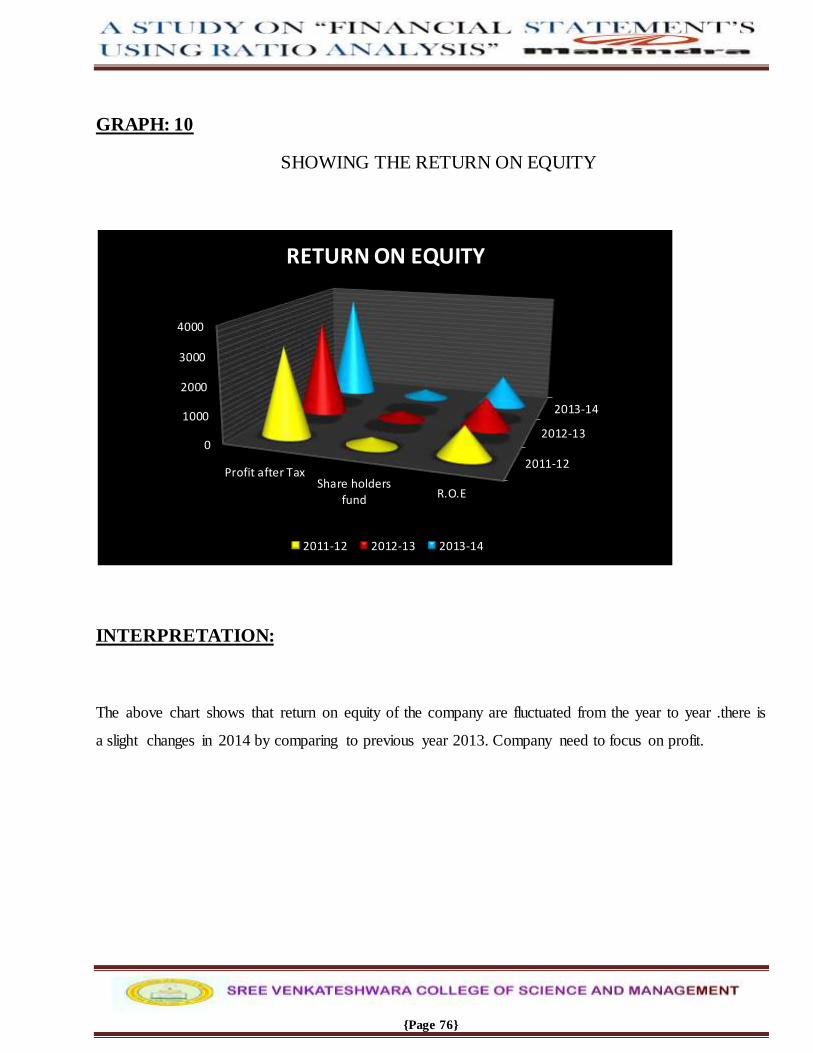
{Page 76}
GRAPH: 10
SHOWING THE RETURN ON EQUITY
INTERPRETATION:
The above chart shows that return on equity of the company are fluctuated from the year to year .there is
a slight changes in 2014 by comparing to previous year 2013. Company need to focus on profit.
2011-12
2012-13
2013-14
0
1000
2000
3000
4000
Profit after TaxShare holders
fund R.O.E
RETURN ON EQUITY
2011-12 2012-13 2013-14
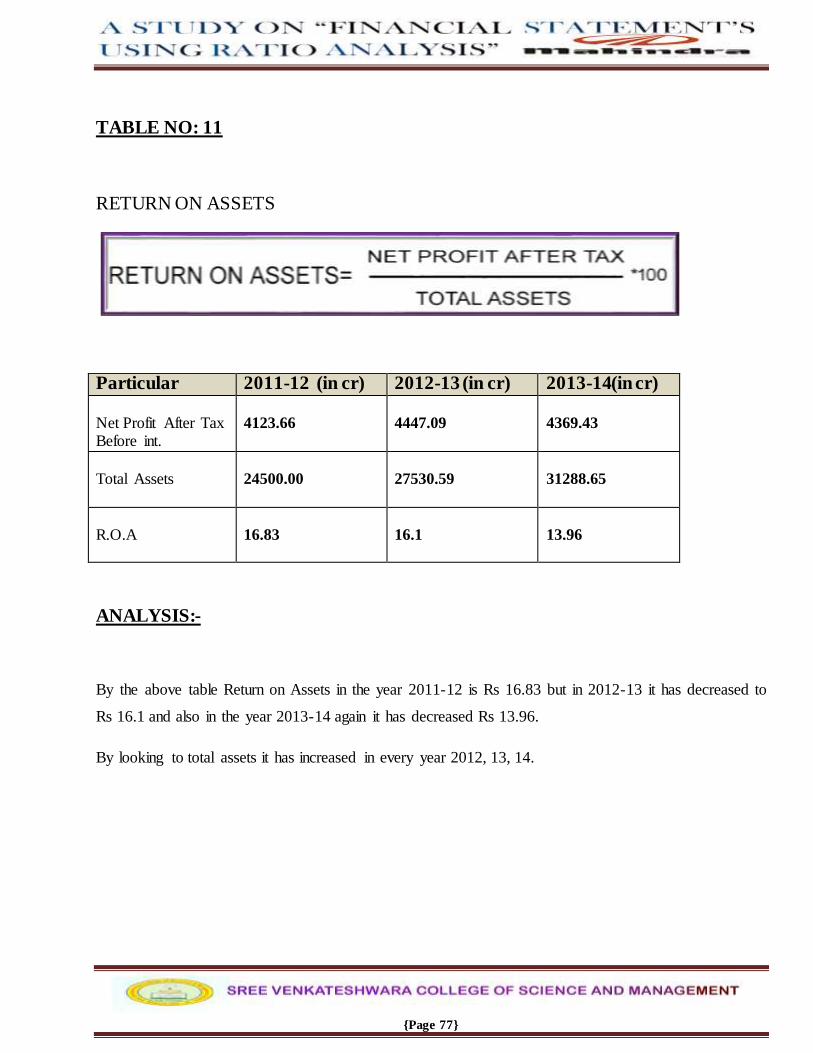
{Page 77}
TABLE NO: 11
RETURN ON ASSETS
Particular 2011-12 (in cr) 2012-13 (in cr) 2013-14(in cr) Net Profit After Tax Before int.
4123.66
4447.09
4369.43
Total Assets
24500.00
27530.59
31288.65
R.O.A
16.83
16.1
13.96
ANALYSIS:-
By the above table Return on Assets in the year 2011-12 is Rs 16.83 but in 2012-13 it has decreased to
Rs 16.1 and also in the year 2013-14 again it has decreased Rs 13.96.
By looking to total assets it has increased in every year 2012, 13, 14.
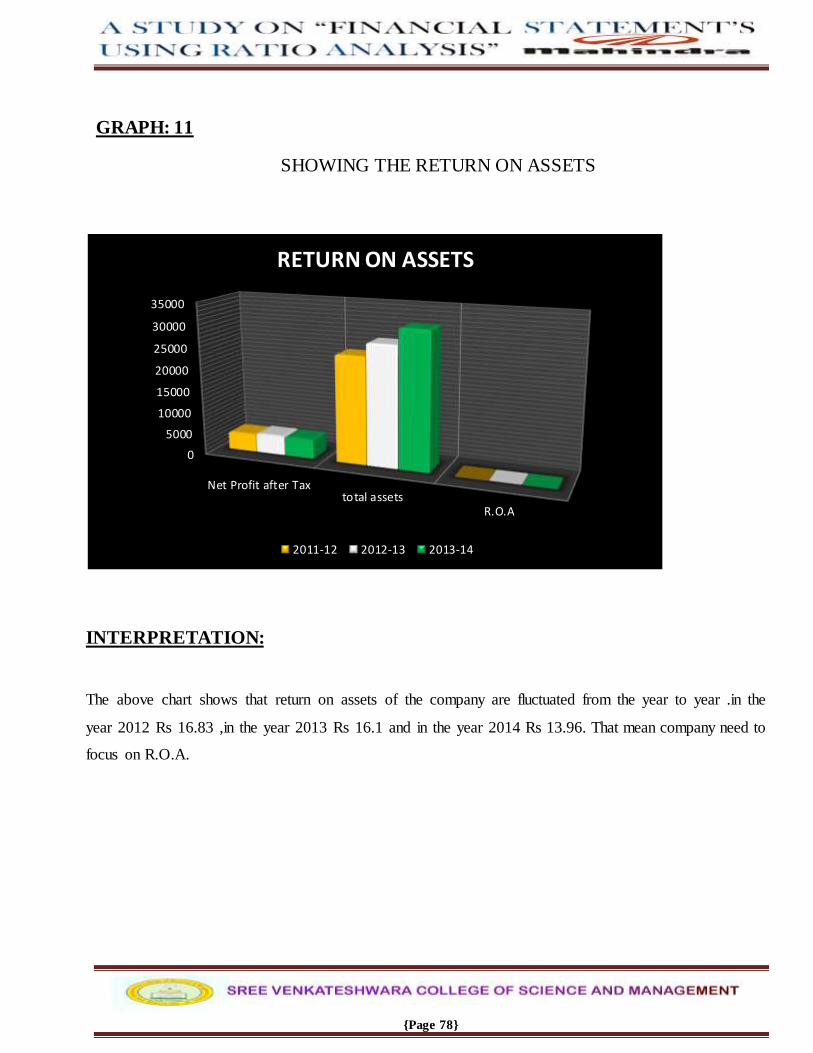
{Page 78}
GRAPH: 11
SHOWING THE RETURN ON ASSETS
INTERPRETATION:
The above chart shows that return on assets of the company are fluctuated from the year to year .in the
year 2012 Rs 16.83 ,in the year 2013 Rs 16.1 and in the year 2014 Rs 13.96. That mean company need to
focus on R.O.A.
0
5000
10000
15000
20000
25000
30000
35000
Net Profit after Taxtotal assets
R.O.A
RETURN ON ASSETS
2011-12 2012-13 2013-14
{Page 79}
TABLE NO: 12
OPERATING PROFIT RATIO
Particular 2011-12 (in cr) 2012-13 (in cr) 2013-14(in cr) Operating profit
3962.45
5439.20
5258.47
Sales
33531.33
40508.50
40441.16
Operating profit ratio
11.81
13.42
13.00
ANALYSIS:-
By the above table operating profit ratio in the year 2011-12 is Rs 11.81, in the year 2012-13 Rs 13.42
showing the increase but in the year 2013-14 Rs 13.00 shows the ratio decrease to 13.00.
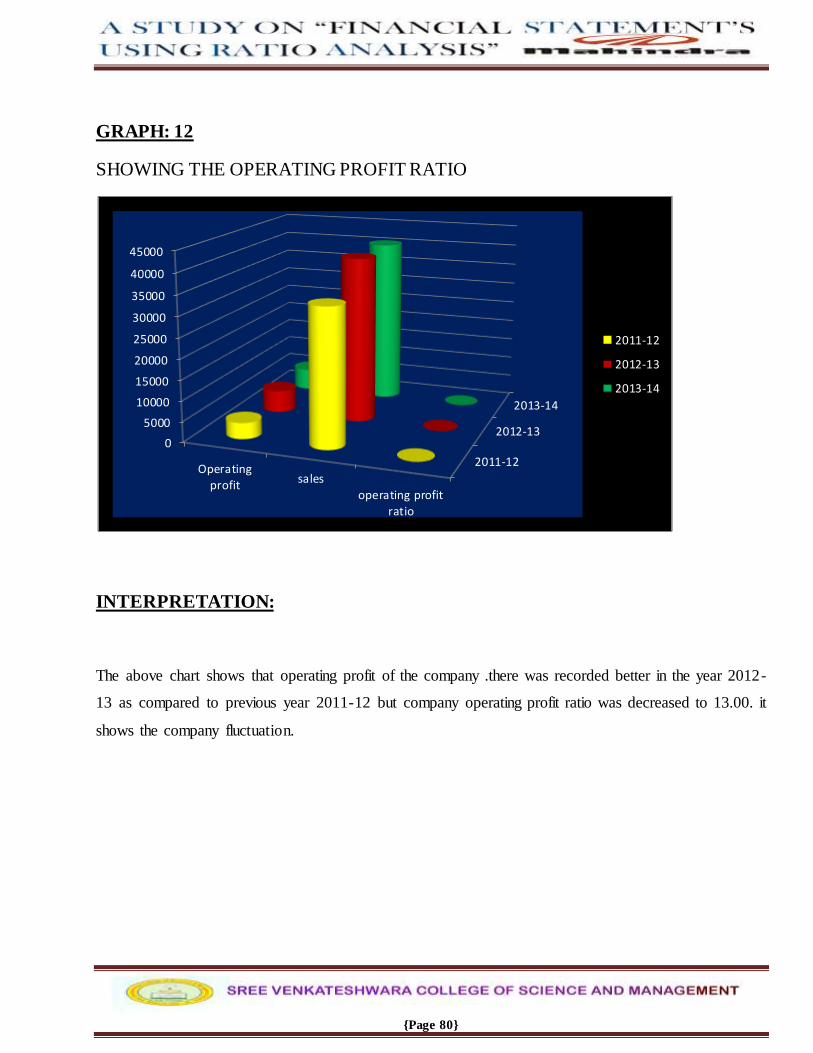
{Page 80}
GRAPH: 12
SHOWING THE OPERATING PROFIT RATIO
INTERPRETATION:
The above chart shows that operating profit of the company .there was recorded better in the year 2012-
13 as compared to previous year 2011-12 but company operating profit ratio was decreased to 13.00. it
shows the company fluctuation.
2011-12
2012-13
2013-14
0
5000
10000
15000
20000
25000
30000
35000
40000
45000
Operating
profitsales
operating profit
ratio
2011-12
2012-13
2013-14

{Page 81}

{Page 82}
CURRENT RATIO: -
By observing that current ratio is increased every year shows the better results in Mahindra and
Mahindra ltd.
DEBT-EQUITY RATIO :-
By observing the debt-equity ratio shows increase in every year even share holders fund also
increased year by year 2011-12 to current year 2013-14 in Mahindra and Mahindra ltd.
INTREST COVERAGE RATIO:-
By observing the above table interest coverage ratio is decreased year by year but fixed interest
charges is increased year by year in Mahindra and Mahindra ltd.
DEBTOR TURNOVER RATIO:-
In the year 2011-12 debtor turnover ratio is better but coming to 2012-13 &2013-14 is less than
2011-12.
FIXED ASSET TURNOVER RATIO:-
By knowing the fixed assets turnover ratio in the year 2011-12 is less but slight changes has
happen in 2012-13 7 2013-14 in Mahindra & Mahindra ltd .
WORKING CAPITAL TURNOVER RATIO :-
In the year 2011-12 Mahindra and Mahindra ltd working capital ratio is high but working capital
is less, in the year 2012-13 working capital ratio slightly decreased and it has continued in 2013-
14 coming to sales we can see the fluctuation and working capital is increased year by year.
GROSS PROFIT RATIO:-
By observing above table the gross profit ratio is decreased in 2012-13 &2013-14 comparing to
2011-12.

{Page 83}
NET PROFIT RATIO:-
In the year 2011-12 shows the good results then 2012-13 by in the year 2013-14 slight increased
in Mahindra and Mahindra ltd.
RETURN ON INVESTMENT:-
By observing the calculation of return on investment in the year 2011-12 investment is very
down comparing to further year and in 2012-13 returns on investment is better in Mahindra and
Mahindra ltd.
RETURN ON EQUITY:-
In the year 2011-12 returns on equity is increased year by year’s shows better results in
Mahindra and Mahindra ltd.
RETURN ON ASSETS:-
In the year 2013-14 we can find that return on assets is less comparing to previous year but total
assets shows the increase every year in Mahindra and Mahindra ltd.
OPERATING PROFIT RATIO:-
We can come to know that in the year 2011-12 operating profit ratio is less but in 2012-13 it has
increased again in the year 2013-14 slightly decreased in Mahindra and Mahindra ltd.
*****************************
CURRENT RATIO
Current ratio it very important .in Mahindra and Mahindra ltd current ratio is increased year by
year suggestion is to maintain the same results.
DEBT-EQUITY RATIO
By observing debt-equity ratio shows the slight increase year by year startlingly ratio was around
10.77 and in 2013-14 came to 11.00 in Mahindra and Mahindra ltd.
{Page 84}
INTEREST COVERAGE RATIO
In Mahindra and Mahindra ltd interest coverage ratio in the year 2011-12 is 192.03 ,in 2012-13 it
was around 175.36 7 & in 2013-14 increased to 144.98 suggestion is to maintain the same results
in further year .
DEBTOR TURNOVER RATIO
In Mahindra and Mahindra ltd debtors turnover ratio is very pathetic because lack of sales
suggestion is to increase in sales.
FIXED TURNOVER RATIO
By observing the fixed turnover ratio in the year 2011-12 is around 0.37 but it has increased in
2013-14 to 0.64 in Mahindra and Mahindra ltd.
WORKING CAPITAL TURNOVER RATIO
In working capital ratio show the pathetic results in 2011-12, 2012-13& 2013-14. Starting it was
around 50.88 but in 2013-14 it has decreased to 25.93.suggestion is to improve the sales.
GROSS PROFIT RATIO
In the year 2011-12 gross profit is Rs 34820 it as decreased in the year 2013-14 to 14452.50
results affected in gross profit ratio suggestion is to maintain good gross profit.
NET PROFIT RATIO
By observing the above table net profit ratio is decreased in 2012-13 but lots of efforts it has
recovered in 2013-14 my suggestion is to sell the product and need to increase sales.
{Page 85}
RETURN ON INVESTMENT
In Mahindra and Mahindra ltd return on Investment is increased from 2011-12 to2013-14 so
company need to maintain the same in further year.
RETURN ON EQUITY
In the year 2011-12 Mahindra and Mahindra ltd return on Equity is less but proper maintains it
shows better results in 2013-14 my suggestion is need to improve the share holder funds.
RETURN ON ASSETS
In Mahindra and Mahindra ltd return on assets is better in 2012, 13 but lack of net profit
company return on assets decreased in 2013-14 my suggestion is to improve in net profit by
sales.
OPERATING PROFIT RATIO
By observing the operating profit ratio shows good results year by year suggestion is to increase
in profit by selling Mahindra products then ratio will be increased.
@@@@@@@@@@@@@@
The study conducted by me on financial position using ratio analysis. I come to know the performance of
Mahindra and Mahindra ltd. their way of classification of assets and liabilities in the balance sheet.
classification of cost particulars their method of costing even I came to know the risks taken by Mahindra
and Mahindra ltd both financially and technically by calculating various types of leverages.
So thus projects is concluded with the composition of performance of Mahindra and Mahindra ltd by the
classification in terms of balance sheet ,profit and loss a/c ,trading account cost statements, progress
reports for 3 year along with this. I have identified several differences in the performance in Mahindra and
Mahindra ltd also given some suggestions to overcome those differences and problems.
{Page 86}

{Page 87}
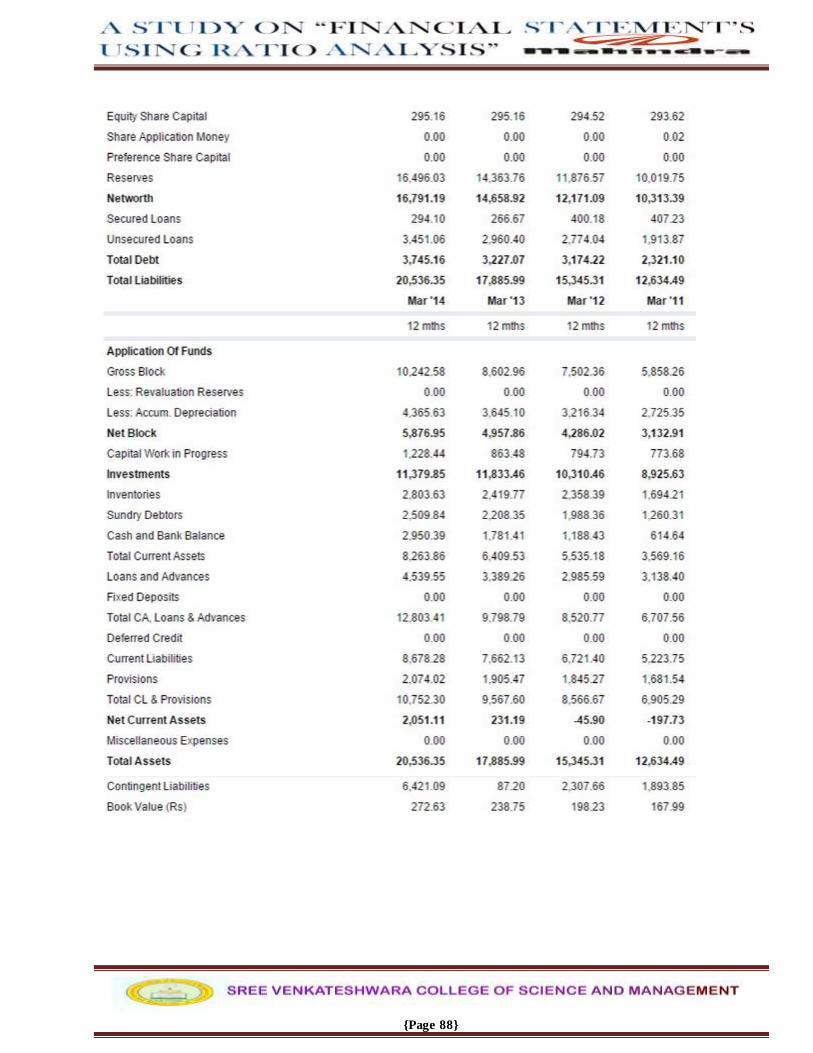
{Page 88}

{Page 89}
*-*-*-*-*-*-*-*-*-*-*-*-*-*-*
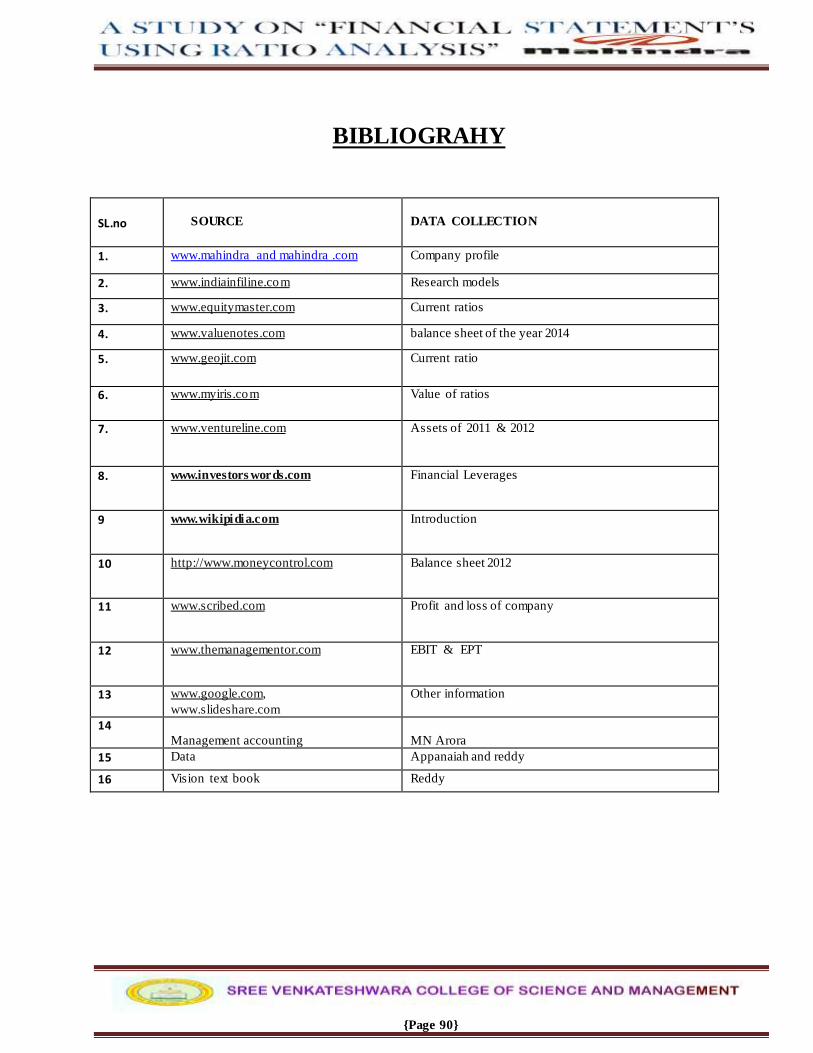
{Page 90}
BIBLIOGRAHY
SL.no
SOURCE
DATA COLLECTION
1. www.mahindra and mahindra .com Company profile
2. www.indiainfiline.com Research models
3. www.equitymaster.com Current ratios
4. www.valuenotes.com balance sheet of the year 2014
5. www.geojit.com Current ratio
6. www.myiris.com
Value of ratios
7. www.ventureline.com
Assets of 2011 & 2012
8.
www.investors words.com Financial Leverages
9 www.wikipidia.com Introduction
10 http://www.moneycontrol.com
Balance sheet 2012
11 www.scribed.com Profit and loss of company
12 www.themanagementor.com EBIT & EPT
13 www.google.com,
www.slideshare.com
Other information
14
Management accounting
MN Arora
15 Data Appanaiah and reddy
16 Vision text book Reddy


