
Correspondence: E-mail: [email protected] Website: www.fjst.org
FUNAI Journal of Science and Technology
3 (1), 2017, 110-123
A COMPARATIVE STUDY OF PROFILE PERMEABILITY AND AIR
PERMEABILITY IN RESERVOIR CHARACTERIZATION: THE CASE OF GX 2
WELL IN WESTERN NIGER DELTA BASIN
Otosigbo, Gloria Ogochukwu
1 , Nzekwe, Kenneth Emeka
2 , Eluwa, Ndidiamaka Nchedo
1
1. Department Of Physics/Geology/Geophysics, Federal University, Ndufu-Alike, Ikwo,
2. Delta Terratek Laboratories Limited, Ajah, Lagos State
(Received 4 February, 2017; Revised 19 June 2017; Accepted:23 June, 2017)
Abstract
Profile permeability has been compared to air permeability to ascertain the prospect of using it as a cost
effective method determining core permeability in reservoir characterization. The study was carried out
using pressure decay permeameter (PDPK-300™). Plugs were extracted of oil prior to measurements in
the case of permeability while in profile permeability the oil was not extracted from the cores. Plugs
dimensions, Length (L) and diameter (D) were taken to be imputed in the Darcy’s equation. In probe
permeability, the ratio of the external radii, ro to internal radii, ri of the probe tip was used to calculate a
dimensionless geometrical factor, Gf with several limiting factors. During air permeability
measurements, the cylindrical plugs were confined one at a time in Hassler cell while in probe
permeability, the slabbed cores were not confined. In GX well, the results of profile permeability (Kp)
were compared with that of air permeability (Ka) at 27 points. Air permeability (Ka) values ranged from
121md to 2870md while probe permeability ranged from 33.9 to 2190mD. The mean values calculated
were 956 and 1001mD respectively for Ka and Kp. A plot of Ka and Kp(log10) versus Depth (ft) revealed
that major deviations were observed at depth between 7265ft(2421.6m) and 7272ft(2424.0m) and also
between the depth 7253ft(2417.6m) and 7256ft(2418.6), which corresponds to Silty Sandstones (high
permeable zone) and Shaly sand (low permeable zone) intervals respectively. A linear graph of profile
permeability versus air permeability reveals that the general regression R2 is 0.212 while the linear
equation is Y = 0.840X, which is equivalent to Kp = 0.840Ka. The deviation of probe permeability values
from air permeability could be caused by coarse surface of sand grains resulting to imperfect sealing of
the probe tip against the core surfaces, heterogeneity caused by bioturbations and diagenetic features
which were accounted for by close samplings and dimensionless geometrical factor lapses.
Keywords: core analysis, profile perm, geometric factor, Darcy

A comparative study of profile permeability... Otosigbo, et. al.,
FUNAI Journal of Science and Technology, 3(1), 2017 Page 111
1. Introduction
Petrophysical properties of sedimentary rocks
are decisive parameters for the quantitative
and qualitative evaluation of reservoir
rocks.Permeability (K) is one of the most
important quantitative parameter for reservoir
which describes the magnitude of flow
through porous rock. Reservoir engineers are
faced with challenges of the equipments and
methods of obtaining accurate permeability
results. More often, different equipments are
used in combination to obtain dependable
results. Reliable permeability values are a
prerequisite for the assessment and modelling
of hydrocarbon reservoirs (Li et al., 1995;
Branets et al., 2009), their economy and
sustainable production (Davies and Davies,
2001; Dutton et al., 1991). They are also
crucial for hydrological studies (Huysmans et
al., 2008; Todd and Mays, 2005). In core
samples, permeability is determined on core
plugs or slabbed cores using gas or liquid
phase. The experiment could be carried out
under steady state or unsteady state. Steady
state flow is where the external temperature
and pressure remains constant throughout the
experiment. The pressure fall-off or pulse
decay flow could be run under steady state.
The flow could be applied axially, transverse
or radially on the core plugs or slabbed cores.
Each method has its advantages and
limitations. For the purpose of this study, gas
phase under steady state have been chosen for
both probe permeameter and air permeameter
method. Both approach are normally
corrected for Klinkenberg(1941) effect .
Klinkenberg effect is as a result of the
slippage of gases along the pore walls which
gives rise to an apparent dependence of
permeability on pressure because gas does not
adhere to the pore walls as liquid does. Often
times, reservoir engineers use more than one
method in combination to achieve accurate
results. Economy and time are also crucial to
the management in preparation to production
of crude oil. Probe permeameter is a fast, easy,
and non destructive equipment used to
measure the permeability at very closed
interval of 1cm. It has the advantage of
obtaining 3D permeability image where cores
from 3 wells are available with their
geographical coordinates. The air permeability
using core plugs is a time consuming method
but it has the advantage of obtaining oil/water
saturation, pore volume/porosity, and easily
solve the problem of geometry resolution
since plugs have definite shapes. This study
critically evaluated the accuracy and reliability
of the profile permeability method compared
to that of air permeability results. Also, to see
the possibility of using probe permeability

A comparative study of profile permeability... Otosigbo, et. al.,
FUNAI Journal of Science and Technology, 3(1), 2017 Page 112
results independently for reservoir
characterization.
1.1. Geology of the Study Area
Study cores were taken from GX2 well in
Western Niger Delta Basin (Fig 1). The well is
situated within the coastal swamps depobelts.
From bottom to top, the Niger Delta consists
of three formations; Akata Formation, Agbada
Formation and Benin Formation. The three
diachronous Formations (Akata, Agbada and
Benin) in the Niger Delta were deposited in
each of the five depobelts shown in Fig. 1.
The depobelts are 30–60 km with the oldest
northward while progradation is 250 km
south-westward over oceanic crust into the
Gulf of Guinea (Stacher, 1995). The
interaction of sagging and rate of sediment
supply caused deposition of each depobelt
(Doust and Omatsola, 1990). These depobelts
are in separate unit and represent a break in
regional dip of the delta and is confined
landward by growth faults and basin-ward by
large counter regional faults or the growth
fault of the adjacent basin-ward belt (Evamy
et al., 1978; Doust and Omatsola, 1990).
These depobelts are characterized by distinct
sedimentation, deformation and petroleum
history (Michele et al., 1999). The Akata
Formation which comprises at least 6500m of
marine clays with silty and sandy interbeds
(Whiteman,1982). The Agbada Formation
(petroleum bearing unit), which is
characterized by paralic to marine coastal and
fluvial-marine deposits mainly composed of
sandstones and shale organized into
coarsening upward off-lap cycles (Weber,
1987).
The Benin Formation consists of continental
and fluvial sands, gravel, and back swamp
deposits (2500 m) thick (Reijers (2011). The
sedimentation in each depobelts was caused
by deposition and sedimentation rate with syn-
sedimentary growth fault upsetting the balance
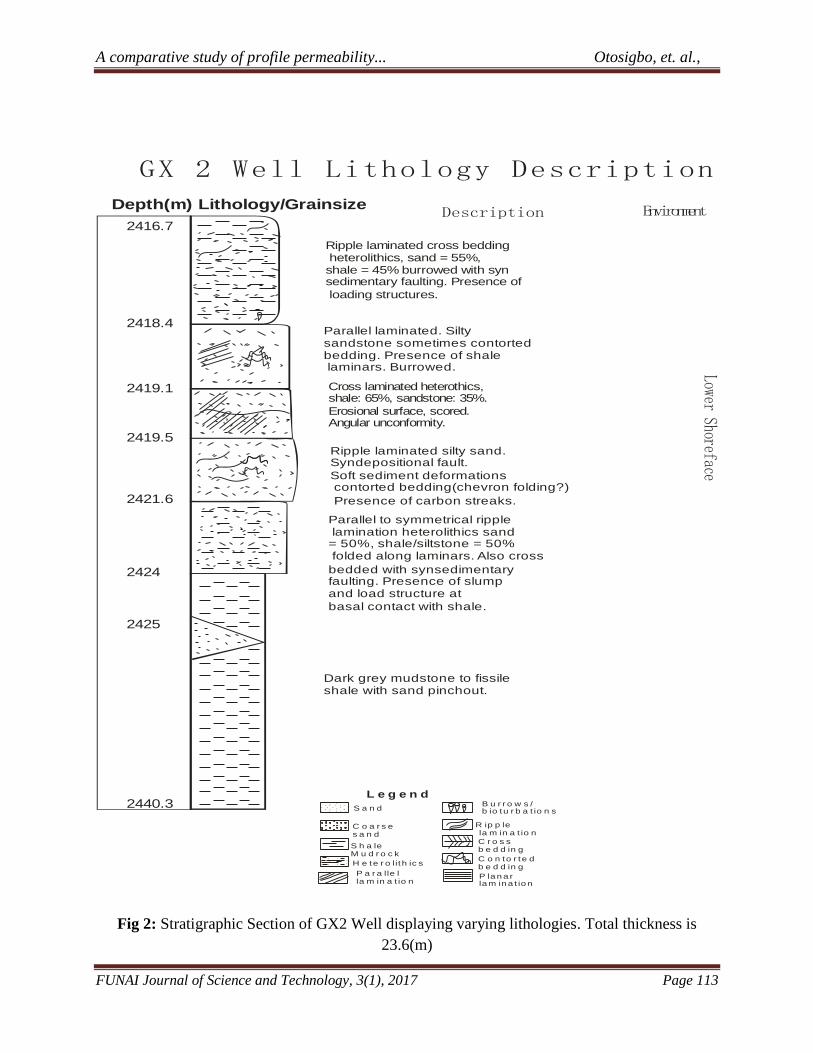
(Evamy et al., 1978). The local stratigraphy
section of the studied well is shown in fig 2.
Total depth of core ranged from 7250ft
(2416.7m) to 7273ft (2440.3m).
Fig. 1: Location of the studied well, GX2
within Coastal Swamp Depobelts.
A comparative study of profile permeability... Otosigbo, et. al.,
FUNAI Journal of Science and Technology, 3(1), 2017 Page 113
Dark grey mudstone to fissile shale with sand pinchout.
Depth(m)
2416.7
2418.4
2419.1
2419.5
2421.6
2424
2425
2440.3
Parallel to symmetrical ripple lamination heterolithics sand = 50%, shale/siltstone = 50% folded along laminars. Also cross
bedded with synsedimentaryfaulting. Presence of slump and load structure at
basal contact with shale.
Ripple laminated silty sand. Syndepositional fault.
Soft sediment deformations contorted bedding(chevron folding?)
Presence of carbon streaks.
Cross laminated heterothics, shale: 65%, sandstone: 35%.
Erosional surface, scored. Angular unconformity.
Parallel laminated. Silty sandstone sometimes contortedbedding. Presence of shale laminars. Burrowed.
Ripple laminated cross bedding heterolithics, sand = 55%,shale = 45% burrowed with syn sedimentary faulting. Presence of
loading structures.
Lithology/Grainsize
Lower Shoreface
Description Environment
. . .. . . .... .. ...
.... ..
. ..... . .. . .
L e g e n d
S a n d
R ip p le la m in a t io n
C r o s s b e d d in g
C o n to r te d b e d d in g
P la n a r la m in a t io n
P a r a lle l la m in a t io n
C o a r s e s a n d
S h a leM u d r o c k
H e te r o lith ic s
B u r r o w s /b io tu r b a t io n s
GX 2 Well Lithology Description
Fig 2: Stratigraphic Section of GX2 Well displaying varying lithologies. Total thickness is
23.6(m)

A comparative study of profile permeability... Otosigbo, et. al.,
FUNAI Journal of Science and Technology, 3(1), 2017 Page 114
2. Methodology
The two methods used are Air Permeability
using Gas permeameter and Profile
Permeability using mini-permeameter.
2.1. Air permeability-Steady State Method
Permeability was carried out on 27 plugs (Fig.
3) drilled from the cores horizontally to the
sedimentary bedding surface. Three plugs
were drilled in every 3feet core. These plugs
were extracted of oil and water and dried to
constant weight for three days. The
dimensions of the plugs were taken with
calliper to calculate L and A for Darcy’s
equation. The gas permeameter used is a
steady state device using nitrogen gas. The
plugs were confined under pressure of 400psi
in Hassler’s cell one at a time. The gas flow
was axial. Nitrogen gas known viscosity is
injected into the core plug while mounted in a
steel chamber. Inlet pressure was measured
directly at the input sample face using
pressure transducers calibrated to measure
high, medium and low permeability. The
apparatus used was dependent upon the
pressure drop measured across the sample.
Exit pressure was measured at the pressure
transducers. Flow rate was measured directly
by flowing soap film through a graduated
burette. The principal is based on Darcy’s
equation for laminar flow. The average of
three measured consecutive flow rates was
used to calculate the final reported
permeability value.
Fig 3: Plug sample for Air permeability
Permeability, K is calculated in accordance
with Darcy’s Law (1856) as:
Where,
K: permeability in millidarcys,
Q: flow rate in cm3/s
η: viscosity of nitrogen in centipoises
L : the length of sample in cm
A: sample cross-sectional area in cm2
ΔP: pressure difference between the injection
and outflow in PA.
2.2. Probe (Profile) Permeability-Pulse
Decay Method
Profile permeability was run using Pressure
Decay Profile Permeameter (PDPK 300TM)
on the cores slabbed perpendicular to their
bedding surfaces (Jones, 1992). The cores
PA
LQK

A comparative study of profile permeability... Otosigbo, et. al.,
FUNAI Journal of Science and Technology, 3(1), 2017 Page 115
were not extracted of hydrocarbon. The cores
were marked with meter rule at 30 equal
points interval in a 3-feet or 1 metre. The
slabbed core sample was placed onto a core
rack. The probe assembly and the core rack
were moved to a desired measurement
location (Fig 4). The probe was lowered
pneumatically, and its rubber tip was sealed
against the sample. The valve was opened and
gas was flowed through the sample at a
constant measured pressure of about 24.7psi.
The computer system connected to the
permeameter arrangement reads out the flow
rate, temperature and pressures while it
decayed and stabilized. The permeability
reading at stabilization was taken against the
depth and recorded. The procedure was
repeated point to point to obtain a profile cm-
cm. In profile permeability, probe tip was
placed on the slabbed core and the region of
the gas flow was hemispherical. The
geometrical factor (half space solution) was
modelled using the internal and external radii
of the probe tip. Since, it is almost impractical
to obtain a true hemispherical geometry (API,
1998). Goggin, et al.(1988) performed
numerical calculations to produce
dimensionless geometrical flow factors that
account for the lack of a hemispherical cavity
on the surface of a small, finite sample, and a
robe seal of small, finite interior and exterior
radii.
Fig 4: Probe Permeameter in use:
Photographed at Delta Terratek Limited
Laboratory, Lagos.
Fig 5. Schematic Diagram of Steady State
Probe Permeameter ( After API, 1998)
These dimensionless factors are displayed in
Fig 5 as a function of the ratio of the outer
radius, ro, of the probe seal to its inner radius,
ri. The value for Go for true hemispherical is
2π. This is applicable with little error on
samples where depth is at least 4 times the

A comparative study of profile permeability... Otosigbo, et. al.,
FUNAI Journal of Science and Technology, 3(1), 2017 Page 116
Fig 6: Dimensionless Geometric Factor for
Measurements with Probe Permeameter. After
Goggin et al. (1988)
radii of the interior of probe seal and where
the lateral boundary is at least 4ri from the
axis of the probe. Geometrical factor Gf is
given by the equation:
iof rGG
Where G0 is obtained from Goggin et al
(1988) (fig 6) to account for hemispherical
and ri is the interior diameter of the probe. Gf
is substituted for L/A in Darcy’s Equation
above.
The probe permeability Kp, is given by
Where:
Q = Flow rate in cm3/s
η = Viscosity of Fluid(Nitrogen gas) in
centipoise
ΔP = Change in pressure
A total of 240 points were run and
permeability values calculated automatically
by the software attached to the system were
recorded against depth.
3. Result and Discussion
The results of the 240 points run for probe
permeability were plotted against the depth in
feet as shown in Fg 6. High permeability
readings were observed at the mid section of
the log around 7258ft depth. This region
consists mainly of silty sand From 7265ft, the
permeability values were lowered, probably
owing to increasing clay contents. This
decreasing permeability is an indication of
decreasing grain sizes as a result of reduced
porosity . Air permeability results were
compared with that of profile permeability at
27 points and the result is shown in Table 1.
The values of air permeability ranged from
121md to 2870md while probe permeability
ranged from 33.9 to 2248mD.
The general results have been grouped into
three ranges of permeability for the dominant
lithology types in the study area as shown
below.
Quality Range Lithology
Type
High
permeability
1000 –
2870mD
silty Sand
Medium
Permeability
200 -
<1000mD
Heterolithics
Low
permeability
<200 –
39mD
sandy Shale
P
rGQK io
p

A comparative study of profile permeability... Otosigbo, et. al.,
FUNAI Journal of Science and Technology, 3(1), 2017 Page 117
Probe permeability( Kp) values were higher
than that of air permeability(Ka) at some,
while air permeability are higher at some other
regions. It was observed from the Table 1, Fig
7 and Fig 8 that the values of probe
permeability were mostly higher than that of
air permeability at silty sandstone zones. This
is because of the reasons discussed later on.
Fig. 6: Depth versus profile permeability Log
run at Delta Terratek Laboratory
The values of air permeability were mostly
higher than that of probe permeability at sandy
Shale zones which is low permeable zones.
The cross plots of permeability values from
probe method and gas permeameter shows fair
correlation of both at medium permeable
layers (Fig 7). The regression, R2 = 0.212,
while the linear equation is Y = 0.840X,
which is equivalent to Kp = 0.840Ka or Ka =
1.25Kp or Ka = Kp125%. The air
permeability (Ka) is higher than probe by
25%.
The graph of air and probe permeability
versus depth confirms the deviation at depth
between 7265ft(2421.6m) and 7272ft(2424m)
and also between the depth 7253ft(2417.6m)
and 7256ft(2418.3m)(Fig 8). These depth
ranges were silty Sandstones: high permeable
zone and sandy Shale: low permeable zone
respectively. The graph of depth versus
permeability deviation also revealed the major
deviations at the above depth intervals. For
permeability <100mD, there was significant
deviation of probe from that of air
permeability result (Fig 8). The results affirms
Filomena (2014) conclusion that profile
permeability results show apparent aberration
from air permeability results for low
permeable rocks (<10mD). The large
discrepancy of the probe results from that of
air at the sandy zone could be as a result of
rough surface which eventually affected the
sealing quality of the probe. A leak tightness
and suboptimal probe tip sealing apparently

A comparative study of profile permeability... Otosigbo, et. al.,
FUNAI Journal of Science and Technology, 3(1), 2017 Page 118
lead to higher permeability values for probe
than that of air. On the other hand, preferential
flow in Hassler’s cell mainly contributes to the
overall air permeability of the sample. A
technical explanation for underestimation of
probe minipermeameter recordings at the
Shale region could be that a strong contact
pressure of the minipermeameter probe may
slightly force the sealing rubber towards the
inner part of the probe tip (Filomena et. al.,
2014). This would also narrow the inflow
/outflow tube diameter to a certain degree.
The effect of a reduced in- or outflow
diameter then results in lower permeability.
Another reason for low values of probe
permeameter is as a result punctual
preferential flow which takes care of
heterogeneity in rocks. Non homogeneity is
caused by diagenetic minerals (e.g. sideritic
clasts), sedimentary structures types,
bioturbations and sedimentary structures (Fig
2). Natural rocks are not isotropic.
Table 1: Comparison of Profile Permeability and Air Permeability at depth.
Depth ft Probe
permeability(mD)
Air
permeability(mD)@
400psi
Permeability
Deviation(mD) lithology
7251.65 251 288 37 Shaly Sand
7252.75 112 174 62 Shaly Sand
7253.70 33.9 865 831.1 Shaly Sand
7255.35 1304 121 1183 Shaly Sand
7255.55 1551 1138 413 Silty Sand
7256.60 1567 1449 118 Silty Sand
7256.90 1081 1896 815 Silty Sand
7257.20 1094 532 562 Silty Sand
7260.30 2244 1656 588 Silty Sand
7260.55 1603 2870 1267 Silty Sand
7260.90 2190 2644 454 Silty Sand
7261.15 1771 2493 722 Silty Sand
7262.30 1494 1468 26 Silty Sand
7263.50 992 1465 473 Silty Sand
7265.40 553 571 18 Heterolithics
7265.70 1195 856 339 Heterolithics
7266.30 650 277 373 Heterolithics
7266.75 540 545 5 Heterolithics

A comparative study of profile permeability... Otosigbo, et. al.,
FUNAI Journal of Science and Technology, 3(1), 2017 Page 119
7266.45 591 432 159 Heterolithics
7266.90 1270 616 654 Heterolithics
7268.30 537 269 268 Heterolithics
7268.50 831 562 269 Heterolithics
7270.15 935 1129 194 Heterolithics
7270.30 1157 259 898 Heterolithics
7270.80 454 262 192 Heterolithics
7271.10 668 247 421 Heterolithics
7271.75 350 715 365 Heterolithics
Fig 7: Cross plots of Air Permeability and Probe permeability showing equation and Regression,
R2

A comparative study of profile permeability... Otosigbo, et. al.,
FUNAI Journal of Science and Technology, 3(1), 2017 Page 120
1
10
100
1000
10000
7250.00 7255.00 7260.00 7265.00 7270.00 7275.00
Perm.Kair(mD)
Profileperm
CrossplotofAirpermeabilityandProbePermeabilityVersusDepth
Depth(ft)
B
A
Fig 8: Air Permeability/Probe permeability versus Depth showing depth ranges of major
deviations
Fig 9: Graph of Depth versus Permeability Deviation showing zones of major and minor
deviations and corresponding lithologies

A comparative study of profile permeability... Otosigbo, et. al.,
FUNAI Journal of Science and Technology, 3(1), 2017 Page 121
The efficiency of probe method is very
sensitive to a lot of factors which sometimes
are impractical to control (API, 1998). For
example, the tip seal should be laterally
confined and essentially flat on the bottom (in
the unstressed condition) because it affects the
sensitivity of the geometric factor. The
dimensionless geometrical factor could cause
overestimation or underestimation of probe
permeability results. Flat smooth surface of
the slabbed core is needed for perfect sealing
of the probe, but it is hard to guarantee.
Erroneous permeability values are obtained
when the surface of the core is not dry because
of severe relative permeability of fluids. The
presence of oil in the core during probe
permeability measurements gives an effective
permeability but could not be relied upon
because the slabbed surface could cause
evaporation of oil especially after a long time
and repeated measurements could vary
considerably. Repeated measurements of air
permeability on plug samples gives virtually
same result because of oil extraction.
Therefore air permeability results are
standardized and preferable to profile
permeability because the results are constant
over the years.
Summary and Conclusions
Probe permeameter has the advantage of
providing closely spaced, non-destructive
permeability data, which are mostly suitable to
get 3-D permeability when up to 3 wells are
known with their geographical locations. The
close spacing of results do account for
heterogeneity of reservoir rocks. Sometimes,
its results are overestimated than air
permeability which could be caused by several
factors such as imperfect sealing of probe tip
against the slabbed surface, incomplete flat
surface of the slabbed cores and lapses of
dimensionless geometrical factor. Also,
because slabbed cores were not cleaned of oil,
effective permeability values were obtained.
But, then, the values could vary considerably
with time when the surfaces are exposed and
fluids continue to evaporate. It is difficult to
mimic the reservoir pressure condition for
probe permeability in the laboratory unlike
gas driven permeability where plugs could be
confined to actual pressure of the reservoir
during analysis. The Air permeability method
using Hassler’s cell is more accurate and
consistent than probe (profile) permeability
with the following reasons. The plugs were
extracted of hydrocarbon and dried to stable
weight and this ensures consistent results any
time irrespective climate. Secondly, length (L)
and area(A) were defined by the cylindrical

A comparative study of profile permeability... Otosigbo, et. al.,
FUNAI Journal of Science and Technology, 3(1), 2017 Page 122
plugs which readily adapt to Darcy’s equation
. Also, the method makes it easier to calculate
pore volume, porosity and oil/water saturation.
Major deviations of Profile permeability
results were observed in low permeable rocks
(heterolithics rock or shaly rocks), therefore
accuracy was poor in shaly rocks(Filomena,
2014) and method should not be used in low
permeable rock such as shales and muddy
sandstones. Irrespective of speed and close
data range of permeability and 3D gain using
probe permeameter (PDPK 300Tm), profile
permeability results should not be used
independently in reservoir evaluation.
Filomena et al (2014) analysis using probe
meter (PDPK 400Tm) reveal that air
permeability results were higher than that of
probe by 37% while the present analysis with
probe meter(PDPK 300Tm) reveal that air
permeability results were higher than probe by
25%. There is quite a similarity in the results.
Probe permeability results are fairly accurate
but results should be calibrated with air
permeability results.
References
Branets, L. V., Ghai, S. S., Lyons, S. L., and
Wu, X.-H., (2009). Challenges and
technologies in reservoir modeling,
Commun. Comput. Phys., 6, 1–23.
Darcy, H., (1856). Les fontaines publiques de
la ville Dijon, Dalmont, Paris, 674 pp.
Davies, J. P. and Davies, D. K., (2001).
Stress-dependent permeability:
characterization and modeling, SPE J., 6,
224–235.
Doust, H., Omatsola, E., (1990). Niger Delta.
In: Edwards, J.D., Santogrossi, P.A.
(Eds.), Divergent/PassiveMargin Basins
AAPG Memoir Vol. 48. American
Association of Petroleum Geologists,
Tulsa, pp. 239–248.
Dutton, S. P., Laubach, S. E., and Tye, R. S.,
(1991) Depositional, diagenetic, and
structural controls on reservoir properties
of lowpermeability sandstone, Travis
Peak Formation, East Texas, Gulf Coast
Assoc. Geol. Soc. T., 41, 209–220.
Evamy, B.D., Haremboure, J., Kamerling, P.,
Knaap, W.A., Molloy, F.A., Rowlands,
P.H., (1978). Hydrocarbon habitat of
tertiary Niger Delta. Am. Assoc. Pet.
Geol. Bull. 62,277–298.
Exploration and Production Department,
(1998). Recommended Practices For Core
Analysis, American Petroleum Institute
Publishing Services, Washington D. C.
Filomena C. M., Hornung J. and Stollhofen
H., (2014). Assessing accuracy of gas-
driven permeability measurements: A
comparative study of diverse Hassler-cell

A comparative study of profile permeability... Otosigbo, et. al.,
FUNAI Journal of Science and Technology, 3(1), 2017 Page 123
and probe permeameter devices, Solid
Earth, 5, 1–11.
Goggin, D. J., Thrasher, R. L., and Lake, L.
W., (1988). A Theoretical and
Experimental Analysis of
Minipermeameter Response Including
Gas Slippage and High Velocity Flow
Effects, In Situ, 12, No. 1 & 2, 79-116.
Huysmans, M., Peetersa, L., Moermansa, G.,
and Dassarguesa, A., (2008). Relating
small-scale sedimentary structures and
permeability in a cross-bedded aquifer, J.
Hydrol., 361, 41–51,
Li, D., Cullick, A. S., and Lake, L. W., (1995).
Global scale-up of reservoir model
permeability with local grid refinement, J.
Petrol. Sci.Eng., 14, 1–13.
Michele, L.W., Tuttle, R.R.C., Michael, E.B.,
(1999). The Niger Delta Petroleum
System: Niger Delta Province, Nigeria,
Cameroon, and Equatorial Guinea,
Africa. Open File Report 99-50H.
Department of Interior, U.S. Geologic
Survey (35 p.).
Reijers, T.J.A., (2011). Stratigraphy and
sedimentology of the Niger Delta Basin.
Geologos 17,133–162.
Stacher, P., (1995). Present understanding of
the Niger Delta hydrocarbon habitat. In:
Oti,M.N., Postma, G. (Eds.), Geology of
Deltas. A.A. Balkema, Rotterdam, pp.
257–267.
Todd, D. K. and Mays, L. W., (2005).
Groundwater Hydrology, 3rd Ed.,Wiley,
Hoboken, USA, 636 pp.
Weber, K.J., (1987). Hydrocarbon distribution
patterns in Nigerian growth fault
structures controlled by structural style
and stratigraphy. J. Pet. Sci. Eng. 1, 91–
104.
Whiteman, A., (1982). Nigeria: Its Petroleum
Geology, Resources and Potential.
Grahamand Trotman, London 394 pp.


