
9. November 2005
Experts’ consensus building on technology risks
(Expert judgments on phytoremediation: The role of self-confidence in averaging
procedures and Formative Consensus Building (FCP) for predicting technology
risks; submitted)
Roland W. Scholz

What will be told1. Theoretical motivation: Statistical versus consensus
building procedures; the role of expert’ confidence2. The case of phytoremediation in Dornach
• The situation• Technology application, uncertainties and technology
performance3. The procedure4. Results:
Quantitative results: Is “averaging about all” experts the best strategy?
Qualitative results: What are the potential and limits of consensus building procedures
5. Conclusions/Discussion
Overview

What to do, if
• you have a new technology/medicine/educational program at hand and want to reduce the number of accidents/diseases/failure rate
• the situation of technology application is ‘overly’ complex (cause impact relationships are multi-layered) and not completely known
• empirical evidence is limited (no “von Mises-Reichenbach situation”)
• Expert opinions diverge
1. Motivation

and you are interested in
• the range of outcomes after applying Tech A (i.e. statements such as: “The failure/ mortality rate will be between x% and y%.”)
• the probability distribution on the reduction rate r [p(r < C) = z%]
1. Motivation

Two approaches
A) Statistical models (e.g. Johnson, Budescu, & Wallsten, 2001: Averaging when maximizing independence among experts in “formative measurement procedures”)
B) Consensus building procedures (e.g. Susskind, 1999: Organizing “open but mediated processes on what will be judged and which questions to be answered”)
1. Motivation

2. The case
Metallmill
The situation in Dornach:“Large scale” contaminantion
with Cadmium, Copper, and Zinc

2. The case

Is the flowerful technology of phytoremediation also a
powerful one?
2. The case

Zn Cu
How Phytoremediation Works
Soil parameterspH, clay, conductivity, …
Acquisition
Constraints
-accessibility of heavy metals-low/medium contamination-time …?
Cropping conditions
2. The case

Key questions: Range/Bounds
“If a model lot will be treated for ten years, the cadmium (copper, zinc) concentration will have a value between ___ mg Cd/Cu/Zn per kg dry matter of soil and ___ mg Cd/Cu/Zn per kg dry matter of soil?”
• Expert k’s estimation of lower bound concentration of the pollutants Cd/Cu/Zn
• Expert k’s estimation of upper bound concentration of pollutants Cd/Cu/Zn
Dependent variables

Key questions: Probabilities on Remaining Concentrations
•Experts probability judgments on attaining a remaining degree of contamination r
•Question on p(remaining concentration<r)–Cd: 80%, 20%, 50%, 91%, 90%, 99%, 30%, 70%,
1%, 40%, 60%, 10%–Cu: 90%, 99%, 30%, 70%, 1%, 40%, 60%, 10%–Zn: 80%, 30%, 10%, 99%, 50%, 95%, 20%, 1%
Dependent variables

Fishing in a pool of experts• Large scale eight-year national environmental
research program on soil remediation• Project cluster of six projects on phytoremediation in
Dornach (about 25 researchers) • 10 Experts from this cluster with backgrounds biology,
chemistry, environmental engineering, mathematics, decision sciences and specialized knowledge on soil chemistry, biological mechanisms of heavy metal accumulation in plants, sampling and data analysis, or designing large-scale remediation engineering applications
Expert sample

1. What could/should be answered (sample lot, soil parameters, technology, key questions)
2. Gathering and disseminating documented expertise (“Multi-disciplinary state of the art knowledge”; 79 pages)
3. Questionnaire with key questions on• Ranges• Probabilities of attaining certain
reductions (ca. 10 reduction rates asked per heavy metal)
4. Experts got detailed (anonymized) information about all experts’ judgments
5. Consensus building workshop
6. Signing a public statement
Procedure

H1 Experts confidence provides validity
• Experts’ that feel more confident are more valid in the sense that they deviate less from the real/superexpert’s judgments
Further: The judgments of the high confidence group is more homogeneous than a low confidence group
4. Hypotheses

H2 Statistical models to be compared
1. High confidence: average among high confidence experts (N = 4)
2. Low confidence: Average among low confidence experts (N = 5)
3. Average all (N = 9)4. Median (N = 9)5. Maxcorr: Average among high correlated
experts (N = 4)6. Mincorr: Average among low correlated expert
4. Hypotheses
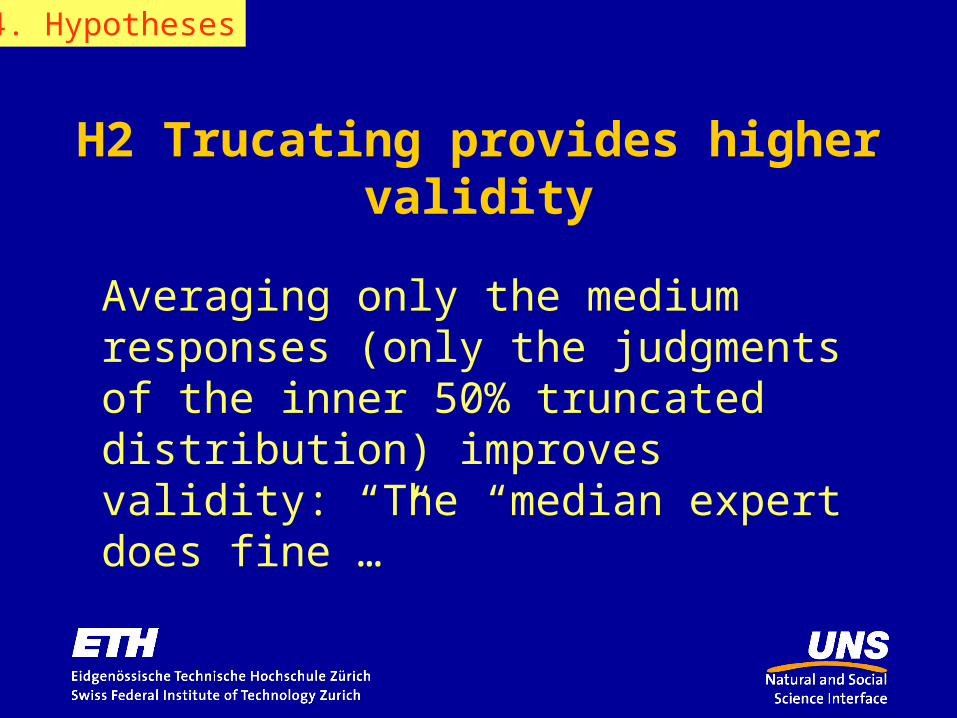
H2 Trucating provides higher validity
Averaging only the medium responses (only the judgments of the inner 50% truncated distribution) improves validity: “The “median expert does fine …”
4. Hypotheses

H3 Showing low correlations in an expert pool is not an indicator of expertise
• Higher correlated experts provide more valid mean estimates (compared to a superexpert) than low correlated experts
(In contradiction to Johnson et al. 2001)
4. Hypotheses

“H4” Consensus Building does/ does not provide new
resultsNot a straight hypothesis; more an exploratory one
• Consensus building provides more reliable/valid vs. fuzzier statements than statistical models
• The high confidence group is the base line
4. Hypotheses

H1 Mean bounds of high and low confidence group differ
Estimates of upper and lower bounds:•Means differ (Factor 2; in general not significant)
•Variances differ significantly; low confidence experts are less homogeneous (show more variance)
(see Table 1)
4. Results

H1 Mean bounds of remaining concentr. of high and low confidence group differ
4. Results
Estimate
Means and
N of low-
confidence
group
Means and
N of high-
confidence
group
p-values
of Mann-
Whitney
U-test
Variances
of low-
confidence
group
Variances
of high-
confidence
group F p
Lower
bound 1.12 (5) 1.90 (4) .16 1.13 0.90 17.10 <.005
Cd Upper
bound 1.77 (5) 2.10 (4) .52 1.75 0.65 7.48 <.03
Lower
bound 351 (4) 425 (5) .55 5.0 166.4 4.68 .07
Cu Upper
bound 332 (5) 422 (5) .53 1.7 152.3 5.32 .06
Lower
bound 327 (5) 525 (4) .14 16.9 152.8 5.99 <.05
Zn Upper
bound 403 (5) 541 (4) <.03 2.6 180.4 7.94 <.03

H1 Probability judgments of high and low confidence group
differProbability judgment on remaining concentrations:
• High and low confidence group differ (rep. meas. ANOVA):– Cd: p < .21 however interaction Probability x
Confidence: p < .04– Cu: p < .04– Zn: p < .02
4. Results

H1 Probability judgments of high and low confidence group
differ
4. Results

H2 High confidence experts’ are more valid
Estimates of upper and lower bounds:
•High confidence experts show lower difference to a superexpert/real measurements in all 6 estimates (Factor 2; however not significant)
4. Results

H3: Self confidence provides validity
Mean sum of differences (absolute values) of experts’ and superexpert’s/real meas. probability judgments for different heavy metals
Low confidence group High confidence group df F p
Cd 290.8 68.2 1 10.55 .02
Cu 122.1 26.8 1 5.80 .05
Zn 194.2 97 1 4.56 .07
4. Results

H3 “The greenhorns are the greens”
Less confident are more optimistic
4. Results

4. Results
0 50 100 150 200 250 300
1
2
3
4
5
6
7
8
Zn
Cu
Cd
Average all (3)
Median (1)
Maxcorr (3)
Mincorr (8)
Truncout (6)
Truncin (3)
High conf (2)
Low conf (8)
Y-axis: Deviations of probability judgments (sum score) to a superexpert/meas.: The Median is the best; high confidence does fine
Mod
el (
rank
)

H4: Qualitative statements consented:a)We all agree that the remaining concentration
will be in the range between x% and y% (grey area) with a certain probability
b)For Cadmium: The reduction will exceed 15% with low probability
c)For Zinc: The Majority believes that the remaining concentration will be between 93% and 98%

Conclusions1. The Formative Consensus Building method (i.e., a structured,
formative, „anonymous“ method organized by an independent facilitator) should include
– Cooperative definition of the judgmental task– A common „knowledge base“– Statistical procedures of integrating judgments (better than „fuzzy
workshop statements“)
2. The validation by a data based super-expert judgment is a good/ideal research strategy
3. Measuring distributional knowledge is possible: Statistical procedures do better than discursive ones; take the median expert!
4. „High confidence experts“ and „high correlated experts“ provide better judgments (if ....)


