
1© João Aires de Sousa www.dq.fct.unl.pt/staff/jas/qc
Introduction to Chemoinformatics
4. Machine learning, QSAR, and QSPR

2© João Aires de Sousa www.dq.fct.unl.pt/staff/jas/qc
Can a computer learn chemistry ?

3© João Aires de Sousa www.dq.fct.unl.pt/staff/jas/qc
For example, learn to predict properties from the molecular structural formula
Learn what ?
Is it toxic ?
How does it react with a
base ?
How are its spectra (IR,
NMR, MS,...) ?CH3
CH3
O
O
Pharmacological properties ?
4© João Aires de Sousa www.dq.fct.unl.pt/staff/jas/qc
Empirically !
A computer can learn, just like experimental chemists have typically learned...
Starting from a dataset of experimental data with molecular structures and the corresponding observable properties.
A computer can find relationships between molecular structures and the properties.
It learns! E can apply the knowledge to new situations!
5© João Aires de Sousa www.dq.fct.unl.pt/staff/jas/qc
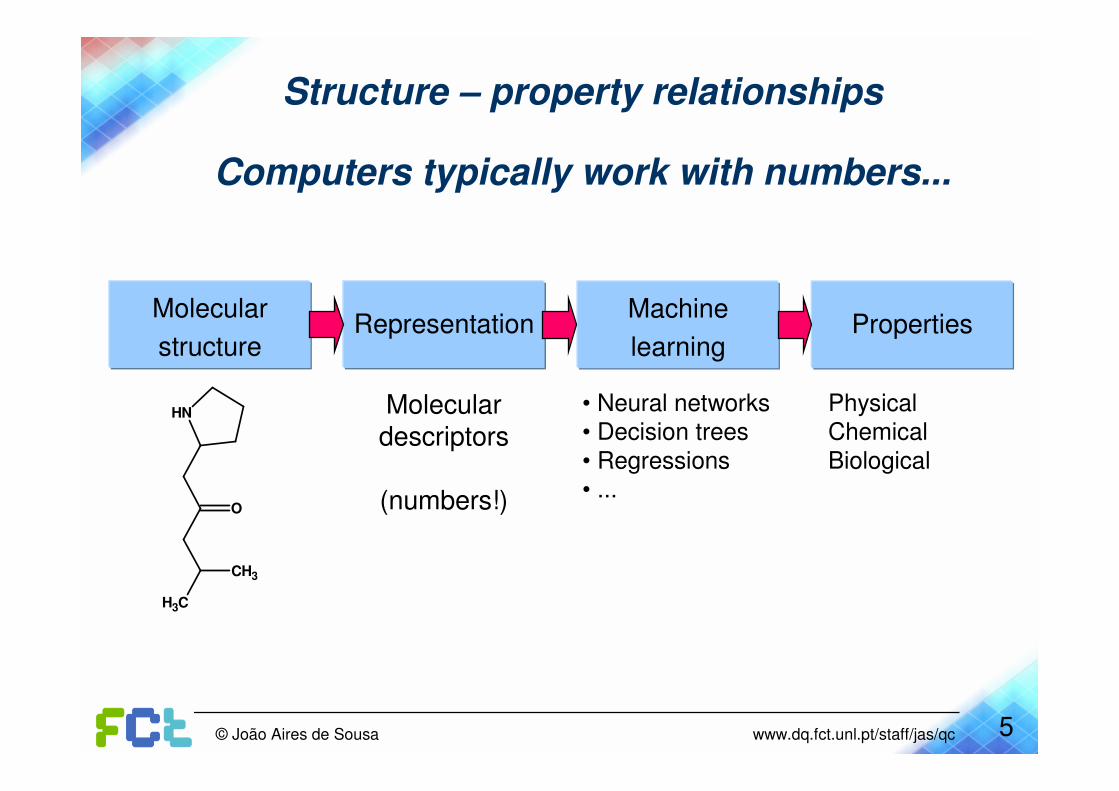
Structure – property relationships
Computers typically work with numbers...
Molecular
structurePropertiesRepresentation
Machine
learning
CH3
CH3
O
NH Moleculardescriptors
(numbers!)
• Neural networks• Decision trees
• Regressions
• ...
PhysicalChemical
Biological

6© João Aires de Sousa www.dq.fct.unl.pt/staff/jas/qc

7© João Aires de Sousa www.dq.fct.unl.pt/staff/jas/qc
Structure – property relationships
In chemical and pharmaceutical research, large amounts of experimental data are produced. For example, resulting from high-throughput screening (HTS) of large sets of compounds.
Knowledge may be extracted from such data, for example by deriving models that can predict properties for new compounds.
Machine learning techniques are used to establish quantitativestructure-property relationships.
QSPR – Quantitative Structure-Property RelationshipsQSAR – Quantitative Structure-Activity Relationships

8© João Aires de Sousa www.dq.fct.unl.pt/staff/jas/qc
Linear regressions
Variable x Variable y
Find the equation that best expresses the linear relationship between x and y.
y = a · x + b
y = 0.2636x + 1.371
R2 = 0.9093
0
1
2
3
4
5
6
7
8
0 5 10 15 20 25
The goal is to find the best possible values of a and b such that the equation allows to predict y from x.
The least squares algorithm minimizes the sum of the squared distances of the points to the line.

9© João Aires de Sousa www.dq.fct.unl.pt/staff/jas/qc
8.00
9.00
10.00
11.00
12.00
13.00
14.00
15.00
16.00
8.00 9.00 10.00 11.00 12.00 13.00 14.00 15.00 16.00 17.00
Multilinear regressions
Variables x1, x2, x3, x4, … xn Variable y
Find the equation that best expresses the linear relationship between x1,… xn and y.
y = a1 x1 + a2 x2 + a3 x3 + a4 x4 + … + an xn + b
The goal is to find the best possible values of a1 … an and b such that the equation allows to predict y from X.
The least squares algorithm minimizes the sum of the squared distances of the points to the line in an n dimensional space.
experimental
pre
dic
ted

10© João Aires de Sousa www.dq.fct.unl.pt/staff/jas/qc
Multilinear regressionsApplication to QSPR
Descriptors x1, x2, x3, x4, … xn Property y
To find an equation that can predict the property y from descriptorsx1,… xn.
It is wise to look for descriptors that are expected to be related to the property.
For example, the melting point is related to the size and polarity of compounds; if we want to model mp we should use molecular descriptors encoding size and polarity.
11© João Aires de Sousa www.dq.fct.unl.pt/staff/jas/qc
8.00
9.00
10.00
11.00
12.00
13.00
14.00
15.00
16.00
8.00 9.00 10.00 11.00 12.00 13.00 14.00 15.00 16.00 17.00
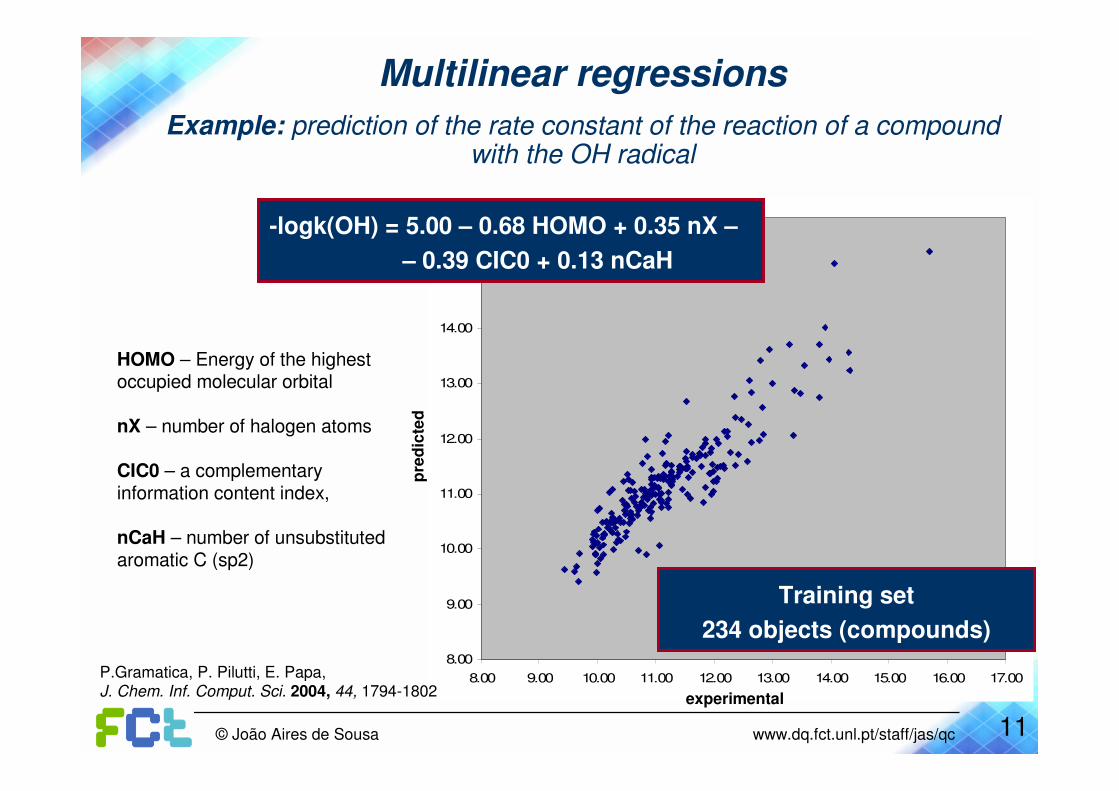
Multilinear regressions
Example: prediction of the rate constant of the reaction of a compound with the OH radical
-logk(OH) = 5.00 – 0.68 HOMO + 0.35 nX –
– 0.39 CIC0 + 0.13 nCaH
Training set
234 objects (compounds)
HOMO – Energy of the highest occupied molecular orbital
nX – number of halogen atoms
CIC0 – a complementaryinformation content index,
nCaH – number of unsubstitutedaromatic C (sp2)
P.Gramatica, P. Pilutti, E. Papa,J. Chem. Inf. Comput. Sci. 2004, 44, 1794-1802 experimental
pre
dic
ted
12© João Aires de Sousa www.dq.fct.unl.pt/staff/jas/qc
8.00
9.00
10.00
11.00
12.00
13.00
14.00
15.00
16.00
8.00 9.00 10.00 11.00 12.00 13.00 14.00 15.00 16.00
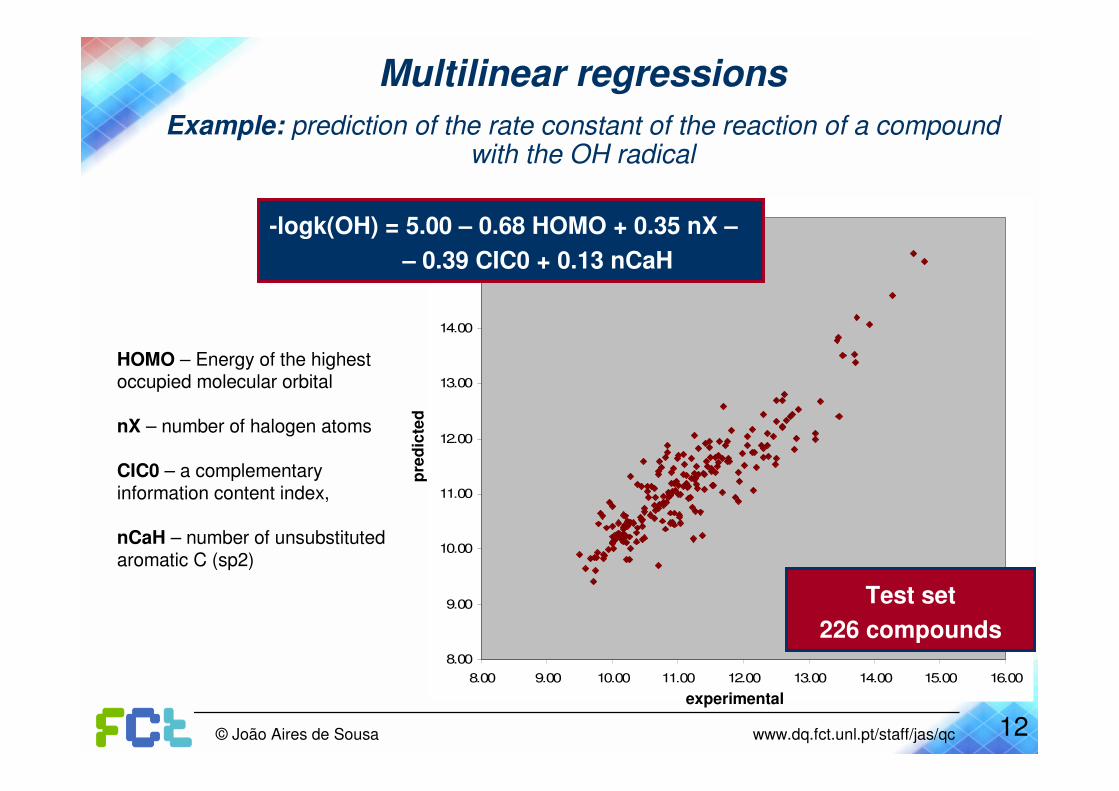
-logk(OH) = 5.00 – 0.68 HOMO + 0.35 nX –
– 0.39 CIC0 + 0.13 nCaH
Test set
226 compounds
experimental
Multilinear regressions
Example: prediction of the rate constant of the reaction of a compound with the OH radical
HOMO – Energy of the highest occupied molecular orbital
nX – number of halogen atoms
CIC0 – a complementaryinformation content index,
nCaH – number of unsubstitutedaromatic C (sp2)
pre
dic
ted
13© João Aires de Sousa www.dq.fct.unl.pt/staff/jas/qc
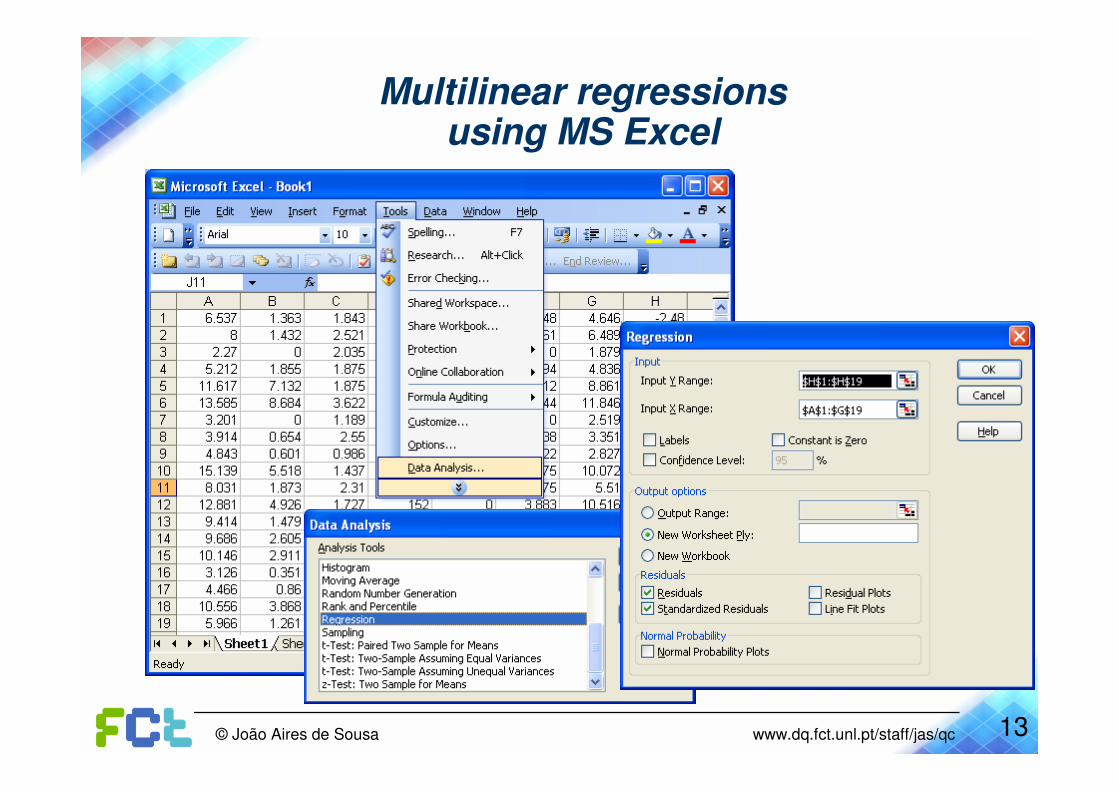
Multilinear regressionsusing MS Excel
14© João Aires de Sousa www.dq.fct.unl.pt/staff/jas/qc
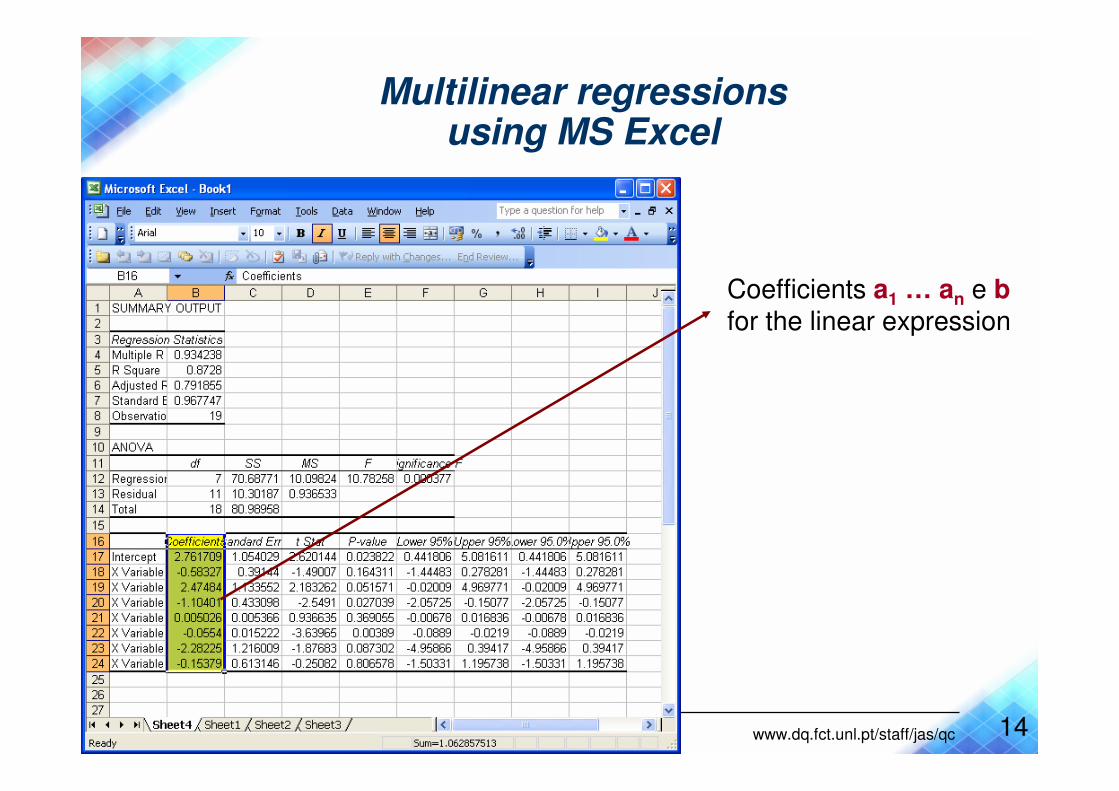
Coefficients a1 … an e bfor the linear expression
Multilinear regressionsusing MS Excel

15© João Aires de Sousa www.dq.fct.unl.pt/staff/jas/qc
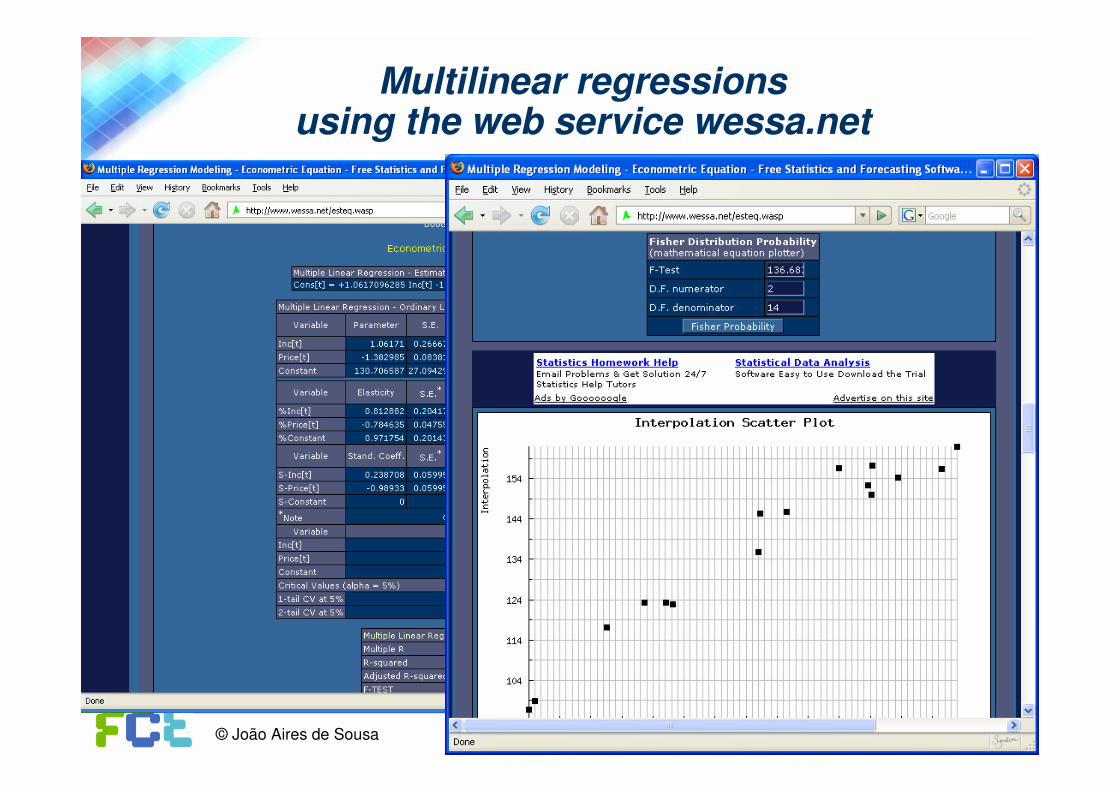
Multilinear regressionsusing the web service wessa.net

16© João Aires de Sousa www.dq.fct.unl.pt/staff/jas/qc
Multilinear regressionsusing the web service wessa.net
17© João Aires de Sousa www.dq.fct.unl.pt/staff/jas/qc
Multilinear regressionsusing the web service wessa.net

18© João Aires de Sousa www.dq.fct.unl.pt/staff/jas/qc
Decision trees(or classification and regression trees, CART)
Descriptors x1, x2, x3, x4, … xn Classes A, B, C, …
� Decision trees look for rules that are able to classify objects on the basis of descriptors x1,… xn.
� Rules are inferred from objects in the training set. After training, the trees can be applied to new objects for their classification.

19© João Aires de Sousa www.dq.fct.unl.pt/staff/jas/qc
Decision trees
Example: prediction of mutagenicityfrom 381 molecular descriptors
32 polycyclic aromatic hydrocarbons (PAH)
Gs ≥0.3325< 0.3325
Gs ≥0.2045< 0.2045
R5m+≥0.015< 0.015
Mut MutNon-Mut Non-Mut
Gs: G total symmetry index/weighted by atomic electrotopological states (3D-WHIM descriptor)R5m+: R maximal autocorrelation of lag 5/weighted by atomic masses (3D-GETAWAY descriptor)
P. Gramatica, E. Papa, A. Marrocchi, L. Minuti, A. Taticchi, Ecotoxicology and Environmental Safety 2007, 66 (3), 353-361.
‘Leave-one-out’ validation: 3/32 wrong classifications
20© João Aires de Sousa www.dq.fct.unl.pt/staff/jas/qc
Neural networks
Information processing systems
inspired on biological nervous systems.
Ability to learn from observations:
Extract knowledge
Identify relationships
Identify structures
Generalize
21© João Aires de Sousa www.dq.fct.unl.pt/staff/jas/qc
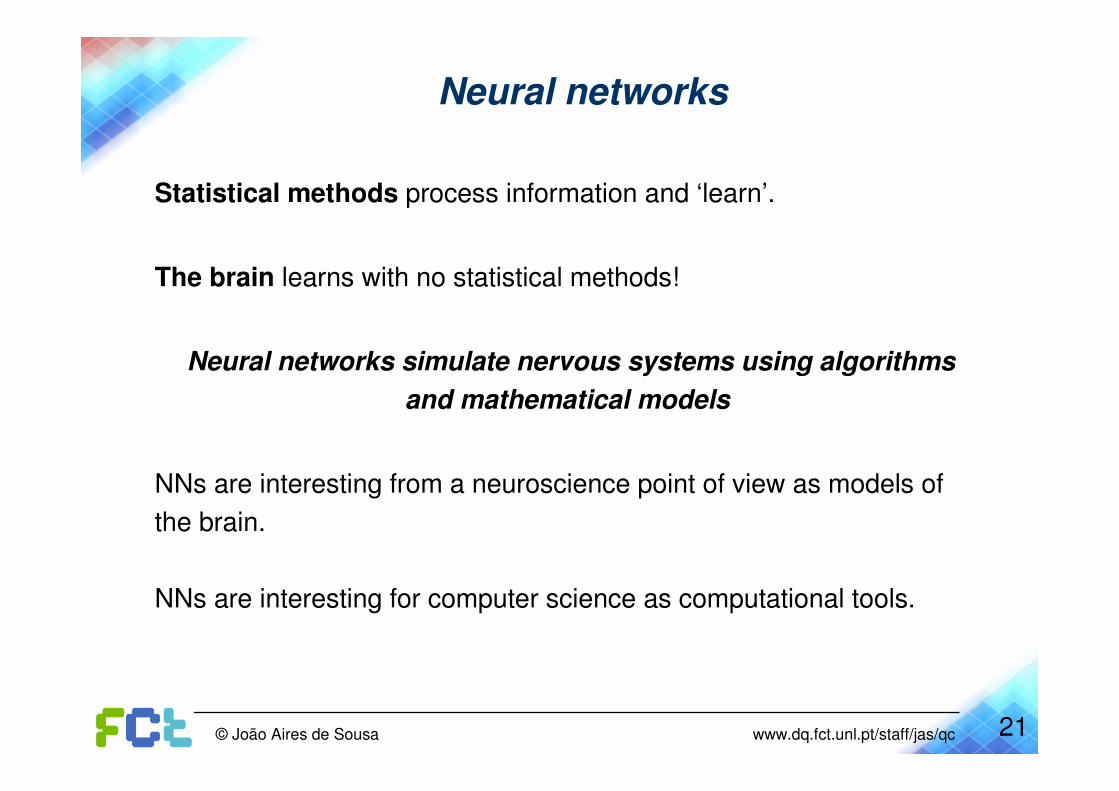
Statistical methods process information and ‘learn’.
The brain learns with no statistical methods!
Neural networks simulate nervous systems using algorithms
and mathematical models
NNs are interesting from a neuroscience point of view as models of
the brain.
NNs are interesting for computer science as computational tools.
Neural networks
22© João Aires de Sousa www.dq.fct.unl.pt/staff/jas/qc
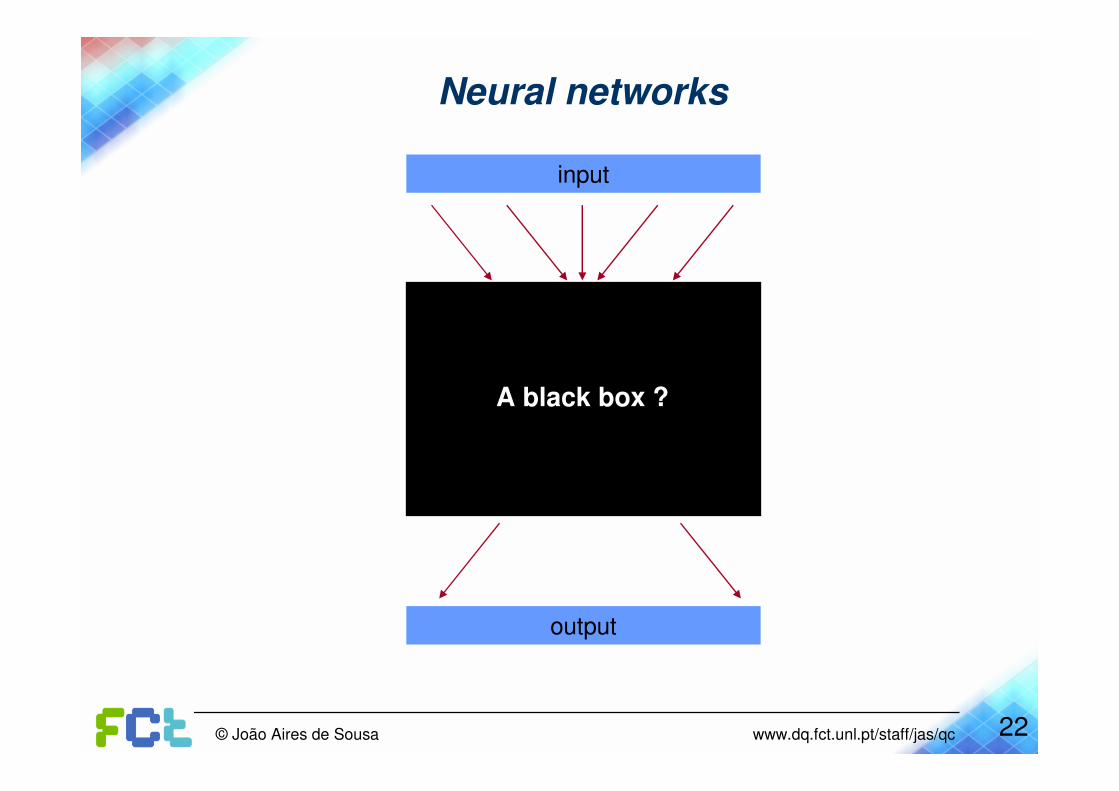
input
output
A black box ?
Neural networks

23© João Aires de Sousa www.dq.fct.unl.pt/staff/jas/qc
input
output
Connected
functional units
NEURONS
Neural networks
24© João Aires de Sousa www.dq.fct.unl.pt/staff/jas/qc
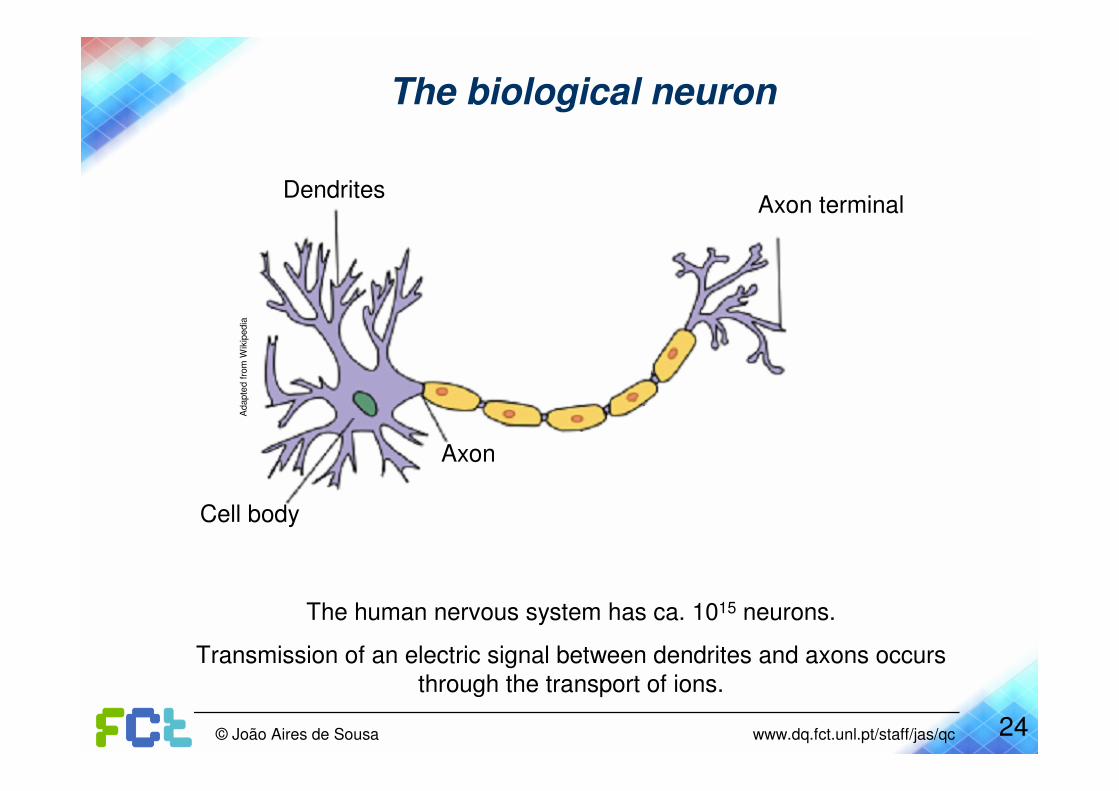
The biological neuron
Cell body
Dendrites
Axon
The human nervous system has ca. 1015 neurons.
Transmission of an electric signal between dendrites and axons occurs
through the transport of ions.
Axon terminal
Adapte
d f
rom
Wik
ipedia

25© João Aires de Sousa www.dq.fct.unl.pt/staff/jas/qc
Neurons in the superficial layers of the visual cortex in the brain of a mice.
PLoS Biology Vol. 4, No. 2, e29 DOI: 10.1371/journal.pbio.0040029
The biological neuron
26© João Aires de Sousa www.dq.fct.unl.pt/staff/jas/qc
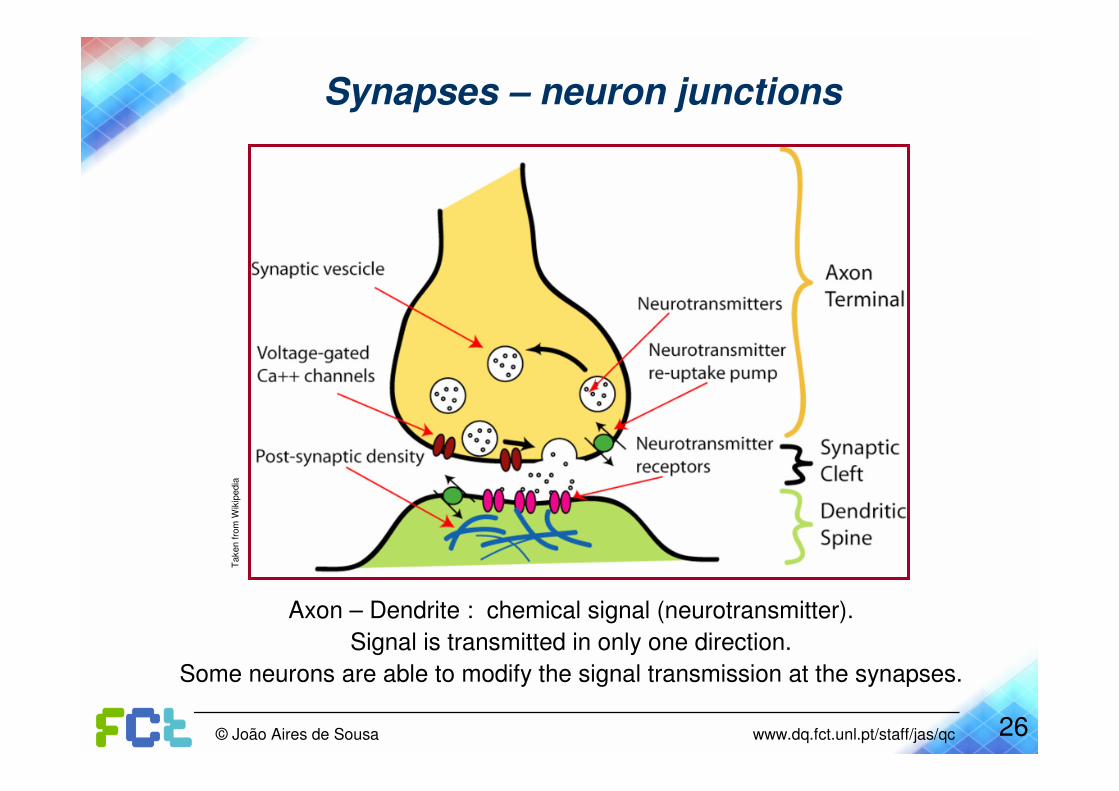
Synapses – neuron junctions
Axon – Dendrite : chemical signal (neurotransmitter).
Signal is transmitted in only one direction.
Some neurons are able to modify the signal transmission at the synapses.
Taken f
rom
Wik
ipedia

27© João Aires de Sousa www.dq.fct.unl.pt/staff/jas/qc
Loss of connections between neurons in the Alzheimer disease
Synapses – neuron junctions
Taken f
rom
Wik
ipedia
and
Nation
al In
stitu
te o
f A
gin
g w
ww
.nia
.nih
.gov
28© João Aires de Sousa www.dq.fct.unl.pt/staff/jas/qc
Neural networks
Similar neurons in different species.
The same type of signal.
What is essential is the whole set of neurons, and the connections.
THE NETWORK
29© João Aires de Sousa www.dq.fct.unl.pt/staff/jas/qc
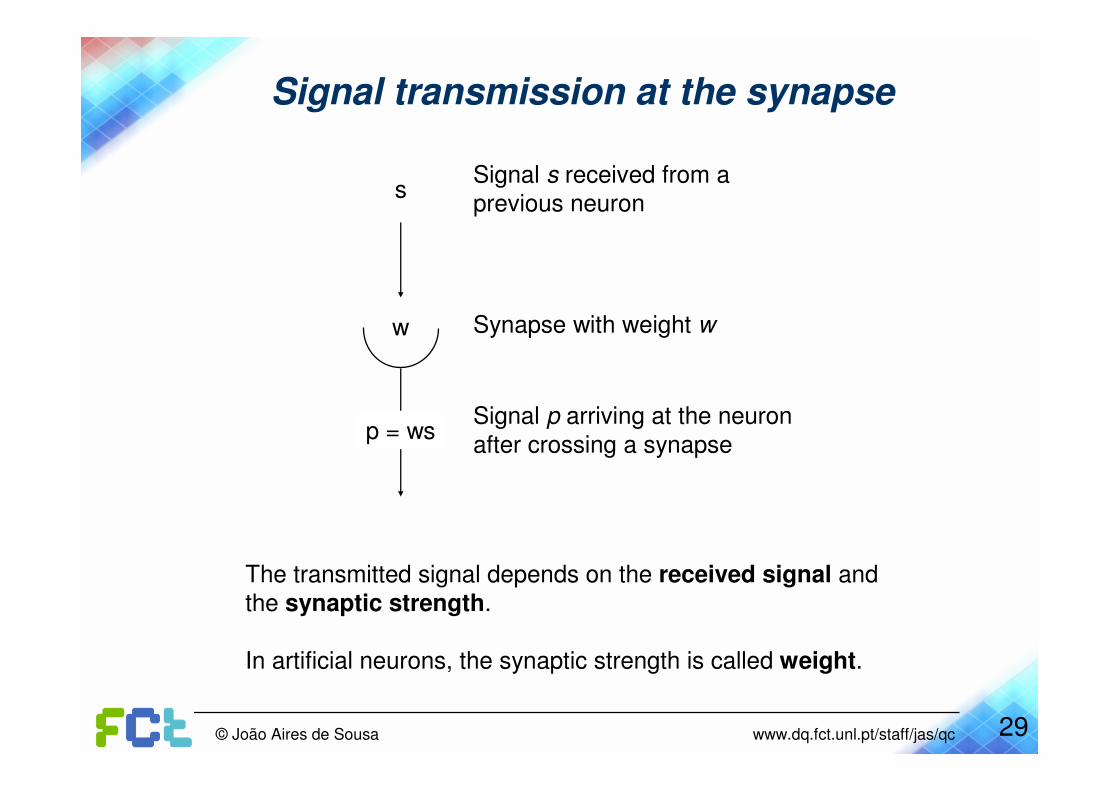
Signal transmission at the synapse
The transmitted signal depends on the received signal and
the synaptic strength.
In artificial neurons, the synaptic strength is called weight.
w
s
p = ws
Signal s received from a
previous neuron
Synapse with weight w
Signal p arriving at the neuron
after crossing a synapse
30© João Aires de Sousa www.dq.fct.unl.pt/staff/jas/qc
Synapses and learning
� Learning and memory are believed to result
from long-term changes in synaptic strength.
� In artificial neural networks, learning occurs
by correcting the weights.
31© João Aires de Sousa www.dq.fct.unl.pt/staff/jas/qc
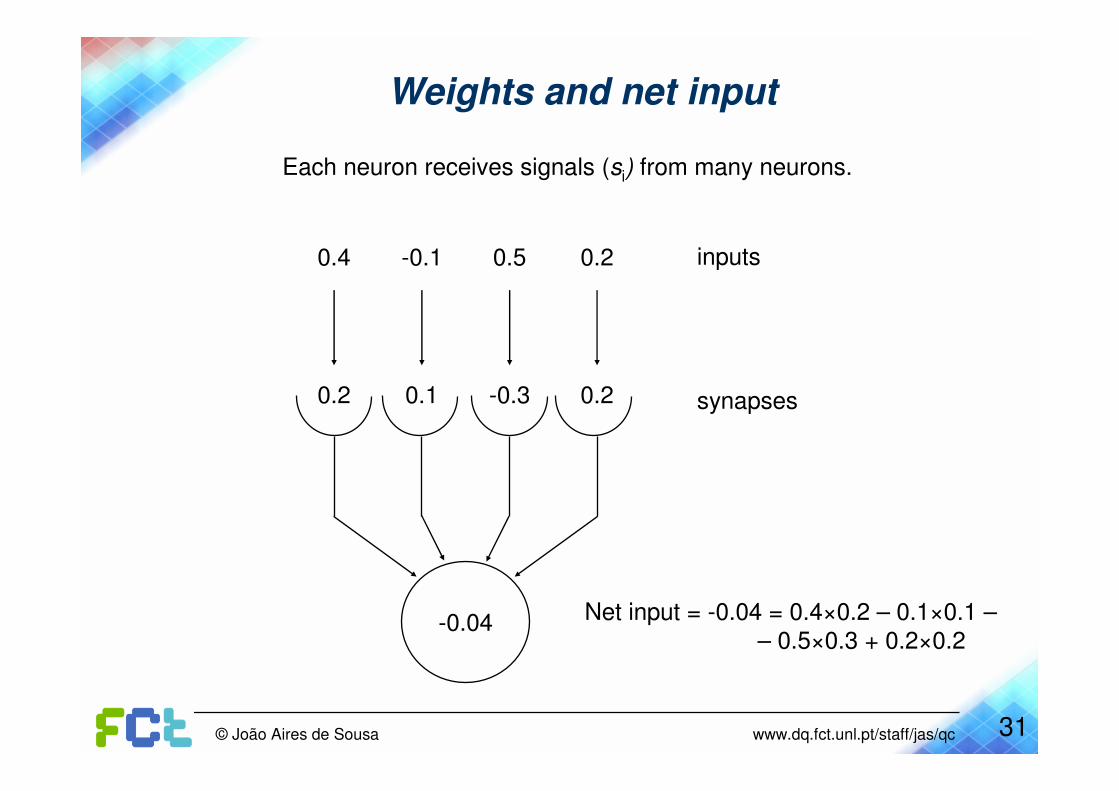
Weights and net input
Each neuron receives signals (si) from many neurons.
0.1
-0.1
0.2
0.4
-0.3
0.5
0.2
0.2
-0.04 Net input = -0.04 = 0.4×0.2 – 0.1×0.1 –– 0.5×0.3 + 0.2×0.2
inputs
synapses

32© João Aires de Sousa www.dq.fct.unl.pt/staff/jas/qc
Transfer functions
The net input is modified by a transfer function into an outputOut = f (Net)

33© João Aires de Sousa www.dq.fct.unl.pt/staff/jas/qc
Sigmoid transfer function
Out = 1 / (1 + e -Net)
Important: it is non-linear!
Derivative is easy to calculate:
d(Out) / d(Net) = Out (1-Out)

34© João Aires de Sousa www.dq.fct.unl.pt/staff/jas/qc
Simulation of an artificial neuron
http://lcn.epfl.ch/tutorial/english/aneuron/html/index.html

35© João Aires de Sousa www.dq.fct.unl.pt/staff/jas/qc
The ‘100 steps paradox’
� A neuron recovers approximately one millisecond (10-3 s) after
firing.
� The human brain is able to perform intelligent processes, such
as recognizing a friend's face or reacting to some danger, in
approximately one tenth of a second.
� Highly complex tasks have to be performed in less than 100
steps ?!
� Conclusion: many tasks must be performed simultaneously and
in parallel.
36© João Aires de Sousa www.dq.fct.unl.pt/staff/jas/qc
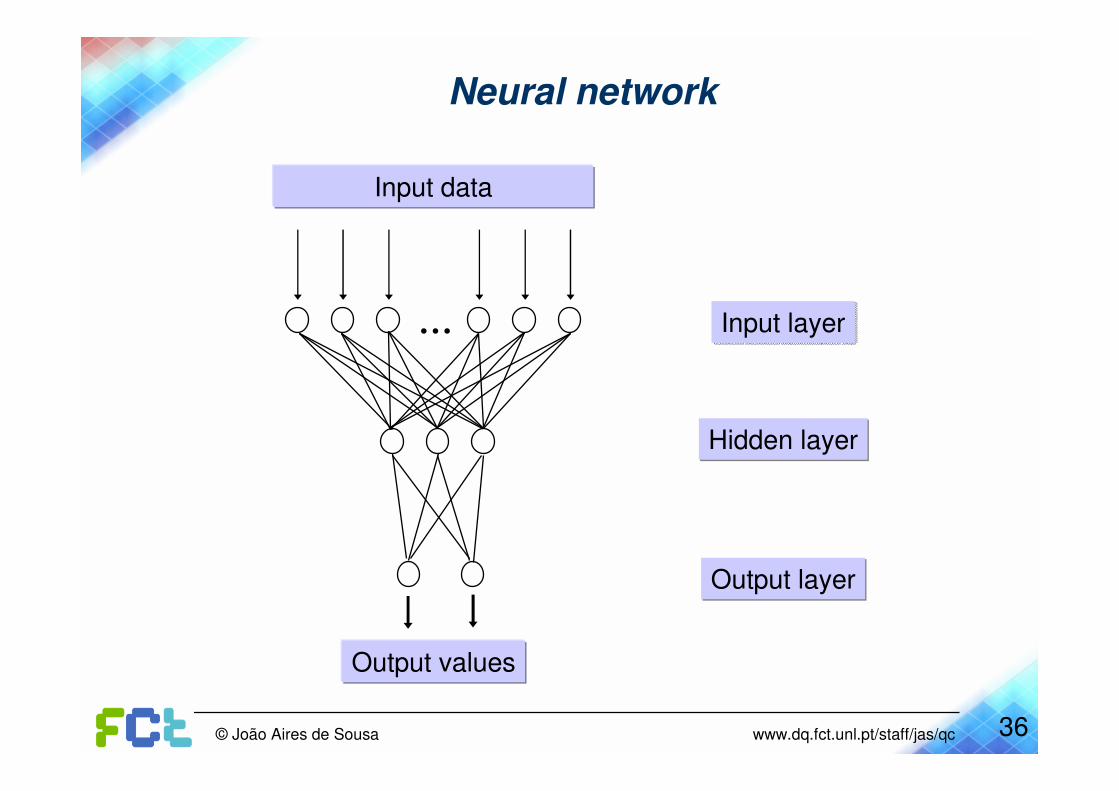
Neural network
Input layerInput layer
Hidden layerHidden layer
Output layerOutput layer
Input data
Output values
...

37© João Aires de Sousa www.dq.fct.unl.pt/staff/jas/qc
Architecture of a neural network
...
• Number of inputs and outputs
• Number of layers
• Number of neurons in each layer
• Number of weights in each neuron
• How neurons are connected
• Which neurons receive corrections

38© João Aires de Sousa www.dq.fct.unl.pt/staff/jas/qc
The ‘feed-forward’ of ‘backpropagation’ NN
Input data
39© João Aires de Sousa www.dq.fct.unl.pt/staff/jas/qc
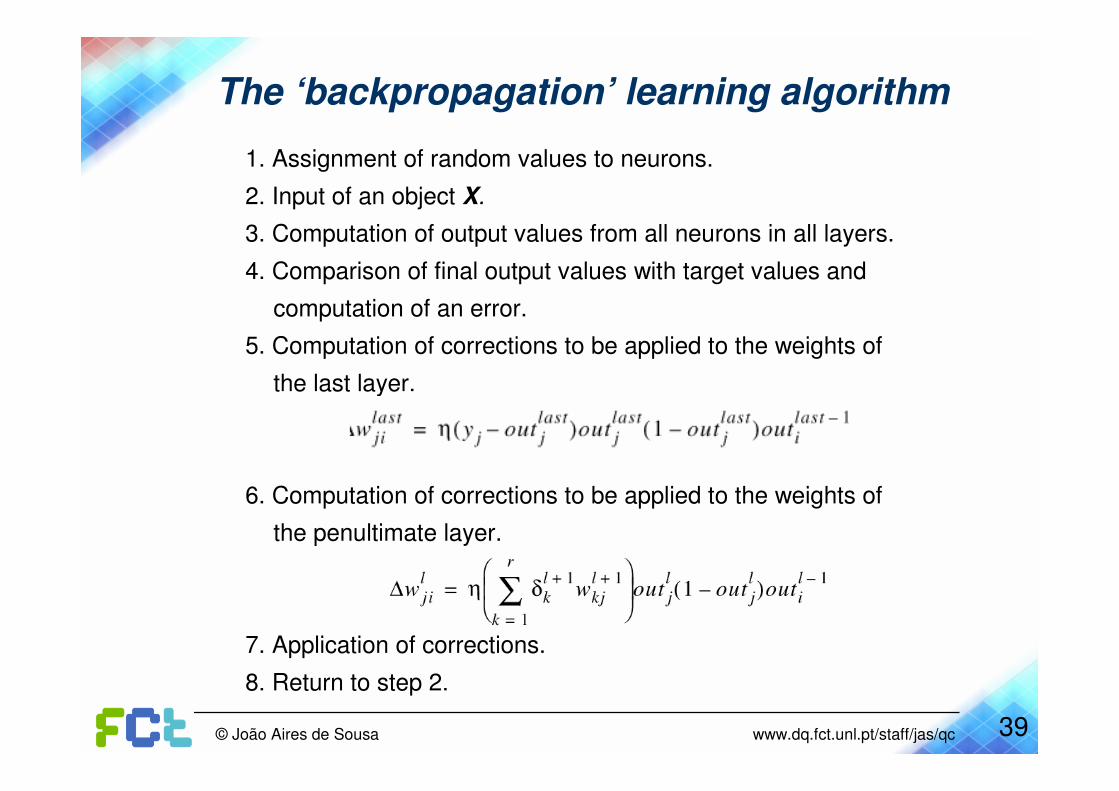
The ‘backpropagation’ learning algorithm
1. Assignment of random values to neurons.
2. Input of an object X.
3. Computation of output values from all neurons in all layers.
4. Comparison of final output values with target values and
computation of an error.
5. Computation of corrections to be applied to the weights of
the last layer.
6. Computation of corrections to be applied to the weights of
the penultimate layer.
7. Application of corrections.
8. Return to step 2.

40© João Aires de Sousa www.dq.fct.unl.pt/staff/jas/qc
Introduction of a momentum parameter µ.
Correction = computed correction + µ × previous correction
The ‘backpropagation’ learning algorithm
41© João Aires de Sousa www.dq.fct.unl.pt/staff/jas/qc
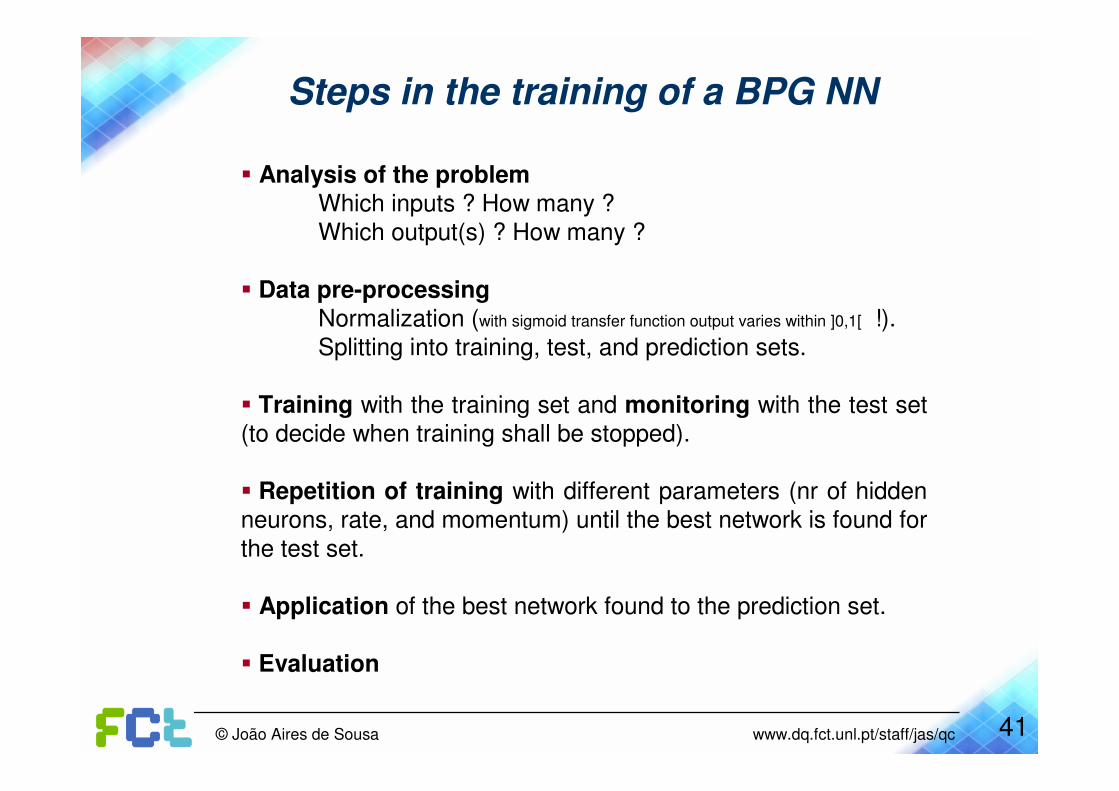
Steps in the training of a BPG NN
� Analysis of the problemWhich inputs ? How many ?Which output(s) ? How many ?
� Data pre-processingNormalization (with sigmoid transfer function output varies within ]0,1[ !).Splitting into training, test, and prediction sets.
� Training with the training set and monitoring with the test set (to decide when training shall be stopped).
� Repetition of training with different parameters (nr of hidden
neurons, rate, and momentum) until the best network is found for
the test set.
� Application of the best network found to the prediction set.
� Evaluation

42© João Aires de Sousa www.dq.fct.unl.pt/staff/jas/qc
Monitoring the training of a BPG NN
Stop training

43© João Aires de Sousa www.dq.fct.unl.pt/staff/jas/qc
BPG NNs using JATOON softwarehttp://www.dq.fct.unl.pt/staff/jas/jatoon
Training set
Test set
Optimum nr of epochs
44© João Aires de Sousa www.dq.fct.unl.pt/staff/jas/qc
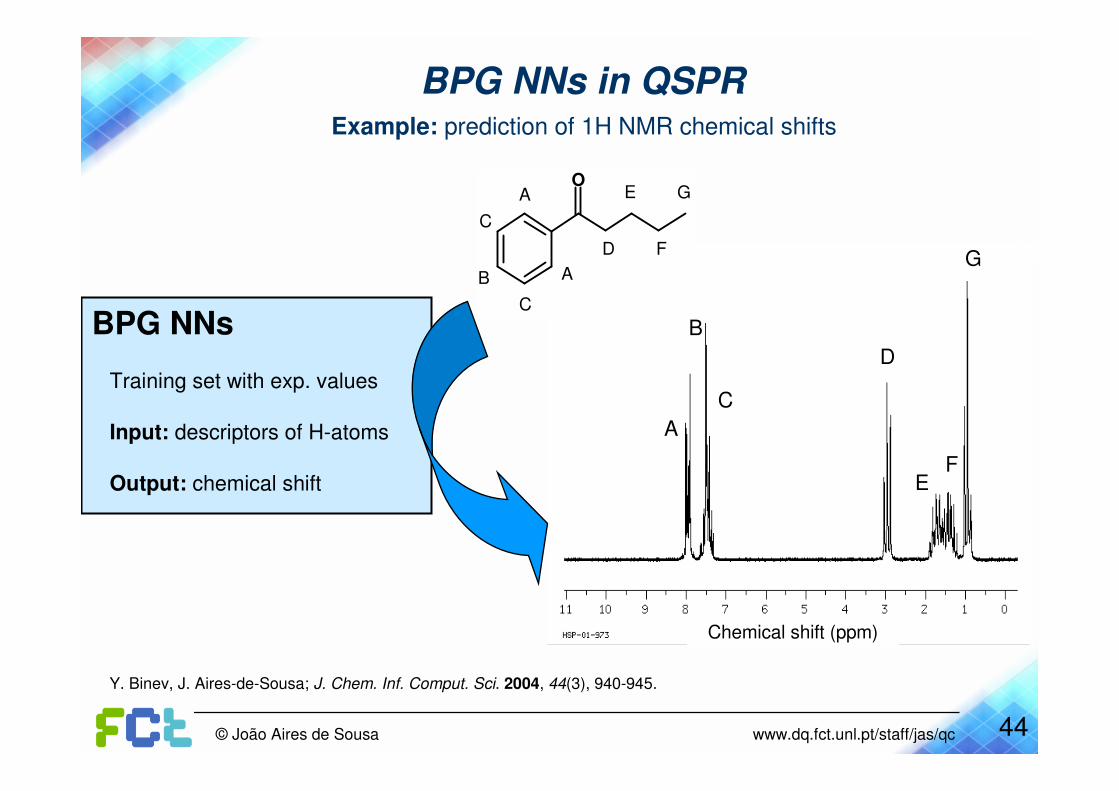
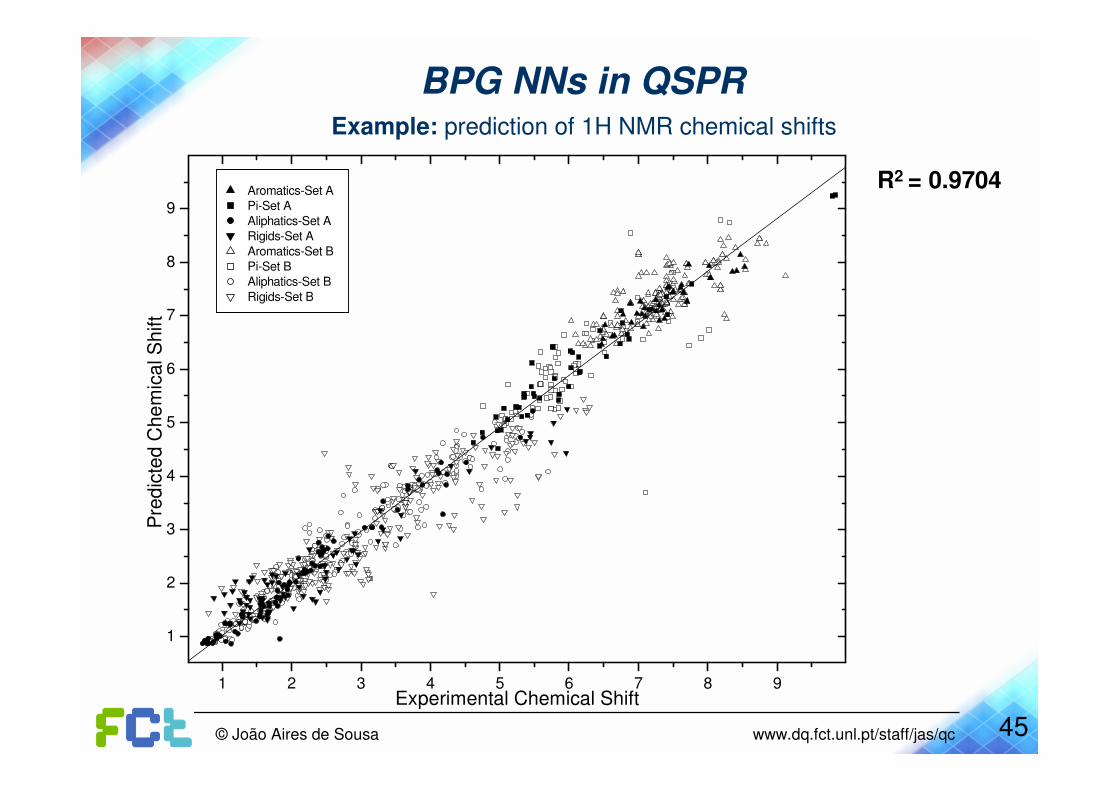
BPG NNs in QSPRExample: prediction of 1H NMR chemical shifts
O
A
A
B
C
C
D
E
F
G
A
B
C
D
EF
G
Chemical shift (ppm)
BPG NNs
Training set with exp. values
Input: descriptors of H-atoms
Output: chemical shift
Y. Binev, J. Aires-de-Sousa; J. Chem. Inf. Comput. Sci. 2004, 44(3), 940-945.
45© João Aires de Sousa www.dq.fct.unl.pt/staff/jas/qc
1 2 3 4 5 6 7 8 9
1
2
3
4
5
6
7
8
9
Pre
dic
ted C
he
mic
al S
hift
Experimental Chemical Shift
Aromatics-Set A
Pi-Set A
Aliphatics-Set A
Rigids-Set A
Aromatics-Set B
Pi-Set B
Aliphatics-Set B
Rigids-Set B
R2 = 0.9704
BPG NNs in QSPRExample: prediction of 1H NMR chemical shifts
46© João Aires de Sousa www.dq.fct.unl.pt/staff/jas/qc
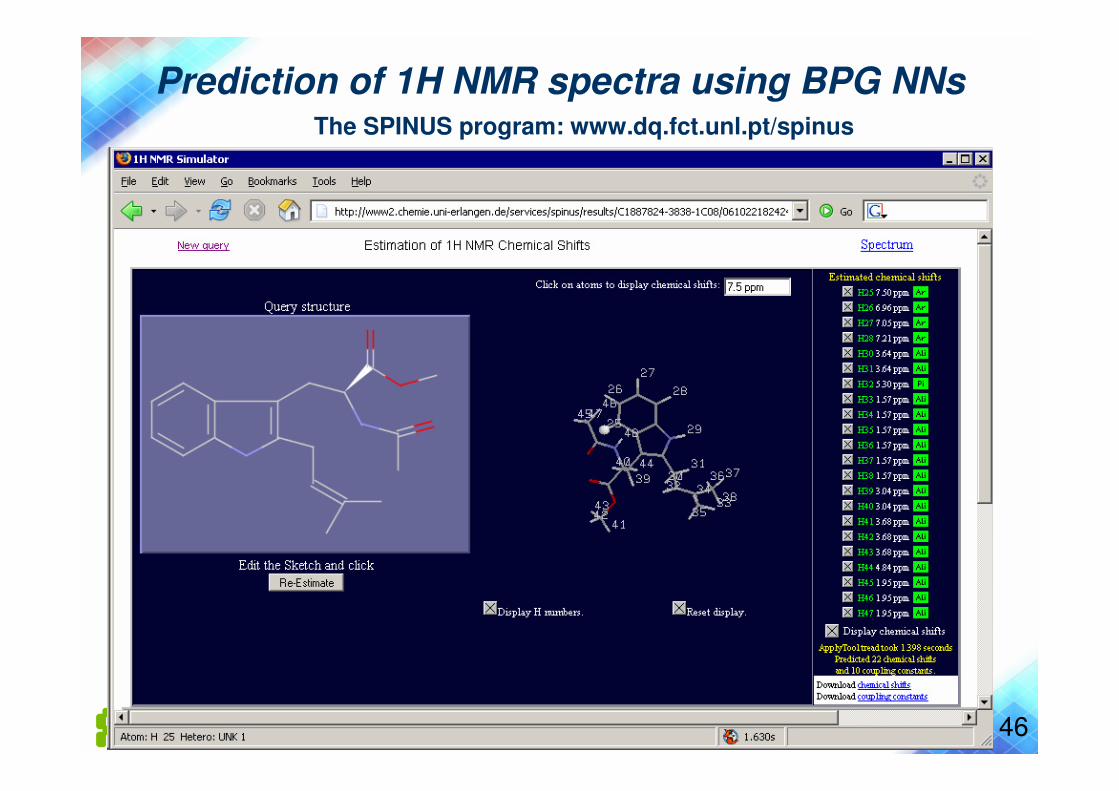
Prediction of 1H NMR spectra using BPG NNsThe SPINUS program: www.dq.fct.unl.pt/spinus

47© João Aires de Sousa www.dq.fct.unl.pt/staff/jas/qc
Self-organizing maps
48© João Aires de Sousa www.dq.fct.unl.pt/staff/jas/qc
Kohonen neural networks“self-organizing maps (SOMS)”
Algebraic view of a data set(values, signals, magnitudes,...)
vs.
Topological view of a data set(relationships between information)
49© João Aires de Sousa www.dq.fct.unl.pt/staff/jas/qc
Kohonen neural networks“self-organizing maps (SOMS)”
These are two-dimensional arrays of neurons that reflect as well as possible the topology of information, that is, the relationships between
individual pieces of data and not their magnitude.
Compression of information
Mapping on a 2D surface.
“Self-Organized Topological Features Maps”Preserve topology.

50© João Aires de Sousa www.dq.fct.unl.pt/staff/jas/qc
Kohonen neural networksArchitecture
One layer of neurons.

51© João Aires de Sousa www.dq.fct.unl.pt/staff/jas/qc
Kohonen neural networksArchitecture
One layer of neurons.
n weights for each neuron
(n = number of
inputs)

52© João Aires de Sousa www.dq.fct.unl.pt/staff/jas/qc
Kohonen neural networksTopology
Definition of distance between neurons
Neuron
1st neighborhood
2nd neighborhood
The output of a neuron only affects neighbor neurons

53© João Aires de Sousa www.dq.fct.unl.pt/staff/jas/qc
Kohonen neural networks
Goal
Mapping similar signals
onto neighbor neurons
54© João Aires de Sousa www.dq.fct.unl.pt/staff/jas/qc
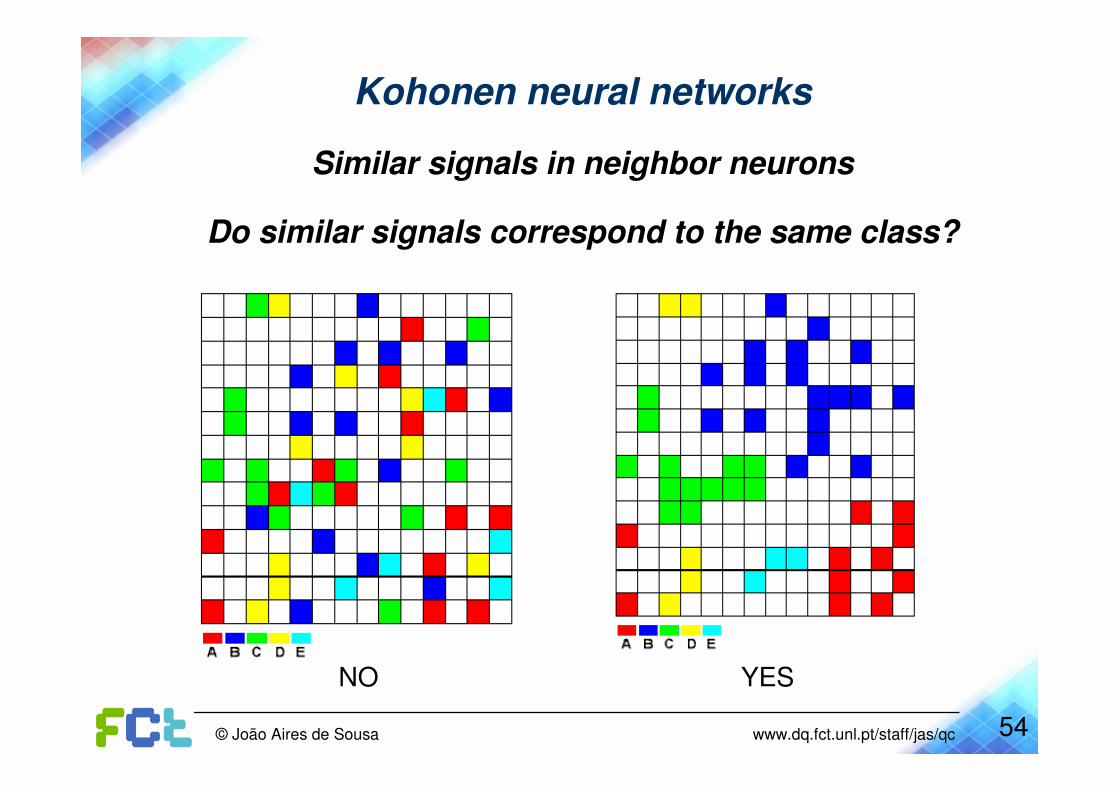
Kohonen neural networks
Similar signals in neighbor neurons
Do similar signals correspond to the same class?
YESNO
55© João Aires de Sousa www.dq.fct.unl.pt/staff/jas/qc
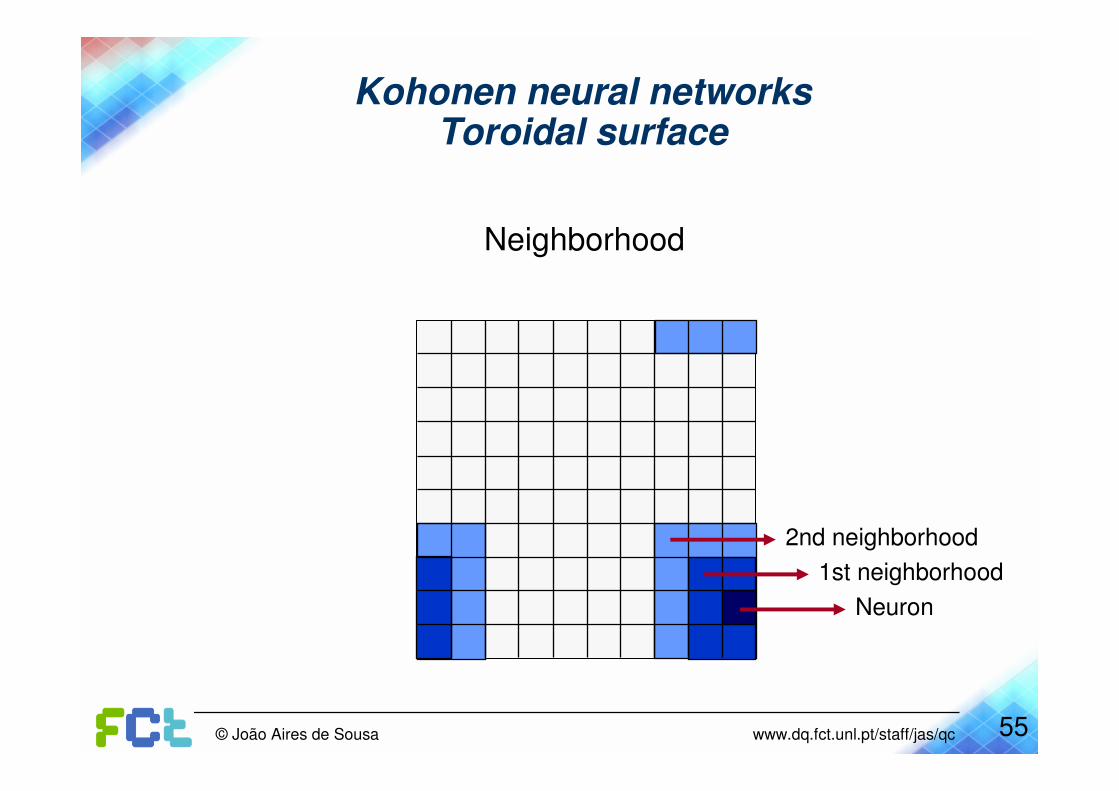
Kohonen neural networksToroidal surface
Neighborhood
Neuron
1st neighborhood
2nd neighborhood

56© João Aires de Sousa www.dq.fct.unl.pt/staff/jas/qc
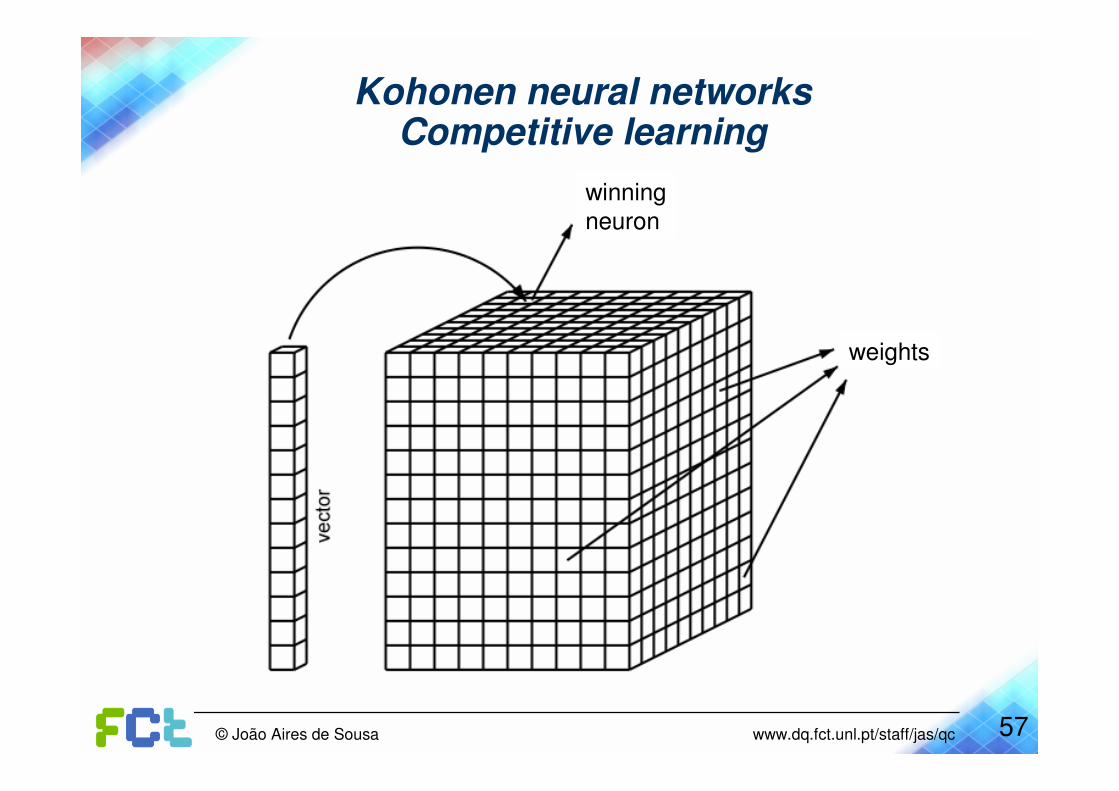
Kohonen neural networksCompetitive learning
After the input, only one neuron is activated(central neuron or winning neuron)
The central neuron is the one with themost similar weights to the input.
Traditionaly, similarity = Euclidean distance
2
1
)(i
n
i
ixw∑
=
−n – number of inputs
w – value of the weight
x – value of the input
57© João Aires de Sousa www.dq.fct.unl.pt/staff/jas/qc
Kohonen neural networksCompetitive learning
winning
neuron
weights

58© João Aires de Sousa www.dq.fct.unl.pt/staff/jas/qc
Kohonen neural networksCompetitive learning
The weights of the winning neuron are corrected to make them even more similar
to the input. The weights of neighbor neurons are also adapted with the same
goal but to a lesser extent.
Neuron
1st neighborhood
2nd neighborhood
59© João Aires de Sousa www.dq.fct.unl.pt/staff/jas/qc
Kohonen neural networksCompetitive learning
The correction of the neighbor neurons after the activation of a neuron depends on:
1. The distance to the winning neuron (the farther, the smaller thecorrection)
2. The stage of the training (at the beginning corrections are moredrastic)
3. The difference between the weight and the input (the larger the difference, the stronger the correction).

60© João Aires de Sousa www.dq.fct.unl.pt/staff/jas/qc
Kohonen neural networksNormalization of data
The activation of neurons, and the corrections, depend on the Euclidean distance.
If the values of a descriptor are in a wider range than another, it will have a larger impact on the result.
Therefore, for all descriptors to make a similar impact, NORMALIZATION of data is required.
61© João Aires de Sousa www.dq.fct.unl.pt/staff/jas/qc
Kohonen neural networksNormalization of data
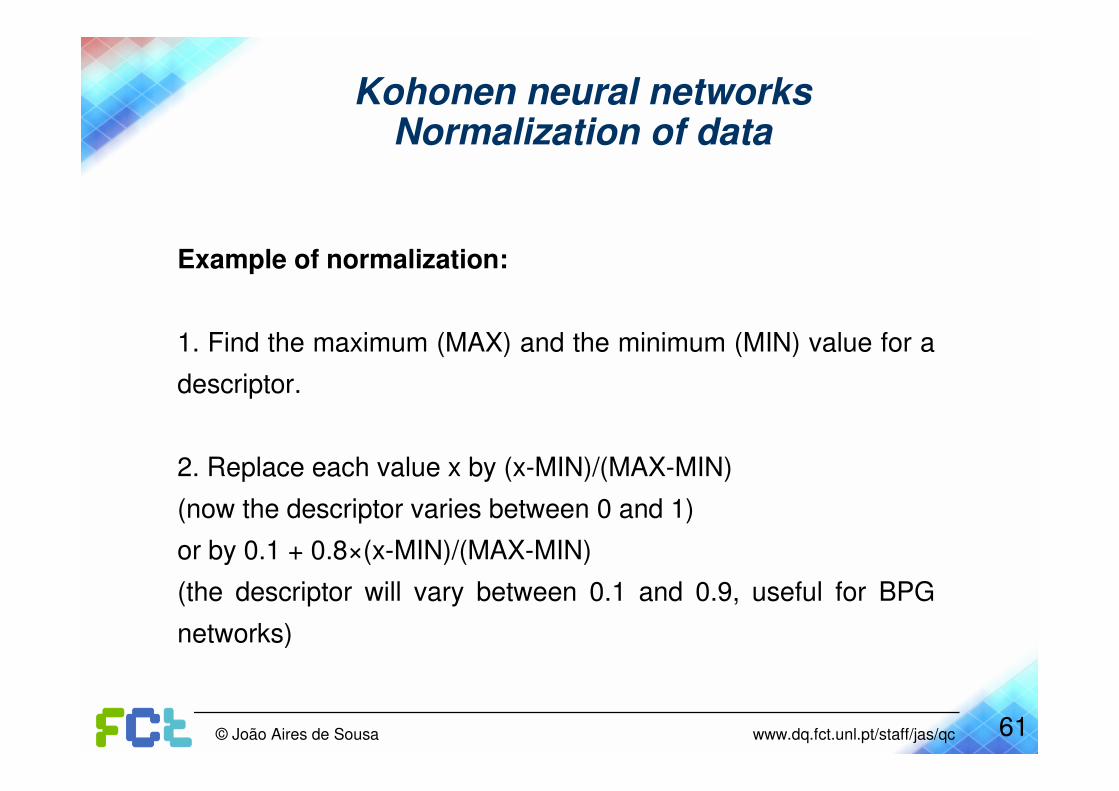
Example of normalization:
1. Find the maximum (MAX) and the minimum (MIN) value for a
descriptor.
2. Replace each value x by (x-MIN)/(MAX-MIN)
(now the descriptor varies between 0 and 1)
or by 0.1 + 0.8×(x-MIN)/(MAX-MIN)
(the descriptor will vary between 0.1 and 0.9, useful for BPG
networks)

62© João Aires de Sousa www.dq.fct.unl.pt/staff/jas/qc
Kohonen neural networksNormalization of data
Another example of normalization (z normalization):
1. Calculate the average (aver) and the standard deviation (sd) for a
descriptor.
2. Replace each value x by (x-aver)/sd
(the normalized descriptor will have average = 0 and standard
deviation = 1)

63© João Aires de Sousa www.dq.fct.unl.pt/staff/jas/qc
Kohonen neural networks : Application
Geographical classification of crude oil samples for the identification of spill sources.
From chemical features of oils.
Database of chemical features of oils from different geographical origins.
Sample(chemical features )
NEURALNETS
Geographical class
A. M. Fonseca, J. L. Biscaya, J. Aires-de-Sousa, A. M. Lobo,"Geographical
classification of crude oils by Kohonen self-organizing maps", Anal. Chim. Acta
2006, 556 (2), 374-382.
64© João Aires de Sousa www.dq.fct.unl.pt/staff/jas/qc
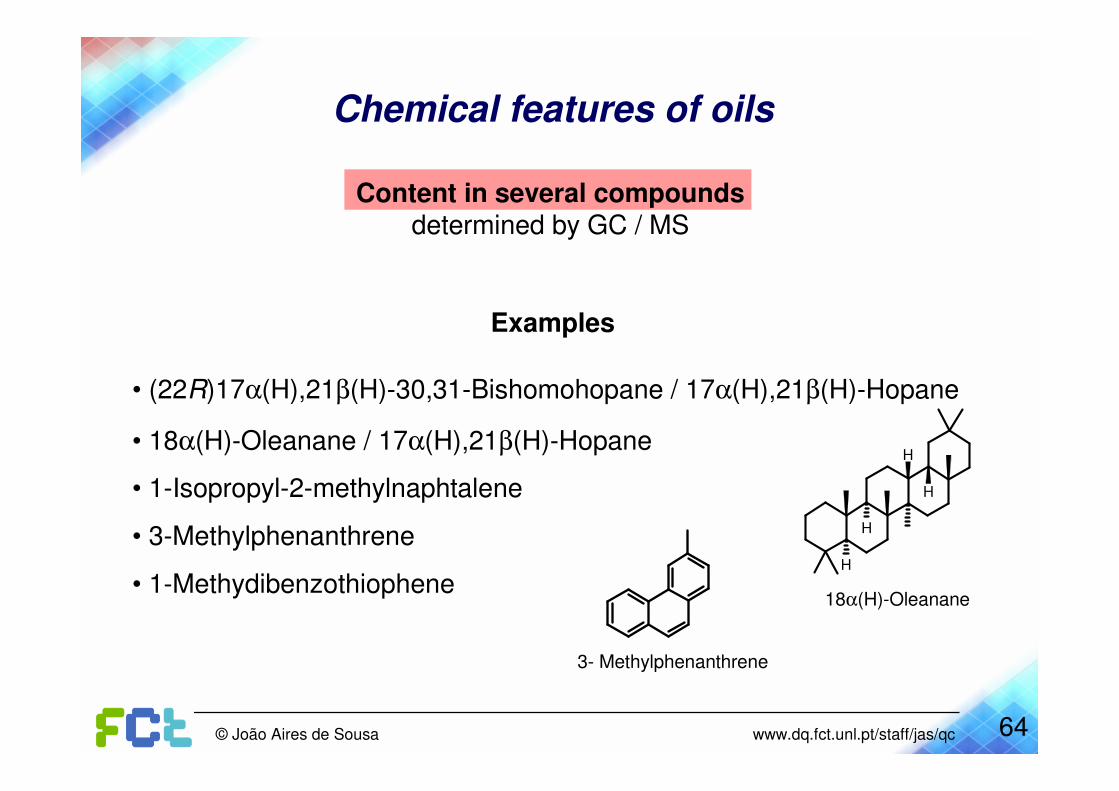
Chemical features of oils
Content in several compoundsdetermined by GC / MS
Examples
• (22R)17α(H),21β(H)-30,31-Bishomohopane / 17α(H),21β(H)-Hopane
• 18α(H)-Oleanane / 17α(H),21β(H)-Hopane
• 1-Isopropyl-2-methylnaphtalene
• 3-Methylphenanthrene
• 1-Methydibenzothiophene
3- Methylphenanthrene
H
H
H
H
18α(H)-Oleanane
65© João Aires de Sousa www.dq.fct.unl.pt/staff/jas/qc
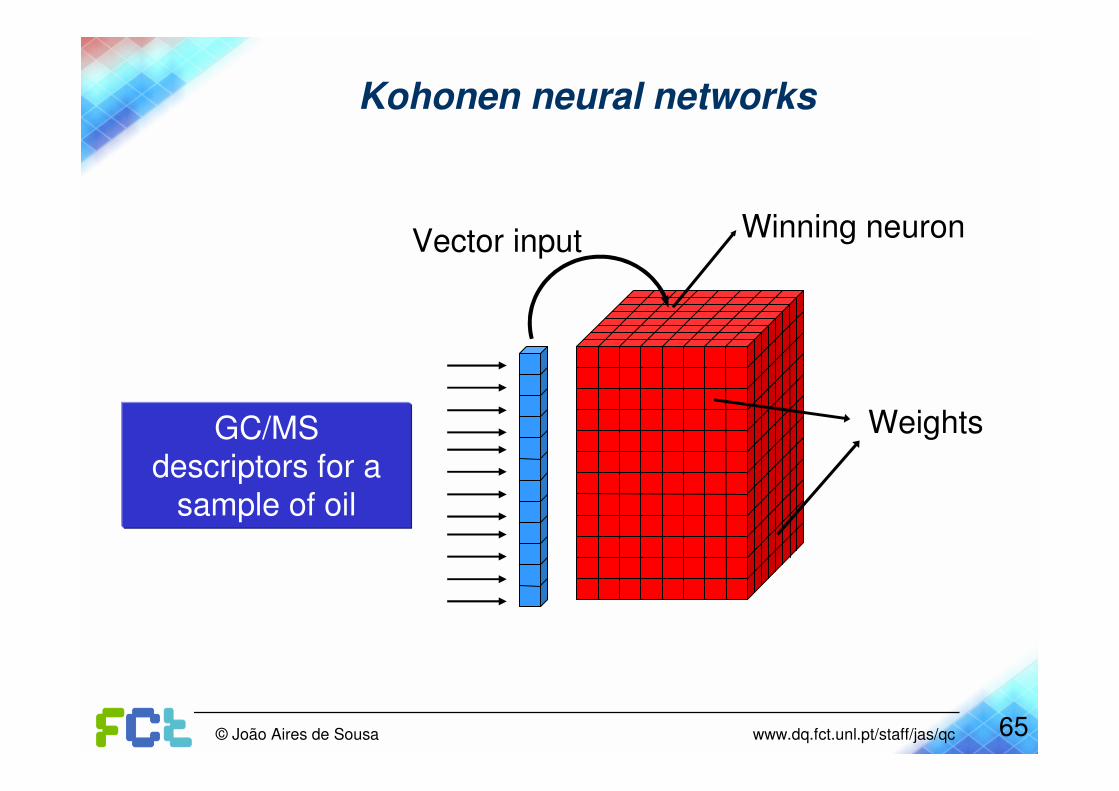
Vector input
GC/MS descriptors for a
sample of oil
Kohonen neural networks
Weights
Winning neuron

66© João Aires de Sousa www.dq.fct.unl.pt/staff/jas/qc
Test set:
• 55 samples• 70% correct predictions
Test set:
• 55 samples• 70% correct predictions
Training set:
• 133 samples• 20 different geographical origins• 21 descriptors
• Good clustering• 97% correct predictions
Training set:
• 133 samples• 20 different geographical origins• 21 descriptors
• Good clustering• 97% correct predictions
Results

67© João Aires de Sousa www.dq.fct.unl.pt/staff/jas/qc
Inputlayer
Output layer
Counterpropagation (CPG) neural network
SOM with an output layer

68© João Aires de Sousa www.dq.fct.unl.pt/staff/jas/qc
Submission ofinput
input
output
Training of a CPG neural network
Correction of
the weights
at the input
layer
Correction of the
corresponding
weights at the
output layer
69© João Aires de Sousa www.dq.fct.unl.pt/staff/jas/qc
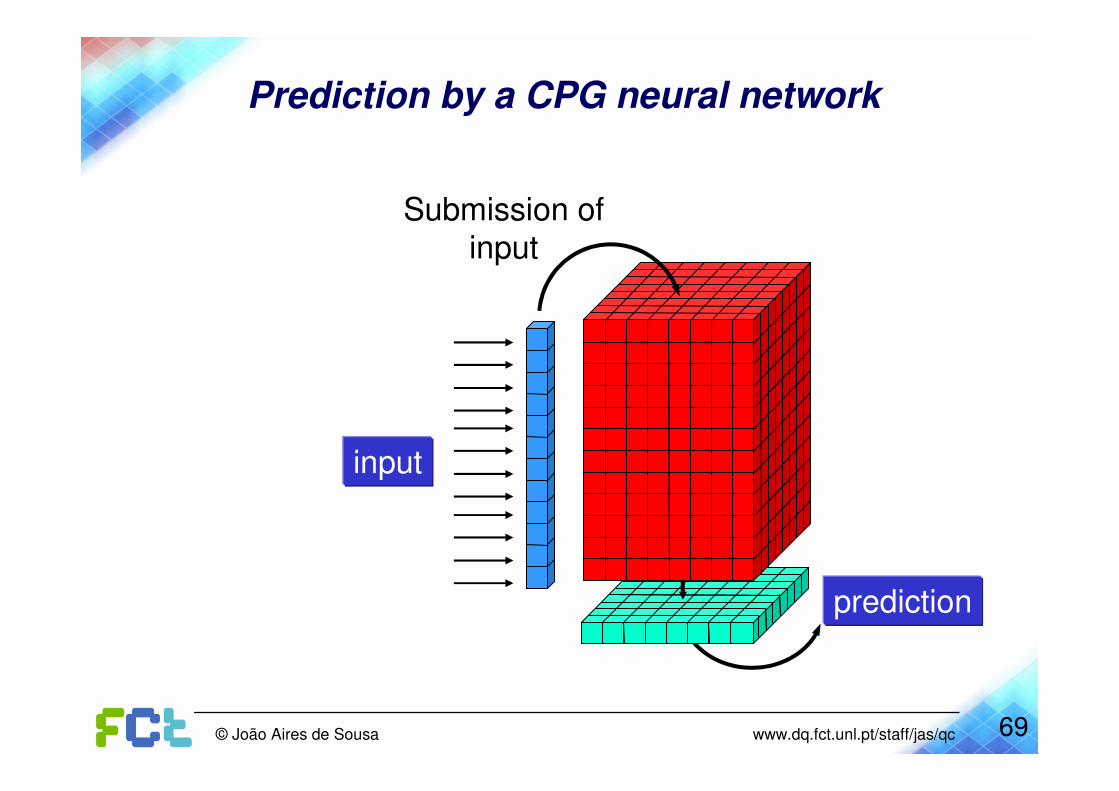
Submission ofinput
input
Prediction by a CPG neural network
prediction
70© João Aires de Sousa www.dq.fct.unl.pt/staff/jas/qc
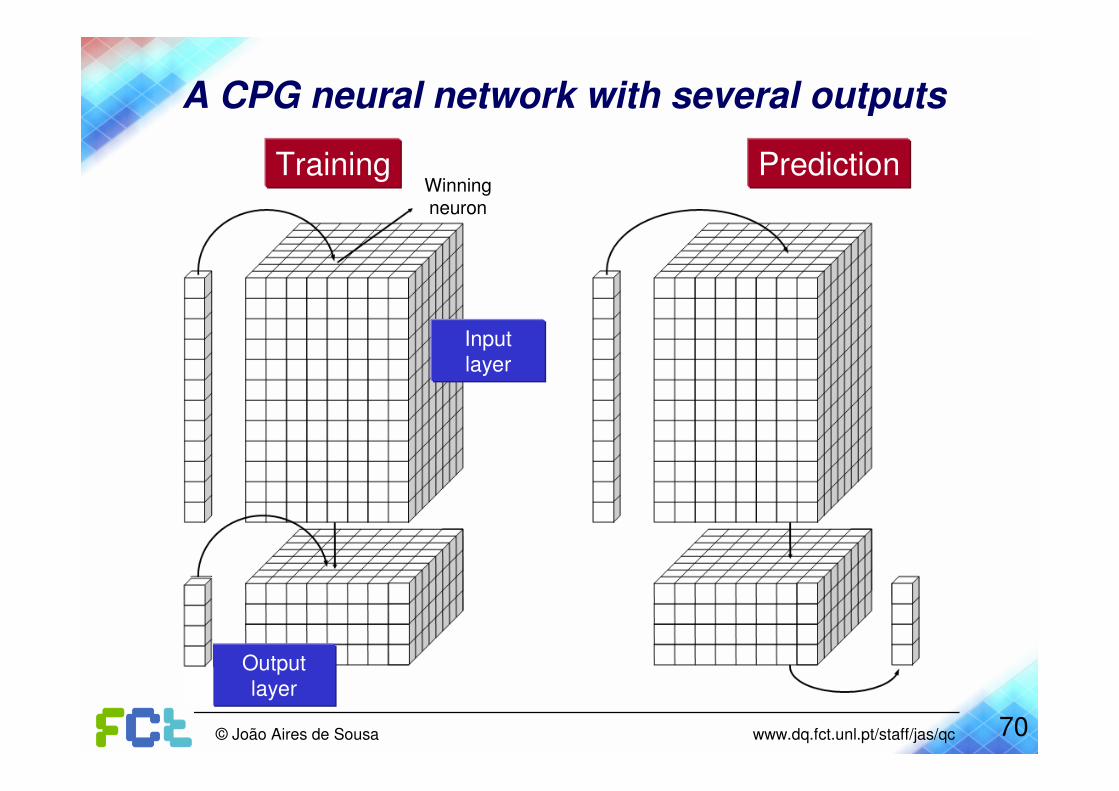
A CPG neural network with several outputs
Prediction
Input
layer
Output
layer
Winning neuron
Training

71© João Aires de Sousa www.dq.fct.unl.pt/staff/jas/qc
CPGNN: application
Ability of a compound to bind GPCR (G-Protein-Coupled Receptors)P.Selzer, P. Ertl, QSAR Comb. Sci. 2005, 24, 270-276; J. Chem. Inf. Model. 2006, 46 (6), 2319 -2323.

72© João Aires de Sousa www.dq.fct.unl.pt/staff/jas/qc
CPGNN: application
Prediction of the ability to bind GPCR (G-Protein-Coupled Receptors)P.Selzer, P. Ertl, QSAR Comb. Sci. 2005, 24, 270-276; J. Chem. Inf. Model. 2006, 46 (6), 2319 -2323.
CPG network of size 250×250
Training set:24870 molecules randomly taken from catalogs (“drug-like”)
1709 known GPCR ligands
Input: 225 descriptors (RDF descriptors)
Output: 9 levels (GPCR and sub-family “adrenalin, bradykinin, dopamine,
endothelin, histamine, opioid, serotonin, vasopressin”). Binary values (0/1)
according to ‘YES’ or ‘NO’.
73© João Aires de Sousa www.dq.fct.unl.pt/staff/jas/qc
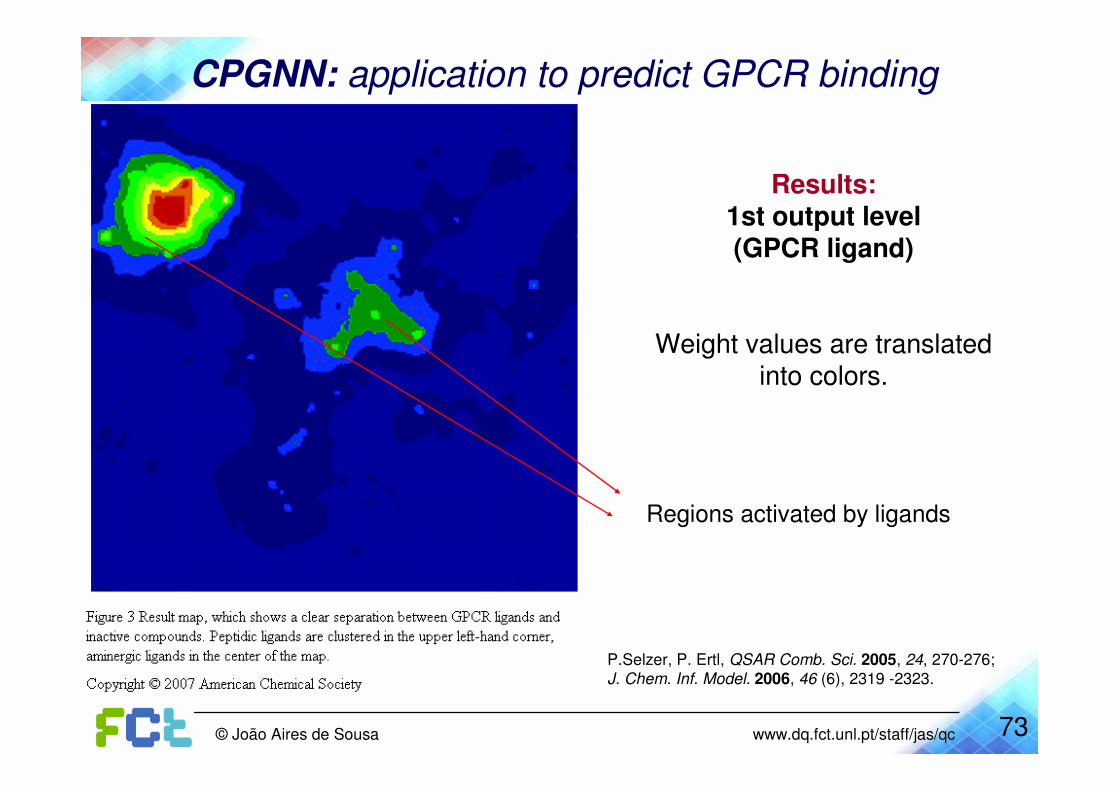
CPGNN: application to predict GPCR binding
P.Selzer, P. Ertl, QSAR Comb. Sci. 2005, 24, 270-276; J. Chem. Inf. Model. 2006, 46 (6), 2319 -2323.
Results:1st output level(GPCR ligand)
Weight values are translated into colors.
Regions activated by ligands

74© João Aires de Sousa www.dq.fct.unl.pt/staff/jas/qc
CPGNN: application to predict GPCR binding
P.Selzer, P. Ertl, QSAR Comb. Sci. 2005, 24, 270-276; J. Chem. Inf. Model. 2006, 46 (6), 2319 -2323.
Results:output levels nr 4 (‘dopamine’) e nr 7 (‘opioid’)
75© João Aires de Sousa www.dq.fct.unl.pt/staff/jas/qc
CPGNN: application to predict GPCR binding
P.Selzer, P. Ertl, QSAR Comb. Sci. 2005, 24, 270-276; J. Chem. Inf. Model. 2006, 46 (6), 2319 -2323.
Results:
Test set
(25096 non-GPCR and 1490 GPCR)
71% of ligands correctly predicted
18% false positives

76© João Aires de Sousa www.dq.fct.unl.pt/staff/jas/qc
SOMs in the JATOON programhttp://www.dq.fct.unl.pt/staff/jas/jatoon
‘Paste’ data
77© João Aires de Sousa www.dq.fct.unl.pt/staff/jas/qc
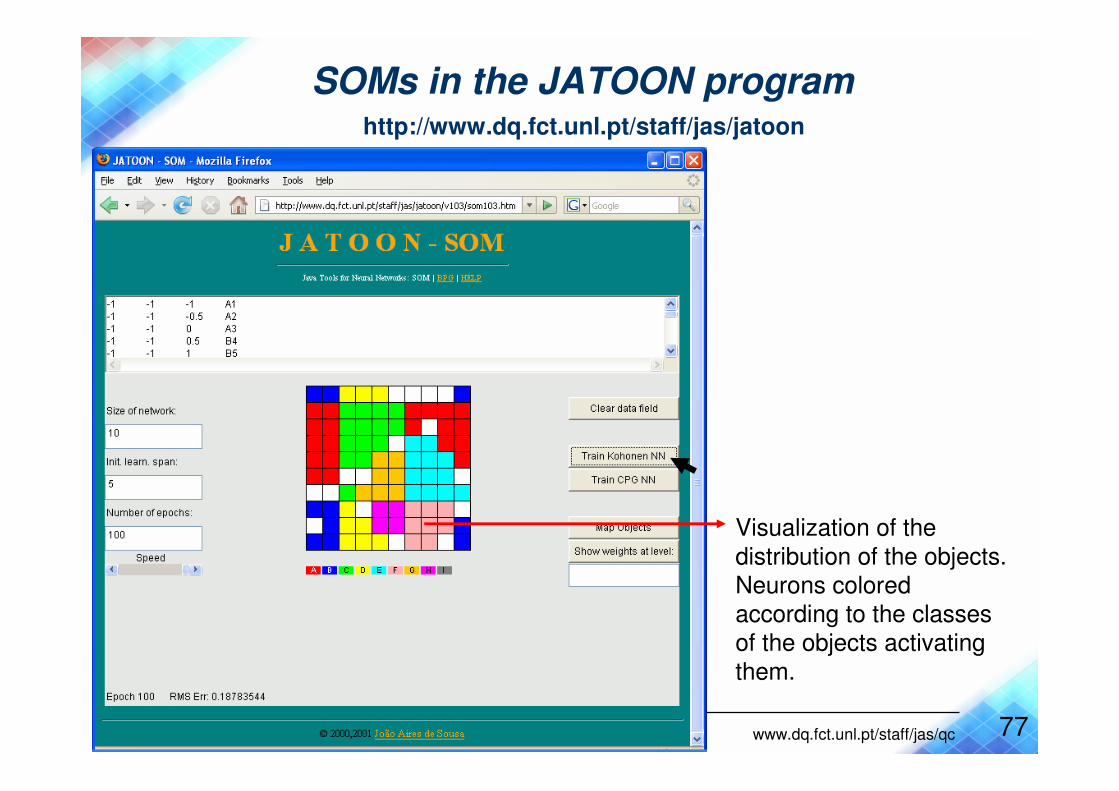
SOMs in the JATOON programhttp://www.dq.fct.unl.pt/staff/jas/jatoon
Visualization of the
distribution of the objects.
Neurons colored
according to the classes of the objects activating
them.
78© João Aires de Sousa www.dq.fct.unl.pt/staff/jas/qc
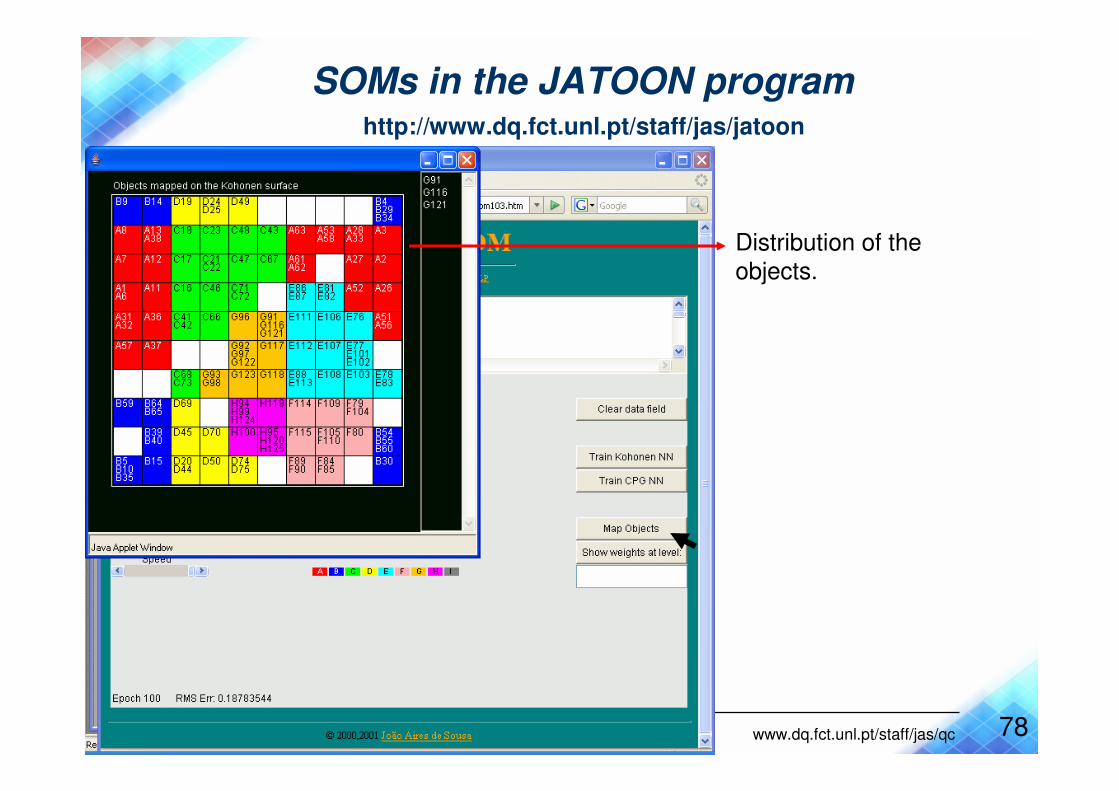
SOMs in the JATOON programhttp://www.dq.fct.unl.pt/staff/jas/jatoon
Distribution of the
objects.

79© João Aires de Sousa www.dq.fct.unl.pt/staff/jas/qc
SOMs in the JATOON programhttp://www.dq.fct.unl.pt/staff/jas/jatoon
Inspection of the weights
at level 2 of the input
layer.


![State of Art: Review of Theoretical Study of GSK-3β and a ...€¦ · QSAR for anti-parasitic drugs. This year we have published another issue [65] focused on QSAR/QSPR models and](https://cdn.vdocuments.site/doc/165x107/5f1808978d7f1942ee7fc335/state-of-art-review-of-theoretical-study-of-gsk-3-and-a-qsar-for-anti-parasitic.jpg)