Download - 3rd Quarter 2020 - Johnson & Johnson

1

3rd Quarter 2020Earnings Call
October 13, 2020

Cautionary Note on Forward-looking Statements
3
This presentation contains “forward-looking statements” as defined in the Private Securities Litigation Reform Act of 1995 regarding, among other things: future
operating and financial performance, product development, market position and business strategy. The reader is cautioned not to rely on these forward-looking
statements. These statements are based on current expectations of future events. If underlying assumptions prove inaccurate or known or unknown risks or
uncertainties materialize, actual results could vary materially from the expectations and projections of Johnson & Johnson. Risks and uncertainties include, but are not
limited to: risks related to the impact of the COVID-19 global pandemic, such as the scope and duration of the outbreak, government actions and restrictive measures
implemented in response, material delays and cancellations of medical procedures, supply chain disruptions and other impacts to our business, or on our ability to
execute business continuity plans, as a result of the COVID-19 pandemic; economic factors, such as interest rate and currency exchange rate fluctuations; competition,
including technological advances, new products and patents attained by competitors; challenges inherent in new product research and development, including
uncertainty of clinical success and obtaining regulatory approvals; uncertainty of commercial success for new and existing products; challenges to patents; the impact of
patent expirations; the ability of the company to successfully execute strategic plans; the impact of business combinations and divestitures; manufacturing difficulties or
delays, internally or within the supply chain; product efficacy or safety concerns resulting in product recalls or regulatory action; significant adverse litigation or
government action, including related to product liability claims; changes to applicable laws and regulations, including tax laws and global health care reforms; trends
toward health care cost containment; changes in behavior and spending patterns of purchasers of health care products and services; financial instability of international
economies and legal systems and sovereign risk; increased scrutiny of the health care industry by government agencies. A further list and descriptions of these risks,
uncertainties and other factors can be found in Johnson & Johnson's Annual Report on Form 10-K for the fiscal year ended December 29, 2019, including in the
sections captioned “Cautionary Note Regarding Forward-Looking Statements” and “Item 1A. Risk Factors,” in the company’s most recently filed Quarterly Report on
Form 10-Q and the company’s subsequent filings with the Securities and Exchange Commission. Copies of these filings are available online at www.sec.gov,
www.jnj.com or on request from Johnson & Johnson. Any forward-looking statement made in this presentation speaks only as of the date of this presentation. Johnson
& Johnson does not undertake to update any forward-looking statement as a result of new information or future events or developments.
Cautionary Note on Non-GAAP Financial MeasuresThis presentation refers to certain non-GAAP financial measures. These non-GAAP financial measures should not be considered replacements for, and should be read
together with, the most comparable GAAP financial measures.
A reconciliation of these non-GAAP financial measures to the most directly comparable GAAP financial measures can be found in the accompanying financial
schedules of the earnings release and the Investor Relations section of the Company’s website at www.investor.jnj.com.

Strategic Partnerships,
Collaborations & Licensing Arrangements
4
During the course of this morning’s presentation, we will discuss a number of products and compounds developed in collaboration
with strategic partners or licensed from other companies. The following is an acknowledgement of those relationships:
ImmunologyREMICADE and SIMPONI/ SIMPONI ARIA marketing partners are Schering-Plough (Ireland) Company, a subsidiary of Merck & Co., Inc. and Mitsubishi Tanabe Pharma Corporation, and TREMFYA
discovered using MorphoSys AG antibody technology
Neuroscience INVEGA SUSTENNA/ XEPLION/ INVEGA TRINZA/ TREVICTA includes technology licensed from Alkermes Pharma Ireland Limited, RISPERDAL CONSTA developed in collaboration with Alkermes, Inc
Infectious Diseases PREZCOBIX/ REZOLSTA fixed-dose combination, SYMTUZA and ODEFSEY developed in collaboration with Gilead Sciences, Inc., and JULUCA developed in collaboration with ViiV Healthcare UK
Cardiovascular/
Metabolism/OtherINVOKANA/ INVOKAMET/ VOKANAMET/ INVOKAMET XR fixed-dose combination licensed from Mitsubishi Tanabe Pharma Corporation, XARELTO co-developed with Bayer HealthCare AG, PROCRIT/
EPREX licensed from Amgen Inc., and X-Linked Retinitis Pigmentosa: AAV-RPGR licensed from MeiraGTx
Oncology
IMBRUVICA developed in collaboration and co-marketed in the U.S. with Pharmacyclics, LLC, an AbbVie company, ZYTIGA licensed from BTG International Ltd., VELCADE developed in collaboration with
Millennium: The Takeda Oncology Company, DARZALEX licensed from Genmab A/S, BALVERSA discovered in collaboration with Astex Pharmaceuticals, Inc., and cusatuzumab licensed and
developing in collaboration argenx BVBA and argenx SE, ERLEADA is licensed from Regents of California and Memorial Sloan Kettering, BCMA CAR-T licensed and developed in collaboration with
Legend Biotech USA Inc., Legend Biotech Ireland Limited (“Legend”), subsidiaries of GenScript Biotech Corporation, niraparib licensed from TESARO, Inc., an oncology-focused business within GSK, and
DuoBody platform licensed from Genmab relates to several bispecific antibody programs; ENHANZE platform licensed from Halozyme Therapeutics, Inc.
Pulmonary
HypertensionUPTRAVI license and supply agreement with Nippon Shinyaku (co-promotion in Japan), and OPSUMIT co-promotion agreement with Nippon Shinyaku in Japan
Global Public Health
Janssen’s Monovalent Ebola Vaccine is developed in collaboration with Bavarian Nordic A/S, and MVA-BN-Filo® is licensed-in from Bavarian Nordic A/S. The program has benefited from funding and
preclinical services from the National Institute of Allergy and Infectious Diseases (NIAID), part of NIH, NIAID support included 2 product development contracts starting in 2008 and 8 pre-clinical services
contracts. This program is also receiving funding from the IMI2 Joint Undertaking under EBOVAC1 (grant nr. 115854), EBOVAC2 (grant nr. 115861), EBOVAC3 (grant nr. 800176), EBOMAN (grant nr.
115850) and EBODAC (grant nr. 115847). The IMI2 Joint Undertaking receives support from the European Union’s Horizon 2020 research and innovation program and the European Federation of
Pharmaceutical Industries and Associations (EFPIA). Further funding for the Ebola vaccine regimen has been provided by the BARDA, within the U.S. Department of Health and Human Services’ Office of
the Assistant Secretary for Preparedness and Response, under Contract Numbers HHSO100201700013C and HHSO100201500008C.. The initial work on Ebola was conducted which was extended from
2002 until 2011. 2002 and 2007 via a Cooperative Research and Development Agreement (CRADA is AI-0114) between Janssen/Crucell and the Vaccine Research Center (VRC)/NIAID, part of the NIH.
Janssen/Crucell have licenses to much of VRC’s Ebola IP specific for human adenovirus under the Ad26/Ad35 Ebola vaccine CRADA invention. VAC69120 (Filovirus multivalent vaccine) developed in
collaboration with Bavarian Nordic; funding: NIH Division of Microbiology and Infectious Diseases (DMID), under Contract Number HHSN272200800056C

Sales Performance and Earnings Review
CFO Remarks
Capital Allocation and Guidance
Q&A
5
Agenda
1
2
3
4
Joseph J. Wolk
Executive Vice President,
Chief Financial Officer
Chris DelOrefice
Vice President,
Investor Relations
Ashley McEvoy
Executive Vice President
Worldwide Chairman,
Medical Devices
Thibaut Mongon
Executive Vice President
Worldwide Chairman,
Consumer Health
Jennifer Taubert
Executive Vice President
Worldwide Chairman,
Pharmaceuticals
Mathai Mammen
Global Head of Janssen
Research and Development

Regional Sales Results Q3 2020 Q3 2019
% CHANGE
Reported Operational1
U.S. $11.1 $10.8 2.7% 2.7%
Europe 4.8 4.5 8.0 4.6
Western Hemisphere
(ex U.S.)1.3 1.5 (12.9) (1.2)
Asia-Pacific, Africa 3.9 4.0 (2.7) (3.2)
International 10.0 9.9 0.6 0.6
Worldwide (WW) $21.1 $20.7 1.7% 1.7%
1 Non-GAAP measure; excludes the impact of translational currency; see reconciliation schedules in the Investors section of the company's website2 Note: Values may not add due to rounding
3rd Quarter 2020 Sales
Dollars in Billions
6

3.8%; 2.4%1
Q3 2020 Q3 2019
$2.20
$2.12
3rd Quarter 2020 Financial HighlightsDollars in Billions, except EPS
Reported %; Operational %1
7
Sales
Adjusted Earnings2 Adjusted EPS2
1.7%; 1.7%1
$21.1 $20.7
GAAP Earnings
102.7%
$3.6
$1.8
3.5%
Q3 2020 Q3 2019
GAAP EPS
101.5%
$1.33
$0.66
Q3 2020Q3 2020 Q3 2019 Q3 2019Q3 2020 Q3 2019
$5.9
$5.7
1 Non-GAAP measure; excludes the impact of translational currency; see reconciliation schedules in the Investors section of the company's website2 Non-GAAP measure; excludes intangible amortization expense and special items; see reconciliation schedules in the Investors section of the company's website

OTC$1,142
Skin Health/Beauty$1,149
Oral Care$412
Baby Care$393
Women's Health$230
Wound Care/Other$189
$3,5141.3%, 3.0%
WW Sales $MM■ Reported Growth ■ Operational Growth1
Consumer Health Highlights – 3rd Quarter 2020Double digit U.S. growth partially offset by negative OUS COVID-19 impacts
8
Key Drivers of Operational Performance1
OTC
• U.S. increase driven by share growth for TYLENOL primarily due to COVID-19
demand, PEPCID due to competitive withdrawal; ZYRTEC due to share gains; and
increased retailer stocking across multiple brands as well as ZARBEE's strength
• OUS decline due to COVID-19 negative impacts, primarily consumption declines in
China in Pain and in other regions impacting Cough & Cold and Digestive Health
Skin Health/
Beauty
• U.S. growth driven by OGX share gains, increased retail stocking and lower Sun
Care returns partially offset by competitive pressures and negative COVID -19 market
impacts primarily in Cleansing, Sun Care and Makeup
• OUS decline driven by negative COVID-19 impacts in ASPAC and LATAM partially
offset by strong e-commerce growth for DR. CI LABO and OGX
Oral Care• Primarily due to strong performance of LISTERINE mouthwash driven by new
product launches in ASPAC and increased demand globally related to COVID-19
Baby Care• Decline due to Baby Center divestiture prior year, SKU rationalization primarily in
EMEA and the negative impact of COVID-19 partially offset by AVEENO e-commerce
growth primarily driven by COVID-19 demand
Women’s
Health
• Declines driven by liners and internal sanitary protection pricing reductions in EMEA
partially offset by napkins growth due to COVID-19 recovery in India
Wound
Care/Other
• Growth due to BAND-AID® Brand Adhesive Bandages strong performance in the U.S.
and isopropyl alcohol in ASPAC primarily attributed to COVID-19
Adjusted Operational Sales2: WW 3.1%, U.S. 12.0%, Int’l (2.8)%
Reported: WW 1.3%, U.S. 11.6%, Int’l (5.6)%
Operational1: WW 3.0%, U.S. 11.6%, Int’l (2.7)%
1 Non-GAAP measure; excludes the impact of translational currency; see reconciliation schedules in the Investors section of the company's website2 Non-GAAP measure; excludes acquisitions and divestitures and translational currency; see reconciliation schedules in the Investors section of the company's website
Note: Values may not add due to rounding
4.0%, 4.0%
(9.6)%, (4.1)%
12.5%, 13.5%
(5.9)%, (0.7)%
8.5%, 10.8%
(0.2)%, 0.9%

Key Drivers of Operational Performance1
Immunology
• Growth driven by strong uptake of STELARA in Crohn’s Disease and Ulcerative Colitis and
strength of TREMFYA in Psoriasis, partially offset by COVID-19 impacts to market growth
and unfavorable channel mix dynamics in the U.S.
• REMICADE decline due to increased discounts/rebates and biosimilar competition
Infectious
Diseases
• Driven by strong sales of SYMTUZA in the US and launch uptake of JULUCA in the EU,
partially offset by increased competition for PREZISTA/PREZCOBIX/REZOLSTA and
PREZISTA OUS LOE
Neuroscience
• Paliperidone long-acting injectables growth due to strength of INVEGA
SUSTENNA/XEPLION and INVEGA TRINZA/TREVICTA from new patient starts and
persistency, partially offset by cannibalization of RISPERDAL CONSTA, declines in U.S.
CONCERTA due to competitive entrants, and COVID-19
Oncology
• DARZALEX increase driven by continued strong market growth and share gains in the U.S.
and EU and solid uptake of the subcutaneous formulation that was approved in Q2
• Strong sales of IMBRUVICA due to increased patient uptake globally, partially offset by
unfavorable prior year one-time inventory and returns reserve comparisons in the US
• Continued strong global launch uptake of ERLEADA and share gains in non-metastatic
CRPC as well as recently approved mCSPC indication
• Lower sales and share of VELCADE and ZYTIGA due to generic competition
Cardiovascular/
Metabolism/
Other
(CVM/Other)
• Decline driven by lower sales of PROCRIT/EPREX due to biosimilar competition
• Modest growth in XARELTO due to a one-time prior period pricing adjustment and demand
growth, partially offset by increased rebates
• INVOKANA/INVOKAMET increase due to market growth and favorable channel mix
dynamics in the U.S. as well as strength in the EU, partially offset by U.S. share declines
due to competitive pressures
Pulmonary
Hypertension
(PH)
• Growth in OPSUMIT and UPTRAVI due to continued share gains, market growth, and
improved payer mix, partially offset by the impact of COVID-19
Adjusted Operational Sales2: WW 4.7%, U.S. 1.5%, Int’l 9.2%
Immunology$3,789
Infectious Diseases$864
Neuroscience$1,605
Oncology$3,129 CVM/Other
$1,281
PH$749$11,418
5.0%, 4.6%
WW Sales $MM■ Reported Growth ■ Operational Growth1
Pharmaceutical Highlights – 3rd Quarter 2020
9
Reported: WW 5.0%, U.S. 1.5%, Int’l 9.7%
Operational1: WW 4.6%, U.S. 1.5%, Int’l 8.8%
1 Non-GAAP measure; excludes the impact of translational currency; see reconciliation schedules in the Investors section of the company's website2 Non-GAAP measure; excludes acquisitions and divestitures and translational currency; see reconciliation schedules in the Investors section of the company's website
Note: Values may not add due to rounding
(2.6)%, (2.5)%
14.5%, 13.9%
13.3%, 12.4%
0.6%, 0.4%
3.0%, 2.6%2.1%, 1.9%
Growth across most therapeutic areas

Orthopaedics$2,083
Surgery$2,152
Vision$1,081
Interventional Solutions
$836
$6,150(3.6)%, (3.9)%
WW Sales $MM■ Reported Growth ■ Operational Growth1
Medical Devices Highlights – 3rd Quarter 2020Decline driven by negative impact of COVID-19, partially offset by double digit growth in Interventional
Solutions
10
Reported: WW (3.6)%, U.S. 1.2%, Int’l (8.1)%
Operational1: WW (3.9)%, U.S. 1.2%, Int’l (8.5)%
Key Drivers of Operational Performance1
Interventional
Solutions
• Returned to double-digit growth driven by atrial fibrillation procedure growth coupled
with strength from new products, including the CARTO VIZIGO sheath
Orthopaedics
• Hips: Returned to growth due to market procedure recovery as well as our leadership
in the Anterior approach, strong market demand for the ACTIS stem and enabling
technologies – KINCISE and VELYS Hip Navigation
• Trauma: Returned to growth with procedures rebounding and strength from new
products
• Knees: Decline driven by the negative impact of COVID-19
• Spine, Sports & Other: Decline driven by the negative impact of COVID-19 partially
offset by strong uptake of SYMPHONY in Spine
• Spine: WW: ~Flat, U.S.: ~+1%, OUS: ~(3%)
Surgery
• Advanced:
• Endocutters: ~(3%) Primarily driven by the negative impact of COVID-19 and
competitive pressures in the U.S. partially offset by new products OUS, primarily
EMEA and China
• Biosurgery: ~+5% Returned to growth globally led by share gains from
SURGIFLO after prior year supply disruption and procedure rebound
• Energy: ~(7%) Primarily driven by the negative impact of COVID-19 and
competitive pressures in the U.S. partially offset by new product growth in China
• General: Decline primarily driven by the negative impact of COVID-19
Vision
• Contact Lenses/Other: Decline primarily driven by the negative impact of COVID-19;
U.S. returned to growth partially driven by higher level of stocking
• Surgical: Decline primarily driven by the negative impact of COVID-19 coupled with
competitive pressures in the U.S.
Adjusted Operational Sales2: WW (3.3)%, U.S. 1.3%, Int’l (7.6)%
1 Non-GAAP measure; excludes the impact of translational currency; see reconciliation schedules in the Investors section of the company's website2 Non-GAAP measure; excludes acquisitions and divestitures and translational currency; see reconciliation schedules in the Investors section of the company's website
Note: Values may not add due to rounding
12.9%, 12.4%
(9.4)%, (9.5)%
(2.6)%, (3.1)%
(6.9)%, (6.9)%
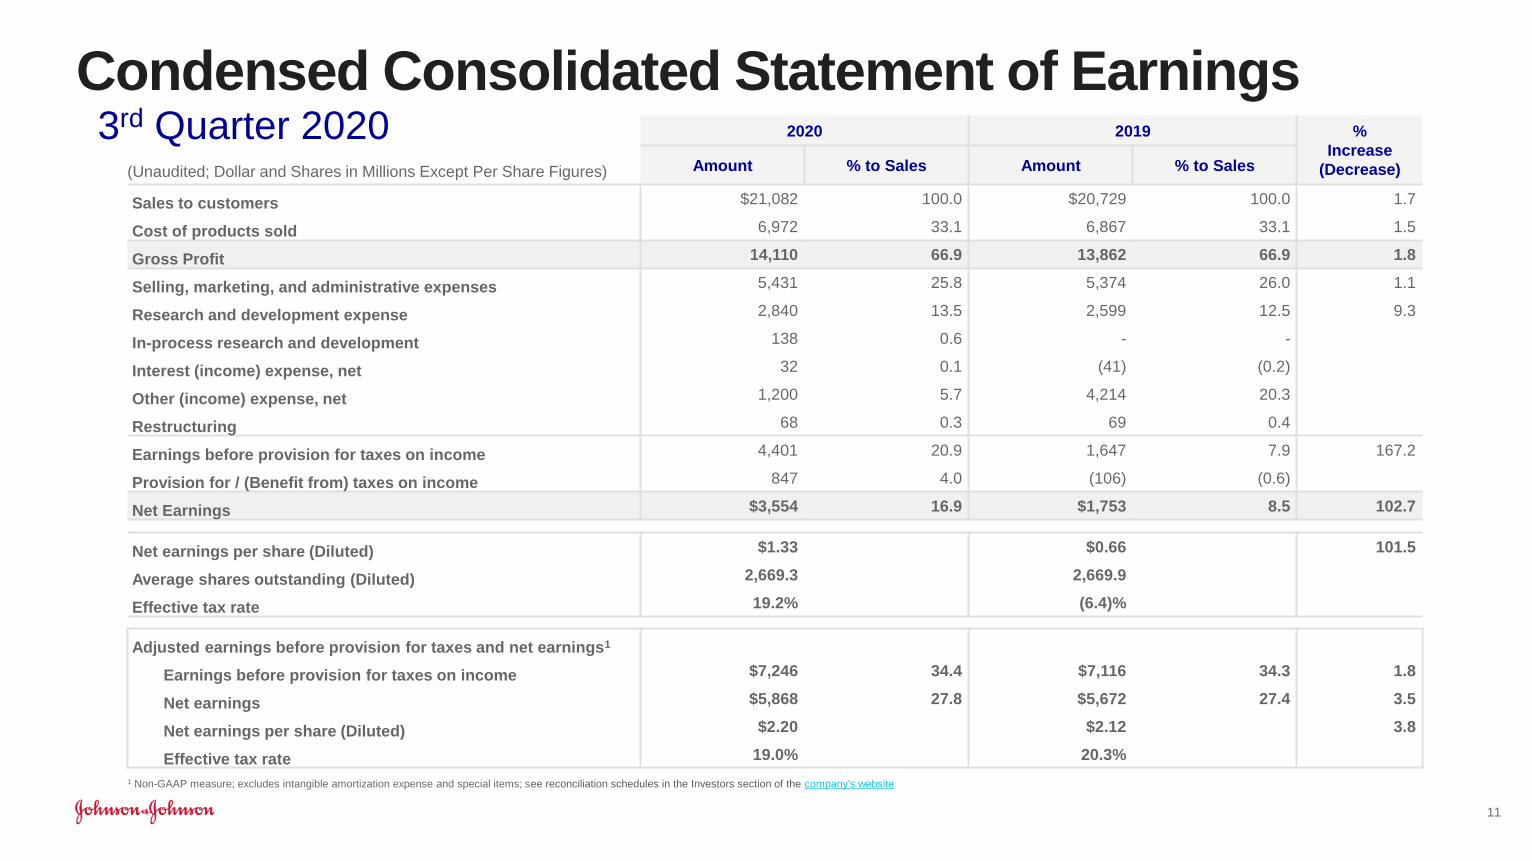
Condensed Consolidated Statement of Earnings
1 Non-GAAP measure; excludes intangible amortization expense and special items; see reconciliation schedules in the Investors section of the company's website
11
2020 2019 %
Increase
(Decrease)Amount % to Sales Amount % to Sales
Sales to customers $21,082 100.0 $20,729 100.0 1.7
Cost of products sold 6,972 33.1 6,867 33.1 1.5
Gross Profit 14,110 66.9 13,862 66.9 1.8
Selling, marketing, and administrative expenses 5,431 25.8 5,374 26.0 1.1
Research and development expense 2,840 13.5 2,599 12.5 9.3
In-process research and development 138 0.6 - -
Interest (income) expense, net 32 0.1 (41) (0.2)
Other (income) expense, net 1,200 5.7 4,214 20.3
Restructuring 68 0.3 69 0.4
Earnings before provision for taxes on income 4,401 20.9 1,647 7.9 167.2
Provision for / (Benefit from) taxes on income 847 4.0 (106) (0.6)
Net Earnings $3,554 16.9 $1,753 8.5 102.7
-
Net earnings per share (Diluted) $1.33 $0.66 101.5
Average shares outstanding (Diluted) 2,669.3 2,669.9
Effective tax rate 19.2% (6.4)%
.
Adjusted earnings before provision for taxes and net earnings1
Earnings before provision for taxes on income $7,246 34.4 $7,116 34.3 1.8
Net earnings $5,868 27.8 $5,672 27.4 3.5
Net earnings per share (Diluted) $2.20 $2.12 3.8
Effective tax rate 19.0% 20.3%
3rd Quarter 2020(Unaudited; Dollar and Shares in Millions Except Per Share Figures)

Adjusted Income Before Tax by Segment1
3rd Quarter 2020
12
Pharmaceutical
Medical Devices
Consumer Health
Expenses Not Allocated to Segments
3Q 2020 3Q 2019
Pharmaceutical 46.4% 43.0%
Medical Devices 21.6% 29.3%
Consumer Health 24.4% 21.6%
Total 34.4% 34.3%
1 Non-GAAP measure; excludes amortization expense and special items; see reconciliation schedules in the Investors section of the company's website2 Estimated as of 10/13/2020
Note: Values may not add due to rounding
% to Sales

CFO Remarks
Joseph J. WolkExecutive Vice President,
Chief Financial Officer
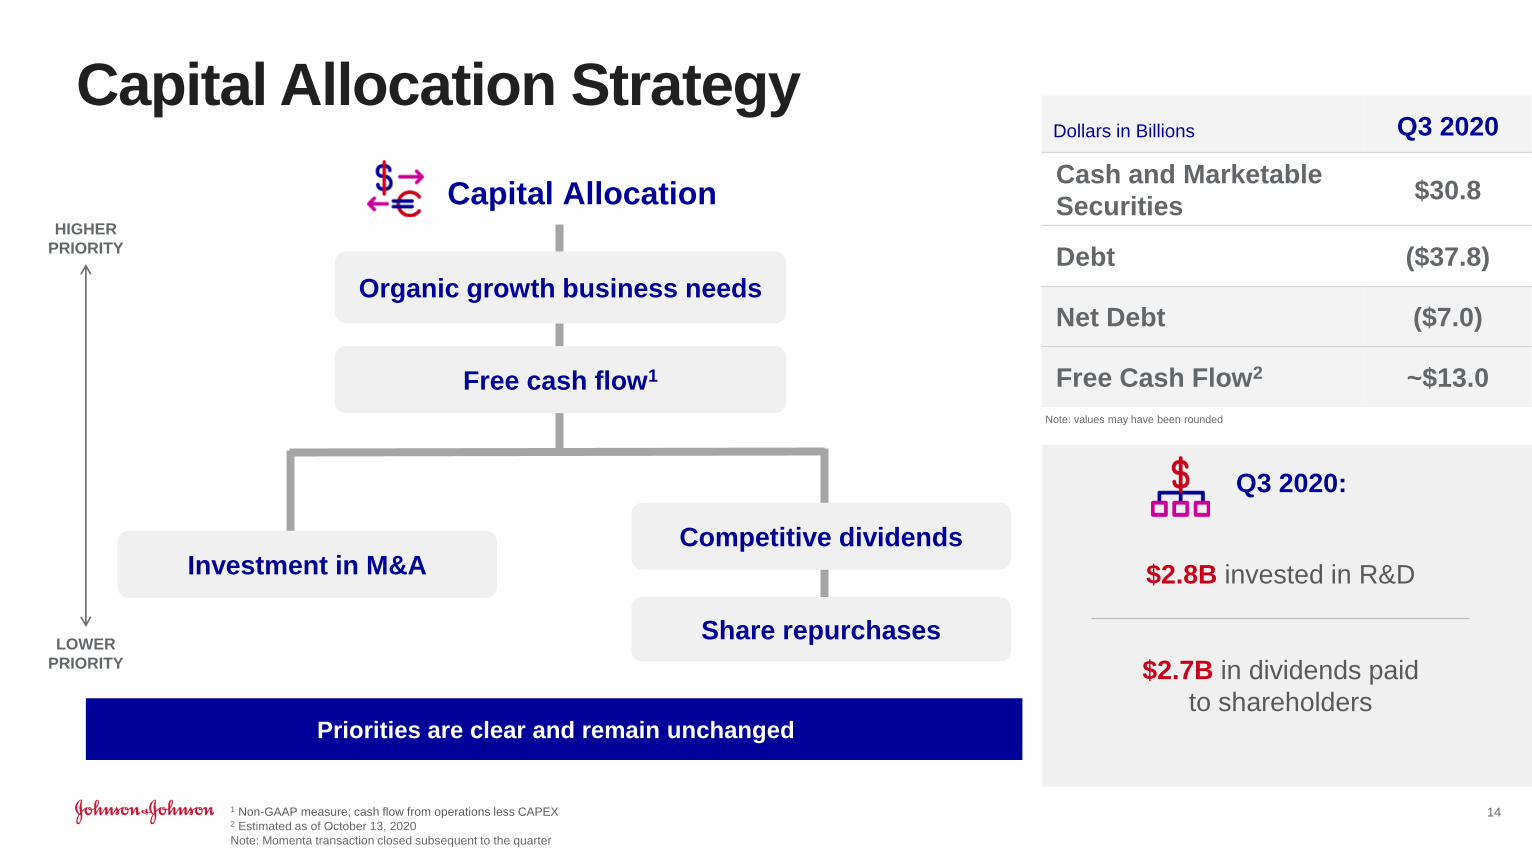
Capital Allocation Strategy
Capital Allocation
Organic growth business needs
Free cash flow1
Priorities are clear and remain unchanged
Competitive dividends
Share repurchases
HIGHER
PRIORITY
LOWER
PRIORITY
Investment in M&A
Dollars in Billions Q3 2020
Cash and Marketable
Securities$30.8
Debt ($37.8)
Net Debt ($7.0)
Free Cash Flow2 ~$13.0
Q3 2020:
$2.8B invested in R&D
$2.7B in dividends paid
to shareholders
Note: values may have been rounded
1 Non-GAAP measure; cash flow from operations less CAPEX2 Estimated as of October 13, 2020
Note: Momenta transaction closed subsequent to the quarter
14

Notable New Announcements in 3rd Quarter 20201
Pharmaceuticals
• Regulatory Approvals:
– SIMPONI ARIA (golimumab) – Approved by the U.S. Food and Drug Administration for Active Polyarticular Juvenile Idiopathic Arthritis and Extension of Its Active Psoriatic Arthritis Indication in
Patients 2 Years of Age and Older
– SPRAVATO (esketamine) – Janssen Announces U.S. FDA Approval of CIII Nasal Spray to Treat Depressive Symptoms in Adults with Major Depressive Disorder with Acute Suicidal Ideation or
Behavior
– DARZALEX (daratumumab) – U.S. FDA Approves New DARZALEX-Based Combination Regimen for Patients with Relapsed/Refractory Multiple Myeloma
– STELARA (ustekinumab) – U.S. Food and Drug Administration Approves Treatment of Pediatric Patients with Moderate to Severe Plaque Psoriasis
• Regulatory Submissions:
– UPTRAVI (selexipag) – Janssen Submits New Drug Application (NDA) to U.S. FDA for Injection for Intravenous Use to Treat Pulmonary Arterial Hypertension (PAH)
– DARZALEX FASPRO (daratumumab and hyaluronidase-fihj) – Janssen Submits Application Seeking U.S. FDA Approval for the Treatment of Patients with Light Chain (AL) Amyloidosis
• Other:
– Johnson & Johnson Announces European Commission Approval of Agreement to Supply 200 Million Doses of Janssen's COVID-19 Vaccine Candidate 2
– Johnson & Johnson Completes Acquisition of Momenta Pharmaceuticals, Inc.2
– Johnson & Johnson Initiates Pivotal Global Phase 3 Clinical Trial of Janssen's COVID-19 Vaccine Candidate
– Johnson & Johnson Announces that Janssen’s COVID-19 Investigational Vaccine Candidate Prevents Severe Clinical Disease in Pre-clinical Studies
– Janssen to Discontinue Pimodivir Influenza Development Program
– Johnson & Johnson Announces Agreement with U.S. Government for 100 Million Doses of Investigational COVID-19 Vaccine
Medical Devices
• Regulatory Approvals:
– THERMOCOOL SMARTTOUCH – Biosense Webster Receives FDA Approval for SF Ablation Catheter for the Treatment of Persistent Atrial Fibrillation2
• Other:
– CERENOVUS Launches New Suite of Technologies to Advance Stroke Treatment
– U.S. FDA Grants Ethicon Breakthrough Device Designation for Monarch-enabled NeuWave Microwave Ablation Technology
15
1 These developments and all other news releases are available online in the Investors section of the company’s website at news releases2 Subsequent to the quarter

Medical DevicesUpdateThursday, November 19, 2020
Save the Date
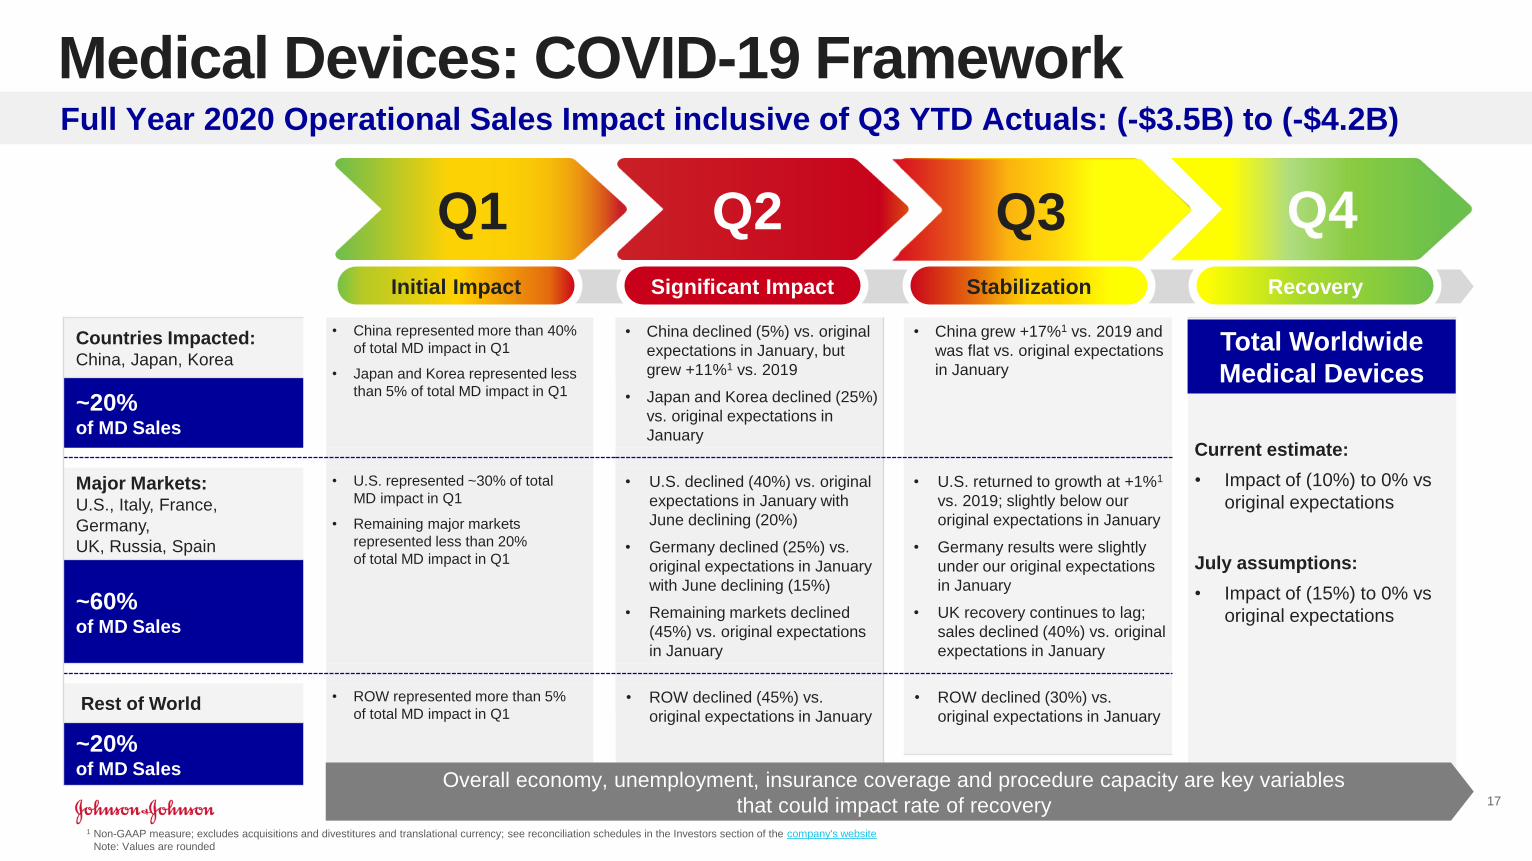
Countries Impacted:China, Japan, Korea
• China represented more than 40%
of total MD impact in Q1
• Japan and Korea represented less
than 5% of total MD impact in Q1
• China declined (5%) vs. original
expectations in January, but
grew +11%1 vs. 2019
• Japan and Korea declined (25%)
vs. original expectations in
January
• China grew +17%1 vs. 2019 and
was flat vs. original expectations
in January
Current estimate:
• Impact of (10%) to 0% vs
original expectations
July assumptions:
• Impact of (15%) to 0% vs
original expectations
~20%of MD Sales
Major Markets:U.S., Italy, France,
Germany,
UK, Russia, Spain
• U.S. represented ~30% of total
MD impact in Q1
• Remaining major markets
represented less than 20%
of total MD impact in Q1
• U.S. declined (40%) vs. original
expectations in January with
June declining (20%)
• Germany declined (25%) vs.
original expectations in January
with June declining (15%)
• Remaining markets declined
(45%) vs. original expectations
in January
• U.S. returned to growth at +1%1
vs. 2019; slightly below our
original expectations in January
• Germany results were slightly
under our original expectations
in January
• UK recovery continues to lag;
sales declined (40%) vs. original
expectations in January
~60%of MD Sales
Rest of World • ROW represented more than 5%
of total MD impact in Q1• ROW declined (45%) vs.
original expectations in January
• ROW declined (30%) vs.
original expectations in January
~20%of MD Sales
Medical Devices: COVID-19 Framework
17
Full Year 2020 Operational Sales Impact inclusive of Q3 YTD Actuals: (-$3.5B) to (-$4.2B)
Initial Impact Significant Impact Stabilization Recovery
Q1 Q2 Q3 Q4
Overall economy, unemployment, insurance coverage and procedure capacity are key variables
that could impact rate of recovery
Total Worldwide
Medical Devices
Q3 Q4
1 Non-GAAP measure; excludes acquisitions and divestitures and translational currency; see reconciliation schedules in the Investors section of the company's website 1 Note: Values are rounded
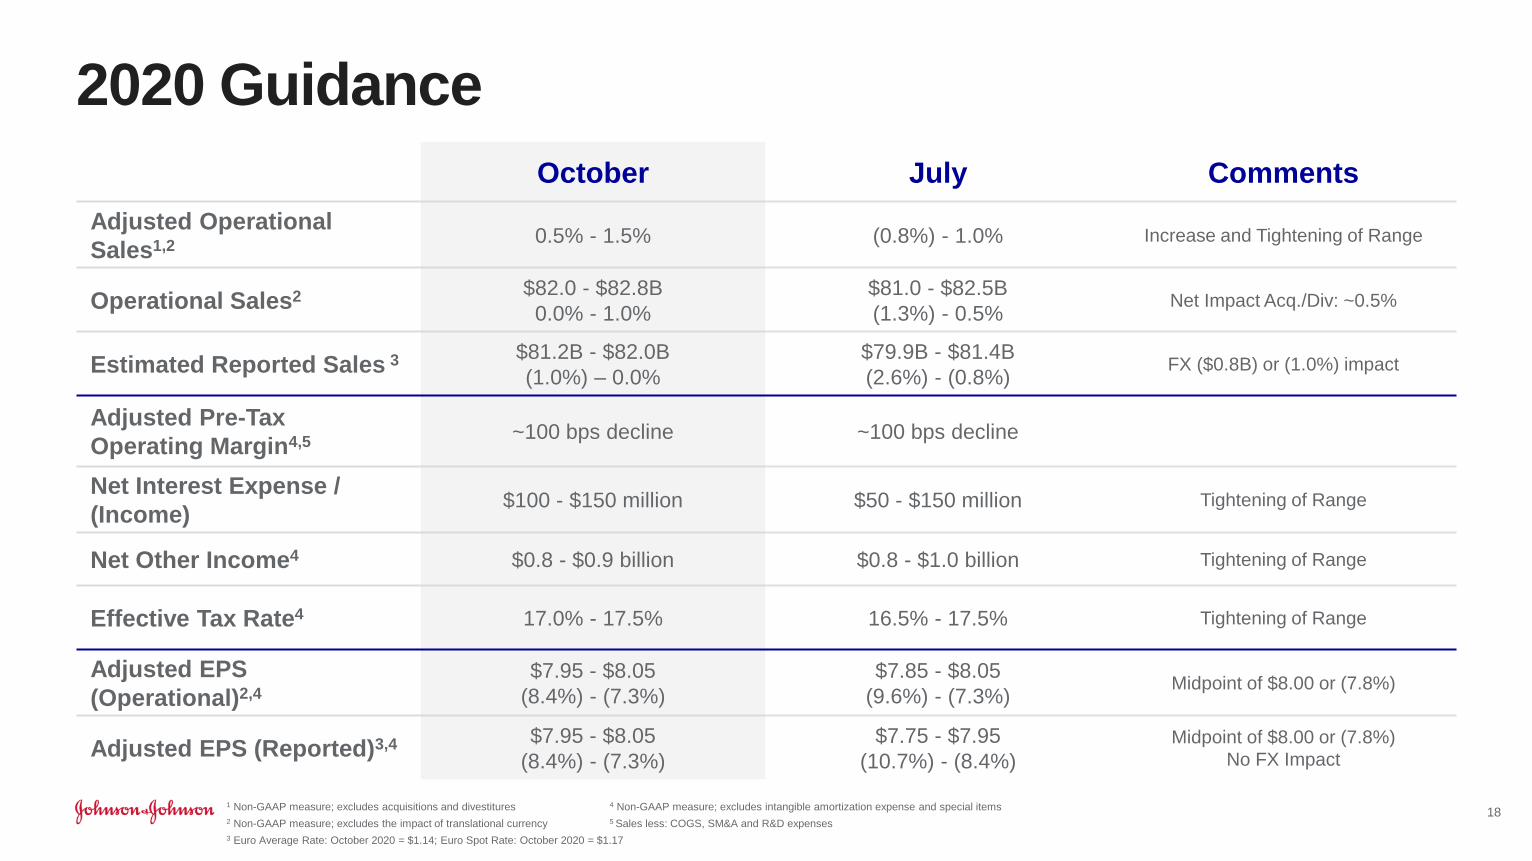
2020 Guidance
1 Non-GAAP measure; excludes acquisitions and divestitures 4 Non-GAAP measure; excludes intangible amortization expense and special items
2 Non-GAAP measure; excludes the impact of translational currency 5 Sales less: COGS, SM&A and R&D expenses
3 Euro Average Rate: October 2020 = $1.14; Euro Spot Rate: October 2020 = $1.17
18
October July Comments
Adjusted Operational
Sales1,20.5% - 1.5% (0.8%) - 1.0% Increase and Tightening of Range
Operational Sales2 $82.0 - $82.8B
0.0% - 1.0%
$81.0 - $82.5B
(1.3%) - 0.5% Net Impact Acq./Div: ~0.5%
Estimated Reported Sales 3 $81.2B - $82.0B
(1.0%) – 0.0%
$79.9B - $81.4B
(2.6%) - (0.8%)FX ($0.8B) or (1.0%) impact
Adjusted Pre-Tax
Operating Margin4,5~100 bps decline ~100 bps decline
Net Interest Expense /
(Income)$100 - $150 million $50 - $150 million Tightening of Range
Net Other Income4 $0.8 - $0.9 billion $0.8 - $1.0 billion Tightening of Range
Effective Tax Rate4 17.0% - 17.5% 16.5% - 17.5% Tightening of Range
Adjusted EPS
(Operational)2,4
$7.95 - $8.05
(8.4%) - (7.3%)
$7.85 - $8.05
(9.6%) - (7.3%)Midpoint of $8.00 or (7.8%)
Adjusted EPS (Reported)3,4 $7.95 - $8.05
(8.4%) - (7.3%)
$7.75 - $7.95
(10.7%) - (8.4%)
Midpoint of $8.00 or (7.8%)
No FX Impact

Pharmaceuticals
19
2021 Considerations
EnterpriseMedical Devices
‒ On going focus on
reaching patients
through transformational
innovation
‒ Expect to continue to
deliver above market
growth
‒ Continued strength in
underlying market
fundamentals
‒ Assume procedures to
be largely permissible
throughout the year
leading to double-digit
operational sales growth
‒ Strong YoY sales and
EPS performance
‒ Anticipate operating
margin in-line with 2019
exit
‒ 2020 additional 2 to 3
shipping days (53rd week)
‒ Expect competitive
growth with the market
and enhanced strength
in e-Commerce channel
‒ 2020 COVID-19
elevated consumption
trends for health and
hygiene focused brands
Consumer Health

Q&A
Jennifer TaubertExecutive Vice President
Worldwide Chairman,
Pharmaceuticals
Executive Vice President
Worldwide Chairman,
Medical Devices
Ashley McEvoy
Joseph J. WolkExecutive Vice President,
Chief Financial Officer
Thibaut MongonExecutive Vice President
Worldwide Chairman,
Consumer Health
Mathai MammenGlobal Head of Janssen
Research and Development


