Download - 21.02.2013 KHAN BANK, Norihiko Kato

Coal Mongolia 2013Ulaanbaatar, Mongolia
Norihiko KatoCEO

2
Mongolia
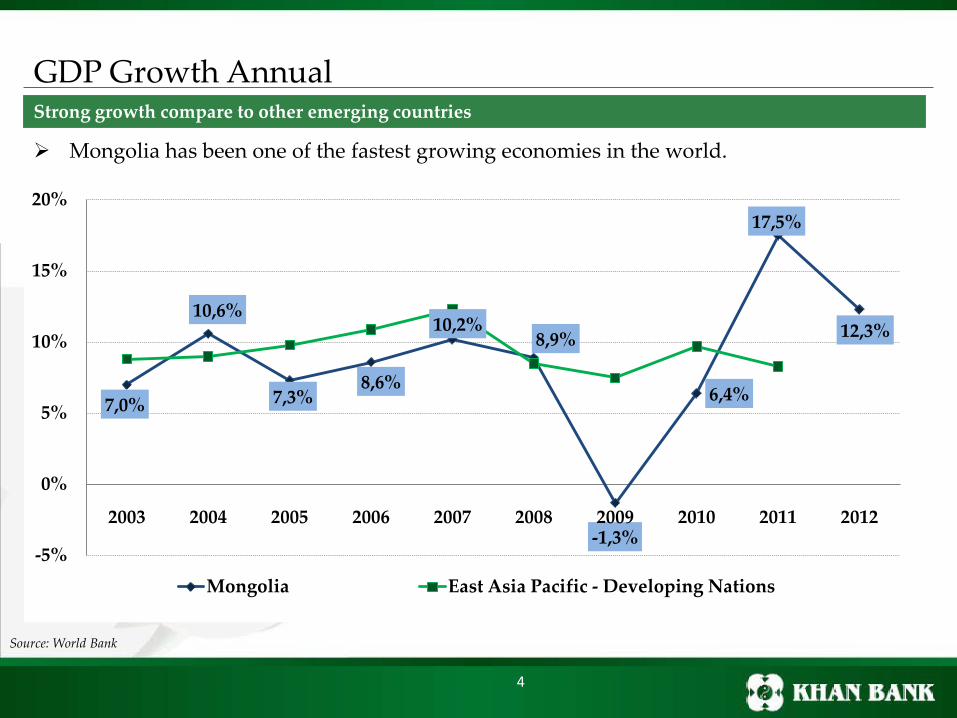
Real GDP growth in 2011 - 17.5%( Nominal GDP - USD8 billion)
Wholesale and retail – 42.5% growth Repair of motor vehicle – 16.0% growth Construction – 14.3% growth Mining and quarrying – 8.7% growth
Real GDP growth in 2012 - 12.3% (Nominal GDP – USD10 billion)
Agriculture – 21.3% growth Transportation – 11.4% growth Wholesale and retail – 9.2% growth Mining and quarrying – 8.9% growth
We see Supply Chain Effect and Economic Ripple Effect
Source: National Statistical Office (NSO)

3
GDP structureGDP Historical numbers
Source: National Statistical Office
22% 19% 20% 19% 20% 16% 14% 15%
31% 32% 31% 28% 28%28% 26% 25%
36% 37% 38% 40% 41%43%
42% 43%
11% 12% 11% 12% 10% 14% 18% 17%
2005 2006 2007 2008 2009 2010 2011 2012
Бүтээгдэхүүний Цэвэр Татвар Үйлчилгээ Үйлдвэрлэл & Барилга ХАА
4
7,0%
10,6%
7,3%8,6%
10,2%8,9%
-1,3%
6,4%
17,5%
12,3%
-5%
0%
5%
10%
15%
20%
2003 2004 2005 2006 2007 2008 2009 2010 2011 2012
Mongolia East Asia Pacific - Developing Nations
GDP Growth Annual
Source: World Bank
Strong growth compare to other emerging countries
Mongolia has been one of the fastest growing economies in the world.

5
Inflation Challenges to reduce inflation
17,8%
22,1%
4,2%
13,0%
10,2%14,0%
0%
5%
10%
15%
20%
25%
2007 2008 2009 2010 2011 2012
Core Inflation National CPI
Source: Bank of Mongolia, NSO
In 2012, inflation reached 14.0%. Central Bank of Mongolia introduced “Price Stabilization Program” in December 2012.

Currency Exchange Rate
Source: Central Bank of Mongolia
6
Central Bank of Mongolia’s currency intervention
Central Bank of Mongolia has been making interventions to smooth market fluctuation.
-2%
0%
2%
4%
6%
8%
10%
1 100₮
1 150₮
1 200₮
1 250₮
1 300₮
1 350₮
1 400₮
1 450₮
01.2011 07.2011 01.2012 07.2012 01.2013
BoM bought USD BoM sold USD Official Rate Daily changes
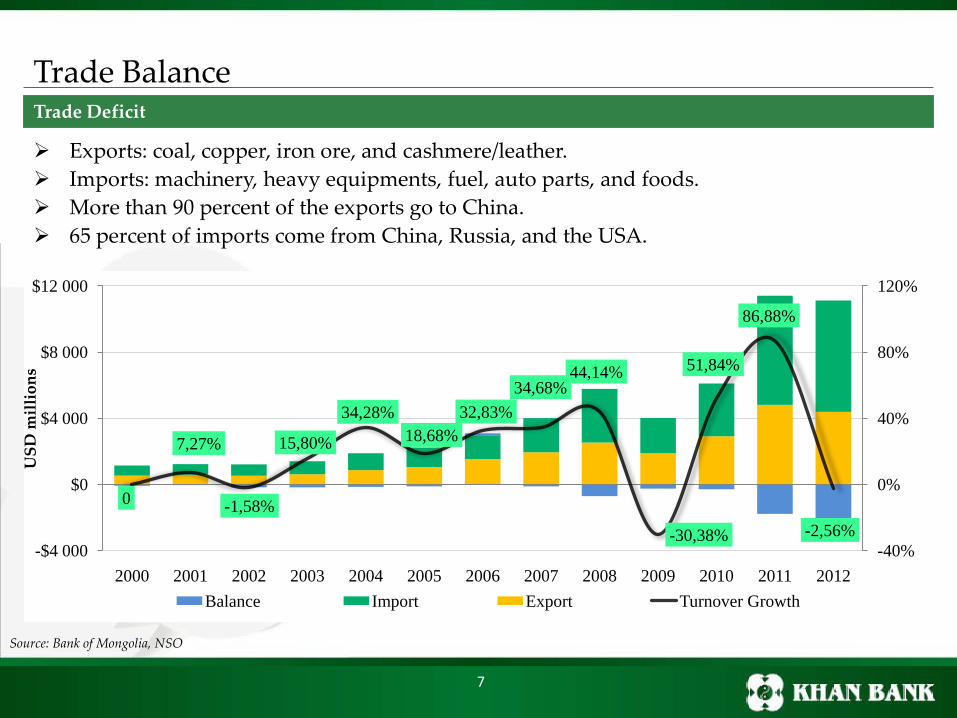
Trade Balance Trade Deficit
7
Source: Bank of Mongolia, NSO
Exports: coal, copper, iron ore, and cashmere/leather. Imports: machinery, heavy equipments, fuel, auto parts, and foods. More than 90 percent of the exports go to China. 65 percent of imports come from China, Russia, and the USA.
0
7,27%
-1,58%
15,80%
34,28%18,68%
32,83%34,68%
44,14%
-30,38%
51,84%
86,88%
-2,56%-40%
0%
40%
80%
120%
-$4 000
$0
$4 000
$8 000
$12 000
2000 2001 2002 2003 2004 2005 2006 2007 2008 2009 2010 2011 2012Balance Import Export Turnover Growth
USD
mill
ions

8
Foreign Direct Investment Initial phase of mining projects increased FDI
Source: Bank of Mongolia, NSO
69%
655%
200%
103%
424%
218%184%
60%
-16%-27%
3%-36%
-100%
0%
100%
200%
300%
400%
500%
600%
700%
0
200
400
600
800
1 000
1 200
1 400
1 600
Q1 Q2 Q3 Q4 Q1 Q2 Q3 Q4 Q1 Q2 Q3 Q4
2010 2011 2012
FDI Growth y-o-y
USD
mill
ions
Strategic Entities Foreign Investment Law (SEFIL) was introduced in May 2012. FDI decreased in 2012 Q4. Is it because of shift from construction to operation or the latest
legal and political discussions and uncertainty?

9
Budget
4,24%
2,06%3,23% 3,32%
2,44%
4,84%5,44%
0,58%
7,58% 7,71%
2,05%
0%
2%
4%
6%
8%
10%
2003 2004 2005 2006 2007 2008 2009 2010 2011 2012 2013*
Budged Deficit
“Fiscal Stability Law” (FSL) , effective in 2013, limits the structural deficit at 2 percent of the GDP.
The World Bank noted that although FSL is an important step towards sound fiscal policy, following factors need to be taken into consideration: The 2013 budget assumes the Government will reach agreement with OT over
revision of investment agreement USD 1.5 billion bond proceeds is not included in the budget Global economic outlook and commodity price
Source: Bank of Mongolia, World Bank

10
Ease of Doing Business
In terms of ease of doing business, Mongolia’s ranking improved from 88th place to 76th
place out of 185 countries in 2013.
Mongolia’s Rank
Ease of Doing Business 2013 2012 Change in Rank
Starting a Business 39 95 56Dealing with Construction Permits 121 121 0Getting Electricity 169 168 -1Registering Property 22 24 2Getting Credit 53 67 14Protecting Investors 25 29 4Paying Taxes 70 65 -5Trading Across Borders 175 174 -1Enforcing Contracts 29 29 0Resolving Insolvency 127 130 3
Source: IFC, World Bank
11
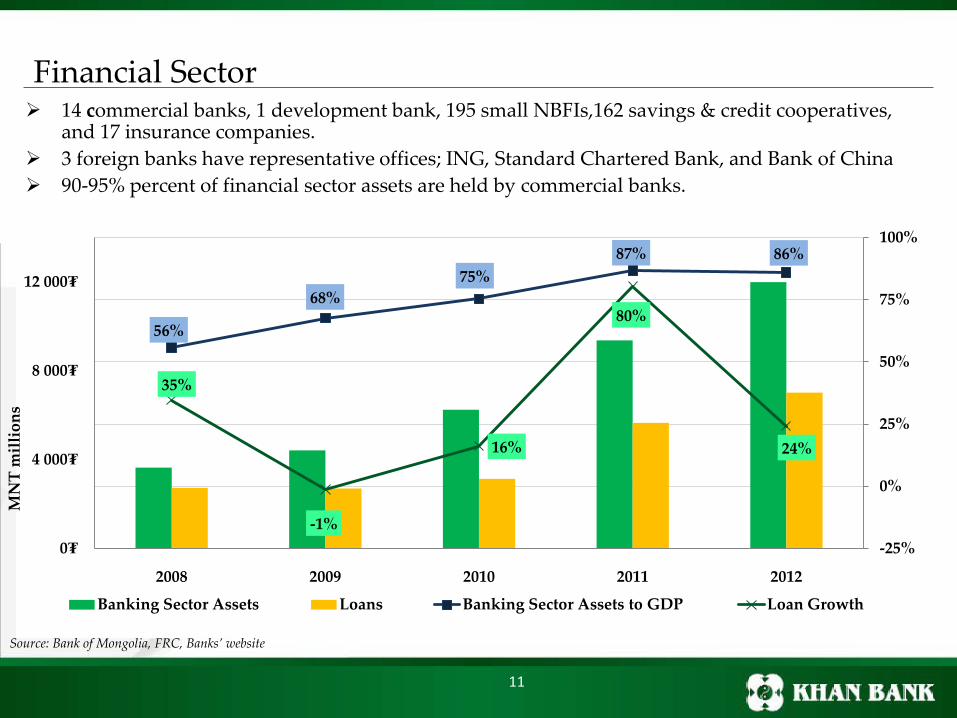
Financial Sector 14 commercial banks, 1 development bank, 195 small NBFIs,162 savings & credit cooperatives,
and 17 insurance companies. 3 foreign banks have representative offices; ING, Standard Chartered Bank, and Bank of China 90-95% percent of financial sector assets are held by commercial banks.
56%
68%75%
87% 86%
35%
-1%
16%
80%
24%
-25%
0%
25%
50%
75%
100%
0₮
4 000₮
8 000₮
12 000₮
2008 2009 2010 2011 2012
Banking Sector Assets Loans Banking Sector Assets to GDP Loan Growth
Source: Bank of Mongolia, FRC, Banks’ website
MN
T m
illio
ns

12
Banking Sector Sector
20%27% 27%
20%28% 32% 30% 30%
40%
133% 125% 120%118% 115% 110%
132% 132%133%
0%
30%
60%
90%
120%
150%
180%
210%
2003 2004 2005 2006 2007 2008 2009 2010 2011
Mongolia East Asia & Pacific (developing only)
Domestic credit provided by banking sector (% of GDP)
Source: World Bank
Total assets as of Dec 31, 2012 - USD 8,6 billion. Top 3 banks (Khan, TDB, Golomt) make up 70% of total assets. Banking sector grew rapidly, but Mongolia is still under banked.
131313
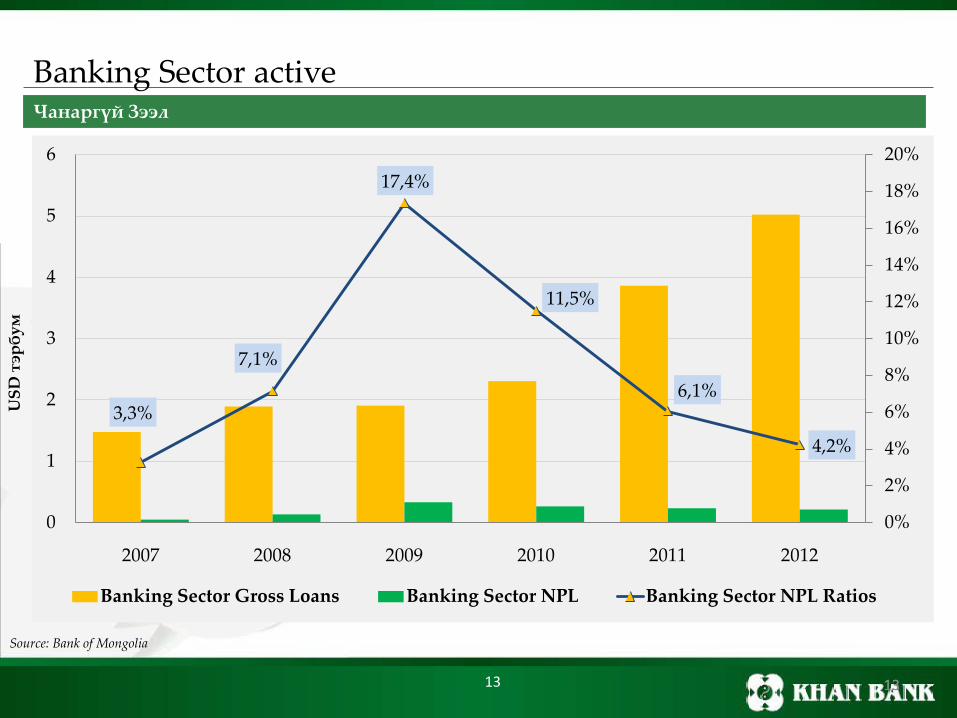
Banking Sector activeЧанаргүй Зээл
3,3%
7,1%
17,4%
11,5%
6,1%
4,2%
0%
2%
4%
6%
8%
10%
12%
14%
16%
18%
20%
0
1
2
3
4
5
6
2007 2008 2009 2010 2011 2012
Banking Sector Gross Loans Banking Sector NPL Banking Sector NPL Ratios
Source: Bank of Mongolia
USD
тэр
бум

14
Banking Sector Challenges
Small size of bank’s capital limits bank’s capacity
Underdeveloped capital markets and interbank market
Lack of long term MNT funding source, bank’s maturity gap
Underdeveloped derivative markets and hedging instruments
Legal and regulatory framework e.g. movable assets pledge, non-banking financial services
Risk management and system investment
Compliance, AML, KYC
Governance and transparency
15
70%16%
-4%-34%
74%99%
400%
45%11%
138%
47%
-18%-100%-50%
0%50%
100%150%200%250%300%350%400%450%
2001 2002 2003 2004 2005 2006 2007 2008 2009 2010 2011 2012
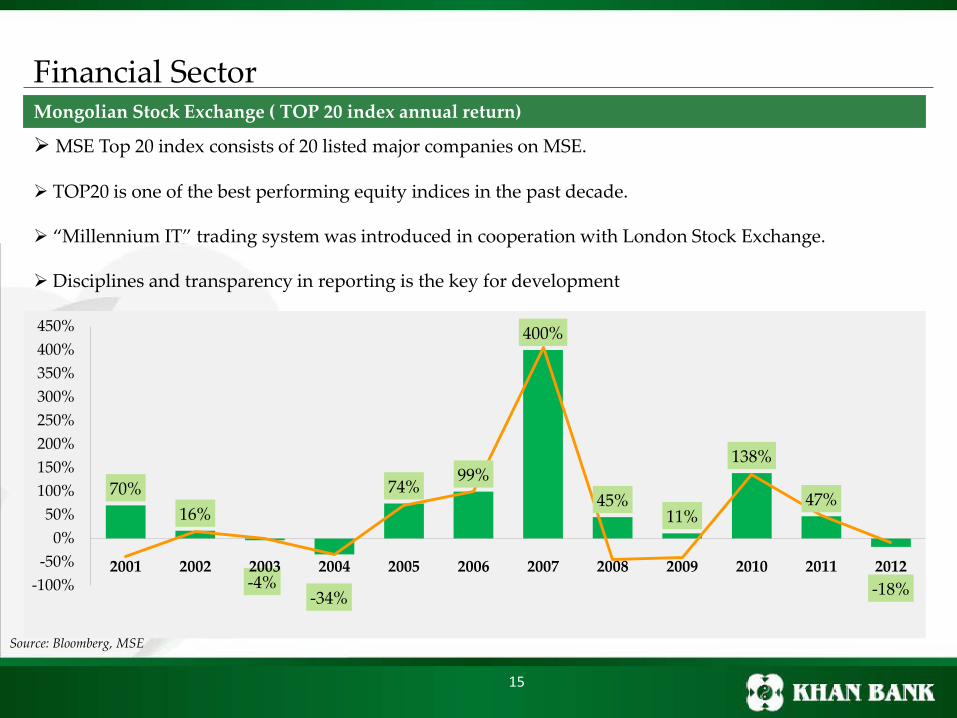
Financial SectorMongolian Stock Exchange ( TOP 20 index annual return)
MSE Top 20 index consists of 20 listed major companies on MSE.
TOP20 is one of the best performing equity indices in the past decade.
“Millennium IT” trading system was introduced in cooperation with London Stock Exchange.
Disciplines and transparency in reporting is the key for development
Source: Bloomberg, MSE

16
Political Environment Latest issues that attracted world wide attention
USD 1,5 billion sovereign bond.
Strategic Entities Foreign Investment Law
Draft of new Mineral Law
OT discussion
17
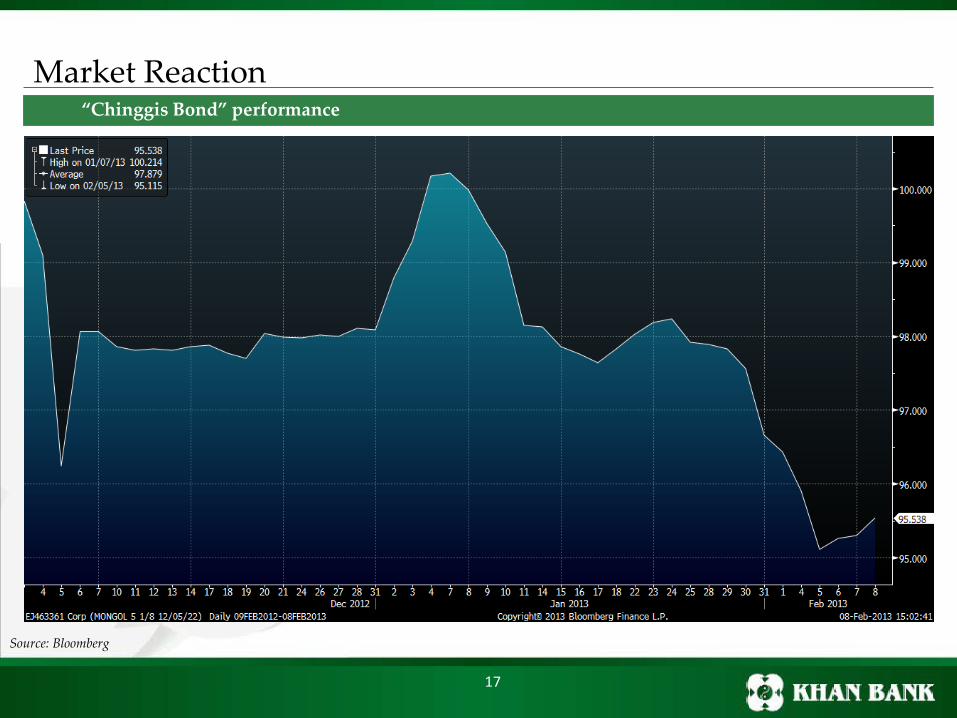
Market Reaction “Chinggis Bond” performance
Source: Bloomberg
18
0
2
4
6
8
10
12
14
16
18
0
10
20
30
40
50
60
70
12.01.30 12.02.29 12.03.31 12.04.30 12.05.31 12.06.30 12.07.31 12.08.31 12.09.30 12.10.31 12.11.30 12.12.31 13.01.31
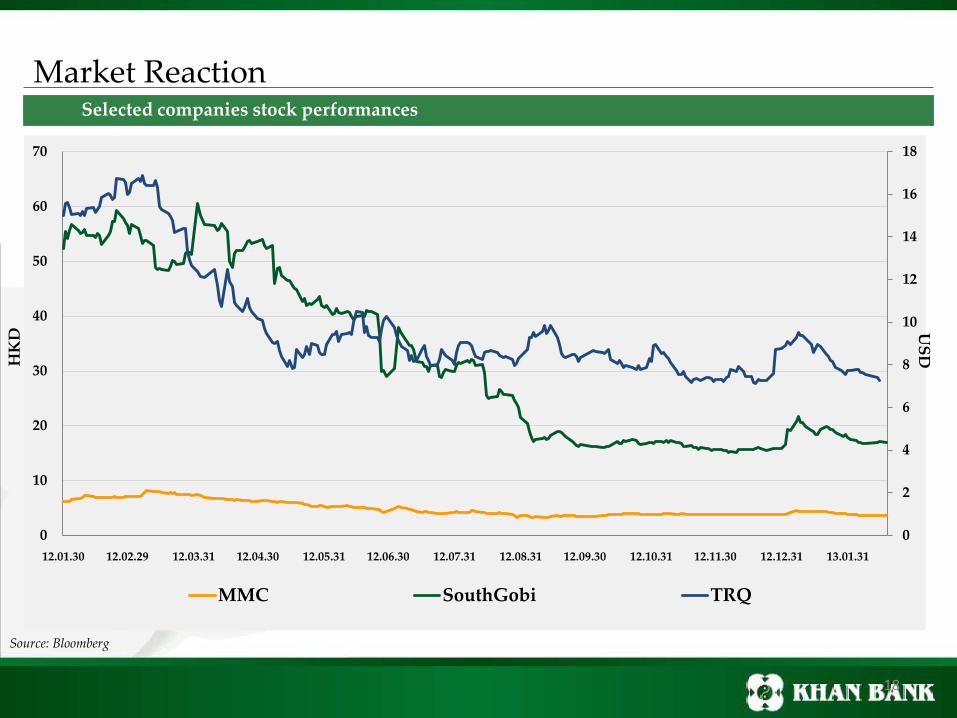
MMC SouthGobi TRQ
Market Reaction Selected companies stock performances
Source: Bloomberg
HK
D U
SD

19 19
Commodity MarketЗарим түүхий эдийн үнийн индекс
Source: Bloomberg
60$
65$
70$
75$
80$
85$
90$
95$
100$
105$
7 000$
7 500$
8 000$
8 500$
9 000$
9 500$
10 000$
12.02.15 12.03.15 12.04.15 12.05.15 12.06.15 12.07.15 12.08.15 12.09.15 12.10.15 12.11.15 12.12.15 13.01.15 13.02.15
Зэс Нүүрс

20
Rating Agency Review on Mongolia Rating Agency Country Rating on Mongolia
“B1”/Stable “B+”/Stable “BB-”/Stable
Rating agencies’ concerns: Heavily dependent on mineral exports Pro-cyclical fiscal policy may lead to overheating in Mongolia Fiscal discipline and external borrowing
Factors that could change the rating down: High inflation Weak fiscal policy framework Uncertainty in Mongolia’s investment regime Excess external borrowings
Source: Rating Agencies’ websites

21
Thank you for your attention.


