2017 BUILDING ENERGY BENCHMARKING REPORT
Based on 2016 Calendar Year Data
Cook County Government

1 | P a g e
ACKNOWLEDGMENTS Gathering the information necessary to complete this report involved the contributions of time and expertise by many
people. Special thanks to the following contributors for data collection, analysis, and review of the energy and water
benchmarking results.
Bureau of Asset Management:
Ann P. Kalayil Bureau Chief
Jamie Meyers Energy Manager
Department of Capital Planning and Policy
Earl Manning Director
Christine Johnson Assistant Director
Kate Buczek Energy Consultant
Department of Facilities Management
Bob Rassano Electrical Foreman
Pat Nolan Operating Engineer IV
Bureau of Administration:
Jerry Pray Industrial Engineer IV
Department of Environmental Control
Deborah Stone Director
Laura Oakleaf Legislative Coordinator I
Bureau of Finance:
Performance Management Office
Sam Molaro Industrial Engineer I

2 | P a g e
Table of Contents
ACKNOWLEDGMENTS .................................................................................................................................................................. 1
ENERGY BENCHMARKING AT A GLANCE ......................................................................................................................................... 3
BENCHMARKING METRICS ............................................................................................................................................................ 4
OVERALL ENERGY PERFORMANCE .............................................................................................................................................. 5
ENERGY STAR RESULTS ................................................................................................................................................................ 6
BUILDING PORTFOLIO OVERVIEW .............................................................................................................................................. 7
ENERGY PERFORMANCE RESULTS .............................................................................................................................................. 8
GREENHOUSE GAS EMISSIONS PERFORMANCE RESULTS .................................................................................................................. 11
FUTURE ENERGY SAVINGS .......................................................................................................................................................... 15
ENERGY SOURCE DIVERSIFICATION .............................................................................................................................................. 16
WATER USAGE ......................................................................................................................................................................... 18
NEXT STEPS .............................................................................................................................................................................. 23
Appendix A: 2016 Energy Benchmarking Results of County-Owned Properties ............................................................... 24
APPENDIX B: COOK COUNTY BUILDING LIST BY PORTFOLIO ............................................................................................................ 28
APPENDIX C: PERFORMANCE METRICS – SITE VS. SOURCE ENERGY .................................................................................................. 35
APPENDIX D: 2016 WATER BENCHMARKING RESULTS ................................................................................................................... 36
TABLE OF CONTENTS
3 | P a g e
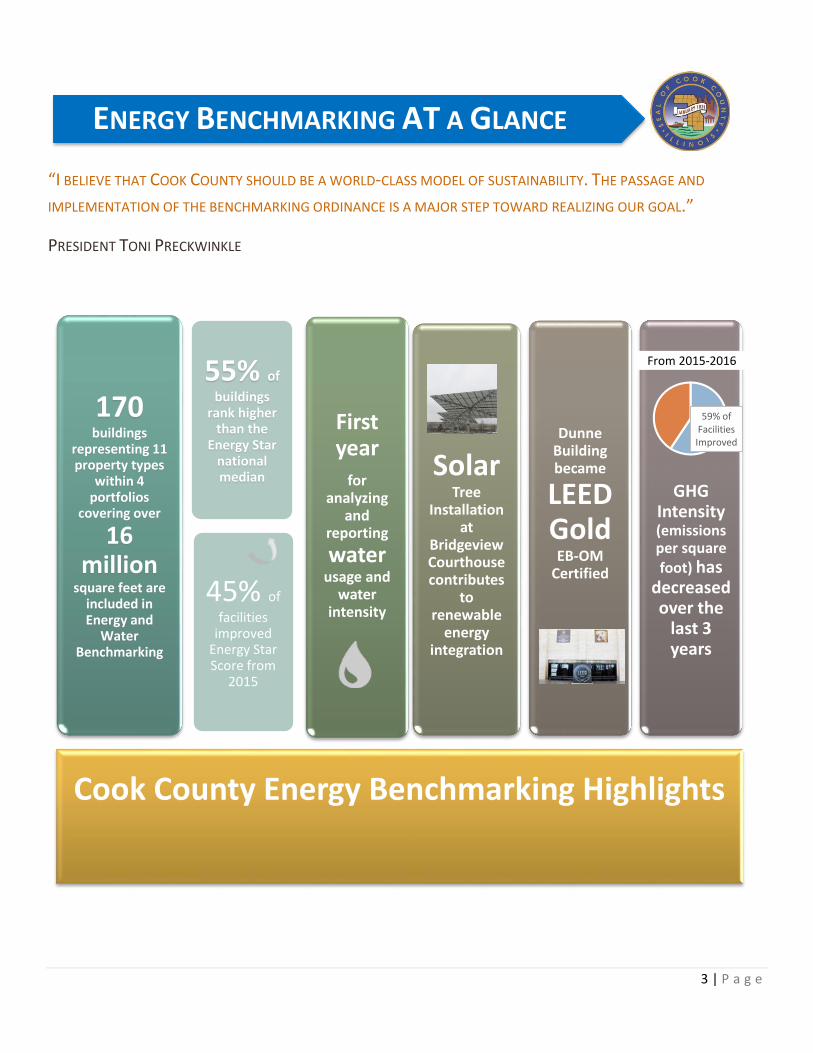
“I BELIEVE THAT COOK COUNTY SHOULD BE A WORLD-CLASS MODEL OF SUSTAINABILITY. THE PASSAGE AND
IMPLEMENTATION OF THE BENCHMARKING ORDINANCE IS A MAJOR STEP TOWARD REALIZING OUR GOAL.”
PRESIDENT TONI PRECKWINKLE
Cook County Energy Benchmarking Highlights
170 buildings
representing 11 property types
within 4 portfolios
covering over
16 million
square feet are included in Energy and
Water Benchmarking
45% of
facilities improved
Energy Star Score from
2015
55% of
buildings rank higher
than the Energy Star
national median
First year
for analyzing
and reporting
waterusage and
water intensity
Solar Tree
Installation at
Bridgeview Courthouse contributes
to renewable
energy integration
Dunne Building became
LEED Gold
EB-OM Certified
GHG Intensity (emissions per square foot) has
decreased over the
last 3 years
ENERGY BENCHMARKING AT A GLANCE
59% of Facilities Improved
From 2015-2016

In 2014, the Cook County Board of Commissioners passed the first ever energy benchmarking ordinance to
compare County-owned buildings’ energy and water usage on an annual basis.
The Benchmarking Ordinance requires the County to track annual energy and water use of its buildings
larger than 35,000 square feet, which is 98% of the County portfolio.
The Benchmarking Ordinance identifies the U.S. Environmental Protection Agency (EPA) Portfolio
Manager as the required method of benchmarking.
Portfolio Manager is a secure online tool that tracks and measures energy and water consumption as
well as greenhouse gas emissions for one building or multiple buildings in a portfolio.
The main metrics of analysis are energy use intensity (EUI) which details source energy per square foot,
and GHG intensity which details CO2 equivalent emissions per square foot.
This report covers energy and water usage during the 2016 calendar year for all County-owned
buildings over 35,000 square feet.
Some facilities less than 35,000 square feet with sufficient data sets have been included to better
understand the County’s portfolio energy and water usage.
In an effort to ensure accuracy in benchmarking figures,
the Bureau of Asset Management improved all of the
County’s Portfolio Manager Accounts in 2014 by:
reconciling utility meters and buildings,
upgrading energy management systems,
installing sub-meters,
separating space types for mixed-use buildings
verifying number of building occupants, and
number of computers.
Continued efforts are made each year to ensure the
accuracy of the portfolio. By better understanding the
occupancy and use of a facility, building performance
ratings are more precise. Refer to Appendix C for
explanation of this report’s choice to analyze buildings
based on source energy use.
BENCHMARKING METRICS
5 | P a g e
The Energy Star rating system assigns each building a score 1–100 (with 50 being
the median) by comparing it to similar structures nationwide in 18 different
building type categories. The scores are normalized for size, weather and building
usage. Higher scores reflect better performing buildings. To be eligible for Energy
Star certification, a building must earn an Energy Star score of 75 or higher,
indicating that it performs better than at least 75 percent of similar buildings
nationwide.
2016 Building Energy Performance Highlights
Year over year energy consumption dropped by
nearly 20,000,000 kBtu
Year over year greenhouse gas emissions were
reduced by over 15,000 metric tons
Over 55% of buildings eligible for an Energy Star
score performed equal to or better than the
national median.
57% of eligible Energy Star properties
maintained or improved their scores over the
previous year
The George Dunne Administration building,
Skokie Courthouse, Rolling Meadows
Courthouse, and Rockwell Warehouse scored
high enough to be eligible for Energy Star
certification.
OVERALL ENERGY PERFORMANCE
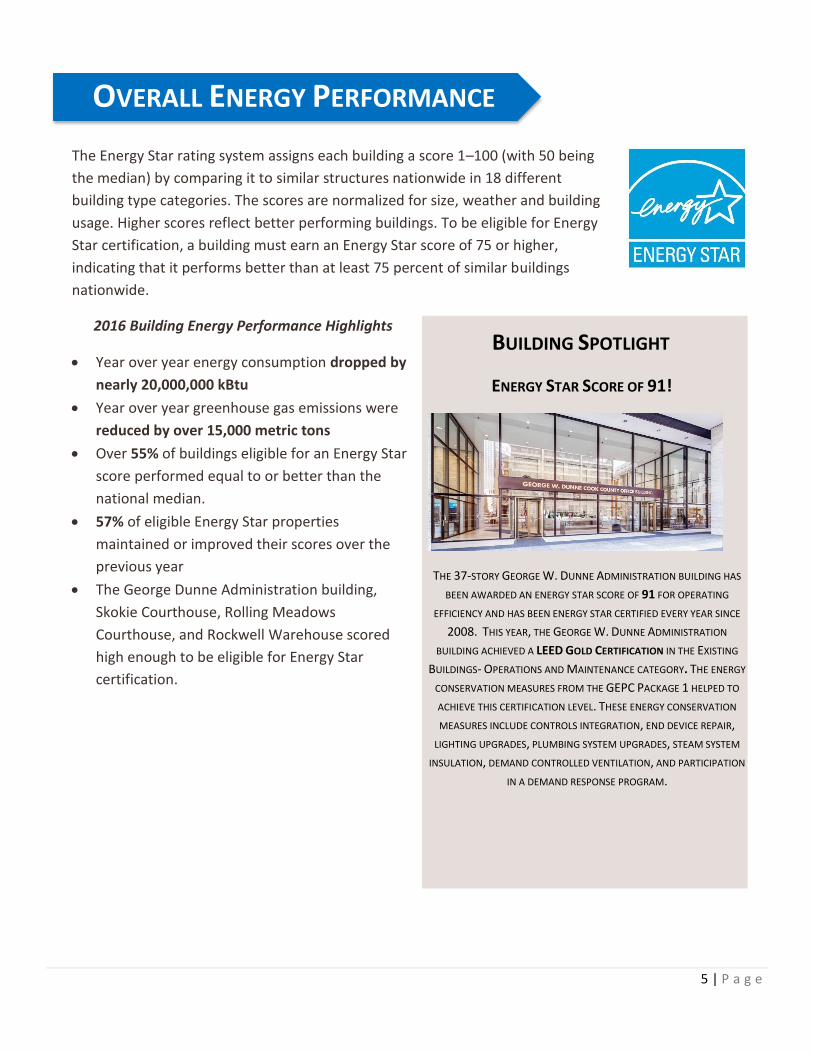
BUILDING SPOTLIGHT
ENERGY STAR SCORE OF 91!
THE 37-STORY GEORGE W. DUNNE ADMINISTRATION BUILDING HAS
BEEN AWARDED AN ENERGY STAR SCORE OF 91 FOR OPERATING
EFFICIENCY AND HAS BEEN ENERGY STAR CERTIFIED EVERY YEAR SINCE
2008. THIS YEAR, THE GEORGE W. DUNNE ADMINISTRATION
BUILDING ACHIEVED A LEED GOLD CERTIFICATION IN THE EXISTING
BUILDINGS- OPERATIONS AND MAINTENANCE CATEGORY. THE ENERGY
CONSERVATION MEASURES FROM THE GEPC PACKAGE 1 HELPED TO
ACHIEVE THIS CERTIFICATION LEVEL. THESE ENERGY CONSERVATION
MEASURES INCLUDE CONTROLS INTEGRATION, END DEVICE REPAIR,
LIGHTING UPGRADES, PLUMBING SYSTEM UPGRADES, STEAM SYSTEM
INSULATION, DEMAND CONTROLLED VENTILATION, AND PARTICIPATION
IN A DEMAND RESPONSE PROGRAM.

6 | P a g e
Table 1: Energy Star Scores for Cook County Government Buildings
Facility Energy Star Score 2013
Energy Star Score 2014
Energy Star Score 2015
Energy Star Score 2016
George W. Dunne Administration Building
87 89 91 91
Skokie Courthouse (2nd District)* 49 79 84 86
Rolling Meadows Courthouse (3rd District)*
66 71 69 80
Rockwell Warehouse* 72 74 75 75
Domestic Violence Courthouse 70 66 72 65
Whitcomb Building Not Available 52 59 59
Cicero Records Center Not Available 63 56 58
Cook County Building 41 53 52 55
Jefferson Building Not Available 38 49 52
Bridgeview Courthouse (5th District) 57 45 42 52
Markham Courthouse (6th District) 52 48 54 51
Maywood Courthouse (4th District) Not Available 31 44 44
Piszcezek TB Clinic 19 23 24 39
Hawthorne Warehouse 45 43 39 37
Logan Square Health Center 60 66 38 34
John Stroger Jr. Hospital Campus 21 18 20 17
Robbins Health Center 52 55 47 13
Cottage Grove Health Center 17 19 23 6
Provident Hospital 16 3 1 4
Rothstein Core Center 1 1 1 1
Englewood Health Center 1 1 1 1
*Scores high enough for attempting to pursue certification in 2017
Table 2: Cook County Government Buildings Not Eligible for Energy Star Scores
Facility Reason Not Eligible
Department of Corrections Campus Multiple buildings, Non-eligible property type
Oak Forest Campus Multiple buildings on account
Juvenile Center Campus Multiple buildings on account, Non-eligible property type
Institute of Forensic Medicine Non-eligible property type
Note: Based on the way the buildings are metered, 170 buildings are included in this report for evaluation (see
Appendix A for exact counts for each facility in the portfolio), while the 21 facilities in Table 1 are eligible for an
Energy Star Score.
ENERGY STAR RESULTS

7 | P a g e
Corporate13%
Health and
Hospitals21%
Public Safety56%
Parking10%
Percentage of Total Square Footage by Building Type
Figure 1: Portfolio Square Footage
2016 benchmarking analyzed 170 buildings categorized into
four main types of portfolios: Public Safety, Corporate, Health
and Hospitals, and Parking. These buildings represent 98.5%
(16.9M square feet) of the total square footage within Cook
County Government buildings. The Health and Hospitals and
Public Safety Portfolios have the largest energy consumption.
The Health and Hospitals portfolio demands 40% of the energy
(refer to Figure 2) yet makes up only 21% of the square footage
(refer to Figure 1). The Public Safety portfolio includes 18 more
buildings and 7 million more square feet than the Health and
Hospitals portfolio. While representing 56% of the total square
footage, it represents 50% of source energy use.
Figure 2: 2016 Source Energy Use by Portfolio
89
Public Safety
Buildings
5
Corporate Facilities
71
Health and Hospitals Buildings
5
Parking Garages
170 Buildings
Corporate 9%
Health and Hospitals40%
Public Safety50%
Parking 1%
2016 Source Energy Use (kBtu)
Corporate 406,153,022 kBtu Health and Hospitals 1,715,517,795 kBtu
Public Safety 2,135,206,365 kBtu Parking 37,920,944 kBtu
BUILDING PORTFOLIO OVERVIEW

8 | P a g e
The diagram below1 explains the inputs that determine EUI. EUI measures a building’s energy use by factoring
in its gross floor area; therefore, the EUI expresses a building’s energy consumption as a function of its size.
This report analyzes Source EUI because source energy provides a holistic measure of energy use based on the
combination of primary and secondary energy types, as described within Appendix C. Source EUI also forms
the basis for the Energy Star score.
The 170 buildings benchmarked used around 1.98 billion kBtus of energy in 2016 and emitted 204,836 metric
tons of CO2 equivalent emissions. Figure 3 exemplifies the varied relationship between a building’s total
energy use and its Source Energy Use Intensity (EUI). A higher Source EUI does not always correspond to
higher total energy consumption, as exemplified by Provident Hospital. Additionally, Figure 3 illustrates that a
lower total energy use does not always have a lower Source EUI. However, a low EUI generally suggests more
efficient energy performance.
Figure 3: 2016 Total Energy Use and Source EUI by Facility
1 EUI Graphic created with icons from flaticon.com and information from the American Institute of Architects
226
519
266
504
240
153
218
131
242
-
100
200
300
400
500
600
-
100,000,000
200,000,000
300,000,000
400,000,000
500,000,000
600,000,000
700,000,000
DOCCampus
StrogerHospitalCampus
Oak ForestCampus
ProvidentHospital
CookCountyBuilding
DunneBuilding
JTDCCampus
HawthorneWarehouse
BridgeviewCourthouse
kBtu
/ft²
kBtu
BUILDING CONSUMPTION AND ENERGY USE INTENSITY
Total Energy Use (kBtu) 2016 EUI (kBtu/ft2)
ENERGY PERFORMANCE RESULTS
HOW IS ENERGY USE INTENSITY (EUI) CALCULATED?
9 | P a g e
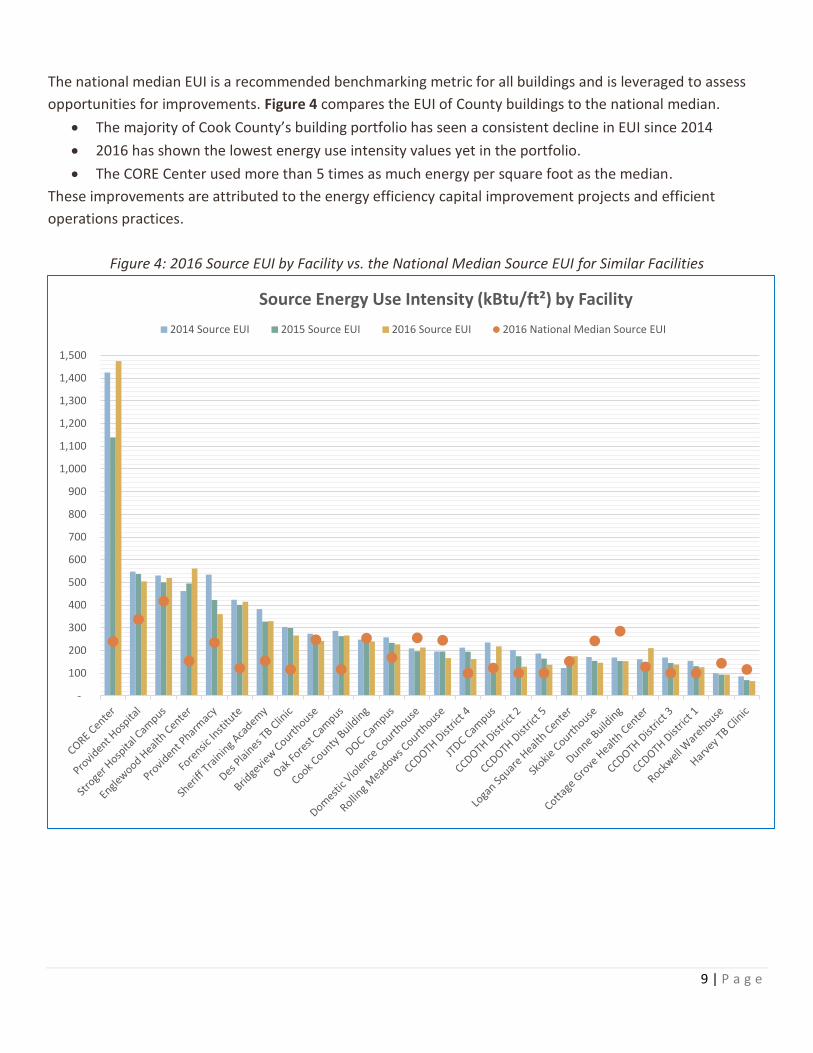
The national median EUI is a recommended benchmarking metric for all buildings and is leveraged to assess
opportunities for improvements. Figure 4 compares the EUI of County buildings to the national median.
The majority of Cook County’s building portfolio has seen a consistent decline in EUI since 2014
2016 has shown the lowest energy use intensity values yet in the portfolio.
The CORE Center used more than 5 times as much energy per square foot as the median.
These improvements are attributed to the energy efficiency capital improvement projects and efficient
operations practices.
Figure 4: 2016 Source EUI by Facility vs. the National Median Source EUI for Similar Facilities
-
100
200
300
400
500
600
700
800
900
1,000
1,100
1,200
1,300
1,400
1,500
Source Energy Use Intensity (kBtu/ft²) by Facility
2014 Source EUI 2015 Source EUI 2016 Source EUI 2016 National Median Source EUI

Figure 5 provides an illustration of the relationship between source energy use, Source EUI, and the utility cost for 15 Cook County facilities. The
largest energy users such as the Department of Corrections and Stroger Hospital were excluded from Figure 5 to fully demonstrate the interaction
between source energy and utility cost. The high Source EUI for the Forensic Institute, given its low source energy use and low utility cost, reveals
the impact of the gross building area input within the EUI calculation.
Figure 5: Source Energy Use, Energy Use Intensity, and Utility Cost by Facility
Dunne Building
Cook County Building
Rockwell Warehouse
Hawthorne Warehouse
Cicero Records Center
Bridgeview Courthouse Markham Courthouse
Domestic Violence Courthouse
Forensic Institute
CCDOTH District 1
CCDOTH District 3
CCDOTH District 2 CCDOTH District 4
CCDOTH District 5
Hektoen Building
-
20,000,000
40,000,000
60,000,000
80,000,000
100,000,000
120,000,000
140,000,000
160,000,000
180,000,000
50 100 150 200 250 300 350 400 450 500
Sou
rce
En
erg
y U
se (
kBtu
)
Source EUI (kBtu/ft.²)
SOURCE ENERGY USE, ENERGY USE INTENSITY, AND UTILITY COST BY FACILITY Bubble Size = Utility
Cost of Facility ($)

11 | P a g e
Greenhouse gas emissions occur when carbon dioxide (CO2), methane (CH4), and nitrous oxide (N2O) gases are released into the
atmosphere due to energy consumption at the property. Emissions are expressed in carbon dioxide equivalent emissions (CO2e), a universal
unit of measure that combines the quantity and global warming potential of each greenhouse gas. Cook County Government adopted a goal
to reduce 80% of GHG emissions from facilities and operations by 2050 from a 2010 baseline, a 2% annual reduction.
The benchmarked buildings in 2016 emitted 204,836 metric tons of CO2
For benchmarked facilities, the County has decreased emissions by 15,620 metric tons in 2016
The emission goal for 2016 was 12% since 2010 – actual reduction since 2010 is 25%
Figure 6: Benchmarked GHG Intensity Summary Compared with 2050 Targets
16 kgCO2 e/ ft214 kgCO2 e/ ft2
13 kgCO2 e/ ft2
12 kgC02 e/ ft2
0
2
4
6
8
10
12
14
16
18
20
20
10
20
11
20
12
20
13
20
14
20
15
20
16
20
17
20
18
20
19
20
20
20
21
20
22
20
23
20
24
20
25
20
26
20
27
20
28
20
29
20
30
An
nu
al E
mis
sio
ns
Inte
nsi
ty (
kg
CO
2 E
/ ft
2)
Year
Benchmarked GHG Intensity Compared with 2050 Targets
County Benchmarking
2010 Baseline
Annual 2% Reduction Goal
2010 GHG Baseline: 18 kg CO2 E /
2050 GHG Target: 4 kg CO2 E / ft 2
GHG Reduction
GREENHOUSE GAS EMISSIONS PERFORMANCE RESULTS

12 | P a g e
Corporate 9%
Health and Hospitals 40%Public Safety
50%
Parking 1%
T O T A L G H G E M I S S I O N S B Y P O R T F O L I O ( M E T R I C T O N S C O 2 E )
Corporate 22,828Metric Tons
Health and Hospitals95,332 Metric Tons
Public Safety 119,745Metric Tons
Parking 2,219 MetricTons
Figure 7: 2016 Total GHG Emissions by Portfolio
Figure7 breaks GHG Emissions down by
portfolio and is consistant with Source
Energy Use within each of the building
portfolios, with approximately 9% of use
and emissions in the Corporate portfolio,
40% in the Health and Hospitals portfolio,
50% in the Public Safety portfolio, and 1% in
the Parking portfolio. Figure 8 below
further breaks down greenhouse gas
emissions by building.
Figure 8: 2016 Greenhouse Gas Emissions (Metric Tons CO2e) by Facility
0%5%
10%15%
20%25%
30%
1%
1%
1%
1%
1%
1%
1%
1%
2%
2%
2%
2%
2%
3%
3%
4%
5%
6%8%
25%
28%
Faci
lity
Percent of Total GHG Emissions by FacilityDOC Campus 56,849 Metric Tons
Stroger Hospital Campus 52,119 Metric Tons
Oak Forest Campus 16,097 Metric Tons
JTDC Campus 12,748 Metric Tons
Provident Hospital 10,536 Metric Tons
Cook County Building 8,755 Metric Tons
Dunne Building 7,133 Metric Tons
Other Facilities 6,380 Metric Tons
Bridgeview Courthouse 4,738 Metric Tons
Markham Courthouse 4,573 Metric Tons
Hawthorne Warehouse 3,455 Metric Tons
Skokie Courthouse 2,701 Metric Tons
Rolling Meadows Courthouse 3,263 MetricTonsMaywood Courthouse 2,955 Metric Tons
CORE Center 2,604 Metric Tons
Rockwell Warehouse 2,325 Metric Tons
Domestic Violence Courthouse 2,278 MetricTonsForensic Institute 1,851 Metric Tons
13 | P a g e
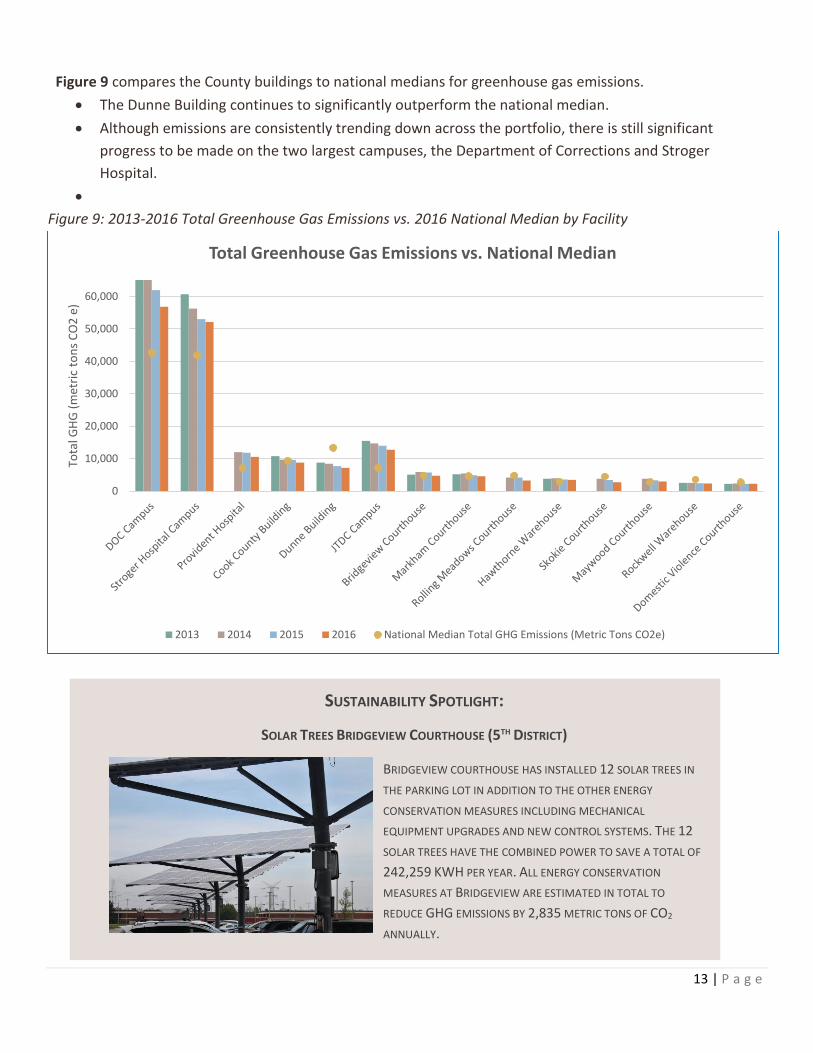
Figure 9 compares the County buildings to national medians for greenhouse gas emissions.
The Dunne Building continues to significantly outperform the national median.
Although emissions are consistently trending down across the portfolio, there is still significant
progress to be made on the two largest campuses, the Department of Corrections and Stroger
Hospital.
Figure 9: 2013-2016 Total Greenhouse Gas Emissions vs. 2016 National Median by Facility
0
10,000
20,000
30,000
40,000
50,000
60,000
Tota
l GH
G (
met
ric
ton
s C
O2
e)
Total Greenhouse Gas Emissions vs. National Median
2013 2014 2015 2016 National Median Total GHG Emissions (Metric Tons CO2e)
SUSTAINABILITY SPOTLIGHT:
SOLAR TREES BRIDGEVIEW COURTHOUSE (5TH DISTRICT)
BRIDGEVIEW COURTHOUSE HAS INSTALLED 12 SOLAR TREES IN
THE PARKING LOT IN ADDITION TO THE OTHER ENERGY
CONSERVATION MEASURES INCLUDING MECHANICAL
EQUIPMENT UPGRADES AND NEW CONTROL SYSTEMS. THE 12
SOLAR TREES HAVE THE COMBINED POWER TO SAVE A TOTAL OF
242,259 KWH PER YEAR. ALL ENERGY CONSERVATION
MEASURES AT BRIDGEVIEW ARE ESTIMATED IN TOTAL TO
REDUCE GHG EMISSIONS BY 2,835 METRIC TONS OF CO2
ANNUALLY.
14 | P a g e
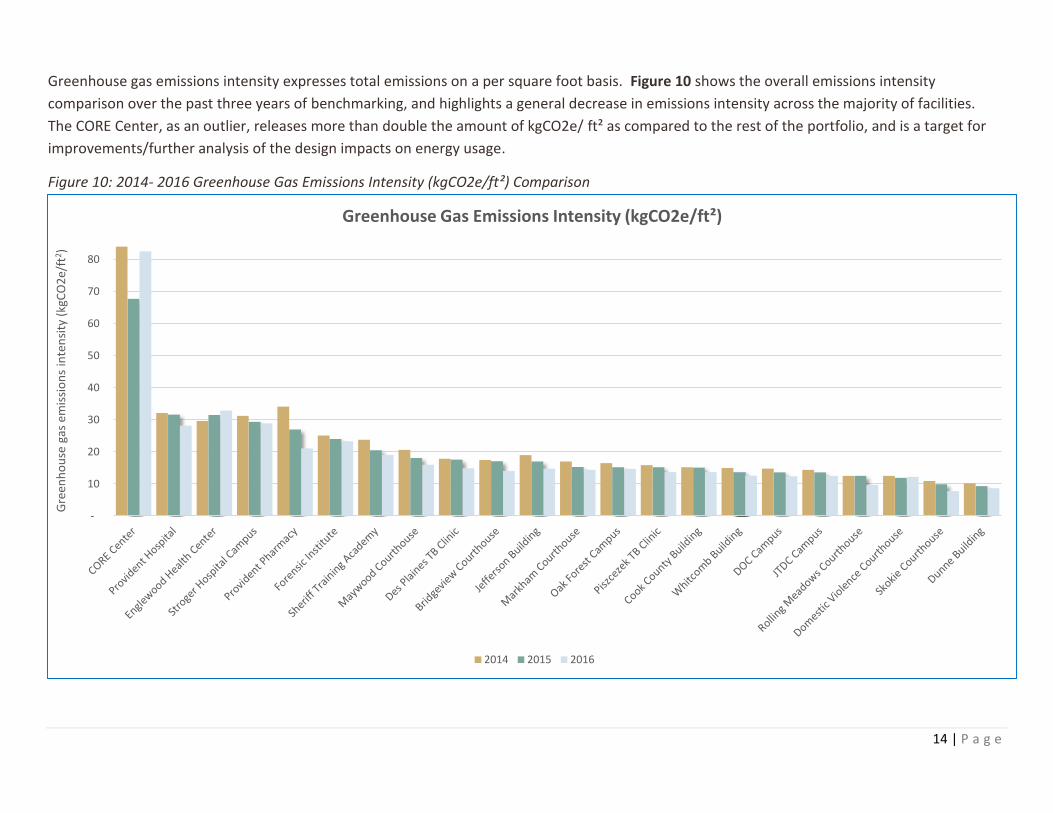
Greenhouse gas emissions intensity expresses total emissions on a per square foot basis. Figure 10 shows the overall emissions intensity
comparison over the past three years of benchmarking, and highlights a general decrease in emissions intensity across the majority of facilities.
The CORE Center, as an outlier, releases more than double the amount of kgCO2e/ ft² as compared to the rest of the portfolio, and is a target for
improvements/further analysis of the design impacts on energy usage.
Figure 10: 2014- 2016 Greenhouse Gas Emissions Intensity (kgCO2e/ft²) Comparison
-
10
20
30
40
50
60
70
80
Gre
enh
ou
se g
as e
mis
sio
ns
inte
nsi
ty (
kgC
O2
e/ft
2 )
Greenhouse Gas Emissions Intensity (kgCO2e/ft²)
2014 2015 2016

15 | P a g e
Corporate, 270,397 ft²
Health and Hospitals,
1,992,100 ft²
Public Safety, 4,399,998 ft²
Square Footage of GEPC by Building Type
Through the Energy Efficiency Capital Improvement Program, Cook County has implemented over
$44 million in building improvement projects to make large-scale energy efficiency upgrades at 11
County facilities. These improvements were part of Guaranteed Energy Performance Contracts
(GEPCs) that provide expertise and support for energy projects. Upgrades are paid for through the
savings generated over 20 years. These GEPC’s will reduce greenhouse gas emissions, improve
occupant comfort, and upgrade lighting infrastructure, aging mechanical systems, and temperature
controls.
Cook County’s latest Guaranteed Energy Performance Contract (GEPC) projects are in the final
stages of installation for Bridgeview, Skokie, Markham, and Rolling Meadows courthouses, as well
as five district highway maintenance facility campuses. The contract including the Cook County
Building and Dunne Building closed out in 2017. These GEPC’s will then enter the measurement
and verification stages for the next 20 years to guarantee energy and emissions savings. The
courthouses are projected to reduce energy consumption by 53%, the corporate buildings by 30%,
and highway facilities by over 40%.
The previous two large GEPC’s targeting the Health and Hospitals system and the Department of Corrections and Juvenile Detention Center were
completed in 2012 and 2014, respectively, and have entered their 20 year savings period.
For further information on the County’s energy initiatives, visit https://www.cookcountyil.gov/content/energy-initiatives
or https://www.cookcountyil.gov/sustainability.
FUTURE ENERGY SAVINGS

16 | P a g e
The diversity of energy resources comprising the electricity grid further influences greenhouse gas emissions potential. When source energy usage
is the unit of measure, a cleaner grid divesting away from emissions-intensive fossil fuels and realizing a greater proportion of renewable energy
resources can further lower carbon emissions across the building portfolio. Lower emissions at the grid level help to reduce overall greenhouse gas
emissions on the environment and to accelerate emissions reduction goals across the building portfolio. Nuclear power, coal-fired power, and
natural gas-fired power comprised the majority of energy supplied to Cook County, as represented within Figure 12. This year, the slight decline of
coal usage to the second largest grid component behind nuclear could indicate a potential decline in fossil fuel energy usage across the ComEd
energy mix that supplies Cook County facilities.
Figure 12: Sources of Electricity Supplied For 2016
Source: Commonwealth Edison Company’s Environmental Disclosure Statement Ending 12/2016
Biomass, 0%
Coal, 34%
Hydro, 1%
Natural Gas, 27%
Nuclear, 35%
Wind, 2% Other, 1%
2016 Electricity by Source
ENERGY SOURCE DIVERSIFICATION
17 | P a g e
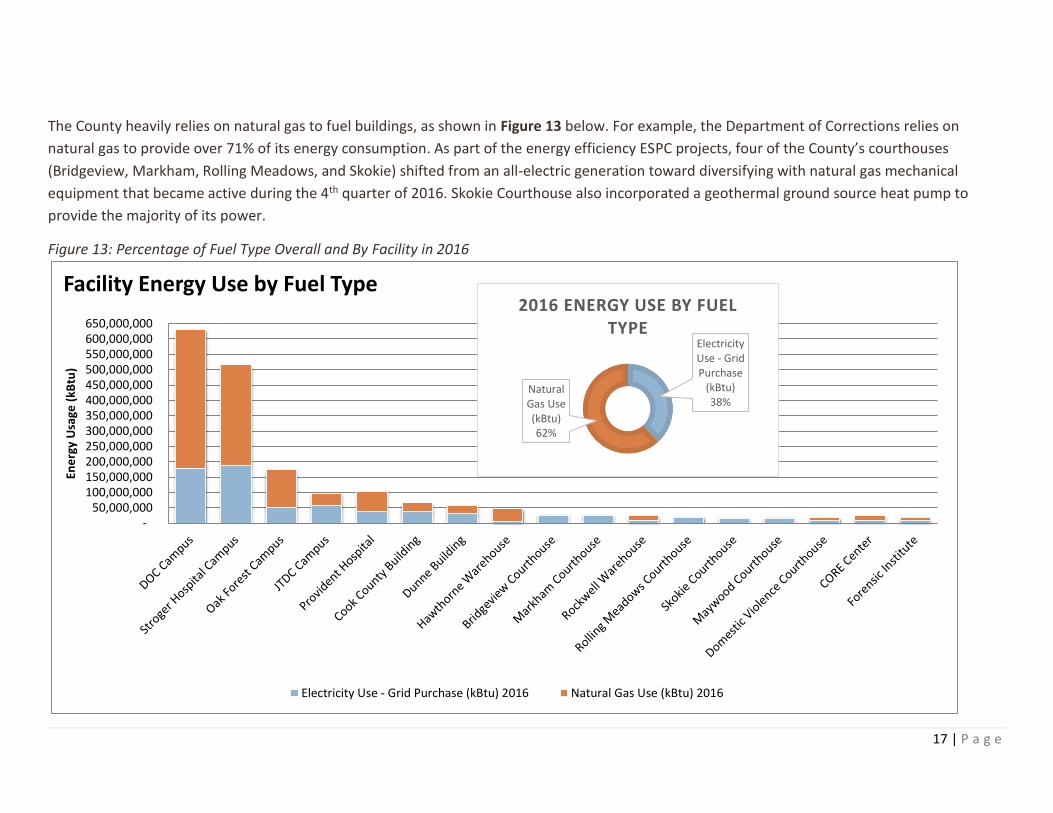
The County heavily relies on natural gas to fuel buildings, as shown in Figure 13 below. For example, the Department of Corrections relies on
natural gas to provide over 71% of its energy consumption. As part of the energy efficiency ESPC projects, four of the County’s courthouses
(Bridgeview, Markham, Rolling Meadows, and Skokie) shifted from an all-electric generation toward diversifying with natural gas mechanical
equipment that became active during the 4th quarter of 2016. Skokie Courthouse also incorporated a geothermal ground source heat pump to
provide the majority of its power.
Figure 13: Percentage of Fuel Type Overall and By Facility in 2016
- 50,000,000
100,000,000 150,000,000 200,000,000 250,000,000 300,000,000 350,000,000 400,000,000 450,000,000 500,000,000 550,000,000 600,000,000 650,000,000
Ene
rgy
Usa
ge (
kBtu
)
Facility Energy Use by Fuel Type
Electricity Use - Grid Purchase (kBtu) 2016 Natural Gas Use (kBtu) 2016
Electricity Use - Grid Purchase
(kBtu)38%
Natural Gas Use (kBtu)62%
2016 ENERGY USE BY FUEL TYPE
18 | P a g e
2
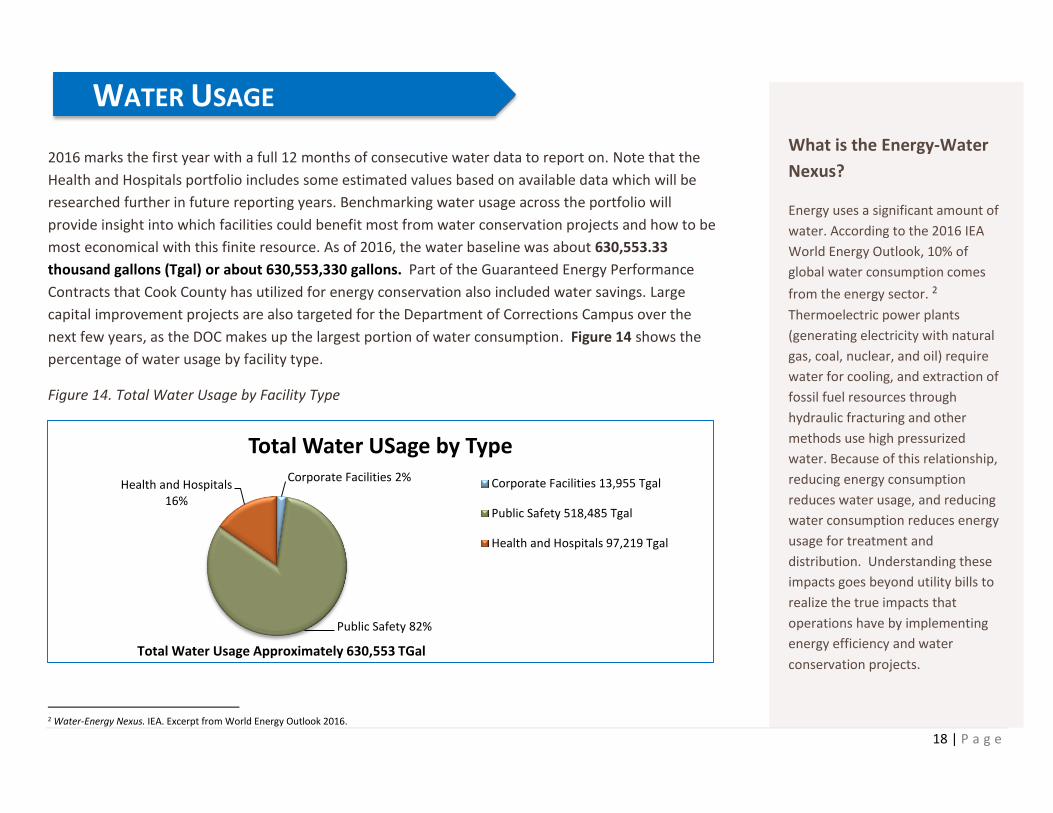
2016 marks the first year with a full 12 months of consecutive water data to report on. Note that the
Health and Hospitals portfolio includes some estimated values based on available data which will be
researched further in future reporting years. Benchmarking water usage across the portfolio will
provide insight into which facilities could benefit most from water conservation projects and how to be
most economical with this finite resource. As of 2016, the water baseline was about 630,553.33
thousand gallons (Tgal) or about 630,553,330 gallons. Part of the Guaranteed Energy Performance
Contracts that Cook County has utilized for energy conservation also included water savings. Large
capital improvement projects are also targeted for the Department of Corrections Campus over the
next few years, as the DOC makes up the largest portion of water consumption. Figure 14 shows the
percentage of water usage by facility type.
Figure 14. Total Water Usage by Facility Type
2 Water-Energy Nexus. IEA. Excerpt from World Energy Outlook 2016.
Corporate Facilities 2%
Public Safety 82%
Health and Hospitals 16%
Total Water USage by Type
Corporate Facilities 13,955 Tgal
Public Safety 518,485 Tgal
Health and Hospitals 97,219 Tgal
Total Water Usage Approximately 630,553 TGal
WATER USAGE
What is the Energy-Water
Nexus?
Energy uses a significant amount of
water. According to the 2016 IEA
World Energy Outlook, 10% of
global water consumption comes
from the energy sector. 2
Thermoelectric power plants
(generating electricity with natural
gas, coal, nuclear, and oil) require
water for cooling, and extraction of
fossil fuel resources through
hydraulic fracturing and other
methods use high pressurized
water. Because of this relationship,
reducing energy consumption
reduces water usage, and reducing
water consumption reduces energy
usage for treatment and
distribution. Understanding these
impacts goes beyond utility bills to
realize the true impacts that
operations have by implementing
energy efficiency and water
conservation projects.

19 | P a g e
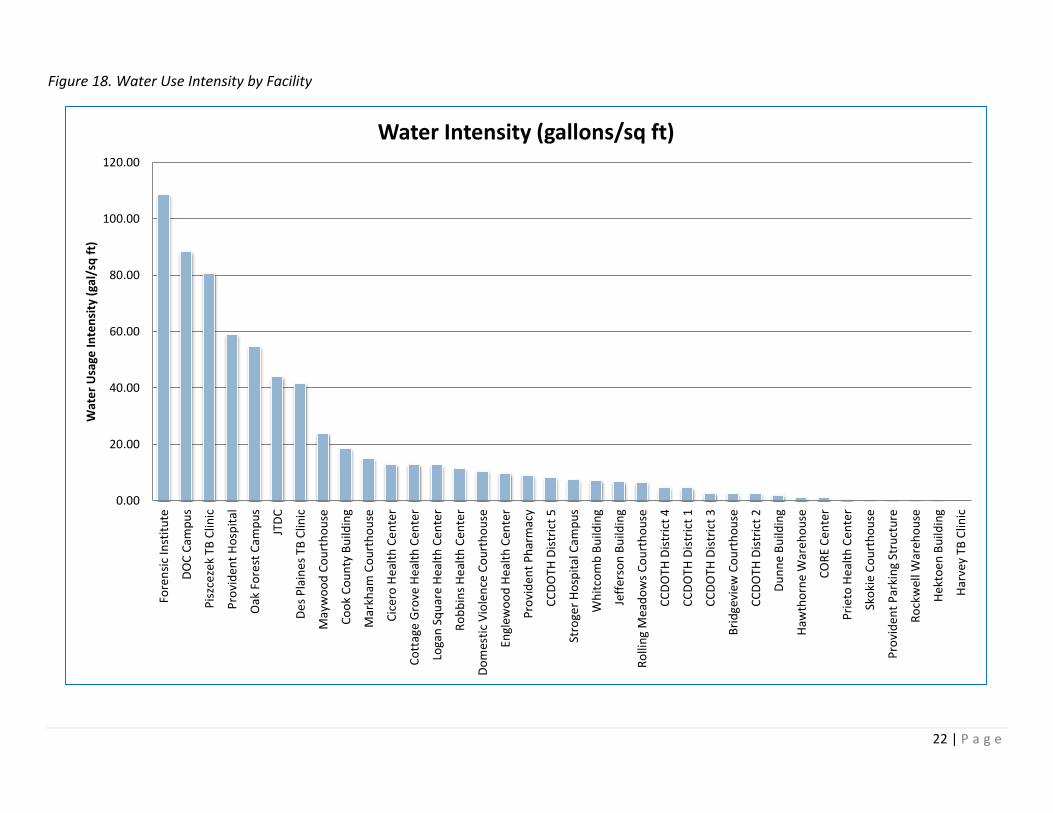
Figure 15 shows the annual water usage in thousand gallons (TGal) by facility and provides a snapshot of some of the highest water consumption
locations. The DOC Campus was excluded from this chart as its usage is exponentially higher than the other facilities in the portfolio and makes up
over 74% of all water usage at the County. All water intensity and annual usage estimates can be found in Appendix D.
Figure 15. 2016 Comparison of Water Usage and Water Usage Intensity
Cook County Building 18.50
Maywood Courthouse 23.92
Markham Courthouse 15.11
JTDC 43.95
Forensics 108.65
Oak Forest Hospital 54.71
Provident Hospital 59.09
Stroger Hospital 7.49
Piszcezek TB Clinic 80.78
Des Plaines TB Clinic 41.60
See Appendix D for other facility values (10,000.00)
-
10,000.00
20,000.00
30,000.00
40,000.00
50,000.00
60,000.00
70,000.00
(20.00) - 20.00 40.00 60.00 80.00 100.00 120.00 140.00
An
nu
al W
ate
r U
sage
(1
,00
0 G
allo
ns)
Water Usage Intensity (gallons/sq ft)
Water Usage (TGal) and Water Use Intensity (gal/sq ft)
Bubble size = water intensity (gallons/ sq ft)Bubble size = water
intensity (gallons/sq ft)

20 | P a g e
Figure 16. Water Usage in Cook County Facilities
DOC Campus74%
Oak Forest Hospital 10%
JTDC Campus 4%
Provident Hospital 3%
Cook County Building 2%
Forensics1%
Markham 1%
Maywood 1%
Others 2%
Stroger Hospital Campus2%
Percentage of Water Usage by Facility
DOC Campus
Oak Forest Hospital
JTDC Campus
Provident Hospital
Cook County Building
Rob't J. Stein Institute of ForensicMedicine
Markham Courthouse (6th Dist.)
Maywood Courthouse (4th Dist.)
Others
Stroger Hospital Campus

21 | P a g e
Figure 17. Water Usage in Remaining 2% of Facilities (from Figure 16)
2,192
1,972
1,595 1,563
892
647
527
331 316 257
171 167 161 153 128 110 105 104 104 60 44 43 32 28 20 9 1
-
500
1,000
1,500
2,000
2,500
Wat
er
Usa
ge (
1,0
00
Gal
lon
s)
Water Usage in Remaining 2% of Facilities
22 | P a g e
Figure 18. Water Use Intensity by Facility
0.00
20.00
40.00
60.00
80.00
100.00
120.00Fo
ren
sic
Inst
itu
te
DO
C C
amp
us
Pis
zcez
ek
TB C
linic
Pro
vid
ent
Ho
spit
al
Oak
Fo
rest
Cam
pu
s
JTD
C
De
s P
lain
es
TB C
linic
May
wo
od
Co
urt
ho
use
Co
ok
Co
un
ty B
uild
ing
Mar
kham
Co
urt
ho
use
Cic
ero
Hea
lth
Ce
nte
r
Co
ttag
e G
rove
He
alth
Cen
ter
Loga
n S
qu
are
Hea
lth
Ce
nte
r
Ro
bb
ins
He
alth
Cen
ter
Do
mes
tic
Vio
len
ce C
ou
rth
ou
se
Engl
ewo
od
He
alth
Cen
ter
Pro
vid
ent
Ph
arm
acy
CC
DO
TH D
istr
ict
5
Stro
ger
Ho
spit
al C
amp
us
Wh
itco
mb
Bu
ildin
g
Jeff
erso
n B
uild
ing
Ro
llin
g M
ead
ow
s C
ou
rth
ou
se
CC
DO
TH D
istr
ict
4
CC
DO
TH D
istr
ict
1
CC
DO
TH D
istr
ict
3
Bri
dge
view
Co
urt
ho
use
CC
DO
TH D
istr
ict
2
Du
nn
e B
uild
ing
Haw
tho
rne
War
eh
ou
se
CO
RE
Cen
ter
Pri
eto
He
alth
Cen
ter
Sko
kie
Co
urt
ho
use
Pro
vid
ent
Par
kin
g St
ruct
ure
Ro
ckw
ell W
areh
ou
se
Hek
toe
n B
uild
ing
Har
vey
TB C
linic
Wat
er
Usa
ge I
nte
nsi
ty (
gal/
sq f
t)
Water Intensity (gallons/sq ft)

23 | P a g e
Benchmarking allows facility managers and occupants to better understand their building’s energy
performance and the impact of capital and operational changes. In an effort to make sure
benchmarking figures are as accurate as possible, the Bureau of Asset Management is currently
working to:
Implement a new energy management system to make improvements between utility meters
and buildings
Continue with the sub-metering of building groups previously benchmarked as one structure,
such as separating the courthouse (CCB) and the administration building (CCAB) from the
Department of Corrections (DOC) campus account to better analyze individual building
performance and more accurately represent the DOC complex
Continue prioritizing sustainability initiatives within low-performing portfolios. For instance,
none of the Health and Hospitals buildings had an Energy Star score above the national median,
and the buildings consume 40% of the County’s source energy usage
Finalize water data collection policy for future reporting and analysis and complete water meter
inventory
Begin water conservation planning for Department of Corrections Campus
Beyond benchmarking, the County is undertaking the following sustainability projects that will improve
building operations and reduce energy consumption:
Utilizing the developed Carbon Reduction Plan to identify strategies to reduce building
consumption and inform project investments that effectively reduce GHG emissions
Conducting Energy Assessments to improve energy efficiency projects and highlight
improvements
Participating in a Demand Response Load Curtailment Program that was expanded to include
more hours at select properties
Designing a new LEED certified facility as a redevelopment project at Stroger Hospital
Carrying out demolition of DOC Divisions 1, 1A, 3, and 17 to reduce total footprint and energy
Incorporating DOC diesel generator usage in Portfolio Manager totals for future years further
refining emissions analysis
NEXT STEPS

24 | P a g e
The following pages summarize the 2016 benchmarking results for each building. Data has been downloaded from Portfolio Manager, a secure
online tool that tracks and measures energy consumption and greenhouse gas emissions for one building or multiple buildings in a portfolio.
Property Name Primary Property
Type
Year Built
No. of Bldgs.
ENERGY STAR Score
Site EUI (kBtu/ft²)
Source EUI
(kBtu/ft²)
Source Energy Use (kBtu)
Site Energy Use (kBtu)
Electricity Use - Grid Purchase
(kWh)
Natural Gas Use (therms)
GHG Emissions
(Metric Tons
CO2e)
GHG Emissions Intensity (kgCO2e/
ft²)
George W Dunne Office Building
Office 1965 1 91 70.7 153 125,464,650 58,110,107 9,037,766 272,732 7,133 9
Cook County Building Office 1906 1 55 106.1 240 153,277,694 67,741,834 11,519,820 284,362 8,755 14
Rockwell Warehouse Non-Refrigerated Warehouse
1927 1 75 52.8 94 41,858,172 23,632,475 2,390,111 154,774 2,325 5
Hawthorne Warehouse
Non-Refrigerated Warehouse
1905 1 37 97.7 131 64,880,656 48,304,736 1,985,770 415,293 3,455 7
Cicero Records Center Non-Refrigerated Warehouse
2008 1 58 41.1 79 20,671,851 10,713,375 1,321,372 62,049 1,161 5
2nd District Courthouse Complex - Skokie
Courthouse 1980 2 65 72.4 203 70,104,748 25,025,245 6,146,087 40,548 3,865 11
2nd District Courthouse (Skokie)
Courthouse 1980 (1) 86 54.1 145 50,266,096 18,707,203 4,294,375 40,548 2,701 8
2nd District Courthouse (Skokie) Parking Structure
Parking 2002 (1) N/A 13.1 41 19,838,656 6,318,043 1,851,712 N/A 1,165 2
3rd District Courthouse Complex - Rolling Meadows
Courthouse 1987 2 77 56 176 58,891,842 18,772,714 5,494,327 5,604 3,455 10
3rd District Courthouse (Rolling Meadows)
Courthouse 1987 (1) 80 52.9 166 55,615,413 17,729,265 5,188,510 5,604 3,263 10
Appendix A: 2016 Energy Benchmarking Results of County-Owned Properties

25 | P a g e
Property Name Primary Property
Type
Year Built
No. of Bldgs.
ENERGY STAR Score
Site EUI (kBtu/ft²)
Source EUI
(kBtu/ft²)
Source Energy Use (kBtu)
Site Energy Use (kBtu)
Electricity Use - Grid Purchase
(kWh)
Natural Gas Use (therms)
GHG Emissions
(Metric Tons
CO2e)
GHG Emissions Intensity (kgCO2e/
ft²)
3rd District Courthouse (Rolling Meadows) Parking Structure
Parking
1987 (1) N/A 1.8 6 3,110,578 990,630 290,337 N/A 183 0
4th District Courthouse Campus - Maywood
Courthouse 1975 4 N/A 87 268 74,360,392 24,100,396 6,879,038 6,291 4,360 16
Jefferson Building Office 1965 (1) 52 80.3 252 11,908,123 3,792,396 1,111,488 N/A 699 15
Whitcomb Building Office 1965 (1) 59 68.1 214 4,965,032 1,581,220 463,429 N/A 292 13
Sheriff Training Academy
Other - Public Services
1967 (1) N/A 124.2 329 7,143,100 2,693,615 605,070 6,291 414 19
4th District Courthouse (Maywood)
Courthouse 1975 (1) 44 86.7 272 50,344,137 16,033,165 4,699,051 N/A 2,955 16
5th District Courthouse - Bridgeview
Courthouse 1989 1 52 77.7 242 81,059,261 26,037,245 7,533,242 3,505 4,738 14
Domestic Violence Courthouse
Courthouse 1890 1 65 97 214 39,996,363 18,158,874 2,934,975 81,447 2,278 12
6th District Courthouse - Markham
Courthouse 1980 1 51 82.8 250 79,457,749 26,285,792 7,272,063 16,186 4,573 14
Juvenile Temporary Detention Center Campus
Prison/ Incarceration 1973 3 N/A 95.9 218 223,096,359 98,200,343 16,825,780 407,908 12,748 13
Juvenile Temporary Detention Center
Prison/ Incarceration 1974 (1) N/A 88.7 189 115,346,863 54,218,150 8,191,999 262,670 6,547 11
Juvenile Courthouse Courthouse 1993 (1) 61 99.9 240 99,103,188 41,228,592 7,826,747 145,237 5,694 14
JTDC Parking Structure
Parking 1993 (1) N/A 3.5 11 8,646,311 2,753,602 807,035 N/A 508 1
Institute of Forensic Medicine
Other - Public Services
1982 1 N/A 212 415 32,909,822 16,825,626 2,137,532 95,324 1,851 23

26 | P a g e
Property Name Primary Property
Type
Year Built
No. of Bldgs.
ENERGY STAR Score
Site EUI (kBtu/ft²)
Source EUI
(kBtu/ft²)
Source Energy Use (kBtu)
Site Energy Use (kBtu)
Electricity Use - Grid Purchase
(kWh)
Natural Gas Use (therms)
GHG Emissions
(Metric Tons
CO2e)
GHG Emissions Intensity (kgCO2e/
ft²)
Cook County Department of Corrections Campus
Prison/ Incarceration 1926 57 N/A 138.2 226 1,034,374,567 631,684,721 52,040,584 4,541,222 56,849 12
CCDOTH Maintenance Facility District 1
Repair Services
1954 4 N/A 102.8 126 7,117,723 5,812,565 142,269 53,271 372 7
CCDOTH Maintenance Facility District 3
Repair Services
1950 3 N/A 88.7 138 6,393,615 4,109,817 291,444 31,154 349 8
CCDOTH Maintenance Facility District 2
Repair Services
1990 4 N/A 101.6 129 7,987,827 6,292,090 193,678 56,313 421 7
CCDOTH Maintenance Facility District 4
Repair Services
1969 5 N/A 130.6 163 11,143,013 8,937,456 246,622 80,960 585 9
CCDOTH Maintenance Facility District 5
Repair Services
1987 3 N/A 99.5 138 10,741,062 7,767,339 362,548 65,303 575 7
Oak Forest Hospital Campus
Medical Office
1910 52 N/A 158.2 266 291,832,997 173,694,584 15,348,821 1,213,244 16,097 15
CORE Center Medical Office
1998 1 1 783.8 1,475 46,521,683 24,729,508 2,882,550 148,942 2,604 83
Provident Hospital Campus
Hospital 1981 2 4 276.7 519 194,076,420 103,479,717 11,978,930 626,076 10,859 29
Provident Hospital Hospital 1981 (2) 3 272 504 188,566,889 101,725,089 11,464,678 626,076 10,536 28
Provident Hospital Parking Structure
Parking 1991 1 N/A 6.6 21 5,104,857 1,625,751 476,480 N/A 300 1
Stroger Hospital Campus
Hospital 2002
4
17 287.7 519 935,932,295 518,427,974 54,912,142 3,310,677 52,119 29
Hektoen Building Laboratory 1964 2 N/A 138 171 31,619,317 25,473,071 683,290 231,417 1,659 9
Cottage Grove Health Center
Medical Office
2000 1 6 100.8 210 2,811,578 1,347,323 195,887 N/A 123 9
Piszcezek TB Clinic Medical Office
1957 1 39 150.7 250 4,830,837 2,916,103 248,059 20,697 266 14
Des Plaines TB Clinic Medical Office
1991 1 N/A 143.3 266 662,388 356,779 40,354 2,191 37 15
Logan Square Health Center
Medical Office 1962 1 34 80.2 175 1,428,695 655,529 103,826 3,013 81 10

27 | P a g e
Property Name Primary Property
Type
Year Built
No. of Bldgs.
ENERGY STAR Score
Site EUI (kBtu/ft²)
Source EUI
(kBtu/ft²)
Source Energy Use (kBtu)
Site Energy Use (kBtu)
Electricity Use - Grid Purchase
(kWh)
Natural Gas Use (therms)
GHG Emissions
(Metric Tons
CO2e)
GHG Emissions Intensity (kgCO2e/
ft²)
Englewood Health Center
Medical Office 2000 1 1 186.1 562 6,046,957 2,004,102 552,883 1,177 354 33
Harvey TB Clinic Medical Office
1962 1 N/A 52.6 65 176,813 143,174 3,713 1,305 9 3
Robbins Health Center
Medical Office
2000 1 13 97.4 199 2,852,540 1,394,081 194,747 N/A 123 9
Cicero Health Center Medical Office
1999 1 31 69.4 199 1,688,897 590,889 149,832 N/A 94 11
Prieto Health Center Medical Office
1994 1 11 118.5 242 4,101,091 2,011,375 278,940 10,596 232 14
Provident Hospital Pharmacy
Medical Office
2005 1 8 114.9 360 2,368,398 755,889 220,824 24 139 21
Sheriff Central Warrants
Public Safety 1955 1 N/A 82.6 148 2,880,249 1,605,162 167,552 10,335 160 8
Rockwell Garage Parking 1927 1 N/A 195.4 255 1,220,541 935,361 33,433 8,213 65 14
NOTE: NO. OF BLDGS. IN ( ) INDICATE CAMPUS PORTFOLIOS WHERE THE BUILDINGS ARE COUNTED ELSEWHERE TO AVOID DOUBLE COUNTING

28 | P a g e
CORPORATE FACILITIES (CF) Property ID Property Name Address City Zip Code Primary Use Dept/ Agency Owned/ Leased Year Built GSF
CF.001.001 County Building 118 N. Clark St. Chicago 60602 Public Multiple Owned/ Leased 1/1/1906 638,592
CF.002.001 George W. Dunne Admin. Building- Main
69 W. Washington St.
Chicago 60602 Admin Multiple Owned 1/1/1964 787,888
CF.002.002 George W. Dunne Admin. Building- Generator Building
69 W. Washington St.
Chicago 60602 Admin Multiple Owned 1/1/2002 896
CF.003.001 CCHD Maintenance Fac. Dist. 1 - Bldg. A 2325 N. Meacham Rd.
Schaumburg 60173 Garage CCHD Owned 1/1/1954 16,159
CF.003.002 CCHD Maintenance Fac. Dist. 1 - Bldg. B 2325 N. Meacham Rd.
Schaumburg 60173 Garage CCHD Owned 1/1/1986 24,350
CF.003.003 CCHD Maintenance Fac. Dist. 1 - Bldg. C 2325 N. Meacham Rd.
Schaumburg 60173 Garage CCHD Owned 1/1/1995 8,241
CF.003.004 CCHD Maintenance Fac. Dist. 1 - Bldg. D 2325 N. Meacham Rd.
Schaumburg 60173 Garage CCHD Owned 1/1/1988 7,818
CF.004.001 CCHD Maintenance Fac. Dist. 2 - Bldg. A 9801 Ballard Rd. Des Plaines 60016 Garage CCHD Owned 1/1/2000 20,753
CF.004.002 CCHD Maintenance Fac. Dist. 2 - Bldg. B 9801 Ballard Rd. Des Plaines 60016 Garage CCHD Owned 1/1/2000 18,688
CF.004.003 CCHD Maintenance Fac. Dist. 2 - Bldg. C 9801 Ballard Rd. Des Plaines 60016 Garage CCHD Owned 1/1/1990 14,574
CF.004.004 CCHD Maintenance Fac. Dist. 2 -Bldg. D 9801 Ballard Rd. Des Plaines 60016 Garage CCHD Owned 1/1/2000 7,896
CF.006.001 CCHD Maintenance Fac. Dist. 4 - Bldg. A 8900 W. 135th St. Orland Park 60462 Garage CCHD Owned 1/1/1969 17,582
CF.006.002 CCHD Maintenance Fac. Dist. 4 - Bldg. B 8900 W. 135th St. Orland Park 60462 Garage CCHD Owned 1/1/1975 4,000
CF.006.003 CCHD Maintenance Fac. Dist. 4 - Bldg. C 8900 W. 135th St. Orland Park 60462 Garage CCHD Owned 1/1/1975 18,997
CF.006.004 CCHD Maintenance Fac. Dist. 4 - Bldg. D 8900 W. 135th St. Orland Park 60462 Garage CCHD Owned 1/1/1984 7,708
CF.006.005 CCHD Maintenance Fac. Dist. 4 - Bldg. E 8900 W. 135th St. Orland Park 60462 Garage CCHD Owned 1/1/2007 20,157
CF.007.001 CCHD Maintenance Fac. Dist. 5 - Bldg. A 13600 S. Ashland Ave.
Riverdale 60827 Garage CCHD Owned 1/1/2002 24,794
CF.007.002 CCHD Maintenance Fac. Dist. 5 - Bldg. B 13600 S. Ashland Ave.
Riverdale 60827 Garage CCHD Owned 1/1/1987 45,636
CF.007.003 CCHD Maintenance Fac. Dist. 5 - Bldg. C 13600 S. Ashland Ave.
Riverdale 60827 Garage CCHD Owned 1/1/2002 7,662
CF.008.001 Rockwell Warehouse 2323 S. Rockwell St. Chicago 60608 Storage Multiple Owned 1/1/1979 447,418
CF.009.001 Hawthorne Warehouse 4545 W. Cermak Rd. Chicago 60623 Storage Multiple Owned 1/1/1905 354,672
CF.010.001 Public Administrator Warehouse 7232 N. Western Ave.
Chicago 60645 Storage/Public Service
Administrator Leased 7,709
APPENDIX B: COOK COUNTY BUILDING LIST BY PORTFOLIO

29 | P a g e
PUBLIC SAFETY (PS) Property ID Property Name Address City
Zip Code
Primary Use
Dept/ Agency
Owned/ Leased
Year GSF
PS.011.000 DOC Site 26th/S. California Chicago 60608 Courts Sheriff Owned
PS.011.001 Criminal Courts (26th/California) 2650 S. California Ave. Chicago 60608 Courts Circuit Court Owned 1/1/1927 324438
PS.011.002 Criminal Court Admin. Building 2650 S. California Ave. Chicago 60608 Admin Multiple Owned 1/1/1978 472493
PS.011.003 RTU‐RCDC 2750 S. California Ave. Chicago 60608 Detention Owned 1/1/2013 283401
PS.011.004 DOC Central Chiller Plant 3045 S. Sacramento Ave. Chicago 60608 Utility Multiple Owned 1/1/1990 18225
PS.011.005 DOC Cermak Hospital 2800 S. California Ave. Chicago 60608 Medical CCHHS Owned 1/1/1998 161590
PS.011.006 DOC Div. II, Dorm I 2809 S. Sacramento Ave. Chicago 60608 Detention Sheriff Owned 1/1/1958 54484
PS.011.007 DOC Div. II, Dorm II 2807 S. Sacramento Ave. Chicago 60608 Detention Sheriff Owned 1/1/1955 54741
PS.011.008 DOC Div. II, Dorm III 2805 S. Sacramento Ave. Chicago 60608 Detention Sheriff Owned 1/1/1955 54717
PS.011.009 DOC Div. II, Dorm IV 2803 S. Sacramento Ave. Chicago 60608 Detention Sheriff Owned 1/1/1972 45203
PS.011.010 DOC Division I 2602 S. California Ave. Chicago 60608 Detention Sheriff Owned 1/1/1929 344268
PS.011.011 DOC Division III 2750 S. California Ave. Chicago 60608 Detention Sheriff Owned 1/1/1973 81511
PS.011.012 DOC Division III Annex (RTU) 2811 S. Sacramento Ave. Chicago 60608 Detention Sheriff Owned 1/1/1985 78023
PS.011.013 DOC Division IV 2649 S. Sacramento Ave. Chicago 60608 Detention Sheriff Owned 1/1/1976 122362
PS.011.014 DOC Division IX 2834 W. 31st St. Chicago 60608 Detention Sheriff Owned 1/1/1990 311786
PS.011.015 DOC Division V 2708 S. California Ave. Chicago 60608 Detention Sheriff Owned 1/1/1978 364560
PS.011.016 DOC Division VI 2901 S. Sacramento Ave. Chicago 60608 Detention Sheriff Owned 1/1/1978 264238
PS.011.017 DOC Division Vll‐Div I Annex 2604 S. California Ave. Chicago 60608 Detention Sheriff Owned 1/1/1929 68088
PS.011.018 DOC Division X 2950 S. California Ave. Chicago 60608 Detention Sheriff Owned 1/1/1991 211562
PS.011.019 DOC Division Xl 3015 S. California Ave. Chicago 60608 Detention Sheriff Owned 1/1/1995 630380
PS.011.020 DOC Division XVII (Old Cermak Hospital) 2724 S. California Ave. Chicago 60608 Detention Sheriff Owned 1/1/1958 54309
PS.011.021A DOC Guard House A 2600 S. California Ave. Chicago 60608 Detention Sheriff Owned 1/1/1976 234
PS.011.021B DOC Guard House B 2602 S. California Ave. Chicago 60608 Detention Sheriff Owned 1/1/1976 2064
PS.011.021C DOC Guard House C 2600 S. California Ave. Chicago 60608 Detention Sheriff Owned 1/1/1976 58
PS.011.021D DOC Guard House D 2950 S. California Ave Chicago 60608 Detention Sheriff Owned 1/1/1976 249
PS.011.021E DOC Guard House E 3000 S. California Ave. Chicago 60608 Detention Sheriff Owned 1/1/1976 167
PS.011.021F DOC Guard House F 3026 S. California Ave. Chicago 60608 Detention Sheriff Owned 1/1/1970 1392
PS.011.021G DOC Guard House G 2828 W. 31st Street Chicago 60608 Detention Sheriff Owned 1/1/1976 410
PS.011.021H DOC Guard House H 2901 S. Sacramento Ave. Chicago 60608 Detention Sheriff Owned 1/1/1956 156
PS.011.021I DOC Guard House I 2801 S. Sacramento Ave. Chicago 60608 Detention Sheriff Owned 1/1/1976 234
PS.011.021J DOC Guard House J 2717 S. Sacramento Ave. Chicago 60608 Detention Sheriff Owned 1/1/1976 234
PS.011.021K DOC Guard House K 2950 S. California Ave. Chicago 60608 Detention Sheriff Owned 1/1/1999 375

30 | P a g e
PUBLIC SAFETY (PS) Property ID
Property Name Address City Zip
Code
Primary Use
Dept./ Agency
Owned/ Leased
Year GSF
PS.011.022A DOC Guard Tower A 26th ‐ Adjacent to Div. I Annex Chicago 60608 Detention Sheriff Owned 1/1/1929 372
PS.011.022B DOC Guard Tower B 2602 S. California Ave. Chicago 60608 Detention Sheriff Owned 1/1/1929 347
PS.011.022C DOC Guard Tower C Inside Campus Chicago 60608 Detention Sheriff Owned 1/1/1991 272
PS.011.022D DOC Guard Tower D California ‐ b/w Div. III & Div. X Chicago 60608 Detention Sheriff Owned 1/1/1976 224
PS.011.022E DOC Guard Tower E Inside Campus ‐ b/w Old RTU Chicago 60608 Detention Sheriff Owned 1/1/1976 224
PS.011.022F DOC Guard Tower F 2901 S. Sacramento Ave. Chicago 60608 Detention Sheriff Owned 1/1/1976 224
PS.011.022G DOC Guard Tower G 2901 S. Sacramento Ave. Chicago 60608 Detention Sheriff Owned 1/1/1955 284
PS.011.022H DOC Guard Tower H Sacramento ‐ adj. to Div. VI Chicago 60608 Detention Sheriff Owned 1/1/1976 224
PS.011.022I DOC Guard Tower I 2801 S. Sacramento Ave. Chicago 60608 Detention Sheriff Owned 1/1/1976 224
PS.011.022J DOC Guard Tower J 2717 S. Sacramento Ave. Chicago 60608 Detention Sheriff Owned 1/1/1976 224
PS.011.022K DOC Guard Tower K Sacramento ‐ Adj. to Div. I yard Chicago 60608 Detention Sheriff Owned 1/1/1929 375
PS.011.022L DOC Guard Tower L Corner of Sacramento & 26th Chicago 60608 Detention Sheriff Owned 1/1/1929 341
PS.011.022 DOC Guard Tower M 26th ‐ NW corner of Div. I Chicago 60608 Detention Sheriff Owned 1/1/1929 332
PS.011.022N DOC Guard Tower N 3015 S. California Ave. Chicago 60608 Detention Sheriff Owned 1/1/1999 402
PS.011.022O DOC Guard Tower O 3015 S. California Ave. Chicago 60608 Detention Sheriff Owned 1/1/1999 402
PS.011.022P DOC Guard Tower P 3015 S. California Ave. Chicago 60608 Detention Sheriff Owned 1/1/1999 402
PS.011.022Q DOC Guard Tower Q 3015 S. California Ave. Chicago 60608 Sheriff Owned 1/1/1999 402
PS.011.023 DOC Gym (Div. IV) 2649 S. Sacramento Ave Chicago 60608 Detention Sheriff Owned 1/1/1976 31292
PS.011.024 DOC Kitchen 2735 S. Sacramento Ave. Chicago 60608 Detention Sheriff Owned 1/1/1994 95904
PS.011.025A DOC Powerhouse 3045 S. Sacramento Ave. Chicago 60608 Utility Sheriff Owned 1/1/1957 22622
PS.011.025B DOC Powerhouse 3045 S. Sacramento Ave. Chicago 60608 Utility Sheriff Owned 1/1/1992 3716
PS.011.026 DOC South Campus Building 1 3026 S. California Ave. Chicago 60608 Admin Sheriff Owned 1/1/1910 40966
PS.011.027 DOC South Campus Building 2 3036 S. California Ave. Chicago 60608 Admin Sheriff Owned 1/1/1910 89011
PS.011.028 DOC South Campus Building 3 3026 S. California Ave. Chicago 60608 Detention Sheriff Owned 1/1/1910 74186
PS.011.029 DOC South Campus Building 4 2828 W. 31st St. Chicago 60608 Detention Sheriff Owned 1/1/1910 49346
PS.011.030 DOC South Campus Building 5 2840 W. 31st St. Chicago 60608 Admin Sheriff Owned 1/1/1910 34114
PS.011.031 Boot Camp Building #1 2801 S. Rockwell St. Chicago 60608 Detention Sheriff Owned 1/1/1996 8432
PS.011.032 Boot Camp Building #2 2801 S. Rockwell St. Chicago 60608 Detention Sheriff Owned 1/1/1996 8432
PS.011.033 Boot Camp Building #3 2801 S. Rockwell St. Chicago 60608 Detention Sheriff Owned 1/1/1996 8432
PS.011.034 Boot Camp Building #4 2801 S. Rockwell St. Chicago 60608 Detention Sheriff Owned 1/1/1996 8432
PS.011.035 Boot Camp Building #5 2801 S. Rockwell St. Chicago 60608 Detention Sheriff Owned 1/1/1996 5429
PS.011.036 Boot Camp Building #6 2801 S. Rockwell St. Chicago 60608 Detention Sheriff Owned 1/1/1996 7707
31 | P a g e
PUBLIC SAFETY (PS)
Property ID Property Name Address City Zip
Code
Primary Use
Dept/ Agency
Owned/ Leased
Year GSF
PS.011.037 Boot Camp Building #7 2801 S. Rockwell St. Chicago 60608 Detention Sheriff Owned 1/1/1996 10400
PS.011.038 Boot Camp Building #8 2801 S. Rockwell St. Chicago 60608 Detention Sheriff Owned 1/1/1996 6814
PS.011.039 Boot Camp Building #9 2801 S. Rockwell St. Chicago 60608 Detention Sheriff Owned 1/1/1996 6267
PS.011.040 Boot Camp Building #10 2801 S. Rockwell St. Chicago 60608 Detention Sheriff Owned 1/1/1996 1847
PS.011.041 DOC Tunnels 2700 S. California Ave. Chicago 60608 Utility Sheriff Owned 1/1/1955 45600
PS.011.044 DOC Parking Structure 26th/California Chicago 60608 Parking Sheriff Owned 1/1/1976 463597
PS.013.001 Domestic Violence Courthouse 555 W. Harrison St. Chicago 60607 Courts Circuit Court Owned 187,268
PS.014.001 Juvenile West (Courthouse) 1100 S. Hamilton Ave. Chicago 60612 Courts Circuit Court Owned 1/1/1993 412,596
PS.015.001 Markham Courthouse (6th Dist.) 16501 S. Kedzie Ave. Markham 60428 Courts Circuit Court Owned 1/1/1977 317,652
PS.029.001 Jefferson Building 1401 Maybrook Dr. Maywood 60153 Sheriff Multiple Owned 1/1/1965 47,254
PS.030.001 Sheriff Training Academy 1401 Maybrook Dr. Maywood 60153 Police Sheriff Owned 1/1/1967 21,687
PS.031.001 Whitcomb Building 1311 Maybrook Dr. Maywood 60153 Admin Multiple Owned 1/1/1965 23,217
PS.016.001 Maywood Courthouse (4th Dist.) 1500 Maybrook Dr. Maywood 60153 Courts Circuit Court Owned 1/1/1975 184,841
PS.017.001 Rolling Meadows Courthouse (3rd District) 2121 Euclid Ave. Rolling 60008 Courts Circuit Court Owned 1/1/1987 335,205
PS.017.002 Rolling Meadows Courthouse Parking Structure
2121 Euclid Ave. Rolling 60008 Parking Circuit Court Owned 1/1/1987 554,767
PS.018.001 Skokie Courthouse (2nd District) 5600 Old Orchard Rd. Skokie 60077 Courts Circuit Court Owned 1/1/1980 345,743
PS.018.002 Skokie Courthouse (2nd Dist.) Parking Structure
5600 Old Orchard Rd. Skokie 60077 Parking Circuit Court Owned 1/1/2002 483,451
PS.022.001 Bridgeview Courthouse (5th Dist.) 10220 S. 76th Ave. Bridgeview 60455 Courts Circuit Court Owned 1/1/1989 335,205
PS.028.001 Juvenile Temp. Detention Center 1100 S. Hamilton Ave. Chicago 60612 Detention Circuit Court Owned 1/1/1974 611,255
PS.028.002 JTDC Parking Structure 1101 S. Hamilton Ave. Chicago 60612 Parking Circuit Court Owned 1/1/1993 788,777
PS.096.001 Clerk of the Circuit Ct. Warehouse 1330 S. 54th Avenue Cicero 60804 Storage Circuit Court Owned 2009 260,725
CF.005.001 CCHD Maintenance Fac. Dist. 3 ‐ Bldg. A 901 W. 26th St. LaGrange 60526 Garage Sheriff Owned 1/1/1950 24,469
CF.005.002 CCHD Maintenance Fac. Dist. 3 ‐ Bldg. B 901 W. 26th St. LaGrange 60526 Garage Sheriff Owned 1/1/1950 19,823
CF.005.003 CCHD Maintenance Fac. Dist. 3 ‐ Bldg. C 901 W. 26th St. LaGrange 60526 Garage Sheriff Owned 1/1/1985 2,031

32 | P a g e
HEALTH & HOSPITAL (HH) Property ID Property Name Address City
Zip Code
Primary Use
Dept/ Agency
Owned/ Leased
Year Built
GSF
HH.046.002 OFH Administration Building, Floors 1,2,3 15900 S. Cicero Ave. Oak Forest 60452 Admin CCHHS Owned 1/1/1910 16,454
HH.046.003 OFH Brick Storage 15900 S. Cicero Ave. Oak Forest 60452 Storage CCHHS Owned 1/1/1910 793
HH.046.004 OFH Building A 15900 S. Cicero Ave. Oak Forest 60452 Admin CCHHS Owned 1/1/1910 26,906
HH.046.005 OFH Building B 15900 S. Cicero Ave. Oak Forest 60452 Admin CCHHS Owned 1/1/1910 115,891
HH.046.006 OFH Building C 15900 S. Cicero Ave. Oak Forest 60452 Vacant CCHHS Owned 1/1/1910 114,413
HH.046.007 OFH Building D 15900 S. Cicero Ave. Oak Forest 60452 Admin CCHHS Owned 1/1/1910 25,382
HH.046.008 OFH Building E, New 15900 S. Cicero Ave. Oak Forest 60452 Pharmacy CCHHS Owned 1/1/1991 121,153
HH.046.009 OFH Building E, Old 15900 S. Cicero Ave. Oak Forest 60452 Storage CCHHS Owned 1/1/1910 29,620
HH.046.010 OFH Building F 15900 S. Cicero Ave. Oak Forest 60452 Pharmacy CCHHS Owned 1/1/1910 60,326
HH.046.011 OFH Building H 15900 S. Cicero Ave. Oak Forest 60452 Pharmacy CCHHS Owned 1/1/1910 64,940
HH.046.012 OFH Building J 15900 S. Cicero Ave. Oak Forest 60452 Pharmacy CCHHS Owned 1/1/1958 79,845
HH.046.013 OFH Catholic Chapel & Offices 15900 S. Cicero Ave. Oak Forest 60452 Admin CCHHS Owned 1/1/1912 11,442
HH.046.016 OFH Comfort Station 15900 S. Cicero Ave. Oak Forest 60452 Admin CCHHS Owned 1/1/1912 1,064
HH.046.017 OFH Connecting Corridors (1st & 2nd Flr) 15900 S. Cicero Ave. Oak Forest 60452 Admin CCHHS Owned 1/1/1912 47,832
HH.046.019 OFH County Store 15900 S. Cicero Ave. Oak Forest 60452 Vacant CCHHS Owned 1/1/1948 2,995
HH.046.020 OFH Dietary Building 15900 S. Cicero Ave. Oak Forest 60452 Dietary CCHHS Owned 1/1/1910 19,776
HH.046.022 OFH Employee Annex 15900 S. Cicero Ave. Oak Forest 60452 Public CCHHS Owned 1/1/1910 18,089
HH.046.023 OFH Employee Residence 15900 S. Cicero Ave. Oak Forest 60452 Storage CCHHS Owned 1/1/1949 52,017
HH.046.024 OFH Generator Building B 15900 S. Cicero Ave. Oak Forest 60452 Utility CCHHS Owned 1/1/1980 426
HH.046.026 OFH Grounds Office 15900 S. Cicero Ave. Oak Forest 60452 Admin CCHHS Owned 1/1/1988 2,576
HH.046.027 OFH Halsted Street Pump House 15900 S. Cicero Ave. Oak Forest 60452 Utility CCHHS Owned 1/1/1940 1,021
HH.046.028 OFH Kitchen 15900 S. Cicero Ave. Oak Forest 60452 Dietary CCHHS Owned 1/1/1912 20,375
HH.046.029 OFH Laboratory & Morgue 15900 S. Cicero Ave. Oak Forest 60452 Medical CCHHS Owned 1/1/1954 9,373
HH.046.030 OFH Laundry 15900 S. Cicero Ave. Oak Forest 60452 Storage CCHHS Owned 1/1/1915 21,105
HH.046.031 OFH Laundry Annex 15900 S. Cicero Ave. Oak Forest 60452 Vacant CCHHS Owned 1/1/1912 6,892
HH.046.032 OFH Main Gate House 15900 S. Cicero Ave. Oak Forest 60452 Public Service
CCHHS Owned 1/1/1950 261
HH.046.033 OFH Main Pump House 15900 S. Cicero Ave. Oak Forest 60452 Utility CCHHS Owned 1/1/1980 2,099
HH.046.034 OFH Medical Residence 15900 S. Cicero Ave. Oak Forest 60452 Vacant CCHHS Owned 1/1/1912 12,114
HH.046.035 OFH Medical Social Service 15900 S. Cicero Ave. Oak Forest 60452 Public Service
CCHHS Owned 1/1/1912 8,815
HH.046.036 OFH Paint Shop 15900 S. Cicero Ave. Oak Forest 60452 Utility CCHHS Owned 1/1/1947 4,745
HH.046.037 OFH Physical Plant Office 15900 S. Cicero Ave. Oak Forest 60452 Admin CCHHS Owned 1/1/1910 2,680
33 | P a g e
HEALTH & HOSPITAL (HH) Property ID Property Name Address City
Zip Code
Primary Use
Dept/ Agency
Owned/ Leased
Year GSF
HH.046.038 OFH Powerhouse, New 15900 S. Cicero Ave. Oak Forest 60452 Utility CCHHS Owned 1/1/1980 20,448 HH.046.039 OFH Powerhouse, Old 15900 S. Cicero Ave. Oak Forest 60452 Utility CCHHS Owned 1/1/1908 37,056
HH.046.040 OFH Protestant Chapel & Offices 15900 S. Cicero Ave. Oak Forest 60452 Vacant CCHHS Owned 1/1/1912 4,525
HH.046.041 OFH Public Aid Offices (F Annex) 15900 S. Cicero Ave. Oak Forest 60452 Admin CCHHS Owned 1/1/1912 7,836
HH.046.042 OFH Public Safety 15900 S. Cicero Ave. Oak Forest 60452 Admin CCHHS Owned 1/1/1912 2,051
HH.046.043 OFH Pump House, Old 15900 S. Cicero Ave. Oak Forest 60452 Utility CCHHS Owned 636
HH.046.044 OFH Quincy Building 15900 S. Cicero Ave. Oak Forest 60452 Utility CCHHS Owned 1/1/1912 15,034
HH.046.045 OFH Recreation Building 15900 S. Cicero Ave. Oak Forest 60452 Public CCHHS Owned 1/1/1954 53,244
HH.046.048 OFH Skilled Trade Garage 15900 S. Cicero Ave. Oak Forest 60452 Utility CCHHS Owned 1/1/1950 1,675
HH.046.049 OFH Sneed Hall 15900 S. Cicero Ave. Oak Forest 60452 Admin CCHHS Owned 1/1/1912 18,983
HH.046.050 OFH Store Room #21 15900 S. Cicero Ave. Oak Forest 60452 Storage CCHHS Owned 1/1/1988 15,690
HH.046.051 OFH Store Room #23 15900 S. Cicero Ave. Oak Forest 60452 Storage CCHHS Owned 1/1/1912 4,924
HH.046.052 OFH Stucco Office 15900 S. Cicero Ave. Oak Forest 60452 Utility CCHHS Owned 1/1/1950 3,310
HH.046.054 OFH Truck Barn & Salt Shed 15900 S. Cicero Ave. Oak Forest 60452 Utility CCHHS Owned 1/1/1950 2,922
HH.046.056 OFH Fire Dept. Garage 15900 S. Cicero Ave. Oak Forest 60452 Utility CCHHS Owned 1/1/1940 1,004
HH.046.057 OFH Hazmat Building 15900 S. Cicero Ave. Oak Forest 60452 Utility CCHHS Owned 1/1/1947 201
HH.046.058 OFH Public Health Vehicle Storage 15900 S. Cicero Ave. Oak Forest 60452 Utility CCHHS Owned 1/1/2010 5,368
HH.046.060 OFH Generator Building C 15900 S. Cicero Ave. Oak Forest 60452 Utility CCHHS Owned 1/1/1980 399
HH.046.061 OFH Generator Building E ‐ New 15900 S. Cicero Ave. Oak Forest 60452 Utility CCHHS Owned 1/1/1991 503
HH.046.062 OFH Generator Building F‐J 15900 S. Cicero Ave. Oak Forest 60452 Utility CCHHS Owned 1/1/1980 379
HH.046.063 OFH Generator Building E ‐ Old 15900 S. Cicero Ave. Oak Forest 60452 Utility CCHHS Owned 1/1/1980 389
HH.047.001 John H. Stroger Jr. Hospital 1901 W. Harrison St. Chicago 60612 Hospital CCHHS Owned 1/1/2002 1,217,341
HH.047.003 JHS Campus Power Plant 750 S. Winchester Ave. Chicago 60612 Utility CCHHS Owned 1/1/2002 54,251
HH.047.004 John H. Stroger Jr. Parking Structure 1800 W. Polk St. Chicago 60612 Parking CCHHS Owned 1/1/1998 423,000
HH.067.001 Fantus Health Center 621 S. Winchester Ave. Chicago 60612 Clinic CCHHS Owned 1/1/1959 205,793
HH.049.001 CCHHS Administration Building 1900 W. Polk St. Chicago 60612 Admin CCHHS Owned 1/1/1931 324,708
HH.048.001 Provident Hospital 500 E. 51st St. Chicago 60615 Hospital CCHHS Owned 1/1/1981 341,042
HH.048.002 Provident Outpatient Pharmacy 430 E. 50th Pl. Chicago 60615 Pharmacy CCHHS Owned 1/1/2005 6,577
HH.048.004 John Sengstacke Clinic (former) 450 E. 51st St. Chicago 60615 Vacant CCHHS Owned 1/1/1950 32,953
HH.048.005 Provident Hospital Parking Structure 5010 South Forestville Ave. Chicago 60615 Parking CCHHS Owned 1/1/1991 245,541

34 | P a g e
HEALTH & HOSPITAL (HH)
Property ID Property Name Address City Zip
Code
Primary Use
Dept./ Agency
Owned/ Leased
Year GSF
HH.050.001 Durand Building 639 W. Wood St. Chicago 60612 Vacant CCHHS Owned 1/1/1914 38,058
HH.051.001 Hektoen Building 627 W. Wood St. Chicago 60612 Admin/Lab CCHHS Owned 1/1/1964 146,477
HH.052.001 Rob't J. Stein Institute of Forensic Med 2121 W. Harrison St. Chicago 60612 Medical Admin Owned 1/1/1982 79,368
HH.054.001 Ruth M. Rothstein Core Center 2020 West Harrison St. Chicago 60612 Clinic CCHHS Owned 1/1/1998 31,550
HH.076.001 Old Main Hospital 1825 W. Harrison St. Chicago 60612 Vacant CCHHS Owned 1/1/1913 320,000
35 | P a g e
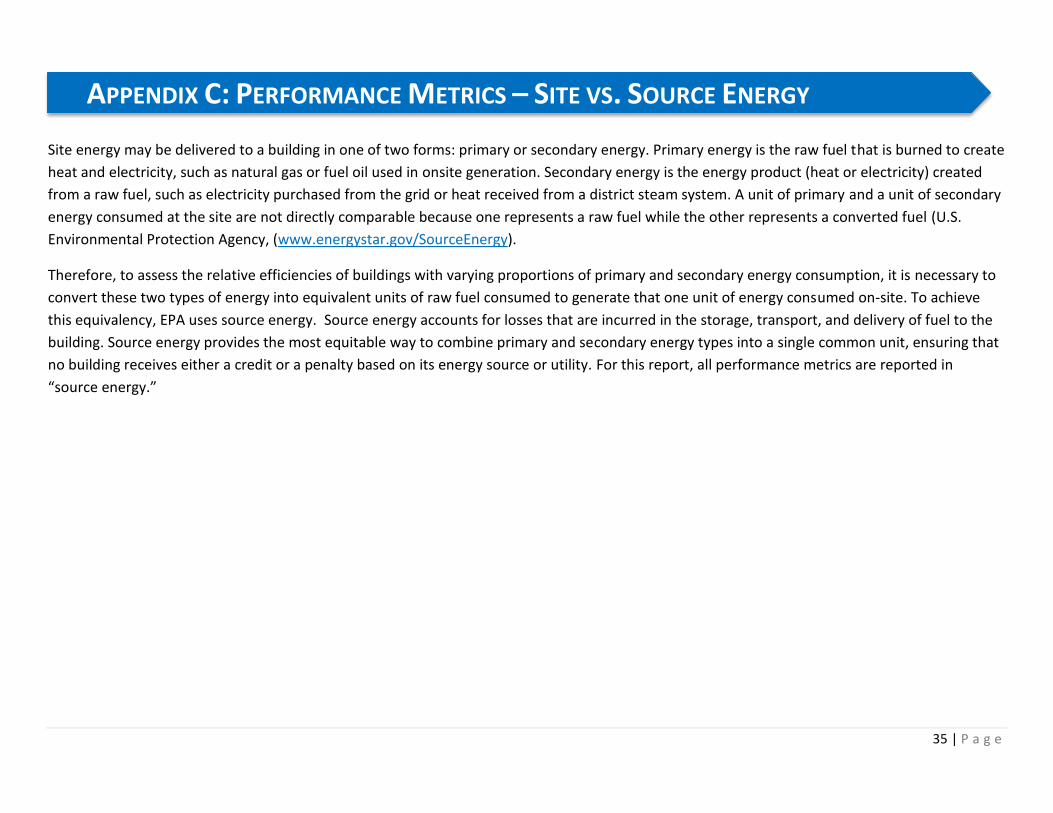
Site energy may be delivered to a building in one of two forms: primary or secondary energy. Primary energy is the raw fuel that is burned to create
heat and electricity, such as natural gas or fuel oil used in onsite generation. Secondary energy is the energy product (heat or electricity) created
from a raw fuel, such as electricity purchased from the grid or heat received from a district steam system. A unit of primary and a unit of secondary
energy consumed at the site are not directly comparable because one represents a raw fuel while the other represents a converted fuel (U.S.
Environmental Protection Agency, (www.energystar.gov/SourceEnergy).
Therefore, to assess the relative efficiencies of buildings with varying proportions of primary and secondary energy consumption, it is necessary to
convert these two types of energy into equivalent units of raw fuel consumed to generate that one unit of energy consumed on-site. To achieve
this equivalency, EPA uses source energy. Source energy accounts for losses that are incurred in the storage, transport, and delivery of fuel to the
building. Source energy provides the most equitable way to combine primary and secondary energy types into a single common unit, ensuring that
no building receives either a credit or a penalty based on its energy source or utility. For this report, all performance metrics are reported in
“source energy.”
APPENDIX C: PERFORMANCE METRICS – SITE VS. SOURCE ENERGY
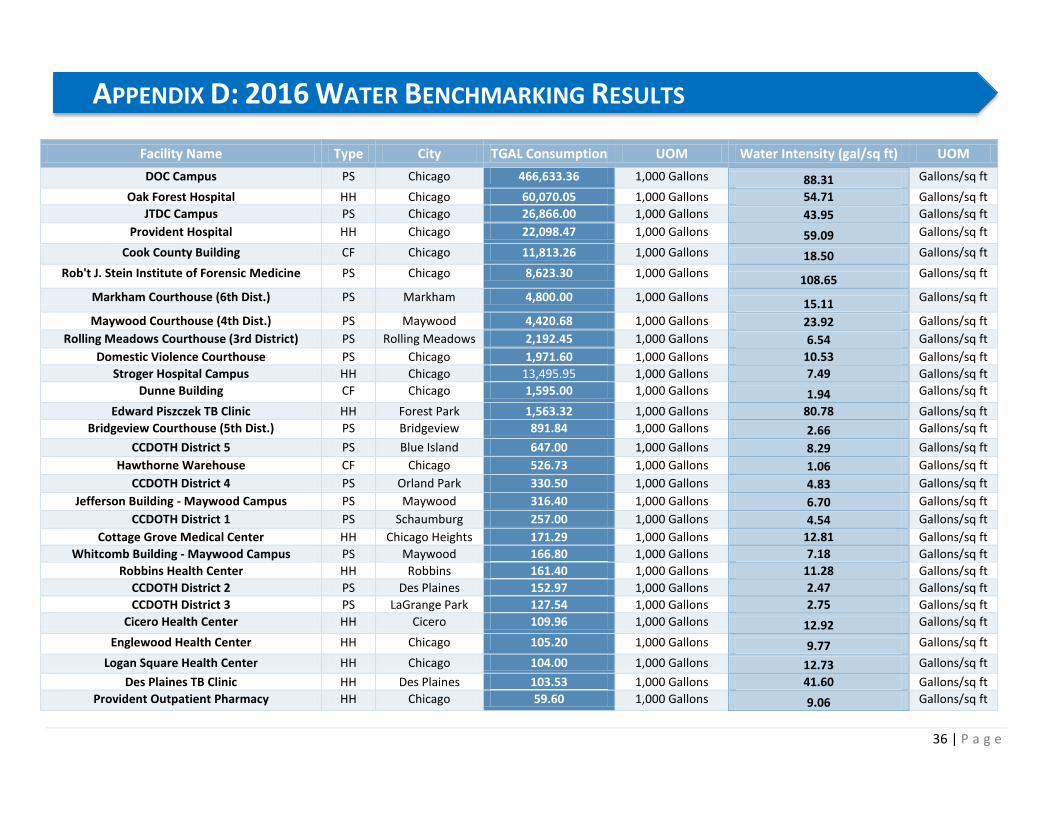
36 | P a g e
Facility Name Type City TGAL Consumption UOM Water Intensity (gal/sq ft) UOM
DOC Campus PS Chicago 466,633.36 1,000 Gallons 88.31 Gallons/sq ft
Oak Forest Hospital HH Chicago 60,070.05 1,000 Gallons 54.71 Gallons/sq ft
JTDC Campus PS Chicago 26,866.00 1,000 Gallons 43.95 Gallons/sq ft
Provident Hospital HH Chicago 22,098.47 1,000 Gallons 59.09 Gallons/sq ft
Cook County Building CF Chicago 11,813.26 1,000 Gallons 18.50 Gallons/sq ft
Rob't J. Stein Institute of Forensic Medicine PS Chicago 8,623.30 1,000 Gallons 108.65
Gallons/sq ft
Markham Courthouse (6th Dist.) PS Markham 4,800.00 1,000 Gallons 15.11
Gallons/sq ft
Maywood Courthouse (4th Dist.) PS Maywood 4,420.68 1,000 Gallons 23.92 Gallons/sq ft
Rolling Meadows Courthouse (3rd District) PS Rolling Meadows 2,192.45 1,000 Gallons 6.54 Gallons/sq ft
Domestic Violence Courthouse PS Chicago 1,971.60 1,000 Gallons 10.53 Gallons/sq ft
Stroger Hospital Campus HH Chicago 13,495.95 1,000 Gallons 7.49 Gallons/sq ft
Dunne Building CF Chicago 1,595.00 1,000 Gallons 1.94 Gallons/sq ft
Edward Piszczek TB Clinic HH Forest Park 1,563.32 1,000 Gallons 80.78 Gallons/sq ft
Bridgeview Courthouse (5th Dist.) PS Bridgeview 891.84 1,000 Gallons 2.66 Gallons/sq ft
CCDOTH District 5 PS Blue Island 647.00 1,000 Gallons 8.29 Gallons/sq ft
Hawthorne Warehouse CF Chicago 526.73 1,000 Gallons 1.06 Gallons/sq ft
CCDOTH District 4 PS Orland Park 330.50 1,000 Gallons 4.83 Gallons/sq ft
Jefferson Building - Maywood Campus PS Maywood 316.40 1,000 Gallons 6.70 Gallons/sq ft
CCDOTH District 1 PS Schaumburg 257.00 1,000 Gallons 4.54 Gallons/sq ft
Cottage Grove Medical Center HH Chicago Heights 171.29 1,000 Gallons 12.81 Gallons/sq ft
Whitcomb Building - Maywood Campus PS Maywood 166.80 1,000 Gallons 7.18 Gallons/sq ft
Robbins Health Center HH Robbins 161.40 1,000 Gallons 11.28 Gallons/sq ft
CCDOTH District 2 PS Des Plaines 152.97 1,000 Gallons 2.47 Gallons/sq ft
CCDOTH District 3 PS LaGrange Park 127.54 1,000 Gallons 2.75 Gallons/sq ft
Cicero Health Center HH Cicero 109.96 1,000 Gallons 12.92 Gallons/sq ft
Englewood Health Center HH Chicago 105.20 1,000 Gallons 9.77 Gallons/sq ft
Logan Square Health Center HH Chicago 104.00 1,000 Gallons 12.73 Gallons/sq ft
Des Plaines TB Clinic HH Des Plaines 103.53 1,000 Gallons 41.60 Gallons/sq ft
Provident Outpatient Pharmacy HH Chicago 59.60 1,000 Gallons 9.06 Gallons/sq ft
APPENDIX D: 2016 WATER BENCHMARKING RESULTS

37 | P a g e
Facility Name Type City TGAL Consumption UOM Water Intensity (gal/sq ft) UOM
Juvenile West (Courthouse) PS Chicago 44.30 1,000 Gallons 0.11 Gallons/sq ft
Skokie Courthouse (2nd District) PS Skokie 43.32 1,000 Gallons 0.13 Gallons/sq ft
Ruth M. Rothstein Core Center HH Chicago 32.27 1,000 Gallons 1.02 Gallons/sq ft
Provident Parking Structure PK Chicago 28.00 1,000 Gallons 0.11 Gallons/sq ft
Rockwell Warehouse CF Chicago 19.95 1,000 Gallons 0.04 Gallons/sq ft
Dr. Jorge Prieto Health Center HH Chicago 8.81 1,000 Gallons 0.52 Gallons/sq ft
Hektoen Building HH Chicago 1.47 1,000 Gallons 0.01 Gallons/sq ft
Harvey TB Clinic HH Harvey - 1,000 Gallons 0.00 Gallons/sq ft


