
2016 Retrospective
Office of Air Quality
Arkansas Department of Environmental
Quality
12/2/2016
State of the Air in Arkansas
i
Table of Contents
Introduction ................................................................................................................................................... 1
Air Quality Standards ................................................................................................................................... 2
National Ambient Air Quality Standards .................................................................................................. 3
Attainment Status ...................................................................................................................................... 4
Criteria Pollutants ..................................................................................................................................... 7
Ozone .................................................................................................................................................... 7
Particulate Matter ................................................................................................................................ 10
Carbon Monoxide ............................................................................................................................... 14
Nitrogen Dioxide ................................................................................................................................ 16
Sulfur Dioxide ..................................................................................................................................... 18
Lead..................................................................................................................................................... 20
The Impact of Air Quality Programs on Pollutant Emissions ..................................................................... 20
State and Federal Programs to Improve Air Quality ............................................................................... 20
Criteria Pollutant and Precursor Emissions Trends for Regulated Sources in Arkansas ........................ 21
Nitrogen Oxides .................................................................................................................................. 22
Volatile Organic Compounds.............................................................................................................. 23
Carbon Monoxide ............................................................................................................................... 24
Sulfur Dioxide ..................................................................................................................................... 25
Coarse Particulate Matter .................................................................................................................... 26
Primary Fine Particulate Matter .......................................................................................................... 27
Ammonia............................................................................................................................................. 28
Lead..................................................................................................................................................... 29
Carbon Dioxide Emission Trends ........................................................................................................... 30
Regional Haze ......................................................................................................................................... 32
Conclusion .................................................................................................................................................. 35
List of Tables
Table 1. National Ambient Air Quality Standards ........................................................................................ 3
Table 2. Arkansas Ambient Air Monitors ..................................................................................................... 6
Table 3. NEI Source Types ......................................................................................................................... 22

ii
List of Figures
Figure 1. Locations of Facilities with Active Minor or Title V Air Permits ................................................. 2
Figure 2. Counties Designated Nonattainment for National Ambient Air Quality Standards ...................... 5
Figure 3. Arkansas Ambient Air Monitoring Network ................................................................................. 6
Figure 4. Ozone Design Values at Arkansas Monitors (Pass/Fail) ............................................................... 9
Figure 5. Ozone Design Values at Arkansas Monitors (Degree of Deviation from the NAAQS) ............... 9
Figure 6. PM10 24-Hour Maximum by Year ............................................................................................... 12
Figure 7. PM2.5 Annual Design Values at Arkansas Monitors (Degree of Deviation from the NAAQS) ... 13
Figure 8. PM2.5 24-Hour Design Values at Arkansas Monitors (Degree of Deviation from the NAAQS) . 13
Figure 9. CO 8-Hour Maximum by Year .................................................................................................... 15
Figure 10. CO 1-Hour Maximum by Year .................................................................................................. 16
Figure 11. NO2 Annual Design Values ....................................................................................................... 17
Figure 12. NO2 1-HourDesign Values ........................................................................................................ 18
Figure 13. 1-Hour SO2 Design Values ........................................................................................................ 19
Figure 14. Comparison of Growth Areas and Emissions, 1980 – 2015 ...................................................... 21
Figure 15. Arkansas NOx Emissions by Regulated Category .................................................................... 23
Figure 16. Arkansas VOC Emissions by Regulated Category .................................................................... 24
Figure 17. Arkansas CO Emissions by Regulated Category ....................................................................... 25
Figure 18. Arkansas SO2 Emissions by Regulated Category ...................................................................... 26
Figure 19. Arkansas PM10 Emissions by Regulated Category .................................................................... 27
Figure 20. Arkansas Primary PM2.5 Emissions by Regulated Category ...................................................... 28
Figure 21. Arkansas NH3 Emissions by Regulated Category ..................................................................... 29
Figure 22. Arkansas Lead Emissions by Regulated Category .................................................................... 30
Figure 23. Arkansas Carbon Dioxide Emission Trends by Sector .............................................................. 31
Figure 24. Arkansas Carbon Dioxide Emission Trends by the Electricity Sector ...................................... 32
Figure 25. Reasonable Progress Assessment - Upper Buffalo Wilderness Area – 20 % Best Days .......... 33
Figure 26. Reasonable Progress Assessment - Upper Buffalo Wilderness Area – 20 % Worst Days ........ 34
Figure 27. Reasonable Progress Assessment - Caney Creek Wilderness Area – 20 % Best Days ............. 34
Figure 28. Reasonable Progress Assessment - Caney Creek Wilderness Area – 20 % Worst Days .......... 35
1
State of the Air in Arkansas
Introduction
The state of the air in Arkansas is excellent and continues to improve. All areas of
Arkansas are in attainment with the National Ambient Air Quality Standards (NAAQS)
promulgated by the United States Environmental Protection Agency (EPA). The NAAQS are
limits set to protect the public health and welfare. The Arkansas Department of Environmental
Quality (ADEQ) has the responsibility of developing and administering air quality programs to
ensure that all areas of the state are in attainment with the NAAQS. Emissions reductions have
been achieved through implementation of both state and federal programs. Arkansas is also on
target to meet or beat other Clean Air Act (CAA) goals, including visibility improvement in
national parks and reductions in carbon emissions.
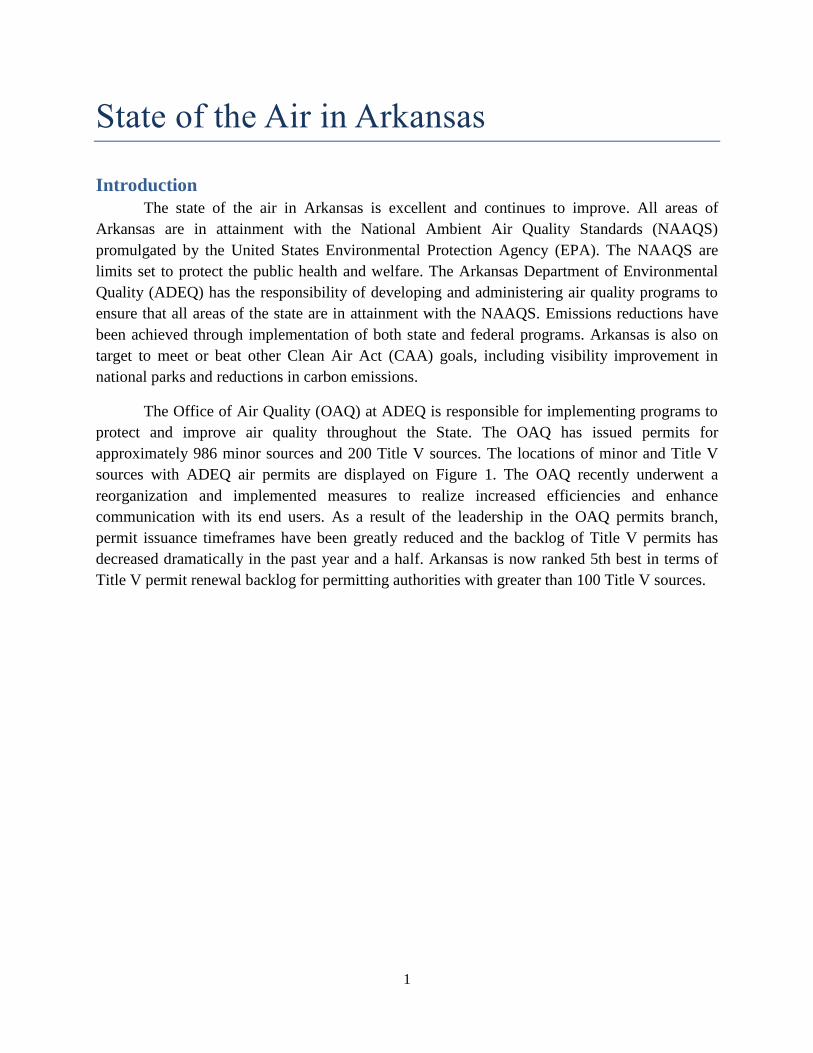
The Office of Air Quality (OAQ) at ADEQ is responsible for implementing programs to
protect and improve air quality throughout the State. The OAQ has issued permits for
approximately 986 minor sources and 200 Title V sources. The locations of minor and Title V
sources with ADEQ air permits are displayed on Figure 1. The OAQ recently underwent a
reorganization and implemented measures to realize increased efficiencies and enhance
communication with its end users. As a result of the leadership in the OAQ permits branch,
permit issuance timeframes have been greatly reduced and the backlog of Title V permits has
decreased dramatically in the past year and a half. Arkansas is now ranked 5th best in terms of
Title V permit renewal backlog for permitting authorities with greater than 100 Title V sources.
2
Figure 1. Locations of Facilities with Active Minor or Title V Air Permits
The OAQ also actively engages specific communities when there are local air quality
concerns. The OAQ has established special projects, including short-term monitoring for specific
pollutants in response to these concerns. The OAQ also investigates complaints from the public
pertaining to potential local air quality issues. Between October 1, 2015 and September 30, 2016,
inspectors performed 794 inspections, investigated 409 complaints, and reviewed 620 stack tests.
The OAQ compliance branch continues to excel at ensuring that regulated sources are meeting
their permit requirements. Compliance with state air regulations and state air permits ensures that
air quality in the state continues to attain and maintain the air quality standards.
This report focuses on trends in air quality and emissions over the past decade.1
Specifically, this report looks at trends in ambient air quality with respect to criteria pollutants
and visibility in national parks. This report also examines trends in emissions of criteria
pollutants and their precursors, as well as carbon dioxide. These recent trends are illustrative of
the improvements in air quality seen in Arkansas that have resulted in attainment of CAA goals.
1 ADEQ has monitored for certain criteria pollutants for more than thirty years.

3
Air Quality Standards
National Ambient Air Quality Standards
The CAA requires that EPA set NAAQS for pollutants that are common to outdoor air
and are considered harmful to public health and the environment. These pollutants, which are
referred to as “criteria pollutants,” include ozone, particulate matter, carbon monoxide (CO),
lead, sulfur dioxide (SO2), and nitrogen dioxide (NO2). The EPA administrator, in consultation
with the Clean Air Scientific Advisory Committee, sets primary and secondary NAAQS to
protect public health and the environment for each criteria pollutant. The primary NAAQS is set
at a level that reduces the risk of harm so as to protect public health, including sensitive
populations, with an adequate margin of safety.2 The secondary NAAQS is set at a level that is
protective of the public welfare, including protection against decreased visibility and damage to
animals, crops, vegetation, and buildings. Secondary standards are typically equal to the primary
standard or less stringent than the primary standard. The current NAAQS are listed in Table 1.
Table 1. National Ambient Air Quality Standards
Pollutant Primary /
Secondary
Averaging
Time
Level Form
Carbon
Monoxide
Primary 8-hour 9 ppm Not to be exceeded more than once per year
1-hour 35 ppm
Lead Primary and
secondary
Rolling 3-
month
average
0.15 μg/m3 Not to be exceeded
Nitrogen
Dioxide
Primary 1-hour 100 ppb
98th percentile, averaged over 3 years
Primary and
secondary
Annual 53 ppb Annual mean
Ozone Primary and
secondary
8-hour 0.070 ppm Annual fourth-highest daily maximum 8-hr
concentration, averaged over 3 years
Particle
Pollution,
PM2.5
Primary Annual 12 μg/m3 Annual mean, averaged over 3 years
Secondary Annual 15 μg/m3
Primary and
secondary
24-hour 35 μg/m3 98th percentile, averaged over 3 years
Particle
Pollution,
PM10
Primary and
secondary
24-hour 150 μg/m3 Not to be exceeded more than once per year on
average over 3 years
Sulfur
Dioxide
Primary 1-hour 75 ppb 99th percentile of 1-hour daily maximum
concentrations, averaged over 3 years
Secondary 3-hour 0.5 ppm Not to be exceeded more than once per year
2 CAA §109

4
The NAAQS are reviewed every five years to determine whether recent scientific data
continue to indicate that the level, form, and averaging time of the current NAAQS are protective
of public health.3 If the data show that the current level of the NAAQS is not protective of public
health with an adequate margin of safety, the EPA must revise the standard and states must
develop implementation plans to ensure that all areas of the state attain and maintain the revised
NAAQS.4 Areas in which the NAAQS for a particular criteria pollutant is not being met are
designated as nonattainment and require additional planning efforts to improve air quality.5
Nonattainment designation recommendations are made by the Governor and promulgated by
EPA. EPA classifies nonattainment areas as marginal, moderate, serious, severe, or extreme,
based on the severity of the air pollution and the availability and feasibility of pollution control
measures. For each nonattainment area, the affected states must develop plans to reduce pollutant
levels in the air to achieve attainment with the NAAQS as expeditiously as possible.
Attainment Status
All counties in Arkansas are in attainment with the NAAQS for all criteria pollutants.
Crittenden County, which is located in the Memphis metropolitan area, had previously been
designated a marginal nonattainment area for the 1997 ozone standard and the 2008 ozone
standard. Based on monitored improvements in air quality between 2012 and 2014, EPA
redesignated the county to attainment, effective May 25, 2016. All counties in Arkansas are
anticipated to continue to attain all NAAQS, including the recently promulgated 2015 ozone
NAAQS set at 70 parts per billion (ppb). On September 29, 2016, Governor Asa Hutchinson
submitted a letter to EPA Region 6 recommending that all counties in Arkansas be designated
attainment or attainment/unclassifiable (for counties that do not have a monitor) based on 2013 –
2015 data. Figure 2 is a map of counties designated nonattainment with one or more NAAQS.
3 CAA §109
4 CAA §110
5 CAA Title I Part D

5
Figure 2. Counties Designated Nonattainment for National Ambient Air Quality Standards
Attainment status is determined based on air quality measurements by ambient air monitoring
networks. A design value is computed for each monitor location based on time-weighted
averages of the criteria pollutant in ambient air and the form of the NAAQS. Design values are
compared with the level of the NAAQS to determine whether the standard is exceeded and if so,
by how much. If multiple monitors are collocated in an area, the monitor with the highest design
value controls attainment status. When EPA promulgates a new NAAQS, states must evaluate
monitoring data to determine whether to recommend an attainment or a nonattainment status to
EPA.
Ambient air monitoring networks are established according to federal requirements based on
total population in a metropolitan statistical area (MSA). Within an MSA, several factors are
used to determine the location of the monitoring sites:
1. Where the highest concentration is expected to occur in the area covered by the monitor
(usually determined through modelling);
2. What the expected representative concentrations are in areas of high population density;

6
3. What impacts on ambient pollution levels significant sources or source categories may
have; and
4. What the background concentration levels are.
Locations of monitors in the current Arkansas Ambient Air Monitoring Network are listed in
Table 2 and depicted in Figure 3.
Figure 3. Arkansas Ambient Air Monitoring Network
Table 2. Arkansas Ambient Air Monitors
Pollutant Number of Monitors Locations
Ozone 8
Clark County
Crittenden County
Newton County
Polk County
Pulaski County
Washington County
Particulate Pollution (PM10) 2 Pulaski County
Particulate Pollution (PM2.5) 14
Arkansas County
Ashley County
Crittenden County
Garland County
Jackson County
Polk County
Pulaski County
Union County
Washington County
Sequoyah County (Oklahoma)

7
Pollutant Number of Monitors Locations
Carbon Monoxide 1 Pulaski County
Nitrogen Dioxide 2 Crittenden County
Pulaski County
Sulfur Dioxide 2 Pulaski County
Union County
Lead 1 Pulaski County
Per federal requirements, Arkansas’s air monitors are strategically located throughout the
state to ensure that data from the monitors provide high-quality information so that ADEQ can
confirm that air quality programs in the state are adequately protecting public health and that
environmental goals are being achieved. ADEQ reviews the Arkansas Ambient Air Monitoring
Network each year to detail the exact expected operation schedule for each monitor for the
coming calendar year. The most recent annual network review was submitted to EPA on July 13,
2016. The network is evaluated every five years to determine whether the current number and
location of monitors meets ADEQ’s environmental monitoring objectives and satisfies federal
monitoring requirements for each pollutant. The Five-Year Network Assessment is a robust
analysis that includes meteorological analysis, probability analysis, correlation analysis, and
historical trends. The Five-Year Network Assessment also outlines possible and expected
changes to the network that may occur within the next five years based on changes in the
regulations or projections of population growth. The most recent Five-Year Network Assessment
was submitted to EPA on October 12, 2015. EPA acknowledged on July 22, 2016 that the
monitoring plan detailed in the Five-Year Network Assessment was adequate to meet federal
requirements.
Criteria Pollutants
Ozone
All areas of the state have ozone design values below the level of the current NAAQS for
ozone (70 ppb). Crittenden County was designated a marginal nonattainment area for the 1997
ozone standard and the 2008 ozone standard, but ultimately reattained each standard through
continued improvements in air quality. Over the past ten years, concentrations of ozone have
dropped in Crittenden County and across the state because of federal and State air quality
programs to reduce emissions of precursor pollutants, particularly NOx.
Ozone is a reactive molecule composed of three atoms of oxygen. In the upper
atmosphere, ozone is beneficial and protects the earth from harmful ultraviolet rays. At ground
level, ozone is unhealthy to breathe and can trigger various respiratory and cardiovascular health
problems. Ozone is ubiquitous in the natural environment and is formed by photochemical
reactions involving nitrogen oxides (NOx), volatile organic compounds (VOCs), and sunlight.
VOCs can be emitted from both biogenic and anthropogenic sources. In Arkansas, approximately
81% of VOC emissions come from biogenic sources, particularly trees, and only 10% of

8
emissions come from sources regulated by State and federal air quality programs.6 NOx is
formed primarily by combustion of fossil fuels. The formation of ozone is highly weather
dependent, and ozone can be transported long distances by wind.
In setting the level of the ozone NAAQS, EPA considers various clinical and
epidemiological studies to evaluate what level, averaging time, and form of the standard would
be protective of human health and public welfare. The primary NAAQS is set to reduce the risk
of acute and chronic health effects due to exposure to ozone. EPA also develops an air quality
index (AQI) to communicate with the public on days when ozone concentrations are likely to be
elevated so that the public can consider taking actions to limit their exposure. Although EPA
uses the AQI as a communication tool, EPA actually evaluates air quality with respect to ozone-
based measurements from ambient air monitors.
Over the last 10-year period, EPA has increased the stringency of the 8-hour ozone
NAAQS twice from 0.08 parts per million (ppm) in 1997 to 0.075 ppm in 2008 then to 0.070
ppm in 2015. Although the level of the ozone NAAQS changed, the form and averaging time
remained the annual fourth-highest daily maximum 8-hour concentration, averaged over 3 years.
Figure 4 shows the trends compared to the standard on a pass/fail basis.7 Figure 5 illustrates the
degree by which design values at each monitor fall above or below the level of the ozone
NAAQS in effect during the period over which design values were calculated.
6 Source: 2011 National Emissions Inventory version 2
7 For both Figures 3 and 4, all design values shown are rounded to the nearest 1000
th of a ppm; however, those
design values for year ranges prior to 2008 would be rounded to the nearest 100th
of a ppm for comparison with the
1997 ozone NAAQS for the purposes of determining attainment per EPA requirements. Design values for the 2008
and 2015 ozone NAAQS must be reported to the nearest 1000th
of a ppm. For example, a design value of 0.083 ppm
would be rounded down to 0.08 ppm when considering whether the 1997 ozone NAAQS of 0.08 ppm is met, but a
design value of 0.073 ppm would not be rounded down when considering whether the 2015 ozone NAAQS of 0.070
ppm is met. Thus, an area with a 0.083 ppm design value would be considered to meet the 1997 ozone NAAQS, but
an area with a 0.073 ppm design value would be considered to exceed the level of the 2015 ozone NAAQS.

9
Figure 4. Ozone Design Values at Arkansas Monitors (Pass/Fail)
Figure 5. Ozone Design Values at Arkansas Monitors (Degree of Deviation from the
NAAQS)
As indicated by Figures 4 and 5 above, ozone concentrations have shown a decline over
the past ten years. Both Pulaski County and Crittenden County have experienced brief periods
during which the level of the ozone NAAQS was exceeded. These exceedances were very small,
0.050
0.055
0.060
0.065
0.070
0.075
0.080
0.085
0.090
0.095
0.100
05-07 06-08 07-09 08-10 09-11 10-12 11-13 12-14 13-15
Des
ign
Va
lue
(pp
m)
Years
Fail
Pass
Clark
Crittenden
Newton
Polk
Pulaski
Washington
0.050
0.055
0.060
0.065
0.070
0.075
0.080
0.085
0.090
0.095
0.100
05-07 06-08 07-09 08-10 09-11 10-12 11-13 12-14 13-15
Des
ign
Va
lue
(pp
m)
DV Year Range
>10% Above
<10% Above
<10% Below
<20% Below
>20% Below
Clark
Crittenden
Newton
Polk
Pulaski
Washington

10
less than 10% above the level of the NAAQS. Although the design value for Pulaski County was
above the level of the 2008 ozone NAAQS during the 2006 – 2008 averaging period, the design
value dropped below the standard for the 2007 – 2009 averaging period, and a nonattainment
designation was avoided. Crittenden County was designated as a marginal nonattainment area for
both the 1997 ozone standard and the 2008 standard. Crittenden County was redesignated to
attainment for the 1997 ozone standard in 2010 and redesignated for the 2008 ozone standard in
2016.
All counties in Arkansas are on track to attain the 2015 ozone NAAQS. Approximately
713,485 Arkansans live in areas monitored for ozone.8 The latest design values from 2015
indicate that 46.4% of Arkansas’s population living in monitored areas reside in areas within
10% of the 2015 ozone NAAQS. The remaining 53.6% of Arkansas’s population living in
monitored areas reside in areas where design values are more than 10% lower than the 2015
ozone NAAQS.9 An additional 2,254,180 Arkansans live in rural unmonitored areas where
ozone concentrations are likely to be even lower.10
The 2016 three-year average fourth high
values are on track to be even lower than 2015 design values for Pulaski County, Northwest
Arkansas, Clark County, Newton County, and Polk County. The 2016 three-year average fourth
high value for Crittenden County is on track to be slightly higher than the 2015 design value, but
under the 70 ppb level of the 2015 ozone NAAQS. Design values will not be calculated for 2016
until the ozone season ends and all ozone season data have been certified. On September 29,
2016, Governor Asa Hutchinson submitted a letter to EPA Region 6 recommending that all
counties in Arkansas be designated attainment or attainment/unclassifiable (for counties that do
not have a monitor) based on 2013 – 2015 data.
Particulate Matter
All areas of the state are in attainment with the current NAAQS for particulate matter.
There are two size fractions of particulate matter for which EPA sets NAAQS: particles less than
10 microns in diameter (PM10 or “coarse particulate matter”) and particles less than 2.5 microns
in diameter (PM2.5 or “fine particulate matter”). PM10 levels have seen little change over the past
ten years, and design values have stayed well below the level of the PM10 NAAQS.
Concentrations of PM2.5 have declined over the past ten years.
PM10 particles are small enough to enter the respiratory tract once inhaled. Inhalation of
PM10 can increase the frequency and severity of asthma attacks, cause or aggravate bronchitis
and other lung diseases, and reduce the body’s ability to fight infections. Certain populations
may be more sensitive to the effects of particulate pollution than others. These include children,
the elderly, exercising adults, and those with pre-existing lung disease.
8 Source: U.S. Census Bureau 2015 estimated population
9 Id.
10 Id.

11
PM2.5 particles are microscopic solids and liquid droplets that are small enough to
penetrate deep into the lungs when inhaled. Numerous scientific studies have linked PM2.5
exposure to a number of adverse health effects. These effects include the following: premature
death in people with heart or lung disease; nonfatal heart attacks; irregular heartbeat; aggravated
asthma; decreased lung function; and increased respiratory symptoms, such as irritation of
airways, coughing, and difficulty breathing.
PM10 and PM2.5 fractions of particulate matter have different physical characteristics and
are emitted by different sources. PM10 particles originate from a variety of mobile and stationary
sources, and their chemical composition varies widely. Some of the actions that generate PM10
particles include grinding or crushing operations, mineral processing, agricultural operations,
fuel combustion, and fires. PM2.5 is emitted directly from diesel engines, smelters, and other
combustion sources. PM2.5 can also form in the atmosphere because of complex reactions of
precursor compounds, such as oxides of sulfur (SOx) and NOx. PM2.5 may be composed of
sulfate, nitrate, ammonium, and/or hydrogen ions. It may also contain elemental carbon, metal
compounds, organic compounds, and particle-bound water.
The nature of PM2.5 is such that it may stay suspended in the atmosphere for long periods
of time and may be transported hundreds of miles. PM10 particles generally do not stay
suspended in the atmosphere as long or travel as far as PM2.5 particles do. PM10 particles often
settle out in areas relatively near their sources. The vast majority of PM10 emissions in Arkansas
can be attributed to dust, agricultural activities, and fires. Much smaller contributions come from
industrial processes, mobile sources, fuel combustion, solvents, and other miscellaneous sources.
The majority of PM2.5 emissions in Arkansas can be attributed to fires, agricultural activities, and
dust. Much smaller contributions are made by mobile sources, industrial processes,
miscellaneous sources, fuel combustion, and solvents. It is very difficult to tie secondary PM2.5
in the atmosphere to specific sources.
In setting the level of the NAAQS for particulate matter, EPA considers various clinical
and epidemiological studies to evaluate what level, averaging time, and form of the standard
would be protective of human health and public welfare. The primary NAAQS is set to reduce
the risk of acute and chronic health effects due to exposure to particulate matter. EPA has
established a 24-hour primary PM10 NAAQS of 150 micrograms per cubic meter (µg/m3), which
is not to be exceeded more than once per year on average over three years. EPA has also
established a primary and secondary 24-hour PM2.5 NAAQS of 35 µg/m3, based on the annual
mean averaged over three years, and a primary annual PM2.5 NAAQS of 12 µg/m3, based on the
98th
percentile averaged over three years. For the PM2.5 fraction of particulate matter, EPA has
also developed an AQI to communicate with the public on days when PM2.5 concentrations are
likely to be elevated so that the public can consider taking actions to limit their exposure.
Although EPA uses the AQI as a communication tool, EPA actually evaluates air quality with
respect to PM2.5 based on measurements from ambient air monitors.

12
There are two PM10 monitors in Arkansas, both of which are located in Pulaski County.
PM2.5 monitors are located throughout the state. Figure 6 shows the maximum 24-hour time-
weighted average for PM10 at Arkansas monitors. No design values are calculated for PM10.
Attainment is determined based on whether the level of the standard is exceeded more than once
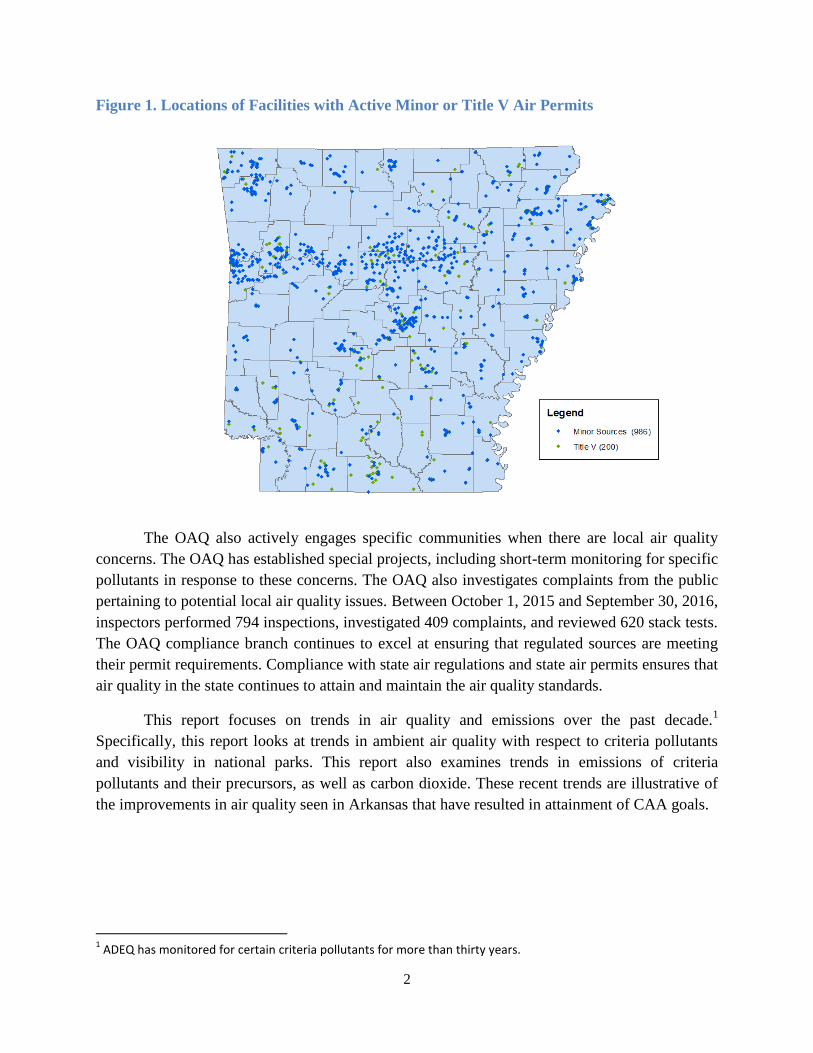
a year averaged over three years. Figures 7 and 8 illustrate the degree by which design values at
each monitor fall above or below the level of the annual PM2.5 NAAQS and the 24-hour PM2.5
NAAQS, respectively. The primary annual PM2.5 NAAQS decreased from 15 µg/m3
to 12 µg/m3
in 2012. This change is indicated in Figure 7 during the 2011 – 2013 design value years.
Figure 6. PM10 24-Hour Maximum by Year
0
20
40
60
80
100
120
140
160
180
2007 2008 2009 2010 2011 2012 2013 2014 2015
24
-ho
ur
Ma
xim
um
(µ
g/m
3)
Year
>NAAQS
<NAAQS
PARR
VA Hospital
13
Figure 7. PM2.5 Annual Design Values at Arkansas Monitors (Degree of Deviation from the
NAAQS)
Figure 8. PM2.5 24-Hour Design Values at Arkansas Monitors (Degree of Deviation from
the NAAQS)
As indicated in Figure 6, the maximum 24-hour PM10 time-weighted average
concentration has increased slightly over the past ten years. However, the maximum annual
8.0
9.0
10.0
11.0
12.0
13.0
14.0
15.0
16.0
17.0
18.0
05-07 06-08 07-09 08-10 09-11 10-12 11-13 12-14 13-15
Des
ign
Va
lue
DV Year Range
>10% Above<10% Above<10% Below>10% Below>20% BelowArkansasAshleyCrittendenFaulknerGarlandJacksonMississippiPhillipsPolkPopePARRBond StADEQ/DSRSebastianUnionWashingtonWhite
0.0
10.0
20.0
30.0
40.0
50.0
60.0
70.0
80.0
05-07 06-08 07-09 08-10 09-11 10-12 11-13 12-14 13-15
De
sign
Val
ue
DV Year Range
>10%
Above<10%
Above<10%
Below>10%
Below>20%
BelowArkansas
Ashley
Crittenden
Faulkner
Garland
Jackson

14
value has remained far below the level of the PM10 NAAQS. The highest maximum 24-hour
PM10 concentration during the period displayed in Figure 5 was 68 µg/m3
and occurred in 2015.
This value is less than half the level of the PM10 NAAQS (150 µg/m3). Figures 7 and 8 display
the decreasing trend in PM2.5 design values over the past ten years. Design values for the primary
annual PM2.5 NAAQS were below the level of the concurrent NAAQS during the entire ten year
period. Design values for the primary 24-hour PM2.5 NAAQS were at or below the level of the
NAAQS during the entire 10-year period.
Approximately 859,776 Arkansans live in areas with particulate monitors that provide
data for the purposes of determining attainment with the annual PM2.5 NAAQS, and 877,275
Arkansans live in locations monitored for the 24-hour PM2.5 NAAQS.11
The latest design values
from 2015 indicate that 45.6% of Arkansans living in monitored locations reside in areas with
design values 10 – 20% lower than the annual PM2.5 NAAQS, and the remaining 54.4% live in
areas where design values are more than 20% lower than the annual PM2.5 NAAQS.12
Design
values from 2015 for the 24-hour PM2.5 NAAQS indicate that all Arkansans living in monitored
locations live in areas where design values are more than 20% lower than the 24-hour PM2.5
NAAQS.13
Approximately 2.1 million Arkansans live in rural unmonitored locations.14
Carbon Monoxide
Arkansas is in attainment with the CO NAAQS. Over the past ten years, CO design
values have declined by more than 50%. CO design values in Arkansas remained well below the
level of the 1-hour and 8-hour CO NAAQS throughout the ten-year period.
CO is a colorless, odorless gas emitted from combustion processes. CO is primarily a
byproduct of incomplete combustion of fuels such as gasoline, natural gas, oil, coal, and wood.
CO emissions in Arkansas come primarily from fires, mobile sources, and biogenics.15
Smaller
contributions come from industrial processes, fuel combustion, solvents, and other miscellaneous
sources.
CO can cause harmful health effects by reducing oxygen delivery to the body's organs
(like the heart and brain) and other tissues. At extremely high levels, CO can cause death.
Exposure to CO can reduce the oxygen-carrying capacity of the blood. People with several types
of heart disease already have a reduced capacity for pumping oxygenated blood to the heart,
which can cause them to experience myocardial ischemia (reduced oxygen to the heart), often
accompanied by chest pain (angina), when exercising or under increased stress. For these people,
short-term CO exposure further affects their body’s already compromised ability to respond to
the increased oxygen demands of exercise or exertion. Based on the acute effects of CO, EPA set
11
Source: U.S. Census Bureau 2015 estimated population 12
Id. 13
Id. 14
Id. 15
Source: 2014 National Emissions Inventory version 1

15
a 1-hour NAAQS of 35 parts per million (ppm) and an 8-hour NAAQS of 9 ppm. For both
standards, these levels are not to be exceeded more than once per year.
Arkansas’s CO monitor is located in Pulaski County. Figure 9 shows the maximum 8-
hour time-weighted average for CO at Arkansas monitors. Figure 10 shows the maximum 1-hour
average for CO at Arkansas monitors. The 8-hour and 1-hour maximum CO time-weighted
average concentrations have decreased over the past 10 years. Both the 8-hour maximum and the
1-hour maximum have remained well below the level of the 8-hour and 1-hour CO NAAQS
during the past 10 years. In 2015, the 8-hour maximum was only 11% of the level of the 8-hour
CO NAAQS, and the 1-hour maximum was only 3% of the level of the 1-hour CO NAAQS.
Figure 9. CO 8-Hour Maximum by Year
0
1
2
3
4
5
6
7
8
9
10
2007 2008 2009 2010 2011 2012 2013 2014 2015
8-h
ou
r M
axim
um
(p
pm
)
Year
>NAAQS
<NAAQS
Pulaski

16
Figure 10. CO 1-Hour Maximum by Year
Nitrogen Dioxide
Arkansas is in attainment with the NO2 NAAQS. Over the past 10 years, NO2 design
values in Crittenden County have declined because of measures to reduce ozone concentrations
in the area. NO2 design values in Pulaski County have also seen a small decline over the past 10
years. All NO2 design values over the past decade have been well below the level of the
NAAQS.
NO2 is one of a group of highly reactive gases known as “oxides of nitrogen,” “nitrogen
oxides,” or NOx. Other nitrogen oxides include nitrous acid and nitric acid. EPA’s NAAQS uses
NO2 as the indicator for the larger group of NOx. NOx forms quickly from emissions from cars,
trucks, buses, power plants, and off-road equipment. NOx may be transported for long distances
and may react with other pollutants or water vapor to form secondary pollutants. NOx emissions
in Arkansas result primarily from mobile sources and fuel combustion.16
Smaller sources include
biogenics, industrial processes, fires, solvents and other miscellaneous sources.
Exposure to NOx occurs through inhalation. Scientific studies link short-term
NOx exposures, ranging from 30 minutes to 24 hours, with adverse respiratory effects including
airway inflammation in healthy people and increased respiratory symptoms in people with
asthma. Also, studies show a connection between breathing elevated short-term
NOx concentrations and increased visits to emergency departments and hospital admissions for
respiratory issues. This is especially true for people with asthma. The primary NO2 NAAQS is
16
Source: 2014 National Emissions Inventory version 1
0
5
10
15
20
25
30
35
40
2007 2008 2009 2010 2011 2012 2013 2014 2015
1-h
ou
r M
axim
um
(p
pm
)
Year
>NAAQS
<NAAQS
Pulaski
17
set to reduce the risk of acute and chronic health effects due to exposure to NOx. EPA has
established a 1-hour NO2 NAAQS of 100 ppb, based on the 98th
percentile averaged over three
years, and an annual NO2 NAAQS of 53 ppb, which is based on the annual mean.
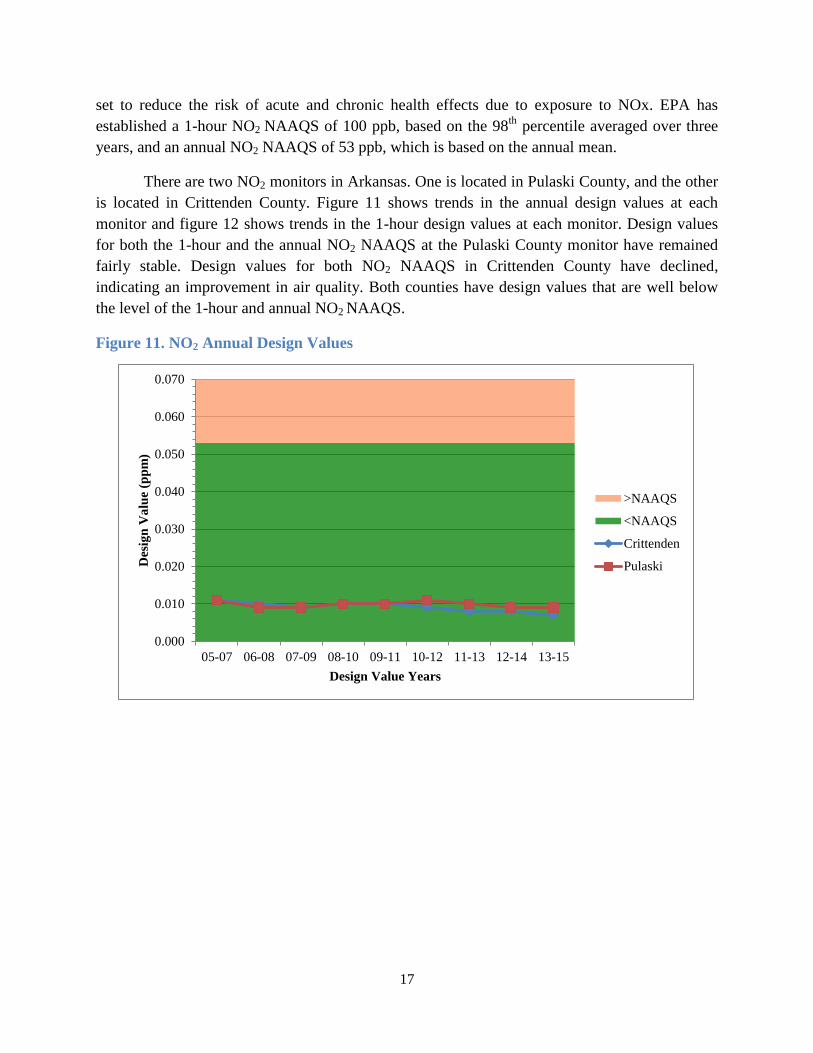
There are two NO2 monitors in Arkansas. One is located in Pulaski County, and the other
is located in Crittenden County. Figure 11 shows trends in the annual design values at each
monitor and figure 12 shows trends in the 1-hour design values at each monitor. Design values
for both the 1-hour and the annual NO2 NAAQS at the Pulaski County monitor have remained
fairly stable. Design values for both NO2 NAAQS in Crittenden County have declined,
indicating an improvement in air quality. Both counties have design values that are well below
the level of the 1-hour and annual NO2 NAAQS.
Figure 11. NO2 Annual Design Values
0.000
0.010
0.020
0.030
0.040
0.050
0.060
0.070
05-07 06-08 07-09 08-10 09-11 10-12 11-13 12-14 13-15
Des
ign
Va
lue
(pp
m)
Design Value Years
>NAAQS
<NAAQS
Crittenden
Pulaski

18
Figure 12. NO2 1-HourDesign Values
Sulfur Dioxide
All areas in Arkansas are in attainment with the SO2 NAAQS based on monitoring data.
Because of the typical dispersion pattern of SO2, EPA is also requiring that certain facilities
perform modeling or install their own monitors to demonstrate attainment with the 1-hour SO2
NAAQS. Arkansas has characterized air quality using dispersion modeling in areas in which
large sources of SO2 are located if those areas do not have a nearby ambient air quality monitor
located to identify maximum 1-hour SO2 concentrations. There are two such areas in Arkansas:
Jefferson County and Independence County. These areas are home to White Bluff Steam Electric
Station and Independence Steam Electric Station, respectively.
On September 11, 2015, Governor Asa Hutchinson submitted a letter to EPA Region 6
recommending that Independence County and Jefferson County be designated
unclassifiable/attainment based on dispersion modeling analyses reviewed by ADEQ. On July
12, 2016, EPA acted on Arkansas’s designation recommendations by affirming the
unclassifiable/attainment designation for Jefferson County and designating Independence County
as unclassifiable. Because EPA designated Independence County as unclassifiable, ADEQ is
developing additional analyses to support its unclassifiable/attainment designation
recommendation for Independence County. As part of this analysis, ADEQ will incorporate both
Independence Steam Electric Station and a smaller SO2 source, Future Fuel Chemical Company,
into the modeling demonstration for Independence County.
SO2 is one of a group of highly reactive gases known as “oxides of sulfur.” The largest
sources of SO2 emissions are from fossil fuel combustion at power plants and other industrial
0
20
40
60
80
100
120
05-07 06-08 07-09 08-10 09-11 10-12 11-13 12-14 13-15
Des
ign
Va
lue
(pp
b)
Design Value Years
>NAAQS
<NAAQS
Crittenden
Pulaski
19
facilities. Smaller sources of SO2 emissions include industrial processes, such as extracting metal
from ore, and the burning of high sulfur-containing fuels by locomotives, large ships, and
nonroad equipment. While SO2 tends not to be transported long distances in its original form, it
does react with other pollutants and water vapor to form fine particulates and acidic aerosols that
may be transported long distances. It also contributes to acid rain. SO2 emissions in Arkansas
result primarily from fuel combustion, with much smaller contributions from fires, industrial
processes, mobile sources, solvents and other miscellaneous sources.17
Current scientific evidence links short-term exposures to SO2, ranging from five minutes
to 24 hours, with an array of adverse respiratory effects, including bronchoconstriction and
increased asthma symptoms. These effects are particularly important for asthmatics at elevated
ventilation rates (e.g., while exercising or playing). The primary NAAQS is set to reduce the risk
of acute and chronic health effects due to exposure to SO2. EPA has established a primary SO2
NAAQS of 75 ppb, based on the 99th percentile of 1-hour daily maximum concentrations
averaged over 3 years.
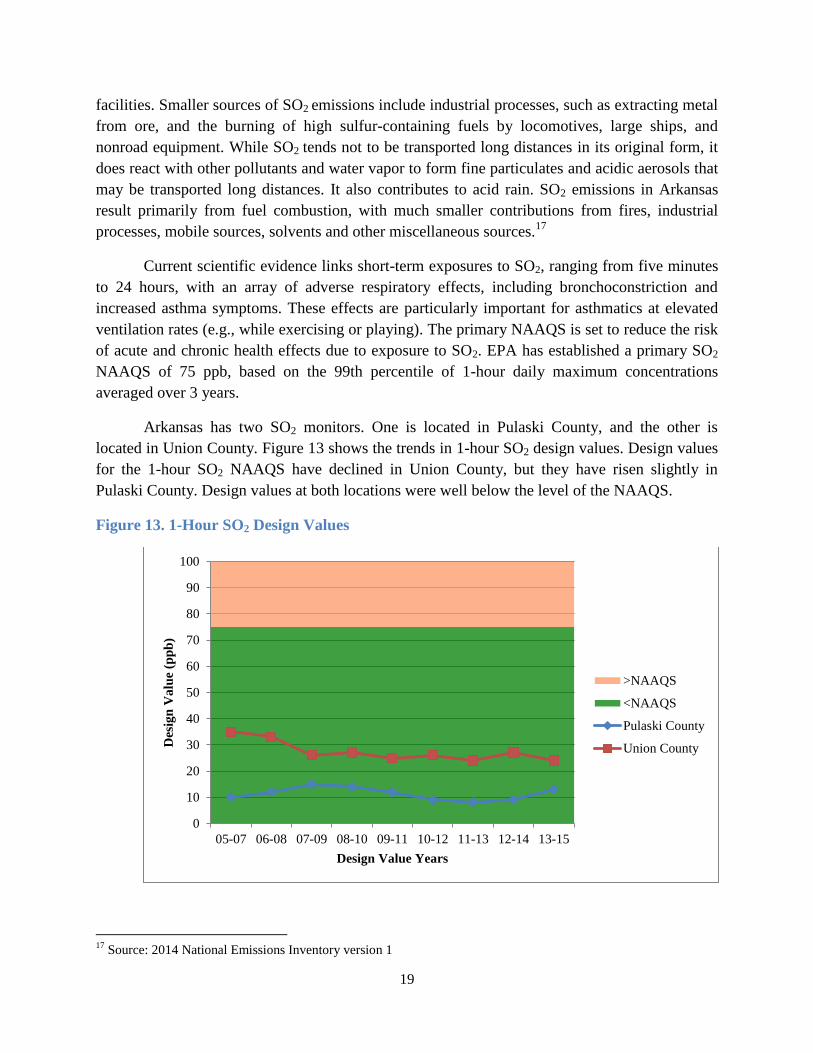
Arkansas has two SO2 monitors. One is located in Pulaski County, and the other is
located in Union County. Figure 13 shows the trends in 1-hour SO2 design values. Design values
for the 1-hour SO2 NAAQS have declined in Union County, but they have risen slightly in
Pulaski County. Design values at both locations were well below the level of the NAAQS.
Figure 13. 1-Hour SO2 Design Values
17
Source: 2014 National Emissions Inventory version 1
0
10
20
30
40
50
60
70
80
90
100
05-07 06-08 07-09 08-10 09-11 10-12 11-13 12-14 13-15
Des
ign
Va
lue
(pp
b)
Design Value Years
>NAAQS
<NAAQS
Pulaski County
Union County

20
Lead
Lead is a naturally occurring element that can be found in the air, water, and soil.
Although small levels of lead are naturally occurring in soil, lead is also emitted into the air
during ore and metals processing and combustion of fuels containing lead. In Arkansas, 66% of
lead emissions come from aircraft running on leaded fuel.18
The remaining 34% of lead
emissions primarily come from the industrial and electricity sectors. Lead emitted into the air can
settle onto surfaces like soil, dust and water where it can remain for long periods because it does
not decay or decompose.
Exposures to lead over a long period of time can cause deleterious effects on the central
nervous system. Lead exposure is particularly harmful to children because exposure may lead to
neurodevelopmental impairment resulting in lowered intelligence quotients (IQ) and behavioral
problems. According to the Centers for Disease Control, harmful effects may also result from
short-term exposures to very high levels of lead. EPA has set the primary NAAQS at the level of
0.15 µg/m3, based on a rolling three month average.
The NAAQS is set at this level to reduce the
risk of long-term health effects due to exposure to lead.
Arkansas’s lead monitor is located in Pulaski County. The first year data were collected
was 2010. All three-month rolling averages for 2010 – 2015 were below 0.01 µg/m3.
The Impact of Air Quality Programs on Pollutant Emissions
State and Federal Programs to Improve Air Quality
Air quality improvements have been achieved through implementation of State and
federal programs to implement the CAA. EPA has the primary authority for the regulation of
mobile sources. Regulation of stationary sources is achieved through a system of cooperative
federalism under which the federal government sets air quality goals that are protective of public
health and the environment and states have the primary responsibility of developing and
implementing a regulatory approach that achieves these goals. States also have the primary
responsibility to operate permitting programs to ensure that construction and operation of
stationary sources do not interfere with attainment of air quality goals. Examples of air quality
programs include Corporate Average Fuel Economy standards for light-duty vehicles, medium-
and heavy-duty vehicle emission standards, the Regional Haze Program, new source review for
stationary sources, and the Acid Rain Program. Since the promulgation of the CAA,
concentrations of criteria pollutants have plummeted despite increases in gross domestic product,
vehicle miles traveled, population, and energy consumption. Figure 14 shows national trends in
economic growth and emissions of air pollutants. Similar to the rest of the nation, Arkansas has
seen declines in emissions of air pollutants from regulated sources because of the
implementation of air quality programs.
18
Source: 2011 National Emissions Inventory version 2

21
Figure 14. Comparison of Growth Areas and Emissions, 1980 – 201519
Criteria Pollutant and Precursor Emissions Trends for Regulated Sources in
Arkansas
Every three years, EPA, in collaboration with the states, collects data on criteria pollutant
emissions. EPA publishes the data in the National Emissions Inventory (NEI) and provides
information about the estimated emissions of criteria pollutants and their precursors from various
source categories. ADEQ provides EPA with emissions estimates reported by larger stationary
sources for inclusion in the NEI. EPA estimates emissions from smaller stationary sources,
nonpoint sources, biogenic sources, mobile sources, and event sources. The nonpoint source
category includes small stationary sources too small to be reported as point sources (eg.
residential heating, commercial combustion, solvent use, etc.). The biogenic source category
includes vegetation and other natural sources of emissions (eg. crops, lawn grass, trees, and
soils). Biogenic sources primarily emit NOx, CO, and VOCs, which may impact air quality with
respect to NO2 and ozone. The mobile source category is split into two subcategories: onroad
vehicles and nonroad vehicles. EPA also estimates emissions from wildfires and prescribed
burns. These emissions fall into the event category. Source categories and examples of source
types that fall into these categories are listed in Table 3.
19
https://www.epa.gov/air-trends/air-quality-national-summary
CO2 emissions estimate through 2013 (Source: 2014 US Greenhouse Gas Inventory Report)
Gross Domestic Product: Bureau of Economic Analysis
Vehicle Miles Traveled: Federal Highway Administration Population: Census Bureau
Energy Consumption: Dept. of Energy, Energy Information Administration
Aggregate Emissions: EPA Clearinghouse for Inventories and Emissions Factors

22
Table 3. NEI Source Types
Source Category Examples
Point larger stationary sources
Nonpoint residential heating, solvents, agriculture, road dust
Biogenic crops, lawns, trees, soils
Onroad passenger vehicles, trucks, buses
Nonroad aircraft, locomotives, marine vessels
Event wildfires, prescribed burns
ADEQ air quality programs primarily regulate point sources. However, some nonpoint
sources may also fall within ADEQ’s regulatory authority. Mobile sources are regulated by EPA
under Title II of the CAA. Because of the nature of biogenic and event sources, emissions from
these two categories are not regulated. The following section describes emission trends by source
category for the three most recent NEI years: 2008, 2011, and 2014.
Nitrogen Oxides
NOx is a precursor for multiple criteria pollutants including ozone and PM2.5. The
NO2 NAAQS set by EPA uses NO2 as the indicator for the larger group of NOx compounds. NO2
is not directly tracked by the NEI because NO readily converts to NO2 and vice versa. The
equilibrium ratio of NO to NO2 depends on the intensity of sunlight. Instead, the NEI tracks total
NOx emissions, which includes both NO and NO2. Approximately 88% of NOx emissions in
Arkansas come from regulated source categories. 20
The primary contributors to NOx emissions
in Arkansas are mobile sources, particularly onroad vehicles, and point sources. 21
Emissions
from onroad vehicles constitute approximately 36% of NOx emissions from regulated source
categories. 22
Point source NOx emissions comprise approximately 36% of emissions from
regulated source categories in Arkansas. 23
Nonpoint NOx emissions comprise approximately
19%, and nonroad NOx emissions comprise approximately 9%.24
Figure 15 breaks down NOx
emissions from each regulated source category for NEI years 2008, 2011, and 2014.
20
Source: 2014 National Emissions Inventory version 1 21
Id. 22
Id. 23
Id. 24
Id.

23
Figure 15. Arkansas NOx Emissions by Regulated Category25
Overall, NOx emissions from regulated source categories decreased by 8% between the
2008 and 2014 NEI years. Onroad NOx emissions decreased by approximately 17%, nonroad
NOx emissions decreased by 24%, and point source NOx emissions decreased by 2% between
2008 and 2014 NEI years. Nonpoint source NOx emissions increased by approximately 18%
between 2008 and 2014 NEI years.
Volatile Organic Compounds
VOCs are precursors for ozone. Only 10% of VOC emissions in Arkansas come from
regulated sources. 26
Emissions from nonpoint sources comprise the largest portion (53%) of the
VOC emissions inventory from source categories regulated by state and federal air quality
programs. 27
Point sources emit approximately 15%, onroad sources emit approximately 17%,
and nonroad sources emit approximately 15% of the inventory from regulated source categories.
28 Figure 16 breaks down VOC emissions from each regulated source category for NEI years
2008, 2011, and 2014.
25
Source: 2008 National Emissions Inventory version 3, 2011 National Emissions Inventory version 2, 2014
National Emissions Inventory version 1 26
Source: 2014 National Emissions Inventory version 1 27
Id. 28
Id.
2008 2011 2014
Point 75,045 71,402 73,474
Onroad 88,416 91,215 73,325
Nonroad 24,811 22,156 18,882
Nonpoint 32,019 36,528 37,801
-
50,000
100,000
150,000
200,000
250,000
Ton
s P
er
Ye
ar

24
Figure 16. Arkansas VOC Emissions by Regulated Category29
Overall, VOC emissions from regulated source categories decreased by approximately
12% between the 2008 and 2014 NEI. Emissions from nonpoint sources increased by 6%
between the 2008 and 2014 NEI years. Emissions from nonroad, onroad, and point sources
decreased during the same time period. The largest reduction (35%) in emissions was achieved
by the onroad source category.
Carbon Monoxide
CO is both a criteria pollutant and a precursor for ozone. Approximately 43% of CO
emissions come from regulated source categories.30
Emissions from onroad sources comprise the
largest portion (48%) of the CO emissions inventory from source categories regulated by state
and federal air quality programs. 31
Point sources emit approximately 8%, nonroad sources emit
approximately 17%, and onroad sources emit approximately 27% of the inventory from
regulated source categories. 32
Figure 17 breaks down CO emissions from each regulated source
category for NEI years 2008 and 2011.
29
Source: 2008 National Emissions Inventory version 3, 2011 National Emissions Inventory version 2, 2014
National Emissions Inventory version 1 30
Source: 2014 National Emissions Inventory version 1 31
Id. 32
Id.
2008 2011 2014
Point 27,965 22,811 24,763
Onroad 40,952 35,407 26,533
Nonroad 32,563 29,365 23,223
Nonpoint 80,191 79,431 85,213
(10,000)
10,000
30,000
50,000
70,000
90,000
110,000
130,000
150,000
170,000
190,000To
ns
Pe
r Y
ear

25
Figure 17. Arkansas CO Emissions by Regulated Category33
Overall, CO emissions from regulated source categories decreased by 35% between 2008
and 2014. Onroad and nonroad CO emissions dropped sharply by approximately 45% and 30%,
respectively. Nonpoint CO emissions decreased by approximately 13% between 2008 and 2014
NEI years and point CO emissions decreased by approximately 8%.
Sulfur Dioxide
SO2 is both a criteria pollutant and a precursor for PM2.5. Virtually all SO2 emissions
come from regulated source categories.34
Emissions from point sources comprise the largest
portion (98.5%) of the SO2 emissions inventory from source categories regulated by state and
federal air quality programs. 35
Nonpoint sources emit approximately 1%, and onroad and
nonroad sources emit less than 1% of the inventory from regulated source categories.36
Figure 18
breaks down SO2 emissions from each regulated source category for NEI years 2008, 2011, and
2014.
33
Source: 2008 National Emissions Inventory version 3, 2011 National Emissions Inventory version 2, 2014
National Emissions Inventory version 1 34
Source: 2014 National Emissions Inventory version 1 35
Id. 36
Id.
2008 2011 2014
Point 44,342 45,584 41,008
Onroad 470,696 330,471 256,745
Nonroad 202,623 162,986 142,271
Nonpoint 105,126 117,773 91,660
-
100,000
200,000
300,000
400,000
500,000
600,000
700,000
800,000
900,000To
ns
Pe
r Y
ear
26
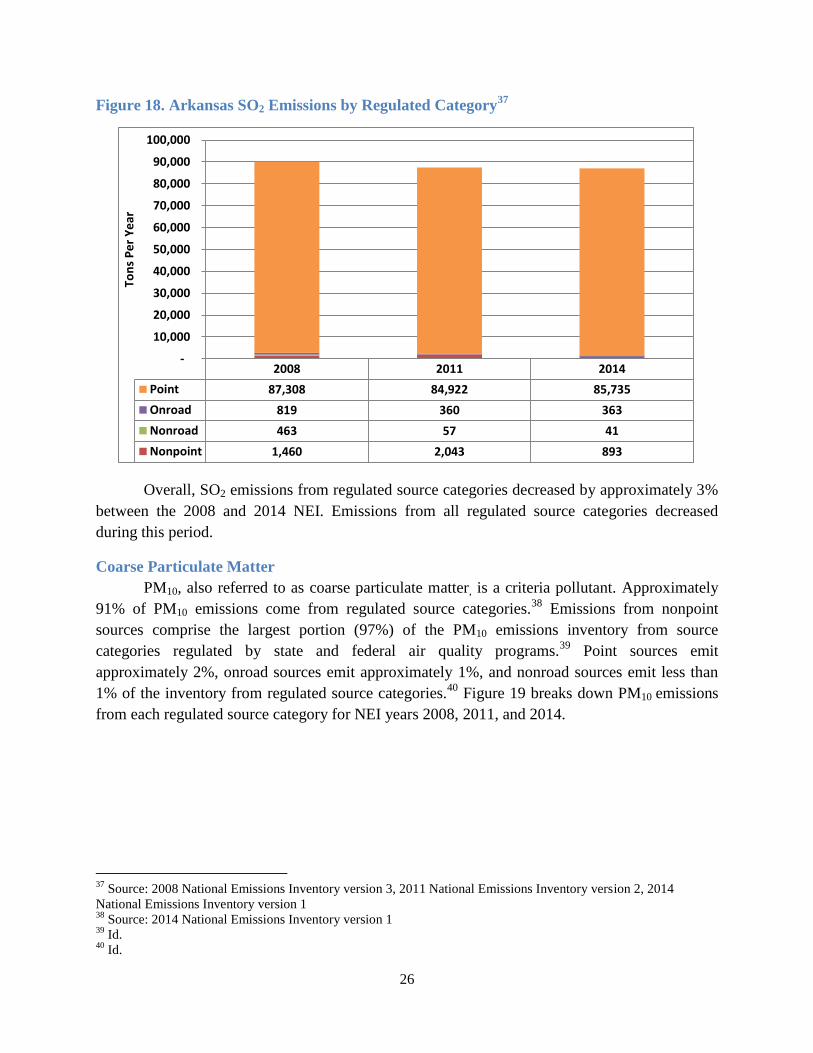
Figure 18. Arkansas SO2 Emissions by Regulated Category37
Overall, SO2 emissions from regulated source categories decreased by approximately 3%
between the 2008 and 2014 NEI. Emissions from all regulated source categories decreased
during this period.
Coarse Particulate Matter
PM10, also referred to as coarse particulate matter, is a criteria pollutant. Approximately
91% of PM10 emissions come from regulated source categories.38
Emissions from nonpoint
sources comprise the largest portion (97%) of the PM10 emissions inventory from source
categories regulated by state and federal air quality programs.39
Point sources emit
approximately 2%, onroad sources emit approximately 1%, and nonroad sources emit less than
1% of the inventory from regulated source categories.40
Figure 19 breaks down PM10 emissions
from each regulated source category for NEI years 2008, 2011, and 2014.
37
Source: 2008 National Emissions Inventory version 3, 2011 National Emissions Inventory version 2, 2014
National Emissions Inventory version 1 38
Source: 2014 National Emissions Inventory version 1 39
Id. 40
Id.
2008 2011 2014
Point 87,308 84,922 85,735
Onroad 819 360 363
Nonroad 463 57 41
Nonpoint 1,460 2,043 893
-
10,000
20,000
30,000
40,000
50,000
60,000
70,000
80,000
90,000
100,000To
ns
Pe
r Y
ear

27
Figure 19. Arkansas PM10 Emissions by Regulated Category41
Overall, PM10 emissions from regulated source categories increased by approximately
41% between the 2008 and 2014 NEI. Emissions from point and nonroad source categories
decreased. Nonpoint source emissions increased by 43% and onroad emissions increased by
26%.
Primary Fine Particulate Matter
Primary PM2.5, fine particulate matter, is the condensable and filterable fraction that is
directly emitted from sources. Primary PM2.5 does not include PM2.5 formed downwind by
reactions between precursor pollutants, such as NOx, SO2, and ammonia (NH3). Approximately
69% of primary PM2.5 emissions come from regulated source categories.42
Emissions from
nonpoint sources comprise the largest portion of the primary PM2.5 emissions inventory from
source categories regulated by state and federal air quality programs.43
Point sources emit
approximately 6%, onroad sources emit approximately 2%, and nonroad sources emit
approximately 2% of the inventory from regulated source categories. 44
Figure 20 breaks down
primary PM2.5 emissions from each regulated source category for NEI years 2008, 2011 and
2014.
41
Source: 2008 National Emissions Inventory version 3, 2011 National Emissions Inventory version 2, 2014
National Emissions Inventory version 1 42
Source: 2014 National Emissions Inventory version 1 43
Id. 44
Id.
2008 2011 2014
Point 11,060 10,451 9,947
Onroad 3,647 4,971 4,583
Nonroad 2,586 2,317 1,928
Nonpoint 385,007 374,651 552,031
-
100,000
200,000
300,000
400,000
500,000
600,000To
ns
Pe
r Y
ear

28
Figure 20. Arkansas Primary PM2.5 Emissions by Regulated Category45
Overall, primary PM2.5 emissions increased between the 2008 and 2014 NEI; however,
this was driven by an increase in emission estimates from the nonpoint source category and in
particular from the following two sectors: agriculture—crop and livestock dust—and unpaved
road dust.46
These two sectors of the nonpoint category are not regulated by ADEQ or EPA.
Emissions from point, onroad, and nonroad source categories decreased.
Ammonia
NH3 is a precursor for PM2.5. Approximately 89% of NH3 emissions come from regulated
source categories.47
Emissions from nonpoint sources comprise the largest portion (96%) of the
NH3 emissions inventory from source categories regulated by state and federal air quality
programs.48
Point sources emit approximately 3%, onroad sources emit approximately 1%, and
nonroad sources emit less than 1% of the inventory from regulated source categories. 49
Figure
21 breaks down NH3 emissions from each regulated source category for years 2008, 2011, and
2014 based on NEI data.
45
Source: 2008 National Emissions Inventory version 3 and 2011 National Emissions Inventory version 2, and 2014
National Emissions Inventory version 1 46
Id. 47
2014 National Emissions Inventory version 1 48
Id. 49
Id.
2008 2011 2014
Point 7,671 6,782 5,988
Onroad 2,818 2,981 2,568
Nonroad 2,470 2,211 1,837
Nonpoint 68,513 65,880 96,902
-
20,000
40,000
60,000
80,000
100,000
120,000
Ton
s P
er
Ye
ar

29
Figure 21. Arkansas NH3 Emissions by Regulated Category50
Overall, NH3 emissions from regulated source categories decreased by approximately
39% between the 2008 and 2014 NEI. The overall decrease in NH3 emissions was driven by a
40% decrease in nonpoint source NH3 emissions between the 2008 and 2014 NEI. Onroad
sources of NH3 emissions also decreased between 2008 and 2014. Nonroad and point source
emissions increased between 2008 and 2014.
Lead
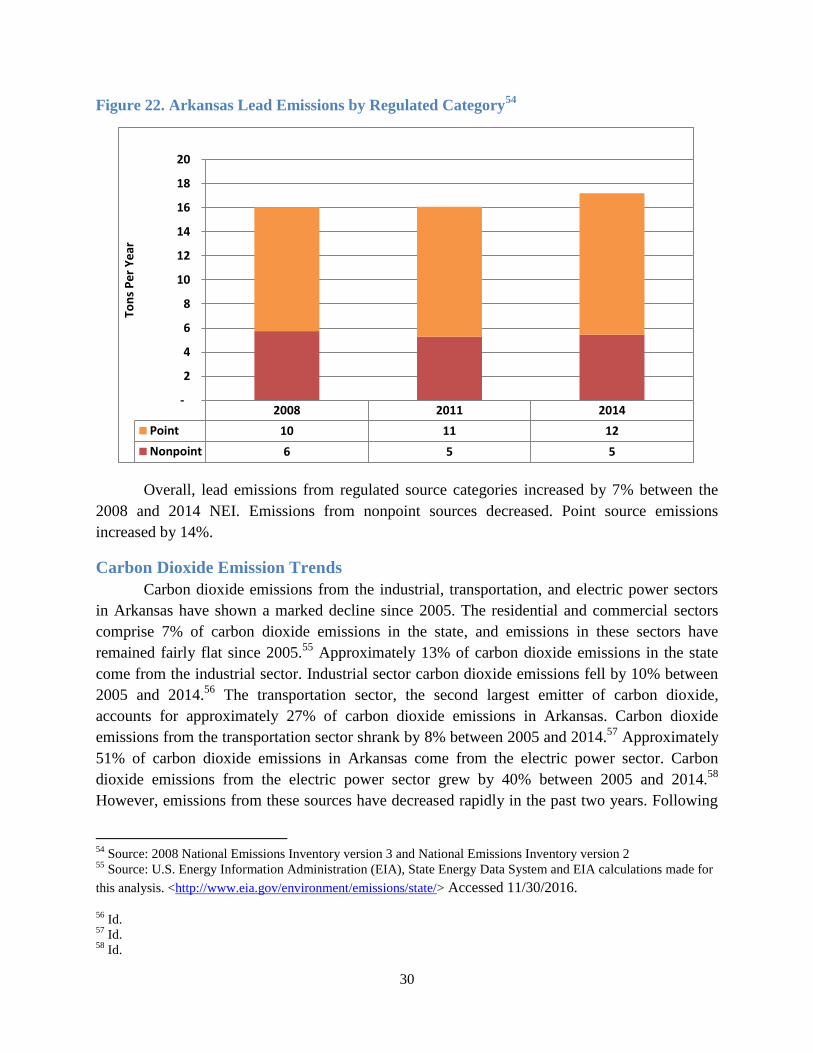
Lead is a criteria pollutant. All lead emissions reported in the NEI come from regulated
source categories.51
Emissions from point sources, primarily airports, comprise the largest
portion (68%) of the Arkansas lead emissions inventory from source categories regulated by
State and federal air quality programs.52
Nonpoint sources emit approximately 32% of the
inventory from regulated source categories.53
Figure 22 breaks down lead emissions from each
regulated source category for NEI years 2008 and 2011.
50
Source: Source: 2008 National Emissions Inventory version 3 and 2011 National Emissions Inventory version 2,
and 2014 National Emissions Inventory version 1 51
Source: 2014 National Emissions Inventory version 1 52
Id. 53
Id.
2008 2011 2014
Point 1,189 1,261 1,872
Onroad 1,464 1,307 1,095
Nonroad 26 27 28
Nonpoint 120,623 118,126 72,239
-
20,000
40,000
60,000
80,000
100,000
120,000
140,000
Ton
s P
er
Ye
ar
30
Figure 22. Arkansas Lead Emissions by Regulated Category54
Overall, lead emissions from regulated source categories increased by 7% between the
2008 and 2014 NEI. Emissions from nonpoint sources decreased. Point source emissions
increased by 14%.
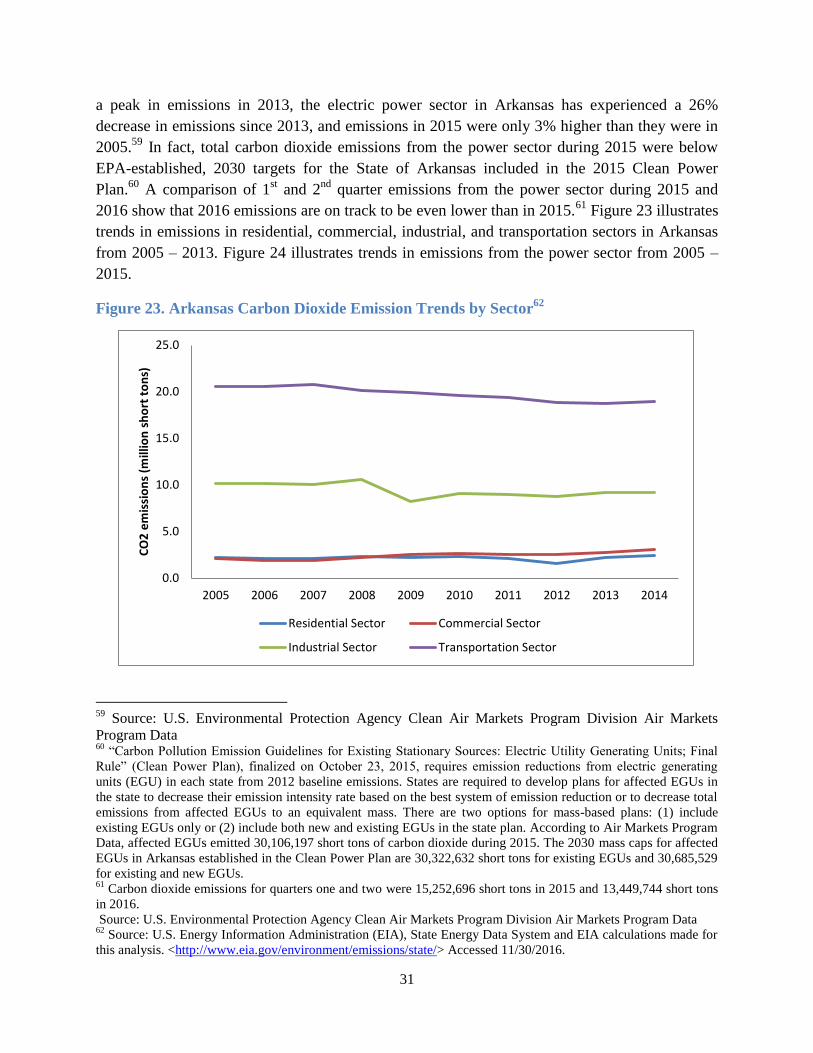
Carbon Dioxide Emission Trends
Carbon dioxide emissions from the industrial, transportation, and electric power sectors
in Arkansas have shown a marked decline since 2005. The residential and commercial sectors
comprise 7% of carbon dioxide emissions in the state, and emissions in these sectors have
remained fairly flat since 2005.55
Approximately 13% of carbon dioxide emissions in the state
come from the industrial sector. Industrial sector carbon dioxide emissions fell by 10% between
2005 and 2014.56
The transportation sector, the second largest emitter of carbon dioxide,
accounts for approximately 27% of carbon dioxide emissions in Arkansas. Carbon dioxide
emissions from the transportation sector shrank by 8% between 2005 and 2014.57
Approximately
51% of carbon dioxide emissions in Arkansas come from the electric power sector. Carbon
dioxide emissions from the electric power sector grew by 40% between 2005 and 2014.58
However, emissions from these sources have decreased rapidly in the past two years. Following
54
Source: 2008 National Emissions Inventory version 3 and National Emissions Inventory version 2 55
Source: U.S. Energy Information Administration (EIA), State Energy Data System and EIA calculations made for
this analysis. <http://www.eia.gov/environment/emissions/state/> Accessed 11/30/2016.
56 Id.
57 Id.
58 Id.
2008 2011 2014
Point 10 11 12
Nonpoint 6 5 5
-
2
4
6
8
10
12
14
16
18
20
Ton
s P
er
Ye
ar
31
a peak in emissions in 2013, the electric power sector in Arkansas has experienced a 26%
decrease in emissions since 2013, and emissions in 2015 were only 3% higher than they were in
2005.59
In fact, total carbon dioxide emissions from the power sector during 2015 were below
EPA-established, 2030 targets for the State of Arkansas included in the 2015 Clean Power
Plan.60
A comparison of 1st and 2
nd quarter emissions from the power sector during 2015 and
2016 show that 2016 emissions are on track to be even lower than in 2015.61
Figure 23 illustrates
trends in emissions in residential, commercial, industrial, and transportation sectors in Arkansas
from 2005 – 2013. Figure 24 illustrates trends in emissions from the power sector from 2005 –
2015.
Figure 23. Arkansas Carbon Dioxide Emission Trends by Sector62
59
Source: U.S. Environmental Protection Agency Clean Air Markets Program Division Air Markets
Program Data 60
“Carbon Pollution Emission Guidelines for Existing Stationary Sources: Electric Utility Generating Units; Final
Rule” (Clean Power Plan), finalized on October 23, 2015, requires emission reductions from electric generating
units (EGU) in each state from 2012 baseline emissions. States are required to develop plans for affected EGUs in
the state to decrease their emission intensity rate based on the best system of emission reduction or to decrease total
emissions from affected EGUs to an equivalent mass. There are two options for mass-based plans: (1) include
existing EGUs only or (2) include both new and existing EGUs in the state plan. According to Air Markets Program
Data, affected EGUs emitted 30,106,197 short tons of carbon dioxide during 2015. The 2030 mass caps for affected
EGUs in Arkansas established in the Clean Power Plan are 30,322,632 short tons for existing EGUs and 30,685,529
for existing and new EGUs. 61
Carbon dioxide emissions for quarters one and two were 15,252,696 short tons in 2015 and 13,449,744 short tons
in 2016.
Source: U.S. Environmental Protection Agency Clean Air Markets Program Division Air Markets Program Data 62
Source: U.S. Energy Information Administration (EIA), State Energy Data System and EIA calculations made for
this analysis. <http://www.eia.gov/environment/emissions/state/> Accessed 11/30/2016.
0.0
5.0
10.0
15.0
20.0
25.0
2005 2006 2007 2008 2009 2010 2011 2012 2013 2014
CO
2 e
mis
sio
ns
(mill
ion
sh
ort
to
ns)
Residential Sector Commercial Sector
Industrial Sector Transportation Sector

32
Figure 24. Arkansas Carbon Dioxide Emission Trends by the Electricity Sector63
Regional Haze
One of the most basic forms of air pollution is haze, which degrades visibility in many
American cities and scenic areas. Haze is caused when sunlight encounters fine particles in the
atmosphere and reduces the clarity and color of what we see, particularly during humid
conditions. Some light is absorbed by particles, while other light is scattered. The result of this
light scattering is reduced visibility. The higher the pollution levels, the lower the visibility.
Some of the types of particles that degrade visibility conditions include sulfates, nitrates, soot,
and dust. Air pollutants come from a variety of natural and manmade sources. Natural sources
can include windblown dust and soot from wildfires. Manmade sources can include motor
vehicles, electricity generation, industrial fuel burning, and manufacturing operations. Some
haze-causing particles are directly emitted to the air, while others are formed when gases emitted
to the atmosphere undergo chemical reactions that result in fine particles that can be transported
for hundreds or even thousands of miles
Some of the pollutants that form haze have also been linked to serious health problems
and environmental damage. Exposure to fine particles in the air has been linked with increased
respiratory illness, decreased lung function, and even premature death. In addition, particles such
as nitrates and sulfates contribute to acid rain formation, which makes lakes, rivers, and streams
unsuitable for certain species and erodes buildings, historical monuments, and paint on cars.
63
Source: U.S. Environmental Protection Agency Clean Air Markets Program Division Air Markets Program Data
20.0
25.0
30.0
35.0
40.0
45.0
2005 2006 2007 2008 2009 2010 2011 2012 2013 2014 2015
CO
2 e
mis
sio
ns
(mill
ion
sh
ort
to
ns)

33
Since 1988, the federal government has been monitoring visibility in national parks and
wilderness areas. In 1999, EPA issued the Regional Haze Rule to improve visibility conditions in
national parks and wilderness areas. The ultimate goal of the Regional Haze Rule is to return
those areas to natural background visibility conditions by 2064.
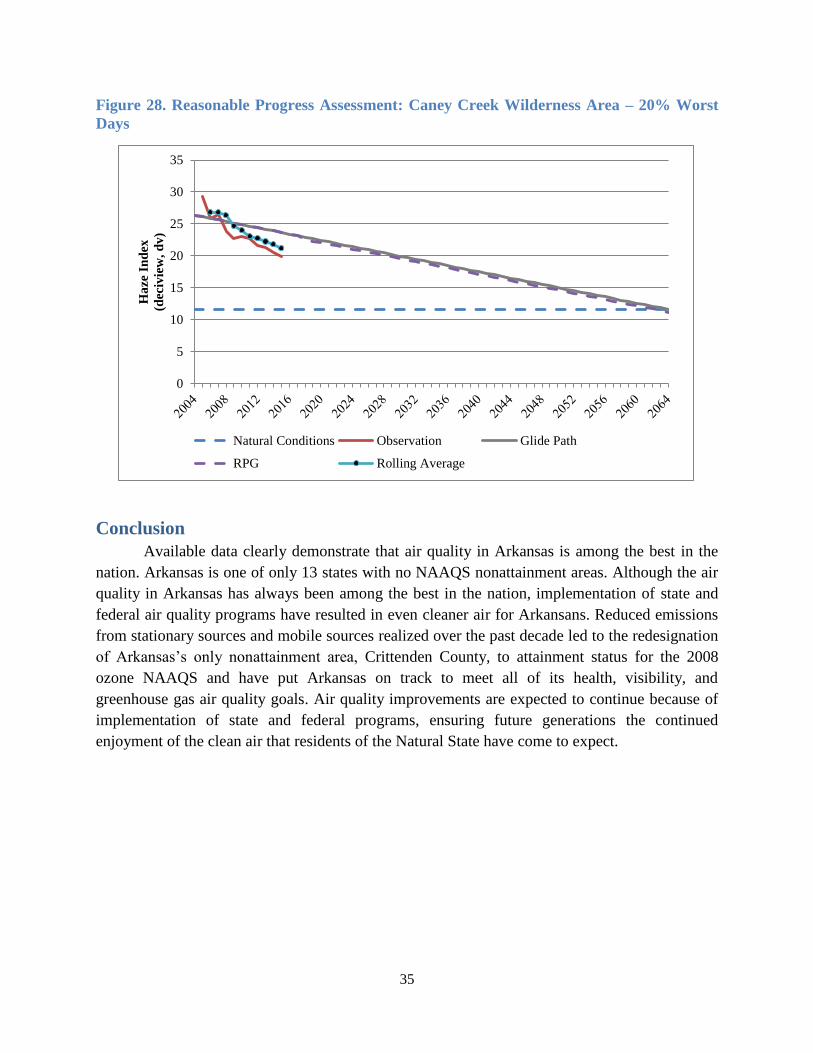
Visibility has improved dramatically in Arkansas since 2004. Visibility in the Natural
State is approaching natural background conditions much more rapidly than required under the
Regional Haze Rule. Figures 25, 26, 27, and 28 illustrate visibility improvements in the two
federal wilderness areas in Arkansas, the Upper Buffalo Wilderness Area in northwest Arkansas
and the Caney Creek Wilderness Area in west central Arkansas.64
Figure 25. Reasonable Progress Assessment: Upper Buffalo Wilderness Area – 20% Best Days
64
Federal Land Manager Environmental Database < http://views.cira.colostate.edu/fed/ToolsMenu.aspx>
0
2
4
6
8
10
12
14
16
Ha
ze I
nd
ex
(dec
ivie
w, d
v)
Natural Conditions Observation Glide Path
Baseline Rolling Average

34
Figure 26. Reasonable Progress Assessment: Upper Buffalo Wilderness Area – 20% Worst
Days
Figure 27. Reasonable Progress Assessment: Caney Creek Wilderness Area – 20% Best
Days
0
5
10
15
20
25
30
35H
aze
In
dex
(dec
ivie
w, d
v)
Natural Conditions Observation Glide Path
RPG Rolling Average
0
2
4
6
8
10
12
14
Ha
ze I
nd
ex
(dec
ivie
w, d
v)
Natural Conditions Observation Glide Path
Baseline Rolling Average
35
Figure 28. Reasonable Progress Assessment: Caney Creek Wilderness Area – 20% Worst
Days
Conclusion
Available data clearly demonstrate that air quality in Arkansas is among the best in the
nation. Arkansas is one of only 13 states with no NAAQS nonattainment areas. Although the air
quality in Arkansas has always been among the best in the nation, implementation of state and
federal air quality programs have resulted in even cleaner air for Arkansans. Reduced emissions
from stationary sources and mobile sources realized over the past decade led to the redesignation
of Arkansas’s only nonattainment area, Crittenden County, to attainment status for the 2008
ozone NAAQS and have put Arkansas on track to meet all of its health, visibility, and
greenhouse gas air quality goals. Air quality improvements are expected to continue because of
implementation of state and federal programs, ensuring future generations the continued
enjoyment of the clean air that residents of the Natural State have come to expect.
0
5
10
15
20
25
30
35
Ha
ze I
nd
ex
(dec
ivie
w, d
v)
Natural Conditions Observation Glide Path
RPG Rolling Average


