
1
WIND POWER TECHNOLOGIES OFFICE WIND POWER TECHNOLOGIES OFFICE
2015 Wind Technologies Market Report: Summary
Ryan Wiser & Mark Bolinger Lawrence Berkeley National Laboratory
August 2016

2
WIND POWER TECHNOLOGIES OFFICE
2015 Wind Technologies Market Report Purpose, Scope, and Data:
• Publicly available annual report summarizing key trends in the U.S. wind power market, with a focus on 2015
• Scope primarily includes wind turbines over 100 kW in size
• Separate DOE-funded report on distributed wind
• Data sources include AWEA, EIA, FERC, SEC, etc. (see full report)
Report Authors: • Primary authors: Ryan Wiser and Mark Bolinger, Berkeley Lab
• Contributions from others at Berkeley Lab, Exeter Associates, NREL
Funded by: U.S. DOE Wind & Water Power Technologies Office
Available at: http://energy.gov/eere/wind

3
WIND POWER TECHNOLOGIES OFFICE
Report Contents
• Installation trends • Industry trends • Technology trends • Performance trends • Cost trends • Wind power price trends • Policy & market drivers • Future outlook

4
WIND POWER TECHNOLOGIES OFFICE
Key Findings • Annual wind capacity additions surged in 2015, w/ significant additional
new builds anticipated over next five years in part due to PTC extension
• Wind has been a significant source of new electric generation capacity additions in the U.S. in recent years
• Supply chain has been under some duress, but domestic manufacturing content for nacelle assembly, blades, and towers is strong
• Turbine scaling is significantly boosting wind project performance, while the installed cost of wind projects has declined
• Wind power sales prices remain near all-time lows, enabling economic competitiveness despite low natural gas prices
• Growth beyond current PTC cycle remains uncertain: could be blunted by declining federal tax support, expectations for low natural gas prices, and modest electricity demand growth

5
WIND POWER TECHNOLOGIES OFFICE
Installation Trends

6
WIND POWER TECHNOLOGIES OFFICE
• $14.5 billion invested in wind power project additions in 2015 • More than $150 billion invested since beginning of the 1980s • Cumulative wind capacity up 12%, bringing total to 74 GW
Wind Power Additions Surged in 2015, with 8,598 MW of New Capacity Added

7
WIND POWER TECHNOLOGIES OFFICE
Wind Power Represented 41% of Electric-Generating Capacity Additions in 2015
Over last decade, wind has comprised 31% of capacity additions nation-wide, and a much higher proportion in some regions
InteriorGreatLakes
West
Southeast
Northeast

8
WIND POWER TECHNOLOGIES OFFICE
• Global wind additions reached a new high in 2015 • U.S. remains a distant second to China in cumulative capacity • U.S. led the world in wind energy production in 2015
The U.S. Placed 2rd in Annual Wind Power Capacity Additions in 2015
Annual Capacity (2015, MW)
Cumulative Capacity (end of 2015, MW)
China 30,293 China 145,053 United States 8,598 United States 73,992 Germany 6,013 Germany 44,986 Brazil 2,754 India 25,352 India 2,623 Spain 22,665 Canada 1,506 United Kingdom 13,388 Poland 1,266 Canada 11,190 France 1,073 France 10,243 United Kingdom 975 Brazil 9,346 Turkey 956 Italy 8,851 Rest of World 7,078 Rest of World 68,464 TOTAL 63,135 TOTAL 433,530
Source: Navigant; AWEA project database for U.S. capacity

9
WIND POWER TECHNOLOGIES OFFICE
U.S. Lagging Other Countries in Wind As a Percentage of Electricity Consumption
Note: Figure only includes the countries with the most installed wind power capacity at the end of 2015

10
WIND POWER TECHNOLOGIES OFFICE
Geographic Spread of Wind Projects in the United States Is Reasonably Broad
Note: Numbers within states represent cumulative installed wind capacity and, in brackets, annual additions in 2015

11
WIND POWER TECHNOLOGIES OFFICE
Texas Installed the Most Wind Capacity in 2015; 10 States ≥ 10% Wind Energy
• Texas had almost 3 times as much wind capacity as the next-highest state
• 24 states had > 500 MW of capacity at end of 2015 (17 > 1 GW, 11 > 2 GW)
• IA = 31% of total in-state generation from wind; SD = 26%, KS = 24%; 10 states ≥ 10%)
Installed Capacity (MW) Percentage of In-State Generation
Annual (2015) Cumulative (end of 2015) Actual (2015)* Texas 3,615 Texas 17,711 Iowa 31.3% Oklahoma 1,402 Iowa 6,209 South Dakota 25.5% Kansas 799 California 5,662 Kansas 23.9% Iowa 524 Oklahoma 5,184 Oklahoma 18.4% Colorado 399 Illinois 3,842 North Dakota 17.7% Illinois 274 Kansas 3,764 Minnesota 17.0% New Mexico 268 Minnesota 3,235 Idaho 16.2% North Dakota 258 Oregon 3,153 Vermont 15.4% Minnesota 200 Washington 3,075 Colorado 14.2% California 194 Colorado 2,965 Oregon 11.3% South Dakota 175 North Dakota 2,143 Maine 10.5% Maine 173 Indiana 1,895 Texas 10.0% Indiana 150 New York 1,749 Nebraska 8.0% Nebraska 80 Michigan 1,531 Wyoming 7.7% Arizona 30 Wyoming 1,410 Montana 6.6% Maryland 30 Pennsylvania 1,340 Washington 6.5% New Hampshire 14 New Mexico 1,080 New Mexico 6.3% Ohio 8 South Dakota 977 California 6.2% Connecticut 5 Idaho 973 Hawaii 6.1% New York 1 Nebraska 890 Illinois 5.5% Rest of U.S. 0 Rest of U.S. 5,203 Rest of U.S. 1.0% TOTAL 8,598 TOTAL 73,992 TOTAL 4.7%
* Based on 2015 wind and total generation by state from EIA’s Electric Power Monthly.
12
WIND POWER TECHNOLOGIES OFFICE
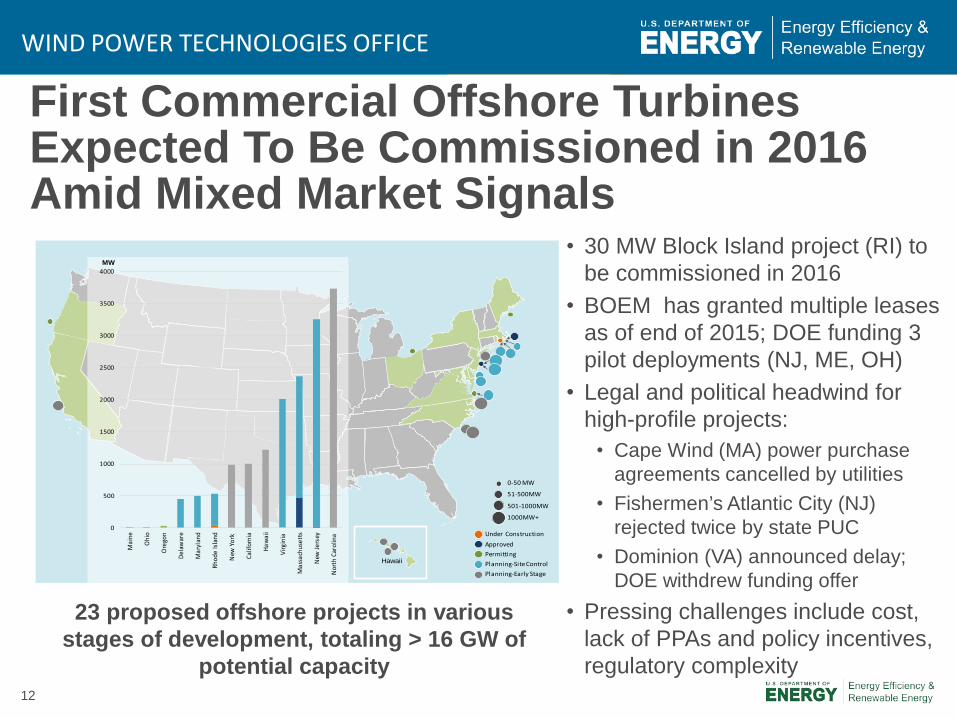
First Commercial Offshore Turbines Expected To Be Commissioned in 2016 Amid Mixed Market Signals
• 30 MW Block Island project (RI) to be commissioned in 2016
• BOEM has granted multiple leases as of end of 2015; DOE funding 3 pilot deployments (NJ, ME, OH)
• Legal and political headwind for high-profile projects:
• Cape Wind (MA) power purchase agreements cancelled by utilities
• Fishermen’s Atlantic City (NJ) rejected twice by state PUC
• Dominion (VA) announced delay; DOE withdrew funding offer
• Pressing challenges include cost, lack of PPAs and policy incentives, regulatory complexity
0-50 MW
51-500MW
501-1000MW
1000MW+
Hawaii
Under ConstructionApprovedPermitting Planning-Site ControlPlanning-Early Stage
0
500
1000
1500
2000
2500
3000
3500
4000
Mai
ne
Ohi
o
Ore
gon
Dela
war
e
Mar
ylan
d
Rhod
e Is
land
New
Yor
k
Calif
orni
a
Haw
aii
Virg
inia
Mas
sach
uset
ts
New
Jers
ey
Nor
th C
arol
ina
MW
23 proposed offshore projects in various stages of development, totaling > 16 GW of
potential capacity

13
WIND POWER TECHNOLOGIES OFFICE
Interconnection Queues Demonstrate that a Substantial Amount of Wind Is Under Consideration
Wind represented 31% of capacity in sampled 34 queues; 2015 = largest amount of wind additions since 2010
But… absolute amount of wind (and coal & nuclear) in queues has declined in recent years whereas natural gas and solar capacity has increased or held steady
Not all of this capacity will be built….
• AWEA reports 15 GW of capacity under construction after 1Q2016

14
WIND POWER TECHNOLOGIES OFFICE
Larger Amounts of Wind Planned for Texas, Midwest, Southwest Power Pool, Northwest, PJM, and Mountain Region
Not all of this capacity will be built….

15
WIND POWER TECHNOLOGIES OFFICE
Industry Trends

16
WIND POWER TECHNOLOGIES OFFICE
GE and Vestas Captured 73% of the U.S. Market in 2014
• Recent dominance of the three-largest turbine suppliers in the U.S. market • Globally, Goldwind and Vestas were the top suppliers, followed by GE • Chinese suppliers occupied 5 of the top 10 spots in the global ranking,
based almost entirely on sales within their domestic market
0%
10%
20%
30%
40%
50%
60%
70%
80%
90%
100%
2005 2006 2007 2008 2009 2010 2011 2012 2013 2014 2015
Turb
ine
OEM
US
Mar
ket S
hare
by
MW
Other
Suzlon
Mitsubishi
Goldwind
Sany
Nordex
Gamesa
Acciona
Siemens
Vestas
GE Wind

17
WIND POWER TECHNOLOGIES OFFICE
Manufacturing Supply Chain Continued to Adjust to Swings in Domestic Demand
Note: map not intended to be exhaustive
• Upswing in near- to medium-term expected growth, but strong competitive pressures and possible reduced demand over time as the PTC is phased down
• 3 domestic manufacturing facility closures in 2015; 1 new opening
• Many manufacturers remain: over last decade, manufacturers have localized and expanded U.S. presence; “Big 3” OEMs all have at least one facility
• Wind related jobs increased from 73,000 in 2014 to 88,000 in 2015

18
WIND POWER TECHNOLOGIES OFFICE
Domestic Manufacturing Capability for Nacelle Assembly, Towers, and Blades Is Reasonably Well Balanced Against Near-Term Demand Forecasts
0
2,000
4,000
6,000
8,000
10,000
12,000
14,000
16,000
2006 2007 2008 2009 2010 2011 2012 2013 2014 2015 2016 2017 2018
Capa
city
(MW
)
Annual installed wind power capacityNacelle assembly manufacturing capacityTower manufacturing capacityBlade manufacturing capacity
Past Projected

19
WIND POWER TECHNOLOGIES OFFICE
Turbine OEM Profitability Has Generally Rebounded Over the Last Three Years

20
WIND POWER TECHNOLOGIES OFFICE
Imports of Wind Equipment Are Sizable; Exports Declined in 2015
• Figure only includes tracked trade categories; misses other wind-related imports • See full report for the assumptions used to generate this figure
U.S. is a net importer of wind equipment Exports of wind-powered generating sets decreased to $149 million in 2015; no ability to track other wind-specific exports, but total tower exports equalled $63 million

21
WIND POWER TECHNOLOGIES OFFICE
Tracked Wind Equipment Imports in 2015: 40% Asia, 38% Europe, 22% Americas
Note: Tracked wind-specific equipment includes: wind-powered generating sets, towers, hubs and blades, wind generators and parts

22
WIND POWER TECHNOLOGIES OFFICE
Source Markets for Imports Vary Over Time, and By Type of Wind Equipment
• Majority of imports of wind-powered generating sets from home countries of OEMs, dominated by Europe
• Significant imports of towers from Asia, but decline in recent years after tariff measures largely stopped imports from China and Vietnam
• Majority of imports of blades & hubs from China, Brazil, Europe
• Globally diverse sourcing strategy for generators & parts
0%
10%
20%
30%
40%
50%
60%
70%
80%
90%
100%
20050.6B
20061.4B
20072.7B
20082.8B
20092.5B
20101.3B
20111.3B
20121B
20130.02B
20140.3B
20150.2B
Impo
rt C
ount
ry (%
of a
nnua
l im
port
s)
Annual Imports
Wind-powered Generating Sets
China
Germany
Spain
Denmark
20120.9B
20130.3B
20140.5B
20150.8B
Blades & Hubs
ItalyDenmark
Spain
China
Brazil0%
10%
20%
30%
40%
50%
60%
70%
80%
90%
100%
20110.5B
20120.9B
20130.1B
20140.2B
20150.3B
Spain
Mexico
Canada
South Korea
Indonesia
Towers
20120.5B
20130.2B
20140.3B
20150.3B
Mexico
Serbia
Japan
China
Vietnam
Generators & Parts

23
WIND POWER TECHNOLOGIES OFFICE
Domestic Manufacturing Content Is Strong for Nacelle Assembly, Towers, and Blades, but U.S. Is Highly Reliant on Imports for Equipment Internal to the Nacelle
Imports occur in untracked trade categories, including many nacelle internals; nacelle internals generally have domestic content of < 20% Overall estimated domestic content: ~40% in 2012 for wind turbine equipment; ~60% if considering total projects costs, including balance-of-plant
Domestic Content for 2015 Turbine Installations in the U.S. Towers Blades & Hubs Nacelle Assembly
80-85% 50-70% > 85% of nacelle assembly

24
WIND POWER TECHNOLOGIES OFFICE
The Project Finance Environment Remained Strong in 2015
• Project sponsors raised $5.9-6.4 billion of tax equity (largest single-year amount on record) and $2.9 billion of debt in 2015
• Tax equity yields drifted slightly lower, as did debt interest rates

25
WIND POWER TECHNOLOGIES OFFICE
IPPs Own the Majority of Wind Assets Built in 2015
26
WIND POWER TECHNOLOGIES OFFICE
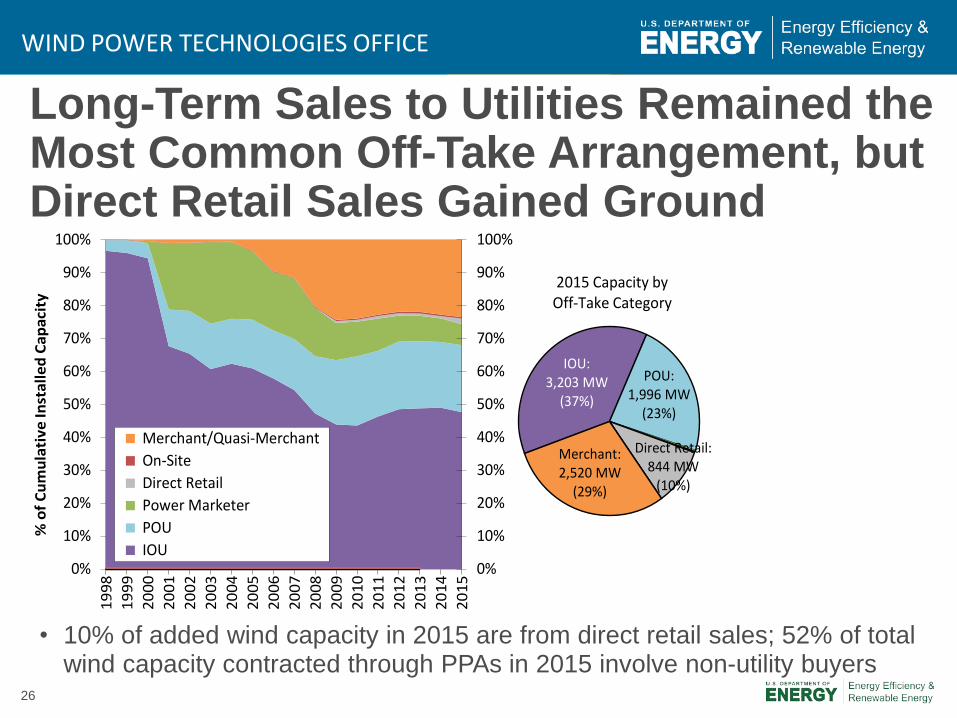
Long-Term Sales to Utilities Remained the Most Common Off-Take Arrangement, but Direct Retail Sales Gained Ground
• 10% of added wind capacity in 2015 are from direct retail sales; 52% of total wind capacity contracted through PPAs in 2015 involve non-utility buyers
0%
10%
20%
30%
40%
50%
60%
70%
80%
90%
100%
0%
10%
20%
30%
40%
50%
60%
70%
80%
90%
100%
1998
1999
2000
2001
2002
2003
2004
2005
2006
2007
2008
2009
2010
2011
2012
2013
2014
2015
Merchant/Quasi-Merchant On-Site Direct Retail Power Marketer POU IOU
% o
f Cum
ulat
ive
Inst
alle
d Ca
paci
ty
IOU:3,203 MW
(37%)
POU:1,996 MW
(23%)
Direct Retail:844 MW
(10%)
Merchant:2,520 MW
(29%)
2015 Capacity byOff-Take Category

27
WIND POWER TECHNOLOGIES OFFICE
Technology Trends

28
WIND POWER TECHNOLOGIES OFFICE
Turbine Nameplate Capacity, Hub Height, and Rotor Diameter Have All Increased Significantly Over the Long Term

29
WIND POWER TECHNOLOGIES OFFICE
Growth in Rotor Diameter Has Outpaced Growth in Nameplate Capacity and Hub Height in Recent Years
Nameplate Capacity
Hub Height
Rotor Diameter

30
WIND POWER TECHNOLOGIES OFFICE
Turbines Originally Designed for Lower Wind Speed Sites Have Rapidly Gained Market Share
Specific Power
IEC Class
Specific Power by Selected IEC Class

31
WIND POWER TECHNOLOGIES OFFICE
Turbines Originally Designed for Lower Wind Speeds Now Regularly Used in Lower & Higher Wind Sites; Taller Towers Predominate in Great Lakes and NE
By Region By Wind Resource Quality

32
WIND POWER TECHNOLOGIES OFFICE
Performance Trends

33
WIND POWER TECHNOLOGIES OFFICE
Sample-Wide Capacity Factors Have Increased, but Impacted by Curtailment and Inter-Year Wind Resource Variability
Note: The wind resource index is compiled from NextEra Energy Resources reports

34
WIND POWER TECHNOLOGIES OFFICE
Wind Curtailment Has Generally Declined in Recent Years; Higher in MISO
In areas where curtailment has been particularly problematic in the past – principally in Texas – steps taken to address the issue have born fruit
Except for BPA, data represent both forced & economic curtailment

35
WIND POWER TECHNOLOGIES OFFICE
Impact of Technology Trends on Capacity Factors Becomes More Apparent When Parsed by Project Vintage

36
WIND POWER TECHNOLOGIES OFFICE
Trends Explained by Competing Influence of Lower Specific Power and Higher Hub Heights vs. Build-Out of Lower Quality Wind Resource Sites through 2012
Reversal of build-out in lower wind speed sites in 2013-2015

37
WIND POWER TECHNOLOGIES OFFICE
Controlling for Wind Resource Quality and Specific Power Demonstrates Impact of Turbine Evolution
Turbine design changes are driving capacity factors higher for projects located in given wind resource regimes

38
WIND POWER TECHNOLOGIES OFFICE
Controlling for Wind Resource Quality and Commercial Operation Date Also Illustrates Impact of Turbine Evolution

39
WIND POWER TECHNOLOGIES OFFICE
Degradation of Project Performance as Projects Age Also Impacts Overall Trends
Note: See full report for caveats associated with this figure

40
WIND POWER TECHNOLOGIES OFFICE
Regional Variations in Capacity Factors Reflect the Strength of the Wind Resource and Adoption of New Turbine Technology
Note: Very limited sample size for 2014 projects in most regions

41
WIND POWER TECHNOLOGIES OFFICE
Cost Trends

42
WIND POWER TECHNOLOGIES OFFICE
Wind Turbine Prices Remained Well Below the Levels Seen Several Years Ago
Recent turbine orders reportedly in the range of $850-1,250/kW

43
WIND POWER TECHNOLOGIES OFFICE
Lower Turbine Prices Drive Reductions in Reported Installed Project Costs
• 2015 projects had an average cost of $1,690/kW, down $640/kW since 2009 and 2010; limited sample of under-construction projects slated for completion in 2016 suggest no material change in costs

44
WIND POWER TECHNOLOGIES OFFICE
Economies of Scale, Especially at Lower End of Project & Turbine Size Range
Project Size
Turbine Size
45
WIND POWER TECHNOLOGIES OFFICE
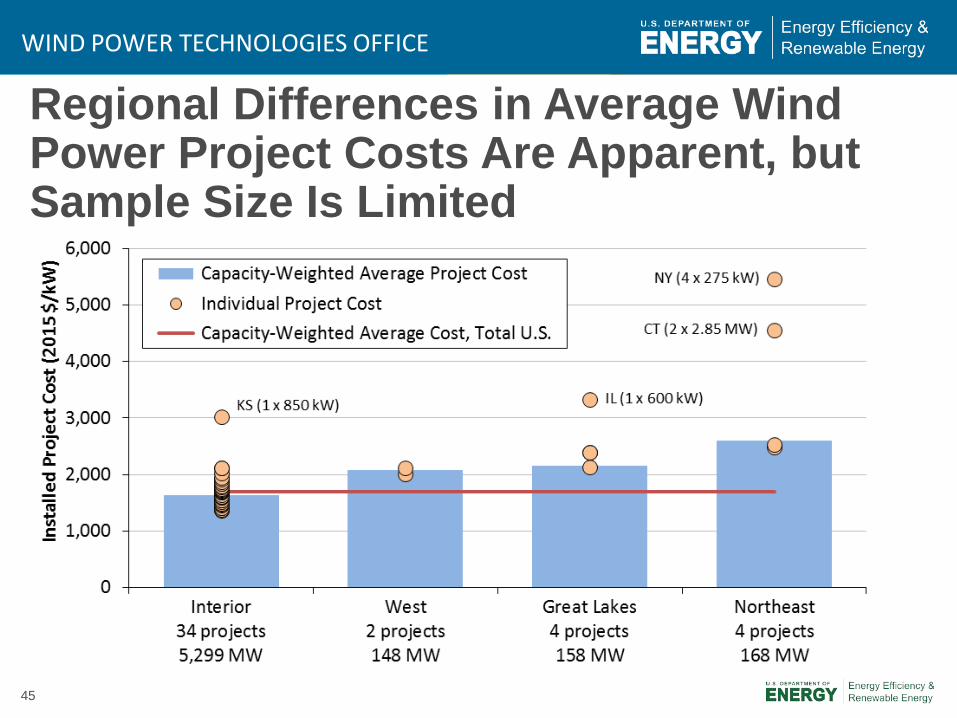
Regional Differences in Average Wind Power Project Costs Are Apparent, but Sample Size Is Limited

46
WIND POWER TECHNOLOGIES OFFICE
Most 2015 Projects—and All of the Low-Cost Projects—Are Located in the Interior; Other Regions Have Higher Costs

47
WIND POWER TECHNOLOGIES OFFICE
Operations and Maintenance Costs Varied By Project Age and Commercial Operations Date
Capacity-weighted average 2000-15 O&M costs for projects built in the 1980s equal $35/MWh, dropping to $24/MWh for projects built in 1990s, to $10/MWh for projects built in the 2000s, and to $9/MWh for projects built since 2010 Note: Sample is limited; few projects in sample have complete records of O&M costs from 2000-15; O&M costs reported here DO NOT include all operating costs

48
WIND POWER TECHNOLOGIES OFFICE
Operations and Maintenance Costs Varied By Project Age and Commercial Operations Date
Note: Sample size is limited
O&M reported in figure does not include all operating costs: Statements from public companies with large U.S. wind asset bases report total operating costs in 2015 for projects built in the 2000s of ~$25/MWh

49
WIND POWER TECHNOLOGIES OFFICE
Wind Power Price Trends

50
WIND POWER TECHNOLOGIES OFFICE
Sample of Wind Power Prices • Berkeley Lab collects data on historical wind power sales
prices, and long-term PPA prices
• PPA sample includes 387 contracts totaling 34,558 MW from projects built from 1998-2015, or planned for installation in 2016 or 2017
• Prices reflect the bundled price of electricity and RECs as sold by the project owner under a power purchase agreement – Dataset excludes merchant plants, projects that sell renewable
energy certificates (RECs) separately, and direct retail sales
– Prices reflect receipt of state and federal incentives (e.g., the PTC or Treasury grant), as well as various local policy and market influences; as a result, prices do not reflect wind energy generation costs

51
WIND POWER TECHNOLOGIES OFFICE
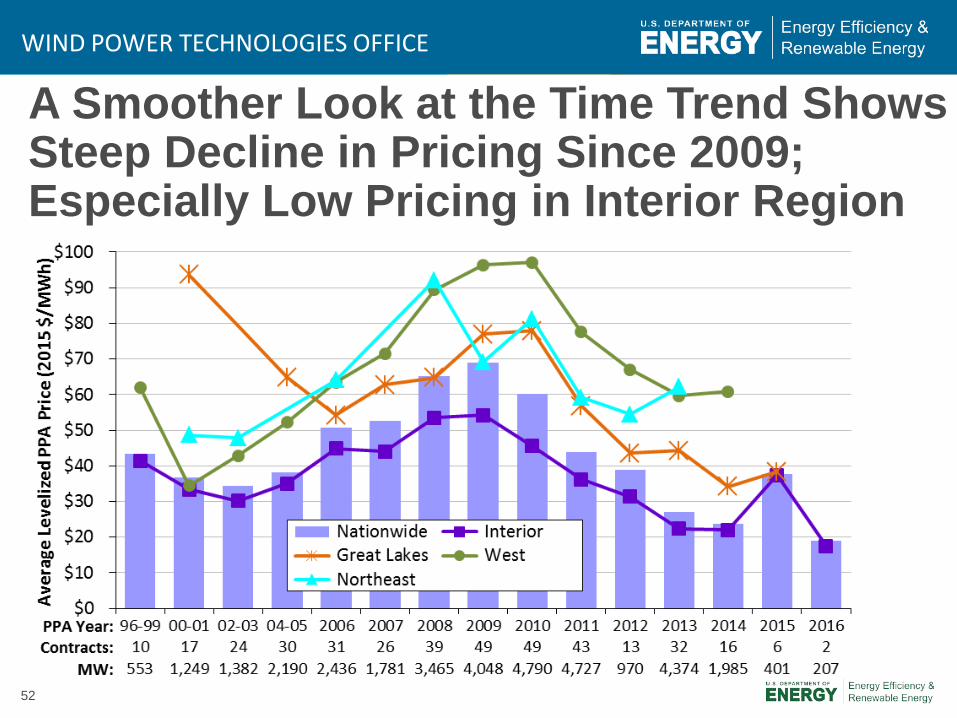
Wind PPA Prices Remain Very Low, Especially in Interior Region
52
WIND POWER TECHNOLOGIES OFFICE
A Smoother Look at the Time Trend Shows Steep Decline in Pricing Since 2009; Especially Low Pricing in Interior Region

53
WIND POWER TECHNOLOGIES OFFICE
Relative Competitiveness of Wind Power Challenged in 2015 as a Result of Dropping Wholesale Electric Prices
• Wholesale price range reflects flat block of power across 23 pricing nodes across the U.S. (and Interior) • Price comparison shown here is far from perfect – see full report for caveats

54
WIND POWER TECHNOLOGIES OFFICE
Recent Wind Prices Are Hard to Beat: Competitive with Expected Future Cost of Burning Fuel in Natural Gas Plants
Price comparison shown here is far from perfect – see full report for caveats

55
WIND POWER TECHNOLOGIES OFFICE
Renewable Energy Certificate (REC) Prices Remain High in Northeast, While Falling Modestly among Mid-Atlantic States
REC prices vary by: market type (compliance vs. voluntary); geographic region; specific design of state RPS policies
$0
$10
$20
$30
$40
2010
2011
2012
2013
2014
2015
2016
Mid-Atlantic Tier I, Texas, & Voluntary Mkt
DC DEIL MDNJ OHPA TXVol. (nat'l) Vol. (west)
$0
$20
$40
$60
$80
2010
2011
2012
2013
2014
2015
2016
New England Class I
CT MA ME NH RI
2015
$/M
Wh
56
WIND POWER TECHNOLOGIES OFFICE
Policy and Market Drivers

57
WIND POWER TECHNOLOGIES OFFICE
Long-Term Extension and Phase Down of PTC Leading to Resurgent Market • 5-year extension of PTC, plus
favorable guidance allowing 4 years for project completion after the start of construction
• Glide path to a lower PTC, with progressive reduction in the value of the credit for projects starting construction after 2016
• PTC will phase down in 20%-per-year increments for projects starting construction in 2017 (80% PTC value), 2018 (60%), and 2019 (40%)
Legislation Date Enacted
Start of PTC Window
End of PTC Window
Effective PTC Planning Window
(considering lapses and early extensions)
Energy Policy Act of 1992 10/24/1992 1/1/1994 6/30/1999 80 months Ticket to Work and Work Incentives Improvement Act of 1999
12/19/1999 (lapsed for >5
months) 7/1/1999 12/31/2001 24 months
Job Creation and Worker Assistance Act
3/9/2002 (lapsed for >2
months) 1/1/2002 12/31/2003 22 months
The Working Families Tax Relief Act
10/4/2004 (lapsed for >9
months) 1/1/2004 12/31/2005 15 months
Energy Policy Act of 2005 8/8/2005 1/1/2006 12/31/2007 29 months Tax Relief and Healthcare Act of 2006 12/20/2006 1/1/2008 12/31/2008 24 months
Emergency Economic Stabilization Act of 2008 10/3/2008 1/1/2009 12/31/2009 15 months
The American Recovery and Reinvestment Act of 2009 2/17/2009 1/1/2010 12/31/2012 46 months
American Taxpayer Relief Act of 2012
1/2/2013 (lapsed for 1-2
days) 1/1/2013 Start construction
by 12/31/2013 12 months (in which to start
construction)
Tax Increase Prevention Act of 2014
12/19/2014 (lapsed for
>11 months) 1/1/2014 Start construction
by 12/31/2014 2 weeks (in which to start
construction)
Consolidated Appropriations Act of 2016
12/18/2015 (lapsed for
>11 months) 1/1/2015
Start construction by 12/31/2016
12 months to start construction and receive 100% PTC value
Start construction by 12/31/2017
24 months to start construction and receive 80% PTC value
Start construction by 12/31/2018
36 months to start construction and receive 60% PTC value
Start construction by 12/31/2019
48 months to start construction and receive 40% PTC value

58
WIND POWER TECHNOLOGIES OFFICE
State Policies Help Direct the Location and Amount of Wind Development, but Current Policies Cannot Support Continued Growth at Recent Levels
• 29 states and D.C. have mandatory RPS programs
• State RPS’ can support ~3.7 GW/yr of renewable energy additions on average through 2030 (less for wind specifically)
WI: 10% by 2015
NV: 25% by 2025
TX: 5,880 MW by 2015
PA: 8.5% by 2020
NJ: 22.5% by 2020CT: 23% by 2020
MA: 11.1% by 2009 +1%/yr
ME: 40% by 2017
NM: 20% by 2020 (IOUs)10% by 2020 (co-ops)
CA: 50% by 2030
MN: 26.5% by 2025Xcel: 31.5% by 2020
IA: 105 MW by 1999
MD: 20% by 2022
RI: 38.5% by 2035
HI: 100% by 2045
AZ: 15% by 2025
NY: 30% by 2015
CO: 30% by 2020 (IOUs)20% by 2020 (co-ops)10% by 2020 (munis)
MT: 15% by 2015
DE: 25% by 2025
DC: 50% by 2032
WA: 15% by 2020
NH: 24.8% by 2025
OR: 50% by 2040 (large IOUs)5-25% by 2025 (other utilities)
NC: 12.5% by 2021 (IOUs)10% by 2018 (co-ops and munis)
IL: 25% by 2025
VT: 75% by 2032
MO: 15% by 2021
OH: 12.5% by 2026
MI: 10% by 2015

59
WIND POWER TECHNOLOGIES OFFICE
System Operators Are Implementing Methods to Accommodate Increased Penetrations of Wind
Notes: Because methods vary and a consistent set of operational impacts has not been included in each study, results from the different analyses of integration costs are not fully comparable.
Integrating wind energy into power systems is manageable, but not free of additional costs Transmission Barriers Remain

60
WIND POWER TECHNOLOGIES OFFICE
Future Outlook

61
WIND POWER TECHNOLOGIES OFFICE
Sizable Wind Additions Anticipated for 2016-20 Given PTC Extension; Downturn and Uncertainty Beyond 2020
Wind additions through 2020 consistent with deployment trajectory analyzed in DOE’s Wind Vision report; not so after 2020

62
WIND POWER TECHNOLOGIES OFFICE
Current Low Prices for Wind, Future Technological Advancement, New EPA Regulations, and Direct Retail Sales May Support Higher Growth in Future, but Headwinds Include… • Phase-down of federal tax incentives • Continued low natural gas and wholesale electricity prices • Modest electricity demand growth • Limited near-term demand from state RPS policies • Inadequate transmission infrastructure in some areas • Growing competition from solar in some regions
63
WIND POWER TECHNOLOGIES OFFICE
Conclusions • Annual wind capacity additions surged in 2015, w/ significant additional new
builds anticipated over next five years in part due to PTC extension
• Wind has been a significant source of new electric generation capacity additions in the U.S. in recent years
• Supply chain has been under some duress, but domestic manufacturing content for nacelle assembly, blades, and towers is strong
• Turbine scaling is significantly boosting wind project performance, while the installed cost of wind projects has declined
• Wind power sales prices remain near all-time lows, enabling economic competitiveness despite low natural gas prices
• Growth beyond current PTC cycle remains uncertain: could be blunted by declining federal tax support, expectations for low natural gas prices, and modest electricity demand growth
64
WIND POWER TECHNOLOGIES OFFICE
For More Information... See full report for additional findings, a discussion of the sources of data used, etc.
• http://energy.gov/eere/wind
To contact the primary authors • Ryan Wiser, Lawrence Berkeley National Laboratory
510-486-5474, [email protected] • Mark Bolinger, Lawrence Berkeley National Laboratory
603-795-4937, [email protected]
Berkeley Lab’s contributions to this report were funded by the Wind Power Technologies Office, Office of Energy Efficiency and Renewable Energy of the U.S. Department of Energy under Contract No. DE-AC02-05CH11231. The authors are solely responsible for any omissions or errors contained herein.


