
Emilio Di Lorenzo – Research engineer – Siemens Industry Software nv PhD candidate at KU Leuven and University of Naples "Federico II" [email protected]
DYNAMIC CHARACTERIZATION OF WIND TURBINE GEARBOXES BY USING OPERATIONAL MEASUREMENTS
Optiwind Open Project Meeting, Leuven, Belgium 02/12/2015
E. Di Lorenzo, S. Manzato

Agenda
1. Introduction
2. Rotor analysis
1. MBC transformation
2. HPS method
3. Validation cases
4. Conclusions
3. Gearbox analysis
1. Operational Modal Analysis
2. Order-Based Modal Analysis
3. Validation cases
4. Conclusions

Gearbox analysis
Development and validation of a methodology for modal analysis of a gearbox in operational conditions (test rig)
Building further on existing “Order Tracking” and “Operational Modal Analysis” techniques, a new method need to be developed
The developed algorithms will be evaluated by means of numerical simulations (flexible MBS model) and real experimental data (test rig measurement)
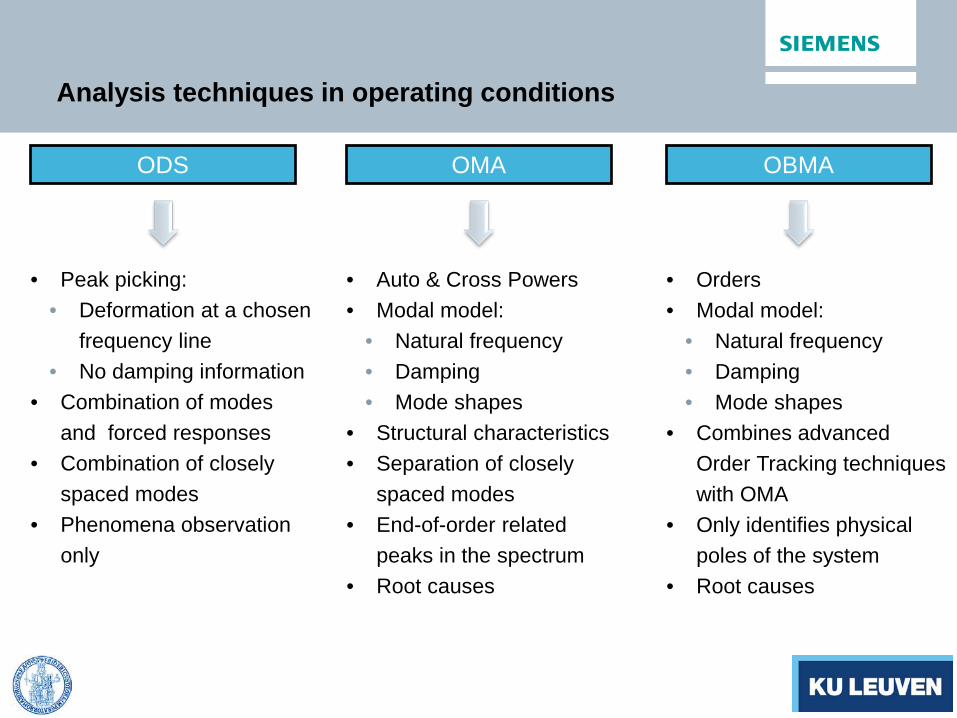
Analysis techniques in operating conditions
OMA OBMA ODS
• Peak picking: • Deformation at a chosen
frequency line • No damping information
• Combination of modes and forced responses
• Combination of closely spaced modes
• Phenomena observation only
• Auto & Cross Powers • Modal model:
• Natural frequency • Damping • Mode shapes
• Structural characteristics • Separation of closely
spaced modes • End-of-order related
peaks in the spectrum • Root causes
• Orders • Modal model:
• Natural frequency • Damping • Mode shapes
• Combines advanced Order Tracking techniques with OMA
• Only identifies physical poles of the system
• Root causes

Operational Modal Analysis
Run-up time data Auto and cross- powers
290.000.00 s
1.00
0.00Am
plitu
de
760.000.00 Hz
1.00
0.00
Ampl
itude
F AutoPow er Point8:+X
Operational Polymax Modal parameters
f o f v s f v o v vv v d v s f v sv v f o s s v o s sv v f v v v f s sv v f v v v f o v vv s d v v f v v v
f d f o v d s o v vd d f v d v o v v s
o s d v v o f v v v f of s v s v v d v v o v sf v f v v v f s v v s o
o v s f d v d s s s s fv s s d f s o s v v v s fv o v v d v v v v s v o v s ff v v f d v v s v s o v v s fv v s s s s o s d s s v v s f o s fs s s s d s v v d s s v v s f s sf v o o v f o d s v v f s s f v v f v ff o v v v o f f s v v f v v f v vv v fv v v v v v d f s s v d s v f s sf v f
f v v o v f f s v v f s v f v v f o v f fs v v s v v v s s v f s v f v s v f v f fv s o s s v o v s s v f s v f v vv f s f fv s f s v s v d s s v s s s d s s f v v sdf s f v v f v v s v v s s s v s v f s v vfv v f s v o d o f v v v s s s v v v f f v fv v f v v v f f f s v v d s s f v v f f s f fv s f s s v v d s s v s d s s s s s f f s v f
o f v f s v o v f v s v v o d v s f v s v v v vv s v d v v v v f o d v v v v s s v s v f s fv s s d s s v v s f s s s s s s s v s s v s sv s v s s s s v d v v s s v s s s f s s s s fv s o v s s s s s s f d s s s o d s s f s s s s df v v d s s s v s v d v s v s s s f s s s s vv s o v d v o s v v f v f s s v o d s s f s v v s fv v v v f o s f s v v o d f f v v v v f s v f v s f s fs v f s f v v v s v s f s s v s s v v s s s v s s v v dv s d s d f s f s v v f s v v v v s v s s o v f s s o v s fs s v s s v s f s v s v s s s s s s s d s v s s s s v v s d
222222223333333333444444444455555555556Natural
Frequency [Hz]
[50-70]
[60-80]
[120-140] Damping
[%]
[0,2-0,4]
[0,5-0,7]
[0,01-0.15]

End-of-order effect
100.00 600.00 Hz40.00
60.00
dB(Pa)
2
200 150
100.00 600.00 Hz
1200.00
6000.00
rpm
Z-Ax
is: m
easu
red
track
ing
20.00
80.00
dB Pa2
200 150
end-of-order related peaks at 150 Hz (order 1.5 at 6000 rpm) and 200 Hz (order 2 at 6000 rpm) are identified as physical poles of the system
Order 1.5
Order 2
end-of-order peak
end-of-order peak
K. Janssens et al. – Order-based resonance identification using Operational PolyMAX

Order Based Modal Analysis
)cos()( 020 ϕ+ωω= trmtfx
)sin()( 020 ϕ+ωω= trmtf y
)(tf x
)(tf y)(ty
output 2 (correlated) inputs m
ω0
r
)()()()()( )(:,)(:, ωω+ωω=ω yfyxfx FHFHY
( ) )()()()( 0)(:,)(:,20 ω−ωδω−ωω∝ω fyfx jHHY
Technique to identify modal parameters from operational data during a run-up/run-down
Hypothesis: the measured response is mainly caused by rotational excitation
The structure is excited by a
rotating mass with increasing frequency

Order Based Modal Analysis
)cos()( 020 ϕ+ωω= trmtfx
)sin()( 020 ϕ+ωω= trmtf y
)(tf x
)(tf y)(ty
output 2 (correlated) inputs m
ω0
r Applications
Jet engine
Rotor blade stability
Turbine
Rotating machinery

Order Based Modal Analysis
310.000.00 s
1700.00
100.00
Ampl
itude
rpm
0.07
0.07
Ampl
itude
F 139:Tacho_P2
179.73179.24 s
1181.11
500.00
Ampl
itude
rpm
0.07
0.07
Ampl
itude
F 139:Tacho_P2
310.000.00 s
1700.00
100.00
Ampl
itude
rpm
0.07
0.07
Ampl
itude
F 139:Tacho_P2F 139:Tacho_P2
142.21141.59 s
985.41
500.00
Ampl
itude
rpm
0.07
0.07
Ampl
itude
F 139:Tacho_P2F 139:Tacho_P2
16.000.00 orderPoint5:+X (CH5)
1600.00
200.00
rpm
Tach
o_P2
(T1)
-10.00
-110.00
dB g
24.07
11.61
Spectrum Point5:+X/Point8:+X WF 700 [202.07-1599.7 rpm]
1600.00200.00 rpmTacho_P2 (T1)
1.00
0.00
Ampl
itude
F Order 11.61 Point5:+X/Point8:+1210.20349.66 rpm
Tacho_P2 (T1)
1.00
0.00
Ampl
itude
F Frequency 24.07 Hz Point5:
140.9954.61 LinearHz
Derived Frequency
-40.50
-80.50
dBg
s s vv v vs s vs s ss s vs s vs s vs s ss s ss s vv s vs s vs s vs s vs s ss s ss s vs s vs s ss s ss s vs s ss s ss s vs s vs s vs s ss s vs s ss s ss s ss s ss s ss s ss s ss s vs s vs s ss s s
424344454647484950515253545556575859606162636465666768697071727374757677787980
Tacho signal Butt-joint correction Order Tracking (OT) technique
Order-based Polymax
Modal parameters
Natural Frequency
[Hz]
[50-70]
[60-80]
[120-140] Damping
[%]
[0,2-0,4]
[0,5-0,7]
[0,01-0.15]

Order tracking techniques
Time domain sampling based Fast Fourier Transform order tracking Based upon the standard FFT analysis Requires time domain data sampled with a constant Δt FFT kernel is based on constant frequency sines/cosines
Angle domain computed order tracking Resamples constant Δt sampled data to constant angular intervals The angle domain data is processed through the use of FFTs Accurate tachometer signal is needed
𝑎𝑛 = 1𝑁�𝑥(𝑛∆𝑡) cos(2𝜋𝑓𝑛𝑛∆𝑡)𝑁
𝑛=1
𝑏𝑛 = 1𝑁�𝑥(𝑛∆𝑡) 𝑠𝑠𝑛(2𝜋𝑓𝑛𝑛∆𝑡)𝑁
𝑛=1
𝑎𝑛 = 1𝑁�𝑥(𝑛∆α) cos(2𝜋𝑜𝑛𝑛∆α)𝑁
𝑛=1
𝑏𝑛 = 1𝑁�𝑥(𝑛∆α) 𝑠𝑠𝑛(2𝜋𝑜𝑛𝑛∆α)𝑁
𝑛=1

Order tracking techniques
𝑎𝑛 = 1𝑁�𝑥(𝑛∆𝑡) cos 2𝜋 � 𝑜𝑛 ∗ ∆𝑡 ∗
𝑟𝑟𝑟60
𝑑𝑡𝑛∆𝑡
0
𝑁
𝑛=1
𝑏𝑛 = 1𝑁�𝑥(𝑛∆𝑡) sin 2𝜋 � 𝑜𝑛 ∗ ∆𝑡 ∗
𝑟𝑟𝑟60
𝑑𝑡𝑛∆𝑡
0
𝑁
𝑛=1
Time Variant Discrete Fourier Transform Instanteneous frequency of kernel matches
frequency of order of interest Post-calculation to separate close/crossing orders Computationally efficient Essentially it is resampling the kernel of the Fourier
transform instead of resampling the data
Vold-Kalman filter based order tracking Extracts orders time histories Computationally demanding Able to separate close/crossing orders
�1 −𝑐(𝑛) 10 0 𝑟(𝑛)�
𝑥(𝑛 − 2)𝑥(𝑛 − 1)𝑥(𝑛)
=𝜀(𝑛)
𝑟(𝑛)(𝑦 𝑛 − 𝜂(𝑛))

Vold-Kalman filter based order tracking
Any drawback? It is not suitable for real time processing because of the long computational
time
Some math!!! Structural equation
Data equation
𝑦 𝑛 = 𝑥(𝑛)𝑒𝑗Θ(𝑛) + 𝜂(𝑛)
𝑥 𝑛 − 2𝑥(𝑛 + 1) + 𝑥(𝑛 + 2) = 𝜀(𝑛)
Filtered signal = Complex envelope Measured data Instantaneous frequency of the sine wave Noise components
Data equation describes the relationship between the measured data y(n) and the complex envelope x(n)
Θ 𝑛 = �𝜔(𝑠)∆𝑡𝑛
𝑖=0
Locally, the complex envelope x(n) is approximated by a low order polynomial. The polynomial order designates the number of filter poles (i.e: 2).

Test cases
Test rig Wind turbine gearbox 8 DOF system

Test-rig configuration
Proto Version Ratio P2 3.0 MW 50 Hz 106.5 P3 3.2 MW 50 Hz 99.5
Step Load Speed 1 0% Standstill (shaker) 2 33% run up, 200-1500 rpm (5 rpm/s) 3 33% constant speed, 1200 rpm 4 33% constant speed, 800 rpm 5 66% run up, 200-1500 rpm (5 rpm/s) 6 66% constant speed, 1200 rpm 7 66% constant speed, 800 rpm 8 100% run up, 200-1500 rpm (5 rpm/s) 9 100% constant speed, 1200 rpm 10 100% constant speed, 800 rpm
P2
P3
Component No. of measurement
locations Tested gearbox (gearbox 1)
P3 202 Counter gearbox (gearbox 2)
P2 27 Test rig Cassette + Motors CASS 27
Total: 256

750.000.00 Hz
-40.00
-90.00
dBg2
1.00
0.00
Ampl
itude
F CrossPow er BH:5:+X/Point8:+X
1
2
3
OBMA processing: Why?
Order-based Modal Analysis
End-of-order related peaks identified as physical
poles of the system using classical OMA technique:
Frequency no. Rpm (P3) Order (P3) Order (P2)
1 1500 8,52 8
2 1500 12,4 11,6
3 1500 27 25,4
Order 8,52 = 8th order counter gearbox
Order 12,4 = 2nd gear mesh (Intermediate Speed Stage)
Order 27 = 1st gear mesh (High Speed Stage)

Modal analysis on operational wind turbine gearbox
Crosspower for classical OMA analysis Orders 27 extracted for OBMA analysis
Frequency [Hz]
Time [s]

Modal analysis on operational wind turbine gearbox
50 Hz component disturbance
End of order spurious peaks
Standard Operational Modal Analysis
Low quality and low confidence estimated Modal Model due to end-of
order peaks and harmonic disturbances
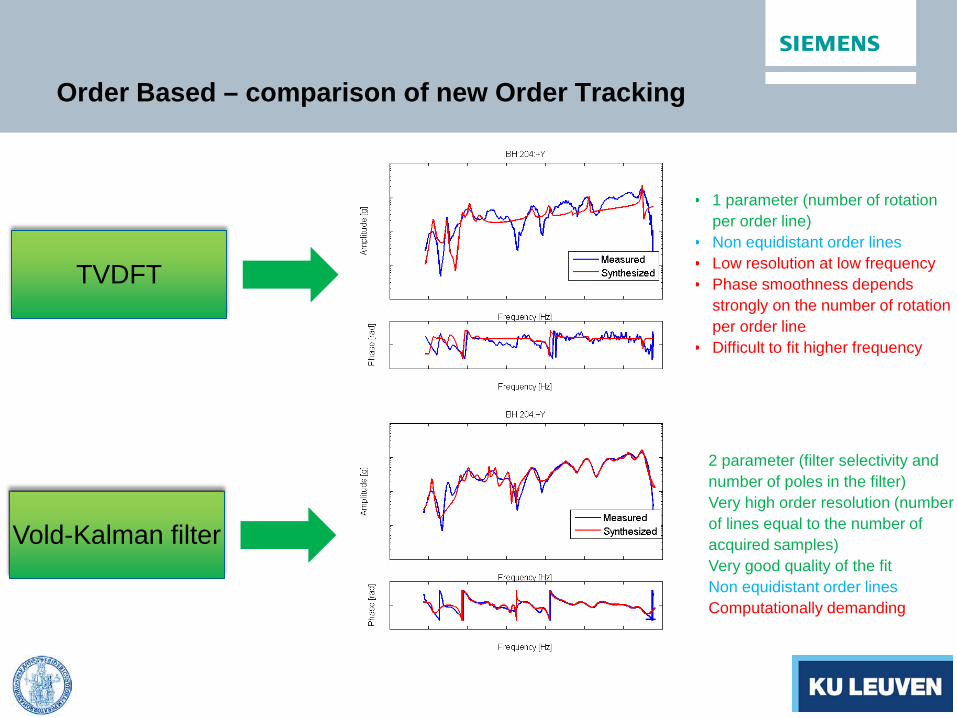
Order Based – comparison of new Order Tracking
TVDFT
Vold-Kalman filter
• 1 parameter (number of rotation per order line)
• Non equidistant order lines • Low resolution at low frequency • Phase smoothness depends
strongly on the number of rotation per order line
• Difficult to fit higher frequency
• 2 parameter (filter selectivity and number of poles in the filter)
• Very high order resolution (number of lines equal to the number of acquired samples)
• Very good quality of the fit • Non equidistant order lines • Computationally demanding

OMA vs OBMA
Gearbox modal parameters OMA
Frequency [Hz] Damping [%] [15-25] 0,26 [45-55] 1,20 [95-105] 1,56 [145-155] 0,49 [180-190] 2,80 [210-220] 1,16 [245-255] 0,35 [300-310] 0,19 [365-375] 0,24 [460-470] 1,14 [510-520] 1,73 [550-560] 1,28 [580-590] 0,61 [610-620] 0,93 [640-650] 0,54
Gearbox modal parameters OBMA + VK
Frequency [Hz] Damping [%] [100-110] 1,97 [180-190] 2,10 [200-210] 1,60 [220-230] 3,33 [245-255] 0,37 [270-280] 1,21 [295-305] 1,39 [320-330] 0,67 [360-370] 2,21 [400-410] 2,00 [450-460] 1,45 [460-470] 1,98 [510-520] 2,39 [530-540] 1,91 [550-560] 2,29 [580-590] 1,68 [610-620] 1,26 [640-650] 1,02
End-of-Order related poles

Order tracking techniques for OBMA processing
Gearbox modal parameters OBMA + TVDFT
Frequency [Hz] Damping [%] [100-110] 0,66 [140-150] 0,19 [180-190] 1,55 [200-210] 1,46 [220-230] 2,34 [360-370] 1,16 [400-410] 0,71 [460-470] 0,21 [510-520] 0,21 [640-650] 0,10
Gearbox modal parameters OBMA + VK
Frequency [Hz] Damping [%] [100-110] 1,97 [180-190] 2,10 [200-210] 1,60 [220-230] 3,33 [245-255] 0,37 [270-280] 1,21 [295-305] 1,39 [320-330] 0,67 [360-370] 2,21 [400-410] 2,00 [450-460] 1,45 [460-470] 1,98 [510-520] 2,39 [530-540] 1,91 [550-560] 2,29 [580-590] 1,68 [610-620] 1,26 [640-650] 1,02
Conclusions
A methodology for extending the use of Operational Modal Analysis (OMA) to rotating machineries has been proposed as a combination of Order Tracking (OT) and OMA techniques
Different OT technique have been applied to several test cases both in a simulation and a test environment
FUTURE DIRECTIONS • Order-Based Modal Analysis will be applied in the automotive and railway domain • Some more OT techniques based on the wavelet transform will be analyzed in order to
improve the accuracy of the results

Emilio Di Lorenzo – Research engineer – Siemens Industry Software nv PhD candidate at KU Leuven and University of Naples "Federico II" [email protected]
Thank you!


