
Lake Eutrophication Modeling and WiLMS
Paul McGinley & Nancy TurykCenter for Watershed Science & Education
UW-Stevens Point
2014 Wisconsin Lakes PreConventionWorkshop
Tentative Outline/Approach• Overview – Eutrophication & Modeling• Introductions• First Model– back_of_the_envelope• Introduce & discuss details as we work
through a few examples • Other Models• Time for your projects
• Please question / interrupt / stop us!• Break at 2:40 (but feel free to move around!)

• This is only a few hours…and a new workshop• We aren’t discussing everything…• Some background /Use WiLMS• Context with respect to other models• Learn more about your needs / suggestions for
developing this course
the3
hourversion

Eutrophication
• “Process of an ecosystem becoming more productive by nutrient enrichment stimulating primary producers”– Walter Dodds, Freshwater Ecology
• Cultural eutrophication- nutrient input increased by humans

Trophic State
• Level of ecosystem productivity
• Oligotrophic - “few” “foods”• Eutrophic – “many” “foods”

Implications of Trophic State
• Biomass quantity• Types of organisms• Light penetration• Dissolved oxygen• Algal toxins
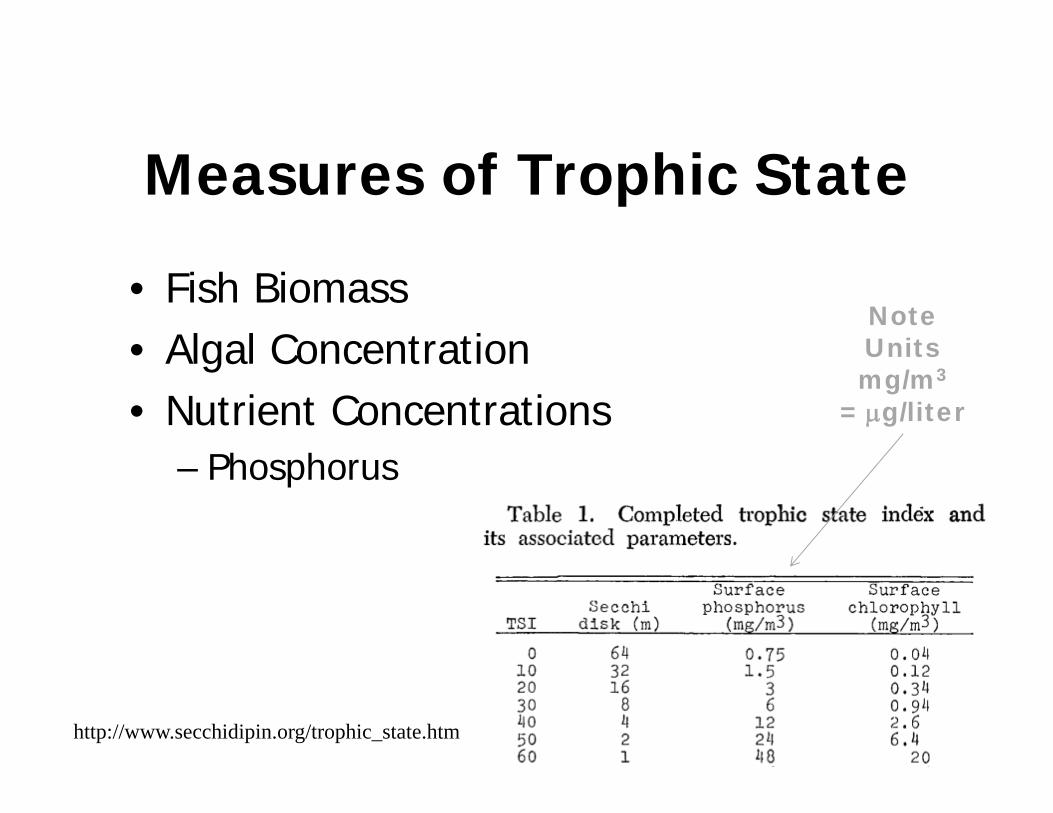
Measures of Trophic State
• Fish Biomass• Algal Concentration• Nutrient Concentrations
– Phosphorus
http://www.secchidipin.org/trophic_state.htm
NoteUnitsmg/m3
= g/liter
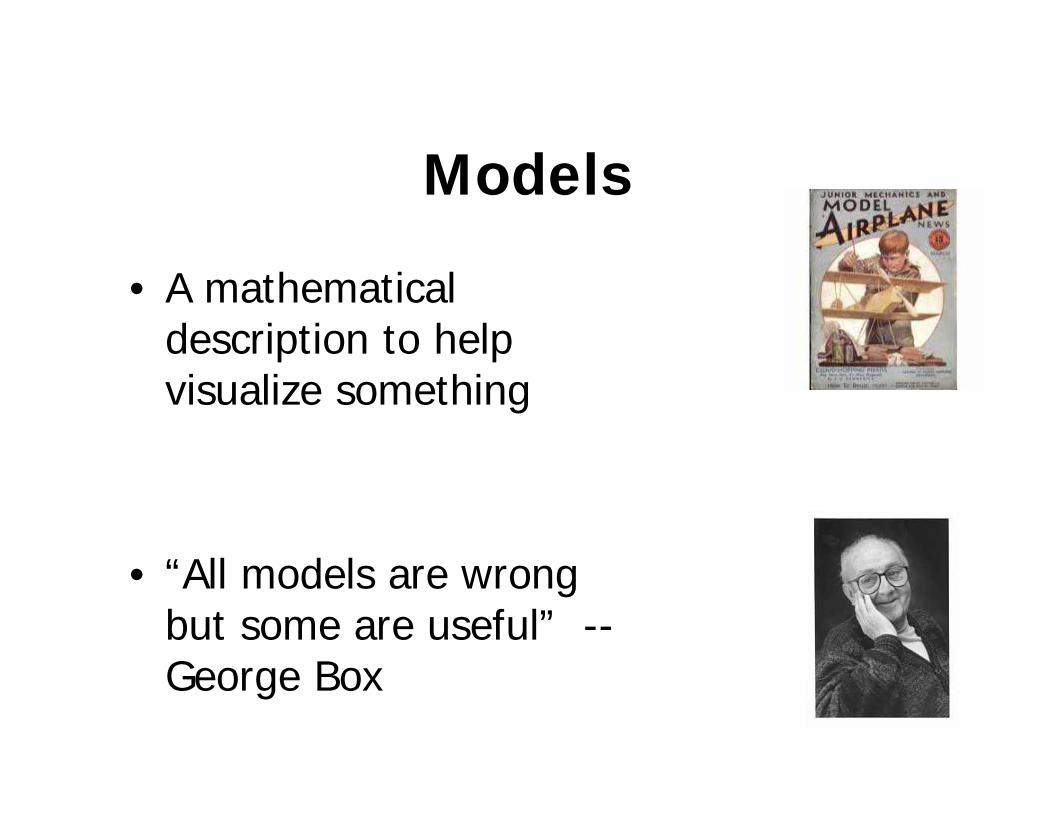
Models
• A mathematical description to help visualize something
• “All models are wrong but some are useful” --George Box

Models
• A mathematical description to help visualize something
• inputsoutputs
OurGoal!

Introductions
• What do you hope to get out of the next few hours?
• How might / do you use eutrophication modeling?
• Name / County / Lake(s) / Affiliation

Our First Model
• Goal– predict the P concentration
Given• The amount of P entering the lake• The amount of water entering the lake

Our First Model
• Goal– predict the P concentration
Given• The amount of P entering the lake• The amount of water entering the lake

DrawingPhosphorus
Entering
Phosphorus leavingIn water
WaterEntering
~Mix~

How does this calculate concentration?
PhosphorusEntering
Phosphorus leavingIn water
WaterEntering
~Mix~
Concentration of P = CP = Mass of Phosphorus /Volume of Water
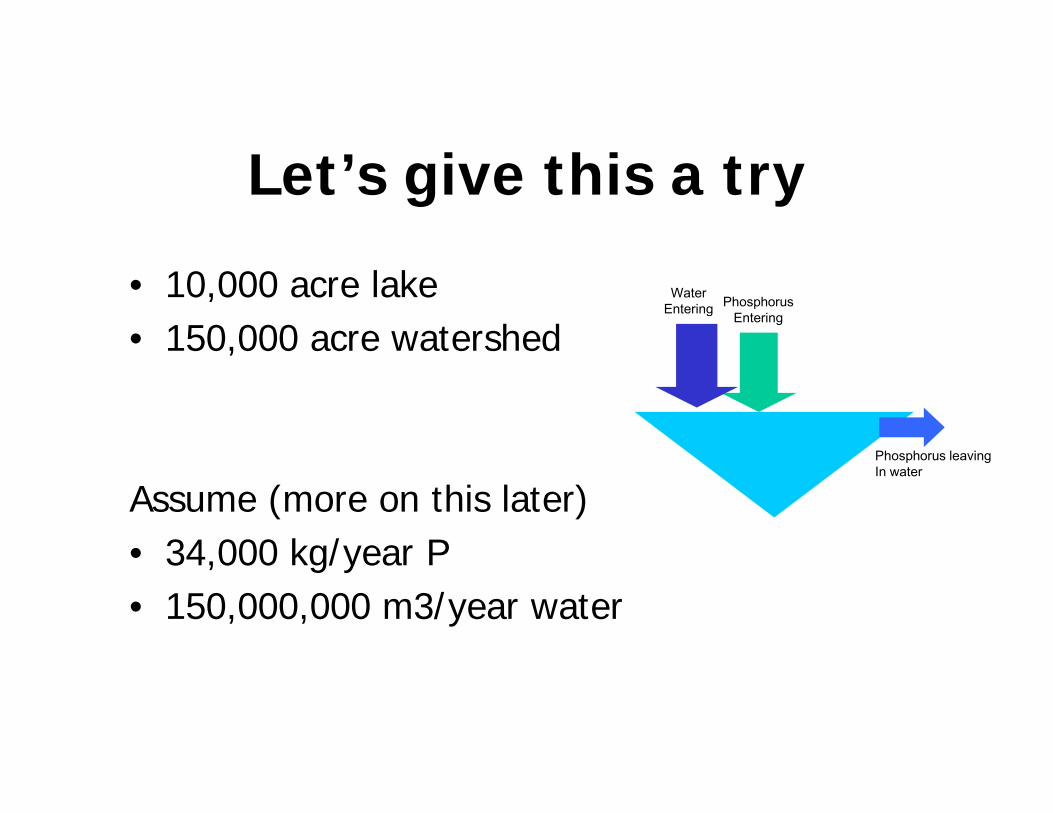
Let’s give this a try
• 10,000 acre lake• 150,000 acre watershed
Assume (more on this later)• 34,000 kg/year P• 150,000,000 m3/year water
PhosphorusEntering
Phosphorus leavingIn water
WaterEntering

“Simple Model”
• Concentration of P
• CP = Mass of P / Volume of Water
• CP = 34,000 kg P/yr/ 150,000,000 m3/yr

“Simple Model”
• Concentration of P
• CP = Mass of P / Volume of Water
• CP = 34,000 kg P/yr/ 150,000,000 m3/yr
• CP = 34,000,000,000mgP/y/ 150,000,000m3/y

“Simple Model”
• Concentration of P
• CP = Mass of P / Volume of Water
• CP = 34,000 kg P/yr/ 150,000,000 m3/yr• CP = 34,000,000,000mg P/yr/ 150,000,000m3/yr
• CP = 222 mg/m3 = 222 ug/liter

…think about our assumptions
• Outflow conc. same as lake conc. (lake completely mixed)
• Uniform conditions (“steady-state”)

Review these
• Steady Conditions– The P concentration doesn’t change with time– The amount of P in the lake is constant
– What goes in must be equal to what goes out

Review these
• Steady Conditions– The P concentration doesn’t change with time– The amount of P in the lake is constant
– What goes in must be equal to what goes out
P IntoLake
=P
FlowingOut of Lake

Take a look at some data
Lathrop and Panuska 1998
222 ug/l

Not a very good model
• Why?
• What happens to P in a lake?

Not a very good model
• Why?
• What happens to P in a lake?
• Another observation on modeling– “Everything should be made as
simple as possible, but no simpler” A. Einstein
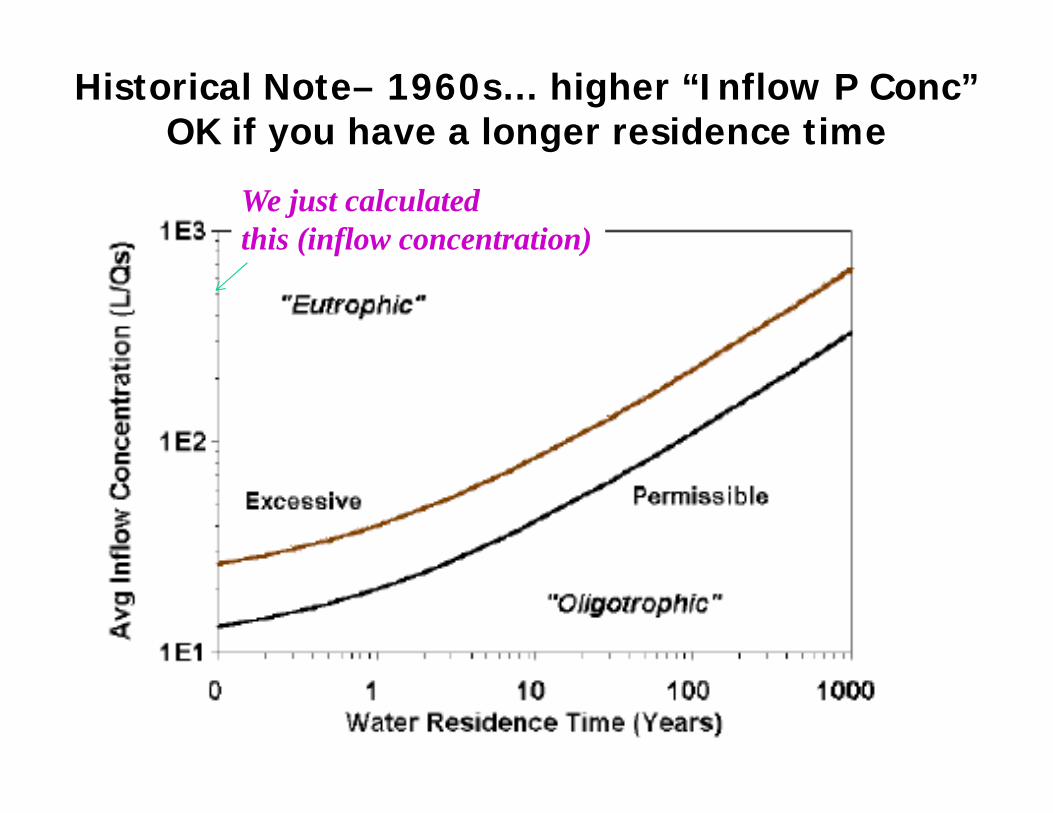
Historical Note– 1960s… higher “Inflow P Conc” OK if you have a longer residence time
We just calculatedthis (inflow concentration)

“Vollenweider Plots”

Second ModelPhosphorus
Entering
Phosphorus leavingIn water
WaterEntering
“mean total P concentration is amount of phosphorus divided by volume of water and diminished by retention
term as P apparently lost to sediments” (Nurnberg, 1984)

Second ModelPhosphorus
Entering
Phosphorus leavingIn water
Phosphorus settlingIn lake
WaterEntering
“mean total P concentration is amount of phosphorus divided by volume of water and diminished by retention
term as P apparently lost to sediments” (Nurnberg, 1984)

…just make a few assumptions
• Lake completely mixed• Outflow conc. same as lake conc.• Uniform conditions (“steady-state”)• Sedimentation proportional to lake conc.

• Uniform (“steady-state”) Conditions– The P concentration doesn’t change with time– The amount of P in the lake is constant
– What goes in must be equal to what goes out
P IntoLake
=P
FlowingOut of Lake
+P
LostTo
“Settling”
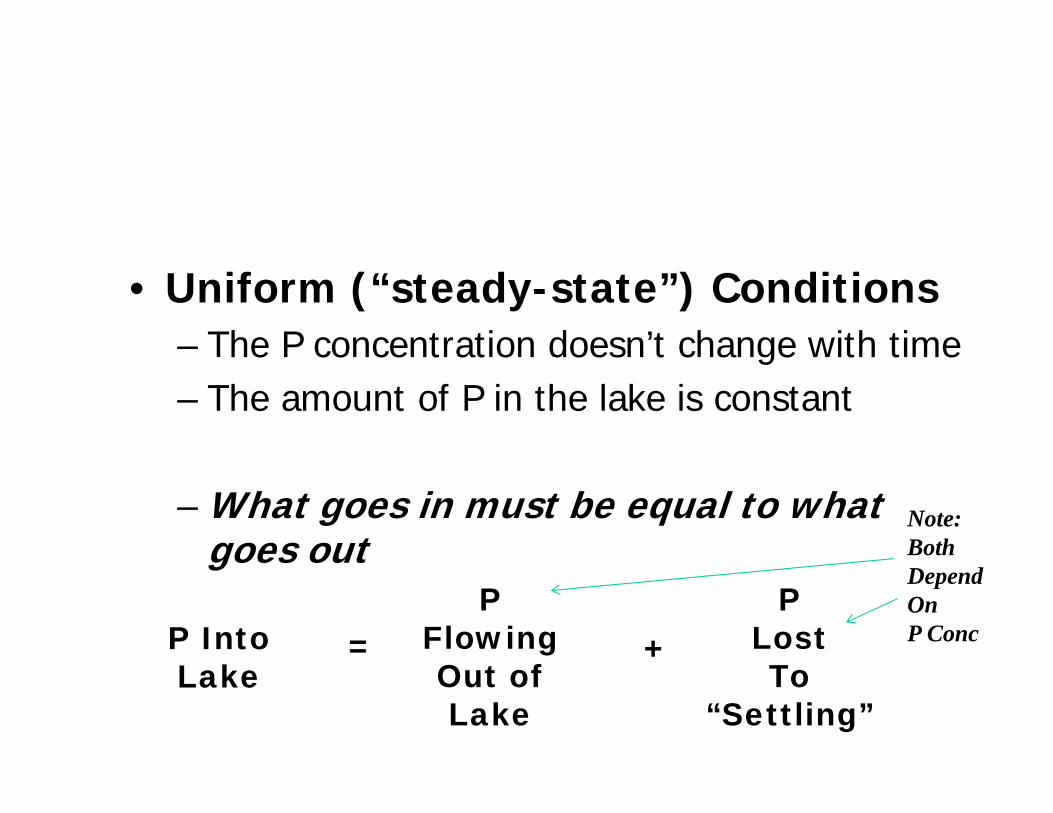
• Uniform (“steady-state”) Conditions– The P concentration doesn’t change with time– The amount of P in the lake is constant
– What goes in must be equal to what goes out
P IntoLake
=P
FlowingOut of Lake
+P
LostTo
“Settling”
Note:BothDependOnP Conc
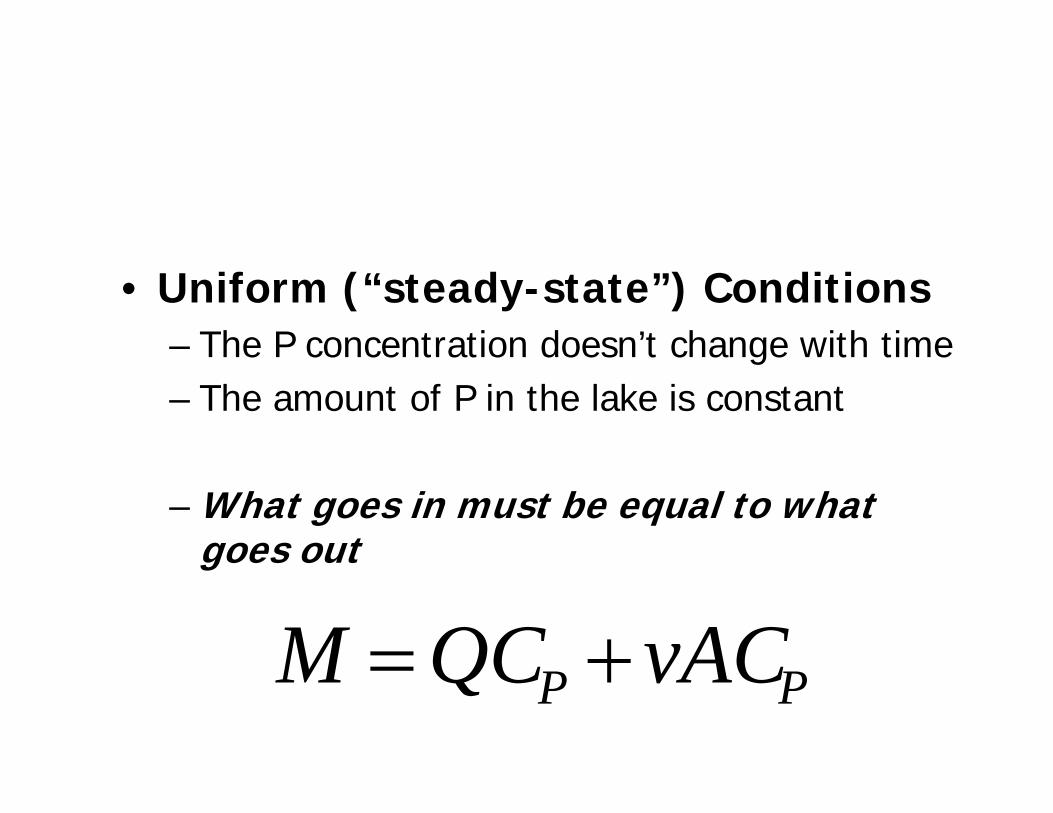
• Uniform (“steady-state”) Conditions– The P concentration doesn’t change with time– The amount of P in the lake is constant
– What goes in must be equal to what goes out
PP vACQCM

This looks a lot like our simple model…
vAQMCP
Phosphorus Concentration in Lake
Mass of Phosphorusper year entering lake
Amount of waterEntering lake in a year Settling term
(“settling velocity” * Area
With this added

Let’s give this a try
• 10,000 acre lake• 150,000 acre watershed
Assume • 34,000 kg/year P• 150,000,000 m3/year water• 40,500,000 m2 lake surface• 10 meter/year settling velocity
PhosphorusEntering
Phosphorus leavingIn water
WaterEntering

Our “Less Simple Model”
• Concentration of P
• CP = Mass of P/t / (Volume of Water/t+ Settling Velocity*Lake Area)
• CP = 34,000,000,000mg P/yr / (150,000,000m3/yr + 405,000,000m3/yr)
• CP = 62 ug/l (better?)

What does this have to do with WiLMS?
• WiLMS uses “empirical models”
• “Empirical Models” based fitting a group of lakes with different equations
• Most started similar to the simple steady-state mass balance method… then fit with some adjustment factors

• For example, our second model is similar to:
• Reckhow Natural Lake Model
ssP vq
LC
6.112.1
sP q
LC

These are not perfect fits…

These are not perfect fits…
NoteUnitsmg/m3
= g/liter

Brings us to WiLMS• Combine watershed export model &
lake response tool
• Estimate lake P concentration with knowledge of lake and P loading (external loads)
• Annual time-step

WiLMS

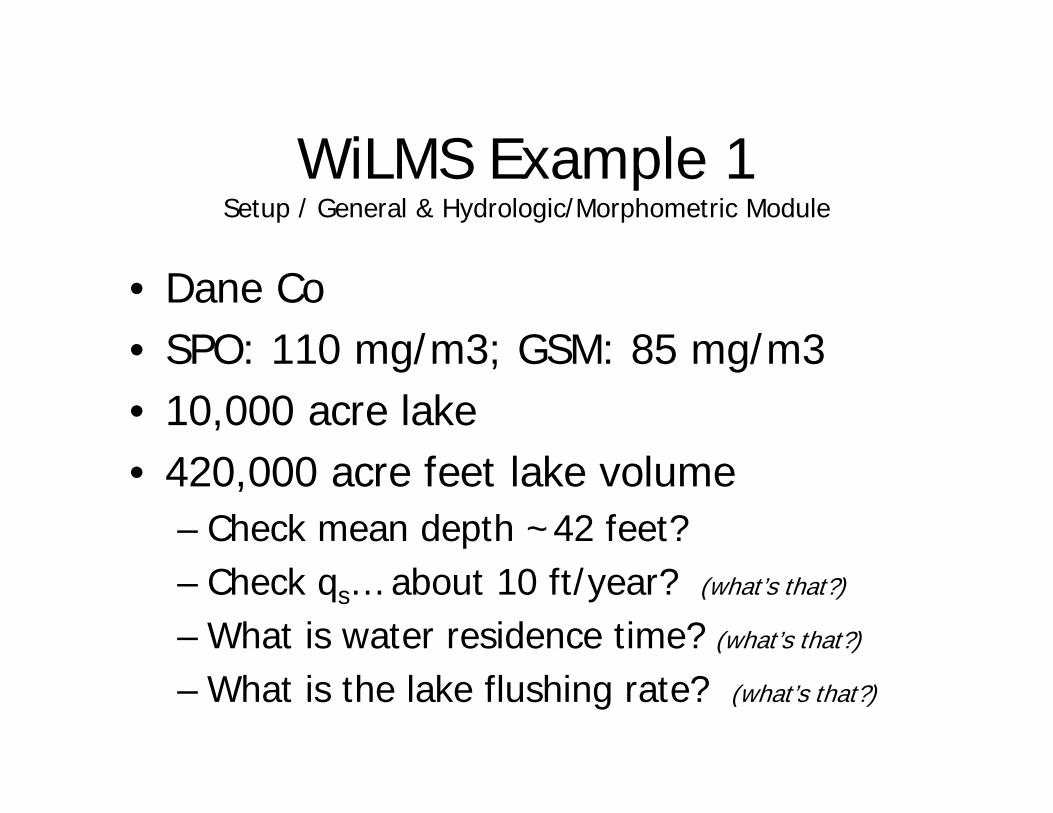
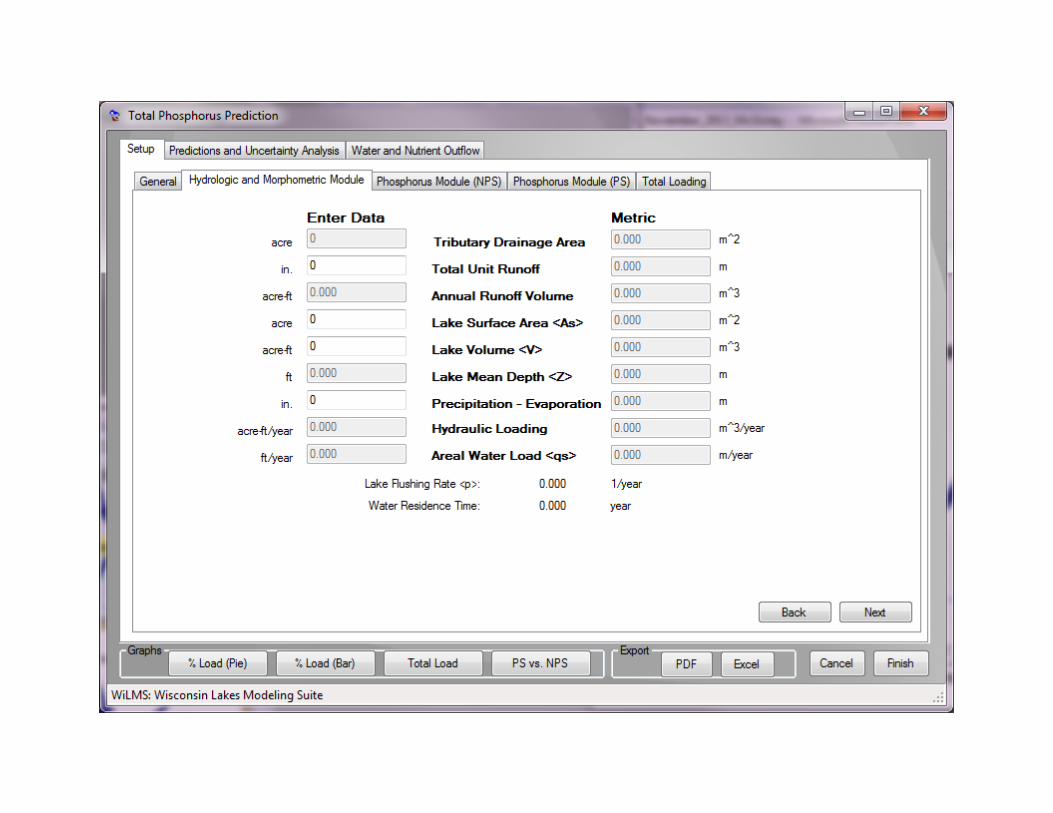
WiLMS Example 1 Setup / General & Hydrologic/Morphometric Module
• Dane Co• SPO: 110 mg/m3; GSM: 85 mg/m3• 10,000 acre lake• 420,000 acre feet lake volume
– Check mean depth ~42 feet?– Check qs… about 10 ft/year? (what’s that?)
– What is water residence time? (what’s that?)
– What is the lake flushing rate? (what’s that?)

First time using WiLMS on your computer?
• Will need to locate the County hydrology data file
• Use browse button on the data file –should go to the right location– then select

Example 1 Phosphorus Module (NPS)
• Row Crop 90,000 acres• Pasture Grass 30,000 acres• MD Urban 30,000 acres• Note that lake surface is already entered• Note loading in kg/ha-year “export rates”

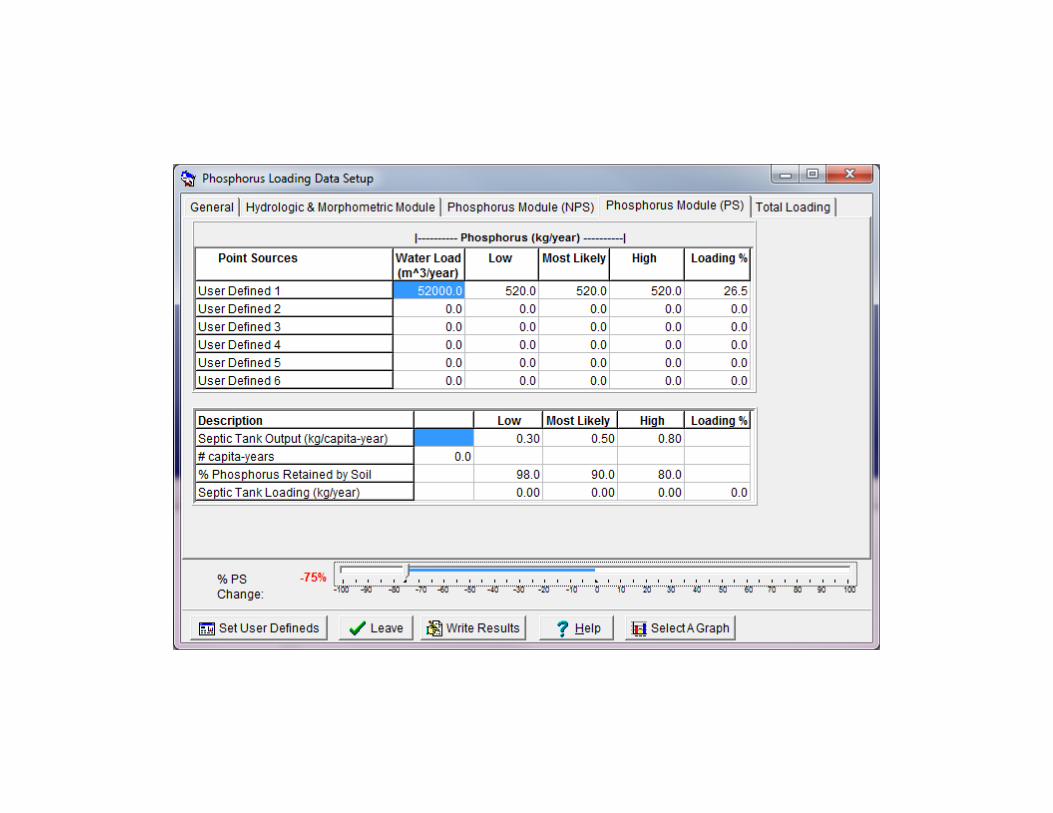
Example 1 Phosphorus Module (PS)
• Don’t enter anything here– Point sources and septic tank stuff

Example 1 (Total Loading)
• Nothing to enter here...– Review
• Total loading in lbs…. Around 100,000?• Should be all NPS… right?
– Leave – save as something (“Dane1”?)

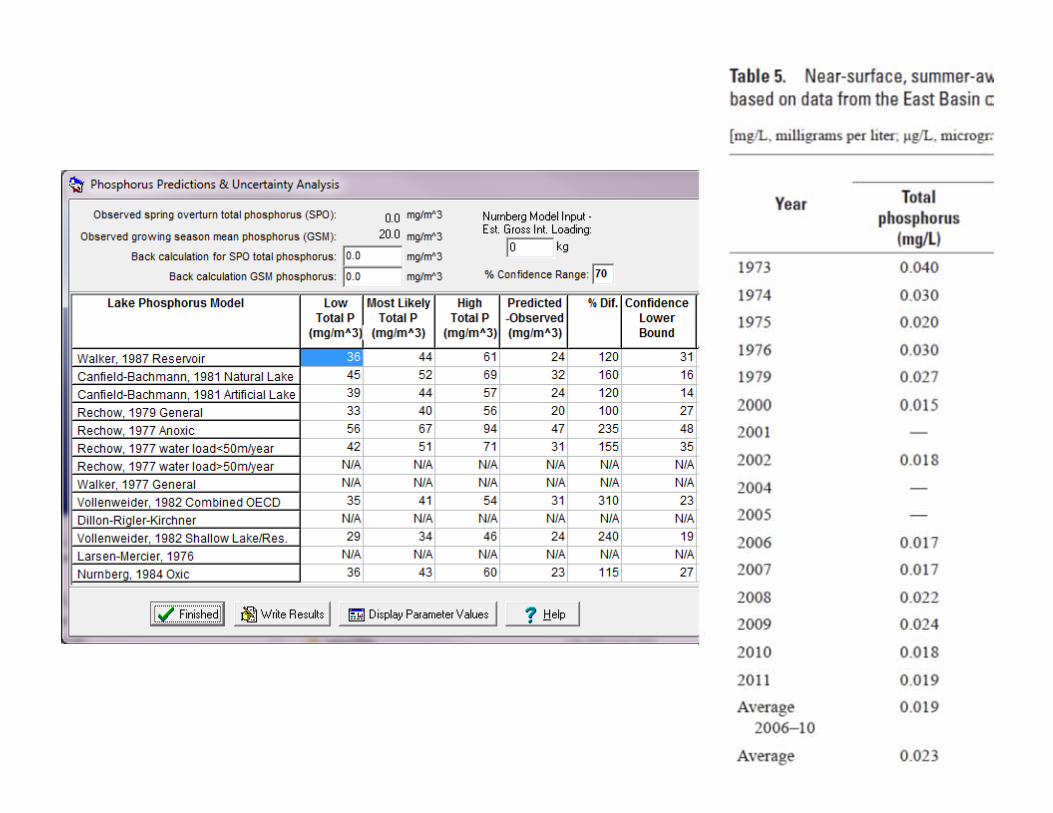
Example 1 (Models – Lake Total Phosphorus Prediction – Prediction & Uncertainty Analysis)
• Look at Results

• 13 empirical equations• TP Predictions• Difference from observed– that was input in the “Setup” screen (note that if both GSM
and SPO– the average will be used for ANN)• Uncertainty bounds - set confidence range• Parameter fit?– checks to see if the input fits within the model data set – if not it
indicates where it differs (N/A means it didn’t calculate) …. Page 18-21 in notes

Challenges: Annual Variations
• P Load (kg) to Lake (Lathrop and Panuska)

Challenges: Variations during the year

There is a lot of terminologyrelated to the P “settling”…
• Retention =fraction of the incoming P that is retained
» R = 1- (Cout/Cin)» See page 58, 68, 100 of notes» Therefore» Can show that R=vs/(vs+qs) and…» CP=(L/qs)(1-R)
• Volumetric Removal…Or kVL = vAs
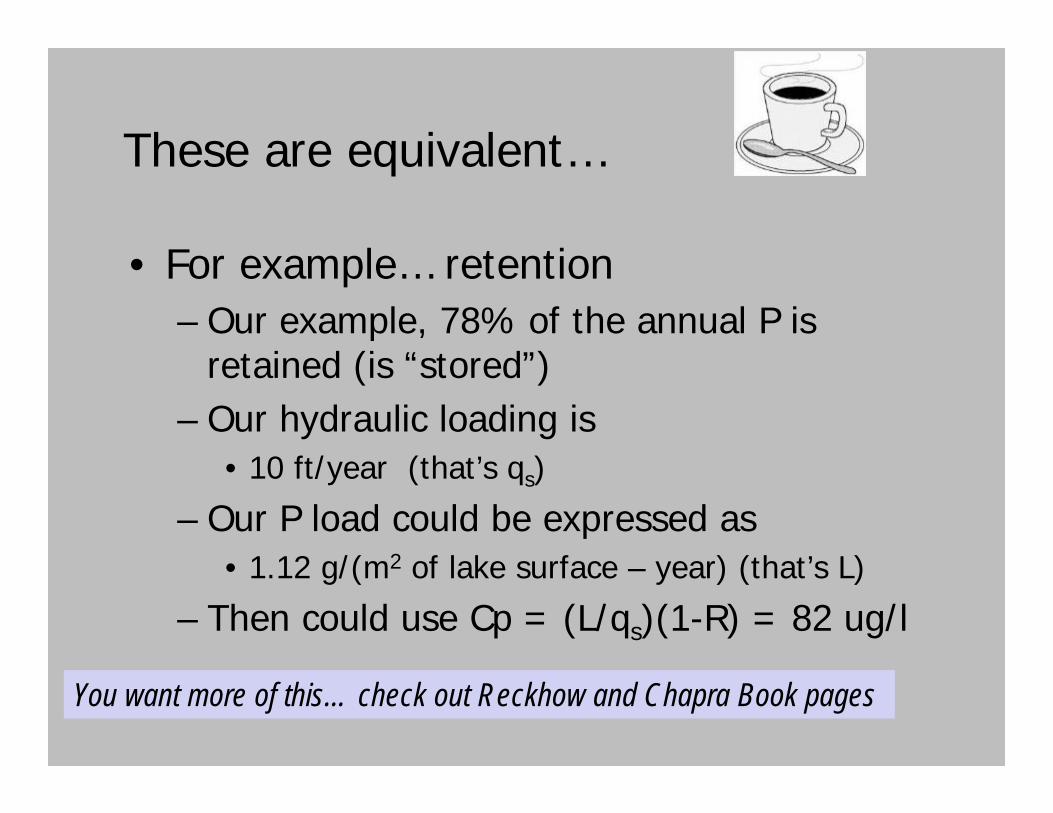
These are equivalent…
• For example… retention– Our example, 78% of the annual P is
retained (is “stored”)– Our hydraulic loading is
• 10 ft/year (that’s qs)
– Our P load could be expressed as • 1.12 g/(m2 of lake surface – year) (that’s L)
– Then could use Cp = (L/qs)(1-R) = 82 ug/l
You want more of this… check out Reckhow and Chapra Book pages

Historical Note
• 1960s/70s eutrophication / phosphorus• OECD (Organization for Economic
Cooperation and Development) Eutrophication Study (1970s)– 18 countries involved, in some, field
studies were initiated – US used small grants to encourage reports
on existing studies – Summarized in 1978 Report (Rast and Lee)
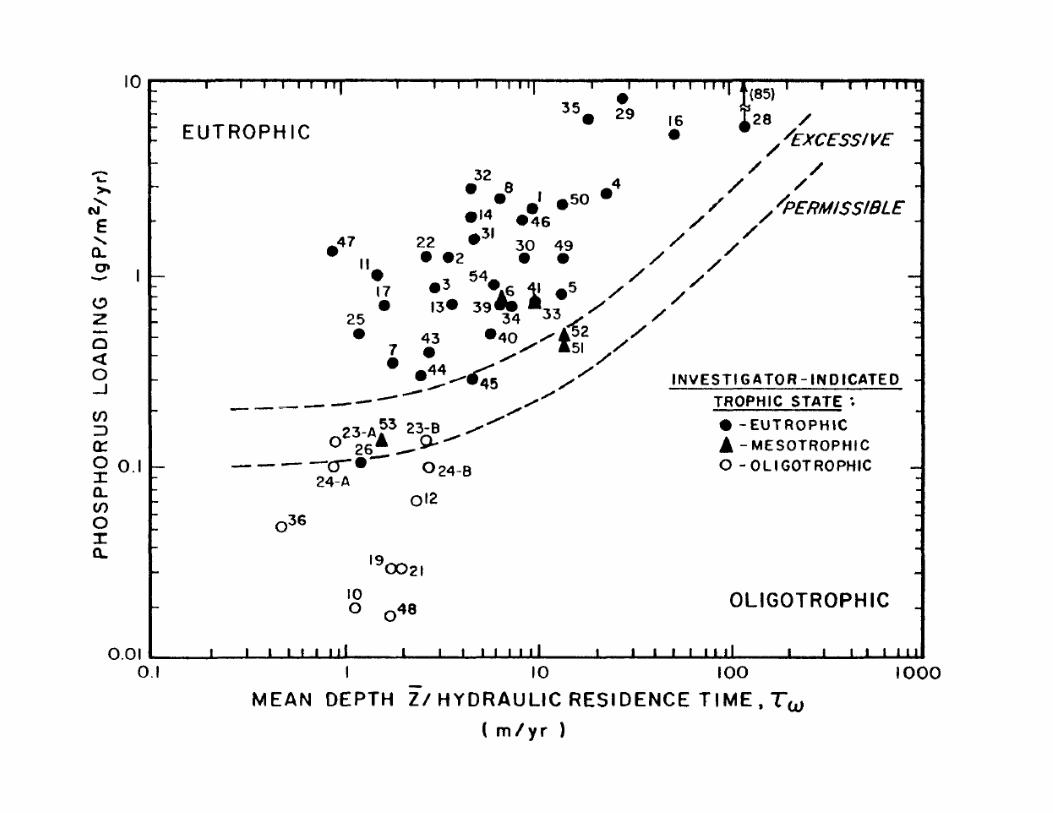

Mendota(22)
Camelot/Sherwood(4)
Redstone(31)
(mean depth/water res time) = qs
Lgram P
perm2-yr

Now Let’s Talk about Those Inputs
• Water Budget– Annual estimate for WiLMS– Need the total quantity of water entering
the lake– What happens to precip on land & water?
• Phosphorus Loading

Watershed - Water Budget• Hydrology
– Precipitation = ET + “Runoff”
– “Runoff” = baseflow + event flow
– “Baseflow” = percolation to saturated zone (groundwater)
– “Event flow” = surface runoff, saturation excess flow

Precip ?Evapotranspiration ?
Event FlowBaseflow

32”/year Evapotranspiration (22”/year)
Event FlowBaseflow

32”/year Evapotranspiration (22”/year)
Event FlowBaseflow
10 inches /year on 1 square mile…= 23,000,000 cubic feet /year= 0.7 cubic foot every second

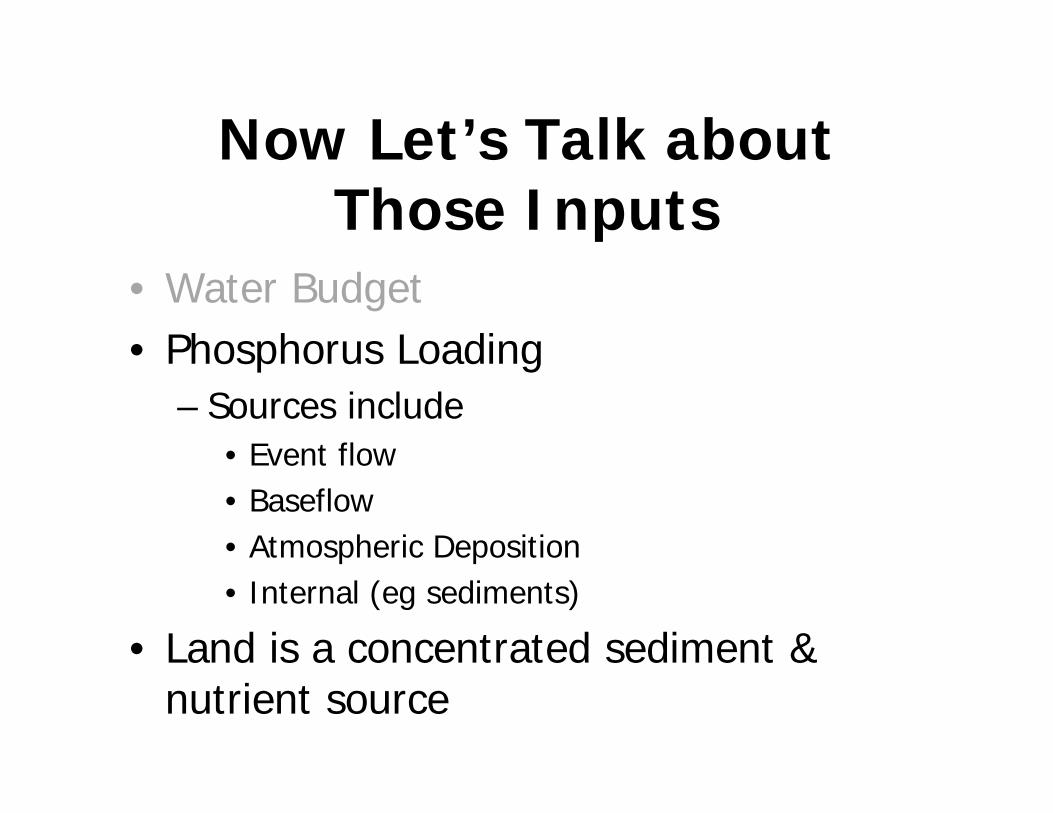
Now Let’s Talk about Those Inputs
• Water Budget• Phosphorus Loading
– Sources include• Event flow • Baseflow• Atmospheric Deposition• Internal (eg sediments)
• Land is a concentrated sediment & nutrient source

Total Suspended Solids…
0.01 gram/l 1,500 gram/l

Phosphorus
40 microgram P
/liter
300,000 microgram P
/liter

Add Energy & Opportunity
Nyle Brady and Raymond Weil 3/e
Contact with vegetation,
salts, sediment
22”
32”
10”
Land
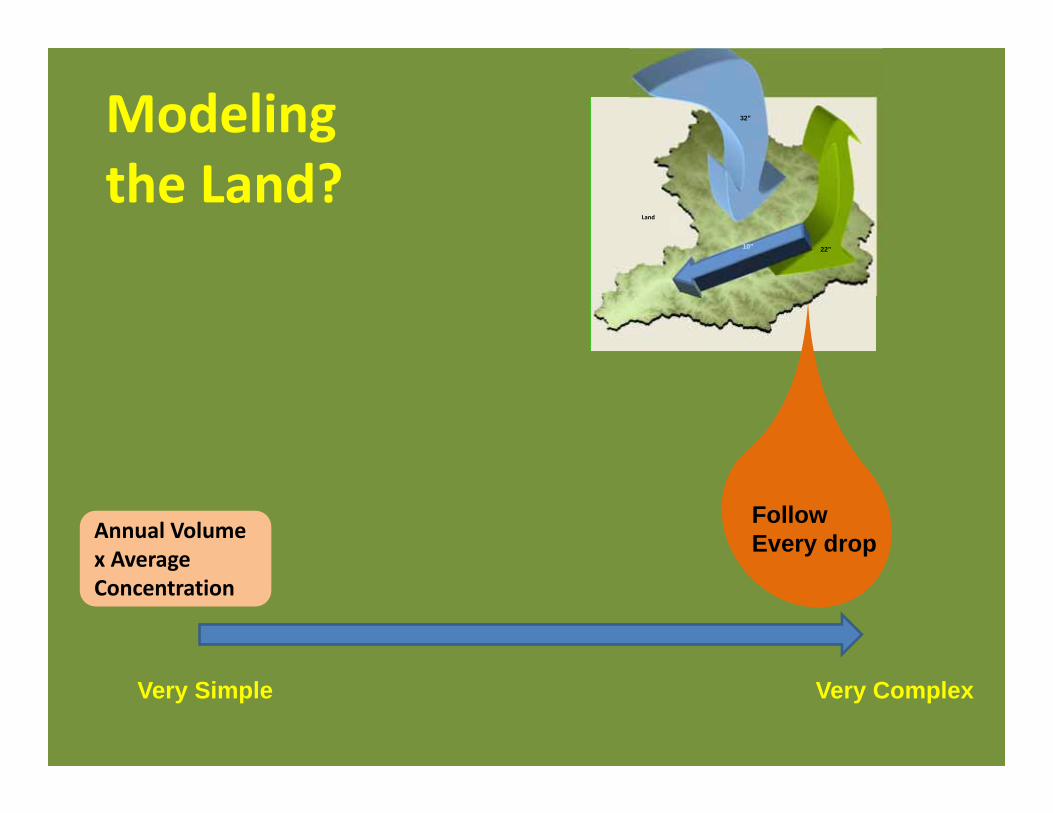
Modelingthe Land?
Very Simple Very Complex
Annual Volume x Average Concentration
Follow Every drop

22”
32”
10”
Land
Modelingthe Land?
Very Simple Very Complex
Annual Volume x Average Concentration
Follow Every drop
Annual ExportBased onLanduse
ShortTimeStep
SpatiallyVariable
Daily TimeStep
SpatialLumping
Avg.Annual
Spatially Variable

WiLMS Watershed Inputs• “Export”
– Pounds/acre-yr– Kg/hectare-yr– Pounds/square mile-yr
• Comment on unit conversions– Is pound/acre-yr the same as
kilogram/ha-yr?
• Watershed loading combines sources and transport– Quantity, availability– Interaction with water &
transport

Phosphorus Export Coefficients
• Panuska and Lillie (p 29)• Corsi et al. (p 37)• Summary from PRESTO (p 41)• Sparrow• Hubbard Brook (p 52)• Ontario LCM (p 119)

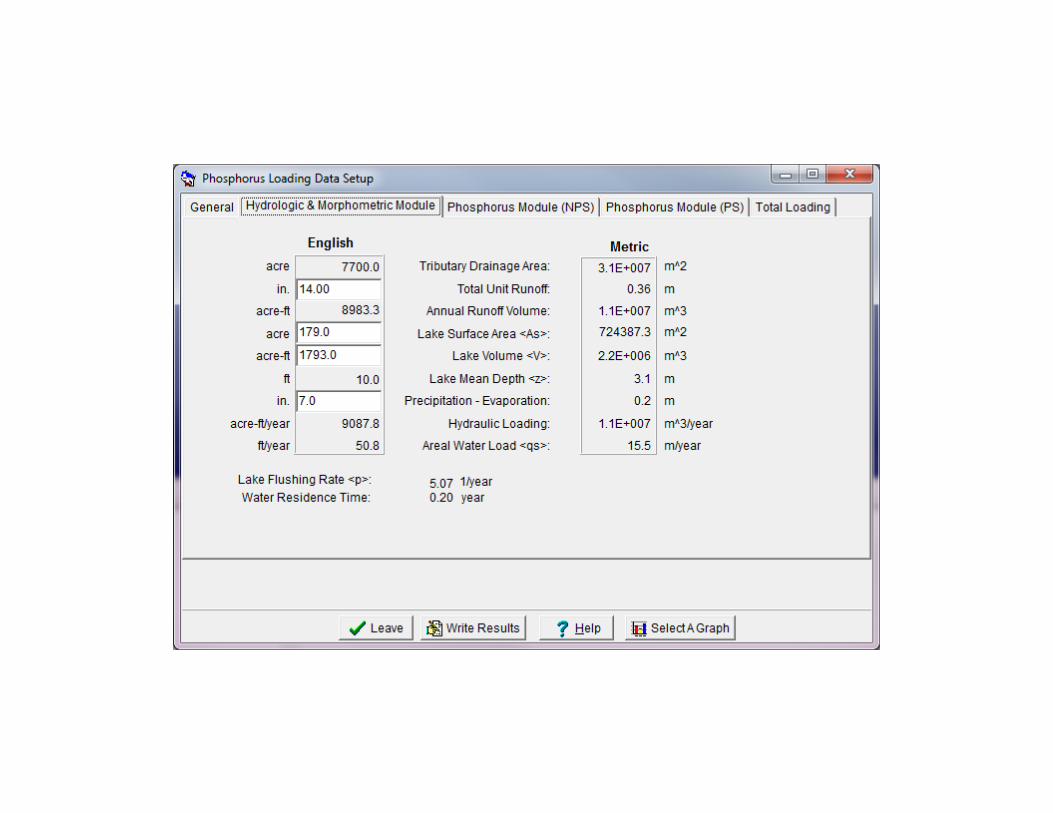
WiLMS Example 2• Mercer Lake, Iron Co• Area = 179 acres• Volume = 1793 acre-feet• P GSM=20 ug/l
• WatershedLand Use Acres
Agriculture 40
Low Den Residential 460
Med Den Residential 150
Grassland 150
Water/Wetlands 1180
Forest 5720
• What is water loading rate (feet/year)?
• What is water residence time (years)?
• What is your “most likely” P loading?
• What is P loading in mg/m2-year of lake surface?
• Compare your lake P prediction with the observed
Find this…


Point Sources• Let’s assume this lake had a WWTP
discharge– 37,400 gallon/day– 10 mg/l P
• We’ll need to do some math…– That’s (37,400 gal/d)(365 d/yr)(1m3/264 gal)– Or = 52,000 m3/year– And, (52,000 m3/yr)(1000 liter/m3)(10mg/l)(1kg/1000000mg)
– Or = 520 kg/year


Slider Bar on Point Sources
• Return to Setup• PS Tab (Phosphorus Module (PS))• Do 75% reduction in point sources• Then look at P prediction


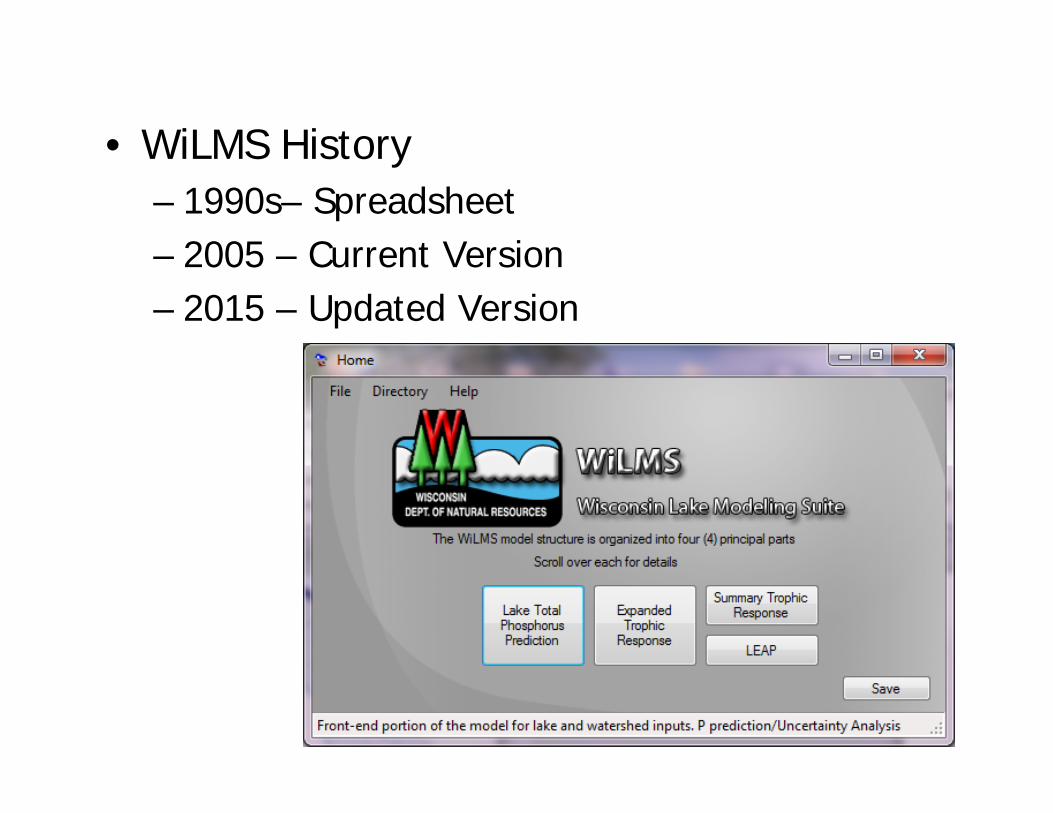
• WiLMS History– 1990s– Spreadsheet– 2005 – Current Version– 2015 – Updated Version
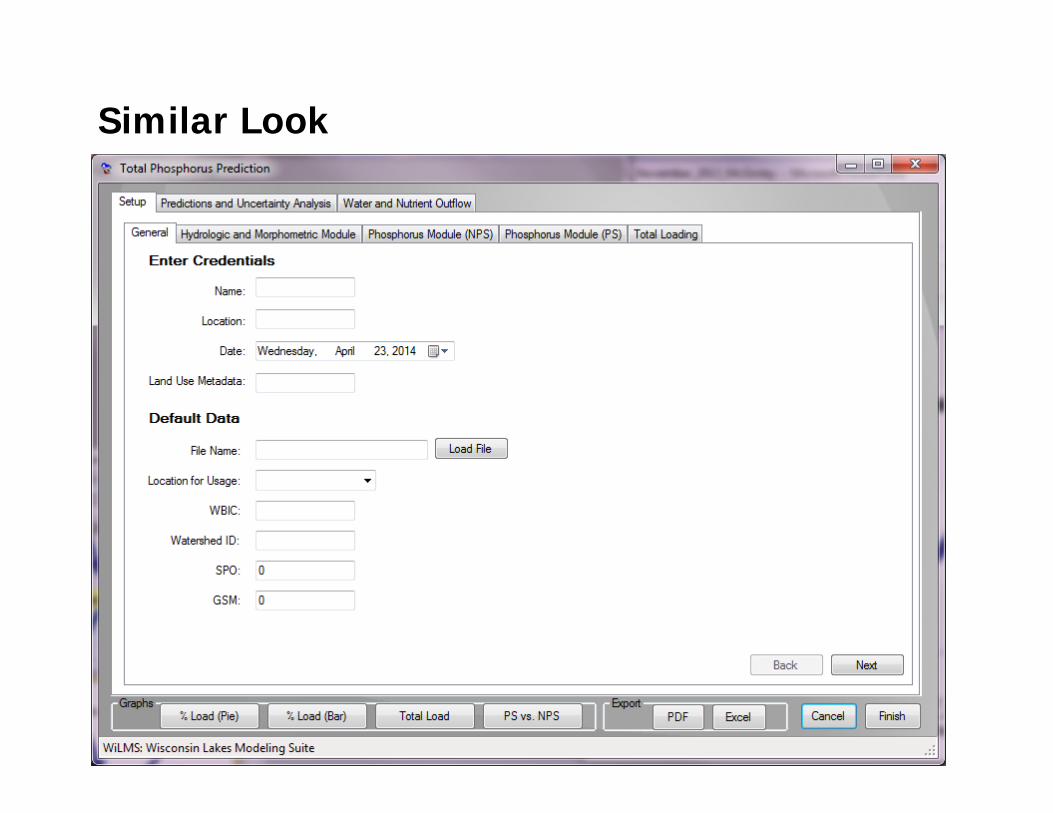
Similar Look
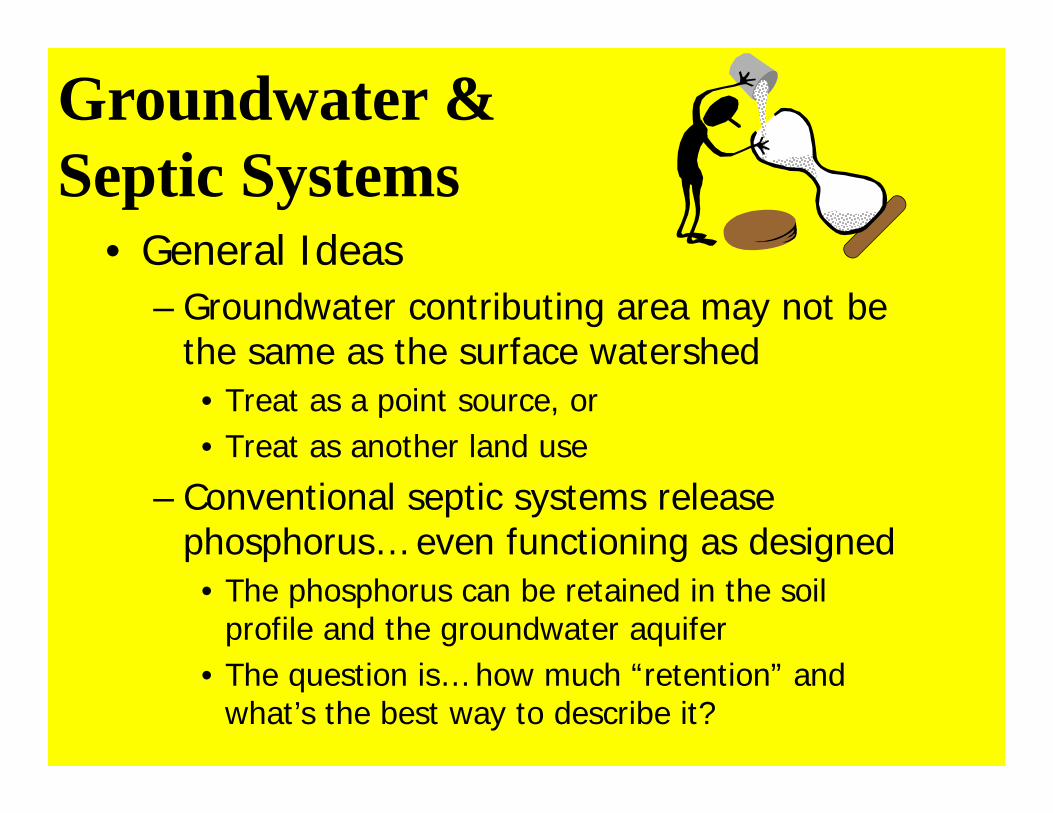
Groundwater & Septic Systems
• General Ideas– Groundwater contributing area may not be
the same as the surface watershed• Treat as a point source, or• Treat as another land use
– Conventional septic systems release phosphorus… even functioning as designed• The phosphorus can be retained in the soil
profile and the groundwater aquifer• The question is… how much “retention” and
what’s the best way to describe it?

Groundwater• For WiLMS need two things
– Flow rate of water– Mass of phosphorus
• For a landuse– that’s already included in the – Area & the “runoff”– Export rate (kg/ha-yr)
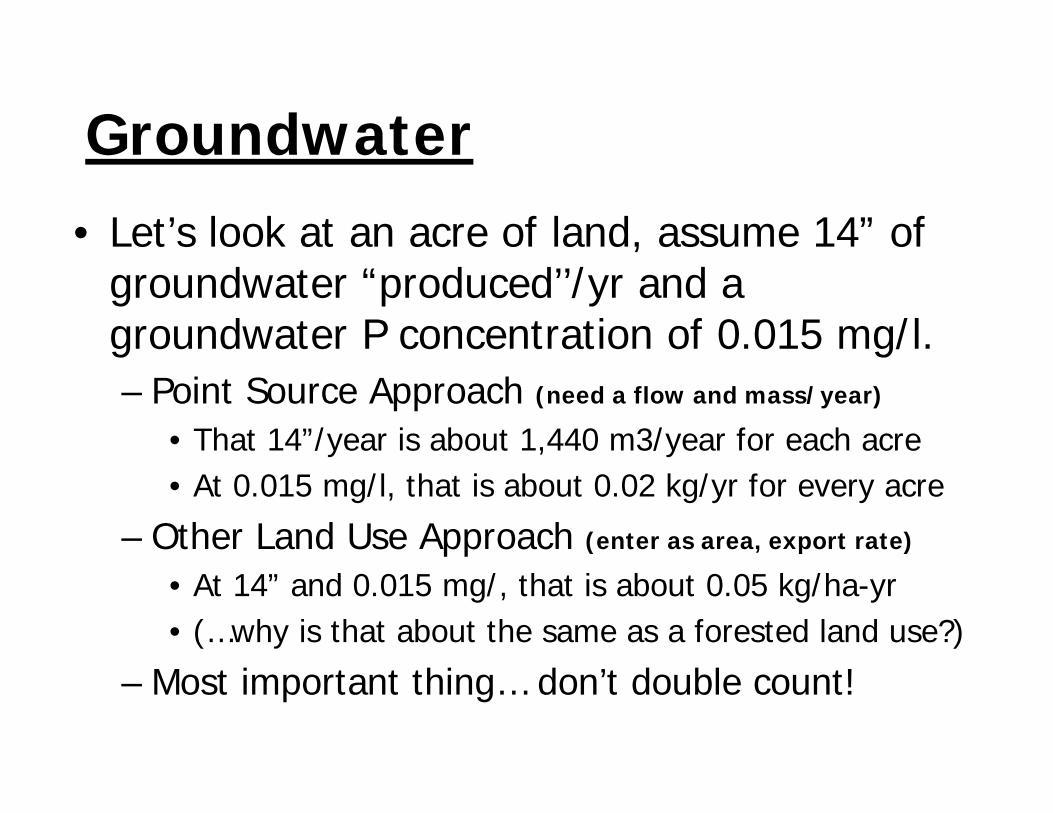
Groundwater• Let’s look at an acre of land, assume 14” of
groundwater “produced’’/yr and a groundwater P concentration of 0.015 mg/l.– Point Source Approach (need a flow and mass/year)
• That 14”/year is about 1,440 m3/year for each acre• At 0.015 mg/l, that is about 0.02 kg/yr for every acre
– Other Land Use Approach (enter as area, export rate)
• At 14” and 0.015 mg/, that is about 0.05 kg/ha-yr• (…why is that about the same as a forested land use?)
– Most important thing… don’t double count!
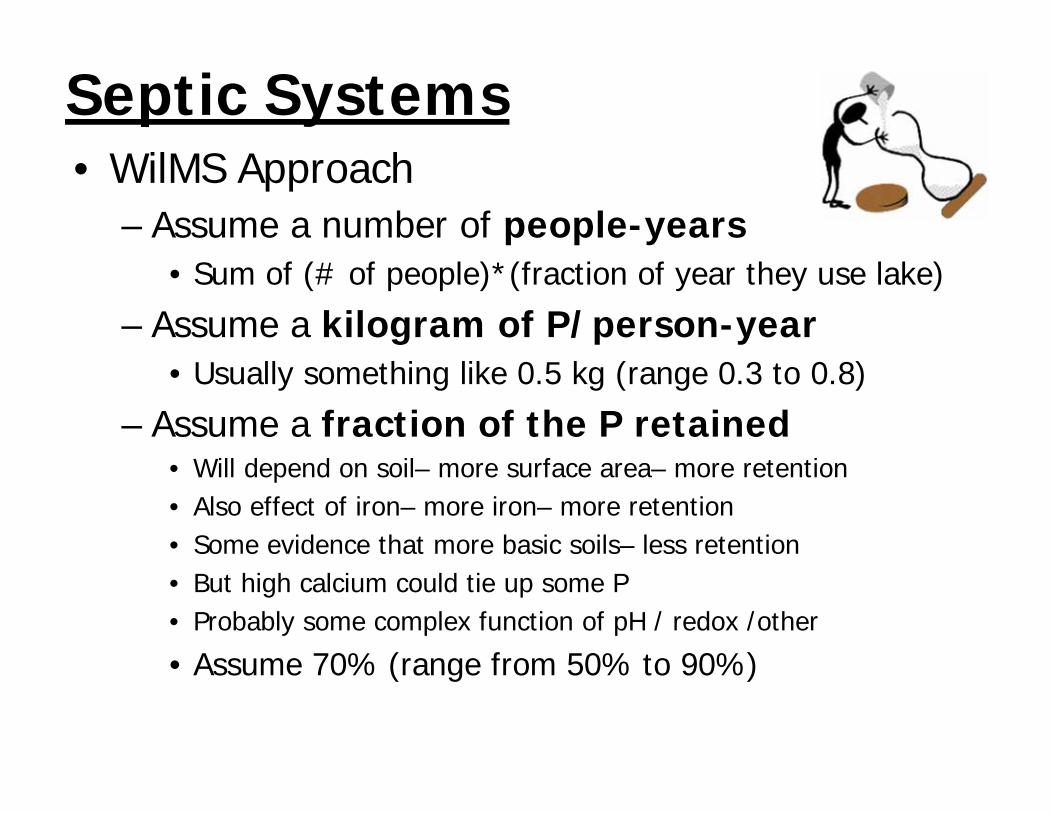
Septic Systems• WilMS Approach
– Assume a number of people-years• Sum of (# of people)*(fraction of year they use lake)
– Assume a kilogram of P/person-year• Usually something like 0.5 kg (range 0.3 to 0.8)
– Assume a fraction of the P retained• Will depend on soil– more surface area– more retention• Also effect of iron– more iron– more retention• Some evidence that more basic soils– less retention• But high calcium could tie up some P• Probably some complex function of pH / redox /other
• Assume 70% (range from 50% to 90%)

Example 3• 833 acre lake, Douglas County• Mean depth of 29 feet• Measured TP 0.007 mg/l (GSM & SPO)• 520 acre watershed
– Assume all forest • Extra 1200 acres of groundwater contributing area
– Try point source– 1440 m3/yr-acre (14 inch/yr)
– 0.02 kg/yr-acre (0.015 mg/l)
• Septic Systems– 80 capita-years– 70% retention– (range 90% to 50%)


RecapSource Low kg/year Most Likely kg/year
Surface watershed 11 19
Atmospheric (lakesurface)
34 101
Additional groundwater 24 24
Septic systems 12 12
Total –kilograms/year 81 156
Total—pounds/year 177 344
Note that the septic P doesn’t show up in the point source total but it is in the total loading

We do have some things we can discuss….
• This is a seepage lake• Let’s take a close look at atmospheric
deposition• Does groundwater actually enter the
lake?• What should the groundwater P
concentration be?• Take another look at steady-state in
shallow lakes• How about riparian runoff?• Other?

Seepage Lake

Atmospheric Deposition• “Lake Surface”
• WiLMS Default– “Most likely” estimate 0.3 kg/ha-yr (similar to Reckhow and
Simpson p 81 in notes w/ range 0.15 to 0.5 in that paper)
• Other Values– 0.06 kg/ha-yr: N WI (Rose, W.J., 1993 Balsam Lake 1987-89:
USGS WRI 91-4125)
– 0.16 kg/ha-yr: (Field and Duerk, 1988 Delavan Lake USGS WRI 87-4168)
– 0.17 kg/ha-yr (Ontario LCM modified in 2006, p 118 in notes)
– Robertson (Whitefish Lake Study) used • Dry deposition
– 0.12 kg/ha-yr for small lake, conifers– 0.07 for large lake, conifers
• Wet deposition– 0.13 kg/ha-yr (0.016 mg/l assumed)
Used ~0.19 kg/ha-yrOr ~ 60 kg total for 833 acre lake

Lakes are connected to groundwater…


Fountain Lake
1.5 Cubic Feet Per Second
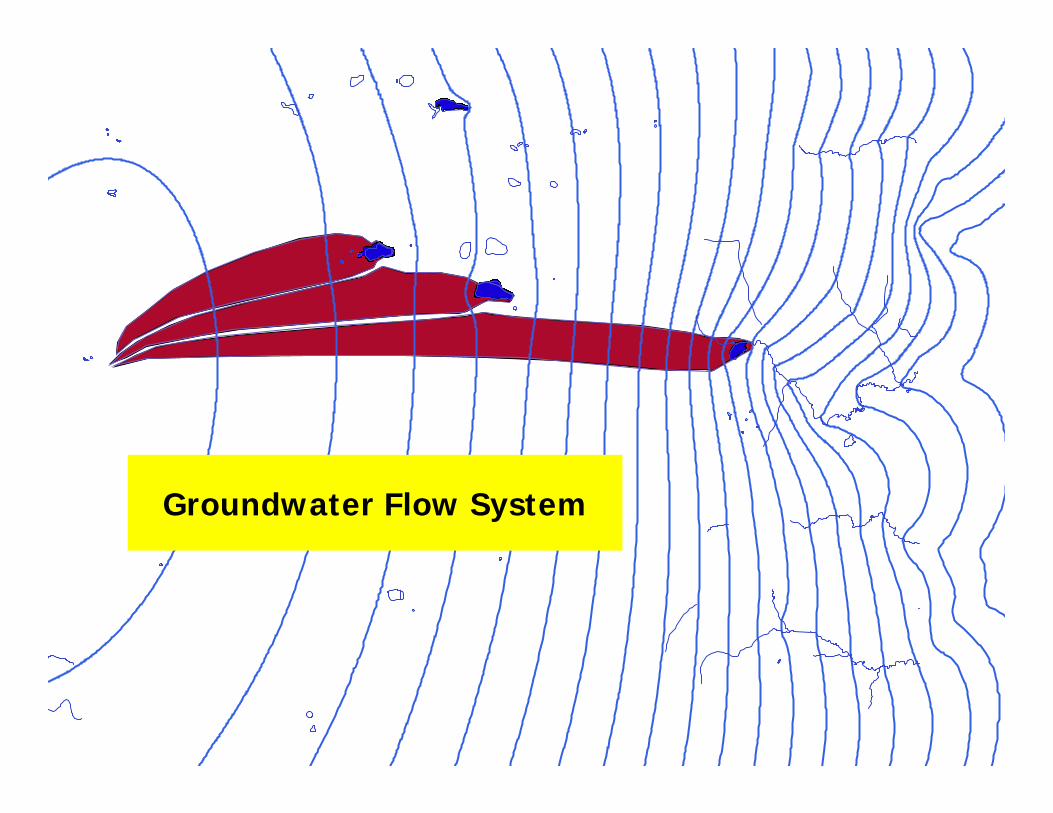
Groundwater Flow System
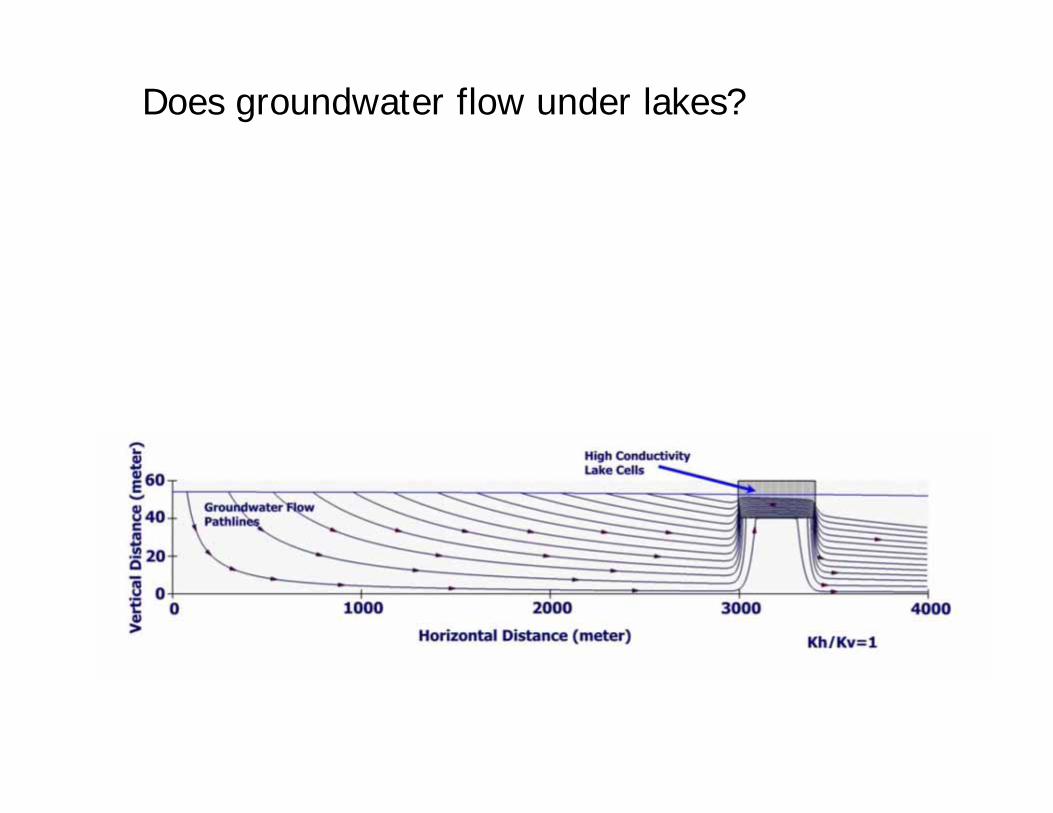
Does groundwater flow under lakes?

Does groundwater flow under lakes?
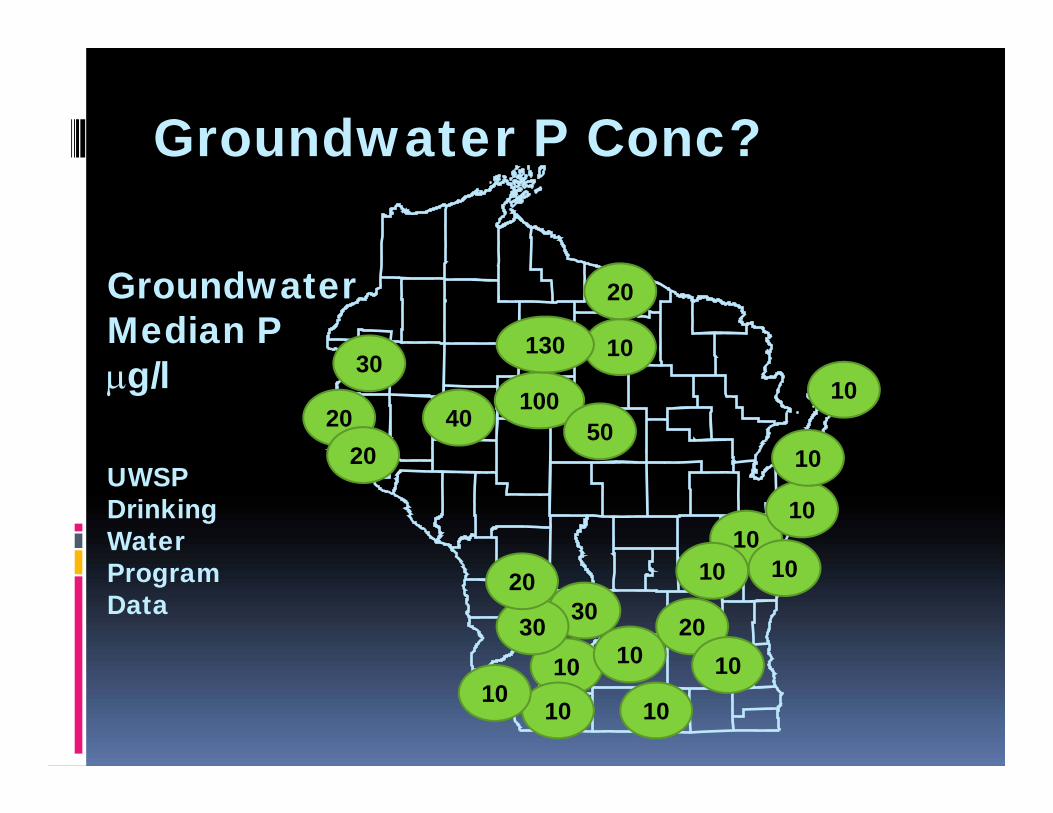
Groundwater P Conc?
10
20
20100
10
10
20
10
50
10
10
10
30
10
10
30
40
130
10
10
20
10
10
20
30
GroundwaterMedian Pg/l
UWSPDrinking Water Program Data
What about Steady-State?
• Is that an important assumption?
• What about concentrations that vary during the growing season

Is this steady-state?

Do we have time to discuss RIPARIAN RUNOFF MODELS?

Runoff generation and acquisition of nutrients

Changes to phosphorus movement because of development?– Changes in vegetation
• Interception• Evapo-transpiration
– Changes in infiltration• Compaction
– Changes in runoff generation• Sources of runoff• Pathways it takes
– Changes in nutrient availability• Fertilizer• Vegetation
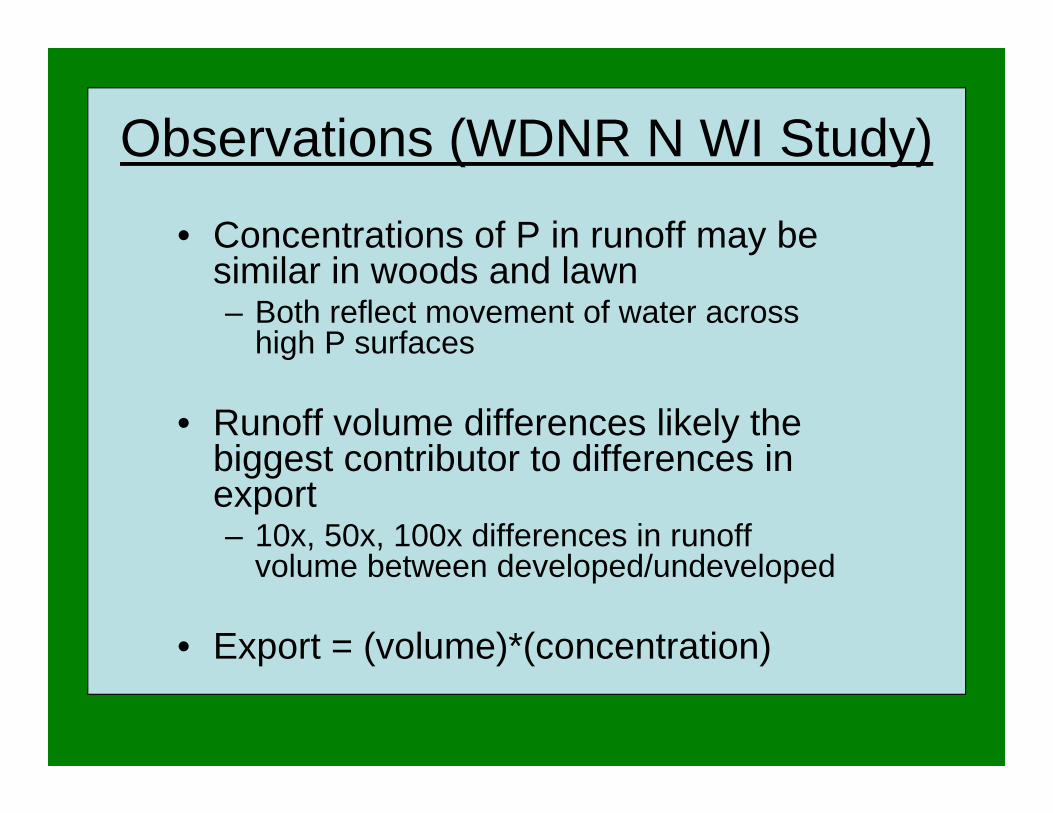
Observations (WDNR N WI Study)
• Concentrations of P in runoff may be similar in woods and lawn– Both reflect movement of water across
high P surfaces
• Runoff volume differences likely the biggest contributor to differences in export– 10x, 50x, 100x differences in runoff
volume between developed/undeveloped
• Export = (volume)*(concentration)

Ideas?
• Delivery? Connectivity?
• What is the quality of the runoff?– Runoff that originates from a roof and is
conveyed across vegetation can have a very different concentration
• Controls – Infiltration?

0
0.5
1
1.5
0.01 0.1 1 10
Infiltration Rate (in/hr)
Frac
tion
of R
unon
Tha
t R
uns
Off
1.3"
0.1"
0.25"
0.5"
The fraction of runon to the secondary buffer that would infiltrate for different storm sizes and infiltration rates (assumes a 500 ft2 impervious area draining to a five foot wide channel, forty feet long and one hour storm of depth shown). Dashed lines show the fitted equation based on soil infiltration rate and storm depth.
Runon Ratio500 / 5(w) x 40 (L)
¼ - ½ inch/hour
SANDYSILTYCLAYEY
What controls the infiltration rate?

What about compaction?
ConditionPonded
Infiltration Rate (in/hr)
Vegetated 3.4
Open Soil 0.7
Traffic 0.1Silt loam soil described by Vervoort, R.W., S.M. Dabney and M.J.M. Romkens. 2001. Tillage and Row Position Effects on Water and SoluteInfiltration Characteristics, Soil ScienceSociety of America Journal 65:1227-1234.
Factors Controlling Water Movement

0.0
0.2
0.4
0.6
0.8
1.0
1.2
0 10 20 30 40 50 60 70
Percent Impervious
Phos
phou
s Ex
port
(lb/
acre
-yr) Panuska, 1994
SLAMM ApproachStearns Co MNUWSP Long Lake
SOME EXAMPLES FROM MODELSRIPARIAN MODEL OUTPUT EXAMPLE
4% to 5% slope/Silt Loam or Silty

Before we end…Last PieceDiscuss Other Models
• Watershed– Simulate storms– Results by day / month
• Lake– Simulate algae, fish…

Quick Modeling Overview
General Categories of Models --------- Examples
Single Event Rainfall / Runoff TR-55, Rational Method
Continuous Hydrologic HEC-1
Hydraulic SWMM, HEC-RAS, HydroCAD
Steady-State Nutrient Export WILMS, BATHTUB
Continuous Hydrologic w/ Nutrient & Sediment Export
Urban – P8, WinSLAMMMixed Watershed – SWAT, HSPF
Steady-State Water ResponseContinuous Water Response
WILMS, BATHTUBAQUATOX, WASP, QUAL2E
NOTE– Increasingly these models overlap in capability

Usefulness of shorter time-step?
• Partition seasonal loads?– Here looking at the monthly P (in
kilograms) for watershed loading (blue)

For more information
• Notepack (pdf file)– Includes many of the original articles
• Questions– Paul McGinley [email protected]– Nancy Turyk [email protected]

QUESTIONS & TIME FOR YOUR PROJECTS


Extra Stuff

• Trophic Response Model Discussion?
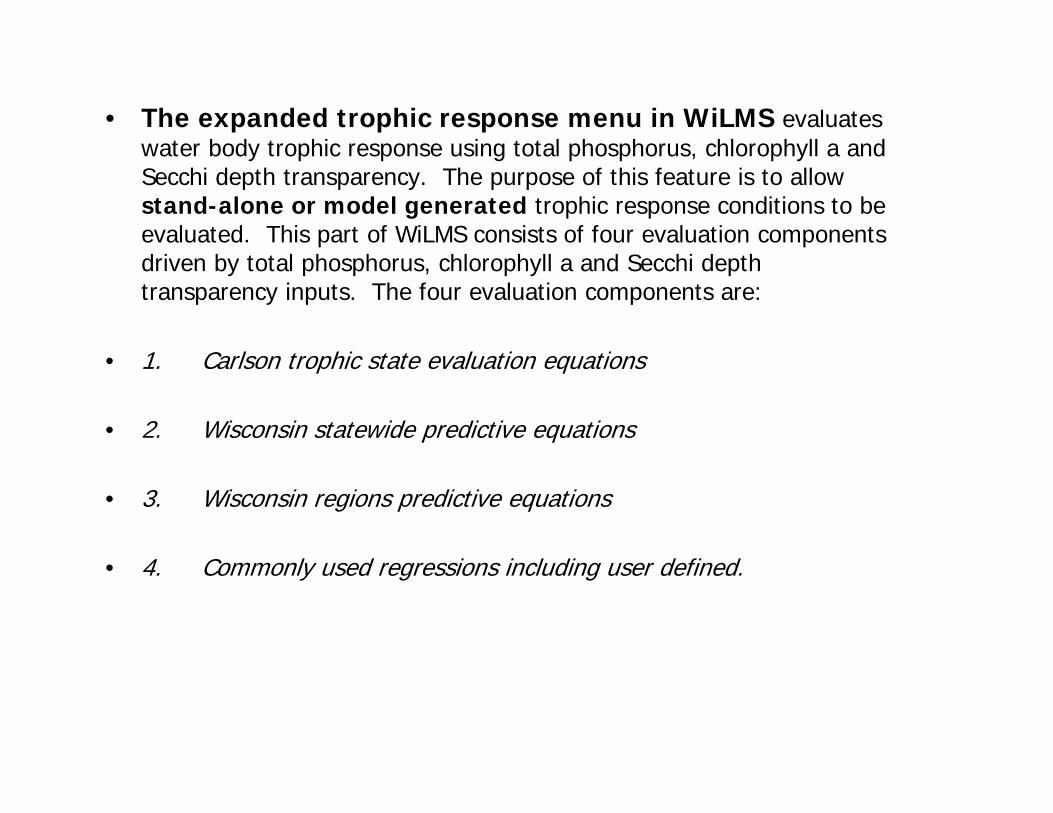
• The expanded trophic response menu in WiLMS evaluates water body trophic response using total phosphorus, chlorophyll a and Secchi depth transparency. The purpose of this feature is to allow stand-alone or model generated trophic response conditions to be evaluated. This part of WiLMS consists of four evaluation components driven by total phosphorus, chlorophyll a and Secchi depth transparency inputs. The four evaluation components are:
• 1. Carlson trophic state evaluation equations
• 2. Wisconsin statewide predictive equations
• 3. Wisconsin regions predictive equations
• 4. Commonly used regressions including user defined.

[2 - 25)[25 - 50)[50 - 150)[150 - 200)[200 - 300)[300 - 400)[400 - 500)[500...
Wisconsin Private Well DataCalcium & Magnesium (Hardness)
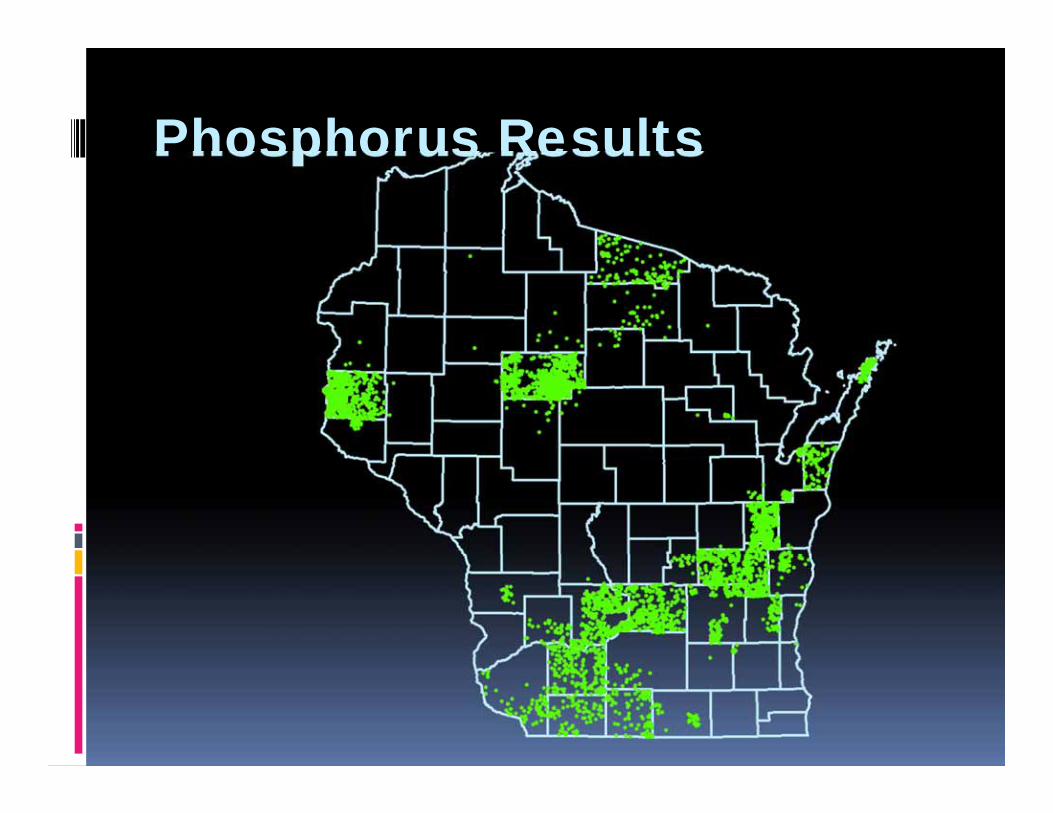
Phosphorus Results
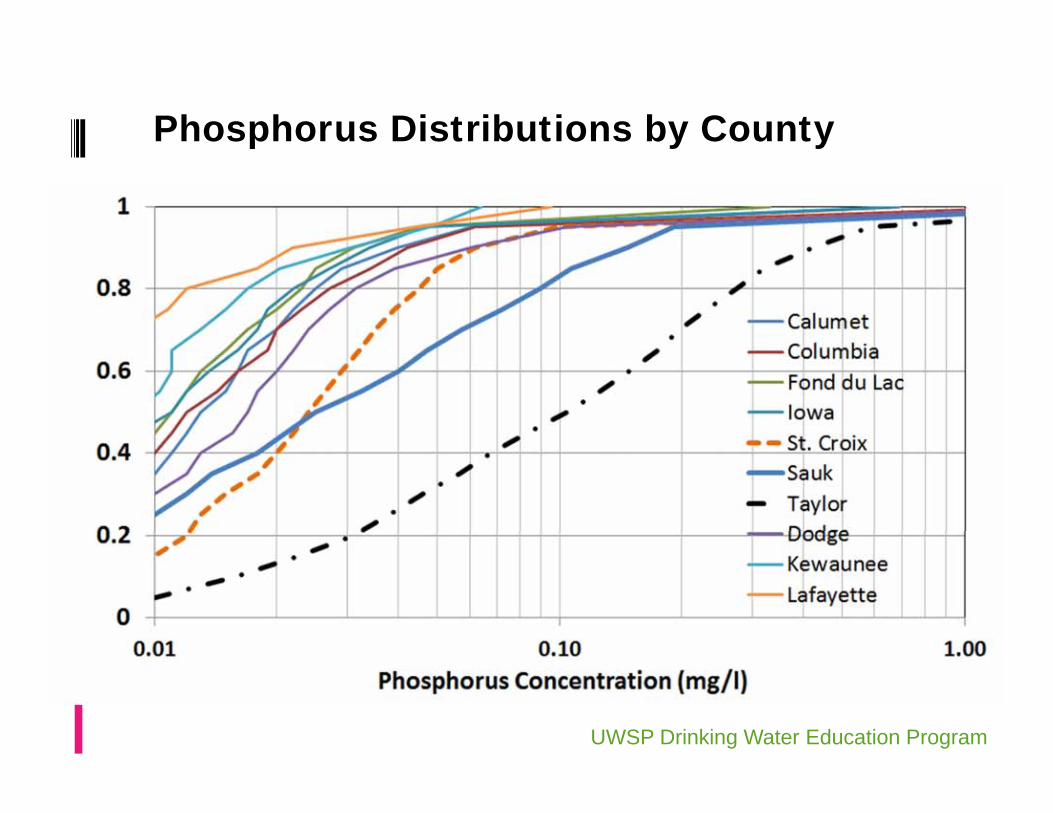
Phosphorus Distributions by County
UWSP Drinking Water Education Program

Extra Example• 310 acre lake, Clark Co• Mean depth 5 feet• Average TP 110 ug/l (GSM/SPO)• 61,900 acre watershed
– Agriculture: 26,200– Grassland: 6,600– Forest: 19,700– Residential: 3,000– Water/Wetland: 6,400
• What is the areal water load?• What is the water residence time?• What is the predicted lake TP?


Internal Loading
• What is it?
• Importance
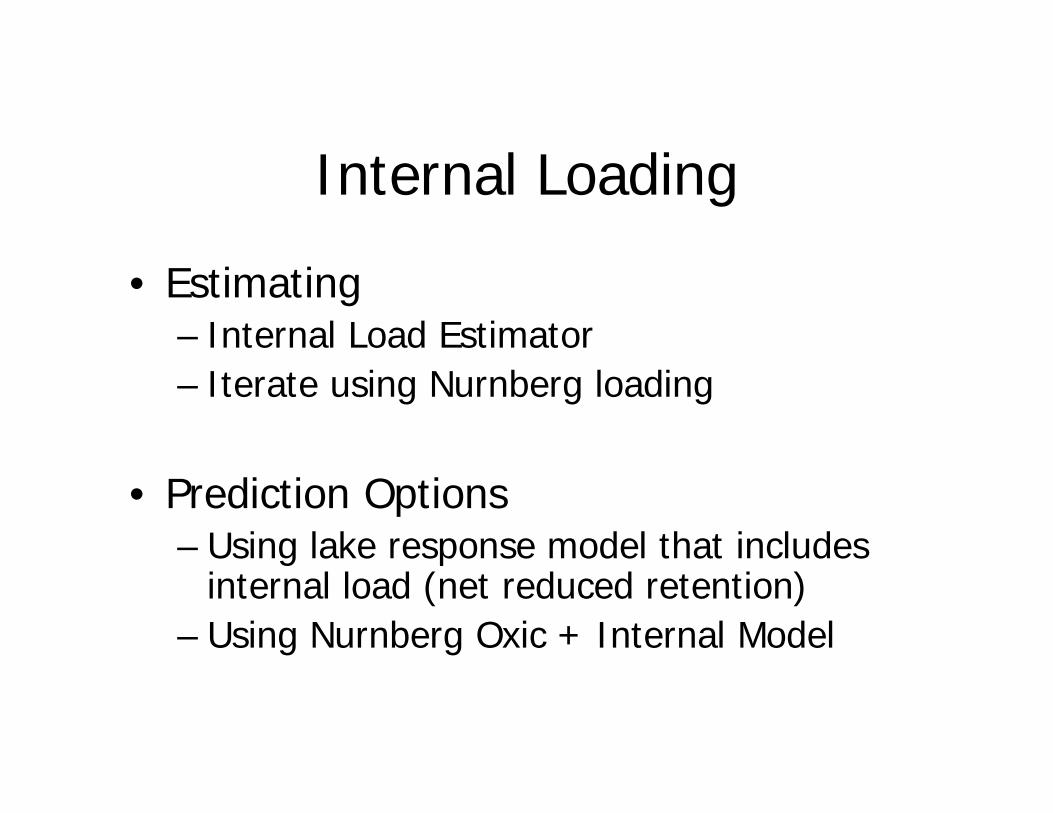
Internal Loading
• Estimating – Internal Load Estimator– Iterate using Nurnberg loading
• Prediction Options– Using lake response model that includes
internal load (net reduced retention)– Using Nurnberg Oxic + Internal Model

Discussion on LEAP(Lake Eutrophication Analysis Procedure)
• Tools … Ecoregion Setup• Pick state• Pick ecoregion• Enter lake & watershed information• Enter water quality information


LEAP
• Lake Eutrophication Analysis Procedure• Reference- Wilson and Walker, 1989
– MNLEAP– page 154

LEAP
• Inflow TP / Mean Depth / Residence Time– TP
• Chl a– Secchi

Applications (S. Heiskary)• How is a lake doing for its ecoregion
and morphometry• Quick estimates of water and nutrient
budgets• Flag lakes for additional study• Compare TP / Chl-a / Secchi observed
versus the reference lakes• Estimate background P, Chl-a, Secchi• Set goals? Along with other info
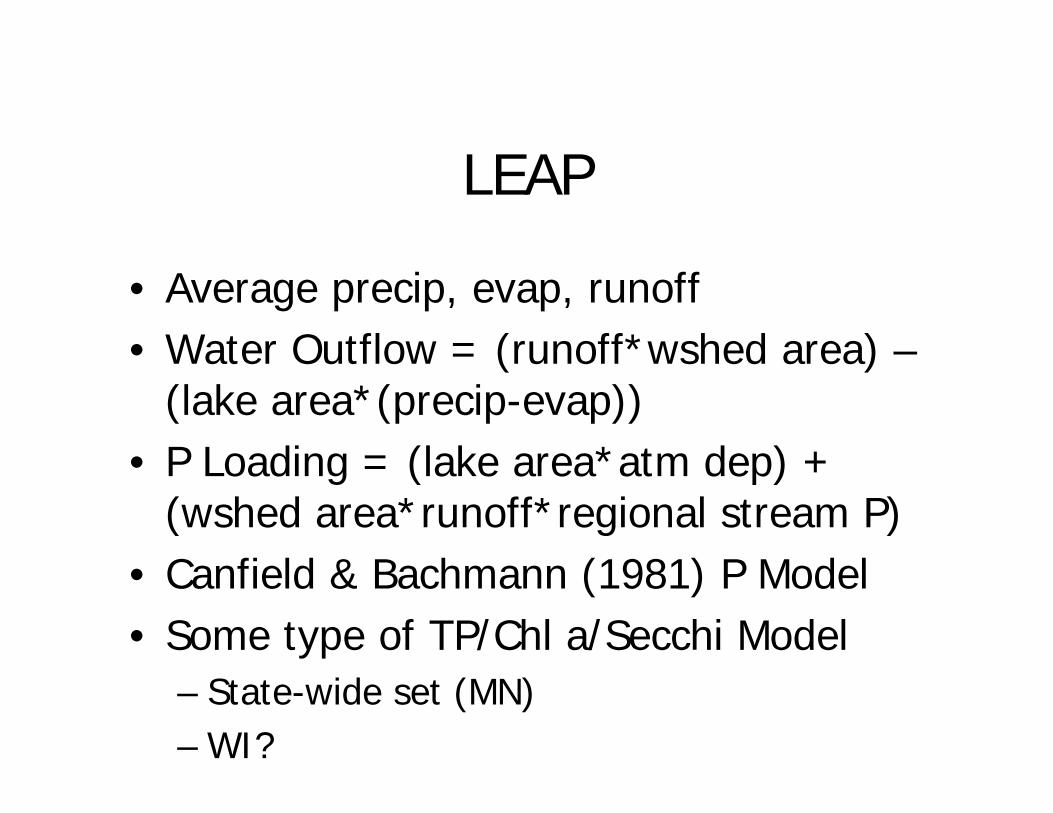
LEAP
• Average precip, evap, runoff• Water Outflow = (runoff*wshed area) –
(lake area*(precip-evap))• P Loading = (lake area*atm dep) +
(wshed area*runoff*regional stream P)• Canfield & Bachmann (1981) P Model• Some type of TP/Chl a/Secchi Model
– State-wide set (MN)– WI?

According to SH
• Maybe best for dimictic lakes in less impacted regions
• Probably most difficult to use for polymictic lakes with significant internal load, turbid lakes, seepage lakes

Example Problem
• 112 ha lake (275 acre)• 750 ha watershed (1800 acre)
– 50% Forested– 50% Row Crop Agriculture
• Overturn P of 30 ug/l• Growing Season Mean 27 ug/l

A little discussion on other watershed models…SWAT
0
20
40
60
80
100
120
0
20
40
60
80
100
120
01/01/02 01/01/03 01/01/04 01/01/05 01/01/06 01/01/07 01/01/08
Daily CN
Precipita
tion mm
Precipitation Daily Curve Number
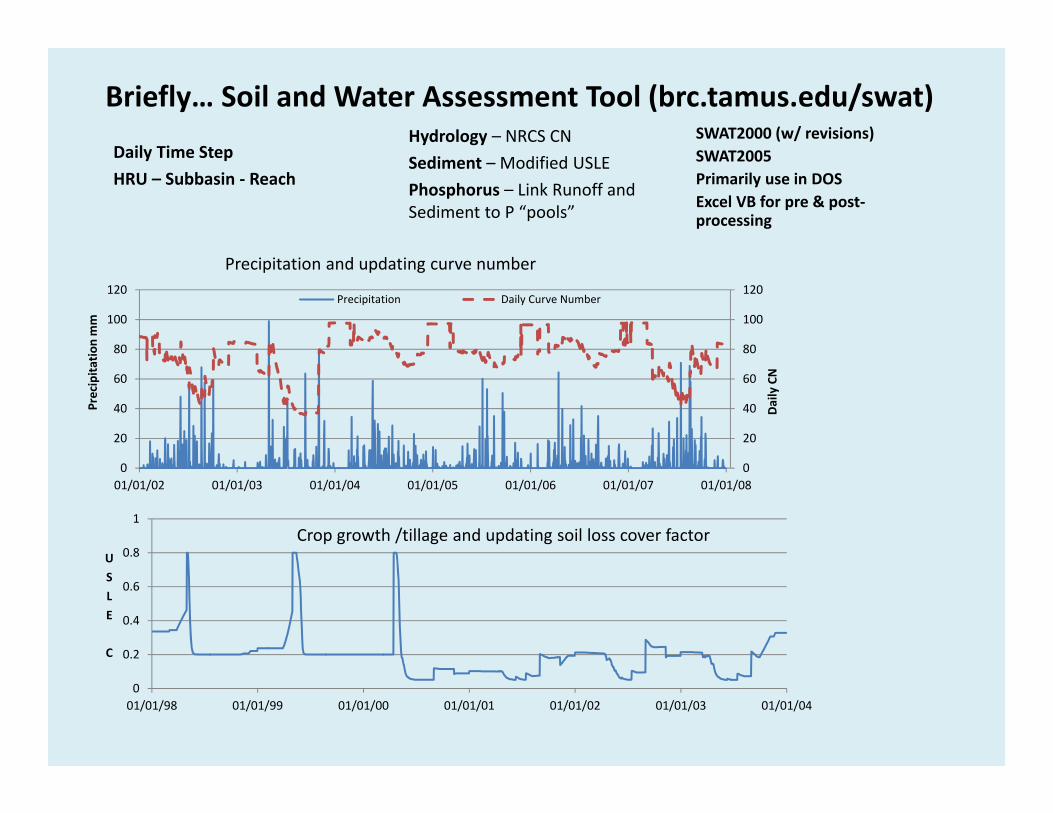
Precipitation and updating curve number
0
0.2
0.4
0.6
0.8
1
01/01/98 01/01/99 01/01/00 01/01/01 01/01/02 01/01/03 01/01/04
USLE
C
Crop growth /tillage and updating soil loss cover factor
Hydrology – NRCS CNSediment – Modified USLEPhosphorus – Link Runoff and Sediment to P “pools”
Daily Time StepHRU – Subbasin ‐ Reach
Briefly… Soil and Water Assessment Tool (brc.tamus.edu/swat) SWAT2000 (w/ revisions)SWAT2005 Primarily use in DOSExcel VB for pre & post‐processing
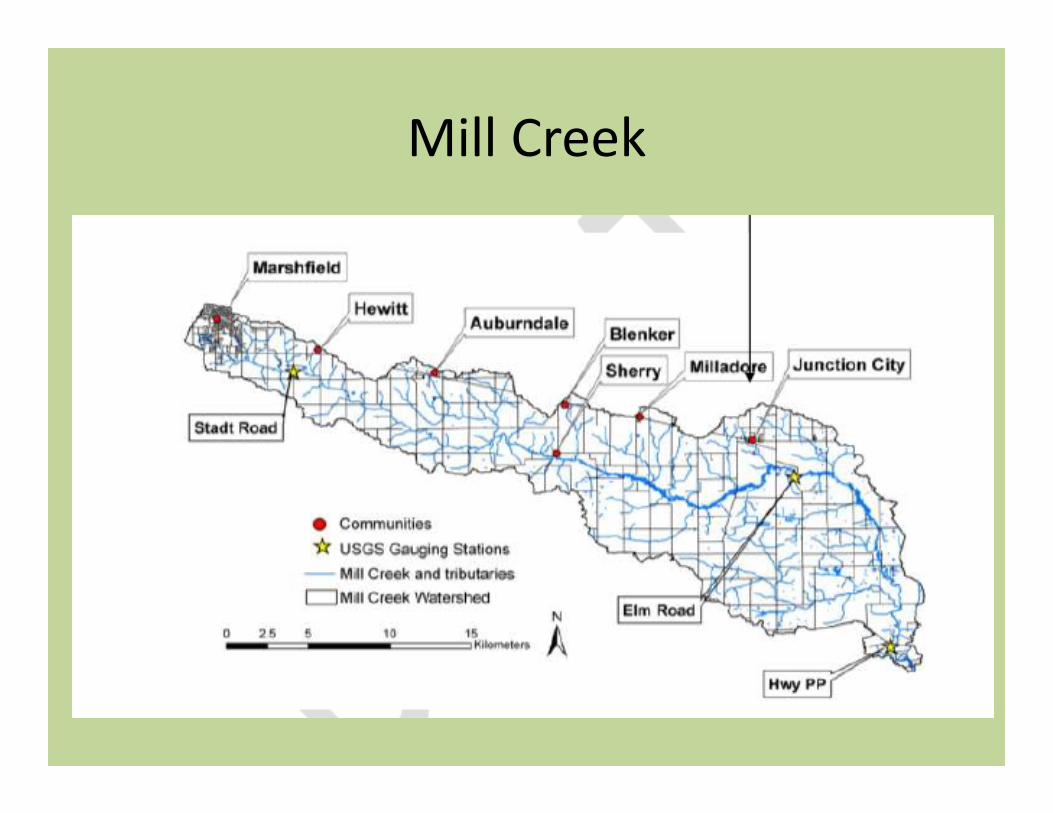
Mill Creek

Divide into “subbasins”

Divide into “hydrologic response units” (land mgt & soils)

Figure out what’s going on in the watershed… create model inputs

Then add water– combine daily rainfall and land management
• simulate – crop growth, runoff etc…

Example‐Mead Lake•Watershed
•250 km2
•SWAT Model•10 subbasins•119 HRUs
•Calibration•2 years flow/ TSS / TP•Matched total w/ CN• Adjusting USLEP, Filterw•Tried to fit P fractions and P Content

Usefulness of shorter time-step?
• Partition seasonal loads?– Here looking at the monthly P (in
kilograms) for watershed loading (blue)

Daily Tracking– Lake Volume/Depth
Precipitation(mm)
LakeElev. (m) ModelMeasure
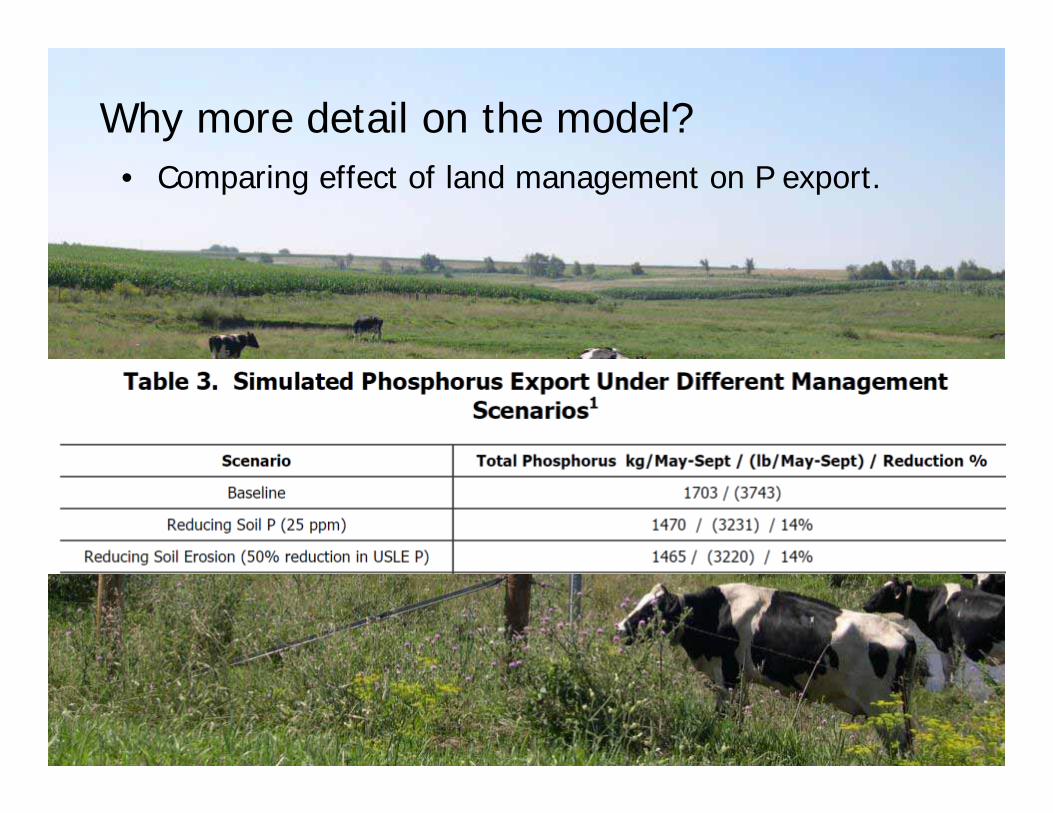
Why more detail on the model?• Comparing effect of land management on P export.
Challenges
• Requires a lot more information• May be more than one way to match
the data
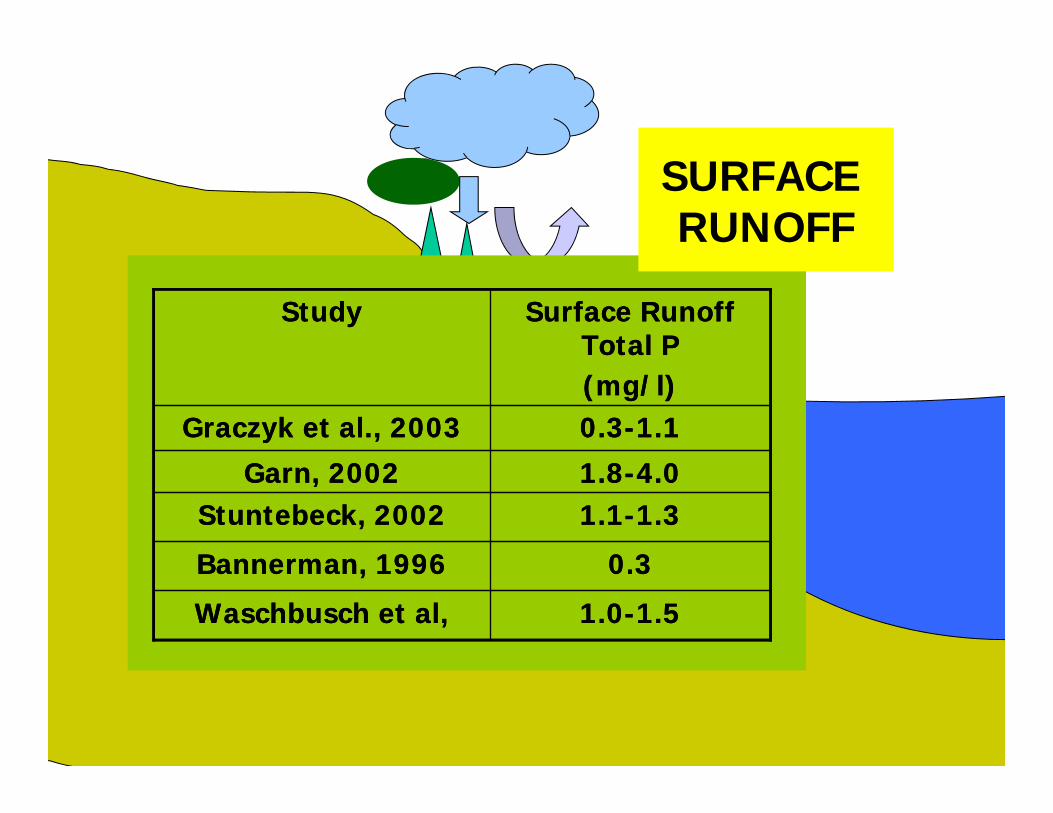
0.3-1.1Graczyk et al., 2003
0.3Bannerman, 1996
1.0-1.5Waschbusch et al,
1.1-1.3Stuntebeck, 20021.8-4.0Garn, 2002
Surface Runoff Total P(mg/l)
Study
0.3-1.1Graczyk et al., 2003
0.3Bannerman, 1996
1.0-1.5Waschbusch et al,
1.1-1.3Stuntebeck, 20021.8-4.0Garn, 2002
Surface Runoff Total P(mg/l)
Study
SURFACE RUNOFF
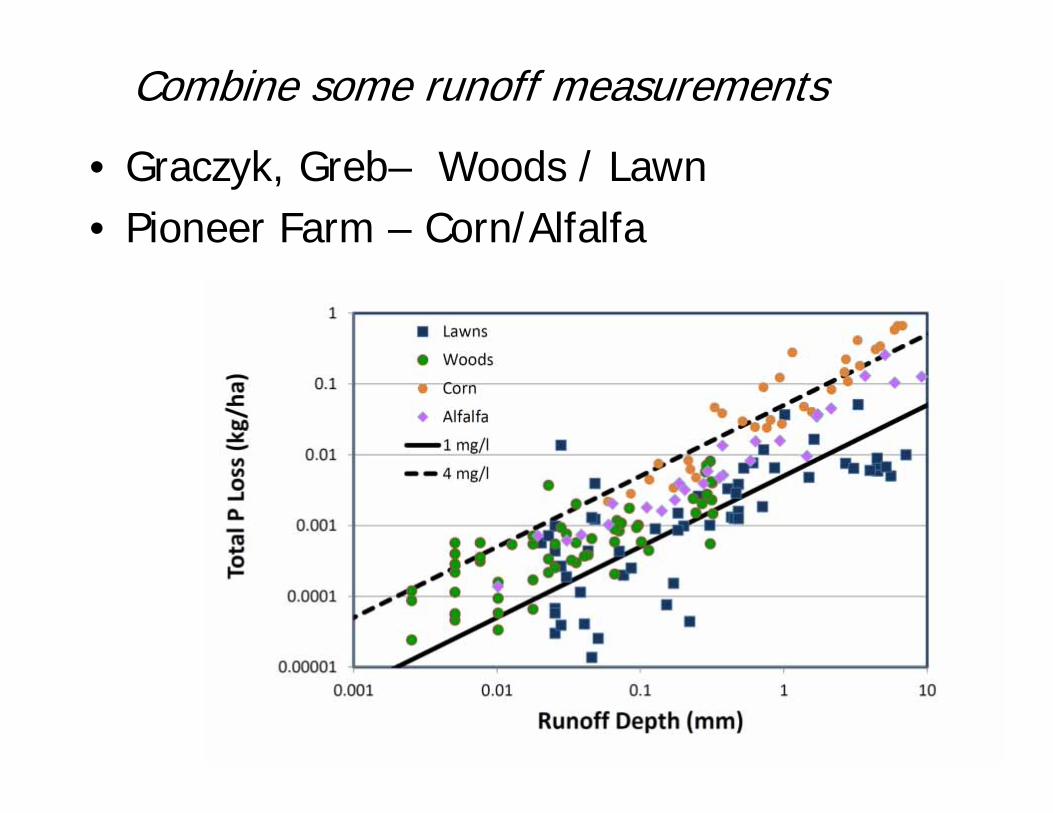
Combine some runoff measurements
• Graczyk, Greb– Woods / Lawn• Pioneer Farm – Corn/Alfalfa


